Transport Accessibility and Social Inequalities
13
Transport accessibility and social inequities: a tool for identification of mobility needs and evaluation of transport investments Juan Pablo Bocarejo S. ⇑ , Daniel Ricardo Oviedo H. 1 Grupo de Estudios en Sostenibilidad Urbana y Regional, Universidad de los Andes, Carrera 1 Este No. 19A-40, Edificio Mario Laserna, Bogotá, Colombia article info Keywords: Accessibility Social exclusion Social equity Urban transport Developing countries abstract Although the concept of social equity seems to be ubiquitous in most mobility plans of major Latin Amer- ican cities, when evaluating transport projects for financing and prioritisation there are no specific or solid indicators to measure how they can contribute to promoting better access to opportunities, partic- ularly for the most vulnerable segments of the population. In response, we designed a methodology that uses the concepts of accessibility and affordability as a complementary means for evaluating public transport investment, and identifying transport disadvantages and priorities for project generation. This is based on the calculation of accessibility levels to the labour market for different zones of a given city, by introducing a function of impedance composed by travel time budget and the percentage of income spent on transportation. The characteristics of time and percentage of income spent for accessing work obtained from transpor- tation surveys define the ‘‘real accessibility’’ to employment for all the zones of a city. Then, a stated pref- erence survey was applied in order to determine the desired expenditure in both variables, and the accessibility to jobs in this new situation was subsequently calculated. We calculated a third type of accessibility, using ‘‘standard’’ values of travel time and expenditure budget. This methodology is therefore used to evaluate different policies in Bogota, corresponding to changes in the fare structure of the existing public transport system, by proposing the development of cross subsi- dies, and carrying out an appraised on the impact of the development of a new Bus Rapid Transit line. The results show that depending on the population, its location and purchasing power, the impact of a redis- tributive fare with respect to accessibility to the labour market can be greater than the expansion and improvement of the public transport network. Ó 2011 Elsevier Ltd. All rights reserved. 1. Introduction In transport policy formulation, attributes that give value to transport systems have been progressively changing. While in the past, speed and reduced travel times were the important assets of a good transportation system, currently the relevance of charac- teristics such as system reliability, low environmental impact, accessibility and contribution to equity are now more relevant than ever. Examples of the relevance of accessibility in the defini- tion of mobility can be easily found in the European experience (LOTI Transport Act of France (1982) and the United Kingdom’s DfT), where the necessity to strengthen mobility in terms of rea- sonable access, quality, and price for the individual has been clearly defined and included in the official planning documents. Most mobility plans of major cities in Latin American, as well as other developing and industrialised countries, emulate this ten- dency of including social exclusion and equity as critical issues in the planning and development processes. However, the tools for the analysis and evaluation of transport projects and conditions do not measure, with either specific or solid indicators, their con- tribution to the accessibility levels to opportunities and their social implications, particularly for the most vulnerable segments of the population. At the moment, in many developing countries as well as in some cities of industrialised areas, there is an obvious problem with respect to accessibility to transport, and therefore to opportu- nities. The capacity of individuals to travel in the poorest segment of the population of cities such as Bogota, Colombia, is reduced to less than 1.5 trips per day, while the corresponding percentage of their total income spent on transport exceeds 20%. Accessibility concepts focus on estimating the availability of opportunities generated as a result of both transportation supply and land use characteristics. As a result, accessibility can be used as an indicator of social inclusion and the potential of economic 0966-6923/$ - see front matter Ó 2011 Elsevier Ltd. All rights reserved. doi:10.1016/j.jtrangeo.2011.12.004 ⇑ Corresponding author. Tel.: +57 13394949x1729. E-mail addresses: [email protected] (J.P. Bocarejo S.), dan-ovie@unian- des.edu.co (D.R. Oviedo H.). 1 Tel.: +57 13394949x1864. Journal of Transport Geography 24 (2012) 142–154 Contents lists available at SciVerse ScienceDirect Journal of Transport Geography journal homepage: www.elsevier.com/locate/jtrangeo
Transcript of Transport Accessibility and Social Inequalities

Journal of Transport Geography 24 (2012) 142–154
Contents lists available at SciVerse ScienceDirect
Journal of Transport Geography
journal homepage: www.elsevier .com/locate / j t rangeo
Transport accessibility and social inequities: a tool for identificationof mobility needs and evaluation of transport investments
Juan Pablo Bocarejo S. ⇑, Daniel Ricardo Oviedo H. 1
Grupo de Estudios en Sostenibilidad Urbana y Regional, Universidad de los Andes, Carrera 1 Este No. 19A-40, Edificio Mario Laserna, Bogotá, Colombia
a r t i c l e i n f o a b s t r a c t
Keywords:AccessibilitySocial exclusionSocial equityUrban transportDeveloping countries
0966-6923/$ - see front matter � 2011 Elsevier Ltd. Adoi:10.1016/j.jtrangeo.2011.12.004
⇑ Corresponding author. Tel.: +57 13394949x1729.E-mail addresses: [email protected] (J.P. B
des.edu.co (D.R. Oviedo H.).1 Tel.: +57 13394949x1864.
Although the concept of social equity seems to be ubiquitous in most mobility plans of major Latin Amer-ican cities, when evaluating transport projects for financing and prioritisation there are no specific orsolid indicators to measure how they can contribute to promoting better access to opportunities, partic-ularly for the most vulnerable segments of the population. In response, we designed a methodology thatuses the concepts of accessibility and affordability as a complementary means for evaluating publictransport investment, and identifying transport disadvantages and priorities for project generation. Thisis based on the calculation of accessibility levels to the labour market for different zones of a given city,by introducing a function of impedance composed by travel time budget and the percentage of incomespent on transportation.
The characteristics of time and percentage of income spent for accessing work obtained from transpor-tation surveys define the ‘‘real accessibility’’ to employment for all the zones of a city. Then, a stated pref-erence survey was applied in order to determine the desired expenditure in both variables, and theaccessibility to jobs in this new situation was subsequently calculated. We calculated a third type ofaccessibility, using ‘‘standard’’ values of travel time and expenditure budget.
This methodology is therefore used to evaluate different policies in Bogota, corresponding to changes inthe fare structure of the existing public transport system, by proposing the development of cross subsi-dies, and carrying out an appraised on the impact of the development of a new Bus Rapid Transit line. Theresults show that depending on the population, its location and purchasing power, the impact of a redis-tributive fare with respect to accessibility to the labour market can be greater than the expansion andimprovement of the public transport network.
� 2011 Elsevier Ltd. All rights reserved.
1. Introduction
In transport policy formulation, attributes that give value totransport systems have been progressively changing. While inthe past, speed and reduced travel times were the important assetsof a good transportation system, currently the relevance of charac-teristics such as system reliability, low environmental impact,accessibility and contribution to equity are now more relevantthan ever. Examples of the relevance of accessibility in the defini-tion of mobility can be easily found in the European experience(LOTI Transport Act of France (1982) and the United Kingdom’sDfT), where the necessity to strengthen mobility in terms of rea-sonable access, quality, and price for the individual has beenclearly defined and included in the official planning documents.
ll rights reserved.
ocarejo S.), dan-ovie@unian-
Most mobility plans of major cities in Latin American, as well asother developing and industrialised countries, emulate this ten-dency of including social exclusion and equity as critical issues inthe planning and development processes. However, the tools forthe analysis and evaluation of transport projects and conditionsdo not measure, with either specific or solid indicators, their con-tribution to the accessibility levels to opportunities and their socialimplications, particularly for the most vulnerable segments of thepopulation.
At the moment, in many developing countries as well as insome cities of industrialised areas, there is an obvious problemwith respect to accessibility to transport, and therefore to opportu-nities. The capacity of individuals to travel in the poorest segmentof the population of cities such as Bogota, Colombia, is reduced toless than 1.5 trips per day, while the corresponding percentage oftheir total income spent on transport exceeds 20%.
Accessibility concepts focus on estimating the availability ofopportunities generated as a result of both transportation supplyand land use characteristics. As a result, accessibility can be usedas an indicator of social inclusion and the potential of economic

J.P. Bocarejo S., D.R. Oviedo H. / Journal of Transport Geography 24 (2012) 142–154 143
development at an individual level (Scottish Executive, 2000a,2000b).
Consequently, this research focuses on the construction andapplication of a series of indicators linked with the different com-ponents of accessibility in the urban transport domain, particularlythose that cover the relationships between transport costs and in-come level. Affordability should be one of the main aspects to con-sider when formulating public policies in developing cities in orderto provide better accessibility.
2. The problem
Among other strategies to improve public transport in develop-ing cities of certain importance, the development of the Bus RapidTransit systems (from now on BRT) has proven to be an efficientsolution to fulfil most of the critical public transport requirements,since these systems are proficient in transporting medium to highpassenger volumes.
BRT projects have focused on improving efficiency, providingtransport supply and technology according to existing and ex-pected demand. In Colombia, seven cities with over 700,000 inhab-itants have implemented these initiatives, following the success ofTransMilenio in its capital, Bogota. Nowadays, many cities in boththe developing and industrialised world are planning, building oroperating such systems.
The development of these projects includes the application of exante cost–benefit assessments, and financial structuring of projectsinvolving an interesting component of public–private participa-tion. As usual, the main benefits of the projects were considerablereductions in travel times and operating costs; while the financialstructuring sought to cover transport operating costs entirely byfare revenues. The calculation of the equilibrium rate of the systemshould cover the payment of the operation and sustainability of thesystem, and these costs should be covered by the fare paid by theusers, sadly, these being mainly the poorest of each city.
Unquestionably, users of the new system save time. However,increased fares can represent a strong limitation of its use. As a re-sult, the policy of increasing mobility by improving the systemthrough price increases, adversely affects individual accessibility,given a spatial distribution of activities that makes it even moredifficult to access opportunities from the peripheral areas.
It is likely that the traditional evaluation of these projects couldhave ignored the negative effect of increased fare costs on trans-port demand. However, the problem lies beyond the lack of evalu-ation tools for transport projects that respond to these inequalities.In fact, an accessibility methodology for analysing transport disad-vantages while considering socioeconomic conditions can provideevidence of disparities between different areas of the city and helpin the formulation of adequate response strategies. In that order, acentral issue in transport research is the development of an acces-sibility analysis tool that helps quantify and differentiate accessinequalities, evaluate existing projects as well as prioritising needsand contribute to project generation.
Therefore, by introducing the concept of accessibility in theanalysis of mobility conditions for specific population groups, itwill be possible to consider not only an indicator that relates thetransport system to land use, but the real possibility of transportuse and ease of access to the city opportunities depending on indi-vidual purchasing power. This tool can be used to analyse differenttypes of policy related to the relocation of activities and improve-ments in access to transport systems. It can also search for a shift inthe statements of mobility plans in cities experiencing transportand access-related inequalities by providing additional value onmatters such as equity and productivity allowing verification ofthe achievement of these objectives.
3. Accessibility as a means to analysing social inequities andtransport investments
The study of transport accessibility has produced a largeamount of research and working papers over the years. New stud-ies and practical approaches are continuously emerging on thissubject; however, most of them apply the existing methodologiesto the contexts and data previously examined. This section pre-sents a compilation of the most representative methodological ap-proaches to the study of transport accessibility and an overview ofrelevant concepts that are directly and indirectly related to thestudy topic that can contribute to the study of accessibility indeveloping countries as a tool for evaluating transport investment.
3.1. Accessibility definitions
The concept of accessibility has been frequently used in a diver-sity of scientific studies focused on mobility issues, and representsa fundamental tool in the definition of public policy. Nevertheless,many methods for defining and putting into practice the notion ofaccessibility have been developed over the years, and the quantityof studies centring on this topic has provoked the use of the con-cept in several ways.
Interpretations of accessibility generated within the scientificcommunity include the definition of accessibility as: the potentialopportunities for interaction (Hansen, 1959), the ease of reachingany area of activity using a specific transport system (Dalvi andMartin, 1976), and, the overall benefits provided by a given trans-port system (Ben-Akiva and Lerman, 1979), among others.
From a more classical point of view, accessibility can be under-stood as the ease of reaching desired destinations given a numberof available opportunities and intrinsic impedance to the resourcesused to travel from the origin to the destination. Usually, opportu-nities are measured in terms of employment positions, and imped-ance in units of distance or time (Niemeier, 1997). Many authorshave augmented this view of accessibility by adding and develop-ing existing and new components to the approach, constructing awider theory about accessibility.
Three main clusters can be identified according to Van Wee et al.(2001) for accessibility definitions and measures: infrastructure-related, activities-related and mixed approaches. The first approachfocuses on characteristics of transport supply and demand; someexamples of this approach can be found in Priemus and Visser(1995), Linneker and Spence (1992), Gutiérrez (2001), Ribeiroet al. (2009), among others. The activities approach is associatedwith land use and location, focusing on the number of activitiesaccessible in a given range of travel time or distance; many authorshave studied accessibility from this perspective, and among themost representative we can cite Hansen (1959), Cervero (1989,1996), Gutiérrez (2001), Van Wee et al. (2001), Halden (2002),and Ben-Akiva et al. (2006). The last approach combines the preced-ing two, making a more complete analysis of accessibility; someauthors found in the scientific literature who have used this kindof method are Nutley (1980), Van Wee et al. (2001), Levine and Garb(2002), Wu and Hine (2003), Curtis (2007), and Straatemeier(2009). Generally, nearly all accessibility definitions and measuresconsider elements linked with generalised travel costs, demandcharacteristics such as number of households, job clusters, com-mercial activities, and origin–destination interaction and access.
As shown, accessibility has several components from which itcan be analysed. Three main elements are determinant in definingaccessibility in a more complete way than in previous works: LandUse, Transport and Individual characteristics. Geurs and Van Wee(2004) define each of these components, on the basis of an exten-sive collection of research.
144 J.P. Bocarejo S., D.R. Oviedo H. / Journal of Transport Geography 24 (2012) 142–154
3.2. Measurement techniques and indicators
Over the years, many researchers have focused on the study anddevelopment of accessibility measurement systems. Some of themost representative works on this subject range from activity-based measures (Ben-Akiva et al., 2006) and utility-basedmeasures (Handy and Clifton, 2002) to specialised software forthe calculation of accessibility levels (Bhat et al., 2000).
Among the different approaches for measuring accessibility, themost frequently used measures are based on a combination ofopportunities and impedances. Hansen (1959) was the first to pro-pose a gravity measure for accessibility in the scientific literaturewith the purpose of modelling land development. As describedby Meyer and Miller (1984) and Dickey et al. (1983), gravity-typeaccessibility measures correspond to the portion of the gravitymodels which measure attractive power and the friction of spatialseparation. New approaches and measures related to other aspectsof urban mobility have been developed in recent years. Some ofthese classifications are described below.
� Infrastructure-based indicators: analyse the characteristics of thesupply of infrastructure in terms of capacity and level of service,studying the quality of transport facilities using measures suchas levels of congestion and average travel speed on roads. Thistype of indicator studies the coverage, capacity and quality ofthe transport infrastructure through measures of length, den-sity, and traffic levels during periods of congestion.� Activities/land use-based indicators: these measures give a per-
spective of accessibility at a macroscopic level. Activities-basedindicators usually describe the level of access to activities dis-tributed in space, using indicators of opportunities availabilityregarding their distribution in space and time. Some of the mostcommonly used measures of this type are potential indicators,also called gravity measures. Potential measures are generatedby weighting opportunities located in a given area using anattribute of attraction (population, purchasing power, etc.),and discounting a measure of impedance (Knox, 1978; Handy,1993; Geertman and Ritsema van Eck, 1995; Johnston et al.,2000). These accessibility indicators provide a powerful tool ofanalysis because they consider both measures of attractivenessand impedance to establish a reliable value of the potential of agiven area.� People-based indicators: these measures are based on spatial and
temporal geography, and consider the restrictions of an individ-ual reaching the activities. The accessibility measures at an indi-vidual level examine the activities that a person can perform ina given time, measured in terms of their time budgets for themandatory activities (working, studying), flexible activities(entertainment, leisure, etc.), and the speed offered by thetransport systems for moving between areas of activity.
Also known as space–time accessibility measures (Kwan, 1998;Miller, 1999; Miller and Wu, 2002; Kwan and Weber, 2003), peo-ple-based measures consider accessibility as an attribute of indi-viduals (Kwan and Weber, 2003), and evaluate it from the dailyschedule of activities and spatial and temporal constraints for anindividual (Landau et al., 1982; Kwan, 1998). Using these indica-tors requires a considerable level of disaggregation, and involvesseparately evaluating accessibility for different trip purposes,modes of transport, income level, gender, age, occupational groupsand types of activity (Wachs and Kumagai, 1973; Ben-Akiva andLerman, 1979; Handy and Nieimeier, 1997; Kwan, 1998).
Utility-based indicators: these measures, based on economicstudies, contemplate the benefits acquired by people when access-ing activities distributed in space. This type of indicator estimatesaccessibility at an individual level, taking into account not only the
characteristics of individuals but also those of the different trans-port modes (Banister and Berechman, 2000; Geurs and Ritsemavan Eck, 2001).
Koenig (1980) defined the basic assumptions of these measures.First, a utility is associated with each alternative in order to com-pare them, and then select the most useful. Then a utility functionis defined, composed of the sum of a deterministic and a randomcomponent, incorporating the variables representing each option,reflecting the attractiveness of the destination area, the impedanceof the trip owing to the characteristics of the network and trans-port systems, and the characteristics and preferences of the indi-viduals studied (Handy and Nieimeier, 1997). One of the mainproblems with this type of measure, besides that they are some-times difficult to estimate, is that they require a large amount ofinformation.
3.3. Accessibility, inequality and social exclusion
The concept of social exclusion in its different dimensions hasprogressively become an important element in social policy dis-course, often limiting its scope to the field of economic povertyand income-disadvantages. However, social exclusion representsa complex notion that includes several dimensions, including eco-nomic, that considers spatial, political, societal, personal, and tem-poral disadvantages, among others, which can be exacerbated bypoverty (Kenyon et al., 2002).
The social exclusion term refers to the co-existence of a set ofsocial problems associated with the fragmentation of traditionalsocial structures, the decline in participation in normal processesof society, as well as increasing deprivation among particular socialgroups (Burchardt, 1999; Witter, 2010). An individual is sociallyexcluded when he or she resides geographically in a society butcannot be involved in its normal activities (Witter, 2010). Relation-ships between transport and social exclusion have been studiedmore recently with an important number of studies in the UKand the European community whose used survey methodologiesto identify specific conditions related to the transport componentof exclusion (Church et al., 2000; TRaC, 2000; Lucas et al., 2001;Social Exclusion Unit, 2003; Hurnie, 2006; Currie et al., 2007;Cebollada, 2009; Páez et al., 2009).
Mobility-related social exclusion is defined as the process bywhich, due to an insufficiency or inexistence of adequate meansto travel, people are prevented from participating in the economic,political and social life of the community, as a result of reducedaccessibility to opportunities (Kenyon et al., 2002). In the case ofpeople experiencing conditions of exclusion, travel choice is re-moved as a result of an urban environment built around the notionof high mobility in order to access goods, services and participatein society. These conditions are often reinforced by poverty and alow quality of public transport services in neighbourhoods withlow car ownership. However, it is worth noting that not all peoplethat experience mobility-related exclusion live in poor neighbour-hoods, nor that all people experiencing income poverty are ex-cluded (Grieco, 2006).
According to Lucas (2004), the rationale for adopting a socialexclusion approach to transport disadvantage resides in its capac-ity to help policy makers recognise three main aspects of the prob-lem: its multi-dimensional, relational and dynamic nature. In thesame way, the notion of social exclusion is also useful in termsof policy definition and evaluation because it forces one to concen-trate not only on the disadvantages of being excluded as a result oftransport-related inequalities, but on the economic and social out-comes that result from them. In fact, when studying the effects ofthe unavailability or insufficiency of transport from the socialexclusion approach it is fundamental to analyse the consequencesin terms of lack of accessibility to vital activities such as health,

J.P. Bocarejo S., D.R. Oviedo H. / Journal of Transport Geography 24 (2012) 142–154 145
education, employment, etc., for identifying particular deficienciesof transport policies that can lead to more equal and people-fo-cused initiatives.
The main focus of the methodology that will be described in thefollowing sections is the quantification of accessibility levels of dif-ferent groups of the population with different spatial and economicconstrains for travelling. It is intended to apply the social exclusionrationale to the methodology through the identification of the ef-fort made by people for accessing mandatory activities from differ-ent areas of an urban space designed in terms of high mobility, aswell as evidencing the inequalities resulting from the necessity togain access to an income source. Implicitly, the possibility of over-coming at least some of economic constrains that could lead toexclusion are considered. The main objective is to obtain an indica-tor of the effort required for not being excluded, particularly inareas of low income and deficient access to transport alternatives,considering the elements of spatial, economic and transport facili-ties involved in the accessibility function.
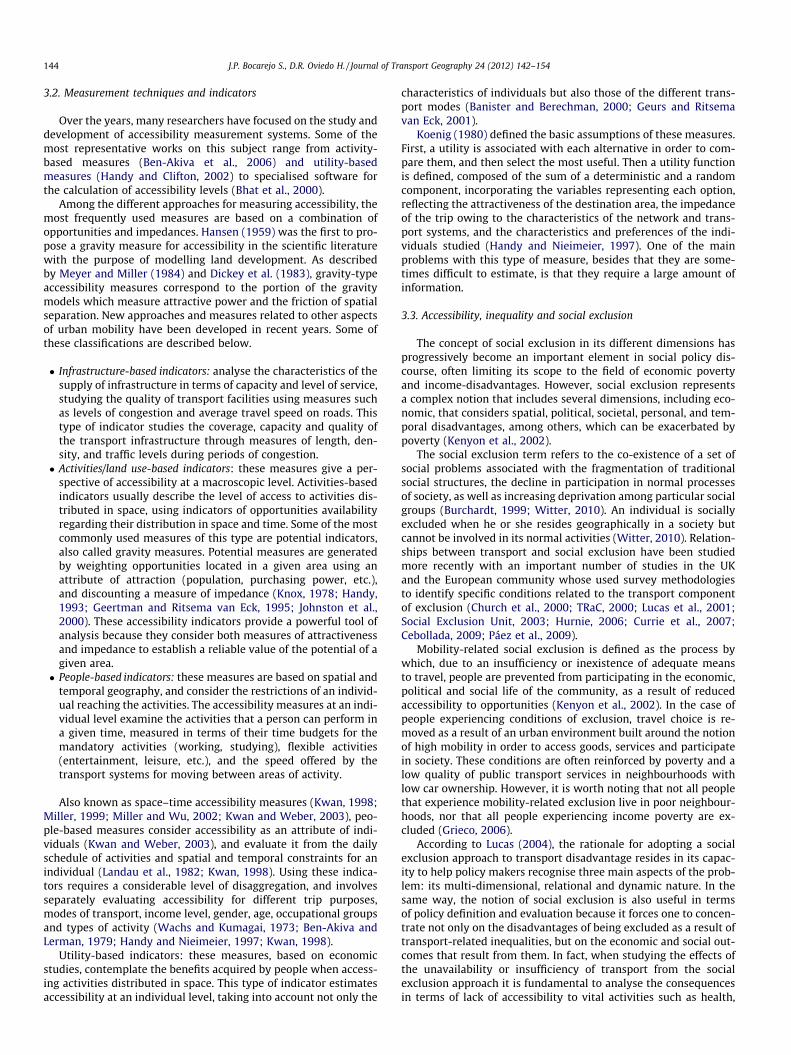
4. Methodology
The conventional Hansen equation, one of the most used formu-las in scientific literature for estimating the level of accessibility ofa given area is defined as:
Ai ¼X
j
ajf ðdijÞ ð1Þ
where Ai = accessibility of the zone i (origin zone), aj = attractive-ness of zone j (destiny zone) and f(dij) = function of the distance(cost) between zones i and j.
In Eq. (1), the cost function is traditionally defined in terms oftravel time or distance inherent to move from one area to another,and takes the standard form of utility functions. Although this mayrepresent a first approach in accessibility measurement in develop-ing countries, in order to consider a component of exceptional rel-evance given the characteristics of the population residing in thestudy area it is necessary to incorporate an affordability compo-nent in the function, which can be expressed in terms of the per-centage of individual income spent on transportation, obtaining:
f ðdijÞ ¼ e�bCi;j ¼ e�b1Ctþb2Cc ð2Þ
where Cij = generalised travel cost (impedance) between zones i andj, Ct = travel time cost between i and j and Cc = percentage of theindividual income spent on travelling.
The first component of generalised travel cost, the cost ex-pressed in terms of time, is directly related to individual variablessuch as occupation, age, income level, among others, and land usevariables such as activities distribution, which determines the tra-vel and activity time budgets.
Similarly, it is related to supply variables that define the speedof travel and availability of transport modes that can increase or re-duce waiting and walking times as the availability of alternativesvaries.
On the other hand, the monetary cost component of f(dij) is di-rectly connected to the income level of individuals and supply oftransport. The affordability component of this function is closelyassociated with the travel money budget that is related to a per-centage of the income of individuals which, according to Zahavi,tends to remain constant in time. As a result, the monetary costof each mode determines whether or not individuals are able touse every alternative available to mobilise themselves, given theirbudget restriction and purchasing power.
Likewise, it is recognised that there are both temporal andfinancial restrictions that limit the ability of individuals to mobi-lise. These constraints represent conditions for the relationship
between internal and external issues that directly affect the levelof accessibility for an individual in a defined study area.
In general, accessibility to the labour market has been calcu-lated from transportation surveys. Given the location of housesand of jobs, and the characteristics of transport modes used, it ispossible to calculate the number of jobs that can be reached con-sidering a ‘‘rational’’ time budget. A more complex definition ofimpedance allows us to introduce affordability as being relevantin the calculation. Labour market was selected as the core of theaccessibility methodology, mainly due to data availability and rel-evance in travel needs in cities of developing contexts (more than70% of all travel in the case of Bogota). The methodology is de-signed for its use in any context in which transport-related disad-vantages are identified. However, its main incentive is to helpdeveloping cities to analyse mobility and social inequalities andcontribute to project analysis and evaluation with limited informa-tion availability. After analysing aspects of the information conve-nience and relevance of the labour market in travel analysis indifferent socioeconomic groups of the urban population of Colom-bia, it was decided to focus the methodology exclusively on man-datory trips, with the anticipation of expanding it in futureresearch.
4.1. The three types of accessibility
4.1.1. Real accessibilitySince a relationship between the costs/budgets of time and
money for travel, transport supply, socioeconomic characteristicsof individuals, and accessibility levels can be inferred as statedabove, these variables can be used to define the parameters ofEq. (2) as:
Ct ¼ f ðMode; Spatial location; Socieconomic strataÞ ð3Þ
Cc ¼ f ðc=iÞ ð4Þ
where Mode = transport mode(s) used to travel from origin to des-tination, Spatial location = travel origin, Socioeconomic strata = lo-cal classification for purchasing power and household income thatstarts from 1 for the poorest segment of the population to 6 forthe richest and c/i = Travel cost vs. Origin zone average individualincome ratio.
A primary result of this research is setting the values of thecoefficients of each variable defined above for all the selected areasof Bogota, as well as their most likely value corresponding to thecharacteristics that determine the level of access to jobs in eachzone. This first value will be termed Real Accessibility.
Real Accessibility is given by the number of jobs that inhabitantsin different zones of the city are actually reaching. We assume thisto be the number of trips made to work. Accessibility per capita foreach zone is obtained by dividing the total number of trips to workby the population of labour force in the zone. Thus, real accessibil-ity is known, and is given by O-D surveys.
From this kind of survey, it is also possible to determine the wayin whichjobs are reached. It is possible to calculate for each ODpair, the average time and percentage of income spent. Therefore,it is possible to calibrate the f(dij) function for several study areaswith this data.
In order to calculate the coefficients for both of the variablesthat are considered in the impedance function, the values of dailyworking commutes are estimated from a 2005 survey, and com-pared with the total job positions offered in each zone, obtainingan approximate value of f(dij). In addition, averages of time andpercentage of income employed on travelling between each i andj pair are known from given databases, permitting regression anal-ysis to be performed, providing the values of b1 and b2 for each ofthe selected zones.
146 J.P. Bocarejo S., D.R. Oviedo H. / Journal of Transport Geography 24 (2012) 142–154
The resulting equation allows researchers and transport plan-ners to evaluate the effects of different policies on accessibility tojobs in each zone by transforming time and cost savings into ameasurable number of additional opportunities obtained fromeach alternative. These analyses can lead to new forms of the eval-uation of transport projects, based on benefits in terms of accessand inclusion, particularly for the most vulnerable populationgroups.
4.1.2. Accessibility given standard parametersZahavi (1974)hypothesised that the average individual travel
time budget is around an hour a day, however, when looking atthe most vulnerable population of Bogota it is noted that theamount of time spent on travelling is very close to, and in manycases exceeds, 60 min per trip. In addition, the same author sug-gests that most people have a travel money budget closely relatedto their income level. Zahavi argues that depending on certain indi-vidual characteristics, the travel money budget remains fairly sta-ble, ranging from 7% to 9% of the individual’s income. Yet, evidencehas shown that in Bogota the poorest people spend more than 20%of their income on transport.
Therefore, if the international standards of travel money andtravel time budgeting are applied as a restriction to the variablesused to determine accessibility to jobs, the reduction in the num-ber of reachable job positions may decrease to a critical leveldepending on the characteristics and the ease of using transportsystems that provide an acceptable service even under theseconditions.
Accessibility levels under these restrictions are estimated in or-der to determine possible inequalities in terms of accessibility in
Fig. 1. Metho
areas with different purchasing power, access to transport systems,and specific spatial location relative to job clusters in the city, un-der the same maximum budget of money and time for accessingmandatory activities such as work.
4.1.3. Available accessibility under desired preferencesThe study of the effects of homogeneous budget restrictions ap-
plied to population groups with different characteristics of trans-port demand and supply can be useful for the preliminaryanalysis of the effects of travel budgets on accessibility. However,if the actual budget of time and money that people in each areaof study are willing to spend on travelling to work is determined,researchers could have better resources to estimate their effecton accessibility, and be allowed to draw relevant conclusions aboutthe disposition of individuals to sacrifice resources (such as time ormoney) given the disparities of opportunities. This exercise couldbe the first step in the study of access inequity generated froman unequal distribution of activities or an insufficient supply oftransport systems in some neighbourhoods.
Therefore, the application of the model obtained from the firsttype of accessibility to the information gathered from the declaredpreference surveys conducted in each of the areas of study, seeks toestablish the access level subject to the budgets of time and moneyas defined by the inhabitants of each zone, which is classed asAvailable Accessibility under desired preferences. This type ofaccessibility helps better identify the level of effort that peoplemake in order to improve their levels of accessibility to mandatoryactivities, and the resulting access if these preferences wereadopted.
dology.

J.P. Bocarejo S., D.R. Oviedo H. / Journal of Transport Geography 24 (2012) 142–154 147
4.2. Evaluation of transport policies
Our laboratory is the Bogota transport system. In the year 2000,Transmilenio BRT system started operation, a second phase wasimplemented in 2006, while a third phase should begin operationby the end of 2011. In 10 years, the Transmilenio system will becarrying almost 30% of the public transport demand, almost 2 mil-lion trips per day.
Transmilenio’s impact in terms of travel time savings has beenimportant. Nevertheless, cost may have increased for some users.
Considering the accessibility approach, it is possible to estimatethe improvement that Transmilenio has brought to the population,with respect to different incomes, location and access to the sys-tem. This will be done for some of the zones served by the thirdphase of Transmilenio.
As the fare may be a critical issue for a large part of the popula-tion served by Transmilenio, we also calculate the variation inaccessibility brought by a subsidy policy.
Fig. 1 provides a brief summary of the main steps of the devel-oped methodology.
5. Results
In order to test our methodology we decided to analyse the dif-ferent types of accessibility in different zones of Bogota.
5.1. Available information
Information on travel patterns can be accessed from the 2005OD Travel Survey of Bogota (Universidad Nacional, 2005), whichconsiders 846 homogeneous zones in terms of socio-economic
Fig. 2. Employment and incom
characteristics. These zones are grouped into 117 planning zones,called UPZ.
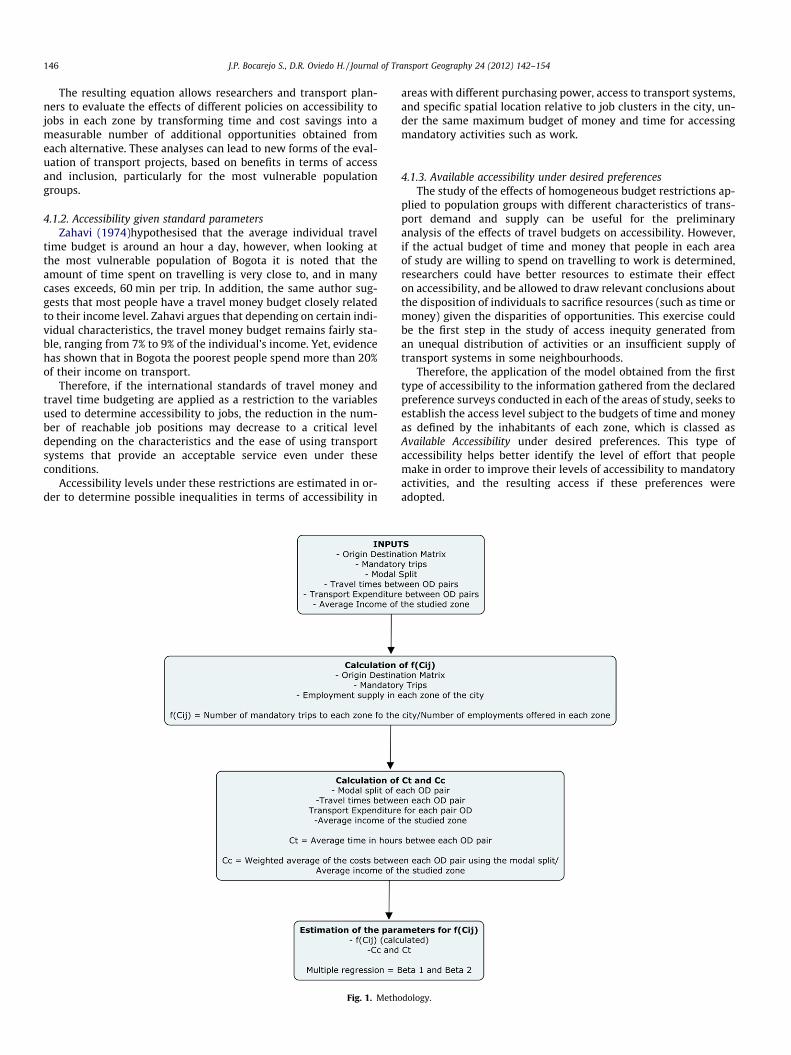
Information on the number of jobs and locations is provided bythe Planning Department of the District (Secretaría Distrital dePlaneación de Bogota, 2005). For a better understanding of the dis-tribution of activities in the city of Bogota, as well as the character-istics of each of the selected areas, the job distribution of the cityand a summary of the attributes of each of the ten selected areasare summarized in Fig. 2 and Table 1.
Fig. 2 allows us to identify a large CBD, which also concentrateson education, health and cultural activities.
Information on the level of income has been provided by thePlanning Department (Secretaría Distrital de Planeación de Bogota,2005). A scale that goes from 1 to 6 depending on the average in-come level of households is used in socioeconomic studies and sta-tistics. Fig. 2 shows the geographic distribution of the poor and richareas in Bogota.
It is possible to note that the high income population tends tosettle close to the CBD (according to Fig. 2), while the poorest liveat the city’s boundaries. Socio economic segregation is quitedramatic.
5.2. Choice of study zones
In order to evaluate the three types of accessibility defined pre-viously, we have analysed UPZs that have different characteristics,related to the level of income, quality of transport system and loca-tion in relation to main work areas, as shown in Table 1.
This table briefly summarises the characteristics of each of theareas chosen for the study and reflects the differences betweeneach of them, demonstrating that there are areas such as Luceroand Bosa Central which are not only located in a unfavourable
e distribution of Bogota.
Table 1Main attributes of selected study zones.
No Zone Income BRT service Car ownership Distance to main job clusters Population density Job density Road density
H M L Yes No H M L H M L H M L H M L H M L
1 Bosa Central X X X X X X X2 Lucero X X X X X X X3 San Blás X X X X X X X4 Zona Franca X X X X X X X5 El Rincón X X X X X X X6 Bolivia X X X X X X X7 La Esmeralda X X X X X X X8 Ciudad Salitre X X X X X X X9 Country Club X X X X X X X
10 Chicó Lago X X X X X X X
H = high, M = medium, L = low.
Table 2Real accessibility results.
Zone Socioeconomic class Accessibility (numberof employment positions)
Accessibility per inhabitanta Average traveltime (min)
Average percentageof income (%)
Bosa Central 1–2 93,713 0.53 60 24Lucero 1–2 42,286 0.22 63.1 26San Blás 1–2 43,279 0.62 59.4 27Zona Franca 2–3 35,704 0.87 54 21El Rincón 2–3 148,238 0.86 68 15Bolivia 3 76,336 0.83 44.9 13La esmeralda 4 24,249 0.85 39 5Ciudad Salitre 4–5 23,997 1.1 38.5 6Country Club 5 27,860 1 50 4Chi co lago 5–6 28,363 0.99 36.9 3
a This indicator is calculated based on the potential of the population that could work in the zone of analysis. In this case, population in terms of working age was used,resulting in accessibility per member of the potential labour force of a specific area.
148 J.P. Bocarejo S., D.R. Oviedo H. / Journal of Transport Geography 24 (2012) 142–154
places relative to the position of employment centres, but that alsohave a fairly low income level. In addition, some of the selectedzones, despite their high income level, may also be affected interms of accessibility because they are far away from the city cen-tre. Similarly, middle income areas such as Bolivia, are consider-ably closer to the main sources of employment and have a publictransport service of good quality. In contrast, Ciudad Salitre notonly is an area of high income but is also very close to the majorwork centres of Bogota.
5.3. Accessibility estimation
Table 2 shows the main information obtained for each zone interms of accessibility in number of work trips (Aj) per capita, aver-age travel time and percentage of income used in transportation.The following are some initial facts that may be determined fromthis analysis:
First, per capita real accessibility does not depend entirely on le-vel of income. Even though the lowest income areas tend to havelower real accessibility, some interesting exceptions can be identi-fied. Accessibility in areas such as 09 and 08, the latter being onaverage of a lower income, shows that location regarding employ-ment and public transport availability can be determinant. Withless time spent commuting, Ciudad Salitre (08) has the same acces-sibility level as Country Club (09). In contrast, some areas withhigh travel time, like 05, have a higher access to employment thanother zones with a similar income level.
Second, according to the results obtained, the potential accessfor the observed conditions of supply and demand reveals a dilem-ma of inequality with respect to access to opportunities of work.Although the difference in time spent by the lower strata is greaterthan 48% compared to the upper classes, the most critical differ-ences correspond to the percentage of income intended for travel
that is 400% higher. In addition, some of these zones show somekind of resignation in terms of the amount of some attributeswhich indicate that, in the case of mandatory travel, they are in-clined to spend a lot more than what is expected because of theneed to earn a basic income. In some cases, sacrifice ‘‘pays off’’ asmore time spent allows better accessibility, as in the case of El Rin-con (05) where in spite of the disadvantageous conditions andhigher travel times their inhabitants have more access to workthan middle income zones.
Third, from the real accessibility results it can be inferred that,due to the geographic location of some areas and the unequal dis-tribution of activities in the city of Bogota, the trips generated formandatory activities require a higher travel time, resulting in alower number of jobs accessible within a similar range of distance.Furthermore, the low purchasing power combined with inade-quate transport and unfavourable locations make cases such asLucero critical examples of access inequity to opportunities inthe city. Due to a centralised distribution of activities and an imbal-ance in the opportunities, there is a willingness from certain indi-viduals to sacrifice certain aspects, like more time for otheractivities or money for other purposes, to access employment.
Fourth, even though individuals with high income have accessto a car in a greater proportion than individuals on middle in-comes, there is not a vast difference in terms of time and moneyspent, and in terms of accessibility. Car use does not have a bigimpact on accessibility for the people of Bogota; a dense and con-gested city may in part explain this fact.
As explained in previous sections, one of the main results ofthis research is the estimation of the parameters for the impedancefunction in each of the selected study areas. In this regard,the equations obtained according to the characteristics of trans-port supply and demand in each area studied are summarizedbelow,
J.P. Bocarejo S., D.R. Oviedo H. / Journal of Transport Geography 24 (2012) 142–154 149
f ðdEl Rinco�on jÞ ¼ e�ð1:95�Ctþ2:39�CcÞ ð5Þ
f ðdBosa central jÞ ¼ e�ð1088�Ctþ3:53�CcÞ ð6Þ
f ðdCountry Cub jÞ ¼ e�ð5:77�Ctþ0:037�CcÞ ð7Þ
f ðdZona Franca jÞ ¼ e�ð3:81�Ctþ4:06�CcÞ ð8Þ
f ðdBolivia jÞ ¼ e�ð4�Ctþ4:54�CcÞ ð9Þ
f ðdLucero jÞ ¼ e�ð0:66�Ctþ11:7�CcÞ ð10Þ
f ðdChic�o Lago jÞ ¼ e�ð9:8�Ctþ0:41�CcÞ ð11Þ
f ðdLa Esmeralda jÞ ¼ e�ð9:24�Ctþ2:4�CcÞ ð12Þ
f ðdSan Bl�as jÞ ¼ e�ð2�Ctþ9:66�CcÞ ð13Þ
f ðdCiudad Salitre jÞ ¼ e�ð9:55�Ctþ2:06�CcÞ ð14Þ
As shown in the equations above, the coefficients vary sharplyfrom one area to another depending on their income level, locationand supply of transport. In the case of high income areas, a poten-tial increase in the monetary costs of transport has no relevant ef-fect, while in the low income areas the opposite is true sinceindividuals are willing to spend more time travelling as long as thisrepresents monetary savings. Likewise, we see that in middle in-come areas, which are also well located, the coefficients are similaras a result of the additional value given to the proximity to the cen-tres of labour supply. At this point it is worth noting that in thecase of the regressions used to calculate the accessibility parame-ters, statistically significant results were obtained for each casestudy, as shown in Supplementary Annex. 1.
As shown in Table 3, regarding the desired expenditure in termsof time and income, the results show that:
First, the time individuals would like to spend travelling to workis similar for all income levels and locations, it is close to 40 minwith a few exceptions that are closer to 35 min. These atypicalcases can be explained in terms of spatial location relative toemployment centres, because these zones are located in favourableplaces, have a higher income and have better access to transportsystems than other zones. Regarding percentage of income theywish to spend, it is on average 13% with marked variations depend-ing on the purchasing power of each zone. Unusual budgets areidentified following a similar explanation of the previous case.
Second, the difference between the desired condition and thereal condition for individuals in Bogota is quite dramatic. Thelow income individuals spend 40% more time and 38% more moneythat they wish to. In comparison, middle income individuals spend39% and wish to spend 5% more, for higher income these
Table 3Desired travel time and monetary budgets for each zone.
Zone Travel budgets for work commutes
Time (min) Money (% of income)
Bosa Central 43 18.00Lucero 42 15.60San Blás 40 11.30Zona Franca 44 26.00El Rincón 40 17.00Bolivia 41 9.60La esmeralda 36 7.70Ciudad Salitre 38 5.60Country Club 43 12.00Chi co lago 35 6.50
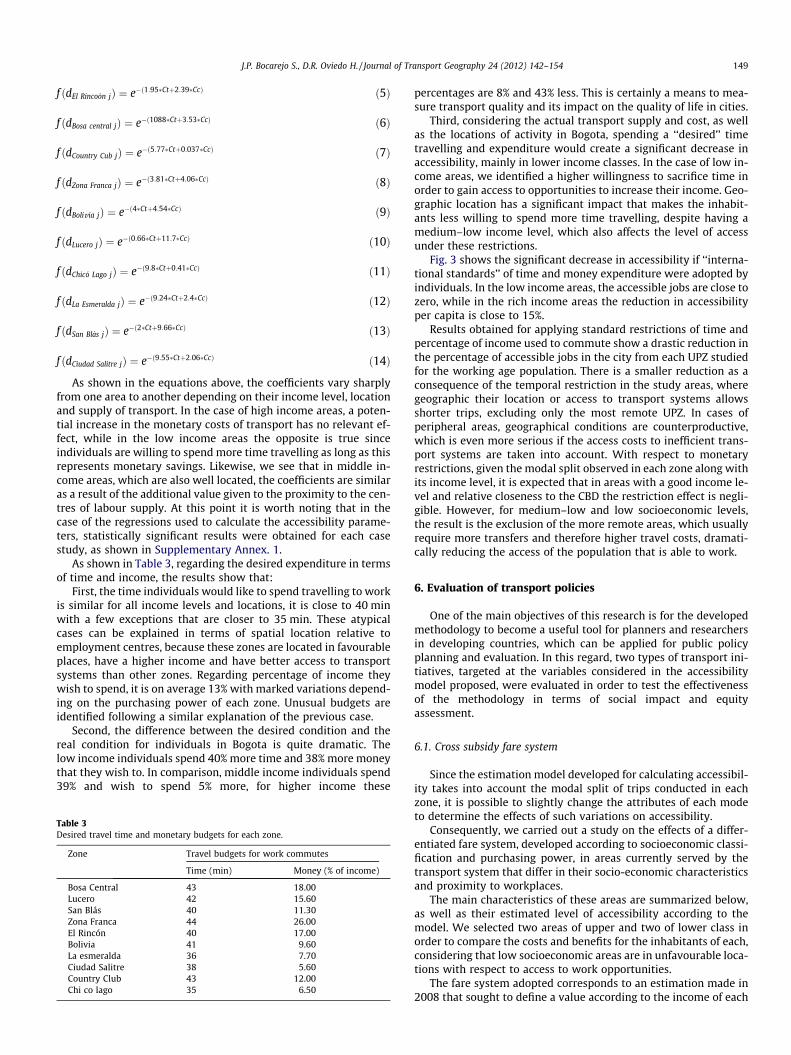
percentages are 8% and 43% less. This is certainly a means to mea-sure transport quality and its impact on the quality of life in cities.
Third, considering the actual transport supply and cost, as wellas the locations of activity in Bogota, spending a ‘‘desired’’ timetravelling and expenditure would create a significant decrease inaccessibility, mainly in lower income classes. In the case of low in-come areas, we identified a higher willingness to sacrifice time inorder to gain access to opportunities to increase their income. Geo-graphic location has a significant impact that makes the inhabit-ants less willing to spend more time travelling, despite having amedium–low income level, which also affects the level of accessunder these restrictions.
Fig. 3 shows the significant decrease in accessibility if ‘‘interna-tional standards’’ of time and money expenditure were adopted byindividuals. In the low income areas, the accessible jobs are close tozero, while in the rich income areas the reduction in accessibilityper capita is close to 15%.
Results obtained for applying standard restrictions of time andpercentage of income used to commute show a drastic reduction inthe percentage of accessible jobs in the city from each UPZ studiedfor the working age population. There is a smaller reduction as aconsequence of the temporal restriction in the study areas, wheregeographic their location or access to transport systems allowsshorter trips, excluding only the most remote UPZ. In cases ofperipheral areas, geographical conditions are counterproductive,which is even more serious if the access costs to inefficient trans-port systems are taken into account. With respect to monetaryrestrictions, given the modal split observed in each zone along withits income level, it is expected that in areas with a good income le-vel and relative closeness to the CBD the restriction effect is negli-gible. However, for medium–low and low socioeconomic levels,the result is the exclusion of the more remote areas, which usuallyrequire more transfers and therefore higher travel costs, dramati-cally reducing the access of the population that is able to work.
6. Evaluation of transport policies
One of the main objectives of this research is for the developedmethodology to become a useful tool for planners and researchersin developing countries, which can be applied for public policyplanning and evaluation. In this regard, two types of transport ini-tiatives, targeted at the variables considered in the accessibilitymodel proposed, were evaluated in order to test the effectivenessof the methodology in terms of social impact and equityassessment.
6.1. Cross subsidy fare system
Since the estimation model developed for calculating accessibil-ity takes into account the modal split of trips conducted in eachzone, it is possible to slightly change the attributes of each modeto determine the effects of such variations on accessibility.
Consequently, we carried out a study on the effects of a differ-entiated fare system, developed according to socioeconomic classi-fication and purchasing power, in areas currently served by thetransport system that differ in their socio-economic characteristicsand proximity to workplaces.
The main characteristics of these areas are summarized below,as well as their estimated level of accessibility according to themodel. We selected two areas of upper and two of lower class inorder to compare the costs and benefits for the inhabitants of each,considering that low socioeconomic areas are in unfavourable loca-tions with respect to access to work opportunities.
The fare system adopted corresponds to an estimation made in2008 that sought to define a value according to the income of each

Fig. 3. Accessibility results considering desired and standard expenditure in relation to Real Accessibility results.
150 J.P. Bocarejo S., D.R. Oviedo H. / Journal of Transport Geography 24 (2012) 142–154
J.P. Bocarejo S., D.R. Oviedo H. / Journal of Transport Geography 24 (2012) 142–154 151
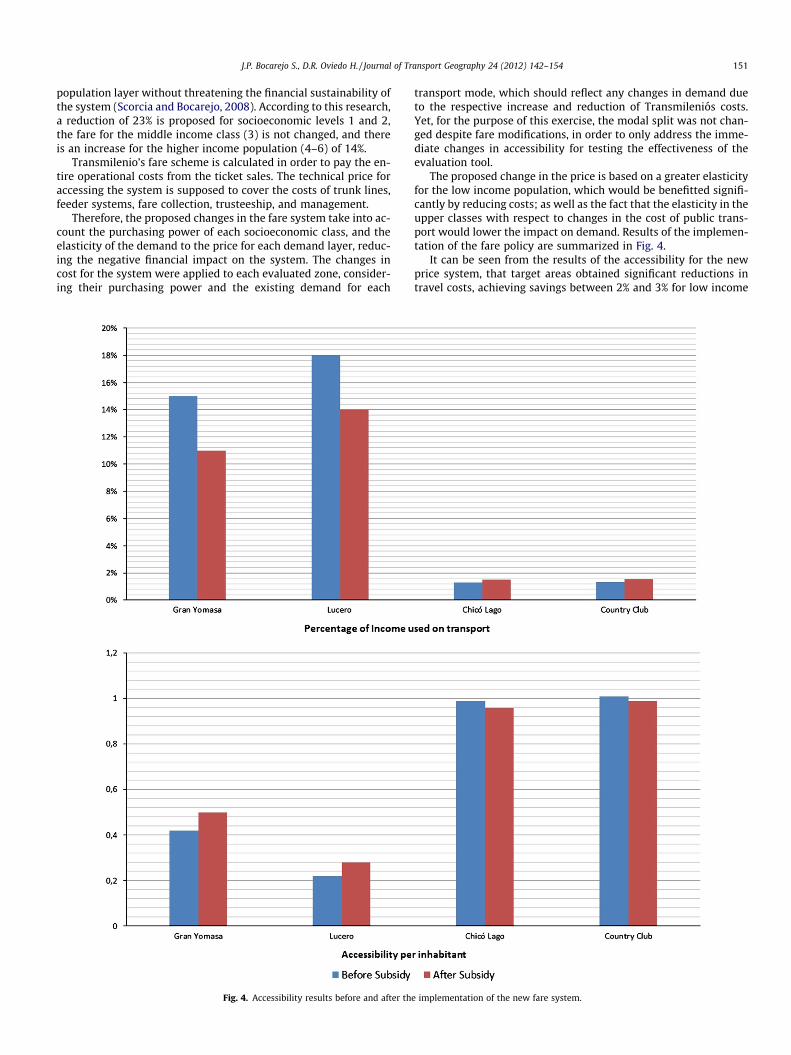
population layer without threatening the financial sustainability ofthe system (Scorcia and Bocarejo, 2008). According to this research,a reduction of 23% is proposed for socioeconomic levels 1 and 2,the fare for the middle income class (3) is not changed, and thereis an increase for the higher income population (4–6) of 14%.
Transmilenio’s fare scheme is calculated in order to pay the en-tire operational costs from the ticket sales. The technical price foraccessing the system is supposed to cover the costs of trunk lines,feeder systems, fare collection, trusteeship, and management.
Therefore, the proposed changes in the fare system take into ac-count the purchasing power of each socioeconomic class, and theelasticity of the demand to the price for each demand layer, reduc-ing the negative financial impact on the system. The changes incost for the system were applied to each evaluated zone, consider-ing their purchasing power and the existing demand for each
Fig. 4. Accessibility results before and after th
transport mode, which should reflect any changes in demand dueto the respective increase and reduction of Transmilenios costs.Yet, for the purpose of this exercise, the modal split was not chan-ged despite fare modifications, in order to only address the imme-diate changes in accessibility for testing the effectiveness of theevaluation tool.
The proposed change in the price is based on a greater elasticityfor the low income population, which would be benefitted signifi-cantly by reducing costs; as well as the fact that the elasticity in theupper classes with respect to changes in the cost of public trans-port would lower the impact on demand. Results of the implemen-tation of the fare policy are summarized in Fig. 4.
It can be seen from the results of the accessibility for the newprice system, that target areas obtained significant reductions intravel costs, achieving savings between 2% and 3% for low income
e implementation of the new fare system.
152 J.P. Bocarejo S., D.R. Oviedo H. / Journal of Transport Geography 24 (2012) 142–154
groups and an increase of only 1% for higher income areas. In addi-tion, contrasting to these low changes in travel costs it can be seenthat the benefits to individual and accessibility in areas like GranYomasa and Lucero are considerable, while the losses in the otherzones are negligible both in absolute and relative terms.
A cross subsidy policy could generate benefits in terms of equityin cities such as Bogota, which are reflected in better accessibilityto work opportunities. Nonetheless, the increasing operative costs
Fig. 5. Accessibility results before and after
and reduction in revenue could damage the self-financing stabilityof Transmilenio.
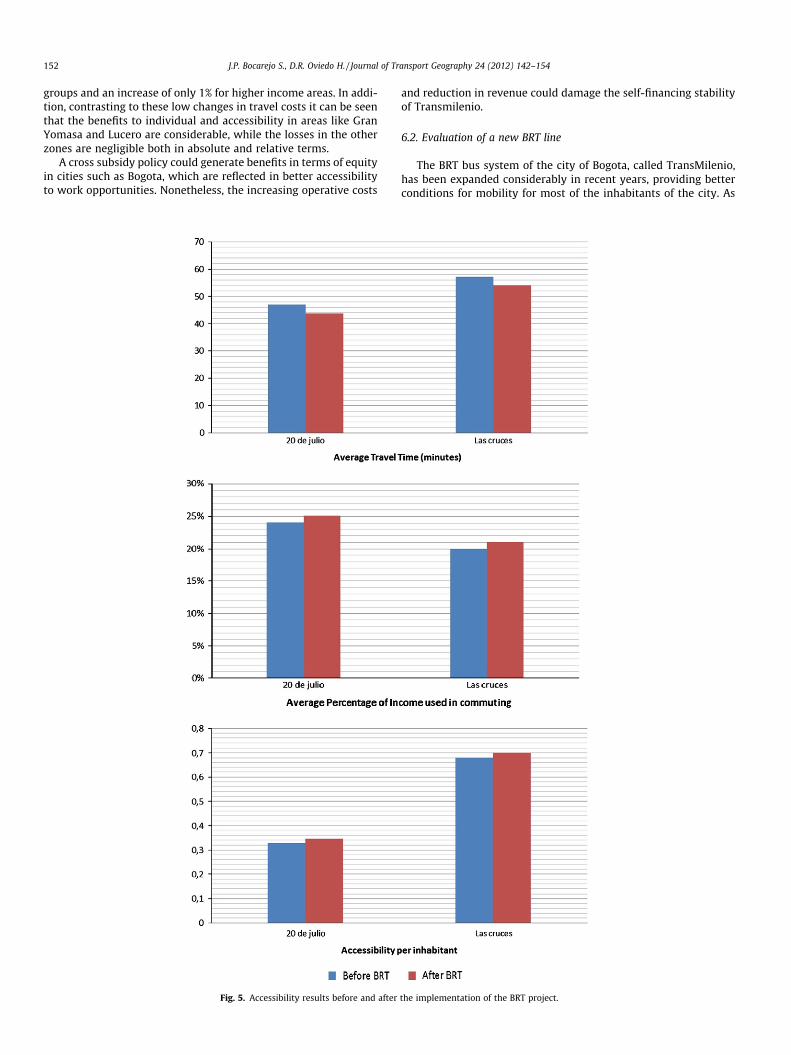
6.2. Evaluation of a new BRT line
The BRT bus system of the city of Bogota, called TransMilenio,has been expanded considerably in recent years, providing betterconditions for mobility for most of the inhabitants of the city. As
the implementation of the BRT project.
J.P. Bocarejo S., D.R. Oviedo H. / Journal of Transport Geography 24 (2012) 142–154 153
part of its expansion, Transmilenio’s third phase aims to develop anew bus corridor that will connect the north and south of the cityon its east side, areas of mostly low income households.
In the third phase, certain benefits of the new system comparedto traditional public transport are recognised in terms of speed,that will increase from the current 15 km/h to approximately24 km/h (9.2 km/h higher), which will reduce travel times and alsogenerate a demand to transfer from the traditional forms of publictransport. In addition, there will be a fare increase of 15%, and it isexpected that half of the total demand for public transport will usethe BRT service.
Two adjacent areas to the new BRT corridor have been analysed.The main objective, similarly to the previous exercise, is to esti-mate the combined effects of savings in travel time and farechanges over accessibility, in order to test the evaluation tool ina more complex context.
As explained in previous sections, the accessibility estimationmodel uses the existing modal split in every zone for work travelin order to calculate the weighted average of travel times and costsfor all O-D Pairs. Therefore, the proposed changes in demand,speed and cost will be reflected in the calculated accessibility foreach zone, allowing a comparative analysis of the new access levelsdue to the effect of the new system against the scenario withoutthe project.
Transmilenio’s new phase positively impacts on accessibility inthe two zones analysed, as the increase in speed has a greater ef-fect than the rise in fares. Nevertheless, a higher increase in tariffsor a less efficient system could produce a negative impact on acces-sibility. In order to explain these results, is necessary to considerthe modal split of each zone; both of them characterised for havingan important portion of total daily trips made on foot (approxi-mately 23%). The increased fare costs of the BRT system preventa greater demand for the new system due to the impossibility ofpaying the new fare for almost a quarter of the population. Fig. 5presents the changes in accessibility as a result of the new BRT line.
As can be seen, there is a slight increase in the accessibility ineach of the study areas, given the modal split and their locationsclose to employment centres, which generate the possibility ofan increased number of trips on foot. In that sense, we concludethat, given the important increase in travel speed for a greatershare of the existing public transport users, it is possible to obtainmajor benefits in terms of accessibility than the decrease in acces-sibility generated as result of the rise in price for those users.
It can be inferred that the estimated accessibility detriment pro-duced by the higher cost of the new system has proved to be lesslikely to adversely affect the total accessibility of each area, tothe extent that, under the proposed situation, time savings aremore profitable than the number of additional jobs that may belost due to the increase in costs. Transmilenio’s effect on commut-ing efficiency in terms of speed and reduced travel times is verypositive, even for zones that value transport system costs higher,as shown by the calculations made in this section. Therefore, ifimprovements in public transport systems, such as Transmilenio,were combined with a fare policy as evaluated in the previous sec-tion, the benefit in terms of accessibility for low income areas incities like Bogota could be enormous.
7. Conclusions
Accessibility as a way of evaluating transport policies allowsconsidering aspects related to urban structure, transport systemquality, individual characteristics and purchasing power. The num-ber of accessible employment opportunities related to the totalnumber of the work force gives an idea of the impact producedby transport projects considering accessibility.
Accessibility can be related to the time and percentage of in-come spent on commuting. It varies upon the type of user, its loca-tion and mode used. Differences in the coefficients evidence therelevance of each variable, depending on the location, purchasingpower and availability of alternative modes of transport, showingin general a higher incidence of time in richer areas and the impor-tant effect of money over accessibility in low income areas, withonly some specific exceptions in well-located areas.
The proposed methodology can be used as an additional ele-ment in the decision making processes regarding where and howto respond to transport disadvantages in cities that experiencetransport-related inequalities, through the identification of specificneeds, prioritisation and proposal of transport strategies foraddressing the disadvantages caused by location or reduced pur-chasing power. Inclusion of affordability in the indicator immedi-ate provides information on equity impacts related to income.This approach allows researchers and policy makers to considerthe economic limitations of the population in the formulation ofinitiatives that aim to improve conditions of access.
In addition, the possibility of exploring travel budgets and theireffect on accessibility represents a step forward in the identifica-tion of inequalities and the needs of specific population groups,and the definition of priorities-based policies aiming at reducingthe effort made by people in order not to be excluded. In fact,the examples identified when comparing economic and infrastruc-ture initiatives, evidenced the different outcomes that can beachieved by addressing these priorities.
8. Future developments
The methodology defined and tested in this paper represents afirst step in the development of accessibility analysis tools for un-equal mobility conditions and policy responses for their mitigation.We aim to continue improving the methodology, as well as encour-aging other researchers to contribute to the development of trans-port analysis tools that consider social elements. The first directionfor improvement is the analysis of access to other activities andservices, which will require more data and aggregation, but canhelp better understand the level of transport-related inequalitiesbetween groups of the population with different transport andsocioeconomic disadvantages. Likewise, it is recognised that thereare additional elements involved in generalised travel costs thatshould be considered, and which can be used for the developmentof a more complex and precise impedance function and morein-depth analyses.
Finally, we believe that this is an indicator with great potentialfor the development and evaluation of transport conditions andpolicies, as well as the study of social impacts of mobility.Consequently, we expect to apply the accessibility indicators tothe identification of mobility needs with social implications andin the development of future projects and evaluation of existingmobility strategies, not only in developing cities but in any contextthat exhibits transport disadvantages like those described in thiswork.
Acknowledgements
We would like to express our gratitude to the Vice-Rector forResearch of the Universidad de los Andes, for the funding and gen-eral support given for the development of this study.
Appendix A. Supplementary material
Supplementary data associated with this article can be found, inthe online version, at doi:10.1016/j.jtrangeo.2011.12.004.

154 J.P. Bocarejo S., D.R. Oviedo H. / Journal of Transport Geography 24 (2012) 142–154
References
Banister, D., Berechman, J., 2000. Transport Investment and Economic Development.University College London Press, London.
Ben-Akiva, M., Lerman, S.R., 1979. In: Hensher, D.A., Stopher, P.R. (Eds.),Disaggregate Travel and Mobility-Choice Models and Measures ofAccessibility. Behavioural Travel Modeling, London: Croom-Helm, pp. 654–679.
Ben-Akiva, M., Xiaojing, D., Bowman, J.L., Walker, J.L., 2006. Moving from trip-basedto activity-based measures of accessibility. Transportation Research Part A 40,163–180.
Bhat, C.R., Handy, S., Kockelman, K., Mahmassani, H.S., Chen, Q., Weston, L., 2000.Accessibility Measures: Formulation Considerations and Current Applications,Report 4938-2. Texas Department of Transportation.
Burchardt, T., 1999 (cited in F.C. Hodgson and J. Turner, 2003. Participation notconsumption: the need for new participatory practices to address transport andsocial exclusion. Transport Policy, 10, 272).
Cebollada, A., 2009. Mobility and labour market exclusion in the Barcelonametropolitan region. Journal of Transport Geography 17, 226–233.
Cervero, R., 1989. Jobs-housing balance and regional mobility. Journal of theAmerican Planning Association 55 (Z), 136–150.
Cervero, R., 1996. Jobs-housing balance revisited. Journal of the American PlanningAssociation 62 (4), 492–511.
Church, A., Frost, M., Sullivan, K., 2000. Transport and social exclusion in London.Transport Policy 7, 195–205.
Currie, G., Stanley, J., Stanley, J., 2007. No Way to Go: Transport and SocialDisadvantage in Australian Communities Melbourne. Monash University ePress,Australia.
Curtis, C., 2007. Planning for sustainable accessibility: the implementationchallenge. Transport Policy 15, 104–112.
Dalvi, M.Q., Martin, K.M., 1976. The measurement of accessibility: some preliminaryresults. Transportation 5, 17–42.
Dickey, J., Diewald, W.J., Hobeika, A.G., Hurst, C.J., Stephens, N.T., Stuart, R.C.,Walker, R.D., 1983. Metropolitan Transportation Planning, second ed.Hemisphere Publishing Co., New York.
Geertman, S.C.M., Ritsema van Eck, J.R., 1995. GIS and models of accessibilitypotential: an application in planning. International Journal of GeographicalInformation Systems 9, 67–80.
Geurs, K.T., Ritsema van Eck, J.R., 2001. Accessibility Measures: Review andApplications. RIVM Report 408505 006. National Institute of Public Healthand the Environment, Bilthoven.
Geurs, K.T., Van Wee, B., 2004. Accessibility evaluation of land-use and transportstrategies: review and research directions. Journal of Transport Geography 12,127–140.
Grieco, M., 2006. Accessibility, mobility and connectivity: the changing frontiers ofeveryday routine. European Spatial Research and Policy 78 (6), 1360–1380(Special Issue).
Gutiérrez, J., 2001. Location, economic potential and daily accessibility: An analysisof the accessibility impact of the high-speed line Madrid–Barcelona–Frenchborder. Journal of Transport Geography 9 (4), 229–242.
Halden, D., 2002. Using accessibility measures to integrate land use and transportpolicy in Edinburgh and the Lothians. Transport Policy 9, 313–324.
Handy, S., 1993. A cycle of dependence: automobiles, accessibility and the evolutionof the transportation and retail hierarchies. The Berkeley Planning Journal 9,21–43.
Handy, S., Clifton, K., 2002. Evaluating neighborhood accessibility: possibilities andpracticalities. Journal of Transportation and Statistics 4 (2/3), 67–78.
Handy, S.L., Nieimeier, D.A., 1997. Measuring accessibility: an exploration of issuesand alternatives. Environment and Planning A 29, 1175–1194.
Hansen, W., 1959. How accessibility shapes land use. Journal of the AmericanInstitute of Planners.
Hurnie, A., 2006. Transport and Social Exclusion. Australia, Western SydneyUniversity of Western Sydney and Western Sydney Community Forum.
Johnston, R.J., Gregory, D., Pratt, G., Watts, M. (Eds.), 2000. The Dictionary of HumanGeography, fourth ed. Blackwell Publishers Ltd.
Kenyon, S., Lyons, G., Rafferty, J., 2002. Transport and social exclusion: investigatingthe possibility of promoting inclusion through virtual mobility. Journal ofTransport Geography 10, 207–219.
Knox, P., 1978. The intraurban ecology of primary medical care: patterns ofaccessibility and their policy implications. Environmental Planning A 10, 415–435.
Koenig, J.G., 1980. Indicators of urban accessibility: theory and application.Transportation 9, 145–172.
Kwan, M.-P., 1998. Space-time and integral measures of individual accessibility: acomparative analysis using a point-based framework. Geographical Analysis 30(3), 191–216.
Kwan, M., Weber, J., 2003. Individual accessibility revisited: implications forgeographical analysis in the 21st century. In: Hanson, S., Kwan, M.-P. (Eds.),Transport: Critical Essays in Human Geography. Ashgate, London.
Landau, U., Prashker, J., Alpern, B., 1982. Evaluation of activity constrained choicesets to shopping destination choice modelling. Transportation Research A 16,199–207.
Levine, J., Garb, Y., 2002. Congestion pricing’s conditional promise: promotion ofaccessibility or mobility? Transport Policy., 9.
Linneker, B.J., Spence, N.A., 1992. Accessibility measures compared in an analysis ofthe impact of the M25 London orbital motorway on Britain. Environment andPlanning A 24 (1), 1137–1154.
LOTI Transport Act of France, 1982.Lucas, K., 2004. Running on Empty: Transport Social Exclusion and Environmental
Justice. Policy Press, Bristol.Lucas, K., Grosvenor, T., Simpson, R., 2001. Transport, the Environment and Social
Exclusion. Joseph Rowntree Foundation/York Publishing Ltd., York.Meyer, M., Miller, E., 1984. Urban Transportation Planning. McGraw-Hill, New York.Miller, H.J., 1999. Measuring space-time accessibility benefits within transportation
networks: Basic theory and computational procedures. Geographical Analysis31, 187–212.
Miller, H., Wu, Y., 2002. Computational tools for measuring space-time accessibilitywithin transportation networks with dynamic flow. Journal of Transportationand Statistics 4 (2/3), 1–14 (Special issue).
Niemeier, D.A., 1997. Accessibility: an evaluation using consumer welfare.Transportation 24, 377–396.
Nutley, D., 1980. Accessibility, mobílity and transport-related welfare: the case ofrural Wales. Geoforum 11, 335–352.
Páez, A., Mercado, R.G., Farber, S., Morency, C., Roorda, M., 2009. Mobility and socialexclusion in Canadian communities: an empirical investigation of opportunityaccess and deprivation from the perspective of vulnerable groups. PolicyResearch Directorate Strategic Policy and Research, Toronto.
Priemus, H., Visser, J., 1995. Infrastructure Policy in the Randstad Holland: StruggleBetween Accessibility and Sustainability. OTB Research Institute for PolicySciences and Technology, Delft University of Technology, Delft.
Ribeiro, A., Pais, A., Páez, A., 2009. Road accessibility and cohesion in laggingregions: empirical evidence from Portugal based on spatial econometricmodels. Journal of Transport Geography 18 (1), 125–132.
Scorcia, Y.S., Bocarejo, J.P., 2008. Análisis de la implementación de una tarifa enTransmilenio en algunos sectores de Bogotá. Universidad de los Andes, Bogota.
Scottish Executive, 2000a. Review of Accessibility Analysis Techniques. DerekHalden Consultancy for the Scottish Executive Central Research Unit,Edinburgh.
Scottish Executive, 2000b. Guidance on Accessibility Measuring Techniques. DerekHalden Consultancy for the Scottish Executive Central Research Unit,Edinburgh.
Secretaría Distrital de Planeación de Bogota, 2005. Monografías de localidades.<http://www.sdp.gov.co> (accessed 25.04.10).
Social Exclusion Unit, 2003. Making the Connections: Final Report on Transport andSocial Exclusion. Office of the Deputy Prime Minister, London.
Straatemeier, T., 2009. How to plan for regional accessibility. Transport Policy 15(2), 127–137.
TRaC, 2000. Social Exclusion and the Provision of Public Transport. Department ofEnvironment Transport and the Regions, London.
Universidad Nacional de Colombia, 2005. Encuesta de Movilidad de Bogotá. PlanMaestro de Movilidad. Secretaría Distrital de Movilidad, Bogota.
Van Wee, B., Hagoort, M., Annema, J.A., 2001. Accessibility measures withcompetition. Journal of Transport Geography 9, 199–208.
Wachs, M., Kumagai, T.G., 1973. Physical accessibility as a social indicator. Socio-Economic Planning Science 7, 437–456.
Witter, R., 2010. Public urban transport, travel behaviour and social exclusion – thecase of Santiago de Chile. In: XII World Conference on Transportation Research,Lisbon (July).
Wu, B.M., Hine, J.P., 2003. A PTAL approach to measuring changes in bus serviceaccessibility. Transport Policy 10 (4), 307–320.
Zahavi, Y., 1974. Traveltime Budgets and Mobility in Urban Areas. Final Report.Report FHWA PL-8183. FHWA, US Department of Transportation, Washington,DC.