Estimation of Bus Transport Ridership accounting Accessibility
9
Procedia - Social and Behavioral Sciences 104 (2013) 885 – 893 1877-0428 © 2013 The Authors. Published by Elsevier Ltd. Selection and peer-review under responsibility of International Scientific Committee. doi:10.1016/j.sbspro.2013.11.183 ScienceDirect 2 nd Conference of Transportation Research Group of India (2nd CTRG) Estimation of Bus Transport Ridership Accounting Accessibility S Kalaanidhi a 1 & Dr. K Gunasekaran b aPost Graduate Student, College of Engineering Guindy, Anna University, Chennai 600025, India bAssociate Professor, College of Engineering Guindy, Anna University, Chennai 600025, India Abstract Accessibility is defined as a measure of the ease with which an individual can pursue an activity of a desired type, at a desired location, by a desired mode, and at a desired time. It influences the modal choice of a trip maker preferring public transport. Estimation of ridership of a public transport system is to predict the behavioral patterns of individuals and their influence on mode selection. Formulation of a framework for evaluating the accessibility of urban transportation networks and assessing its influence on the ridership of bus transit system is the main focus of the paper. The accessibility measures encompass a range of available opportunities with respect to the attractiveness and travel impedance. In this approach the accessibility measures were considered in geographically aggregated level mainly because of two reasons. One is that this framework is intended for planning decisions which by necessity deals with areas and not with individuals living in it. Another reason is to showcase the methodology of interrelating the accessibility measures and ridership of a transport system. Hence these measures are indispensable to be of plain and easy to understand and work with. The bus route (21G) from Tambaram to Broadway in Chennai city was chosen for this study. It is of 35 km in length. Bus passenger opinion was collected at the bus stops of the study route. The questionnaire was prepared in such a way that it records ps from their home to destination including transfers. Global Positioning System (GPS) and Electronic Ticketing Machines (ETM) are provided in all the buses operated in the route and these data were collected for a week. The OD pattern of travelers was taken from the Chennai City Traffic Study (CCTS) of Chennai Metropolitan Development Authority and updated with the ETM and passenger opinion survey data. The in-vehicle travel time of the trips and headway of buses at each bus stop were obtained from GPS data. The headway of the trips alludes the waiting time of the passenger at bus stops. The study route was split up into 16 zones. Accessibility Index (AI) of the each zone was determined using Composite Impedance Gravity measure of Urban Accessibility Index tool of TransCAD. Multinomial Logit Model was chosen for aggregation of the accessibility measures in 2 dimensions viz. Time and Purpose. The AIs of the zones were presented in graphical form to show in which areas the accessibility of the public transportation is to be improved. A model was developed to relate the boarding and alighting of passengers at each bus stop with that of the AIs using Multiple Linear Regression. 1 * Corresponding author. Tel.: +919944359840. E-mail address: [email protected] Available online at www.sciencedirect.com
-
Upload
csregistry -
Category
Documents
-
view
1 -
download
0
Transcript of Estimation of Bus Transport Ridership accounting Accessibility
Procedia - Social and Behavioral Sciences 104 ( 2013 ) 885 – 893
1877-0428 © 2013 The Authors. Published by Elsevier Ltd.Selection and peer-review under responsibility of International Scientific Committee.doi: 10.1016/j.sbspro.2013.11.183
ScienceDirect
2nd Conference of Transportation Research Group of India (2nd CTRG)
Estimation of Bus Transport Ridership Accounting Accessibility S Kalaanidhia
1 & Dr. K Gunasekaranb
aPost Graduate Student, College of Engineering Guindy, Anna University, Chennai 600025, India bAssociate Professor, College of Engineering Guindy, Anna University, Chennai 600025, India
Abstract
Accessibility is defined as a measure of the ease with which an individual can pursue an activity of a desired type, at a desired location, by a desired mode, and at a desired time. It influences the modal choice of a trip maker preferring public transport. Estimation of ridership of a public transport system is to predict the behavioral patterns of individuals and their influence on mode selection. Formulation of a framework for evaluating the accessibility of urban transportation networks and assessing its influence on the ridership of bus transit system is the main focus of the paper. The accessibility measures encompass a range of available opportunities with respect to the attractiveness and travel impedance. In this approach the accessibility measures were considered in geographically aggregated level mainly because of two reasons. One is that this framework is intended for planning decisions which by necessity deals with areas and not with individuals living in it. Another reason is to showcase the methodology of interrelating the accessibility measures and ridership of a transport system. Hence these measures are indispensable to be of plain and easy to understand and work with. The bus route (21G) from Tambaram to Broadway in Chennai city was chosen for this study. It is of 35 km in length. Bus passenger opinion was collected at the bus stops of the study route. The questionnaire was prepared in such a way that it records ps from their home to destination including transfers. Global Positioning System (GPS) and Electronic Ticketing Machines (ETM) are provided in all the buses operated in the route and these data were collected for a week. The OD pattern of travelers was taken from the Chennai City Traffic Study (CCTS) of Chennai Metropolitan Development Authority and updated with the ETM and passenger opinion survey data. The in-vehicle travel time of the trips and headway of buses at each bus stop were obtained from GPS data. The headway of the trips alludes the waiting time of the passenger at bus stops. The study route was split up into 16 zones. Accessibility Index (AI) of the each zone was determined using Composite Impedance Gravity measure of Urban Accessibility Index tool of TransCAD. Multinomial Logit Model was chosen for aggregation of the accessibility measures in 2 dimensions viz. Time and Purpose. The AIs of the zones were presented in graphical form to show in which areas the accessibility of the public transportation is to be improved. A model was developed to relate the boarding and alighting of passengers at each bus stop with that of the AIs using Multiple Linear Regression.
1 * Corresponding author. Tel.: +919944359840. E-mail address: [email protected]
Available online at www.sciencedirect.com
886 S. Kalaanidhi and K. Gunasekaran / Procedia - Social and Behavioral Sciences 104 ( 2013 ) 885 – 893
The various parameters of accessibility measures were determined and specific indices to represent the accessibility level of the transit corridor pertaining to key factors influencing the trip production and attraction are presented. It is demonstrated in the paper that how this approach could be developed into a decision supporting tool to assist in a range of transport and land-use planning activities. The impact on ridership for changes in the Accessibility Indices due to variation in bus transit fare and travel time is reported. © 2013 The Authors. Published by Elsevier Ltd.
Selection and peer-review under responsibility of International Scientific Committee.
Keywords: Accessibility Indices; Ridership Estimation Models; Urban Transit
1. Introduction
Chennai, being the fourth largest Metropolitan City in India, the vehicles constitute one-fourth of the 17.5 million vehicles operated in Tamil Nadu State. There is a strong mismatch arising between the rate of increase of vehicles and rate of growth of road network. The vehicle population explosion of Chennai has slowed down the traffic movement virtually to a snarl on every road during the peak hours. For a city like Chennai, more than 70% of the population should use Public Transport. But it is reported only 32% of population use Public Transport.
Buses are the most preferable mode of Public Transport as they have the greatest flexibility over the road network to cater the need of the passenger demand. The improvement of efficiency in operation of buses is essential in increasing the patronage of buses and also protects the environment by shifting the mobility from personalised vehicles to buses. Patronage to a public transport system is influenced to a large extent by accessibility.
Accessibility can be defined in several ways.
Further definition of accessibilitemployment Bhat defines Accessibility as with which an individual can pursue an activity of a desired type, at a desired location, by a desired mode, and a
Accessibility cannot be quantified as such. Specific indices are required to describe the level of accessibility of an area. Accessibility Index is regarded as the best tool for predicting the ridership of a transportation system. None of the Indian cities have such indices to demonstrate the quality of transportation system. This study concentrates on the influence of the Accessibility Indices over ridership of bus transit system. 2. Background
Development of any city is dependent on efficient operation of urban bus system. Buses are having a widespread reliance for the public transport, providing important mobility within urban area throughout the world. Because of the inefficient operation of city bus services in most of the Indian cities, people prefer to use privately-owned vehicles, which results in congestion, accidents and vehicular pollution (Agarwal P.K. et. al., 2010).
Accessibility consists of four components. Transport component deals with measures such as time, cost and effort of movement in space. Spatial distribution of activities or opportunities is measured by Land-Use
© 2013 The Authors. Published by Elsevier Ltd.Selection and peer-review under responsibility of International Scientific Committee.
887 S. Kalaanidhi and K. Gunasekaran / Procedia - Social and Behavioral Sciences 104 ( 2013 ) 885 – 893
component. Activity/opportunity available to the users according to the time of the day is investigated by Temporal component. The Individual component examines the needs, abilities, and opportunities of users (Curtis & Scheurer, 2007). The temporal accessibility can be determined when the consideration is given for the
. The most accurate way to measure accessibility is accounting the perceived distances (Bhat et al., 2002). The importance of Accessibility Indices is to indicate the transport corridors where the greatest priority and potential are required for improving equity in transport opportunities for users. The actions, such as improved bus priority and varying fare levels, parking charges, and other user chargesthe use of the Accessibility Indices to illustrate the impacts. It also helps in focusing on detailed modal shift analysis aimed at reshaping the transport system in a sustainable manner (Schoon et al., 2002). Improvement of the current service to support the current potential ridership and determination of the impact on the transit system when adding new service areas can be helped by the demand estimation (LaMondia & Bhat, 2009). Transit service reliability improvement has significant impact on the demand than the realignment and relocation of bus stops (El-Geneidy & Kimpel, 2004). Hence it is planned to develop Accessibility Indices for a route in Chennai city to demonstrate its impact on ridership.
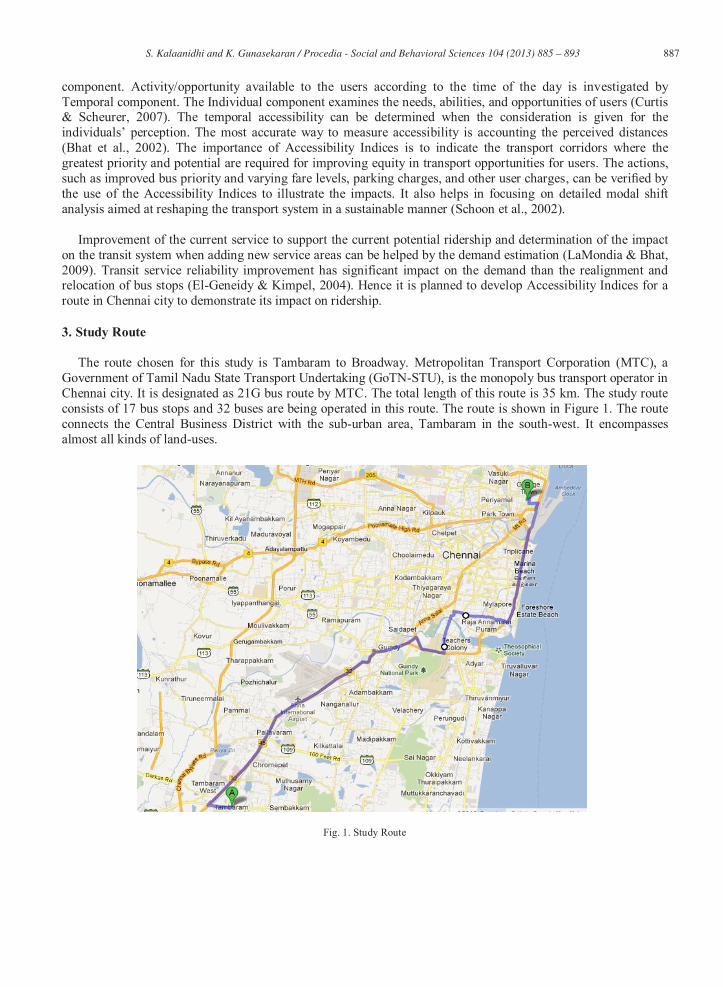
3. Study Route The route chosen for this study is Tambaram to Broadway. Metropolitan Transport Corporation (MTC), a Government of Tamil Nadu State Transport Undertaking (GoTN-STU), is the monopoly bus transport operator in Chennai city. It is designated as 21G bus route by MTC. The total length of this route is 35 km. The study route consists of 17 bus stops and 32 buses are being operated in this route. The route is shown in Figure 1. The route connects the Central Business District with the sub-urban area, Tambaram in the south-west. It encompasses almost all kinds of land-uses.
Fig. 1. Study Route

888 S. Kalaanidhi and K. Gunasekaran / Procedia - Social and Behavioral Sciences 104 ( 2013 ) 885 – 893
4. Data Collection
The data collection for determination of Accessibility Indices and development of ridership estimation modelsare as follows.
The Population data and Socio-Economic data of zones, as of 2011, were obtained from Tamil Nadu Censusdepartment and projected to the year 2013, considering the prevailing growth rate of population. The data onbasic employment, service employment and retail employment for each zone was extracted from the Tamil Nadu Census data. Electronic Ticketing Machine (ETM) and Global Positioning System (GPS) Data of the 21G routebuses were obtained from MTC, Chennai for a week in March 2013. Passenger Interview was conducted at allthe bus stops of the study stretch. Questionnaire was prepared in such a way to record their perception of accessibility parameters of their trips such as waiting time at the bus stops, time taken & cost incurred to reachthe boarding bus stop from origin and time taken & cost incurred to reach the destination from the alighting busstop. Nearly 7% of the total bus passengers traveling along the route were interviewed.
Origin Destination pattern of the bus passengers weTraffic and Transportation Study (CTTS) of Chennai Metropolitan Development Authority (CMDA). The data was collected in the year 2007. It was projected to the year 2013 by accounting the increase in population (8%) and trip rate (2.4%). Eventually the origin destination data for the interested study zones were updated with ETM data and Passenger Interview survey.
5. Development of Accessibility Indices
The process of determination of accessibility measures involves the selection of accessibility measure amongthe variety of available measures such as Cumulative measure, Gaussian Gravity measure, Composite ImpedanceGravity measure, Distance Impedance Gravity measure and In-Vehicle Travel Time Gravity measure. Asrecommended by Bhat (2002), the Composite Impedance Gravity measure is found to be designed specifically tounderstand the effectiveness of In-Vehicle Travel Time (IVTT), Off-ff Vehicle Travel Time (OVTT) the stops and cost of parking, if any. The Accessibility of each zone can be determined using the equation (1).
(1)
Where,J = Total number of zones in the areaOjO = Activity in the Zone jCij = Composite Impedance (equivalent auto in-vehicle time units)
= IVTTauto auto parking
This can also be aggregated in any combination of four different dimensions such as Spatial aggregation,Intermodal aggregation, Trip purpose and Time of the day using Multinomial Logit Model.
(2)

889 S. Kalaanidhi and K. Gunasekaran / Procedia - Social and Behavioral Sciences 104 ( 2013 ) 885 – 893
Where, Z1 = Zone 1; M1 = Mode 1; T1 = Time 1; P1 = Purpose 1; OP1,j = Attraction for purpose P1 in Zone j; C1,j,T1 = Impedance for zone 1 to zone j for the time 1. Accessibility Indices were determined using Urban Accessibility Index tool, developed by Centre for Transportation Research, University of Texas, Austin. This process begins with the preparation of impedance matrix and attraction table. Impedance matrix encompasses the in-vehicle travel time & cost and off-vehicle travel time & cost for the different times of the day. The in-vehicle travel time and cost are the time taken to travel between any origin and destination pairs and the respective cost incurred. These details were obtained from the ETM and GPS data. Similarly off-vehicle travel time is the waiting time at the bus stops and time taken to reach the stop from their origin/destination and vice versa. The corresponding cost is denoted as off-vehicle travel cost. Attraction table represents the basic employment, service employment and retail employment of the study zones. The determined Accessibility Indices are presented in Table 1. Table 1. Accessibility Indices of the Study Zones
This method possesses the advantage of incorporating the temporal accessibility by obtaining the perspective values of time and cost of passengers. With a map representing the zones of Chennai, the Accessibility Indices can be well represented in a graphical form as shown in Figure 2 (a).
It was attempted to showcase the methodology by applying it to a single major transit route of Chennai. Alternatively, the range of application of these Indices is narrow and this methodology needs to be carried out to all the zones of Chennai in order to achieve a wider range of application.
Due to limited data availability, assumptions were made to develop the accessibility map for Chennai city (Figure 2 (b)). The assumptions are the travel time within the Central Business District (CBD) is 30 Kmph and beyond CBD is 45 Kmph, the accessible distance of the bus stops are relatively lesser for the zones within CBD than that of those of beyond CBD and the waiting time of the buses at the CBD zones varies between 5 to 10 minutes whereas that of zones beyond CBD varies between 10 to 20 minutes. The zones with red colours in the
Sl No Zone Name Accessibility Index Sl No Zone Name Accessibility Index
1 Kachaleeswarar Nagar 4.99145 9 Avvai Nagar South 5.65022
2 Vallal Seethakadhi Nagar 5.25179 10 GD Naidu Nagar West 5.61758
3 Chepauk 5.37138 11 Guindy West 5.31199
4 Krishnampet 5.59439 12 Alandur 5.09139
5 Bharathidhasan Nagar 5.61345 13 Issa Pallavaram 4.85551
6 Madavaperumalpuram 5.45142 14 Zamin Pallavaram 4.83844
7 Avvai Nagar North 5.33272 15 Chrompet 4.68313
8 Beemannapettai 5.46587 16 Tambaram 4.51169

890 S. Kalaanidhi and K. Gunasekaran / Procedia - Social and Behavioral Sciences 104 ( 2013 ) 885 – 893
map have relatively high accessibility and those with blue have relatively less accessibility. It is very easy withthis map to prioritize the zones for improving accessibility.
6. Development of Ridership Estimation Models
The ridership estimation models were developed separately for both boarding and alighting of the zones using Multiple Linear Regression. Trip produced in the zone and to travel by bus transport is considered here asboarding, which depends on the accessibility to the bus stop from the point the person starts the trip. Whereastrips attracted to the zone by bus considered as alighting is also influenced by the accessibility he/she has to reachhis/her final destination from the bus stop he/she alights. Of the 16 zones, 85% of the zones were taken for model development and validated for remaining 15%, since the sample size is less.
6.1. Ridership Estimation Model for Boarding
Boarding estimation model for bus transit was developed, considering the boarding of the zones as dependent variable and population of the zones and Accessibility Indices as independent variables. Developed model is,
Boarding per day = (0.42 * Population)n + (0.386 * Accessibility Index)x + 2.079 (3)
Fig. 2. (a) Accessibility Indices for the Traffic Analysis Zones in the Study Corridor; (b) Accessibility Indices for the Traffic Analysis Zonesin Chennai city.

891 S. Kalaanidhi and K. Gunasekaran / Procedia - Social and Behavioral Sciences 104 ( 2013 ) 885 – 893
6.2. Ridership Estimation Model for Alighting
Similar to the boarding estimation model, alighting estimation model for bus transit was also developed. Thedependent variable is number of passengers alighting at the zones. The developed model is,
Alighting per day = (0.288 * Population)n + (0.405 * Accessibility Index) + 1x .071 (4)
6.3. Model Validation
The models were checked for statistical significance. Besides, the models were validated with the 15% of thezones in the study corridor. It was found that the model for boarding estimation is having 78% accuracy and alighting estimation model is having 84% accuracy. The R2 values of these models were 0.91 and 0.96respectively.
7. Analysis
The Analysis was carried out to quantify the impact of accessibility components such as waiting time & off-ffvehicle cost over the Accessibility Indices and their corresponding impact on ridership. By varying the waiting time of the passengers at the bus stops, the changes in the Accessibility Indices of the zones were estimated. The impacts on waiting time (Figure 3) and off-ff vehicle cost over the Accessibility Indices were determined.
Fig 3. Percentage variation of Accessibility Indices over the change of Waiting Time
This analysis also demonstrates the impact of changes in Accessibility Indices over the boarding and alighting of the Traffic Analysis Zones in the study route. The percentage variations of boarding and alighting due to the changes in Accessibility Indices are illustrated in Figure 5 and Figure 6.
It was inferred from the sensitivity analysis that the waiting time at the bus stops has relatively greater impacton Accessibility Indices than off-ff vehicle travel cost. For the reduction of waiting time of the passengers at bus

892 S. Kalaanidhi and K. Gunasekaran / Procedia - Social and Behavioral Sciences 104 ( 2013 ) 885 – 893
stops, the Accessibility Indices are increased by the range of 1% to 7%. Similarly for the increase in waiting time,0.2% to 5% reduction in Accessibility Indices is observed.
It was also observed that the change of waiting time at bus stops would affect the boarding and alighting of each zone. It is evident from the analysis that for the variation of Accessibility Indices, the boarding counts of zones are varying in the range from 1.2% to 5.3%. Similarly the alighting counts of zones are varying from 1% to5.5%. This dissimilar variation in boarding and alighting of a zone is reported as the effect of the temporalaccessibility of that zone. This reflects that the service changes during an hour have a say on the temporalaccessibility.
Fig. 4. Variation of Boarding Count due to Changes in Accessibility Indices
Fig. 5. Variation of Alighting count due to the changes in Accessibility Indices

893 S. Kalaanidhi and K. Gunasekaran / Procedia - Social and Behavioral Sciences 104 ( 2013 ) 885 – 893
8. Results & Conclusions This paper demonstrates the use of Accessibility Indices which can assist in evaluating the transit facilities provided in many urban areas. Since the Accessibility Indices were determined based on a single route, in this study, they have several limitations such as the inability of the ridership model to precisely estimate the ridership of the zones. Also, it is to be noted that these indices are relative to each other. There are no limiting values for these indices. The analysis made it clear that the temporal accessibility of the zones affect number of passengers boarding and alighting at those zones. Also it is recognized that the operational efficiency of services has an impact over the temporal accessibility of the zone.
It is suggested that such methodology has to be applied for all the zones in the study area to obtain more reliable and readily applicable models. Also, it could help in efficient bus operation as the variation in ridership for the service changes could be predicted.
NOTE The research sponsoring organisation and the authors do not endorse any proprietary products or technologies
mentioned in this paper. These appear herein only because they are considered essential to the objective of the this paper.
Acknowledgment The Authors would like to thank Centre of Excellence in Urban Transport, IITM, Chennai, for their financial
the Division of Transportation Engineering, College of Engineering Guindy, Anna University, Chennai. Also, the authors would like to extend their sincere thanks to Metropolitan Transport Corporation, Chennai for providing Electronic Ticketing Machine & Global Positioning System data. Without the word of thanks to Centre for Transportation Research of University of Texas, Austin for providing the Urban Accessibility Index add-in, the acknowledgement would be incomplete. References Agarwal P.K., Singh A.P., Performance Improvement of Urban Bus System: Issues and Solution, International Journal of Engineering Science and Technology, Vol. 2(9), 2010, 4759-4766. Schoon J. G., McDonald M. and Lee A. (2002), Accessibility Indices Pilot Study and Potential Use in Strategic Planning, Transport Research Record, Paper No. 99-0606. Bhat C., Handy S., Kockelman K., Mahmassani H., Gopal A., Srour I. and Weston L. (2002), Development of an Urban Accessibility Index: Formulations, Aggregations and Applications, Centre for Transportation Research, The University of Texas, Austin, Report No. FHWA/TX-02-4938-4. LaMondia J. and Bhat C. (2009), Development of a Para-transit Microsimulation Patron Accessibility Analysis Tool for Small and Medium Sized Communities, Transport Research Board, Paper No. 10-1793. El-Geneidy A. M. and Kimpel T. J. (2004), Understanding the Demand for Bus Transit Service: A New Approach, Portland State University, Center for Urban Studies, Portland, Oregon. Jan Scheurer and Carey Curtis (2007), Accessibility Measures: Overview and Practical Applications, Department of Urban and Regional Planning, Curtin University.