Bus Network Design Problem
124
BUS NETWORK DESIGN PROBLEM: A REVIEW OF APPROACHES AND SOLUTIONS DUARTE NUNO SOUSA FERREIRA Dissertação submetida para satisfação parcial dos requisitos do grau de MESTRE EM ENGENHARIA CIVIL — ESPECIALIZAÇÃO EM PLANEAMENTO Orientador: Professor Doutor Álvaro Fernando de Oliveira Costa SETEMBRO DE 2020
-
Upload
khangminh22 -
Category
Documents
-
view
0 -
download
0
Transcript of Bus Network Design Problem

BUS NETWORK DESIGN PROBLEM: A REVIEW OF APPROACHES AND
SOLUTIONS
DUARTE NUNO SOUSA FERREIRA
Dissertação submetida para satisfação parcial dos requisitos do grau de
MESTRE EM ENGENHARIA CIVIL — ESPECIALIZAÇÃO EM PLANEAMENTO
Orientador: Professor Doutor Álvaro Fernando de Oliveira Costa
SETEMBRO DE 2020


Bus Network Design Problem: a review of approaches and solutions
i
MESTRADO INTEGRADO EM ENGENHARIA CIVIL 2019/2020
DEPARTAMENTO DE ENGENHARIA CIVIL
Tel. +351-22-508 1901
Fax +351-22-508 1446
Editado por
FACULDADE DE ENGENHARIA DA UNIVERSIDADE DO PORTO
Rua Dr. Roberto Frias
4200-465 PORTO
Portugal
Tel. +351-22-508 1400
Fax +351-22-508 1440
http://www.fe.up.pt
Reproduções parciais deste documento serão autorizadas na condição que seja mencionado
o Autor e feita referência a Mestrado Integrado em Engenharia Civil - 2019/2020 - Departa-
mento de Engenharia Civil, Faculdade de Engenharia da Universidade do Porto, Porto, Por-
tugal, 2020.
As opiniões e informações incluídas neste documento representam unicamente o ponto de vista do
respetivo Autor, não podendo o Editor aceitar qualquer responsabilidade legal ou outra em relação a
erros ou omissões que possam existir.
Este documento foi produzido a partir de versão eletrónica fornecida pelo respetivo Autor.

Bus Network Design Problem: a review of approaches and solutions
ii
Ao meu Pai, que me ensinou a perguntar;
À minha Mãe, que me ensinou a responder.

Bus Network Design Problem: a review of approaches and solutions
iii

Bus Network Design Problem: a review of approaches and solutions
iv
AGRADECIMENTOS
Neste percurso aprendi que uma tese é um caminho solitário mas impossível de caminhar sozinho. Esta,
em particular, aconteceu num momento insólito, em confinamento durante uma pandemia global, onde
a amizade continuou à distância e o apoio se tornou ainda mais imprescindível. Estes agradecimentos,
embora curtos, são ainda mais sentidos nestes tempos difíceis.
Ao Professor Álvaro Costa, por dar a ideia, o mote e a motivação para este estudo; pelo apoio e dispo-
nibilidade, e pelas lições que, em pessoa ou à distância, tanto me ensinaram e confirmaram a minha
dedicação ao estudo dos transportes.
À minha mãe, cujo contributo e orientação neste percurso foram inestimáveis, os agradecimentos que
possa aqui deixar serão sempre escassos, restando apenas um sincero obrigado.
À minha namorada, pelo inabalável otimismo e inesgotável paciência, por ser uma âncora de sensatez e
pela ajuda da primeira à (literal) última palavra.
Ao meu pai, aos meus avós, às minhas tias, e a toda a minha família, a quem devo quem sou e o que de
bom tenho, agradeço a presença, a preocupação e o apoio incansável.
Numa nota final, estes agradecimentos não se restringem apenas a esta tese mas também a todo o meu
pouco ortodoxo percurso académico, da FAUP até à FEUP, e não esquecendo a ShARE-UP. Agradeço
a todos os Professores com quem tive o privilégio de aprender e aos meus colegas que comigo partilha-
ram momentos de frustração e de vitória em igual medida. Agradeço a todas as pessoas que comigo
construíram este percurso, e espero que as marcas positivas que deixaram em mim tenham sido corres-
pondidas.

Bus Network Design Problem: a review of approaches and solutions
v

Bus Network Design Problem: a review of approaches and solutions
vi
RESUMO
Os crescentes problemas do congestionamento e da sustentabilidade dos transportes em ambiente urbano
causam impactes negativos significativos nas cidades em todo o mundo. As redes de transporte público
têm um papel fundamental na mitigação destes problemas, ao permitirem uma mobilidade urbana mais
eficiente e com menores impactes na sociedade e no ambiente. As redes de autocarro em particular são
essenciais em muitos sistemas de transportes pelo mundo, e o seu planeamento adequado pode ajudar a
melhorar a sua eficiência e qualidade, o que, por sua vez, contribui para o objetivo de reduzir o conges-
tionamento e as emissões. O seu processo de planeamento é, no entanto, bastante complexo, e um grande
número de investigadores e profissionais têm, nas últimas décadas, dedicado os seus esforços a encontrar
melhores soluções. O presente estudo focou-se no ponto de vista da investigação, e o objetivo principal
foi o de rever e analisar as abordagens e soluções presentes na literatura existente.
A proposição de efetuar uma revisão de literatura compreensiva deste assunto não é nova, pois outros
autores haviam já publicado estudos semelhantes. No entanto, através da comparação das suas estrutu-
ras, metodologias de análise e da literatura selecionada por cada um foram encontradas algumas discre-
pâncias, que por sua vez informaram e motivaram o presente estudo.
Para este efeito, aplicou-se uma metodologia de revisão de literatura semi-sistemática. O método se-
guido consistiu, em primeiro lugar, da definição da problemática de investigação, que foi seguida pela
definição da estratégia para a coleção e classificação da literatura. Os artigos selecionados foram orga-
nizados numa matriz de revisão, onde foi resumida e escrita a informação principal relativa aos parâme-
tros definidos (objetivos, restrições, variáveis de decisão, tipo de aplicação e tipo de problema). Esta
informação em texto foi posteriormente categorizada, permitindo um tratamento quantitativo das carac-
terísticas principais de cada artigo. Efetuou-se também uma análise descritiva de cada um destes parâ-
metros.
Esta revisão de literatura resultou numa quantidade considerável de informação relativa à temática em
análise, que foi organizada e apresentada de uma forma que poderá informar estudos futuros e responder
a várias questões além das que foram inicialmente consideradas. A análise efetuada indicou que uma
maioria dos artigos revistos está mais orientada para considerações teóricas do que para aplicações prá-
ticas.
PALAVRAS-CHAVE: transporte público, autocarro, desenho de redes de transporte público, desenho de
redes de autocarro, revisão de literatura.

Bus Network Design Problem: a review of approaches and solutions
vii

Bus Network Design Problem: a review of approaches and solutions
viii
ABSTRACT
The growing issues of congestion and sustainability of transportation in cities cause negative conse-
quences for urban communities worldwide. Public transit networks play a key role in the mitigation of
these problems, as they allow for more efficient mobility that produces less impacts on society and on
the environment. In particular, bus networks form the backbone of many transit systems around the
world; good planning of these networks can improve their quality and efficiency, which in turn can help
achieve the goals of reducing congestion and emissions. The process of planning these networks is,
however, very complex, and many researchers and practitioners have tackled this problem in the last
decades. The present work was then focused on the existing literature on the subject from the point of
view of research, and the main objective was to review and analyse the approaches and solutions that
have been published.
The proposition of a literature review on this subject was not new, as previous authors had already
published similar works. However, some discrepancies were identified among them, as their structures,
methodologies of analysis, and selected literature were summarised and compared. This work intended
to bridge these identified gaps and perform a more comprehensive literature review.
For this goal, a semi-systematic literature review methodology was applied. This methodology consisted
firstly of the definition of the research problem, followed by the definition of a strategy for the collection
and classification of literature. The selected literature was organised in a review matrix, where the in-
formation regarding defined parameters (objectives, constraints, decision variables, application type,
and problem type) was summarised and written. The text in this matrix was then categorised, which
allowed for a quantitative perspective on the main characteristics of each article. This also enabled a
descriptive analysis of the parameters.
This literature review resulted in a large amount of information on the subject, which was organised and
presented in a way that may inform future studies and answer further questions on the problem. The
analysis performed (specifically on the application cases) indicated however that a majority of the re-
viewed studies were oriented towards theoretical considerations and not towards practical solutions.
KEYWORDS: public transit, bus, transit network design, bus network design, literature review.

Bus Network Design Problem: a review of approaches and solutions
ix

Bus Network Design Problem: a review of approaches and solutions
x
TABLE OF CONTENTS
AGRADECIMENTOS .................................................................................................................. iv
RESUMO ................................................................................................................................. vi
ABSTRACT ............................................................................................................................ viii
1 INTRODUCTION ................................................................................................... 1
1.1. FRAMEWORK ............................................................................................................ 1
1.1.1. CONTEXTUALISATION .................................................................................................... 1
1.1.2. CONCEPTUAL FRAMEWORK ............................................................................................ 4
1.2. OBJECTIVES ............................................................................................................. 6
1.3. STRUCTURE .............................................................................................................. 6
2 ANALYSIS OF EXISTING LITERATURE ................................................. 7
2.1. PREVIOUS LITERATURE REVIEWS ................................................................................ 7
2.1.1. GUIHAIRE & HAO (2008) ................................................................................................ 8
2.1.2. KEPAPTSOGLOU & KARLAFTIS (2009) ............................................................................... 9
2.1.3. FARAHANI ET AL. (2013) .............................................................................................. 11
2.1.4. IBARRA-ROJAS ET AL. (2015) ........................................................................................ 13
2.2. CRITICAL ANALYSIS ................................................................................................. 15
2.2.1. SCOPE AND STRUCTURE COMPARISON ............................................................................ 15
2.2.2. METHODOLOGY COMPARISON ....................................................................................... 17
2.2.3. DATABASE COMPARISON .............................................................................................. 18
3 METHODOLOGY ............................................................................................... 21
3.1. SELECTING A METHODOLOGICAL APPROACH ............................................................ 21
3.2. COLLECTION OF LITERATURE ................................................................................... 24
3.2.1. SEARCH METHODOLOGY .............................................................................................. 24
3.2.2. INCLUSION AND EXCLUSION .......................................................................................... 25
3.3. REVIEW MATRIX AND ANALYSIS METHODOLOGY ........................................................ 29
3.3.1. INITIAL REVIEW MATRIX ................................................................................................ 29
3.3.2. EVOLUTION OF REVIEW MATRIX ..................................................................................... 31
3.3.3. FINAL PARAMETERS AND DEFINITIONS ............................................................................. 31

Bus Network Design Problem: a review of approaches and solutions
xi
4 RESULTS AND ANALYSIS ....................................................................... 41
4.1. ANALYSIS OF THE FINAL REVIEW MATRIX .................................................................. 41
4.2. DESCRIPTIVE ANALYSIS OF RESULTS ........................................................................ 41
4.2.1. CHRONOLOGICAL ANALYSIS .......................................................................................... 42
4.2.2. APPLICATION TYPE ANALYSIS ........................................................................................ 42
4.2.3. PROBLEM CATEGORY ANALYSIS ..................................................................................... 44
4.2.4. OBJECTIVE FUNCTION ANALYSIS .................................................................................... 47
4.2.5. CONSTRAINTS ANALYSIS .............................................................................................. 49
4.2.6. DECISION VARIABLES ANALYSIS ..................................................................................... 52
5 CONCLUSIONS .................................................................................................. 55
BIBLIOGRAPHY ..................................................................................................... 59
APPENDIX A ............................................................................................................. 72
APPENDIX B ............................................................................................................. 95

Bus Network Design Problem: a review of approaches and solutions
xii
FIGURES INDEX
Figure 1 – Bus network planning process ............................................................................................... 4
Figure 2 - Proposed structure of the TNDSP .......................................................................................... 9
Figure 3 - Proposed hierarchy of the TRNDP ....................................................................................... 11
Figure 4 - Excerpt from the RNDP review matrix .................................................................................. 12
Figure 5 - Proposed model for TNP ...................................................................................................... 14
Figure 6 - Comparison of models adopted by each author ................................................................... 16
Figure 7 - Exclusive and non-exclusive articles for each review ........................................................... 19
Figure 8 - Overall exclusive and non-exclusive articles ........................................................................ 19
Figure 9 - Articles in common between pairs of reviews ....................................................................... 20
Figure 10 - Structure of the proposed literature review process ........................................................... 23
Figure 11 - Keyword definition for the literature search ........................................................................ 25
Figure 12 - Summary of inclusion and exclusion criteria for the review ................................................ 26
Figure 13 - Proposed structure for the analysis and the review matrix ................................................. 40
Figure 14 - Number of selected articles by year of publication ............................................................. 42
Figure 15 - Selected articles by application type ................................................................................... 43
Figure 16 - Selected articles by problem category ................................................................................ 44
Figure 17 - Problem category combinations (non-zero) ........................................................................ 45
Figure 18 - Problem category combinations by application type .......................................................... 47
Figure 19 - Selected articles by objective function ................................................................................ 47
Figure 20 - User focused objectives divided by application type .......................................................... 48
Figure 21 - Operator focused objectives divided by application type .................................................... 48
Figure 22 - Selected articles by constraints .......................................................................................... 50
Figure 23 - Selected articles by constraint category ............................................................................. 50
Figure 24 - Demand constraints divided by application type ................................................................ 51
Figure 25 - Fleet constraints divided by application type ...................................................................... 51
Figure 26 - Network constraints divided by application type ................................................................. 51
Figure 27 - Budget constraints divided by application type ................................................................... 52
Figure 28 - Other constraints divided by application type ..................................................................... 52
Figure 29 - Selected articles by decision variables ............................................................................... 53
Figure 30 - Decision variables divided by application type ................................................................... 54

Bus Network Design Problem: a review of approaches and solutions
xiii

Bus Network Design Problem: a review of approaches and solutions
xiv
TABLES INDEX
Table 1 – Parameters analysed by the previous authors in their review matrices ................................ 17
Table 2 – Articles not included due to lack of access to full document ................................................. 27
Table 3 – Articles excluded from final review ........................................................................................ 28
Table 4 – Comparison of the adopted parameters for the revew matrix with previous authors ........... 30
Table 5 - Definition of the application type classification ...................................................................... 33
Table 6 - Definitions of objective function categories ............................................................................ 34
Table 7 - Definitions of constraint categories ........................................................................................ 36
Table 8 - Definitions of decision variable categories ............................................................................. 38
Table 9 - Results of all possible combinations of problem categories. ................................................. 45

Bus Network Design Problem: a review of approaches and solutions
xv

Bus Network Design Problem: a review of approaches and solutions
xvi
ABBREVIATIONS AND SYMBOLS
BNDP – Bus Network Design Problem
CNDP - Continuous Network Design Problem
CNDP-T - Continuous Network Design Problem (time-dependent)
DNDP - Discrete Network Design Problem
DNDP-T - Discrete Network Design Problem (time-dependent)
DRP - Driver Rostering Problem
DSP - Driver Scheduling Problem
FS - Frequency Setting
MMNDP - Multi-modal Network Design Problem
MNDP - Mixed Network Design Problem
MNDP-T - Mixed Network Design Problem (time-dependent)
RNDP - Road Network Design Problem
TND - Transit Network Design
TNDFSP – Transit Network Design and Frequencies Setting Problem
TNDP - Transit Network Design Problem
TNDP – Transit Network Design Problem
TNDSP - Transit Network Design and Scheduling Problem
TNFSP - Transit Network Frequencies Setting Problem
TNSP - Transit Network Scheduling Problem
TNT - Transit Network Timetabling
TNTP - Transit Network Timetabling Problem
TRNDP - Transit Route Network Design Problem
UTNDP - Urban Transportation Design Problem
VSP - Vehicle Scheduling Problem

Bus Network Design Problem: a review of approaches and solutions
1
1 INTRODUCTION
1.1. FRAMEWORK
The focus of this study is, as stated in the title, the design and optimisation of transit1 networks, and
specifically bus networks. This contextualisation of the study intends, in the first place, to justify the
continued relevance of planning for quality and efficiency of these networks, which are the aims of the
studies considered in this review. It also presents the basis for the conceptual framework through which
the analysis of the study is developed.
1.1.1. CONTEXTUALISATION
The current issues of urban mobility and congestion have been widely discussed and studied, and still
they are very relevant topics that gather interest for research. In the context of the threat of climate
change (and the urgent need for more sustainable mobility solutions) and rapid urbanisation (accompa-
nied by the growth of motorisation rates and the social cost of congestion), contributions towards better
and more efficient transportation are very pertinent.
In the Global North (or developed countries), although many transit networks have already been well
established since the 19th century, car use is still dominant. In the decades following the Second World
War, the planning of transportation systems was focused on the provision of infrastructure to accommo-
date expected automobile demand, which has led to a well-studied vicious cycle of induced demand
(Razak, 2013). Although in recent years priorities have shifted, private cars are still the dominant mode
of passenger transportation; even though motorisation rates have been stagnating in Europe and North
America, the majority of trips are still made by private car (Buehler, Pucher, Gerike, & Götschi, 2017).
This sustained dominance of cars is even more worrying in the Global South (or developing world),
where the rapid population growth trend of the last decades is being followed by large-scale urbanisation
and economic growth. These trends are creating challenges for cities, as there is a correlation between
economic and population growth and motorisation rates. In countries like China or India, this means
that a huge number of new cars is entering the roads each year, which is certainly leading these regions
into unsustainable situations – both in terms of congestion and emissions (Dargay, Gately, & Sommer,
2007). Although there are already (sometimes informal) transit networks in many large low-income
metropolitan areas, they are frequently of poor quality and suffer greatly from congestion and poor
1 In this study, the term transit is used to refer to public transportation for passengers. Although there are many
variants, such as mass transit, public transportation, or public transport (each of them having regional connota-
tions), the term transit will be used here for the sake of brevity.

Bus Network Design Problem: a review of approaches and solutions
2
infrastructure (Wijaya & Imran, 2019). These considerations highlight the persisting nature of these
issues and the relevance of new approaches that are aimed at tackling them.
There are two main alternative approaches to address these issues from the point of view of transit, that
however converge on their goal: to shift the focus of mobility from cars and into more sustainable modes.
Many planners and engineers focus on the demand side of the equation, developing policies and mech-
anisms that influence the decisions of travellers towards more sustainable and cost-effective solutions.
Others focus mainly on the supply side, through the planning of transit networks that are able to meet
the existing demand and provide quality services (Meyer, 2016). The present study focuses exclusively
on the latter, with the main object of study being the methodologies and processes that aim to design or
improve bus networks.
Busses are, when compared to other modes of transit, cheaper and more flexible, especially when com-
pared to rail-based transit systems (which require much larger investments) (Button, Vega, & Nijkamp,
2010). Thus, they are the main mode of transit in many cities around the world (even in huge metropo-
lises), forming the backbone of mobility for millions around the world (Loh & Xiang, 2014).
There is still, however, the question if the design of quality bus networks can play an important role in
the mitigation of these problems. Although this is not the main focus of the present study, there have
been previous studies that indicate that this approach may play an important role in this mitigation.
Beirão and Sarsfield Cabral (2007) performed a study on comparisons between attitudes towards both
cars and buses, and concluded that, even though there is a perception of personal vehicles as being the
better mobility option, the improvement of several key parameters of bus transit supply can indeed help
shift the modal choices. Although they, as Parkany, Gallagher, and Viveiros (2004), consider that the
potential attitudes of passengers towards transit as a whole play an important role in modal choice, the
perception of the quality of existing bus transit systems – namely, of qualities like short travel times and
reliable service – is a key component of this choice. The results of this study also showed a preference
towards frequent and direct service, with a further emphasis on comfort (avoiding crowding and having
an available seat).
The question that follows the previous considerations is, naturally, how to actually plan a quality bus
network. A definitive answer to this question is certainly larger than the present thesis (and perhaps
impossible), but for decades planners have worked towards it in practical applications. Transit networks
are ubiquitous worldwide, and decades of practice in designing and improving them have produced
ample evidence of both successes and failures; this has often resulted in the publication of practical
guidelines and “rules” that are intended to guide this process, establishing measures of good practice in
this field. Some examples that were found in a quick survey include the report published by Transport
for London (2012), where goals and directives are established regarding stop location, service frequency,
reliability, and cost, or the report by Florida Department of Transportation Research Center (2009)
where similar measures of quality networks are derived from observation. Ceder (2007) argues that these
guidelines and service standards are widely used by transit agencies in the planning process, stating that
more than half of the agencies in the United States and Europe applied them. The author also argues that
these fixed guidelines are mostly outdated, and that there is much room for improvement both in the
guidelines themselves and for innovative approaches to the process.
Another approach to solve the question of how to effectively plan a bus network has been studied from
the perspective of operations research. As previously stated, this subject has gathered much attention
from research since the 1960s, as a large amount of literature has been published that is aimed at solving
it as a mathematical optimisation problem. This approach is aimed at designing an optimal system that
maximises or minimises a number of pre-established objectives. However, from a computational point

Bus Network Design Problem: a review of approaches and solutions
3
of view, this is a very complex problem, with some authors even classifying individual sub-problems of
the overall process as NP-Hard (Guihaire & Hao, 2008). Thus, a wide variety of solutions have been
proposed, with varying degrees of simplification of the “moving parts” of the problem and with accord-
ing methodological sophistication. These solutions have also been accompanied by an evolution of in-
formation technology that has further enabled their application, as computer processing power has be-
come widely available and cheap. At the same time, the technology on the vehicles themselves has
evolved, as the collection of data on the network becomes easier and the data itself is richer and more
detailed. This has opened opportunities for the development of computer aids for the planning process,
as well as the automation of several tasks that may be done through algorithms; it has also enabled the
development of more complex and sophisticated methods in research, which may be more computational
power-heavy.
The current study focuses on this approach, as its title indicates; the main focus is to appraise the existing
approaches from research that apply an optimization perspective to the problem of designing and im-
proving bus networks. But another question that has motivated this study is whether there is a gap be-
tween these two approaches. The hypothesis is that there is a disconnection between the solutions that
are proposed by researchers and the actual needs of planners, as many studies appear to be oriented
towards theoretical advances in computation instead of better solutions that can be applied in practice.
The present study does not intend to answer this question fully, as it only focuses on one side of the
equation, but it may help to shed some light on the shortcomings of past and current academic efforts to
provide solutions to the problem of designing good bus networks.
Another important distinction lies between two of the main entities that shape the problem: the user and
the operator. The definition of the objectives for the optimisation is necessary for the development of
models and methods, and there is a consensus that the BNDP is inherently multi-objective because of
this distinction. The users can be defined as the passengers of the network and are the reason the network
exists in the first place – they create the demand for travel. As previously discussed in this chapter, users
generally desire fast, frequent, and comfortable service that goes where they want to go, and the objec-
tive of satisfying the user’s needs is important to achieve quality networks.
Bus networks exist in many forms and organisational paradigms, with varying degrees of involvement
of both public and private entities in its planning and operation. Thus, the definition of operator might
not be straightforward, as the amount of regulation and privatisation that exist in different locations
influences the scope of its role. Nonetheless, it makes economic sense to consider that these entities
converge on the common objective of minimising costs for running the network, whether from a per-
spective of reduction in public spending or, in the case of private companies, profit maximisation. These
objectives are important for the viability of the network and its sustainability and are reflected in a
rational distribution of resources and adequate service for the existing demand.
At a first glance, it may seem that these objectives are contradictory, as a user-focused increase of the
quality of service can be incompatible with the reduction of operator costs. This apparent trade-off is
very relevant in the definition of optimisation models, and different authors appear to have different
approaches to how they achieve balance between both sides; some focus more on increasing network
quality while others are more directed at cost reduction and network rationalisation. It is then a relevant
objective for this work to understand what objectives are dominant and how the authors balance them.

Bus Network Design Problem: a review of approaches and solutions
4
1.1.2. CONCEPTUAL FRAMEWORK
This thesis intends to contribute towards the understanding and systematization of previous approaches,
and for that goal it is helpful to provide a short overview of the problem’s framework as defined by
previous authors. Previously published literature reviews have also discussed this framework, as will be
detailed further in Chapter 2, but it is relevant to present the main concepts that define the problem in
broader strokes as a basis for further analysis.
One of the earliest formal structures proposed for the Bus Network Design Problem (BNDP) was pub-
lished by Ceder and Wilson (1986). This was a landmark paper, as the structure proposed by the authors
(presented in Figure 1, which is directly adapted from the original) has been widely cited throughout the
years. The planning process is divided into five planning activities: network design, frequency setting,
timetable development, bus scheduling, and driver scheduling. For each of these levels, the authors
identify the inputs and outputs that they require, noting that the result of each step is a necessary input
for the next step but it is also retroactively relevant, i.e., the results of further steps can influence previous
ones. This amounts to an almost iterative process, where in order to obtain near-optimal results these
steps should be repeated including the previous results. The authors also argue that this is a cumbersome
process to perform manually (especially the last two steps), which shows the advantages of automated
computer applications to aid the planning process.
Figure 1 – Bus network planning process. Adapted from Ceder and Wilson (1986)
Demand data
Supply data
Route performance indices
Level A:
Network Design
Route changes
New routes
Operating strategies
Subsidy available
Buses available
Service policies
Current patronage
Level B:
Setting Frequencies
Service frequencies
Demand by time of day
Times for first and last trips
Running times
Level C:
Timetable Development
Trip departure times
Trip arrival times
Deadhead times
Recovery times
Schedule constraints
Cost structure
Level D:
Bus Scheduling
Bus schedules
Driver work schedule
Run cost structure
Level E:
Driver Scheduling
Driver schedules
PLANNING ACTIVITY OUTPUTS INPUTS

Bus Network Design Problem: a review of approaches and solutions
5
The first level – network design – concerns the definition of the network topology, including the design
(or adjustment) of routes and stops, as well as the determination of the location of terminals and inter-
changes. It can mean the definition of new lines in the establishment of a new network or in the expan-
sion of an existing one, or the adjustment/alignment of already established ones. The second level is
frequency setting, which defines the adequate level of service for each line in the existing or planned
network, while considering the available resources and existing policies. The timetable development
level follows the previous one closely, as it converts the designed frequencies into fixed arrival and
departure times for each stop. Both of these levels consider the existing demand, which is varied in time;
different times of day require different service patterns (such as on and off-peak times), and timetables
take into account seasonal variations in demand. The last two levels, bus and driver scheduling, allo-
cate the required resources to the network; the vehicle scheduling activity consists of creating chains of
trips for each vehicle in order to achieve efficient operation, while crew scheduling consists of the as-
signment of drivers to vehicle trips, considering constraints such as contracts and working hours. (Ceder,
2007)
Ibarra-Rojas, Delgado, Giesen, and Muñoz (2015) have also complemented this structure by grouping
these five steps through their scope and their planning horizon. They considered that the first level (net-
work design) concerned decisions on a strategic dimension, as changes in network topology are planned
in the long-term. The decisions in the frequency setting and timetabling levels were considered to belong
on a tactical dimension, as the cost of changes at these levels is lower than at the network level and the
timeframe for these decisions is shorter. The lower levels of vehicle and driver scheduling were consid-
ered to belong to the operational dimension, as they align daily operations of the network to the strategic
and tactical goals previously defined.
The definition of the main problem studied in the present work is based upon the structure presented in
Figure 1. The Bus Network Design Problem (BNDP) is here defined as the combination of decisions
made at strategic, tactical, and operational levels that result in the definition of a bus network, from its
topology to its operational configuration.

Bus Network Design Problem: a review of approaches and solutions
6
1.2. OBJECTIVES
The main objective of this study is to construct a comprehensive review of the research that has been
conducted on solutions for the bus network design problem, in order to produce insights on the key
variables and parameters and on the structure of the problem through the point of view of the existing
body of research. It is oriented towards the organisation of existing approaches through a systematic
collection and classification of literature, so that it may enable further understanding of the problem and
serve as a basis for better solutions.
The literature review not only intends to organise and present the existing body of research but also to
analyse it. The objective is, in this case, to find connections between the defined parameters of analysis
in order to identify recurring trends, so that a more robust categorisation of approaches can be made.
Although the goal is to perform a broad analysis of the subject, some of the previous considerations in
this chapter also warrant interesting hypotheses that may be formulated as research questions, such as:
• Do existing studies focus on the perspective of the user, the operator, or both?
• Is there a gap between research and practice?
These questions are two that have been chosen from many possible ones, as there may be many other
relevant paths of research on this topic. Thus, the intention of these questions is to guide the study, as
the analysis itself may produce other interesting directions, possibly being able to go as far as to iden-
tify possible gaps that may be addressed by future studies.
1.3. STRUCTURE
The present study is divided into five chapters, and a brief summary of each is presented in this section.
Chapter 1 is an introduction to the present work, summarizing its structure and the objectives that were
established. It provides a framework that serves as an introduction to this work, defining the main issues
that are addressed.
Chapter 2 analyses the existing treatment of the subject in literature, with particular focus on existing
comprehensive literature reviews. The analysis and comparison of these works serves as a motivation
and basis for the main body of this study that will be discussed in the following chapters.
Chapter 3 defines the methodology applied to construct the literature review, setting the criteria for
inclusion or exclusion of specific works. The procedures that were taken to categorize and define the
analytical variables are described, and their final definitions are presented and organized into categories,
structuring the analysis in the following chapter.
Chapter 4 presents the results of the review on the selected works through the methodology defined in
the previous chapter, grouping them into the previously defined categories. The attributes found in each
work are compared and analysed.
Chapter 5 summarizes the conclusions and main findings of this work and indicates possible research
gaps that may exist.

Bus Network Design Problem: a review of approaches and solutions
7
2
ANALYSIS OF EXISTING LITERATURE
2.1. PREVIOUS LITERATURE REVIEWS
As stated in the previous chapter, this study intends to review the existing approaches from research to
solve the Bus Network Design Problem. However, this attempt at reviewing the problem is not new.
This field of research, for its relevance and complexity, has attracted much attention throughout the
years and a large amount of studies have been published. This has naturally motivated several authors
to perform state of the art reviews as a basis for their own studies, as the study of previous approaches
is very relevant and informative in this particular subject.
The paper by Ceder and Wilson (1986) that was previously discussed is still widely cited, as the model
they proposed is still applied by authors in more recent times to either measure their own positioning on
the problem or classify existing literature in the case of systematic reviews (as will be discussed further);
they established a model of the bus line planning process as a five-step sequence of decisions. In this
work, they also surveyed previous approaches to the problem in terms of parameters and solution meth-
ods, which was not very extensive due to the small number of studies published at the time.
The article published by van Nes, Hamerslag, and Immers (1988) also included a survey of existing
optimization models, where they established a classification of six different model categories and ex-
emplified each one with relevant studies. Later, L. Spasovic, Boile, and Bladikas (1994) presented their
state of the art review in the form of a matrix, where they also identified the decision variables, objective
function, transit mode, demand model, and network geometry adopted in each paper. This review was
also very sectorial, as they only reviewed analytical solutions to the problem that were pertinent for their
own approach. More recently, W. Fan and Machemehl (2004) presented an extensive review of the
subject also as a support to their study, where each paper was individually summarized. Other authors
such as Agrawal and Mathew (2004), Cevallos and Zhao (2006), and Cancela, Mauttone, and Urquhart
(2015) have also presented their own short reviews on existing solutions that were relevant to their own
analysis and solution proposals.
None of these were, however, attempts at global reviews of the problem. They were limited in scope to
their own contributions to the literature, as they were performed as a way to support their own research
and not as an end in itself. Chua (1984) tackled the bus line planning problem in a global way but not
entirely through literature review; the main concern of the study was a survey on techniques applied in
practice by British bus operators and planners in the 1980’s. Schöbel (2012) published a narrative review
on models and methods for line planning; it focused only on this aspect of the larger problem of network
planning, without considering the interaction with frequency setting and timetabling. The author identi-
fied basic solution approaches and general formulations present in the literature, presenting a theoretical

Bus Network Design Problem: a review of approaches and solutions
8
overview of the problem. However, this review did not present a structured approach or a review matrix
to systematize its conclusions, and as such was not considered to be an attempt at a global review.
Nonetheless, there have been attempts at building true systematic reviews of the transit network design
problem. As of this study’s conclusion date, four such reviews have been found: the studies published
by Guihaire and Hao (2008), Kepaptsoglou and Karlaftis (2009), Farahani, Miandoabchi, Szeto, and
Rashidi (2013), and Ibarra-Rojas et al. (2015). Each of these four papers proposes a global literature
review of the problem, albeit with different focuses and methodologies, and they are the most interesting
to inform the current attempt at such a review. Their analysis is key to not only understand the problem
and the different ways it has been modelled and organized but also to guide the review process of the
present work. Each of them will be studied in detail in the following section, identifying their motiva-
tions, methods, organization, and conclusions.
2.1.1. GUIHAIRE & HAO (2008)
The earliest of the four systematic reviews of the problem was published by Valérie Guihaire and Jin-
Kao Hao in 2008. The authors present three main motivations to conduct the study; the first is that,
acknowledging that previous studies presented interesting overviews of specific parts of the problem
(mostly as a state of the art review to consolidate their own studies), there was a lack of systematic
reviews that allowed a global view of the subject. The second motivation was related to the evolution of
public transit policies, more particularly around the concepts of intermodality, integration, and deregu-
lation, that affected the solutions applied to transit planning. Lastly, they mentioned the recent evolution
of solution methods and the need for a global review that emphasized their gains in efficiency and ap-
plicability.
The authors start their analysis from structure proposed by Ceder and Wilson (1986), which divides the
problem into the five steps that have been discussed in the previous chapter. They acknowledge that,
ideally, these steps should be treated simultaneously in order to obtain optimal solutions; they are very
interconnected, as a solution for one of them impacts the optimality of the other steps. However, they
also consider that solving the five steps simultaneously appears to be intractable due to the overall com-
plexity, which has led most solutions throughout the years to be sequential in nature, i.e., solving each
step individually.
The review was constructed according to an explicit methodology, where the authors first defined the
search strategies for the selected literature; they performed a search on international review databases
complemented with a free web search and an ancestry approach. The search was guided through the
definition of keywords that restricted the results to the subject; to bridge linguistic gaps, these keywords
also included alternative denominations for similar concepts.
The authors structured the problem in a sequential way, according to the first three steps of the process.
For this structure, they proposed a terminology to define each type of problem reviewed, which consisted
of a subdivision of the first three steps of design, frequency setting, and timetabling. On a first level,
they separated these steps in individual sub-problems, for the categorization of studies that only solved
one of them. For more complex approaches, the authors considered combinations of these steps, namely
design and frequency setting and scheduling (frequency setting and timetabling), as is shown in Figure
2. Finally, they classified studies where the three steps were combined in one analysis, which they clas-
sified as design and scheduling problems.

Bus Network Design Problem: a review of approaches and solutions
9
Figure 2 - Proposed structure of the TNDSP. Source: Guihaire and Hao (2008)
The review itself was divided by these combinations of sub-problems, with the authors considering the
isolated problems first (TNDP, TNFSP, and TNTP) and then the composite problems (TNDFSP, TNSP,
and finally TNDSP); each of these categories was further divided by methodological approach (mathe-
matical, heuristic, neighbourhood search, and evolutionary algorithms, along with some other different
approaches), and the papers were reviewed one by one in text. They also summarized their findings in
a review matrix where they identified the problem category and the methodology for each article, along
with the objectives, constraints, and application case.
The conclusions presented by this paper start with the connection between the findings of the review
and the real context in which planners perform their activities. They consider the weight that optimized
network design, frequency setting, and timetabling have on the efficiency and competitiveness of transit
operators and the importance of the optimization objectives that are set, specifically in the context of the
debate between competition and cooperation between operators that the authors consider to be growing.
They also identify gaps in the existing research and opportunities for future work; they argue that there
is a need for more attention to more specific sub-problems (such as intermodality, synchronization man-
agement and intercity transit), as well as taking advantage of technological progress and integrating
more practical concerns into the optimization models (such as adaptability, stochasticity, and demand
responsiveness).
2.1.2. KEPAPTSOGLOU & KARLAFTIS (2009)
Kepaptsoglou and Karlaftis performed a review in 2009 where they collected 62 papers on the subject
(Transit Route Network Design Problem, as stated in the study’s title). They present a structured review
on the problem, focused on its framework and the interaction of all its identified parts.
Their methodology for the literature review is not explicitly defined, in contrast to other authors that
present inclusion criteria and search strategies. Thus, the selected body of literature for the review, while
extensive, is not directly justifiable and may contain bias. The problem definition is not directly stated,
but it may be inferred from the structure proposed by the authors; they cite the five-step structure pro-
posed by Ceder and Wilson (1986) but focus mainly on network design and frequency setting, as deci-
sion variables related to the other three steps are not present in the review matrix.
It is interesting to note that this study does not cite the previously mentioned review published by
Guihaire and Hao (2008), which can possibly be explained by both being almost contemporaneous.
They roughly cover the same subject; although this study does not have such an explicit thematic defi-
nition as the previous one, the chosen literature solves the same first three steps of the problem (network
design, frequency setting, and timetable development). A more detailed comparison of these studies will
be presented further.

Bus Network Design Problem: a review of approaches and solutions
10
Instead of focusing on the aforementioned steps as Guihaire and Hao (2008), Kepaptsoglou and Karlaftis
developed a structure e to contextualize the multiple parts involved in transit network design, and orga-
nized the paper around those definitions. They started with the definition of the objectives for the design
and whether they were single or multiple, and the influence they had on the parameters and methodology
applied. Then, they analysed the different parameters involved in the design problem, such as the deci-
sion variables, the network structure, the demand patterns and characteristics, the constraints, and the
optimal operational strategies, mentioning examples from the selected body of literature for each con-
cept. Finally, the authors focused on methodologies, analysing the approaches (conventional, heuristic,
or other) that were taken in research to solve this complex problem. Each of these three layers is divided
into its own subcategories, where the authors present a short summary of relevant papers that exemplify
them.
The authors also present a review matrix for all the 62 studies considered, that is organized in the three-
fold structure previously described (objectives, parameters, and methodology). Within the “parameters”
category, only the decision variables, the demand patterns and characteristics, and the network structure
are listed for each paper; the constraints and operational strategies, while included in the proposed struc-
ture and defined in the main body of the review, are not included in the matrix. There is also a second
matrix for a more detailed classification of heuristic and metaheuristic methodological approaches,
where only 28 of the 62 papers are analysed.
The main conclusions that the authors propose are related to the definition of a structure to the network
design problem. This structure, that is presented in Figure 3, is an illustration of the framework that the
authors propose for the process. They consider a hierarchical order of importance for the three main
layers, starting with the definition of objectives, which thy argue that is motivated by the goals and
policies of the operator and the environment of the application. The definition of objectives also must
deal with the inherently multi-objective nature of the problem, as the interests of its two main stakehold-
ers (users and operators) must be balanced. The authors consider that the “parameters” layer comes next,
which includes the definition of the main “working parts” of the problem – its decision variables, con-
straints, demand patterns (dependent on and use and urban form), and operational strategies (which
reflect the policy and resources of the operator). They also consider these two layers as the “design
space” of the problem, in opposition to the “methodological” layer which handles the modelling char-
acteristics of the problem. The authors argue that this aspect is the one that has had more attention from
research, and the review presented a variety of methods that can suit different levels of detail of the
design environment (as required by the problem definition) and different levels of computational power
available.
As a conclusion, the authors identified some shortcomings of the existing research that could be im-
proved by future works, considering that, even though an extensive number of articles has been pub-
lished on the problem, there is still a large potential for more studies. They commented on the need for
improvement of the solutions, especially on the realism and practical usefulness of the methodologies.
They also suggested further research on different demand scenarios (other than daily use, such as dis-
ruptions or mega-events) and on more complex models that could incorporate more design objectives.

Bus Network Design Problem: a review of approaches and solutions
11
Figure 3 - Proposed hierarchy of the TRNDP. Source: Kepaptsoglou and Karlaftis (2009)
2.1.3. FARAHANI ET AL. (2013)
Farahani et al. (2013) propose a much wider view of the problem in their review paper, defining it as
urban transportation design problem (UTNDP). This definition encompasses a holistic view on trans-
portation issues in urban settings, combining road network design (RNDP) and transit network design
(TNDP), as well as the interaction between the two in multi-modal network design (MMNDP). The
problem definition includes both private and public transportation in optimization studies, as the authors
focus on both the solution to existing mobility problems and the planning of new transportation infra-
structure.
The authors justify this holistic approach through the argument that RNDP, TNDP and MMNDP share
the same subject (urban mobility) and are part of a larger problem (UTNDP), and argue that the lack of
reviews that directly compare solutions for these problems hinders the cross-fertilization between dif-
ferent fields of study. They also define the scope of the review to be only related to decisions that define
the topology of the network, either on the strategic or tactical level, not considering operational ap-
proaches or tactical decisions that do not affect the shape of the network.

Bus Network Design Problem: a review of approaches and solutions
12
The review itself is split in three ways, as the authors have analysed each problem through a different
lens. They present six different review matrices; in the first three they organize the selected literature
according to various criteria that depend on the problem, and they subsequently present three tables
summarizing only the cases with real application. Unlike the previous reviews, this one does not present
individual summaries for the selected articles; instead, it presents these individual considerations in the
review matrix only and constructs a more generalised analysis in the body of the article.
The first matrix summarizes the review on RNDP, separating it in discrete network design problems
(DNDP – deals with discrete decisions such as adding new roads or lanes or changing traffic direction),
continuous network design problems (CNDP – deals with continuous decisions such as capacity expan-
sion or toll-setting), mixed network design problems (MNDP – a combination of the two previous ap-
proaches), and time-dependent network design problems (a subset of the previous problems where the
conditions change over the planning horizon – DNDP-T, CNDP-T, MNDP-T). The categories consid-
ered in the analysis for each study are the objectives (and whether they are single or multiple), the traffic
assignment model, the demand model (fixed or elastic), the type of decision taken, and the solution
method; the objectives and decisions are presented in a different table, where they are grouped into
labels and a dot (Boolean-type value) is attributed to each one, making it easier to read and compare
information (figure 4). This organization of the review matrix served as an inspiration for the presenta-
tion of the results in the present study, as will be discussed in Chapter 3.
Figure 4 - Excerpt from the RNDP review matrix. Source: Farahani et al. (2013)
The second matrix, pertaining to the TNDP, is perhaps the simplest, where only the constraints, objec-
tives, and solution methods are identified and categorized. The authors separate the table into pure
TNDP problems, where only the topology of the network is addressed, and TNDFSP, where the service
frequency is also optimized; in comparison with the other two previous reviews considered, the focus is
also on these two first steps of the model cited by previous authors, but the analysis is much more
simplified, as the overall scope of the study is much wider. The multimodal problem (MMNDP) is
reviewed in another separate matrix, where the authors consider the type of decisions, the lower-level
problem that is solved, the modes considered, whether there is flow interaction between modes, the
approach, the objectives, and the solution method.
Additionally, the authors present a summary of existing case studies in the selected literature, dividing
the analysis into three separate matrices (one for each considered sub-problem) that are similar to the
previous review matrices. They conclude that most studies do not include case studies, especially those
that deal with road network design problems, through which they question the practicality of some of
these approaches. The sample size of the data used for each case study is also presented in the matrix,
enabling a comparison of the efficiency of the models for larger (more realistic) databases.
This three-fold structure of the sub-problems is also present in the conclusions, where the authors sum-
marize their outlooks and future research directions separately. As the present study deals only with the
TNDP, the authors’ conclusions for the other problems will not be considered in this section; it is

Bus Network Design Problem: a review of approaches and solutions
13
however interesting to note that they are much more extensive, as for this particular problem only three
existing research gaps were identified. They propose that future studies on TNDP should incorporate
environmental concerns into the defined objectives, as well as time-dependent approaches that involve
strategic decisions. They also consider that more advanced passenger behaviour simulation could be
included in the lower-level problems, as current approaches apply simplified passenger choice models.
2.1.4. IBARRA-ROJAS ET AL. (2015)
The review by Ibarra-Rojas et al. (2015) is the most recent of the four reviews considered in this study.
Its difference towards the other three is immediately visible in its title, where the authors propose not
only to review the problems surrounding the planning of transport systems but also their operational
configuration and real-time control. The stated objective is to develop a comprehensive classification of
the existing body of literature, complementing and expanding upon the already existing literature re-
views.
The authors propose a structure that is, like the other authors before them, based on Ceder and Wilson
(1986), although they consider six sub-problems: transit network design (TND), frequency setting (FS),
transit network timetabling (TNT), vehicle scheduling problem (VSP), driver scheduling problem
(DSP), and driver rostering problem (DRP). They consider these sub-problems as inherently interde-
pendent, as they show on Figure 5; although the authors’ model includes some form of hierarchy, it is
not entirely sequential, as their proposed framework considers the existence of both upstream and down-
stream influence of the various levels. This model is different from previous authors, as they organize
its parameters according to inputs, sub-problems, and outputs. The inputs correspond to various types
of constraints of the model that are relevant at different stages of the planning process (network topology
and characteristics, service level standards, driver work constraints, etc.), while the outputs correspond
loosely to the main decision variables of each problem level (configuration of lines and stops, frequen-
cies, fleet size, schedules, etc.).
This review is, in comparison to the previous ones, apparently the only one to exclusively consider bus
systems and not transit as a whole, excluding from the analysis articles that study rail systems or multi-
modal problems (although they consider some rail-based studies with the justification that they also
apply to bus problems). It is also the only one to explicitly consider vehicle and driver scheduling and
rostering as an integral part of the review, as previous authors have only focused on the first three steps
of the BNDP. They also went even further to also consider a “control” level that corresponds to decisions
made in real-time in the network, in a way that is even more granular and detailed than operational
optimization. Thus, their review was focused on four simultaneous levels of decision: strategic, tactical,
operational, and real-time control.
In comparison to Guihaire and Hao (2008) and Kepaptsoglou and Karlaftis (2009), this review presents
a more complete view of the problem, as they limited their analysis to the first three steps of the problem
(network design, frequency setting and timetabling). With respect to Farahani et al. (2013), this study is
also quite wide in its scope, but presents a more vertical view of the problem while the previous one
views it more horizontally.

Bus Network Design Problem: a review of approaches and solutions
14
Figure 5 - Proposed model for TNP. Source: Ibarra-Rojas et al. (2015)
The review itself is divided through the decision levels, with the authors dividing the problems that
consider strategic, tactical, operational, and real-time decisions. For each of these categories, they pre-
sent a review matrix and a brief summary of the main characteristics of each article reviewed; like
Guihaire and Hao (2008), they also divide each category by methodological approach, but in this case
the authors not only consider solution methods but also different modelling approaches. Adding to these
categories, the authors present a further section where they analyse the existing combinations between
sub-problems. They consider articles that integrate different steps of the network planning process (spe-
cifically, among timetabling and vehicle scheduling, vehicle scheduling and driver scheduling, and
driver scheduling and rostering), reviewing the methodologies applied for solving these sub-problems
simultaneously.
The conclusions of this literature review consider that, although there has been a large number of pub-
lications on this subject, there are still more possibilities for further development. The authors identified
three possible future directions for research: the development of more dynamic approaches to the vehicle
and driver scheduling problem that take uncertainty into account, the consideration of different combi-
nations of limited-stop lines and transfer coordination, and, lastly, the further integration of sub-prob-
lems that are currently solved separately.

Bus Network Design Problem: a review of approaches and solutions
15
2.2. CRITICAL ANALYSIS
As previously discussed in this chapter, each of the previous reviews on this subject has contemplated
it differently and contributed in its own way to the organization of the field. The nomenclature and
structuring proposed by each group of authors have been individually addressed, as well as the criteria
and the methodologies applied for their reviews.
In an initial phase of this study, these review articles were key to understand the problem and its speci-
ficities; however, after an initial analysis, their shortcomings became evident, and they served them-
selves as a motivation to perform the present study. The different approaches that have been individually
addressed in this chapter add some confusion to an already complex subject, as both the structure of the
problem and the methodologies are not unanimous, and the criteria applied for each review is not clear.
Therefore, a critical analysis of previous reviews is helpful to identify these shortcomings and to con-
struct a more informed review, which is the subject of the present work. However, the different ways of
classifying the problem and organizing the literature also create problems for the direct comparison and
analysis of the review papers themselves; thus, this critical analysis will be divided in two axes: first, a
comparison of the scope assumed by each author and the methodological construction of each review,
and then an analysis of the disparity between the selected literature in each review.
2.2.1. SCOPE AND STRUCTURE COMPARISON
The network design problem, as a whole, is very complex; as previously discussed, this complexity
arises not only from the large number of variables involved and the difficulty to obtain optimal solutions
but also from its multidisciplinary nature and the multitude of different approaches that have been taken
in research. Thus, any global review that may be performed on this subject should require the construc-
tion (or, at least, selection) of a model through which the problem is analysed. This models usually
include the definition of nomenclature (in order to clarify the classification of different variables and
sub-problems) and a “tree” of sub-problems that are associated with the main issue, with or without
hierarchy and order.
This construction or selection of a model for the problem creates an additional challenge for the author,
as it requires a balance between simplification and detail. It is clear that, for a problem with such com-
plexity, some degree of simplification is necessary for a useful categorization of the existing research;
however, too much simplification can hide the finer nuance that is also important for the understanding
of the problem. Also, the definition of the scope of the study is also very important in this sense, as a
view of the problem that is too wide (that includes a large range of similar sub-problems) may lead to a
shallower analysis, while narrowing it too much may lead to an overly sectorial study, losing sight of
the bigger picture. It is thus important to analyse how each review positioned itself on this scale and if
the authors achieved a balance between scope and complexity.

Bus Network Design Problem: a review of approaches and solutions
16
Figure 6 - Comparison of models adopted by each author
Figure 6 shows a summary the scope of each review in terms of the model they adopt for the classifica-
tion of sub-problems, including the nomenclature that each has used for them. It summarizes the previ-
ous considerations about each review and demonstrates the differences and similarities that exist be-
tween them. It is immediately visible that Farahani et al. (2013) has the widest scope of all four, as he
not only reviewed problems related to transit (and, specifically, buses) but also road and multimodal
network design; as previously stated, this review is wider but shallower in scope than the others, as the
attention given to the TNDP individually is smaller. On the other hand, Kepaptsoglou and Karlaftis
(2009) do not show much thought on a specific model for the problem, as the structure of their paper is
focused on the functional steps for solving the problem (objectives, parameters and methodologies);
nonetheless, the results for their review show that they limited their analysis to the strategic aspect of
network planning (network design and frequency setting), making their scope even narrower than other
authors. Ibarra-Rojas et al. (2015) perform a different study, narrowing their focus to bus network design
only and simultaneously going deeper into the operational aspect of network planning (and even into
real-time control strategies), being the only study that includes vehicle and driver scheduling and ros-
tering as an integral part of the analysis.
Another difference in the structures of all four reviews is the parameters chosen for the analysis of the
literature. All authors presented some form of review matrix as a way to organize and present the results
of their literature review, but the organization of these matrices diverged. Specifically, the differences

Bus Network Design Problem: a review of approaches and solutions
17
were on the parameters identified in each column, as some authors chose different aspects to focus on.
As it is possible to see in Table 1, the only common elements of classification were the objectives and
the solution methods, as all authors listed them for each paper analysed. However, other aspects were
different among the reviews, as, for example, only Guihaire and Hao (2008) chose to identify the prob-
lem definition according to the structure they proposed for the problem (as shown in Figure 2).
Kepaptsoglou and Karlaftis (2009) chose to list the decision variables of each problem while the other
three reviews listed the constraints; none of the reviews listed the two simultaneously. This review also
gathered information from each paper on other parameters, such as the network structure considered in
the model (rectangular, radial, etc.), the demand pattern (many to one, many to many), and the demand
characteristics (fixed, elastic, etc.). Additionally, all other three authors reviewed the existence of appli-
cation cases in each study, with Guihaire and Hao (2008) and Ibarra-Rojas et al. (2015) also considering
the type of application that was employed (example, real case, benchmark, etc.).
Table 1 – Parameters analysed by the previous authors in their review matrices
Problem
Definition
Objectives Constraints Decision
Variables
Solution
Method
Case appl. Other (network,
demand, etc)
Guihaire & Hao
(2008)
● ● ●
● ●
Kepapstoglou &
Karlaftis (2009)
●
● ●
●
Farahani et al.
(2013)
● ●
● ●
Ibarra-Rojas et al.
(2015)
● ●
● ●
2.2.2. METHODOLOGY COMPARISON
According to Toronto and Remington (2020), for a systematic review to be considered rigorous, it must
have a comprehensive method that is followed and reported. This is necessary for the evaluation of the
review itself, as it allows for the reader to identify bias in the selection of literature and synthesis and, if
needed, reproduce the study and verify its conclusions. It makes sense that a systematic review mirrors
the rigorous methodology of the studies that it considers, and thus it is important that the methodology
followed is explicit in the publication.
However, of the four main reviews considered in the present study, only Ibarra-Rojas et al. (2015) and
Guihaire and Hao (2008) explicitly define the goals and scope of their reviews, and only the latter pre-
sents the methodology and search strategy employed to construct their database. This is a serious short-
coming of the existing reviews, as the lack of explanation of how they obtained their results and struc-
tured their analysis undermines the credibility of their results. This is compounded by the lack of con-
sensus on most of the selected literature (that will be discussed in the following section), even on over-
lapping sub-problems; it is difficult to find explanations for the dispersion of the databases if the authors
don’t reveal the inclusion and exclusion criteria and the search strategy employed to obtain them. Even
more, it is not possible to identify the existence of bias on the selected literature or to reproduce the
search to try and obtain the same results, which creates difficulties for both the evaluation of the existing
reviews and for them to serve as a basis for further research. These considerations also demonstrate the
need for more consistent literature reviews to be published on this subject.

Bus Network Design Problem: a review of approaches and solutions
18
2.2.3. DATABASE COMPARISON
Another important step in the critical analysis of the existing reviews was to build a complete list of all
the articles reviewed by each of the authors. This not only created an initial database of articles to per-
form the literature review (as discussed further in Chapter 3) but also allowed the comparison of which
authors cited which paper. This was necessary to demonstrate the disparity that existed between data-
bases, as the different reviews diverged on the selected literature. Some of the reasons that may explain
this have already been discussed, such as the differences in methodology and scope, but this disparity
was also found in papers that sit within the thematic overlap between the reviews. The method applied
to perform this comparison was to join the lists of articles from all four reviews and assign a “yes” or
“no” value to each one on a matrix, in order to find out which article was reviewed by whom. The result
allowed the identification of overlaps on the literature as well as the gaps and the “distance” between
the review articles, and some insights according to different criteria will be discussed. This classification
for each review paper has been added to the final review matrix, which can be viewed in Appendix B.
It is interesting to note that, from the 175 articles considered in this section, only five were cited by all
four reviews, namely Ceder and Wilson (1986), van Nes et al. (1988), Partha Chakroborty and Wivedi
(2002), and W. Fan and Machemehl (2006a, 2006b). Despite the differences in scope and divergences
in focus among the reviews, these articles were considered by all authors. The papers by Ceder and
Wilson (1986) and van Nes et al. (1988) may be considered seminal works as they have set a standard
for the research performed and have been cited extensively. They have also performed early surveys of
the state of the art at the time they were published, which has made these works interesting points of
entry for potential researchers throughout the years. W. Fan and Machemehl (2006a) also performed a
non-systematic literature review at the time as a way to support their own research (as previously sum-
marized), and its inclusion in a systematic review is therefore important. These articles are, however,
too few considering the volume of research that has been published in the last four decades, which
indicates the lack of consensus on the selected literature that has previously been mentioned.
On this list of articles, 24 others were found to have been cited by three of the four reviews. Some
interesting considerations can be taken from the analysis of this list, such as the fact that all of them
were published before 2008 and that all except two were cited by Guihaire and Hao (2008). It is also
visible that the greatest overlap among this set of articles is between Guihaire and Hao (2008) and
Farahani et al. (2013), while Ibarra-Rojas et al. (2015) reviewed only 10 of these 24 articles.
Apart from the intersection between the literature chosen by each review, it is also interesting to analyse
them one by one to understand the degree of “exclusiveness” that each review presents, i.e., the amount
of articles considered by each one that are not included in the others. The results, obtained through the
analysis of the existing list, are presented in Figure 7.

Bus Network Design Problem: a review of approaches and solutions
19
Figure 7 - Exclusive and non-exclusive articles for each review
This analysis allows for some interesting hypotheses about the literature to be considered; for example,
the review by Farahani et al. (2013), while being the widest and most ambitious of the considered re-
views, is more limited on the singular problem of transit network planning and design (as previously
discussed), which may be shown by the smaller overall amount of papers considered on the subject and
the tiny amount of original papers chosen – only five. The opposite may be said of the review conducted
by Ibarra-Rojas et al. (2015), in that the scope of their analysis is narrower but deeper than the other
authors, and 58 out of the 93 considered papers (≈62%) were original as well as exclusive. This review
also had the largest overall number of papers reviewed on the subject, as it considers more sub-problems
than any previous authors (also taking into account that the papers reviewed by Farahani et al. (2013)
that were not related to transit network planning were filtered out of this analysis). This review also has
the characteristic of being the most recent of the four; while Farahani et al. (2013) had only two exclusive
articles that were published after the previous reviews, Ibarra-Rojas et al. (2015) counts 44 exclusive
articles that were published after 2008 – around 47% of the total considered – and 40 after 2009. It is
evidently impossible for these articles to have been reviewed before their publication date, so the fact
that this particular study has a majority of exclusive articles may be explained by its recency; however,
it also adds 14 articles that were not reviewed by any previous author despite already having been pub-
lished.
Figure 8 - Overall exclusive and non-exclusive articles
Even more dramatic is the consideration that, when taking into account all 175 identified papers, the
majority of them (64%) were reviewed only by one author. This means, as shown in Figure 8, that only
63 articles were reviewed by more than one author, which, given the extensive amount of thematic
58
5
31
18
35
45
30
50
0 10 20 30 40 50 60 70 80 90 100
Ibarra-Rojas et al. (2015)
Farahani et al. (2013)
Kepaptsoglou & Karlaftis (2009)
Guihaire & Hao (2008)
Exclusive articles Articles reviewed by others
112 63
Exclusive Non-exclusive

Bus Network Design Problem: a review of approaches and solutions
20
overlap between them, raises questions on the globality of the existing reviews (despite the previous
consideration of them not being contemporaneous). This also reinforces the need for further reviews on
the subject, as there may be some analysis that can be performed on the existing gaps among the previous
reviews.
Figure 9 - Articles in common between pairs of reviews
After analysing the reviews grouped by four, three, and individually, the other possible combination to
be considered is an analysis by pairs, as shown in Figure 9.It represents the number of articles that appear
in both reviews for each pair, including both the articles that were exclusively considered by both and
the ones that feature in more reviews apart from the pair. This may be interpreted as a measure of the
overlap between the existing reviews. It is visible, for example, that Ibarra-Rojas et al. (2015), having
the most exclusive articles (as shown in Figure 7), also appears to have the least amount of overlap with
previous similar studies. Guihaire and Hao (2008), however, appears to have the most overlap with all
others, which can be attributed to it being the earliest of the four and cited by most.
This analysis has compared the structures, methodologies, and databases that characterize the existing
literature reviews. It has also attempted to find some of the fragilities they show on these three parame-
ters, in order to both justify the need for a more comprehensive and global review of the network plan-
ning problem and to inform the construction of a more robust methodology. Nonetheless, there are also
very positive aspects in each previous review that will serve as a basis for the present study, albeit
reinterpreted. This construction of a new literature review and the way the previous ones are integrated
will be discussed in the following chapter.
2224
36
14
23
17
GH / KK GH / IR GH / FH KK / IR KK / FH IR / FH
GH - Guihaire &
Hao (2008)
KK - Kepaptsoglou
& Karlaftis (2009)
FH - Farahani et al.
(2013)
IR - Ibarra-Rojas et
al. (2015)

Bus Network Design Problem: a review of approaches and solutions
21
3 METHODOLOGY
3.1. SELECTING A METHODOLOGICAL APPROACH
The main goal of this study, as stated before, is to understand the BNDP from the point of view of
existing research. This work approaches this objective through the construction of a literature review,
systematically reading and analysing the existing research and then drawing conclusions from their
comparison. Through a process of categorization, the literature itself becomes data – the input for the
analysis that ultimately provides insights.
However, the path to achieve this was not straightforward; the validity of a literature review as a research
methodology depends heavily on the careful construction of a robust method. In order to mitigate bias
and allow the reader to verify the results, the process and criteria that lead to the final review need to be
clearly defined and well reported (Toronto & Remington, 2020). To improve the results’ accuracy and
trustworthiness, the author must define a strategy and a set of guidelines and follow them correctly to
develop the review in a comprehensive manner (Snyder, 2019).
An initial survey on established literature review methodologies was performed in order to construct the
strategy for this study. It is interesting to note that most of the found applications of these methodologies
come from the field of medicine and nursing, although there are also some examples of application in
fields such as management, marketing and psychology, such as, respectively, Tranfield, Denyer, Smart,
Goodhue, and Thompson (1995), Baumeister and Leary (1997), and Palmatier, Houston, and Hulland
(2018). In the first two fields, the expansion of evidence-based practice has led to a multiplication of
studies that employ literature review methodologies in the analysis of clinical cases for the formulation
of theories and practical applications; in turn, a variety of methods to perform these analyses has
emerged in order to better meet the specificities of each study. These methods are robust but there is
some degree of overlap and confusion in their specific definition (Toronto & Remington, 2020). How-
ever, there seems to be a spectrum of methodologies ranging from simple to complex that may be ap-
plied; a succinct summary of some of these will be presented in the next paragraph.
The narrative review is a simple methodology that consists in the summarization of the relevant liter-
ature on a topic without a systematic approach, allowing the author to present an overview on the subject
with limited synthesis (Toronto & Remington, 2020). It is a procedure that does not require a pre-defined
plan or research question, gathering information as new articles are found. An integrative review is a
more structured approach, where a narrower research question is required and there is a construction of
theoretical framework; these kinds of reviews can provide synthesis on not only empirical studies but
also methodological or theoretical studies (Toronto & Remington, 2020). On the other end of the spec-
trum, a systematic review is a more rigid approach that has a very clearly defined framework and a
narrow and specific research question, allowing robust conclusions to be taken from synthesis. This

Bus Network Design Problem: a review of approaches and solutions
22
requires a quality assessment of the considered literature as a criteria for inclusion, given that the quality
of the conclusions depends on the quality of the data (Ravindran & Shankar, 2015). Another approach
that is subordinate to a systematic review is a meta-analysis, where the quantitative results of each study
is integrated and processed through statistical procedures; this approach is followed, for example, in the
medical field, where numerical results of clinical case studies that deal with the same research issue can
be extracted and compared directly. Somewhere between a narrative and a systematic review is the semi-
systematic review ̧which slightly overlaps with the first but has more well-defined structures. It allows
for broader research topics and more flexible analysis, while its procedures require more adaptation to
the research being performed (Snyder, 2019).
These methodologies have varying degrees of strictness around the structure that they propose, but the
main takeaway is that a good review requires:
(1) a well-defined research question or research problem;
(2) systematic criteria for searching and including or excluding information;
(3) a robust method for analysis and classification;
(4) a well-constructed synthesis of the reviewed literature;
(5) a good communication of both the steps taken (to allow verification and replicability) and the
results obtained in order to have an impact.
In this particular study, the collected “data” is not quantitative in nature, i.e., there aren’t numerical
results that can be compiled and analysed to create a model, and the nature of the studied topic is meth-
odological and not empirical; thus, a meta-analysis is not possible, as it requires quantitative data for the
statistical models to be applied (such as clinical reports). Another limitation regarding the most rigorous
methodologies is the wider research question that motivates this study; the definition of a narrow focus
would go against the objective of understanding and identifying the many different approaches that have
been taken on this subject. It would be paradoxical to guide the review by issues that could only be
identified through the careful reading, analysis, and comparison of the literature – i.e., constructing the
review itself. The solution considered in this study was then to identify the main issue, while more
specific research questions would arise during the work itself through the process of reading the selected
literature.
These considerations led to the conclusion that a methodology closer to a semi-systematic review would
be more adequate for the present study, as the sources are composed of methodological research papers
and the data is inherently qualitative. The structure of this review is then divided in five steps, as shown
in Figure 10.

Bus Network Design Problem: a review of approaches and solutions
23
Figure 10 - Structure of the proposed literature review process
The first step consists of the definition of the main research problem for the literature review. In this
case, the research is focused around a problem and not a specific question; although this presents a
difficulty for a narrower and more specific analysis, it is considered in this study that a more rigorous
definition of the thematic scope of the review is sufficient for the goals that were set in the beginning.
The definition of the problem was discussed in the first chapter.
The next step deals with the collection of the literature that will serve as a basis for the review. It was
necessary in this phase to define a search strategy and the sources that would be used; for the search, the
definition of keywords and search queries is necessary to use search engines more efficiently. It is also
necessary to define criteria for the inclusion or exclusion of specific works in order to maintain a focused
approach to the research subject. In this chapter, these sub-steps will be discussed, as well as the final
results of this process (which are presented in Appendix A and Appendix B).
The two steps that follow – review and categorization – are not entirely sequential – they form an
iterative loop that should be carried almost simultaneously. The reading and appraisal of the literature
is organized in a review matrix, which construction is analysed in this chapter. Simultaneously, this
process is accompanied by a constant comparison of results that allows the identification of common
themes and characteristics in the considered studies; this leads to the development of categories that will
serve as the main basis for the analysis and eventual synthesis. The final results of this process and the
definition of the categories will also be presented in this chapter.
The final step of the process, which corresponds to the analysis and synthesis of the considered litera-
ture, will be presented and discussed in Chapter 4.
ANALYSIS AND SYNTHESIS
CATEGORIZATION
Comparison of review results and categorization of parameters
LITERATURE REVIEW
Critical appraisal of each entry Construction of review matrix
COLLECTION OF LITERATURE
Definition of keywords and search strategy
Documenting and organization of results Criteria of exclusion
DEFINITION OF THE RESEARCH PROBLEM

Bus Network Design Problem: a review of approaches and solutions
24
3.2. COLLECTION OF LITERATURE
As previously discussed, after the definition if the research problem, the step that followed was the
collection of the papers to be analysed in the review. Typically, the search would begin with the defini-
tion of search terms, appropriate databases and clear inclusion or exclusion criteria; this kind of search
would yield a large number of articles on the first phase, and these elements would be crucial to guar-
antee that the review stays focused on the subject and exempt from bias.
However, in this particular case, there were already four comprehensive reviews in existence when this
work began, as discussed in Chapter 3. An important conclusion of that chapter was that these authors
already produced considerable databases for their own reviews, albeit with different methodologies,
criteria, and focus. It was shown that their collection converged consensually on a small number of
papers, but a large part of the considered literature was reviewed by at least two of the authors; in many
cases, they were reviewed by only one author but they met the same criteria for inclusion as the consen-
sual papers. It would not have been reasonable to ignore this existing body of literature, neither to start
a new search from scratch when the problem had been reviewed four times before, even with different
thematic focus. It was thus considered in this study that a good starting point to collect the literature to
be analysed would be to compile all the articles reviewed by the mentioned authors. This way, the pre-
sent review could achieve a wider view of the problem from the start, while also building upon an ex-
tensive database already compiled by the previous authors.
However, it would not be sufficient to only consider these, as there may have been some works that
were not considered by the previous authors that could be relevant to this analysis. Furthermore, the last
global review at the time of the present study was published by Ibarra-Rojas et al. (2015). and further
papers on this subject may have been published in this five-year span. So, in order to build a database
of literature, there was a need to survey more works related to this problem in the first approach.
It is also interesting to note that Farahani et al. (2013) reviewed the problem from a wider perspective
than the other authors, including road network design problems and multimodal network design prob-
lems, as discussed in Chapter 2. Consequently, many of the articles considered in their review were
outside the scope of this work and were not included from the start. However, they separated their anal-
ysis by problem type, which allowed the selective extraction of only the articles relevant to this study.
3.2.1. SEARCH METHODOLOGY
The search strategy defined to find new works to be reviewed started with the definition of keywords
that enable a more guided survey. The choice of these keywords was guided by the structure of the
problem identified in Chapter 1, i.e., the main overarching issue is the network design problem, which
has a subdivision called the transportation network design problem (note that the term transportation is
mostly interchangeable with the term transport, due to differences between American English and Brit-
ish English). Within this problem (which considers all kinds of transportation networks) there is a subset
called urban transportation design problem, as defined by Farahani et al. (2013), which contains the
specific transportation design problems in cities. As the problem regarded in this study contemplates
only public transport modes (specifically buses), it required the addition of keywords such as bus, public
transport, public transportation, or public transit. In order to broaden the analysis, as some works may
have only regarded a specific aspect of the BNDP, further search terms such as frequency setting, sched-
uling, timetable, driver scheduling and vehicle scheduling, although these were only added in a later and
more detailed search when the other keywords were fairly well used. These keywords are summarised
in Figure 11.

Bus Network Design Problem: a review of approaches and solutions
25
Figure 11 - Keyword definition for the literature search
The literature extracted from the existing comprehensive literature reviews, as previously discussed,
was organized using Mendeley’s reference manager software before the search was performed. This
allowed new entries to be compared to the existing ones in order to avoid duplication. Also, the software
was used to construct the database, allowing it to be exported in BibTeX format; using JabRef software,
it was possible to convert the database into a spreadsheet file that served as an input for the review
matrix.
An initial, non-methodical search was done through the Google Scholar search engine, which yielded
some interesting results as a starting point. Further, a more rigorous search was made through the Scopus
engine, which allowed a better use of the defined keywords and Boolean operators to refine and direct
the queries. The engine also allowed a search by author, where some significant (recurring) authors were
selected in order to view their full published work on the platform and also the subsequent works that
cited them, expanding the search procedure beyond the keyword search. These articles were then added
to the Mendeley database and organized.
3.2.2. INCLUSION AND EXCLUSION
Through this methodology, a large database was constructed, with the final list containing 247 articles.
Although a pre-screening of found articles (by reading the title and the abstract, or even quickly scanning
its contents) allowed for some filtration of works that did not obviously meet the search criteria, many
were considered ambiguous as to their relatedness to the problem in this study, and were included in
this list. For this reason, it was necessary to filter the existing studies according to inclusion criteria, as
some of the works that were found in the previous step may have been off topic. It was also possible
that the body of studies extracted from past reviews contained ineligible works; thus, the whole list was
scanned and filtered according to the set criteria (figure 12).
For the definition of these criteria, the principle followed was to aim for a less restrictive rule, as it was
considered that the research problem could have a better analysis if the selected literature represented a
plurality of points of view and motivations, as the main focus is on understanding the different ap-
proaches that were taken by researchers. Thus, the main criterion selected was the relatedness to the
research problem, as defined in Chapter 1; this meant that studies were to be eliminated from the review
if their focus was not the design of bus networks in its strategic, tactical or operational dimension. Stud-
ies that concerned multimodal networks (i.e., the interaction between private cars and public transport),
NETWORK DESIGN PROBLEM
Transport
Transportation
TRANSPORT NETWORK DESIGN PROBLEM
Public transport
Public transportation
Public transit
BUS NETWORK DESIGN PROBLEM
Frequency setting
Scheduling TimetableVehicle
schedulingDriver
scheduling

Bus Network Design Problem: a review of approaches and solutions
26
road network design or traffic management solutions – even if they implied the use of public transport
but did not make it the main focus – were to be discarded from the analysis. Also, studies that concern
operational strategies for buses without the determination of schedules or vehicle and driver assignment
were discarded. Another criterion for removal was applied for studies that discussed the problem or an
approach to it but did not present a methodology or a model, the variables considered, or the application
results; those cases could not fit in the analysis if the main parameters to be appraised were not present.
Figure 12 - Summary of inclusion and exclusion criteria for the review
One other criterion that remains a limitation of this work is the access to the full document – only full
studies were considered for review, as extracting information from abstracts or from the existing reviews
was considered to be unmethodical. This meant that, even if the study had been reviewed by past authors,
if the full document was not available it would have to be discarded from the study. Unfortunately, it
was verified that it was not possible to gain full access to a number of articles previously identified2,
especially older articles that were not available online – their references can be found in Table 2.
2 It is relevant to note that this dissertation was developed during the COVID-19 pandemic, and because of the
many lockdowns that were in place during this time the access to physical resources in libraries or in campus was
severely restricted.
Network Design
Frequency
Setting
Tackles a problem within scope of the review: Has appeared in previous literature reviews
Was found through defined keywords
Was cited in already reviewed article
AND Timetabling
Vehicle/Driver
Scheduling
OR
OR
OR
OR
OR
INCLUSION
Does not fall within the scope of the review Does not present an optimization model
EXCLUSION
OR
OR

Bus Network Design Problem: a review of approaches and solutions
27
Table 2 – Articles not included due to lack of access to full document
Author(s) Year Title Reviewed by:
GH KK IR F
Patz 1925 Die richtige Auswahl von Verkehrslinien bei großen
Straßenbahnnetzen Yes No No yes
Holroyd 1967 Optimum bus service: A theoretical model for a large uni-
form urban area No Yes No No
Byrne &
Vuchic 1971
Public transportation line positions and headways for min-
imum cost No Yes No No
Sonntag 1977 Linienplanung im ffentlichen personennahverkehr Yes No No Yes
Hasselstrom 1979 A method for optimization of urban bus route networks Yes No No Yes
Hasselstrom 1981 Public transportation planning — A mathematical pro-
gramming approach Yes Yes No Yes
Koutsopoulos 1985 Determination of Headways as Function of Time Varying
Characteristics on a Transit Network Yes No No No
Pape et al. 1992
Entwurf und implementierung eines
linienplanungssystems fr den busverkehr im pnv unter
einer objektorientierten grafischen
entwicklungsumgebung
Yes No No Yes
Chakroborty et
al. 1997
A genetic algorithm-based procedure for optimal transit
systems scheduling Yes No Yes no
Russo 1998
Transit frequencies design for enhancing the efficiency of
public urban transportation systems: An optimization
model and an algorithm.
No Yes No No
Dhingra and
Shrivastava 1999 Modelling for coordinated bus train network Yes No No No
Ceder & Tal 2001 Designing synchronization into bus timetables No No Yes No
Cipriani et al. 2006 A multimodal transit network design procedure for urban
areas. No No No Yes
Ibarra-Rojas et
al. 2015 Multiperiod synchronization bus timetabling No No Yes no
Other studies that were either part of the existing body of literature from the existing reviews or were
found during the search that was conducted were found not to meet the established inclusion criteria
upon reading; in total, 14 such articles were found. The nature of their divergence from the established
criteria is varied, and as such they are presented in Table 3 with the justification for their exclusion.

Bus Network Design Problem: a review of approaches and solutions
28
Table 3 – Articles excluded from final review
Author(s) Year Title Justification for exclusion
Baaj and
Mahmassani 1992
Artificial Intelligence-Based System
Representation and Search Procedures
for Transit Route Network Design
Not in scope, directed at further AI-re-
lated research
Xiong and
Schneider 1992
Transportation network design using a
cumulative algorithm and neural net-
work
Not in scope, directed at road network
design problem
Shih and Mah-
massani 1996
A design methodology for bus transit
networks with coordinated operations
There is a more recent publication of
the same study by the same authors
(Shih et al., 1998)
Bussieck 1998 Optimal lines in public rail transport Not in scope, directed at railway net-
work planning
Chen and Yang 2004
Stochastic transportation network de-
sign problem with spatial equity con-
straint
Not in scope, directed at road network
design problem
Chiou 2005 Bilevel programming for the continuous
transport network design problem
Not in scope, directed at continuous
network multimodal design problem
Bartholdi and Ei-
senstein 2012
A self-coordinating bus route to resist
bus bunching
Not in scope, directed at control of
bus operations to avoid bunching
Tu et al. 2014 The study of bus transit network design
methods for different sized cities
No model, summary of various route
design methodologies and their suita-
bility to different sized cities
Chao 2017 Study transit network design for Rivera
of Uruguay
No model, critical revision of
Mauttone & Urquhart (2009)
Chuang 2017 Study for transportation system of ur-
ban area of Rome
No model, critical revision of Cipriani
et al. (2012)
Klumpenhouwer
and Wirasinghe 2018
Optimal time point configuration of a
bus route - A Markovian approach
Not in scope, directed at operational
bus control and holding strategies
Shafahi et al. 2018 SpeedRoute: Fast, efficient solutions
for school bus routing problems
Not in scope, directed at operational
bus control and routing strategies
Dai et al. 2019
A predictive headway-based bus-hold-
ing strategy with dynamic control point
selection: A cooperative game theory
approach
Not in scope, directed at operational
bus control and routing strategies
Leich and Nagel 2019
Improving speed and realism of an evo-
lutionary minibus network design pro-
cess
No model, improvement of existing
software, not specifying objectives,
variables, or constraints

Bus Network Design Problem: a review of approaches and solutions
29
3.3. REVIEW MATRIX AND ANALYSIS METHODOLOGY
3.3.1. INITIAL REVIEW MATRIX
After performing the steps previously described, the final list was composed of 217 articles for review.
The next step was to read each article and summarize the important information in each systematically;
in order to be able to do this, the chosen strategy was to construct a review matrix. Each line would
correspond to an article, and each column would contain a parameter of analysis that is extracted from
it. This procedure gives structure and uniformity to the analysis of the literature, as each article is re-
viewed through the same lens and the parameters are directly comparable.
The question that follows is what parameters to designate to each column, i.e., what should be the main
information to be extracted from each article. Some parameters are trivial, such as the author(s), year,
title, and publication; this is the information extracted directly from Mendeley, which allows the user
to export a library that can be converted into a spreadsheet format. The other parameters are not so
straightforward but pivotal nonetheless – their configuration dictates the type of analysis and eventually
synthesis that can be made in the review, hence they should be carefully constructed.
As previously discussed, this stage of the analysis is meant to be an iterative process. One of the issues
at the start of this study was the author’s insufficient knowledge about the subject, and one of the main
motivations to perform this review was not only to attempt to create new knowledge from the analysis
of the literature but also for it to be a learning process. This constraint meant that, inevitably, the starting
point for the structure of the analysis would be different from the final result, as more information and
constant comparison and questioning would allow a refinement of the parameters. This was a limitation
for the study, as it would become more time consuming and prone to errors; but it also meant that there
would be less probability for bias, as the structure of the analysis would evolve from the literature itself
and not be forced to fit a pre-conceived structure.
However, this process required a starting point for the construction of the review matrix, as some initial
parameters were necessary to begin the classification. For this objective, the analysis of the previous
literature reviews described in Chapter 2 was a good inspiration, as most of the criteria they proposed
for the classification of the review matrix were also aligned with the objectives of this study. The review
of the solution methods was unanimous in all four reviews, as well as the identification of the main
objectives of each paper. The definition of constraints and decision variables was, however, not con-
sensual among the reviews, as all authors classified the former while only Kepaptsoglou and Karlaftis
(2009) classified the latter. In the present work, it was considered that both were equally important to
understand each approach to the problem, as when viewed together these parameters provided a clearer
vision of the inputs, outputs, and overall structure that each author(s) proposed. This consideration also
indicated a gap in the previous reviews, as none of the authors considered the constraints and the decision
variables of each problem together.
The case application parameter was also considered to be central in the review, as one of the main
questions identified in the beginning of the study was on the disparity between theory and practice in
this field, i.e., understanding if the majority of articles published on the subject were theoretical studies
directed at the advancement of techniques and solution methods or if they were aimed at practical ap-
plications. Understanding the differences between these studies, both in parameters and approach, was
also an objective of this study. This was previously studied by Guihaire and Hao (2008) and Ibarra-
Rojas et al. (2015) (and, to a lesser extent, by Farahani et al. (2013), which only considered a select
amount of articles with real cases), as can be seen in Table 1 in the previous chapter. The first authors
represented these cases by a very short description of their application, while the second authors fol-
lowed a more rigorous classification, categorizing the cases as “real” (the model is applied to a real

Bus Network Design Problem: a review of approaches and solutions
30
network), “test” (where random sets are generated based on real circumstances), “example” (simplified
networks, real or artificial), and “benchmark” (solution is tested on models previously established in
literature). The initial classifications considered in this study were inspired by the latter, as the classifi-
cation was divided in real, example, and benchmark, with studies that had no application being clas-
sified with none. Another aspect that was considered to be important and was included in the analysis
was the definition of the size of the database that was used, particularly in real cases; this was relevant
because the real applicability of the proposed methods may depend on the size of the network that it is
able to calculate, and also because cities of different sizes have different specificities that should be
taken into account when designing a bus network. Thus, two additional columns were added to the
matrix, where one identified the real-world location where the data was based on and the other provided
a measure of the size of the studied network.
The problem definition category that was studied by Guihaire and Hao (2008) was not considered in
the present work, as it was based on the nomenclature and organization of the problem proposed by
these authors (that can be seen in Figure 2). It was instead replaced by a definition of the problem
category based on the five step model referenced earlier, where the subject of each study was evaluated
according to whether it covered one or more of these steps (network design, frequency setting, timeta-
bling, vehicle scheduling, and driver scheduling). The objective was to find the problem definition
through the analysis of problem categories, arriving at it through the evidence found from the literature
review.
In summary, the categories on each column of the initial review matrix consisted of four descriptive
parameters (publication, year, author(s), title), the main optimization objectives (objective function), the
parameters (constraints and decision variables), the solution method, the application (application type,
network size and location), and the problem category. The comparison with the previous authors can be
seen in Table 4, which is adapted from Table 1 from Chapter 2.
Table 4 – Comparison of the adopted parameters for the revew matrix with previous authors
Problem
definition
Problem
category
Objectives Constraints Decision
variables
Solution
method
Case
appl.
Network size
and location
Other
Guihaire & Hao
(2008) ● ● ● ● ●
Kepapstoglou
& Karlaftis
(2009)
● ● ● ●
Farahani et al.
(2013)
● ● ●
Ibarra-Rojas et
al. (2015)
● ● ● ●
Present study ● ● ● ● ● ● ●
The review process began by reading each of the articles in the final list and filling in each of the previ-
ously described parameters. Initially, this was done through text, as the review matrix worked as a sup-
port to summarize the main aspects found in the papers as they were read. In some cases, this summari-
zation required some degree of interpretation, as some articles did not clearly state the parameters they
employed in their studies. In the other cases, where the authors described their model more explicitly,
the terminology applied to summarize these parameters was intentionally as close as possible to the

Bus Network Design Problem: a review of approaches and solutions
31
original, although the degree of clarity also varied. This presented an additional difficulty in that the
same concept had different names in different papers, or, as the opposite, concepts with the same name
had different meanings according to the context. These inconsistencies created challenges to the ability
to synthesize the information present in each paper, which also demanded some interpretation by the
author; this constitutes a weak point of the present study, as this interpretation also may have led to
inconsistencies in the review itself.
3.3.2. EVOLUTION OF REVIEW MATRIX
As previously discussed, it was predicted by design that the parameters of analysis in the review matrix
would naturally be adjusted as the knowledge on the subject was expanded and concepts were compared
to each other. As such, the matrix and its configuration were always questioned during the review pro-
cess, as outliers which did not fit on pre-established categories were found. The inclusion of these out-
liers was very constructive for the review, as they challenged existing preconceptions and added new
information that was valuable, but their inclusion implied, sometimes, the adjustment of the evaluation
criteria.
One example of this situation was found when evaluating the application cases. The simplified division
between “real” and “example” started to become insufficient as many papers were considered to be on
the grey area between the two. Some articles that included real cases were very grounded in reality and
incorporated practical concerns in both their models and their conclusions, but others used real databases
(albeit simplified) only to evaluate the performance of their algorithms; this raised the question of the
validity of both being classified as “real” cases just because they used real data, although their methods
and objectives were very different. The same could be said of cases that present simplified examples as
demonstrations of their methods, in that some aim at practical applications (where, in some cases, the
artificial networks could just be placeholders for future real applications) and others simply test theoret-
ical computational performances of algorithms without intent to apply them in real life. For the sake of
clarity and the usefulness of the analysis, it was necessary to rethink the framework for this classification
Another adjustment that was found to be necessary was the separation of constraints and decision vari-
ables into two different parameters. The identification of these two parameters together was difficult
and confusing, as it made the division between what were inputs and outputs of the problem unclear.
Considering them separately allows for a more adequate description of the decisions taken by each au-
thor to structure the problem and develop a model, while still allowing a synthesis to be made between
them.
These adjustments were performed during the review process, and the need for them was identified as
difficulties in classifying the articles appeared. These changes in the analysis criteria naturally required
a revision of the articles that had already been studied, which led to some of them being read more than
one time.
3.3.3. FINAL PARAMETERS AND DEFINITIONS
After the previously described process was concluded, the final result was a review matrix that contained
a description of each parameter considered for all 217 articles; this matrix is integrally presented in
Appendix A. This matrix included the classification of objectives, constraints, decision variables, and
application type, as well as the methodology and information about the data applied in the case studies
(as defined in Table 4).

Bus Network Design Problem: a review of approaches and solutions
32
This method of summarizing the gathered information through text led to a dispersion of the classifica-
tion, as different authors either used slightly different names for the same concept or applied different
parameters that were very close in function and meaning. Although many of these elements are common
throughout the entire literature, many authors introduce small variations in the definition of their varia-
bles (either to simplify them or to increase the level of detail incorporated in their models), and these
variations were reflected in the review matrix. The description of these parameters in text allows for the
reading of specific information that was gathered on each of the studies; it was, however, not sufficient
for more detailed analysis and comparison between these parameters.
The ability to synthesize and compare this information depended on the development of a systematic
classification. For this end, the first step taken was to list all the different variants of each parameter that
were found. The comparison of entries on this list allowed for their codification, i.e., the attribution of
a “code” that grouped similar concepts into a category. This codification was performed various times,
as the first attempts produced uneven results – some categories were too specific (which may have ren-
dered them useless for a comparative analysis), while some were too wide (including sub-categories that
were too different to be considered together). Overall, these categories tried to achieve a balance be-
tween a categorization wide enough to be comparable and analysable and the inevitable loss of granu-
larity and accuracy that comes through generalization. As with the review itself, these final categories
were also affected by some inevitable subjectivity that is inherent to the evaluation of these concepts; in
order to clarify this process, it was considered to be important to present the definitions that were at-
tributed to each identified category – these definitions are presented in the following entries in this sec-
tion.
The results of this classification process were, as mentioned, the categories that will be defined in the
following sections of this chapter. However, to be able to analyse and produce insights on the literature
through comparison and synthesis (which will be discussed in Chapter 4), the results for each entry of
the review matrix also needed to be classified individually according to this framework. The method
employed to achieve this was to create a “translation” of each individual variant of the parameters into
the defined categories; the “key” for this translation already existed as the result of the classification
process. An auxiliary matrix was created where each column corresponded to a category, and they were
compared with the existing text in the review matrix through this “key”, producing a “true” or “false”
answer if the category existed or not in each entry. This “true” or “false” matrix allowed for the trans-
formation of a text-based review into data that could be counted and compared.
The final visual representation of these results was inspired by the review matrix presented by Farahani
et al. (2013) for the RNDP. It was obtained by placing a dot for each “true” value, which allows for an
immediate evaluation of each entry in the review according to the parameters that it has used. This final
matrix is presented in Appendix B. For the analysis in Chapter 4, this matrix was transformed into a
binary matrix with 1 for “true” and 0 for “false”, which facilitated the analysis of the raw data.

Bus Network Design Problem: a review of approaches and solutions
33
3.3.3.1. Application type
The final definitions of the application type that were employed on the review matrix resulted, as previ-
ously discussed, from a need to construct a more systematic classification of this aspect. The analysis
was divided into two axes: the realism of the data set and the focus of the conclusions.
The first axis is presented on the left of Table 5, and corresponds to the evaluation of the data that was
used to perform the application of the model. If the case was constructed with actual data from real cities
(if the authors explicitly described it as such) or with data which complexity was approximate to a real
case, they would fall on the upper line of this table. If the data was constructed to present an example of
the model’s application, or if it was real but so simplified that it resembled a constructed case, it was
classified on the lower line of the table.
The other axis corresponds to the two columns of Table 5, and measures if the focus of the model’s
application is on the actual solutions to the problem or only on the performance of the method. This was
found to be a relevant measure of the realism of the models reviewed, as many articles, although pre-
senting real (or realistic) data in their applications, only analysed their findings through the lens of the
improvements of computational performance of the methods (usually through abstract metrics); classi-
fying these cases as “real” would not be entirely true. These cases, whether they had real or constructed
data, were classified on the right side of the table, while cases which focused on the practical application
of their model would fall on the left side of the table.
Another special case was found that was deemed relevant enough to warrant its own category. Many
reviewed articles presented benchmarks as tests of the models they proposed, using pre-established data
from literature. These cases were classified specifically as “benchmarks” because, although their appli-
cations would usually fall on the “test” category, they were very similar (with most articles using the
same benchmark and solving the same problem).
These categories intend to evaluate the degree of realism that the authors defined for their applications,
and approximately where they would also fall on the “practical-theoretical” axis. This classification was,
however, also subjective; even though these five categories allowed for a more systematic analysis,
many articles were found to be on the “grey areas” between them. This classification also reflects the
interpretation of the author, but nonetheless it offers a much more unambiguous picture than the previous
classification, as the decisions are justified through the system that is illustrated in Table 5.
Table 5 - Definition of the application type classification
Conclusions focus on solution and
configuration
Conclusions focus on model and
performance
Real data set Real Realistic
Constructed data set Example Test
Standardized data from
literature Benchmark

Bus Network Design Problem: a review of approaches and solutions
34
3.3.3.2. Objective Function
The problem of designing and planning bus (and other transit) networks is inherently multi-objective,
as previously discussed. The optimization of a network needs to take into account the sometimes con-
tradictory objectives of the users and the operator, which has led to an interesting variety of optimization
objectives in the existing literature. It was found during the categorization process that most of the iden-
tified variants were either directed at the benefit of the user or the operator, and their analysis was sep-
arated according to this division. The definitions presented in Table 6 are also organized this way. The
quantitative results of the analysis were also divided into whether the objectives were directed at maxi-
mization or minimization of the relevant parameters, as is defined in Appendix B and in Chapter 4, but
this division was not applied in the presentation of the definitions.
The main objectives of the model were, in most cases, clearly stated by the authors in each paper con-
sidered, which made their identification and subsequent classification easier than other parameters.
Nonetheless, the dispersion of the nomenclature applied was also verified in this case, and there was
some confusion at the different definitions that were found for the same concepts. For example, some
authors used “travel time” as a synonym for total travel time (which included the waiting and/or the
access time), while others considered it as only the in-vehicle travel time. The definitions presented in
Table 6 attempt to clarify some of these ambiguities.
Table 6 - Definitions of objective function categories
USER
User cost
The cost incurred by the passengers for a decrease in the system’s service level; its mini-
mization represents the users’ interest in the optimization of the transit network. The overall
cost is obtained through the attribution of costs to other minimization sub-objectives, such
as travel time, waiting time or number of transfers.
Access time The time taken by a user to access the network, usually defined by the walking time
needed to reach stops (some exceptions also considers feeder buses and bicycles).
Travel time
In this case, travel time is used as a synonym for in-vehicle travel time, i.e., the amount of
time a user spends travelling in order to reach their specific destination. It constitutes a
measure of the directness and efficiency of the designed system and is often considered
alongside waiting time and/or access time to minimize an average or total travel time.
Waiting time
The time a passenger needs to wait before boarding a vehicle. Can be the time required to
complete a transfer (in transfer optimization problems) or the time between the arrival of a
passenger to a stop and boarding.
Number of
transfers
Amount of in-system transfers required to satisfy a specific O-D pair. Usually considered as
a percentage of demand satisfied with one or more transfers, its minimization increases di-
rectness and reduces passenger discomfort.
Coverage Minimization of unsatisfied demand, either geographically (by covering most OD pairs) or
chronologically (by covering most trips throughout the day).
Potential
transfers
Maximization of the number and quality of transfer opportunities in order to enhance net-
work connectivity.
Welfare Multiple criteria objective that maximizes not only user benefit but overall social benefit from
the optimization, usually implicitly balanced with operator cost minimization.

Bus Network Design Problem: a review of approaches and solutions
35
OPERATOR
Operator cost
The cost incurred by the operator for an increase in the system’s service level; its minimiza-
tion represents the operator’s interest in the optimization of the transit network. It is ob-
tained through the application of costs to various network parameters, such as route length
or fleet size.
Fleet size Minimization of the required number of buses for the operation of the designed network at
the determined frequency. Used as a measure for operating cost
Load factor
Optimization of the load factor indicator (obtained by dividing passenger-kilometres by
place-kilometres) as a measure of utilization of vehicles in the network, in order to minimize
crowding and/or enhance profitability.
Deadheading
time
Minimization of the amount of time the vehicles would run empty (no passenger service),
either to/from a depot or in between line runs; the objective is the benefit of operator profita-
bility as it aggravates operating costs without providing revenue.
Emissions
Minimization of global network emissions, measured from unit values applied to operational
parameters and/or to a life-cycle analysis (that includes the construction of vehicles and in-
frastructure).
Profit Maximization of operator profitability, being the inverse objective of operator cost minimiza-
tion.
Ridership Maximization of ridership potential for the network, obtained by optimizing the satisfaction
of existing demand and/or potential demand.
Passenger flow Different measure of line utilization optimized by balancing flows, aiming to avoid both over-
crowding and underutilization.
3.3.3.3. Constraints
The constraints of each model that was reviewed were defined as the bounds that were imposed on them
so that their outputs were more adequate with reality. They were considered either as bounds to the
problem, setting minimum or maximum limits on specific parameters, or as physical constraints, where
they provided a “skeleton” within which the model must operate. These physical constraints were also
interpreted as the inputs to the model, which are required input variables that have to be “fed” to the
model for it to work correctly.
Like the objective function, during the analysis and categorization of the constraints some thematic
patterns were identified, and similar instances were grouped together. Four of these groups were identi-
fied: network constraints (which dealt with the physical constraints of the network topology and config-
uration), fleet constraints (related to its size, capacity, and operational characteristics), budget con-
straints, and demand constraints. Constraints that were not related to any of these categories were
grouped under the “other” classification. This structure helped the analysis, as the resulting number of
constraint categories was quite large; thus, the grouping of these categories gives more legibility to the
gathered data.

Bus Network Design Problem: a review of approaches and solutions
36
Table 7 - Definitions of constraint categories
DEMAND
Demand data Estimation of existing demand through the collection and processing of ridership data on an
existing network (commonly ticketing data).
Demand
density
Spatial distribution of demand that can be measured within defined zones, correlating
higher population densities with higher transit demand.
Demand
function
Variable demand model that is depended on a function; can be stochastic (simulating de-
mand variation probabilistically) or elastic (which function may be time-dependent or ser-
vice-dependent, usually in bi-level models).
Demand matrix
Array of values of passenger demand for each origin-destination pair, in this case consid-
ered to be applied to a set of nodes. The values can be fixed or variable (when the problem
considers demand elasticity).
Modal split
The share of total demand assigned to each mode, considered when the problem is multi-
modal (i.e., when the model considers interaction between two transit modes such as bus
and rail – multimodal problems that contemplate car use and traffic modelling are not con-
sidered in this study).
Passenger
arrival rate
Number of passengers that arrive at a specific station in a given amount of time. Applied as
continuous function that models demand independently of origin and destination
FLEET
Average speed The average speed of vehicles in the network – applied as an input to calculate travel time
or as an indirect measure of congestion in an existing network.
Vehicle
capacity
The capacity of each bus (or other mode, such as urban rail) given as a constraint of the
capacity of an existing or hypothetical fleet.
Fleet size
Represents either the fixed number of available vehicles (for problems that do not deter-
mine fleet size) or an upper or lower limit to the optimized fleet size (representing cost con-
straints).
Dwell time The amount of time a vehicle can spend stopped at a station; can either be a fixed require-
ment or an interval that sets minimum and maximum values.
BUDGET
Budget con-
straints Pre-determined limits on operator costs given by a maximum available budget.
Subsidies Input of maximum available subsidies as a constraint to profitability.
Unit costs
Monetary value attributed to a unit of a certain variable in order to model costs. Usually ap-
plied to operator-focused variables (such as vehicle operating costs or driver hourly wages)
and user-focused variables (such as the cost of user time to penalize longer travel and
waiting times).

Bus Network Design Problem: a review of approaches and solutions
37
NETWORK
Existing
frequencies Input of already implemented line frequencies as a constraint for optimization problems.
Existing
network
configuration
Input of existing lines and stops already in operation.
Frequency
bounds
Minimum and/or maximum values of the frequency that can be assigned to each line. Can
be a feasibility constraint or a policy requirement.
Existing
schedules Input of already implemented schedules as a constraint for optimization problems.
Network
configuration
constraints
Various limits imposed on the network configuration solution as feasibility constraints, such
as minimum or maximum route length, number of stops, number of lines, and number of
zones.
Network
structure
Input of the physical structure of the network before the lines are modelled, such as a set of
nodes and arcs or the existing road network and/or existing stops.
Travel time
matrix Array of predicted (fixed) travel times between nodes in the network.
OTHER
Driver shift
constraints
Policy requirements for driver shifts, such as maximum driving time, maximum overtime or
pausing times.
Emissions Input of vehicle emission factors applied to operational parameters (such as vehicle-km or
vehicle-hours) to determine the global emissions of the network.
Load factor
constraints
Upper or lower bounds applied to the value of the network load factor; minimum require-
ments represent a network feasibility constraint and maximum values limit vehicle crowd-
ing.
3.3.3.4. Decision Variables
From the categorization process previously described, 12 separate decision variables were identified.
Through the definitions adopted in this study, the decision variables are very interconnected with both
the objective function and the problem type, as they represent the main parameters through which the
authors evaluate their results. They were, however, more difficult to identify than the objective function,
as they were usually embedded within the model and not explicitly stated. In these cases, the path that
was followed to identify them was to examine the results and the discussion that each author presented
and find the main outputs of the problem that were discussed, considering them as the main decision
variables that the authors intended for the problem. In this case, unlike the previous parameters, the
categories obtained were fewer and did not justify their division into meta-categories, and the analysis
was performed on the integral list of these variables (table 8).

Bus Network Design Problem: a review of approaches and solutions
38
Table 8 - Definitions of decision variable categories
Departure
times
Determination of schedules for lines (starting times) and stops (arrival and departure time
at each stop).
Driver shifts Generation of driver schedules compatible with line schedules, in some cases assignment
of drivers to specific lines and vehicles.
Dwell time Time vehicles spend stopped at a station for passenger boarding and alighting.
Fares Determination of optimized value of fares to be applied on the network or on each line.
Fixed cost
Determination of implementation costs of the network, such as construction costs (where
the problem contemplates construction of infrastructure) or other investments required to
set up the line.
Fleet size Determination of the required number of buses for the operation of the designed network at
the determined frequency.
Frequency Number of vehicle departures per unit of time on a line.
Network
configuration
The topology of the optimized network, including the number and shape of lines and the se-
quence and/or location of stops.
Operating
costs
Determination of overall running costs of the network, measured as a sum of several com-
ponents (such as fuel costs, staff costs, vehicle maintenance, or other variable costs).
Ridership Assignment of passengers to routes or trips; can represent the simulated number of pas-
sengers assigned or a measure of vehicle loading.
Vehicle
assignment Assignment of vehicles to lines and depots.
Vehicle
capacity Determination of adequate vehicle capacity for each line (uniform or mixed).
3.3.3.5. Analysis structure
The final review matrix, as was mentioned previously, was organized according to these parameters that
have been defined. These parameters, when considered together, show the layout of the main functional
parts of the BNDP that have been identified. They form a structure that guides both the review and the
subsequent analysis that may be performed on the data obtained.
This structure, summarized in Figure 13, shows the relative organization that is proposed for each pa-
rameter; it is, along with the previous definition of all used variables, a ley to understand both the pre-
sented review matrix (in Appendix A and Appendix B) and the analysis that will be developed in Chapter
4.

Bus Network Design Problem: a review of approaches and solutions
39

Bus Network Design Problem: a review of approaches and solutions
40
Figure 13 - Proposed structure for the analysis and the review matrix

Bus Network Design Problem: a review of approaches and solutions
41
4
RESULTS AND ANALYSIS
4.1. ANALYSIS OF THE FINAL REVIEW MATRIX
Following the methodology described in the previous chapter, the final review matrix was obtained
through a dynamic process. This way, the parameters and the classification would evolve with the ex-
pansion of analysed literature, as more knowledge on the subject was accumulated. Naturally, this also
meant that the review matrix could always be further improved, even indefinitely; thus, it was necessary
to make a decision to stop the analysis at a point where it was deemed acceptable. The final matrix that
is integrally shown in Appendix A and Appendix B represents a crystallization of this process rather
than a finished product; nonetheless, its final form is very close to the objectives that were set in the
beginning.
The information presented in this matrix can, in itself, be the main result of the work developed for the
present study, as it shows a systematic classification for each selected paper. It identifies the objective
function (minimization or maximization), the constraints, and the decision variables present in each
solution, which, as previously discussed, constitute the main "working parts" of the optimization models.
It also classifies the methodologies and the applications of the model - whether the articles present real
case studies (more grounded in practice) or simpler theoretical tests and numerical experiments, and
other classifications in between. These parameters, defined in the previous chapter, present a solid image
of each paper, although many details are naturally lost in this necessary simplification.
The review matrix is also divided in two modalities that represent two different steps in the analysis. As
described in the previous chapter, the first phase of the review was performed simply by summarizing
the main aspects of each parameters through text, along with some observations that were deemed to be
relevant; the results of this step are presented in Appendix A. These written descriptions were later
compared and grouped into classes and presented in a binary matrix where each dot represents a “yes”
or “no” value for each paper, representing if that particular variable is present or not in each one. This
binary representation of the data was accompanied by the construction of definitions that grouped sim-
ilar concepts, allowing for a better synthesis of the main working parts of the bus network design prob-
lem. The definitions presented in Tables 6, 7, and 8 in the previous chapter provide context to the clas-
sifications that are shown in Appendix B.
4.2. DESCRIPTIVE ANALYSIS OF RESULTS
The process previously described that turned the codification of the text-based review matrix into a
“yes” or “no” matrix for each category allowed for these categories to be turned into binary variables.
By simply translating the existing dots into 1 for “present” and 0 for “not present”, it would be possible

Bus Network Design Problem: a review of approaches and solutions
42
to treat this data numerically and gather both descriptive and comparative results about the selected
literature. This section presents the results for the analysed parameters through this descriptive lens.
4.2.1. CHRONOLOGICAL ANALYSIS
The first descriptive parameter on the literature that was considered was the date of publication. The
results of summing the papers by year is presented in Figure 14, showing the results from 1967 to 2020.
It is visible that, in the earlier years considered, the scientific production on the subject was steady but
not particularly voluminous, with one or two articles being published almost every year. In the 21st
century, however, the production accelerated greatly, as there was a sharp increase in the amount of
papers after 2001. It is also possible to see that, in this century, there were three separate “waves”: one
from 2001 to 2007, another from 2011 to 2016, and lastly the most recent one from 2018. These “waves”
show that there have been significant breaks in production of literature on the subject – the most signif-
icant of which between 2016 and 2017, with only 3 papers found from those years. Conversely, some
of the recent years were also the most productive, with 2014 having seen 18 papers published on this
subject, and 2019 and 2020 having 21 papers combined (considering that many papers published in 2020
may have been ignored in this study as the collection of literature stopped in the first trimester).
It is relevant to note that these results may also be influenced by the methodology followed to collect
the literature for this review, as many articles in the period before 2015 were included from the previous
existing literature reviews, and most of the additional articles that were found were from the period since
2011. This means that there may be a bias towards more recent articles, as modern search engines have
more difficulty in finding older articles than recently published or more cited ones.
Figure 14 - Number of selected articles by year of publication
4.2.2. APPLICATION TYPE ANALYSIS
Of the four main parameters that have been previously discussed, the first that should be discussed is
the application type. Apart from being important on its own, it will also be contemplated on the further
analysis of the other three parameters, and as such it should come first. This analysis follows the struc-
ture that has been proposed in the previous chapter and that is present in the final review matrix, where
the articles are classified according to the application models they present. It is divided in two axes of
analysis, where both the realism of the data used for the application and the focus of the conclusions
taken by each author are considered; this organization can be viewed in Table 5.
1
0 0 0
2
1 1 1
2 2
0 0
3 3
1
2
1
3
0
2 2 2
1
0
2
1
2 2
4
0
1
5
1 1
5
10 10
13
9 9
4
7
4
7
6
13 13
18
10
2
1
6
13
8
19
67
19
68
19
69
19
70
19
71
19
72
19
73
19
74
19
75
19
76
19
77
19
78
19
79
19
80
19
81
19
82
19
83
19
84
19
85
19
86
19
87
19
88
19
89
19
90
19
91
19
92
19
93
19
94
19
95
19
96
19
97
19
98
19
99
20
00
20
01
20
02
20
03
20
04
20
05
20
06
20
07
20
08
20
09
20
10
20
11
20
12
20
13
20
14
20
15
20
16
20
17
20
18
20
19
20
20

Bus Network Design Problem: a review of approaches and solutions
43
Figure 15 - Selected articles by application type
Figure 15 shows both the count of all articles by their application type (in absolute numbers) and their
distribution (in percentage of all articles). It is possible to see that their distribution is more or less
balanced, without any of them having a clear majority. Nonetheless, the “real” applications have the
most instances of all the analysed papers, with “realistic” applications having half of the latter’s count.
Together, they make up 45% of the selected literature, showing that a large number of papers that test
their models on real data has been found. On the opposite axis, considering papers that focus on more
practical conclusions, it is visible that they make up a majority of the literature, as “real” applications
and “examples” form 54% of all articles. There is also a relevant presence of cases that present “bench-
mark” applications, with most of them applying the model developed by Mandl (1980) (as is visible in
the review matrix); these articles are 12% of the selected literature. It is also significant that 7% of the
articles present no application, only describing theoretically their proposed optimization model.
Although this classification is somewhat balanced, the difference in size between these categories also
influences the results found through the breakdown of the other parameters according to their application
type. However, the comparison in scale with this distribution may provide interesting insights on the
relationship between the chosen parameters and the focus of each specific study, and whether they are
more theoretical or practice oriented.
30% 24% 15% 12% 11% 7%
Real Example Realistic Benchmark Test NA
66 53 33 27 23 15

Bus Network Design Problem: a review of approaches and solutions
44
4.2.3. PROBLEM CATEGORY ANALYSIS
The problem categories were initially defined according to the five steps proposed by Ceder and Wilson
(1986). These categories represent the step (or steps) that the authors of each article attempt to solve, as
defined in the methodology chapter; as not all authors clearly stated their positioning on this problem,
there was a degree of subjectivity in this classification as some interpretation was required. Nonetheless,
the results obtained provide a good starting point for this analysis.
Figure 16 - Selected articles by problem category
Figure 16 represents the number of articles by each problem category, which was obtained by counting
them separately (not considering the existing combinations and interactions between categories). The
results show that there is an unevenness of the types of problems found in the selected literature, as the
network design and frequency setting sub-problems have a clear majority. This may, on one hand, mean
that the research on the subject has given more attention to these two sub-problems in comparison to the
others, which indicates a potential research gap. On the other hand, this unevenness may result from
shortcomings in the collection of articles for this review, as there is a possibility that the methodology
followed ignored some articles that may have reduced this imbalance. These differences in scale also
affect the analysis of the following parameters, as there is a connection between the problem categories
and the formulation of the optimization models; this is particularly evident in the analysis of the decision
variables, as they are the parameter that mirrors this classification the most.
This isolated analysis, however, is not sufficient to understand the panorama of all problem types. The
literature review has shown that these steps are not rigid and separated, as is visible in Appendix B. In
the literature, they appear both alone and combined with each other, as some authors try to solve just
one step, but others tackle two or more simultaneously. Therefore, a more in-depth analysis should also
consider problem types as groups of sub-problems, ideally to be able to construct problem definitions.
For this end, a model was constructed with all possible combinations of the separate problem categories.
This resulted in 31 possible combinations (5 single categories, 10 in pairs, 10 in groups of three, 5 in
groups of four, and one with all five combined), and all occurrences of each of these instances was
counted to find out what combinations actually exist in the literature. The results of this process are
presented in Table 9 (with all possible combinations except the combination of the five categories) and
Figure 17 (which shows only the non-zero results).
148
149
48
15
4
Network Design
Frequency Setting
Timetabling
Vehicle Scheduling
Driver Scheduling

Bus Network Design Problem: a review of approaches and solutions
45
Table 9 - Results of all possible combinations of problem categories.
ND 34 ND FS 105 ND FS TT 2
ND FS TT VS 1 ND TT 1 ND FS VS 2
FS 21 ND VS 2 ND FS DS 0
ND FS TT DS 0 ND DS 0 ND TT VS 0
TT 21 FS TT 15 ND TT DS 0
ND FS VS DS 0 FS VS 1 ND VS DS 0
VS 1 FS DS 0 FS TT VS 1
ND TT VS DS 0 TT VS 5 FS TT DS 0
DS 1 TT DS 1 FS VS DS 0
FS TT VS DS 0 VS DS 1 TT VS DS 0
(ND – Network Design; FS – Frequency Setting; TT – Timetabling; VS – Vehicle Scheduling; DS – Driver Scheduling)
Figure 17 - Problem category combinations (non-zero)
105
34
21
21
15
5
2
2
2
1
1
1
1
1
1
1
1
1
Network Design and Frequency Setting
Network Design
Frequency Setting
Timetabling
Frequency Setting and Timetabling
Timetabling and Vehicle Scheduling
Network Design and Vehicle Scheduling
Network Design, Frequency Setting, and Timetabling
Network Design, Frequency Setting, and Vehicle Scheduling
Vehicle Scheduling
Driver Scheduling
Network Design and Timetabling
Frequency Setting and Vehicle Scheduling
Timetabling and Driver Scheduling
Vehicle Scheduling and Driver Scheduling
Frequency Setting, Timetabling, and Vehicle Scheduling
Network Design, Frequency Setting, Timetabling, andVehicle Scheduling
Network Design, Frequency Setting, Timetabling, VehicleScheduling, and Driver Scheduling

Bus Network Design Problem: a review of approaches and solutions
46
The first observation that can be made is that not all of the combinations have similar results. Many
combinations (particularly those that include more than two problems) do not have any instances, while
some combinations are more frequent. For example, network design and frequency setting combined
have more instances than any of them separated, while vehicle and driver scheduling only appear once
isolated. These results confirm that in many cases the combination of problem categories is more sig-
nificant than the categories themselves, and therefore the analysis is incomplete without these combina-
tions.
An interesting result that is noticeable is the striking resemblance of the most frequent categories to the
definitions by Guihaire and Hao (2008) that are shown in Figure 2. The authors considered the first three
steps (network design, frequency setting, and timetabling) not only as isolated sub-problems but also
the overlap between them, and the pairs that they considered are relatively frequent in Figure 17. The
exception is the inclusion of some cases of vehicle scheduling combined with timetabling and network
design, which expand upon the scope defined by those authors.
It is also possible to apprehend from this analysis that there are cases of authors that “jump” steps of the
traditional process, which challenges the idea that these steps are strictly sequential. While a majority
focuses on the first two steps, which are closely intertwined, some authors solve network design and
vehicle scheduling problems simultaneously, as well as network design and timetabling or vehicle
scheduling and frequency setting. Although these cases are a minority, they show that there may be
many possibilities of cross-pollination on the connections between these sub-problems.
In order to perform further analysis (such as comparisons with the other parameters, that will pe pre-
sented in the end of this chapter), there is a need to further identify and classify these combinations of
sub-problems. Many of these combinations, however, only have a single example of their application;
although they are interesting on their own, they add complexity to their systematization. For this pur-
pose, it was decided to ignore problem combinations that were not found in more than one instance, in
order to give clarity and legibility to further analysis.
The nine most frequent cases are shown in Figure 18, including combinations of categories and isolated
cases that appear by exclusion (when they appear alone, without any other problem category). The re-
sults are also separated by application type, in order to show the relationship between the “realism” of
the model (if the data is real or theoretical and if the conclusions are focused on practical concerns) and
the sub-problem considered. In this figure, it is visible that the “benchmark” cases only appear in net-
work design problems and network design and frequency setting problems, which is related to the ex-
isting benchmark models in the literature. Also, network design problems and frequency setting prob-
lems alone have a majority of “real” and “realistic” applications, while when they are considered to-
gether there is a majority of “example” and “test” applications.

Bus Network Design Problem: a review of approaches and solutions
47
Figure 18 - Problem category combinations by application type
(ND – Network Design; FS – Frequency Setting; TT – Timetabling; VS – Vehicle Scheduling; DS – Driver Scheduling)
4.2.4. OBJECTIVE FUNCTION ANALYSIS
The data presented in Figure 19 is divided in two ways. It considers if the objective function is either
for minimization or maximization of a certain parameter, and further divides them by category – if the
focus is on the user or on the operator (or other miscellaneous objectives). This division helps the legi-
bility of the data, as it breaks down the identified objectives into similar groups.
Figure 19 - Selected articles by objective function
1011
5
28
1
7
1 10
9
3
5
11
01 1
0 0
4 4 4
30
1
6
10
1
32
5
9
01
2
0 0
8
0 0
16
0 0 01
001
2
11
0 0 0 01
ND FS TT ND FS ND VS FS TT TT VS ND FS TT ND FS VS
Real Realistic Example Test Benchmark NA
91
86
86
78
25
23
10
6
93
16
14
6
4
13
12
12
8
2
Min. Travel time
Min. User cost
Min. Waiting time
Min. Number of transfers
Min. Access time
Max. Coverage
Max. Welfare
Max. Potential transfers
Min. Operator cost
Min. Fleet size
Min. Load factor
Min. Emissions
Min. Deadheading time
Max. Ridership
Max. Profit
Max. Passenger flow
Min. Other
Max. Other
User
Op
era
tor
Oth
er

Bus Network Design Problem: a review of approaches and solutions
48
This figure shows that more papers adopted minimization objectives than maximization objectives. This
conclusion is also tied to the observation that the most common optimization objective is the minimiza-
tion of operator cost, but there is also a predominance of other minimization objectives focused on the
user, such as the minimization of the number of transfers, travel time, waiting time, or overall user cost.
In comparison, all the other objectives that have been identified were much more marginal, and it is
possible to see in the review matrix that the user and the operator cost minimization objectives appear
predominantly together, as many articles aim for a generalized cost minimization objective. It is also
interesting to note that, as has been explained in Table 6, the overall travel time minimization objective
was separated into three separate phases, including access time, waiting time, and actual in-vehicle travel
time. These three categories are shown to be very prevalent in the image, although they appear together
often (as is visible in the review matrix); travel time (in-vehicle) is the most frequent, followed by wait-
ing time and then by access time, which is the less prevalent of these subdivisions.
It is also visible that the user-focused objectives appear to be more predominant. Apart from the operator
cost minimization objective, most other operator-focused objectives appear to be less frequent than the
their counterparts; the numbers are quite balanced for the load factor and fleet size minimization and
passenger flow, profit, and ridership maximization objectives, which appear in between 12 to 16 papers.
Figure 20 - User focused objectives divided by application type
Figure 21 - Operator focused objectives divided by application type
30
22
2725
8
54
1
7
1012
16
2
54
21
2524
108
56
9
12 12
4 4
1 1
21
8 8
20
1
7
3
9
3 32
Min. Traveltime
Min. User cost Min. Waitingtime
Min. Numberof transfers
Min. Accesstime
Max.Coverage
Max. Welfare Max. Potentialtransfers
Real Realistic Example Test Benchmark None
24
35
21
54
2
12
21 1
2
5
2
28
65
1 13
64
11
12
12
9
31
21
9
1 1 1
Min. Operatorcost
Min. Fleet size Min. Loadfactor
Min. Emissions Min.Deadheading
time
Max. Ridership Max. Profit Max.Passenger
flow
Real Realistic Example Test Benchmark None

Bus Network Design Problem: a review of approaches and solutions
49
The data shown in Figure 20 and Figure 21 was obtained by breaking down the results of the objective
function by application type. The legibility of these results is not immediate, as they are simultaneously
influenced by the sample size of both the objective categories and the application types; as some cate-
gories have so little instances, the data may not be representative. However, it is still possible to identify
some trends on these graphs that may lead to insights on the analysed literature.
The most immediately visible conclusion is that, following what has already been identified in the anal-
ysis of the application type alone, the most prominent categories are the real cases and the examples,
which still dominate in this particular breakdown. However, there are select cases that stand out, such
as the prominence of benchmark applications in papers that minimize travel time and number of trans-
fers, and in those whose objective is to maximize coverage (where the benchmark cases are the major-
ity). In the case of papers that minimize user and/or operator cost (that are very frequently paired), there
are more examples than real cases, although these two application types still make up the majority of
cases. One particularly interesting case is verified in the articles that state the objective of minimizing
fleet size, where real and realistic applications are in the minority.
4.2.5. CONSTRAINTS ANALYSIS
The constraints were organized through a similar method that was applied for the objectives, where they
were divided thematically among different categories (as described in 3.3.3.3.). In this case, five cate-
gories were identified, as is presented in Figure 13, and the results for each are shown in Figure 22.
This analysis shows that the most frequently appearing constraints are the network structure and the
demand matrix, that correspond to the definitions presented in Table 7; this, along with the review matrix
itself, indicates that these constraints correspond to the basic inputs for the majority of network design
models. Excluding these two, the next most frequent constraints are the vehicle capacity and the fleet
size, that correspond to the majority of fleet-related constraints. The category of demand constraints is
heavily dominated by the demand matrix constraint, as other forms of demand modelling are much
sparser. This is, however, not verified in the case of network constraints, where there is much more
diversity and other constraints apart from the network structure appear more often. Budget constraints
are less frequent, and the majority is related to unit costs. There were other constraints that did not fit in
these four categories and were thus considered separately; many of these, along with others that appear
in the four main categories, are marginal, having been identified in a handful of papers.
Figure 23 shows the grouping of each of the previously discussed constraint categories. It presents a
similar picture to Figure 22, but shows the differences in scale more clearly. It is more visible that budget
constraints are much less frequent than others, as not many papers take actual budgets into consideration;
it is interesting to compare this with the prevalence of cost minimization objectives, which shows that
these costs are more a measure of the inefficiency of the system than of actual monetary losses by either
the user or the operator. It can also be seen that network constraints appear in almost all selected articles
(86%), and that there is also a high number of articles with demand constraints. However, the sum of
the separate demand constraints (in Figure 22) is the same as the number of overall demand constraints
(160), which means that all of them are exclusive, i.e., the classification of demand constraints is never
duplicated. This is the opposite of the network constraints, where the sum of all subcategories (293) is
larger than the grouped value, which means that they have more overlap.

Bus Network Design Problem: a review of approaches and solutions
50
Figure 22 - Selected articles by constraints
Figure 23 - Selected articles by constraint category
116
15
11
7
6
4
78
52
18
4
37
17
3
116
51
40
37
24
17
8
10
6
4
2
Demand matrix
Demand density
Demand function
Passenger arrival rate
Demand data
Modal split
Vehicle capacity
Fleet size
Average speed
Dwell time
Unit costs
Budget constraints
Subsidies
Network structure
Frequency bounds
Travel time matrix
Existing Network configuration
Network configuration constraints
Existing frequencies
Existing schedules
Other
Load factor constraints
Driver shift constraints
EmissionsD
em
an
dF
lee
tB
udg
et
Ne
two
rkO
the
r
187
160
115
54
Network Constraints
Demand Constraints
Fleet Constraints
Budget Constraints

Bus Network Design Problem: a review of approaches and solutions
51
Figure 24 - Demand constraints divided by application type
Figure 25 - Fleet constraints divided by application type
Figure 26 - Network constraints divided by application type
24
13 4
33
1 1
15
2 2 2
6
9
23
1 1
10
26
2 1 1
9
Modal split Demand data Passenger arrivalrate
Demand function Demand density Demand matrix
Real Realistic Example Test Benchmark None
13
22
27
1
68
2
11 11
22
13
6
10
6 6
1
5
Dwell time Average speed Fleet size Vehicle capacity
Real Realistic Example Test Benchmark None
54
6
18
6
17
37
23
7 7 7
10
18
1
65
6 68
22
43
4 4
11
5
1
13
8
20
12
4 4
8
Existingschedules
Existingfrequencies
Networkconfigurationconstraints
ExistingNetwork
configuration
Travel timematrix
Frequencybounds
Networkstructure
Real Realistic Example Test Benchmark None

Bus Network Design Problem: a review of approaches and solutions
52
Figure 27 - Budget constraints divided by application type
Figure 28 - Other constraints divided by application type
The constraints, like the objectives, were separated by application type. In this case, for graphical rea-
sons, they were divided in five different figures (Figure 24, Figure 25, Figure 26, Figure 27, and Figure
28), with each corresponding to one of the previously established categories. This division was done in
order to preserve individual legibility.
It is visible that, for many constraints, the previously identified pattern of the most prominent application
types being real cases and examples is the same. However, unlike the objectives, the breakdown of
constraints offers more varied results with more interesting exceptions. One of these is that the budget
constraints appear to be more prevalent in cases without real data applications; this is also verified in
cases with travel time matrix constraints, which have more benchmark applications. The opposite is
verified in cases that apply frequency bounds, the existing network configuration, and the fleet size as
constraints, where real applications are predominant, indicating that they may be more relevant in prac-
tical applications.
4.2.6. DECISION VARIABLES ANALYSIS
The decision variables were also counted according to the categories that were previously defined, and
its results are shown in Figure 29. As only 12 main variables (excluding “others”) were determined, it
was not so necessary to divide them in groups as was performed for the objectives and constraints, as
they would not add much to the legibility of the results. Their variety was not as great as was found in
the other parameters, and their definitions (as defined in Table 8) are more clearly divided.
2
5
7
34
5
18
1
5
2 21 1 1
Subsidies Budget constraints Unit costs
Real Realistic Example Test Benchmark None
1 12
5
21
221 1 11 1 1
Emissions Driver shift constraints Load factor constraints Other
Real Realistic Example Test Benchmark None

Bus Network Design Problem: a review of approaches and solutions
53
Figure 29 - Selected articles by decision variables
The decision variables are the parameter that more clearly shows the focus of the model proposed by
each paper, as they represent the desired results of the optimization model. The most frequent decision
variables, network configuration and frequency, correspond directly to the first two steps of the network
design problem, as proposed by Ceder and Wilson (1986), and they appear in the majority of articles. A
clear comparison can also be made with the results for problem type, as the same pattern is visible in
both analyses; a majority of the studies considered tackle these first two steps, and the results for the
decision variables corroborate that observation. This may also demonstrate the unevenness of the se-
lected literature, as studies that tackle network design and frequency setting may be overrepresented.
Excluding these two predominant decision variables, fleet size and ridership come next in order of rep-
resentation in the selected literature; the determination of the required fleet size to operate at a certain
service level is also a frequent variable considered in many network design problems, and ridership as
a decision variable also appears as a consequence of demand assignment in many problems. The deter-
mination of departure times, which is an important variable for timetable development and optimization,
appears less frequently, which also may mean that less articles that tackled timetabling problems have
been selected. The variables related to driver and vehicle scheduling are also scarce, which may indicate
an underrepresentation of these kinds of problems in the literature.
Figure 30 represents the same data but divided by application type, as was presented for the objectives
and constraints. The conclusions that may be taken from this data are, as for the previous parameters,
influenced by the different samples for each variable, and should not be taken as certain; they are, how-
ever, interesting indicators of the relationship between the variables and the applications. One possible
reading is that articles that employ the two most frequent variables develop a large number of real and
realistic applications, as well as ridership and departure times. Problems that have taken the fleet size,
vehicle capacity, vehicle assignment, and fares as decision variables lean more towards examples, as
their application cases tend to be less realistic and more theoretical. These conclusions are harder to see
for the less frequent variables, as their sample size is smaller and less representative.
138
134
59
41
27
15
12
11
11
7
6
3
2
Frequency
Network configuration
Fleet size
Ridership
Departure times
Other
Vehicle capacity
Fares
Vehicle assignment
Operating costs
Fixed cost
Dwell times
Driver shifts

Bus Network Design Problem: a review of approaches and solutions
54
Figure 30 - Decision variables divided by application type
1
1
3
3
3
4
4
8
16
15
41
47
1
2
1
1
1
4
6
5
9
18
16
2
1
3
7
5
5
4
5
13
21
32
37
1
2
1
2
6
3
3
12
11
1
1
2
10
19
14
1
2
1
1
2
1
12
13
Driver shifts
Dwell times
Fixed cost
Operating costs
Fares
Vehicle assignment
Vehicle capacity
Other
Departure times
Ridership
Fleet size
Network configuration
Frequency
None Benchmark Test Example Realistic Real

Bus Network Design Problem: a review of approaches and solutions
55
5
CONCLUSIONS
This study presents a literature review on the Bus Network Design Problem from the point of view of
approaches and solutions presented in research. Building upon the work of previous authors who have
performed similar reviews, this study attempted to bridge some of the gaps that were identified among
them, such as the unevenness in selection criteria, included literature, and framework of analysis, as was
discussed in Chapter 2. Thus, the main objective was to perform a more comprehensive and updated
review of the existing literature, following a clear methodology and performing analysis through a well-
defined framework.
The methodology defined and described in Chapter 3 yielded the results that are shown in Appendix A
and Appendix B, and was followed by the analysis performed in Chapter 4. The analysis was based on
the transformation of the original review matrix into a binary matrix (presented in Appendix B) and
consisted of a breakdown of the data according to various criteria. This allowed for a descriptive analysis
of the reviewed literature that enabled the observation of common themes and dominant parameters,
which were described according to each defined category.
The final results of the literature review contain a large amount of information, and the efforts that were
made in the analysis intended to help extract meaning from this data. The system through which this
information is presented in both the review matrices and their descriptive analysis follows the frame-
work that was proposed in the definition of the methodology, and clearly presents the observations that
were originally intended in the introduction. Therefore, it is possible to conclude that the main objective
of this study was met – to review and classify the existing literature on the subject, understanding and
analysing its main components and the dominant approaches.
Apart from the stated main objective, there was also a need to define research questions for this study,
which were listed in Chapter 1. Nonetheless, the nature of the present work is still fairly open-ended, as
it allows for further conclusions that are not limited to the initial research questions. These questions
were defined to guide the focus of the work, but they don’t contain it; rather, as was stated in the defi-
nition of the methodology, the intention was to generate new questions from the observation of the data
(or, in this case, the literature). The conclusions of this study, however, will be limited to the initial
hypotheses that were considered, while alluding to some other possible questions that may be answered
by future studies.
One of the initial hypotheses that were considered was the existence of a dissociation between the focus
of the research produced on this topic and the actual needs of professional practice. The analysis of the
articles by the classification of their application type demonstrated that, although “real" applications
were found to be the most frequent category, they only make up 30% of all considered papers. This
reinforces the initial hypothesis, given that the model applications and conclusions of a majority of

Bus Network Design Problem: a review of approaches and solutions
56
studies were theoretical in nature. These findings are also corroborated by the analysis performed ac-
cording to the other parameters, where the most frequent categories also had a minority of real applica-
tions. This does not, however, fully answer the question on its own, as it is limited to the approaches
from research; this could require further studies on practical approaches, gathering data and knowledge
from real applications to compare with the existing theory.
Another conclusion related to the previous one is the observation of a tendency for some parameters
(constraints and decision variables) to appear more frequently in studies oriented towards real cases, and
others in more theoretical models. The former may be more aligned with existing practical applications,
while the inclusion of the latter my make sense from a theoretical perspective but be inadequate in
reality. For example, it was found that the consideration of fleet size as a decision variable appeared
more frequently in studies without real applications, as well as considering fares as a variable. Con-
versely, the consideration of fleet size as a constraint was more frequent in practically oriented studies.
Other parameters such as the existing network configuration constraint were also found to be more pre-
dominant in studies with real applications.
The question of the positioning of the authors on the balance between the interests of the user and the
operator was less clear. The results for the objective function show that there is a balance between user-
focused and operator-focused objectives, although there is a greater tendency towards the former. They
also appear frequently together, as most articles simultaneously consider the interests of both parties
when designing networks, optimising both operator cost/profit and user comfort. However, the applica-
tions of many models that considered both objectives – particularly those which generated changes to
existing networks – resulted in the reduction of the decision variables (such as line density, frequency,
or fleet size) as optimal results, which may hint at a greater weight being placed on the perspective of
the rationalisation of operator costs. This is, however, not a straightforward issue, as in some settings
this may generate overall social value, while in others it may be detrimental to it. The modelling of user
and operator objectives as a balance may yield results that do not benefit society as a whole; it is inter-
esting to note that the optimisation objective of the maximisation of overall social welfare was only
found in 10 articles, which constitute a strong minority of those analysed.
The previous consideration also highlights an aspect that was not considered as a criterion for the anal-
ysis but may be important for the understanding of existing approaches: the location of the application
for the real cases. This was identified in the first review matrix but was not systematically analysed, and
may constitute an interesting direction for future studies, as cities of different sizes, with different social
conditions and problems, and with different organisations of the transportation market require different
focuses for the implementation or improvement of their respective transit networks; it may be relevant
to study the impact of these local characteristics in the development of models and methods for transit
optimisation.

Bus Network Design Problem: a review of approaches and solutions
57
The main limitations of the present work should also be noted. While the methodology that was defined
for the collection of literature was followed carefully, some relevant articles may have been missed
during this process. As such, while the final sample is quite extensive, this review may not be fully
comprehensive, as further papers that fit the scope of this work may exist that were not included. Another
characteristic of this work that may be a limitation is the degree of interpretation that was required for
the classification of the selected literature. The activity of summarising each paper into small bits of
information for the review matrix required a subjective interpretation of their contents, as well as the
construction of the definitions that were necessary for the categorisation. As such, while this approach
tried to be as rigorous as possible, some articles may have been misinterpreted. Finally, this work was
also limited in its conclusions, as it generated a large amount of information which was not easy to
interpret. There may be insights on the literature that were missed due to the limited scope of the analysis
performed; however, the results from this work also have the potential to inform future studies on the
subject and allow future researchers to extract even more meaning from the gathered data.

Bus Network Design Problem: a review of approaches and solutions
58

Bus Network Design Problem: a review of approaches and solutions
59
BIBLIOGRAPHY
Abdolmaleki, M., Masoud, N., & Yin, Y. (2020). Transit timetable synchronization for transfer time
minimization. Transportation Research Part B: Methodological, 131, 143-159.
doi:10.1016/J.TRB.2019.12.002
Agrawal, J., & Mathew, T. V. (2004). Transit route network design using parallel genetic algorithm.
Journal of Computing in Civil Engineering, 18, 248-256. doi:10.1061/(ASCE)0887-
3801(2004)18:3(248)
Ahmed, L., Mumford, C., & Kheiri, A. (2019). Solving urban transit route design problem using
selection hyper-heuristics. European Journal of Operational Research, 274, 545-559.
doi:10.1016/J.EJOR.2018.10.022
Aldaihani, M. M., Quadrifoglio, L., Dessouky, M. M., & Hall, R. (2004). Network design for a grid
hybrid transit service. Transportation Research Part A: Policy and Practice, 38, 511-530.
doi:10.1016/j.tra.2004.05.001
Amiripour, S. M. M., Ceder, A., & Mohaymany, A. S. (2014). Designing large-scale bus network with
seasonal variations of demand. Transportation Research Part C: Emerging Technologies, 48,
322-338. doi:10.1016/j.trc.2014.08.017
An, K., & Lo, H. K. (2015). Robust transit network design with stochastic demand considering
development density. Transportation Research Part B: Methodological, 81, 737-754.
doi:10.1016/j.trb.2015.05.019
An, K., & Lo, H. K. (2016). Two-phase stochastic program for transit network design under demand
uncertainty. Transportation Research Part B: Methodological, 84, 157-181.
doi:10.1016/j.trb.2015.12.009
Arbex, R. O., & da Cunha, C. B. (2015). Efficient transit network design and frequencies setting multi-
objective optimization by alternating objective genetic algorithm. Transportation Research Part
B: Methodological, 81, 355-376. doi:10.1016/j.trb.2015.06.014
Baaj, M. H., & Mahmassani, H. S. (1991). An AI-Based Approach for Transit Route System Planning
and Design. Journal of Advanced Transportation, 25, 187-209.
Baaj, M. H., & Mahmassani, H. S. (1992). Al-Based System representation and Search procedures for
Transit Route Network Design. Transportation Research Record, 1358, 67-70.
Baaj, M. H., & Mahmassani, H. S. (1995). Hybrid route generation heuristic algorithm for the design of
transit networks. Transportation Research Part C: Emerging Technologies, 3, 31-50.
Bachelet, B., & Yon, L. (2005). Enhancing Theoretical Optimization Solutions by Coupling with
Simulation. Clermont- Ferrand, France.
Badia, H., Estrada, M., & Robusté, F. (2014). Competitive transit network design in cities with radial
street patterns. Transportation Research Part B: Methodological, 59, 161-181.
doi:10.1016/j.trb.2013.11.006
Bagloee, S. A., & Ceder, A. (2011). Transit-network design methodology for actual-size road networks.
Transportation Research Part B: Methodological, 45, 1787-1804.
doi:10.1016/j.trb.2011.07.005
Barra, A., Carvalho, L., Teypaz, N., Cung, V. D., & Balassiano, R. (2007, June 24-28). Solving the
transit network design problem with constraint programming. Paper presented at the 11th World
Conference in Transport Research , University of California, Berkeley, USA.
Bartholdi, J. J., & Eisenstein, D. D. (2012). A self-coördinating bus route to resist bus bunching.
Transportation Research Part B: Methodological, 46, 481-491.
doi:10.1016/J.TRB.2011.11.001
Baumeister, R. F., & Leary, M. R. (1997). Writing narrative literature reviews. Review of General
Psychology, 1, 311-320. doi:10.1037/1089-2680.1.3.311

Bus Network Design Problem: a review of approaches and solutions
60
Beirão, G., & Sarsfield Cabral, J. A. (2007). Understanding attitudes towards public transport and
private car: A qualitative study. Transport Policy, 14(6), 478-489.
doi:https://doi.org/10.1016/j.tranpol.2007.04.009
Bielli, M., Caramia, M., & Carotenuto, P. (2002). Genetic algorithms in bus network optimization.
Transportation Research Part C: Emerging Technologies, 10, 19-34. doi:10.1016/S0968-
090X(00)00048-6
Bielli, M., & Carotenuto, P. (1998). A new approach for transport network design and optimization.
Paper presented at the 38th Congress of the european regional science association. Retrieved
12 March, 2020, from file:///C:/Users/35191/Downloads/414%20(1).pdf
Black, A. (1978). Optimizing Urban Mass Transit Systems: a General Model. Transportation Research
Record, 74, 41-47.
Bookbinder, J., & Desilets, A. (1992). Transfer optimization in a transit network. Transportation
Science, 26, 106-118. doi:10.1287/trsc.26.2.106
Borndörfer, R., Grötschel, M., & Pfetsch, M. E. (2005). A Path-Based Model for Line Planning in Public
Transport. Retrieved 19 March, 2020, from
file:///C:/Users/35191/Downloads/ZR_05_18.orig.Vers%20(1).pdf.
Borndörfer, R., Grötschel, M., & Pfetsch, M. E. (2008). Models for line planning in public transport.
Lecture Notes in Economics and Mathematical Systems, 600, 363-378. doi:10.1007/978-3-540-
73312-6_18
Boyer, V., Ibarra-Rojas, O. J., & Ríos-Solís, Y. Á. (2018). Vehicle and Crew Scheduling for Flexible
Bus Transportation Systems. Transportation Research Part B: Methodological, 112, 216-229.
doi:10.1016/J.TRB.2018.04.008
Buba, A. T., & Lee, L. S. (2018). A differential evolution for simultaneous transit network design and
frequency setting problem. Expert Systems with Applications, 106, 277-289.
doi:10.1016/j.eswa.2018.04.011
Buehler, R., Pucher, J., Gerike, R., & Götschi, T. (2017). Reducing car dependence in the heart of
Europe: lessons from Germany, Austria, and Switzerland. Transport Reviews, 37(1), 4-28.
doi:10.1080/01441647.2016.1177799
Bussieck, M. (1998). Optimal Lines in Public Rail Transport. (PhD Thesis). Department of Mathematics
and Computer Science. Technical University of Braunschweig.
Button, K., Vega, H., & Nijkamp, P. (2010). A Dictionary of Transport Analysis. Cheltenham, UK:
Edward Elgar Publishing.
Byrne, B. F. (1975). Public transportation line positions and headways for minimum user and system
cost in a radial case. Transportation Research, 9, 97-102. doi:10.1016/0041-1647(75)90044-1
Byrne, B. F. (1976). Cost minimizing positions, lengths and headways for parallel public transit lines
having different speeds. Transportation Research, 10, 209-214. doi:10.1016/0041-
1647(76)90076-9
Cancela, H., Mauttone, A., & Urquhart, M. E. (2015). Mathematical programming formulations for
transit network design. Transportation Research Part B: Methodological, 77, 17-37.
doi:10.1016/j.trb.2015.03.006
Carosi, S., Frangioni, A., Galli, L., Girardi, L., & Vallese, G. (2019). A matheuristic for integrated
timetabling and vehicle scheduling. Transportation Research Part B: Methodological, 127, 99-
124. doi:10.1016/J.TRB.2019.07.004
Carrese, S., & Gori, S. (2004). An urban bus network design procedure. In M. Patriksson & M. Labbé
(Eds.), Transportation Planning: State of the art (pp. 177-195): Kluwer Academic Publishers.
Castelli, L., Pesenti, R., & Ukovich, W. (2004). Scheduling multimodal transportation systems.
European Journal of Operational Research, 155, 603-615. doi:10.1016/j.ejor.2003.02.002
Ceder, A. (1984). Bus Frequency Determination Using Passenger Count Data. Transportation Research
Part A: Policy and Practice, 18, 439-453.
Ceder, A. (2002a). Designing Public Transport Networks and Routes. In W. H. K. Lam & M. G. H. Bell
(Eds.), Advanced Modeling for Transit Operations and Service Planning (pp. 59-91): Pergamon
Imprint/Elsevier Science Ltd.

Bus Network Design Problem: a review of approaches and solutions
61
Ceder, A. (2002b). Public Transport Timetabling and Vehicle Scheduling. In W. H. K. Lam & M. G. H.
Bell (Eds.), Advanced Modeling for Transit Operations and Service Planning (pp. 30-57):
Pergamon Imprint/Elsevier Science Ltd.
Ceder, A. (2007). Public transit planning and operation. Amsterdam: Elsevier/Butterworth-Heinemann.
Ceder, A., Golany, B., & Tal, O. (2001). Creating bus timetables with maximal synchronization.
Transportation Research Part A: Policy and Practice, 35, 913-928. doi:10.1016/S0965-
8564(00)00032-X
Ceder, A., Hassold, S., & Dano, B. (2013). Approaching even-load and even-headway transit timetables
using different bus sizes. Public Transport, 5, 193-217. doi:10.1007/s12469-013-0062-z
Ceder, A., & Israeli, Y. (1998). User and Operator Perspectives in Transit Network Design.
Transportation Research Record, 3-7. doi:http://dx.doi.org/10.3141/1623-01
Ceder, A., & Wilson, N. H. M. (1986). Bus network design. Transportation Research Part B:
Methodological, 20, 331-344. doi:10.1016/0191-2615(86)90047-0
Cevallos, F., & Zhao, F. (2006). Minimizing transfer times in public transit network with genetic
algorithm. Transportation Research Record, 74-79. doi:10.3141/1971-11
Chai, S., & Liang, Q. (2020). An Improved NSGA-II Algorithm for Transit Network Design and
Frequency Setting Problem. Journal of Advanced Transportation, 2020.
doi:10.1155/2020/2895320
Chakroborty, P. (2003). Genetic algorithms for optimal urban transit network design. Computer-Aided
Civil and Infrastructure Engineering, 18, 184-200. doi:10.1111/1467-8667.00309
Chakroborty, P. (2004). Optimal Routing and Scheduling in Transportation : Using Genetic Algorithm
to Solve Difficult Optimization Problems. Directions-Indian Institute of technology kanpur.
Retrieved 4 May, 2020, from http://faculty.salisbury.edu/~ajlembo/419/networkpaper.pdf
Chakroborty, P., Deb, K., & Sharma, R. K. (2001). Optimal fleet size distribution and scheduling of
transit systems using genetic algorithms. Transportation Planning and Technology, 24, 209-
225. doi:10.1080/03081060108717668
Chakroborty, P., Deb, K., & Subrahmanyam, P. S. (1995). Optimal scheduling of urban transit systems
using genetic algorithms. Journal of Transportation Engineering, 121, 544-553.
doi:10.1061/(ASCE)0733-947X(1995)121:6(544)
Chakroborty, P., & Wivedi, T. (2002). Optimal route network design for transit systems using genetic
algorithms. Engineering Optimization, 34, 83-100. doi:10.1080/03052150210909
Chang, S. K., & Schonfeld, P. M. (1993). Optimal Dimensions of Bus Service Zones. Journal of
Transportation Engineering, 119, 567-585.
Chang, S. K., & Schonfeld, P. M. (1993). Welfare Maximization With Financial Constraints for Bus
Transit Systems. Transportation Research Record, 48-57.
Chang, S. K., & Schonfield, P. M. (1991). Multiple period optimization of bus transit systems.
Transportation Research Part B: Methodological, 25, 453-478. doi:10.1016/0191-
2615(91)90038-K
Chao, H. (2017). Study transit network design for Rivera of Uruguay. Journal of Interdisciplinary
Mathematics, 20, 1655-1659. doi:10.1080/09720502.2016.1240929
Chen, A., & Yang, C. (2004). Stochastic transportation network design problem with spatial equity
constraint. Transportation Research Record, 97-104. doi:10.3141/1882-12
Chew, J. S. C., Lee, L. S., & Seow, H. V. (2013). Genetic algorithm for biobjective urban transit routing
problem. Journal of Applied Mathematics, 2013. doi:10.1155/2013/698645
Chien, S., Dimitrijevic, B., & Spasovic, L. (2003). Optimization of Bus Route Planning in Urban
Commuter Networks. Journal of Public Transportation, 6, 53-79. doi:10.5038/2375-0901.6.1.4
Chien, S., & Schonfeld, P. (1997). Optimization of grid transit system in heterogeneous urban
environment. Journal of Transportation Engineering, 123, 28-35. doi:10.1061/(ASCE)0733-
947X(1997)123:1(28)
Chien, S., Yang, Z., & Hou, E. (2001). Genetic Algorithm Approach for Transit Route Planning and
Design. Journal of Transportation Engineering, 127, 200-207.
Chien, S. I. J., & Spasovic, L. N. (2002). Optimization of grid bus transit systems with elastic demand.
Journal of Advanced Transportation, 36, 63-91. doi:10.1002/atr.5670360105

Bus Network Design Problem: a review of approaches and solutions
62
Chiou, S. W. (2005). Bilevel programming for the continuous transport network design problem.
Transportation Research Part B: Methodological, 39, 361-383. doi:10.1016/j.trb.2004.05.001
Chowdhury, S. M., & Chien, S. I.-j. (2002). Intermodal Transit System Coordination. Transportation
Planning and Technology, 25, 257-287.
Chua, T. A. (1984). The planning of urban bus routes and frequencies: A survey. Transportation, 12,
147-172. doi:10.1007/BF00167373
Chuang, J. P. C. (2017). Study for transportation system of urban area of Rome. Journal of
Interdisciplinary Mathematics, 20, 1625-1630. doi:10.1080/09720502.2016.1188465
Cipriani, E., Fusco, G., Gori, S., & Petrelli, M. (2004). A procedure for the solution of the urban bus
network design problem with elastic demand. Retrieved 10 March, 2020, from
file:///C:/Users/35191/Downloads/A_procedure_for_the_solution_of_the_urba.pdf.
Cipriani, E., Fusco, G., Patella, S. M., Petrelli, M., & Quadrifoglio, L. (2019). Transit network design
for small-medium size cities. Transportation Planning and Technology, 42, 84-97.
doi:10.1080/03081060.2018.1541284
Cipriani, E., Gori, S., & Petrelli, M. (2012). Transit network design: A procedure and an application to
a large urban area. Transportation Research Part C: Emerging Technologies, 20, 3-14.
doi:10.1016/j.trc.2010.09.003
Clarens, G. C., & Hurdle, V. F. (1975). Operating Strategy for a Commuter Bus System. Transportation
Science, 9, 1-20. doi:10.1287/trsc.9.1.1
Constantin, I., & Florian, M. (1995). Optimizing Frequencies in a Transit Network: a Nonlinear Bi-level
Programming Approach. International Transactions in Operational Research, 2, 149-164.
doi:10.1111/j.1475-3995.1995.tb00011.x
Cooper, I. M., John, M. P., Lewis, R., Mumford, C. L., & Olden, A. (2014). Optimising large scale
public transport network design problems using mixed-mode parallel multi-objective
evolutionary algorithms. Paper presented at the Proceedings of the 2014 IEEE Congress on
Evolutionary Computation, CEC 2014.
Curtin, K. M., & Biba, S. (2011). The Transit Route Arc-Node Service Maximization problem.
European Journal of Operational Research, 208, 46-56. doi:10.1016/j.ejor.2010.07.026
Daduna, J. R., & Voss, S. (1995). Practical Experiences in Schedule Synchronization. In J. R. Daduna,
I. Branco, & J. M. P. Paixão (Eds.), Computer-Aided Transit Scheduling: Proceedings of the
Sixth International Workshop on Computer-Aided Scheduling of Public Transport (pp. 39-55):
Springer.
Daganzo, C. F. (2010). Structure of competitive transit networks. Transportation Research Part B:
Methodological, 44, 434-446. doi:10.1016/j.trb.2009.11.001
Dai, Z., Liu, X. C., Chen, Z., Guo, R., & Ma, X. (2019). A predictive headway-based bus-holding
strategy with dynamic control point selection: A cooperative game theory approach.
Transportation Research Part B: Methodological, 125, 29-51. doi:10.1016/J.TRB.2019.05.001
Dargay, J., Gately, D., & Sommer, M. (2007). Vehicle Ownership and Income Growth, Worldwide:
1960-2030. The Energy Journal, 28(4), 143-170.
de Matta, R., & Peters, E. (2009). Developing work schedules for an inter-city transit system with
multiple driver types and fleet types. European Journal of Operational Research, 192, 852-865.
doi:10.1016/j.ejor.2007.09.045
De Palma, A., & Lindsey, R. (2001). Optimal timetables for public transportation. Transportation
Research Part B: Methodological, 35, 789-813. doi:10.1016/S0191-2615(00)00023-0
dell'Olio, L., Ibeas, A., & Ruisánchez, F. (2012). Optimizing bus-size and headway in transit networks.
Transportation, 39, 449-464. doi:10.1007/s11116-011-9332-2
Domschke, W. (1989). Schedule synchronization for public transit networks. OR Spektrum, 11, 17-24.
doi:10.1007/BF01721163
Dubois, D., Bel, G., & Llibre, M. (1979). A set of methods in transportation network synthesis and
analysis. Journal of the Operational Research Society, 30, 797-808. doi:10.1057/jors.1979.190
Duran-Micco, J., Vermeir, E., & Vansteenwegen, P. (2020). Considering emissions in the transit
network design and frequency setting problem with a heterogeneous fleet. European Journal of
Operational Research, 282, 580-592. doi:10.1016/J.EJOR.2019.09.050

Bus Network Design Problem: a review of approaches and solutions
63
Duran, J., Pradenas, L., & Parada, V. (2019). Transit network design with pollution minimization. Public
Transport, 11, 189-210. doi:10.1007/s12469-019-00200-5
El-Hifnawi, M. B. (2002). Cross-town bus routes as a solution for decentralized travel: A cost-benefit
analysis for Monterrey, Mexico. Transportation Research Part A: Policy and Practice, 36, 127-
144. doi:10.1016/S0965-8564(00)00040-9
Eranki, A. (2004). A Model to Create Bus Timetables to Attain Maximum Synchronization Considering
Waiting Times at Transfer Stops. (Graduate Thesis), University of South Florida.
Estrada, M., Roca-Riu, M., Badia, H., Robusté, F., & Daganzo, C. F. (2011). Design and implementation
of efficient transit networks: Procedure, case study and validity test. Transportation Research
Part A: Policy and Practice, 45, 935-950. doi:10.1016/j.tra.2011.04.006
Fan, L., & Mumford, C. L. (2010). A metaheuristic approach to the urban transit routing problem.
Journal of Heuristics, 16, 353-372. doi:10.1007/s10732-008-9089-8
Fan, W., & Machemehl, R. B. (2004). Optimal Transit Route Network Design Problem: Algorithms,
Implementations, and Numerical Results. (PhD Thesis), University of Texas.
Fan, W., & Machemehl, R. B. (2006a). Optimal transit route network design problem with variable
transit demand: Genetic algorithm approach. Journal of Transportation Engineering, 132, 40-
51. doi:10.1061/(ASCE)0733-947X(2006)132:1(40)
Fan, W., & Machemehl, R. B. (2006b). Using a simulated annealing algorithm to solve the transit route
network design problem. Journal of Transportation Engineering, 132, 122-132.
doi:10.1061/(ASCE)0733-947X(2006)132:2(122)
Fan, W., & Machemehl, R. B. (2008). Tabu search strategies for the public transportation network
optimizations with variable transit demand. Computer-Aided Civil and Infrastructure
Engineering, 23, 502-520. doi:10.1111/j.1467-8667.2008.00556.x
Fan, W., & MacHemehl, R. B. (2011). Bi-level optimization model for public transportation network
redesign problem: Accounting for equity issues. Transportation Research Record, 151-162.
doi:10.3141/2263-17
Farahani, R. Z., Miandoabchi, E., Szeto, W. Y., & Rashidi, H. (2013). A review of urban transportation
network design problems. European Journal of Operational Research, 229, 281-302.
doi:10.1016/j.ejor.2013.01.001
Feng, X., Zhu, X., Qian, X., Jie, Y., Ma, F., & Niu, X. (2019). A new transit network design study in
consideration of transfer time composition. Transportation Research Part D: Transport and
Environment, 66, 85-94. doi:10.1016/j.trd.2018.03.019
Fernández, J. E., de Cea, J., & Malbran, R. H. (2008). Demand responsive urban public transport system
design: Methodology and application. Transportation Research Part A: Policy and Practice,
42, 951-972. doi:10.1016/j.tra.2007.12.008
Fleurent, C., Lessard, R., & Séguin, L. (2004). Transit Timetable Synchronization : Evaluation and
Optimization, 1-8. Retrieved 27 April, 2020, from
https://www.researchgate.net/profile/Charles_Fleurent/publication/248584397_Transit_Timet
able_Synchronization_Evaluation_and_Optimization/links/0046353875f4f7e5ea000000.pdf
Florida Department of Transportation Research Center. (2009). Best Practices in Transit Service
Planning. Retrieved 15 March, 2020, from https://www.nctr.usf.edu/pdf/77720.pdf:
Fouilhoux, P., Ibarra-Rojas, O. J., Kedad-Sidhoum, S., & Rios-Solis, Y. A. (2016). Valid inequalities
for the synchronization bus timetabling problem. European Journal of Operational Research,
251, 442-450. doi:10.1016/j.ejor.2015.12.006
Furth, P. G., & Rahbee, A. B. (2000). Dynamic Programming and Geographic Modeling. Transportation
Research Record: Journal of the Transportation, 00-0870, 15-22.
Furth, P. G., & Wilson, N. H. M. (1981). Setting Frequencies on Bus Routes: Theory and Practice.
Transportation Research Record, 1-7.
Fusco, G., Gori, S., & Petrelli, M. (2002). A heuristic transit network design algorithm for medium size
towns. Paper presented at the 9th Euro Working Group on Transportation.
Gao, Z., Sun, H., & Shan, L. L. (2004). A continuous equilibrium network design model and algorithm
for transit systems. Transportation Research Part B: Methodological, 38, 235-250.
doi:10.1016/S0191-2615(03)00011-0

Bus Network Design Problem: a review of approaches and solutions
64
Griswold, J. B., Sztainer, T., Lee, J., Madanat, S., & Horvath, A. (2017). Optimizing urban bus transit
network design can lead to greenhouse gas emissions reduction. Frontiers in Built Environment,
3, 1-7. doi:10.3389/fbuil.2017.00005
Guan, J. F., Yang, H., & Wirasinghe, S. C. (2006). Simultaneous optimization of transit line
configuration and passenger line assignment. Transportation Research Part B: Methodological,
40, 885-902. doi:10.1016/j.trb.2005.12.003
Guihaire, V., & Hao, J. K. (2008). Transit network design and scheduling: A global review.
Transportation Research Part A: Policy and Practice, 42, 1251-1273.
doi:10.1016/j.tra.2008.03.011
Guihaire, V., & Hao, J. K. (2010a). Improving timetable quality in scheduled transit networks. In G.-P.
N., H. F., F. C., & A. M. Benítez J.M. (Eds.), Lecture Notes in Computer Science (Vol. 6096
LNAI, pp. 21-30). Berlin, Heidelberg: Springer.
Guihaire, V., & Hao, J. K. (2010b). Transit network timetabling and vehicle assignment for regulating
authorities. Computers and Industrial Engineering, 59, 16-23. doi:10.1016/j.cie.2010.02.005
Hadas, Y., & Shnaiderman, M. (2012). Public-transit frequency setting using minimum-cost approach
with stochastic demand and travel time. Transportation Research Part B: Methodological, 46,
1068-1084. doi:10.1016/j.trb.2012.02.010
Han, A. F., & Wilson, N. H. M. (1982). The allocation of buses in heavily utilized networks with
overlapping routes. Transportation Research Part B, 16, 221-232. doi:10.1016/0191-
2615(82)90025-X
Hassold, S., & Ceder, A. (2012). Multiobjective approach to creating bus timetables with multiple
vehicle types. Transportation Research Record, 2276 (1), 56-62. doi:10.3141/2276-07
Hu, J., Shu, X., Song, J., & Xu, Y. (2005). Optimal Design for Urban Mass Transit Network Based on
Evolutionary Algorithms BT - Advances in Natural Computation. Advances in Natural
Computation, 3611, 1089-1100. doi:10.1007/11539117_148
Huang, Z., Ren, G., & Liu, H. (2013). Optimizing bus frequencies under uncertain demand: Case study
of the transit network in a developing city. Mathematical Problems in Engineering, 2013, 10
pages. doi:10.1155/2013/375084
Hurdle, V. F. (1973). Minimum Cost Locations for Parallel Public Transit Lines. Transportation
Science, 7, 340-350. doi:10.1287/trsc.7.4.340
Ibarra-Rojas, O. J., Delgado, F., Giesen, R., & Muñoz, J. C. (2015). Planning, operation, and control of
bus transport systems: A literature review. Transportation Research Part B: Methodological,
77, 38-75. doi:10.1016/J.TRB.2015.03.002
Ibarra-Rojas, O. J., & Rios-Solis, Y. A. (2012). Synchronization of bus timetabling. Transportation
Research Part B: Methodological, 46, 599-614. doi:10.1016/j.trb.2012.01.006
Ibeas, A., Alonso, B., Dell'Olio, L., & Moura, J. L. (2014). Bus size and headways optimization model
considering elastic demand. Journal of Transportation Engineering, 140, 1-9.
doi:10.1061/(ASCE)TE.1943-5436.0000641
Imam, M. O. (1998). Optimal Design of Public Bus Service with Demand Equilibrium. Journal of
Transportation Engineering, 124, 431-436.
Islam, K. A., Moosa, I. M., Mobin, J., Nayeem, M. A., & Rahman, M. S. (2019). A heuristic aided
Stochastic Beam Search algorithm for solving the transit network design problem. Swarm and
Evolutionary Computation, 46, 154-170. doi:10.1016/j.swevo.2019.02.007
Jansen, L. N., Pedersen, M. B., & Nielsen, O. A. (2002, December 14). Minimizing Passenger Transfer
Times in Public Transport Timetables. Paper presented at the Seventh Conference of the Hong
Kong Society for Transportation Studies, Hong Kong.
Jha, S. B., Jha, J. K., & Tiwari, M. K. (2019). A multi-objective meta-heuristic approach for transit
network design and frequency setting problem in a bus transit system. Computers and Industrial
Engineering, 130, 166-186. doi:10.1016/j.cie.2019.02.025
Jiang, Y., Szeto, W., & Ng, T. (2013). Transit Network Design: a Hybrid Enhanced Artificial Bee
Colony Approach and a Case Study. International Journal of Transportation Science and
Technology, 2, 243-260. doi:10.1260/2046-0430.2.3.243

Bus Network Design Problem: a review of approaches and solutions
65
Kepaptsoglou, K., & Karlaftis, M. (2009). Transit route network design problem: Review. Journal of
Transportation Engineering, 135, 491-505. doi:10.1061/(ASCE)0733-947X(2009)135:8(491)
Kermanshahi, S., Shafahi, Y., & Bagherian, M. (2013). Application of a new rapid transit network
design model to bus rapid transit network design: Case study Isfahan Metropolitan Area.
Transport, 30, 93-102. doi:10.3846/16484142.2013.816772
Kiliç, F., & Gök, M. (2014). A demand based route generation algorithm for public transit network
design. Computers and Operations Research, 51, 21-29. doi:10.1016/j.cor.2014.05.001
Kim, M. E., & Schonfeld, P. (2014). Integration of conventional and flexible bus services with timed
transfers. Transportation Research Part B: Methodological, 68, 76-97.
doi:10.1016/j.trb.2014.05.017
Klemt, W.-D., & Stemme, W. (1987). Schedule Synchronization for Public Transit Networks. In J. R.
Daduna & A. Wren (Eds.), Computer-Aided Transit Scheduling: Proceedings of the Fourth
International Workshop on Computer-Aided Scheduling of Public Transport (pp. 327-335):
Springer-Verlag.
Klier, M. J., & Haase, K. (2015). Urban public transit network optimization with flexible demand. OR
Spectrum, 37, 195-215. doi:10.1007/s00291-014-0377-4
Klumpenhouwer, W., & Wirasinghe, S. C. (2018). Optimal time point configuration of a bus route - A
Markovian approach. Transportation Research Part B: Methodological, 117, 209-227.
doi:10.1016/J.TRB.2018.08.021
Kocur, G., & Hendrickson, C. (1982). Design of Local Bus Service With Demand Equilibration.
Transportation Science, 16, 149-170. doi:10.1287/trsc.16.2.149
Krylatov, A. Y., & Shirokolobova, A. P. (2018). Evolutionary optimization of the public transit network.
ACM International Conference Proceeding Series, 29-34. doi:10.1145/3274856.3274863
Kuo, Y. (2013). Design method using hybrid of line-type and circular-type routes for transit network
system optimization. TOP, 22, 600-613. doi:10.1007/s11750-013-0273-0
Kwan, C. M., & Chang, C. S. (2008). Timetable synchronization of mass rapid transit system using
multiobjective evolutionary approach. IEEE Transactions on Systems, Man and Cybernetics
Part C: Applications and Reviews, 38, 636-648. doi:10.1109/TSMCC.2008.923872
Lampkin, W., & Saalmans, P. D. (1967). The Design of Routes, Service Frequencies, and Schedules for
a Municipal Bus Undertaking: A Case Study. Operational Research Quarterly, 18, 375-397.
LeBlanc, L. J. (1988). Transit system network design. Transportation Research Part B, 22, 383-390.
doi:10.1016/0191-2615(88)90042-2
Lee, Y. J., & Vuchic, V. R. (2005). Transit network design with variable demand. Journal of
Transportation Engineering, 131, 1-10. doi:10.1061/(ASCE)0733-947X(2005)131:1(1)
Leich, G., & Nagel, K. (2019). Improving speed and realism of an evolutionary minibus network design
process. Procedia Computer Science, 151, 834-839. doi:10.1016/j.procs.2019.04.114
Li, Y., Xu, W., & He, S. (2013). Expected value model for optimizing the multiple bus headways.
Applied Mathematics and Computation, 219, 5849-5861. doi:10.1016/j.amc.2012.11.098
Liang, J., Wu, J., Gao, Z., Sun, H., Yang, X., & Lo, H. K. (2019). Bus transit network design with
uncertainties on the basis of a metro network: A two-step model framework. Transportation
Research Part B: Methodological, 126, 115-138. doi:10.1016/J.TRB.2019.05.011
Liebchen, C., & Stiller, S. (2009). Delay resistant timetabling. Public Transport, 1, 55-72.
doi:10.1007/s12469-008-0004-3
Liu, T., & Ceder, A. (2018). Integrated public transport timetable synchronization and vehicle
scheduling with demand assignment: A bi-objective bi-level model using deficit function
approach. Transportation Research Part B: Methodological, 117, 935-955.
doi:10.1016/J.TRB.2017.08.024
Liu, Z., Shen, J., Wang, H., & Yang, W. (2007). Regional Bus Timetabling Model with Synchronization.
Journal of Transportation Systems Engineering and Information Technology, 7, 109-112.
doi:10.1016/S1570-6672(07)60018-X
Loh, K., & Xiang, Z. (2014). Factors Influencing Bus Network Design. (Master's Thesis), Massachusetts
Institute of Technology.

Bus Network Design Problem: a review of approaches and solutions
66
Lownes, N. E., & Machemehl, R. B. (2010). Exact and heuristic methods for public transit circulator
design. Transportation Research Part B: Methodological, 44, 309-318.
doi:10.1016/j.trb.2009.07.010
Mandl, C. E. (1980). Evaluation and optimization of urban public transportation networks. European
Journal of Operational Research, 5, 396-404. doi:10.1016/0377-2217(80)90126-5
Marín, Á., & Jaramillo, P. (2008). Urban rapid transit network capacity expansion. European Journal
of Operational Research, 191, 45-60. doi:10.1016/j.ejor.2007.08.010
Martínez, H., Mauttone, A., & Urquhart, M. E. (2014). Frequency optimization in public transportation
systems: Formulation and metaheuristic approach. European Journal of Operational Research,
236, 27-36. doi:10.1016/j.ejor.2013.11.007
Martynova, Y. A., Martynov, Y. A., Mustafina, D. B., & Asmolovskiy, V. V. (2014, October 16-18).
Ant colony algorithm for rational transit network design of urban passenger transport. Paper
presented at the International Conference on Mechanical Engineering, Automation and Control
Systems, MEACS 2014. Tomsk, Russia.
Marwah, B. R., Umrigar, F. S., & Patnaik, S. B. (1984). Optimal Design of Bus Routes and Frequencies
for Ahmedabad. Transportation Research Record, 41-47.
Matisziw, T. C., Murray, A. T., & Kim, C. (2006). Strategic route extension in transit networks.
European Journal of Operational Research, 171, 661-673. doi:10.1016/j.ejor.2004.09.029
Mauttone, A., & Urquhart, M. E. (2009). A route set construction algorithm for the transit network
design problem. Computers and Operations Research, 36, 2440-2449.
doi:10.1016/j.cor.2008.09.014
Medina, M., Giesen, R., & Muñoz, J. (2013). Model for the optimal location of bus stops and its
application to a public transport corridor in Santiago, Chile. Transportation Research Record,
84-93. doi:10.3141/2352-10
Mesa, J. A., Ortega, F. A., & Pozo, M. A. (2014). Locating optimal timetables and vehicle schedules in
a transit line. Annals of Operations Research, 222, 439-455. doi:10.1007/s10479-013-1393-5
Meyer, M. D. (2016). Transportation Planning Handbook (4 ed.). Hoboken, New Jersey: John Wiley &
Sons.
Mohaymany, A. S., & Amiripour, S. M. M. (2009). Creating Bus Timetables Under Stochastic Demand.
International Journal of Industrial Engineering & Production Research, 20, 83-91.
Morlok, E. K., & Viton, P. A. (1984). Feasibility of profitable transit service in radial urban corridors.
Transportation Research Record, 46-54.
Murray, A. T. (2003). A Coverage Model for Improving Public Transit System Accessibility and
Expanding Access. Annals of Operations Research, 123, 143-156.
doi:10.1023/A:1026123329433
Nayeem, M. A., Islam, M. M., & Yao, X. (2019). Solving Transit Network Design Problem Using
Many-Objective Evolutionary Approach. IEEE Transactions on Intelligent Transportation
Systems, 20, 3952-3963. doi:10.1109/TITS.2018.2883511
Nayeem, M. A., Rahman, M. K., & Rahman, M. S. (2014). Transit network design by genetic algorithm
with elitism. Transportation Research Part C: Emerging Technologies, 46, 30-45.
doi:10.1016/j.trc.2014.05.002
Newell, G. F. (1971). Dispatching Policies for a Transportation Route. Transportation Science, 5, 91-
105. doi:10.1287/trsc.5.1.91
Newell, G. F. (1979). Some Issues Relating to the Optimal Design of Bus Routes. Transportation
Science, 13, 20-35.
Ngamchai, S., & Lovell, D. J. (2003). Optimal time transfer in bus transit route network design using a
genetic algorithm. Journal of Transportation Engineering, 129, 510-521.
doi:10.1061/(ASCE)0733-947X(2003)129:5(510)
Nikolić, M., & Teodorović, D. (2013). Transit network design by Bee Colony Optimization. Expert
Systems with Applications, 40, 5945-5955. doi:10.1016/j.eswa.2013.05.002
Nikolić, M., & Teodorović, D. (2014). A simultaneous transit network design and frequency setting:
Computing with bees. Expert Systems with Applications, 41, 7200-7209.
doi:10.1016/j.eswa.2014.05.034

Bus Network Design Problem: a review of approaches and solutions
67
Nnene, O. A., Joubert, J. W., & Zuidgeest, M. H. P. (2019). Transit network design with meta-heuristic
algorithms and agent based simulation. IFAC-PapersOnLine, 52, 13-18.
doi:10.1016/j.ifacol.2019.06.003
Oliker, N., & Bekhor, S. (2020). An infeasible start heuristic for the transit route network design
problem. Transportmetrica A: Transport Science, 16, 388-408.
doi:10.1080/23249935.2020.1719551
Ouyang, Y., Nourbakhsh, S. M., & Cassidy, M. J. (2014). Continuum approximation approach to bus
network design under spatially heterogeneous demand. Transportation Research Part B:
Methodological, 68, 333-344. doi:10.1016/j.trb.2014.05.018
Owais, M., & Osman, M. K. (2018). Complete hierarchical multi-objective genetic algorithm for transit
network design problem. Expert Systems with Applications, 114, 143-154.
doi:10.1016/j.eswa.2018.07.033
Pacheco, J., Alvarez, A., Casado, S., & González-Velarde, J. L. (2009). A tabu search approach to an
urban transport problem in northern Spain. Computers and Operations Research, 36, 967-979.
doi:10.1016/j.cor.2007.12.002
Palmatier, R. W., Houston, M. B., & Hulland, J. (2018). Review articles: purpose, process, and structure.
Journal of the Academy of Marketing Science, 46, 1-5. doi:10.1007/s11747-017-0563-4
Park, S. J. (2005). Bus network scheduling with genetic algorithms and simulation. (Master of Science
Thesis), University of Maryland.
Parkany, E., Gallagher, R., & Viveiros, P. (2004). Are Attitudes Important in Travel Choice?
Transportation Research Record, 1894(1), 127-139. doi:10.3141/1894-14
Pattnaik, B. S. B., Mohan, S., & Tom, V. M. (1998). Urban Bus Transit Route Network Design Using
Genetic Algorithm. Journal of Transportation Engineering, 124, 368-375.
Petrelli, M. (2004). A transit network design model for urban areas. WIT Transactions on the Built
Environment, 75, 163-172.
Pternea, M., Kepaptsoglou, K., & Karlaftis, M. G. (2015). Sustainable urban transit network design.
Transportation Research Part A: Policy and Practice, 77, 276-291.
doi:10.1016/j.tra.2015.04.024
Quak, C. B. (2003). Bus line planning. (Master Thesis), Delft University of Technology.
Ranjbari, A., Hickman, M., & Chiu, Y. C. (2020). A network design problem formulation and solution
procedure for intercity transit services. Transportmetrica A: Transport Science, 16, 1156-1175.
doi:10.1080/23249935.2020.1719547
Rapp, M. H., & Gehner, C. D. (1976). Transfer optimization in an interactive graphic system for transit
planning. Transportation Research Record: Journal of the Transportation Research Board,
619, 27-33.
Ravindran, V., & Shankar, S. (2015). Systematic reviews and meta-analysis demystified. Indian Journal
of Rheumatology, 10, 89-94. doi:10.1016/j.injr.2015.04.003
Razak, S. Y. (2013). Classical modernist planning and the menace of automobile dependence in cities:
the case of Abuja, Nigeria. In C. A. Brebbia (Ed.), Urban Transport XIX (pp. 317-328). UK:
Wessex Institute of Technology Press.
Rea, J. C. (1972). Designoing Urban Transit Systems: An Approach to the Route-Technology Selection
Problem. Transportation Research Board, 48-59.
Roca-Riu, M., Estrada, M., & Trapote, C. (2012). The design of interurban bus networks in city centers.
Transportation Research Part A: Policy and Practice, 46, 1153-1165.
doi:10.1016/j.tra.2012.05.011
Saleeshya, P. G., & Anirudh, S. (2015). A bi-level approach to frequency optimisation of public
transport systems. International Journal of Business Innovation and Research, 9, 608-630.
doi:10.1504/IJBIR.2015.071598
Salzborn, F. J. M. (1972). Optimal Bus Scheduling. Transportation Science, 6, 137-148. doi:10.1007/0-
306-48058-1_1
Salzborn, F. J. M. (1980). Scheduling Bus Systems with Interchanges. Transportation Science, 14, 211-
231. doi:10.1287/trsc.1090.0306

Bus Network Design Problem: a review of approaches and solutions
68
Schéele, S. (1980). A supply model for public transit services. Transportation Research Part B, 14, 133-
146. doi:10.1016/0191-2615(80)90039-9
Schmid, V. (2014). Hybrid large neighborhood search for the bus rapid transit route design problem.
European Journal of Operational Research, 238, 427-437. doi:10.1016/j.ejor.2014.04.005
Schöbel, A. (2012). Line planning in public transportation: Models and methods. OR Spectrum, 34, 491-
510. doi:10.1007/s00291-011-0251-6
Schröder, M., & Solchenbach, I. (2006). Optimization of Transfer Quality in Regional Public Transit.
Fraunhofer-Institut für Techno-und Wirtschaftsmathematik, Fraunhofer (ITWM), 84, 1-16.
Shafahi, A., Wang, Z., & Haghani, A. (2018). SpeedRoute: Fast, efficient solutions for school bus
routing problems. Transportation Research Part B: Methodological, 117, 473-493.
doi:10.1016/J.TRB.2018.09.004
Shi, H., & Gao, M. (2020). Analysis of a Flexible Transit Network in a Radial Street Pattern. Journal of
Advanced Transportation, 2020. doi:10.1155/2020/5379218
Shih, M.-C., & Mahmassani, H. S. (1996). A design methodology for bus transit route networks with
coordinated operations. Transportation Research Part A: Policy and Practice, 30, 68.
doi:10.1016/0965-8564(96)81137-2
Shih, M. C., Mahmassani, H. S., & Baaj, M. H. (1998). Planning and design model for transit route
networks with coordinated operations. Transportation Research Record, 1623(1), 16-23.
doi:10.3141/1623-03
Shrivastava, P., & Dhingra, S. L. (2002). Development of coordinated schedules using genetic
algorithms. Journal of Transportation Engineering, 128, 89-96. doi:10.1061/(ASCE)0733-
947X(2002)128:1(89)
Shrivastava, P., Dhingra, S. L., & Gundaliya, P. J. (2002). Application of genetic algorithm for
scheduling and schedule coordination problems. Journal of Advanced Transportation, 36, 23-
41. doi:10.1002/atr.5670360103
Silmam, L., Barzily, Z., & Passy, U. (1974). Planning the route system for urban buses. Computers &
Operations Research, 1, 201-211.
Site, P. D., & Filippi, F. (2001). Bus service optimisation with fuel saving objective and various financial
constraints. Transportation Research Part A: Policy and Practice, 35, 157-176.
doi:10.1016/S0965-8564(99)00053-1
Sivakumaran, K., Li, Y., Cassidy, M. J., & Madanat, S. (2012). Cost-saving properties of schedule
coordination in a simple trunk-and-feeder transit system. Transportation Research Part A:
Policy and Practice, 46, 131-139. doi:10.1016/j.tra.2011.09.013
Snyder, H. (2019). Literature review as a research methodology: An overview and guidelines. Journal
of Business Research, 104, 333-339. doi:10.1016/j.jbusres.2019.07.039
Soehodho, S., & Nahry. (2000). Optimal scheduling of public transport fleet at network level. Journal
of Advanced Transportation, 34, 297-323. doi:10.1002/atr.5670340207
Song, L., Chen, F., Xian, K., & Sun, M. (2012). Research on a Scientific Approach for Bus and Metro
Networks Integration. Procedia - Social and Behavioral Sciences, 43, 740-747.
doi:10.1016/j.sbspro.2012.04.147
Spasovic, L., Boile, M., & Bladikas, A. (1994). Bus transit service coverage for maximum profit and
social welfare. Transportation Research Board, 1451, 12-22.
Spasovic, L. N., & Schonfeld, P. M. (1993). Method for optimizing transit service coverage.
Transportation Research Record, 1402, 28-39.
Sun, S., & Szeto, W. Y. (2019). Optimal sectional fare and frequency settings for transit networks with
elastic demand. Transportation Research Part B: Methodological, 127, 147-177.
doi:10.1016/J.TRB.2019.06.011
Sun, Y., Sun, X., Li, B., & Gao, D. (2013). Joint Optimization of a Rail Transit Route and Bus Routes
in a Transit Corridor. Procedia - Social and Behavioral Sciences, 96, 1218-1226.
doi:10.1016/j.sbspro.2013.08.139
Szeto, W., & Jiang, Y. (2012). Hybrid artificial bee colony algorithm for transit network design.
Transportation Research Record, 2284, 47-56. doi:10.3141/2284-06

Bus Network Design Problem: a review of approaches and solutions
69
Szeto, W. Y., & Jiang, Y. (2014). Transit route and frequency design: Bi-level modeling and hybrid
artificial bee colony algorithm approach. Transportation Research Part B: Methodological, 67,
235-263. doi:10.1016/j.trb.2014.05.008
Szeto, W. Y., & Wu, Y. (2011). A simultaneous bus route design and frequency setting problem for Tin
Shui Wai, Hong Kong. European Journal of Operational Research, 209, 141-155.
doi:10.1016/j.ejor.2010.08.020
Tilahun, S. L., & Ong, H. C. (2012). Bus timetabling as a fuzzy multiobjective optimization problem
using preference-based genetic algorithm. Promet - Traffic - Traffico, 24, 183-191.
doi:10.7307/ptt.v24i3.311
Tirachini, A., Hensher, D. A., & Rose, J. M. (2014). Multimodal pricing and optimal design of urban
public transport: The interplay between traffic congestion and bus crowding. Transportation
Research Part B: Methodological, 61, 33-54. doi:10.1016/j.trb.2014.01.003
Tom, V. M., & Mohan, S. (2003). Transit Route Network Design Using Frequency Coded Genetic
Algorithm. Journal of Transportation Engineering, 129, 186-195. doi:10.1061/(ASCE)0887-
3801(2004)18:3(248)
Torabi, M., & Salari, M. (2019). Limited-stop bus service: A strategy to reduce the unused capacity of
a transit network. Swarm and Evolutionary Computation, 44, 972-986.
doi:10.1016/j.swevo.2018.10.009
Toronto, C. E., & Remington, R. (2020). A Step-by-Step Guide to Conducting an Integrative Review:
Springer.
Tranfield, D., Denyer, D., Smart, P., Goodhue, D., & Thompson, R. (1995). Towards a methodology for
developing evidence-informed management knowledge by means of systematic review. MIS
Quarterly, 14, 207-222. doi:10.2307/249689
Transport for London. (2012). Transport for London - Guidelines for planning bus services. Retrieved
17 March, 2020, from http://content.tfl.gov.uk/bus-service-planning-guidelines.pdf:
Tribby, C. P., & Zandbergen, P. A. (2012). High-resolution spatio-temporal modeling of public transit
accessibility. Applied Geography, 34, 345-355. doi:10.1016/j.apgeog.2011.12.008
Tsao, S.-m., & Schonfeld, P. (1983). Optimization of Zonal Transit Service. Journal of Transportation
Engineering, 109, 257-272.
Tu, W. Y., Ma, J. H., Guan, W., & Chen, X. J. (2014). The study of bus transit network design methods
for different sized cities. Advanced Materials Research, 989-994, 5624-5629.
doi:10.4028/www.scientific.net/AMR.989-994.5624
Van Nes, R. (2003). Multiuser-class urban transit network design. Transportation Research Record, 25-
33. doi:10.3141/1835-04
van Nes, R., Hamerslag, R., & Immers, B. H. (1988). Design of public transport networks.
Transportation Research Record, 74-83. doi:10.1002/etc.175
Van Oudheusden, D. L., Ranjithan, S., & Singh, K. N. (1987). The design of bus route systems - An
interactive location-allocation approach. Transportation, 14, 253-270.
doi:10.1007/BF00837532
Vaughan, R. (1986). Optimum polar networks for an urban bus system with a many-to-many travel
demand. Transportation Research Part B, 20, 215-224. doi:10.1016/0191-2615(86)90018-4
Verbas, I., & Mahmassani, H. (2013). Optimal allocation of service frequencies over transit network
routes and time periods. Transportation Research Record, 50-59. doi:10.3141/2334-06
Verbas, İ. Ö., & Mahmassani, H. S. (2015). Integrated Frequency Allocation and User Assignment in
Multimodal Transit Networks. Transportation Research Record: Journal of the Transportation
Research Board, 2498, 37-45. doi:10.3141/2498-05
Verbas, Ö., Frei, C., Mahmassani, H. S., & Chan, R. (2014). Stretching resources: sensitivity of optimal
bus frequency allocation to stop-level demand elasticities. Public Transport, 7, 1-20.
doi:10.1007/s12469-013-0084-6
Volotskiy, T., Smirnov, J., Ziemke, D., & Kaddoura, I. (2018). An Accessibility Driven Evolutionary
Transit Network Design Approach in the Multi-agent Simulation Environment. Procedia
Computer Science, 136, 499-510. doi:10.1016/j.procs.2018.08.255

Bus Network Design Problem: a review of approaches and solutions
70
Wan, Q. K., & Lo, H. K. (2003). A Mixed Integer Formulation for Multiple-Route Transit Network
Design. Journal of Mathematical Modelling and Algorithms, 2, 299-308.
doi:10.1023/B:JMMA.0000020425.99217.cd
Wang, S., & Qu, X. (2015). Rural bus route design problem: Model development and case studies. KSCE
Journal of Civil Engineering, 19, 1892-1896. doi:10.1007/s12205-013-0579-3
Wijaya, S. E., & Imran, M. (2019). Moving the Masses: Bus-Rapid Transit (BRT) - Policies in Low
Income Asian Cities. Singapore: Springer.
Wirasinghe, S. C., & Vandebona, U. (2011). Route layout analysis for express buses. Transportation
Research Part C: Emerging Technologies, 19, 374-385. doi:10.1016/j.trc.2010.05.021
Wong, R. C. W., & Leung, J. M. Y. (2004). Timetable Synchronization for Mass Transit Railway
Systems. Retrieved 6 March, 2020, from
http://citeseerx.ist.psu.edu/viewdoc/download?doi=10.1.1.86.4904&rep=rep1&type=pdf
Wong, R. C. W., Yuen, T. W. Y., Fung, K. W., & Leung, J. M. Y. (2008). Optimizing timetable
synchronization for rail mass transit. Transportation Science, 42, 57-69.
doi:10.1287/trsc.1070.0200
Wu, J., Song, R., Wang, Y., Chen, F., & Li, S. (2015). Modeling the coordinated operation between bus
rapid transit and bus. Mathematical Problems in Engineering, 2015. doi:10.1155/2015/709389
Wu, L., Gu, W., Fan, W., & Cassidy, M. J. (2020). Optimal design of transit networks fed by shared
bikes. Transportation Research Part B: Methodological, 131, 63-83.
doi:10.1016/J.TRB.2019.11.003
Wu, W., Liu, R., Jin, W., & Ma, C. (2019). Stochastic bus schedule coordination considering demand
assignment and rerouting of passengers. Transportation Research Part B: Methodological, 121,
275-303. doi:10.1016/J.TRB.2019.01.010
Xiong, Y., & Schneider, J. B. (1992). Transportation Network Design Using a cumulative Genetic
Algorithm and Neural Network. Transportation Research Record, 1364, 37-44.
Yan, S., & Chen, H. L. (2002). A scheduling model and a solution algorithm for inter-city bus carriers.
Transportation Research Part A: Policy and Practice, 36, 805-825. doi:10.1016/S0965-
8564(01)00041-6
Yan, Y., Liu, Z., Meng, Q., & Jiang, Y. (2013). Robust optimization model of bus transit network design
with stochastic travel time. Journal of Transportation Engineering, 139, 625-634.
doi:10.1061/(ASCE)TE.1943-5436.0000536
Yang, Z., Yu, B., & Cheng, C. (2007). A parallel ant colony algorithm for bus network optimization.
Computer-Aided Civil and Infrastructure Engineering, 22, 44-55. doi:10.1111/j.1467-
8667.2006.00469.x
Yao, B., Hu, P., Lu, X., Gao, J., & Zhang, M. (2014). Transit network design based on travel time
reliability. Transportation Research Part C: Emerging Technologies, 43, 233-248.
doi:10.1016/j.trc.2013.12.005
Yoo, G. S., Kim, D. K., & Chon, K. S. (2010). Frequency design in urban transit networks with variable
demand: Model and algorithm. KSCE Journal of Civil Engineering, 14, 403-411.
doi:10.1007/s12205-010-0403-2
Yu, B., Cheng, C., Yang, Z., & Liu, C. (2005). Optimizing Bus Transit Network With Parallel Ant
Colony Algorithm. Proceedings of the Eastern Asia Society for Transportation Studies, 5, 374-
389.
Yu, B., & Yang, Z. (2006, August 13-16). Model and Algorithm for Iterative Design of Bus Network.
Paper presented at the Ninth International Conference on Applications of Advanced Technology
in Transportation (AATT). Chicago, Illinois, United States.
Yu, B., Yang, Z., & Yao, J. (2010). Genetic algorithm for bus frequency optimization. Journal of
Transportation Engineering, 136, 576-583. doi:10.1061/(ASCE)TE.1943-5436.0000119
Yu, B., Yang, Z. Z., Jin, P. H., Wu, S. H., & Yao, B. Z. (2012). Transit route network design-maximizing
direct and transfer demand density. Transportation Research Part C: Emerging Technologies,
22, 58-75. doi:10.1016/j.trc.2011.12.003

Bus Network Design Problem: a review of approaches and solutions
71
Zhang, G., Zhang, H., Li, L., & Dai, C. (2014). Agent-based simulation and optimization of Urban
transit system. IEEE Transactions on Intelligent Transportation Systems, 15, 589-596.
doi:10.1109/TITS.2013.2285228
Zhang, T., Ren, G., & Yang, Y. (2020). Transit route network design for low-mobility individuals using
a hybrid metaheuristic approach. Journal of Advanced Transportation, 2020, 12 pages.
doi:10.1155/2020/7059584
Zhao, F. (2006). Large-Scale Transit Network Optimization by Minimizing User Cost and Transfers.
Journal of Public Transportation, 9, 107-129. doi:10.5038/2375-0901.9.2.6
Zhao, F., & Gan, A. (2003). Optimization of Transit Network To Minimize Transfers. Transportation
Research Record: Journal of the Transportation Research Board, 1923, 180-188.
doi:10.1177/0361198105192300119
Zhao, F., & Ubaka, I. (2004). Transit Network Optimization - Minimizing Transfers and Optimizing
Route Directness. Journal of Public Transportation, 7, 63-82. doi:10.5038/2375-0901.7.1.4
Zhao, F., Ubaka, I., & Gan, A. (2005). Transit network optimization: Minimizing transfers and
maximizing service coverage with an integrated simulated annealing and tabu search method.
Transportation Research Record, 1923, 180-188. doi:10.3141/1923-19
Zhao, F., & Zeng, X. (2006). Simulated annealing-genetic algorithm for transit network optimization.
Journal of Computing in Civil Engineering, 20, 57-68. doi:10.1061/(ASCE)0887-
3801(2006)20:1(57)
Zhao, F., & Zeng, X. (2007). Optimization of user and operator cost for large-scale transit network.
Journal of Transportation Engineering, 133, 240-251. doi:10.1061/(ASCE)0733-
947X(2007)133:4(240)
Zhao, F., & Zeng, X. (2008). Optimization of transit route network, vehicle headways and timetables
for large-scale transit networks. European Journal of Operational Research, 186, 841-855.
doi:10.1016/J.EJOR.2007.02.005
Zhao, H., Xu, W., & Jiang, R. (2015). The Memetic algorithm for the optimization of urban transit
network. Expert Systems with Applications, 42, 3760-3773. doi:10.1016/j.eswa.2014.11.056

Bus Network Design Problem: a review of approaches and solutions
72
APPENDIX A
Nº YEAR AUTHOR(S) TITLE OBJECTIVES CONSTRAINTS DECISION VARIABLES METHODOLOGY APP. TYPE APPLICATION CASE SAMPLE SIZE OBSERVATIONS PRESENT IN:
GH KK IR FH
1 1967 Lampkin and Saalmans
The Design of Routes, Service Frequencies, and Schedules for a Municipal Bus Undertaking: A Case Study
Maximize operator profit and service quality
demand distribution (ticket data)
fleet size; frequencies; route configuration
Heuristic Real Municipal Bus Com-pany of a small town of North England
16 routes Skeleton Method yes yes no yes
2 1971 Newell Dispatching policies for a transportation route.
Minimize waiting times
fleet size; passenger arrival rate; vehicle capacity;
headways Analytical None no no yes no
3 1971 Rea
Designing urban transit systems: An approach to the route technology se-lection problem
Multiple possible objectives depend-ing on planner in-put
demand matrix; net-work structure
network configuration; headways; vehicle ca-pacity; vehicle technol-ogy
Heuristic Example Numerical example on template network
16 hypothetical networks (tem-plates)
Incorporates service level and choice of transporta-tion technology in algorith-mic procedure
no yes no no
4 1972 Salzborn Optimum bus scheduling Minimize fleet size and passenger waiting time
passenger arrival rate; vehicle capacity
fleet size; departure times;
Analytical Example Derived from passen-ger statistics from Adelaide, Australia
single line
Determine optimal sched-ules and minimal fleet size for a single route or for combination of two routes
yes yes yes no
5 1973 Hurdle Minimum cost locations for parallel public transit lines.
Minimize user (walking time) and operator cost
passenger arrival rate;
line spacing; frequen-cies
Analytical None Feeder line spacing on a horizontal axis (rapid transit line)
no yes no no
6 1974 Silman et al. Planning the route system for urban buses
Minimize travel time and crowding
fleet size; demand matrix; vehicle capac-ity
network configuration; headways;
Heuristic Test Haifa Transportation Master-Plan Study
50 zones and 30 routes
yes yes no yes
7 1975 Byrne
Public transportation line positions and headways for minimum user and sys-tem cost in a radial case
Minimize user and operator costs
average speed; fleet size; unit costs;
network configuration; headways;
Analytical Example Theoretical Optimal positions for ra-dial lines in a model city with uniform demand
no yes no no
8 1975 Clarens and Hurdle
An operating strategy for a commuter bus system
Minimize user and operator costs
unit costs; passenger arrival rate; travel time matrix; vehicle capac-ity
Zone size; frequencies Analytical Realistic San Francisco (ficti-tious density pattern)
Model assumes radial lines from central terminal to suburban pick-up/drop-off "zones"; solves for zone size
no no yes no
9 1976 Byrne
Cost minimizing positions, lengths and headways for parallel public transit lines having different speeds.
Minimize user and operator costs
average speed; popu-lation density; unit costs;
network configuration; headways;
Analytical Example Theoretical Optimal positions for par-allel lines in a model rec-tangular city
no yes no no
10 1976 Rapp Transfer optimisation in an interactive graphic system for transit planning
Minimize transfer time
existing network; fleet size; headways and layover times
average waiting time; departure times; num-ber of transfers
Heuristic Real Basel Transit System 82 buses Interactive graphical sys-tem for optimization; transfer optimization
yes no no no
11 1978 Black Optimizing urban mass transit systems: A general model.
Minimize total costs
network structure; de-mand matrix; unit costs
network configuration; frequencies; travel time; vehicle assign-ment
Analytical Example Hypothetical circular city, strictly radial network
Route and stop spacing in radial networks, consider-ing costs and transporta-tion technology
no yes no no

Bus Network Design Problem: a review of approaches and solutions
73
Nº YEAR AUTHOR(S) TITLE OBJECTIVES CONSTRAINTS DECISION VARIABLES METHODOLOGY APP. TYPE APPLICATION CASE SAMPLE SIZE OBSERVATIONS PRESENT IN:
GH KK IR FH
12 1979 Dubois et al. A Set of Methods in Trans-portation Network Synthe-sis and Analysis
Minimize total travel time
network structure; de-mand matrix; travel time matrix; modal split;
route configuration; headways
Heuristic (Local Search)
Real 10 towns of France (Nice and Toulouse more significant)
95 nodes, 164 links
Method developed and tested with decision-mak-ers in French towns
yes yes no yes
13 1979 Newell Some Issues Relating to the Optimal Design of Bus Routes
Minimize user and operator cost
demand matrix; vehi-cle capacity
route spacing; head-ways;
Analytical None Mathematical formulation of the route design prob-lem on rectangular grids
no no no no
14 1980 Mandl Evaluation and optimisa-tion of urban public trans-portation networks
Minimize transpor-tation costs (wait-ing, travel, and transfer time)
network structure; de-mand matrix; fleet size
network configuration; passenger assignment; vehicle assignment
Heuristic Test Belgian town 18 routes, 420 nodes, 1800 arcs
Application used exten-sively as benchmark after-wards
yes yes no yes
15 1980 Salzborn Scheduling bus systems with interchanges
Minimize fleet size and passenger waiting time
network configuration; travel time matrix; headways
fleet size; departure times;
Mathematical Example Canberra 14 routes Timetable optimisation for feeder routes
yes no no no
16 1980 Scheele A supply model for public transit services
Minimize total pas-senger travel time
network configuration; fleet size; demand matrix; vehicle capac-ity
frequencies Non-linear pro-gramming
Real Linköping, Sweden 6 lines, 34 buses
yes no yes no
17 1981 Furth and Wil-son
Setting frequencies on bus routes: Theory and prac-tice
Maximize net so-cial benefit
fleet size; subsidies; vehicle capacity; pol-icy headways
headways; ridership; fares; fleet size
Mathematical programming
Real Boston 21 lines, 70 buses
yes yes yes no
18 1982 Han and Wil-son
The allocation of buses in heavily utilized networks with overlapping routes
Minimize waiting times and load fac-tor
fleet size bounds; de-mand matrix; vehicle capacity
fleet size; ridership; ve-hicle assignment; fre-quencies
Heuristic Example Cairo 3 lines, 6 nodes
Optimization of frequen-cies and vehicle assign-ment in overcrowded and overlapping lines
yes no yes no
19 1982 Kocur and Hendrickson
Design of local bus service with demand equilibrium
Maximization of op-erator profitability and user benefit
demand function; budget constraints; vehicle capacity
route spacing; head-ways; fare; ridership
Analytical Example Numerical (derived from Hartford, CT)
no yes no no
20 1983 Tsao and Schonfeld
Optimization of zonal transit service.
Minimize total cost demand matrix; vehi-cle speed; number of zones
Zone size; frequencies Analytical Real Washington DC met-ropolitan area
1 bus corridor Zonal transit service in a radial structure (trips to/from CBD)
no yes no no
21 1984 Ceder Bus frequency determina-tion using passenger count data.
Minimize fleet size and number of bus runs
demand matrix (from data collection); net-work configuration; vehicle capacity; pol-icy headways
frequencies; fleet size; ridership; departure times
Heuristic Real Jerusalem Passenger count data from single line
Enhance frequencies and timetables with passenger data collection
no no yes no
22 1984 Marwah et al. Optimal design of bus routes and frequencies for Ahmedabad.
Minimize operating and passenger time cost
network structure; fleet size; demand matrix
frequencies; network configuration; transfers
Heuristic Real Ahmedabad, India 426 arcs, 134 nodes
Generation of new routes from existing bus network
no yes yes no
23 1984 Morlok and Vi-ton
Feasibility of profitable transit service in radial ur-ban corridors
Maximize profitabil-ity
vehicle capacity; de-mand matrix (peak hours); unit costs;
network configuration (number of routes, length); frequencies; fares; modal split; fleet size
Analytical Example San Francisco (in-come and demand data)
Obtain capacity, service quality and price that max-imizes profit
no yes no no

Bus Network Design Problem: a review of approaches and solutions
74
Nº YEAR AUTHOR(S) TITLE OBJECTIVES CONSTRAINTS DECISION VARIABLES METHODOLOGY APP. TYPE APPLICATION CASE SAMPLE SIZE OBSERVATIONS PRESENT IN:
GH KK IR FH
24 1986 Ceder and Wilson
Bus network design
Minimize user (travel and waiting time) and operator cost (vehicle)
network structure (nodes, terminals); demand matrix; travel time matrix; frequency bounds; max. fleet size; unit costs
network configuration (length); frequencies; fleet size; waiting times; excess travel time
Heuristic Example Simple five node net-work
5 nodes
Seminal paper for the def-inition of the steps in-volved in network plan-ning - notes rarity of inte-gral system redesigns
yes yes yes yes
25 1986 Vaughan
Optimum polar networks for an urban bus system with a many-to-many travel demand
Minimize travel time
fleet size; vehicle speed; network struc-ture; population
route spacing; head-ways; walking time; travel time
Analytical Example Model radial city; data from Perth, Aus-tralia
Theoretical relation be-tween city shape and route spacing and head-ways using an abstract model
no yes no no
26 1987 Klemt and Stemme
Schedule synchronization for public transit networks
Minimize transfer cost
network configuration; frequencies;
departure times; wait-ing times
Heuristic, enu-meration
Test yes no yes no
27 1987 Van Oudheusden et al
The design of bus route systems—An interactive location allocation ap-proach
Multiple possible objectives through cost minimization
network structure; de-mand matrix; initial route set; frequencies
network configuration; cost (multiple objec-tive)
Mathematical programming (SCP, SPLP)
Example Fictional city 41 "zones"
Interactive model for line planning - allows planner to choose optimization ob-jective and decision varia-bles
no yes no no
28 1988 Leblanc Transit system network design
Maximize transit usage and mini-mize operator cost
demand matrix; de-mand assignment; headway bounds
modal split; frequen-cies
Hooke-Jeeves al-gorithm
Realistic Data from Sioux Falls, USA
128 links (5 added lines)
no yes no no
29 1988 Van Nes et al. Design of public transport networks
Maximize number of passengers, minimize transfers
network structure; budget constraints; max. fleet size; de-mand matrix
network configuration; fleet size; frequencies
Heuristic Real Groningen, Nether-lands
115 zones, 182 nodes
Single step method - ar-gues that routes and fre-quencies cannot be solved separately
yes yes yes yes
30 1989 Domschke Schedule synchronization for public transit systems.
Minimize waiting times
network configuration; headways; demand matrix; time matrix
departure times; wait-ing times
Heuristic, branch and bound algo-rithm
Test Numerical test to evaluate fitness of al-gorithm
14 routes no no yes no
31 1991 Baaj and Mah-massani
An AI-based approach for transit route system plan-ning and design
Minimize number of transfers and to-tal travel time
network structure; de-mand matrix; initial route set
headways; route con-figuration; transfers; fleet size; travel time
Hybrid (Artificial Intelligence-AI)
Benchmark Mandl's Benchmark Network (Swiss net-work)
no yes yes no
32 1991 Chang and Schonfeld
Multiple period optimiza-tion of bus transit systems.
Maximize social welfare and opera-tor profit
demand function; unit costs; vehicle capac-ity
route spacing; head-ways; fleet size; fares
Analytical Example Numerical example Feeder line spacing in multiple variable demand scenarios
no yes no no
33 1992 Bookbinder and Désilets
Transfer optimization in a transit network
Minimize waiting times
network configuration; headways; disutility function
waiting times; offset times
Integer program-ming
Test Two examples: one fictional, one with data from Winnipeg
Transfer optimization with fixed headways and ran-dom travel time
yes no yes no
34 1993 Chang and Schonfeld
Welfare maximization with financial constraints for bus transit systems
Maximize welfare
budget constraints (subsidies); demand function; unit costs; vehicle capacity
network configuration; headways; fares; fleet size
Analytical Example Numerical analysis
Maximization of overall welfare and consumer surplus considering sub-sidy constraints and elas-tic demand
no yes no no

Bus Network Design Problem: a review of approaches and solutions
75
Nº YEAR AUTHOR(S) TITLE OBJECTIVES CONSTRAINTS DECISION VARIABLES METHODOLOGY APP. TYPE APPLICATION CASE SAMPLE SIZE OBSERVATIONS PRESENT IN:
GH KK IR FH
35 1993 Chang and Schonfeld
Optimal dimensions of bus service zones
Minimize cost (user and operator)
demand density; unit costs; average speed;
zone size; network configuration (route spacing and length); headways
Analytical Example Numerical analysis Zonal service (local/ex-press mixed lines)
no yes no no
36 1993 Spasovic and Schonfeld
Method for optimizing transit service coverage
Minimize total cost (user and operator)
average speed; unit costs; vehicle capac-ity
network configuration (route length and spac-ing); headways; fleet size
Analytical Example Numerical analysis Zonal service (local/ex-press mixed lines)
no yes no no
37 1994 Spasovic et al. Bus transit service cover-age for maximum profit and social welfare
Maximize profit and social welfare
demand function; budget constraint; network structure (corridor size)
route length; route spacing; frequencies; fares; fleet size
Analytical Example Sensitivity analysis Single corridor Correlation between oper-ator profit and social wel-fare
no yes no no
38 1995 Baaj and Mah-massani
Hybrid route generation heuristic algorithm for the design of transit networks
Minimize user and operator costs
network structure; headway bounds; de-mand matrix; vehicle capacity
demand satisfaction; fleet size; network con-figuration
Heuristic Test Sensitivity analysis yes no yes yes
39 1995 Chakroborty et al.
Optimal scheduling of ur-ban transit systems using genetic algorithms
Minimize waiting and transfer times
policy headways; stopping time bounds; fleet size
headways; stopping times; departure times
Genetic algorithm Example Numerical example 3 routes, 30 ve-hicles
Transfer optimization yes no yes no
40 1995 Constantin and Florian
Optimizing frequencies in a transit network: A nonlin-ear bi-level programming approach
Minimize waiting time
network configuration; fleet size; vehicle ca-pacity; headway bounds
waiting times; frequen-cies; demand assign-ment
Nonlinear Bi-level Programming
Real Stockholm, Winni-peg, Portland
yes yes yes no
41 1995 Daduna and Voss
Practical experiences in schedule synchronization
Minimize waiting times
network configuration; frequencies; travel times
departure times; wait-ing time
Tabu search method
Realistic Cities from Germany (unspecified)
14 routes
Transfer optimization sub-ject to multiple side con-straints - objective is inter-active optimization for planners
yes no yes no
42 1997 Chien and Schonfeld
Optimization of grid transit system in heterogeneous urban environment
Minimize user, op-erator, and capital costs
demand matrix; zone size
total travel time; route spacing; headways
Analytical Test Sensitivity analysis Focus on spatial charac-teristics: heterogeneous urban areas
no yes yes no
43 1998 Bielli et al. A New Approach for Transport Network Design and Optimization
Multicriteria analy-sis - multiple possi-ble optimization ob-jectives
demand matrix; subsi-dies; fleet size policy headways
network configuration; headways
Genetic algorithm None Algorithm theory - no opti-mization objectives or ap-plication example
no yes no no
44 1998 Ceder and Is-raeli
User and Operator Per-spectives in Transit Net-work Design
Minimize user (travel and waiting time) and operator costs (fleet size)
network structure; de-mand matrix; travel time matrix; length bounds
network configuration; frequencies; waiting times; passenger hours; fleet size
Heuristic None no yes no no
45 1998 Imam Optimal design of public bus service with demand equilibrium
Maximize operator profit
vehicle capacity; de-mand function; unit costs;
route spacing; head-ways; fares; zone size
Analytical None Takes demand into ac-count - variable demand with service level
no yes no no
46 1998 Pattnaik et al. Urban Bus Transit Route Network Design Using Ge-netic Algorithm
Minimize user and operator cost
network structure; de-mand matrix; route length bounds
fleet size; network con-figuration; number of transfers; frequencies
Genetic algorithm Realistic Madras, India 25 nodes, 39 links
yes yes no yes

Bus Network Design Problem: a review of approaches and solutions
76
Nº YEAR AUTHOR(S) TITLE OBJECTIVES CONSTRAINTS DECISION VARIABLES METHODOLOGY APP. TYPE APPLICATION CASE SAMPLE SIZE OBSERVATIONS PRESENT IN:
GH KK IR FH
47 1998 Shih et al.
Planning and design model for transit route net-works with coordinated op-erations
Minimize user cost (waiting time and number of trans-fers) and operator cost (fleet size and operating costs)
network structure; de-mand matrix; service level bounds
network configuration; frequencies; vehicle capacity; fleet size; number of transfers; fuel consumption
AI search heuris-tic
Realistic Austin transit network 177 nodes, 40 lines
Variable vehicle sizes, de-mand-responsive transit; solutions to highly subur-banized areas (US)
yes yes no yes
48 2000 Soehodho and Nahry
Optimal scheduling of pub-lic transport fleet at net-work flee
Minimize waiting time, fleet size
network configuration; headways; vehicle ca-pacity
waiting time; fleet size; departure times; vehi-cle assignment
Dynamic pro-gramming algo-rithm
Test Numerical 3 routes, 4 ter-minals, 5 stops
Operational level optimi-zation - algorithm to en-hance timetables and ve-hicle rostering simultane-ously
no yes no no
49 2000 Furth and Rahbee
Dynamic Programming and Geographic Modelling
Minimize walking time, delay cost and operator cost
demand distribution (modelling); network structure;
stop spacing; walking time;
Dynamic pro-gramming algo-rithm
Real Boston, USA Single line Bus stop spacing adjust-ment
no no yes no
50 2001 Ceder et al. Creating bus timetables with maximal synchroniza-tion
Maximize simulta-neous bus arrivals in transfer points
network configuration; headway bounds; travel times
departure times; fre-quencies
Heuristic Real Examples and real case from Israel
14 lines and 3 nodes
yes no yes no
51 2001 Chakroborty et al.
Optimal fleet size distribu-tion and scheduling of ur-ban transit systems using genetic algorithms
Minimize total wait-ing time
total fleet size; stop-ping time bounds; pol-icy headways;
headways; stopping time; vehicle assign-ment
Genetic algorithm Example 3 routes, 30 buses
yes no no no
52 2001 Chien et al. Genetic Algorithm ap-proach for transit route planning and design
Minimize total cost (operator and user)
network structure; ve-hicle capacity; budget constraints; zone size
headways; network configuration; travel time; walking time
Genetic algorithm Test Numerical analysis of model area
Evolutionary Process Method
no yes no no
53 2001 De Palma and Lindsey
Optimal timetables for public transportation
Minimize schedule delay costs
demand assignment; network configuration
departure times Analytical None Optimization based on idealized models
yes no yes no
54 2001 Delle site and Fillippi
Bus service optimization with fuel saving objective and various financial con-straints
Minimize fuel con-sumption
demand assignment; budget constraints
fares; vehicle capacity Analytical Example
Numerical, database derived from peak hour conditions in Rome
Consideration of modal split between bus and car and impact on total fuel consumption
no yes no no
55 2002 Bielli et al. Genetic algorithms in bus network optimization
Multicriteria analy-sis - multiple possi-ble optimization ob-jectives
network structure; ve-hicle capacity; de-mand matrix
fleet size; ridership; network configuration; transfers; travel time; emissions; headways
Genetic algorithm Realistic Parma, Italy Optimization based on fit-ness function and multiple performance indicators
yes yes no yes
56 2002 Ceder Designing Public Transport Network and Routes.
Minimize travel times (in passen-ger-hours) and fleet size
network structure; de-mand matrix; travel time matrix; policy headway
fleet size; travel time and waiting time sav-ings; empty space-hours
Mixed integer lin-ear programming
Example 8 node example net-work
[NOTE Fig. 1] Both route design and op-erational optimization methods are considered
yes no yes yes
57 2002 Chakroborty and Wivedi
Optimal Route Network Design for Transit Sys-tems Using Genetic Algo-rithms
Minimize travel time and transfers
road network; de-mand matrix;
travel time; number of transfers; demand sat-isfaction;
Genetic algorithm Benchmark Mandl's benchmark network
yes yes yes yes

Bus Network Design Problem: a review of approaches and solutions
77
Nº YEAR AUTHOR(S) TITLE OBJECTIVES CONSTRAINTS DECISION VARIABLES METHODOLOGY APP. TYPE APPLICATION CASE SAMPLE SIZE OBSERVATIONS PRESENT IN:
GH KK IR FH
58 2002 Chien and Spasovic
Optimization of grid bus transit systems with elastic demand
Maximize operator profit and total so-cial welfare
network structure; de-mand density; vehicle capacity; unit costs; average speed
route spacing; length; frequency; fares
Analytical Example Fictional simplified grid
no no yes no
59 2002 Chowdhury and Chien
Intermodal Transit System Coordination
Minimize operator costs and user costs for both modes (bus and rail)
network configuration; existing frequencies; demand matrix; vehi-cle capacity
headways; operating costs; waiting times
Heuristic Example Numerical examples Multimodal integration of main lines and feeder routes
yes no no no
60 2002 El-Hifnawi, M.
Cross-town bus routes as a solution for decentral-ized travel: a cost-benefit analysis for Monterrey, Mexico
Maximize total wel-fare (operator cost, minimizing bus user and car user total travel time)
travel time matrix; modal split; existing network configuration; demand assignment
number of transfers; travel time; operating cost
Analytical Real Monterrey, Mexico 114 existing lines, 16 new cross-town lines
Simulation and evaluation of net welfare benefits fol-lowing introduction of new lines to an established system
no no no no
61 2002 Fusco et al. A heuristic transit network design algorithm for me-dium size towns
Minimize overall system costs
network structure; de-mand matrix; travel time matrix;
route configuration; headways; demand satisfaction
Genetic algorithm None Mandl's benchmark network
Incomplete application of proposed model (bench-mark)
yes no no yes
62 2002 Shrivastava and Dhingra
Development of coordi-nated schedules using Ge-netic Algorithms.
Minimize transfer times
existing schedules; network configuration; demand assignment; vehicle capacity
load factor; transfer times; headways
Genetic algorithm Real Optimization on a single railway station (Andheri, India)
Multimodal optimization: railway and bus interface
no no yes no
63 2002 Shrivastava et al.
Application of Genetic Al-gorithm for scheduling and schedule coordination problems.
Minimize waiting times, operation cost, unsatisfied demand
existing schedules; network configuration; vehicle capacity
frequency; departure times; transfers; travel time; fleet size
Genetic algorithm Real
Andheri and Vileparle suburban stations (India); comparison with benchmark re-sults
no no yes no
64 2002 Yan and Chen A scheduling model and a solution algorithm for inter-city bus carriers
Maximize profit
demand matrix; fleet size bounds; network configuration; vehicle capacity
fleet size; demand sat-isfaction; transfers
Heuristic Real Taiwan intercity bus network (5 cities)
320 buses, 15120 nodes, 85680 arcs
yes no no no
65 2003 Ceder Public Transport Timeta-bling and Vehicle Schedul-ing.
Minimize user and operator costs
demand data; vehicle capacity; policy head-ways
fleet size; headways; departure times
Heuristic Example
Graphical method for de-termining frequencies and timetables with operator cost reduction objective (reducing fleet size)
yes no no no
66 2003 Chakroborty Genetic algorithms for op-timal urban transit network design
Maximize demand satisfaction, mini-mize total travel time and number of transfers
road network; de-mand matrix; travel time matrix; fleet size; policy headways
number of transfers; average travel time; demand satisfaction
Genetic algorithm Benchmark Mandl's benchmark network
Main goal is to make an argument for the applica-tion of genetic algorithms
no yes yes no
67 2003 Chien et al. Optimization of bus route planning in urban com-muter networks
Minimize total sys-tem costs
network structure; ve-hicle capacity; de-mand density; unit costs
network configuration; headways; fleet size; total travel time
Analytical Example
Model grid (similar to US cities with grid pattern and diagonal thoroughfares)
Approximation of irregular grid networks to perfect grids for model application
no yes no no

Bus Network Design Problem: a review of approaches and solutions
78
Nº YEAR AUTHOR(S) TITLE OBJECTIVES CONSTRAINTS DECISION VARIABLES METHODOLOGY APP. TYPE APPLICATION CASE SAMPLE SIZE OBSERVATIONS PRESENT IN:
GH KK IR FH
68 2003 Murray
A coverage model for im-proving public transit sys-tem accessibility and ex-panding access
Maximize transit coverage, minimize required bus stops
network structure (zones, stops);
network configuration (bus stop location); service coverage
Hybrid algorithm Real Brisbane, Australia 685 stops Determine location of new transit stops to maximize accessibility
yes no no no
69 2003 Ngamchai and Lovell
Optimal time transfer in bus transit route network design using a genetic al-gorithm
Minimize total sys-tem costs
demand matrix; net-work structure; unit costs; vehicle capac-ity; average speed
network configuration; headways
Genetic algorithm Test Network adapted from Pattnaik et al. (1998)
yes yes no yes
70 2003 Quak Bus line planning.
Minimize operator cost, minimize de-tour time (com-pared to driving time)
network structure; de-mand matrix; travel time matrix; unit costs
frequencies; departure times; network configu-ration; travel time; ve-hicle capacity
Greedy heuristic Real Amersfoort, Nether-lands
125 bus stops
Modelling of passenger costs through mean esti-mated detour time and op-erating costs through total drive time
yes no no no
71 2003 Tom and Mo-han
Transit route network de-sign using frequency coded genetic algorithm
Minimize total sys-tem costs
network structure; de-mand matrix; travel time matrix; frequency bounds; unit costs
network configuration (routes, length); trans-fers; fleet size; fre-quencies
Genetic algorithm Realistic Chennai, India
Medium sized network (75 nodes and 125 links)
yes yes no yes
72 2003 Van Nes Multiuser-Class Urban Transit Network Design
Maximize social welfare
network structure; de-mand density; de-mand sensitivity;
network configuration (line and stop spacing); total travel time; fre-quency
Conventional (an-alytical)
Example Urban bus corridor of Utrecht, Netherlands
Single corridor no yes no no
73 2003 Wan and Lo A mixed integer formula-tion for multiple-route transit network design.
Maximum cover-age (demand satis-fying) at minimum cost
network structure; de-mand matrix; vehicle capacity
network configuration (route length); frequen-cies
Mixed integer programming
Example Example network 10 nodes, 19 arcs
yes no yes yes
74 2003 Zhao and Gan Optimization of Transit Network to minimize Transfers
Minimize number of transfers, max-imize service cov-erage
network structure (set); network configu-ration;
network configuration; transfers;
Heuristic/me-taheuristic (SA, tabu Search, NS)
Realistic Transit System of Mi-ami-Dade County, Florida
2804 nodes, 81 bus lines
Software developed for in-teractive line planning with possibility of using exist-ing network or policy re-quirements as constraints
yes yes no yes
75 2004 Agrawal and Mathew
Transit route design using parallel genetic algorithm
Minimize total sys-tem cost
frequency bounds; load factor con-straints; vehicle ca-pacity; network struc-ture; demand matrix
network configuration; frequencies; transfers; fleet size
Genetic algorithm Realistic Delhi, India 1,332 nodes and 4,076 links
no yes yes yes
76 2004 Aldaihani et al. Network design for a grid hybrid transit service
Optimize number of zones
zone size; passenger arrival rate; unit costs
number of zones; travel times; dead-heading times; fleet size; waiting times; ve-hicle assignment
Analytical Example
Development of a grid zone structure for integra-tion of demand-respon-sive and fixed schedule transit services
no no no no
77 2004 Carresse and Gorri
An urban bus network de-sign procedure
Minimize travel times, waiting times, operator cost
network structure (ex-isting railway net-work); demand matrix; fleet size bounds; ve-hicle capacity
network configuration; passenger flows (rid-ership); headways; fleet size; demand as-signment
Heuristic Real Rome, Italy
Application to a large city, 1400 nodes and 7700 links
yes yes no yes

Bus Network Design Problem: a review of approaches and solutions
79
Nº YEAR AUTHOR(S) TITLE OBJECTIVES CONSTRAINTS DECISION VARIABLES METHODOLOGY APP. TYPE APPLICATION CASE SAMPLE SIZE OBSERVATIONS PRESENT IN:
GH KK IR FH
78 2004 Castelli et al. Scheduling multimodal transportation systems.
Minimize operator costs and passen-ger holding costs
demand matrix (fixed, incoming and out-going); network con-figuration; travel time matrix; unit costs
departure times; de-mand assignment; headways
Heuristic Test Scheduling based on transfer optimization ap-plied line by line
yes no yes no
79 2004 Chakroborty
Optimal Routing and Scheduling in Transporta-tion: Using Genetic Algo-rithm to Solve Difficult Op-timization Problems
Various perfor-mance indicators
demand matrix; fleet size; vehicle capacity; policy headways;
demand satisfaction; number of transfers; average travel time, man-hours saved; de-parture times
Genetic algorithm Benchmark Mandl's network (benchmark)
Solves route design, time-tabling and vehicle routing from depot in separate steps
no no no no
80 2004 Cipriani et al.
A procedure for the solu-tion of the urban bus net-work design problem with elastic demand
Minimize overall system costs
demand matrix (varia-ble); network structure
network configuration; frequencies; vehicle capacity
Genetic algorithm None no yes no no
81 2004 Eranki
A model to create bus timetables to attain maxi-mum synchronization con-sidering waiting times at transfer stops.
Minimize waiting times, maximize simultaneous arri-vals
existing network con-figuration; frequencies
waiting times Heuristic Realistic Real data derived from Ceder et al. (2001)
Simultaneous arrival de-fined as a time window
yes no no no
82 2004 Fan and Ma-chemehl
Optimal Transit Route Net-work Design Problem: Al-gorithms, Implementa-tions, and Numerical Re-sults
Minimize total travel time and fleet size
demand matrix; net-work structure; head-way bounds; network configuration con-straints; load factor bounds
network configuration (route length, number of lines); headway; load factor; fleet size; travel time (waiting, in-vehicle, and walking)
Hybrid heuristics (Variety of NS al-gorithms)
Example Various numerical examples
yes no yes yes
83 2004 Fleurent et al. Transit timetable synchro-nization: evaluation and optimization
Minimize waiting times
existing network con-figuration; frequencies
waiting times Heuristic Real Montréal, Canada "Meet" builder software: timetable synchronization for simultaneous arrivals
yes no no no
84 2004 Gao et al.
A continuous equilibrium network design model and algorithm for transit sys-tems
Minimize user and operator cost
demand matrix; net-work structure (set); demand assignment
network configuration; frequencies; passen-ger flows
Heuristic (Sensi-tivity analysis)
Example Numerical example yes no yes no
85 2004 Petrelli A transit network design model for urban areas
Minimize user and operator costs
demand matrix; net-work structure; fre-quency bounds
network configuration; vehicle capacity; fre-quency; transfers
Genetic algorithm None
Application to a model network and a medium-sized city (not included in pa-per)
no yes no no
86 2004 Wong and Leung
Timetable synchronization for mass transit railway
Minimize waiting times
existing network con-figuration; frequencies
waiting times Heuristic Real Hong Kong Mass Transit Railway net-work
Railway timetable syn-chronization
yes no no no
87 2004 Zhao and Ubaka
Transit network optimiza-tion – minimizing transfers and optimizing route di-rectness
Minimize transfers, optimize service coverage
demand matrix; net-work structure;
number of transfers; route length; number of routes
Greedy search method, Fast hill climbing search method
Benchmark Mandl's benchmark network, Miami-Dade County network
yes no no yes

Bus Network Design Problem: a review of approaches and solutions
80
Nº YEAR AUTHOR(S) TITLE OBJECTIVES CONSTRAINTS DECISION VARIABLES METHODOLOGY APP. TYPE APPLICATION CASE SAMPLE SIZE OBSERVATIONS PRESENT IN:
GH KK IR FH
88 2005 Bachelet and Yon
Enhancing theoretical opti-mization solutions by cou-pling with simulation.
Minimize travel times and route length
network structure; route length bounds; demand matrix
route length; travel times
Heuristic Realistic Clermont-Ferrand, France
109 nodes, 392 arcs
Simulation optimization approach to design net-works and evaluate solu-tions
yes no no no
89 2005 Borndorfer et al.
A path-based model for line planning in public transport
Minimize operating costs and travel times
demand matrix fixed and variable costs; passenger travel times
Heuristic Test Potsdam, Germany 80 lines Multi-commodity flow model for line planning
yes no no no
90 2005 Hu et al.
Optimal design for urban mass transit network based on evolutionary al-gorithms
Minimize user and operator costs
vehicle capacity; route length bounds; net-work structure (termi-nals); demand matrix
network configuration (route length, stops); headways
Genetic algo-rithm, Ant colony algorithm
Real RD: Changchun, China FS: Hong Kong
20 routes no yes no yes
91 2005 Jansen et al. Minimizing passenger transfer times in public transport timetables
Minimize weighted sum of transfer waiting times
existing network; fixed frequencies
perceived cost (amount passengers are willing to pay for saved transfer time)
Tabu search (heuristic)
Realistic Copenhagen-Ringsted model (Nelsen et al. 2001)
Transfer optimization based on perceived time savings expressed by cost and for three passenger groups (business, com-muters and recreational)
yes no no no
92 2005 Lee and Vuchic
Transit network design with variable demand.
Minimize travel time and social cost, maximize op-erator profit
network structure; to-tal demand matrix; modal split
network configuration; demand assignment; waiting time; travel time; frequency
Heuristic Example Example network 16 nodes
Incorporation of variable demand in iterative net-work development algo-rithm
yes yes no yes
93 2005 Lee and Vuchic
Transit network design with variable demand.
Minimize travel time and social cost, maximize op-erator profit
network structure; to-tal demand matrix; modal split
network configuration; demand assignment; waiting time; travel time; frequency
Heuristic Example Example network 16 nodes
Incorporation of variable demand in iterative net-work development algo-rithm
yes yes no yes
94 2005 Park Bus network scheduling with genetic algorithms and simulation
Minimize total cost, minimize transfer times
network configuration and OD matrix
Total cost (divided in multiple components)
Genetic algorithm (deterministic ar-rival times), simu-lation-based ge-netic algorithm (stochastic arrival times)
Example
Different models and anal-ysis for deterministic arri-val times and stochastic arrival times
yes no no no
95 2005 Yu et al. Optimizing bus transit net-work with parallel ant col-ony algorithm.
Minimize transfers, maximize passen-ger flow
network structure; zonal demand matrix; network configuration constraints (route length; stop spacing)
network configuration; passenger flows
Parallel ant col-ony algorithm
Realistic Dalian, China 61 lines Priority of route design over frequency setting
yes no no yes
96 2005 Zhao et al.
Transit network optimiza-tion: Minimizing transfers and maximizing service coverage with an inte-grated simulated anneal-ing and tabu search method
Minimize transfers, maximize service coverage
network structure; de-mand matrix; fleet size bounds
network configuration; transfers; fleet size; headways
Multiple (heuris-tic)
Realistic Miami-Dade County, Florida, USA
no yes no no
97 2006 Cevallos and Zhao
Minimizing transfer times in a public transit network with a genetic algorithm
Optimize transfer times
network configuration; existing timetables;
departure times; time shifting
Genetic algorithm Real Broward County Transit, Florida
yes no no no

Bus Network Design Problem: a review of approaches and solutions
81
Nº YEAR AUTHOR(S) TITLE OBJECTIVES CONSTRAINTS DECISION VARIABLES METHODOLOGY APP. TYPE APPLICATION CASE SAMPLE SIZE OBSERVATIONS PRESENT IN:
GH KK IR FH
demand data; head-ways
98 2006 Fan and Ma-chemehl
Optimal transit route net-work design problem with variable transit demand: A genetic algorithm ap-proach
Minimize operator cost, user cost and unsatisfied demand
Max/min routes and headways; OD matrix; bus capacity
Number of routes; route length; travel times; fleet size
Genetic algorithm Example Experimental net-work
160 nodes, 418 arcs
Two papers using differ-ent methods on same test network; SA achieved bet-ter results
yes yes yes yes
99 2006 Fan and Ma-chemehl
Using a simulated anneal-ing algorithm to solve the transit route network de-sign problem
Minimize operator cost, user cost and unsatisfied demand
Max/min routes and headways; OD matrix; bus capacity
Number of routes; route length; travel times; fleet size
Simulated an-nealing algorithm
Example Experimental net-work
160 nodes, 418 arcs
Two papers using differ-ent methods on same test network; SA achieved bet-ter results
yes yes yes yes
100 2006 Guan et al.
Simultaneous optimization of transit line configuration and passenger line as-signment
Minimize travel time and number of transfers
network structure; de-mand matrix; link ca-pacity; route length bounds
network configuration (route length); travel time; transfers
Analytical Real Hong Kong Mass Transit Railway net-work
6 lines, 49 sta-tions (simplified 9 node network for example)
Linear Binary Integer pro-gram
yes no yes yes
101 2006 Matisziw et al. Strategic route extension in transit networks
Maximize potential demand, minimize route length exten-sion
network configuration; network structure; de-mand matrix; max. number of new stops
network configuration; demand coverage (bi-nary)
Analytical Real Columbus, Ohio bus network
10 stops exten-sion
Focus on strategic exten-sion of pre-existing bus routes
no no no no
102 2006 Schröder and Solchenbach
Optimization of Transfer Quality in Regional Public Transit. Technical
Optimize transfers based on an as-sessment of their quality (penalties for too early or too late transfers)
transfer classification; network structure; ex-isting timetables
departure times; wait-ing times
Analytical Real
Western Palatinate transit association; case studies from Kaiserslautern
240 connec-tions (max)
Improve transfer quality between different opera-tors in regional transit net-works
no no yes no
103 2006 Yu and Yang Model and algorithm for it-erative design of bus net-work
Maximize direct traveller density
network structure; de-mand matrix; length bounds; vehicle ca-pacity
line length; direct pas-sengers; demand as-signment
Ant colony opti-misation
Real Dalian, China 81 lines, 1220 bus stops
Simultaneous optimization of bus network and transit assignment
no yes no no
104 2006 Zhao
Large-scale transit net-work optimization by mini-mizing user cost and transfers
Minimize transit transfers and total user cost while maximizing service coverage
demand matrix travel time; number of transfers; fleet size
Simulated an-nealing
Benchmark Mandl's benchmark network, Miami-Dade County network
yes no no yes
105 2006 Zhao and Zeng
Simulated annealing-ge-netic algorithm for transit network optimization
Minimize transfers, maximize service coverage
network structure; de-mand matrix; fleet size; route length con-straints
network configuration (length, number of routes); transfers
Heuristic / me-taheuristic (GA and SA)
Realistic Miami-Dade County, Florida
Combination of different methods to generate routes with demand cov-erage criteria based on number of transfers
yes yes no yes
106 2007 Barra et al. Solving the transit network design problem with con-straint programming
No objective func-tion: adequate level of service to de-mand assignment
demand matrix; de-mand assignment; budget constraints; network structure; headway bounds
network configuration; ridership; headways
Constraint Pro-gramming
None
Attempts to test the model on real net-works led to high computational times
Consideration of multiple constraints to be applied to the model depending on their classification
yes no no yes

Bus Network Design Problem: a review of approaches and solutions
82
Nº YEAR AUTHOR(S) TITLE OBJECTIVES CONSTRAINTS DECISION VARIABLES METHODOLOGY APP. TYPE APPLICATION CASE SAMPLE SIZE OBSERVATIONS PRESENT IN:
GH KK IR FH
107 2007 Liu et al. Regional bus timetabling model with synchroniza-tion. Journal
Minimize transfer times
network structure; high and low depar-ture time intervals; frequency
Synchronization coeffi-cient (calculated from constraints)
Nesting taboo search
Example Numerical 8 bus routes, 3 connecting hubs
Timetable synchronization for regional bus networks
no no yes no
108 2007 Yang et al. A parallel ant colony algo-rithm for bus network opti-mization
Maximize direct passenger density
Route length limitation direct passenger den-sity (passengers/route length)
Ant colony opti-misation
Realistic Dalian, China
2300 nodes, 3200 links, 89 routes, 1500 bus stops
no yes yes yes
109 2007 Zhao and Zeng
Optimization of user and operator cost for large scale transit networks
Minimize total cost (operator cost and user travel time)
transit demand; net-work structure; feasi-bility constraints
route configuration and number; fleet size; number of transfers
Multiple (heuris-tic)
Benchmark Benchmark networks Focus on large-scale net-work optimization
no yes no yes
110 2008 Borndorfer et al.
Models for line planning in public transport.
Minimize total pas-senger travel time and operation costs
demand matrix; net-work structure; travel time matrix; vehicle capacity; frequency bounds
network configuration; frequencies
Analytical (Inte-ger program-ming)
None no no no yes
111 2008 Fan and Ma-chemehl
Tabu search strategies for the public transportation network optimizations with variable transit demand
Minimize the sum of operator cost, user cost and un-satisfied demand costs
demand matrix (varia-ble); fleet size and ca-pacity; network speci-fications (routes and nodes)
network configuration (length); travel times; demand assignment; load factors; fleet size; frequencies
Tabu search al-gorithm
Example Experimental net-work
28 zones, 160 nodes, 418 arcs
no no yes yes
112 2008 Fernández et al.
Demand responsive urban public transport system design: Methodology and application
Minimize total cost (operator cost and user travel time), maximize social welfare
demand matrix; net-work structure; fleet size; vehicle capacity
network configuration (route directness); fre-quencies
Mathematical and Heuristic
Real Santiago de Chile
370 bus ser-vices; demand data obtained from census survey of 15000 households
Metropolitan-scale analy-sis and modelling of an entire transit network
no no yes no
113 2008 Kwan and Chang
Timetable synchronization of mass rapid transit sys-tem using multiobjective evolutionary approach.
Minimize total pas-senger dissatisfac-tion index
existing headways and schedules
total passenger dissat-isfaction index (measures quality of train connections - not too close and not too far apart)
Genetic algorithm Realistic Metro rail system adapted from section of Singapore MRT
Railway timetable syn-chronization
no no yes no
114 2008 Marin and Jaramillo
Urban rapid transit net-work capacity expansion
Maximize coverage (upper level), mini-mize passenger costs and expan-sion costs (lower level)
network structure; budget constraints; demand matrix
network configuration; construction costs
Heuristic Realistic Section of Seville transit network
72 demands (nodes), 4 lines
Capacity expansion of ex-isting lines
no no no no
115 2008 Wong et al. Optimizing timetable syn-chronization for rail mass transit.
Minimize transfer times
network configuration; network structure; ve-hicle capacity; dwell time bounds; head-ways bounds
departure times; dwell times; waiting times; headways; vehicle as-signment
Heuristic (mixed-integer-program-ming)
Real Hong Kong Mass Transit Railway net-work
6 lines, 14 inter-change stations
no no yes no

Bus Network Design Problem: a review of approaches and solutions
83
Nº YEAR AUTHOR(S) TITLE OBJECTIVES CONSTRAINTS DECISION VARIABLES METHODOLOGY APP. TYPE APPLICATION CASE SAMPLE SIZE OBSERVATIONS PRESENT IN:
GH KK IR FH
116 2008 Zhao and Zeng
Optimization of transit route network, vehicle headways, and timetables for large-scale transit net-works
Minimize user cost function
network structure; de-mand matrix; fleet size
network configuration (number and length); headways; load factor
Metaheuristic Benchmark Benchmark networks no no yes no
117 2009 Matta and Pe-ters
Developing work sched-ules for an inter-city transit system with multiple driver types and fleet types
Minimize total cost of work schedules
network data; number and type of drivers; fleet size and type
driver work scheduling cost
Analytical Test no no no no
118 2009 Mauttone and Urquhart
A route set construction al-gorithm for the transit net-work design problem
Maximize demand coverage, minimize user cost (travel time) and operator cost (route number and length)
network structure; de-mand matrix
network configuration (route length and num-ber); travel time; fre-quencies
Pair Insertion al-gorithm (PIA)
Real Rivera, Uruguay 13 lines
Comparison between Route Generation Algo-rithm (Baaj and Mahmas-sani, 1995) and the au-thor's own algorithm
no no yes yes
119 2009 Mohaymany and Amiripour
Creating bus timetables under stochastic demand.
Minimize expected waiting times
demand function (sto-chastic); network con-figuration; max. fleet size
demand assignment; headways; waiting time; fleet size
Simulation Example Sample network 11 bus routes no no yes no
120 2009 Pacheco et al. A tabu search approach to an urban transport prob-lem in northern Spain
Minimizing waiting time and travel time
fleet size; drivers' work shifts; demand matrix; travel time ma-trix; network structure
network configuration; wait times; travel times; vehicle assign-ment
Heuristic (Local Search and Tabu search)
Real Burgos, Spain 382 stops, 24 lines, 36 buses
no no no yes
121 2010 Daganzo Structure of competitive transit networks
Minimize user and operator cost
demand matrix; route length; vehicle capac-ity
number of transfers; average travel time; zone size; headways
Analytical None
Explores relationship be-tween network type (ra-dial, grid, hub and spoke) and system cost and per-formance
no no yes no
122 2010 Fan and Mum-ford
A metaheuristic approach to the urban transit routing problem.
Minimize total travel time and number of transfers
demand matrix; travel time matrix; network structure
network configuration (number of routes); number of transfers; average travel time
Metaheuristic Benchmark Mandl's benchmark network
50 nodes and 65 links
no no no yes
123 2010 Guihaire and Hao
Transit network timeta-bling and vehicle assign-ment for regulating author-ities
Maximize quality and quantity of transfer opportuni-ties, minimize fleet size and dead-heading trip length
network configuration; initial timetable;
trip starting times; vehi-cle assignment; fleet size
Iterated Local Search algorithm
Realistic Data from Loiret area (France) with 3 me-dium-sized cities
50 lines, 673 stops
Simultaneous solution to timetabling and vehicle assignment problems
no no yes no
124 2010 Guihaire and Hao
Improving timetable quality in scheduled transit net-works.
Maximize quality and quantity of transfer opportuni-ties
maximal shift; driver trip assignment; vehi-cle trip assignment
departure times Tabu search Realistic Data from Loiret area (France) with 3 me-dium-sized cities
50 lines, 673 stops
Opposite approach: con-struct timetables from driver and vehicle assign-ment
no no yes no
125 2010 Lownes and Machemehl
Exact and heuristic meth-ods for public transit circu-lator design.
Minimize total cost (user, operator, un-served demand)
network structure; de-mand density; fre-quency bounds
network configuration; headways
Mixed integer method
Test Circulator line design - lo-cal feeder routes for com-muter train stations
no no yes no

Bus Network Design Problem: a review of approaches and solutions
84
Nº YEAR AUTHOR(S) TITLE OBJECTIVES CONSTRAINTS DECISION VARIABLES METHODOLOGY APP. TYPE APPLICATION CASE SAMPLE SIZE OBSERVATIONS PRESENT IN:
GH KK IR FH
126 2010 Yoo et al.
Frequency design in urban transit networks with varia-ble demand: model and al-gorithm.
Maximize total de-mand
fleet size; frequency bounds; demand function; network con-figuration; vehicle ca-pacity
passenger flow; fre-quency; waiting time
Gradient projec-tion
Example
Bi-level algorithm - rela-tionship between fre-quency (level of service) and passenger demand
no no yes no
127 2010 Yu et al. Genetic algorithm for bus frequency optimization
Minimize travel times
fleet size; demand matrix; vehicle capac-ity; network configura-tion
frequency; travel time; waiting time
Genetic algorithm Realistic Dalian, China 89 bus lines and 3004 bus stops
Bi-level algorithm - rela-tionship between fre-quency (level of service) and passenger demand
no no yes no
128 2011 Bagloee and Ceder
Transit-network design methodology for actual-size road networks
Minimize passen-ger discomfort (generalized time savings)
network structure; de-mand matrix (fixed); budget constraints; vehicle capacity
network configuration; frequencies; travel time savings; transfers; fleet size
Genetic algorithm Real
Mandl's benchmark network; Winnipeg, Canada (1976 data); Chicago rail network (2010 data)
no no yes no
129 2011 Curtin and Biba
The transit route arc-node service maximization prob-lem.
Maximize service value
budget constraints (distance); network structure
network configuration (number of routes); service value
Integer linear pro-gramming
Realistic Richardson, Texas (USA)
Cost as constraint and not as minimization objective
no no no yes
130 2011 Estrada et al.
Design and implementa-tion of efficient transit net-works: procedure, case study and validity test.
Minimize agency costs (capital costs, operating costs) and user cost (time)
passenger arrival rate; vehicle capacity; network structure; unit costs; policy head-ways
zone size; line spacing; route length; headways
Analytical Real Barcelona 11 lines
High performance bus transit network implemen-tation - use of idealized grid network as guide to real plan development
no no yes no
131 2011 Fan and Ma-chemehl
Bi-level optimization model for public transportation network redesign problem
Minimize total cost (operator, user, and unsatisfied de-mand cost), travel time and number of transfers
network constraints and requirements; fleet size and capac-ity; costs
network configuration (length and number of routes); demand as-signment; travel times; headways; load factor
Genetic algorithm Example Sample network 28 zones, 93 nodes, 284 arcs
no no yes no
132 2011 Szeto and Wu
A simultaneous bus route design and frequency set-ting problem for Tin Shui Wai, Hong Kong
Minimize transfers and total travel times
network structure; fleet size bounds; fre-quency bounds; de-mand matrix
route configuration; fre-quencies; transfers; average travel time
Genetic algorithm Real Tin Shui Wai, Hong Kong
23 stops, 7 ter-minals
Model devised from the solution of a real case
no no no no
133 2011 Wirasinghe and Van-debona
Route layout analysis for express buses
Minimizing operat-ing cost, passenger accessibility costs (waiting time, travel time)
network structure (passenger generator locations); demand matrix; average speed; unit costs
network configuration; travel time; waiting time;
Analytical Example Regular grid network Demand modelled through passenger gener-ators
no no no no
134 2012 Cipriani et al. Transit network design: A procedure and an applica-tion to a large urban area
Minimize total cost and resources
demand allocation; vehicle capacity; net-work structure; fre-quency bounds; load factor bounds
network configuration (route length); frequen-cies; load factor
Genetic algorithm Real Rome, Italy 1300 nodes, 7000 arcs
Consideration of a whole multimodal transit network (rapid rail system, bus, and tram lines)
no no yes yes
135 2012 dell'Olio et al. Optimizing bus-size and headway in transit net-works
Optimize the sys-tem's social costs (sum of user and operator costs)
network configuration; fleet size; headway bounds
frequency; bus capac-ity
Analytical (bi-level)
Real Santander 19 lines Bus size and frequency optimization
no no yes no

Bus Network Design Problem: a review of approaches and solutions
85
Nº YEAR AUTHOR(S) TITLE OBJECTIVES CONSTRAINTS DECISION VARIABLES METHODOLOGY APP. TYPE APPLICATION CASE SAMPLE SIZE OBSERVATIONS PRESENT IN:
GH KK IR FH
136 2012 Hadas and Shnaiderman
Public-transit frequency setting using minimum-cost approach with sto-chastic demand and travel time.
Maximize demand fulfilment (min empty seats) and service level
demand (both sto-chastic and determin-istic)
headways; vehicle ca-pacity
Analytical Example Numerical example
Frequency optimization for demand fulfilment ob-jective; also considers bus capacity optimization
no no yes no
137 2012 Hassold and Ceder
Multiobjective approach to creating bus timetables with multiple vehicle types
Minimize waiting times, optimize ve-hicle occupancy
bus capacity; demand headways; load factor Heuristic Real Auckland, New Zea-land
Timetable optimization considering multiple vehi-cle types (different capaci-ties) and balanced depar-ture times
no no yes no
138 2012 Ibarra-Rojas and Rios-Solis
Synchronization of bus timetabling
Maximize number of synchronizations
headway bounds; net-work configuration
departure times; line synchronizations; headways
Iterated local search
Realistic Monterrey, Mexico 300 bus lines Inter-urban transit line de-sign and integration with urban lines
no no yes no
139 2012 Liebchen and Stiller
Delay resistant timetabling
Maximize punctual-ity (minimize ex-pected waiting de-lay)
network structure; travel time
buffer times budget Heuristic None
Timetable optimization based on minimization of expected delays through application of buffer times
no no yes no
140 2012 Roca-Riu et al. The design of interurban bus networks in city cen-tres
Minimize user and operator costs
demand matrix; net-work configuration; travel times for each arc
route configuration; travel and waiting times; fleet size
Tabu search Real Barcelona, Spain 37 lines, 200 demand zones
Inter-urban transit line de-sign and integration with urban lines
no no yes no
141 2012 Sivakumaran et al.
Cost-savings properties of schedule coordination in a simple trunk-and-feeder transit system.
Minimize user cost (waiting and trans-fer times) and op-erator cost
vehicle speed; operat-ing and user costs; zone dimensions
feeder line headways; network configuration (route spacing)
Analytical Example Example network with single trunk and feeder lines
Feeder and trunk line net-work for commuter lines with a many-to-one de-mand structure (single CBD)
no no yes no
142 2012 Song et al.
Research on a Scientific Approach for Bus and Metro Networks Integra-tion
Maximize number of public transport users
demand matrix; de-mand assignment; network structure
travel times; number of transfers; network con-figuration (degree of line overlap); bus cov-erage; revenue
Analytical Real Daxing Line, Beijing, China
Integration of bus lines with a newly built metro line
no no no no
143 2012 Szeto and Jiang
Hybrid artificial bee colony algorithm for transit net-work design
Minimize total travel times and number of transfers
fleet size; demand matrix; network con-figuration constraints; frequency require-ments; network struc-ture; average speed
frequencies; number of transfers; network con-figuration; waiting time
Hybrid Enhanced Artificial Bee Col-ony algorithm (HEABC)
Real Suburban area of Tin Shui Wai, Hong Kong
no no yes no
144 2012 Tilahun and Ong
Bus timetabling as a fuzzy multi-objective optimiza-tion problem using prefer-ence-based genetic algo-rithm
Minimize waiting times (multiple ob-jectives)
routes and possible transfer points
initial departure times; waiting times
Genetic algorithm Test Example network 10 lines
Optimization of transfers on rural low-frequency (one bus per day) regional bus network
no no yes no

Bus Network Design Problem: a review of approaches and solutions
86
Nº YEAR AUTHOR(S) TITLE OBJECTIVES CONSTRAINTS DECISION VARIABLES METHODOLOGY APP. TYPE APPLICATION CASE SAMPLE SIZE OBSERVATIONS PRESENT IN:
GH KK IR FH
145 2012 Tribby and Zandbergen
High-resolution spatio-temporal modelling of pub-lic transit accessibility
Maximize accessi-bility (minimize to-tal travel times)
demand density (cen-sus population and land use data)
Walking time; waiting time; in-vehicle travel time; network configu-ration
Analytical Real Albuquerque, New Mexico
Application on new BRT lines; prioritizes accessi-bility by taking travel time as well as spatial GIS data about population
no no no no
146 2012 Yu et al. Transit route network de-sign-maximizing direct and transfer demand density
Maximize travel density
network structure; de-mand density; vehicle size
network configuration (route length); trans-fers; frequencies
Ant colony opti-misation
Real Dalian, China
Results prioritize express routes over feeder routes, minimizing travel times and transfers
no no yes no
147 2013 Ceder et al.
Approaching even-load and even-headway transit timetables using different bus sizes
Minimize load dis-crepancy and headway uneven-ness
fleet size; vehicle ca-pacity; bus loading data (demand)
time discrepancy (headway unevenness) and load discrepancy (variation of load fac-tor)
Heuristic Real Auckland, New Zea-land
Balance between even frequencies (operational inefficiency and crowding) and even load (less friendly for passengers)
no no yes no
148 2013 Chew et al. Genetic algorithm for bi-objective urban transit routing problem
Minimize user and operator costs
network structure; de-mand matrix; travel time matrix
average travel time; transfers; network con-figuration (route length, number of routes)
Genetic algorithm Benchmark Mandl's benchmark network
no no yes no
149 2013 Huang et al.
Optimizing bus frequen-cies under uncertain de-mand: case study of the transit network in a devel-oping city.
Minimize user and operator costs and travel time variance
fleet size; network configuration
travel times; frequen-cies
Genetic algorithm Real Liupanshui, China 16 lines Application to a small city in China (uncongested)
no no yes no
150 2013 Jiang et al.
Transit Network Design: A Hybrid Enhanced Artificial Bee Colony Approach and a Case Study
Minimize total travel times and number of transfers
fleet size; demand matrix; network struc-ture; network configu-ration constraints; pol-icy headways
frequencies; number of transfers; network con-figuration
Hybrid Enhanced Artificial Bee Col-ony algorithm (HEABC)
Real Suburban area of Tin Shui Wai, Hong Kong
Same as Szeto and Jiang (2012) with revisions
no no no no
151 2013 Kermanshahi et al.
Application of a new rapid transit network design model to bus rapid transit network design: Case study Isfahan Metropolitan Area
Maximize daily trip coverage index (meet a predeter-mined target travel time)
network configuration; demand matrix; budget
coverage; construction costs; travel time; net-work configuration
Analytical Real Isfahan, Iran 56 new lines
Algorithm to develop a set of new BRT routes or opti-mize extensions to pre-ex-isting ones given a fixed budget
no no no no
152 2013 Kuo
Design method using hy-brid of line-type and circu-lar-type routes for transit network system optimiza-tion
Minimize passen-ger travel time and number of transfers
network structure; travel time matrix; OD matrix; operator spec-ifications (number of lines; max route length)
network configuration (route length); number of transfers
Simulated an-nealing
Benchmark
Mandl's benchmark network and compar-ison with results from previous authors
no no no no
153 2013 Li et al. Expected value model for optimizing the multiple bus headways
Maximize operator profit, minimize passenger waiting time cost
vehicle capacity; pas-senger arrival rate; network structure; unit costs
headways; waiting time Hybrid intelligent algorithm (SS and GA)
Test
Numerical experi-ment and compari-son with previous au-thors
Optimize frequencies with stochastic passenger arri-val times and travel times
no no yes no

Bus Network Design Problem: a review of approaches and solutions
87
Nº YEAR AUTHOR(S) TITLE OBJECTIVES CONSTRAINTS DECISION VARIABLES METHODOLOGY APP. TYPE APPLICATION CASE SAMPLE SIZE OBSERVATIONS PRESENT IN:
GH KK IR FH
154 2013 Medina et al.
Model for the optimal loca-tion of bus stops and its application to a public transport corridor in Santi-ago, Chile
Minimize user, op-erator, and capital costs
demand data (contin-uous); unit costs; net-work structure
network configuration (density of stops); headways
Analytical Real Grecia Avenue public transport corridor, Santiago, Chile
1 line, 22 stops Realistic modelling with multiple cost and vehicle specification parameters
no no yes no
155 2013 Mesa et al. Locating optimal timeta-bles and vehicle sched-ules in a transit line
Minimize user in-convenience costs
fleet size and capac-ity; travel and stop-ping times; vehicle trip assignment
inconvenience cost; demand coverage
Clustering algo-rithm
Test Numerical test no no yes no
156 2013 Nikolic and Teodorovic
Transit network design by bee colony optimization
Minimize number of transfers and to-tal travel time
travel time matrix; de-mand matrix; network structure
number of transfers; demand satisfaction; average travel time; network configuration
Artificial bee col-ony algorithm
Benchmark
Mandl's benchmark network and compar-ison with results from previous authors
no no yes no
157 2013 Sun et al. Joint optimization of a rail transit route and bus routes in a transit corridor
Maximize rail rid-ership and mini-mize total travel time
network configuration
rail ridership; total travel times (waiting; in-vehicle; transfer); network configuration (route node sequence)
Genetic algorithm Example Numerical example (model network)
Multimodal transit system (Railway and bus transport)
no no no no
158 2013 Verbas and Mahmassani
Optimal allocation of ser-vice frequencies over transit network routes and time periods: formulation, solution and implementa-tion using bus route pat-terns
Maximize ridership and waiting time savings, minimize net cost
fleet size and capac-ity; policy headways; budget constraints
headways; waiting time savings; ridership
Nonlinear optimi-sation (KNITRO)
Example Two model lines no no yes no
159 2013 Yan et al.
Robust optimization model of bus transit network de-sign with stochastic travel time
Minimize expected value and variabil-ity of operator cost
network structure; travel time data; de-mand matrix; route configuration con-straints
network configuration; frequency; number of transfers
Simulated an-nealing
Benchmark Mandl's benchmark network
Network design with the objective of obtaining ro-bust arrivals under sto-chastic travel time
no no yes no
160 2014 Amiripour et al.
Designing large-scale bus network with seasonal var-iations of demand
Minimize total wait-ing time, fleet size, total differences from the shortest path and empty seats hours
budget; max. unsatis-fied demand; network structure; fleet size bounds; demand ma-trix (variable)
headways; deviation of shortest paths; number of transfers; network configuration; fleet size
Genetic algorithm Real Mashhad, Iran 756 nodes, 1204 links
Large-scale network - considers seasonal varia-tion
no no yes no
161 2014 Badia et al. Competitive transit net-work design in cities with radial street patterns
Minimize total cost (user and operator)
demand distribution; transport technology; network structure
zone size; line and stop spacing; head-ways
Analytical None Sensitivity analysis no no no no
162 2014 Cooper et al.
Optimising large scale public transport network design problems using mixed-mode parallel multi-objective evolutionary al-gorithms
Minimize total cost (user and operator)
travel time matrix; de-mand matrix; road network
average travel time; network configuration
Parallel Genetic algorithms
Realistic Cardiff, UK 70 bus stops no no no no
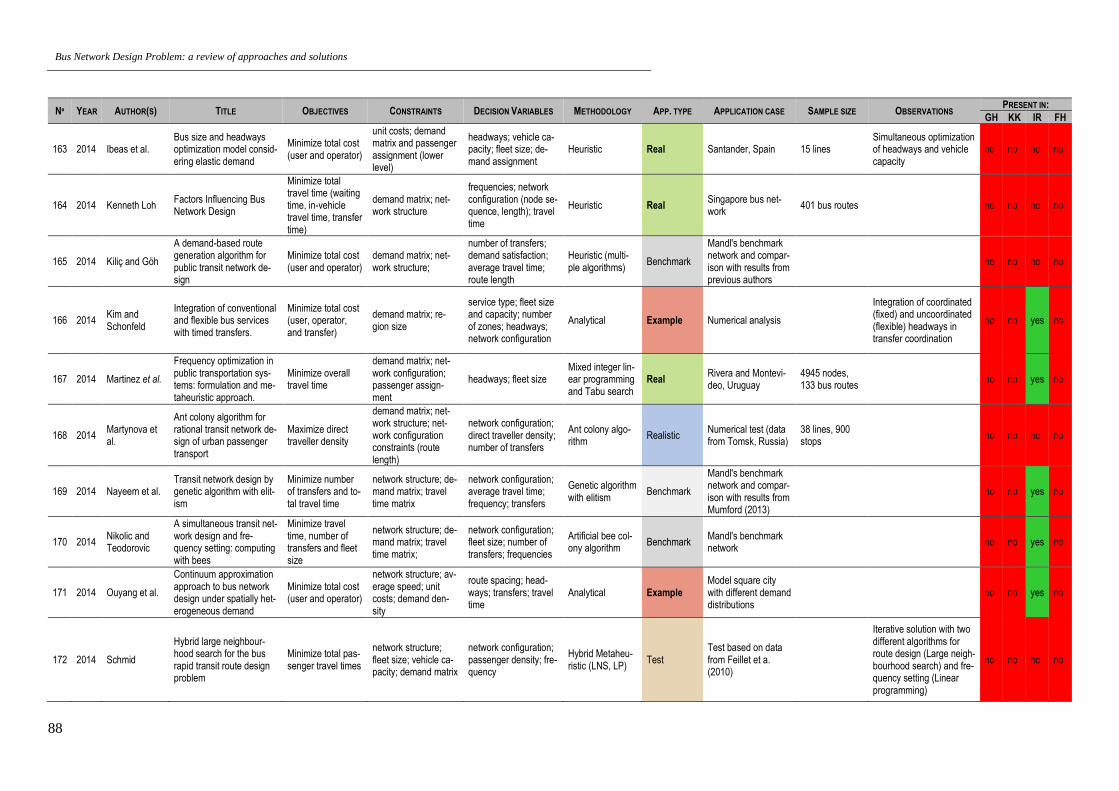
Bus Network Design Problem: a review of approaches and solutions
88
Nº YEAR AUTHOR(S) TITLE OBJECTIVES CONSTRAINTS DECISION VARIABLES METHODOLOGY APP. TYPE APPLICATION CASE SAMPLE SIZE OBSERVATIONS PRESENT IN:
GH KK IR FH
163 2014 Ibeas et al. Bus size and headways optimization model consid-ering elastic demand
Minimize total cost (user and operator)
unit costs; demand matrix and passenger assignment (lower level)
headways; vehicle ca-pacity; fleet size; de-mand assignment
Heuristic Real Santander, Spain 15 lines Simultaneous optimization of headways and vehicle capacity
no no no no
164 2014 Kenneth Loh Factors Influencing Bus Network Design
Minimize total travel time (waiting time, in-vehicle travel time, transfer time)
demand matrix; net-work structure
frequencies; network configuration (node se-quence, length); travel time
Heuristic Real Singapore bus net-work
401 bus routes no no no no
165 2014 Kiliç and Göh
A demand-based route generation algorithm for public transit network de-sign
Minimize total cost (user and operator)
demand matrix; net-work structure;
number of transfers; demand satisfaction; average travel time; route length
Heuristic (multi-ple algorithms)
Benchmark
Mandl's benchmark network and compar-ison with results from previous authors
no no no no
166 2014 Kim and Schonfeld
Integration of conventional and flexible bus services with timed transfers.
Minimize total cost (user, operator, and transfer)
demand matrix; re-gion size
service type; fleet size and capacity; number of zones; headways; network configuration
Analytical Example Numerical analysis
Integration of coordinated (fixed) and uncoordinated (flexible) headways in transfer coordination
no no yes no
167 2014 Martinez et al.
Frequency optimization in public transportation sys-tems: formulation and me-taheuristic approach.
Minimize overall travel time
demand matrix; net-work configuration; passenger assign-ment
headways; fleet size Mixed integer lin-ear programming and Tabu search
Real Rivera and Montevi-deo, Uruguay
4945 nodes, 133 bus routes
no no yes no
168 2014 Martynova et al.
Ant colony algorithm for rational transit network de-sign of urban passenger transport
Maximize direct traveller density
demand matrix; net-work structure; net-work configuration constraints (route length)
network configuration; direct traveller density; number of transfers
Ant colony algo-rithm
Realistic Numerical test (data from Tomsk, Russia)
38 lines, 900 stops
no no no no
169 2014 Nayeem et al. Transit network design by genetic algorithm with elit-ism
Minimize number of transfers and to-tal travel time
network structure; de-mand matrix; travel time matrix
network configuration; average travel time; frequency; transfers
Genetic algorithm with elitism
Benchmark
Mandl's benchmark network and compar-ison with results from Mumford (2013)
no no yes no
170 2014 Nikolic and Teodorovic
A simultaneous transit net-work design and fre-quency setting: computing with bees
Minimize travel time, number of transfers and fleet size
network structure; de-mand matrix; travel time matrix;
network configuration; fleet size; number of transfers; frequencies
Artificial bee col-ony algorithm
Benchmark Mandl's benchmark network
no no yes no
171 2014 Ouyang et al.
Continuum approximation approach to bus network design under spatially het-erogeneous demand
Minimize total cost (user and operator)
network structure; av-erage speed; unit costs; demand den-sity
route spacing; head-ways; transfers; travel time
Analytical Example Model square city with different demand distributions
no no yes no
172 2014 Schmid
Hybrid large neighbour-hood search for the bus rapid transit route design problem
Minimize total pas-senger travel times
network structure; fleet size; vehicle ca-pacity; demand matrix
network configuration; passenger density; fre-quency
Hybrid Metaheu-ristic (LNS, LP)
Test Test based on data from Feillet et a. (2010)
Iterative solution with two different algorithms for route design (Large neigh-bourhood search) and fre-quency setting (Linear programming)
no no no no

Bus Network Design Problem: a review of approaches and solutions
89
Nº YEAR AUTHOR(S) TITLE OBJECTIVES CONSTRAINTS DECISION VARIABLES METHODOLOGY APP. TYPE APPLICATION CASE SAMPLE SIZE OBSERVATIONS PRESENT IN:
GH KK IR FH
173 2014 Szeto and Jiang
Transit route and fre-quency design: Bi-level modelling and hybrid artifi-cial bee colony algorithm approach
Minimize number of transfers
travel time matrix; ve-hicle capacity; fleet size bounds; fre-quency bounds; net-work structure
transfers; waiting time; network configuration; frequency; fleet size
Artificial bee col-ony algorithm
Realistic Tin Shui Wai, Hong Kong and Winnipeg, Canada
154 zones, 1067 nodes, and 2995 arcs (Winnipeg)
no no yes no
174 2014 Tirachini et al.
Multimodal pricing and op-timal design of urban pub-lic transport: The interplay between traffic congestion and bus crowding
Maximize social welfare (operator, bus user and car user costs)
network configuration; demand matrix
fares; frequencies; bus capacity and occu-pancy rate; modal split
Analytical Real Military Road in North Sydney, Aus-tralia
Single line with 12 zones
Multi-modal analysis (modal split between car, walking and bus) with pricing considerations
no no no no
175 2014 Wu et al. Modelling the coordinated operation between bus rapid transit and bus
Minimize total cost (user and operator)
network configuration; unit costs; demand data; vehicle capacity
system costs; head-ways
Genetic algorithm Real Beijing, China 1 BRT route, 8 feeder lines
Frequency optimization based on interaction be-tween a trunk BRT route and various feeder lines through transfer stops
no no yes no
176 2014 Yao et al. Transit network design based on travel time relia-bility
Minimize passen-ger time cost, transfer time and reliability
demand matrix; net-work structure;
number of transfers; reliable travel time; network configuration
Tabu search Example Numerical example of small and medium sized networks
no no no no
177 2014 Zhang et al. Agent-based simulation and optimization of Urban transit system
Minimize operator cost (upper level) and passenger time cost (lower level)
network configuration frequencies; passen-ger flow
Agent-based sim-ulation
Test Numerical examples Focus on lower level (pas-senger decision) model
no no no no
178 2015 An and Lo
Robust transit network de-sign with stochastic de-mand considering devel-opment density
Minimize total cost
population density (demand) over time; network structure; user equilibrium; vehi-cle capacity; unit costs
network configuration; headways; passenger flows
Analytical Example Model linear network 8 nodes
Multimodal network of rapid transit lines and flex-ible bus feeder lines - con-sideration of land use and density
no no no no
179 2015 Arbex and Da Cunha
Efficient transit network design and frequencies setting multi-objective opti-mization by alternating ob-jective genetic algorithm
Minimize passen-ger and operator cost
network configuration; travel times; demand matrix
waiting times; number of transfers; unsatisfied demand; fleet size
Alternating Ob-jective Genetic algorithm
Benchmark Mandl's benchmark network
no no no no
180 2015 Cancela, et al. Mathematical program-ming formulations for transit network design
Maximize operator profit and user con-venience (service coverage, total travel time)
passenger assign-ment model and de-mand matrix; network structure; fleet size; vehicle capacity
transfers; network con-figuration (length); headways
Mixed integer lin-ear programming
Real Rivera, Uruguay
13 lines, 84 nodes, 143 arcs and 378 OD-pairs
no no no no
181 2015 Klier and Haase
Urban public transit net-work optimization with flexible demand
Maximize expected ridership
network structure; travel time matrix; budget; costs;
number of transfers; headways; network configuration; expected ridership
Analytical Realistic Dresden, Germany
No fixed demand matrix: consideration of influence of level of service on ex-pected ridership
no no no no

Bus Network Design Problem: a review of approaches and solutions
90
Nº YEAR AUTHOR(S) TITLE OBJECTIVES CONSTRAINTS DECISION VARIABLES METHODOLOGY APP. TYPE APPLICATION CASE SAMPLE SIZE OBSERVATIONS PRESENT IN:
GH KK IR FH
182 2015 Pternea et al. Sustainable urban transit network design
Minimize user and operator costs, minimize environ-mental impacts
network structure; fre-quency bounds; fleet size; vehicle typology
frequencies: network configuration; vehicle assignment; emis-sions; travel time
Mathematical and Metaheuristic (GA)
Real Heraklion, Crete, Greece
10 lines, 50 stops, 100 buses
Consideration of mixed fleet of conventional and electric buses (and their limitations) as constraints to the TNDP
no no no no
183 2015 Saleeshya and Anirudh
A bi-level approach to fre-quency optimisation of public transport systems
Minimize operator losses
network configuration; fleet capacity (bus type); demand data
fleet size; frequencies; travel time; operating costs
Artificial neural network (first level), Genetic al-gorithm (second level)
Example no no no no
184 2015 Verbas and Mahmassani
Integrated frequency allo-cation and user assign-ment in multi-modal transit networks: methodology and application to large-scale urban systems
Maximize waiting time savings
fleet size and capac-ity; budget; policy headways; network configuration
frequencies; total travel times; number of trans-fers
Heuristic (bi-level program)
Real Chicago Transit Au-thority network (USA)
134 routes, 13754 nodes, 63602 arcs (multimodal net-work)
Bilevel solution framework no no yes no
185 2015 Verbas et al.
Stretching resources: sen-sitivity of optimal bus fre-quency allocation to stop-level demand elasticities
Maximize ridership and waiting time savings
demand elasticity; network configuration; fleet size and capac-ity; policy headways; unit costs
headways; ridership Analytical Realistic Test based on Chi-cago bus network (large scale)
132 routes, 11,598 stops
Consideration of demand elasticity in frequency set-ting problems
no no yes no
186 2015 Wang and Qu Rural bus route design problem: Model develop-ment and case studies
Minimize route length
network structure network configuration (route length)
Dynamic pro-gramming
Real Pacific Pines (Suburb of Gold Coast, Aus-tralia)
Single line
Design of single suburban commuter line, demand and capacity considera-tions simplified
no no no no
187 2015 Zhao et al. The Memetic algorithm for the optimization of urban transit network
Minimize user cost and unsatisfied passenger demand
demand matrix; num-ber of transfers; fleet size and capacity
route configuration; fre-quencies
Memetic algo-rithm
Benchmark Mandl's benchmark network
no no no no
188 2016 An and Lo
Two-phase stochastic pro-gram for transit network design under demand un-certainty
Minimize operating cost while satisfy-ing demand
demand matrix; net-work structure; fre-quency bounds; unit costs
route configuration; fre-quencies; passenger flow;
Improved gradi-ent method, Neighbourhood search
Benchmark Benchmark networks
Combination of rigid (rapid transit) and flexible routes generated and optimized in two different phases
no no no no
189 2016 Fouilhoux et al.
Valid inequalities for the synchronization bus time-tabling problem
Maximize total number of synchro-nizations
network configuration; headway bounds
departure times; syn-chronization nodes
Mixed integer programming
Test
Difference between trans-fer nodes and congestion nodes and application of flexible headways to opti-mize transfers
no no no no
190 2017 Griswold et al.
Optimizing urban bus transit network design can lead to greenhouse gas emissions reduction
Minimize total sys-tem costs and greenhouse gas emissions
demand density; fleet characteristics; emis-sion factors
zone size; line spacing; headways; emissions
Continuum ap-proximation
Real Barcelona, Spain 11 lines
Extension of previous work by Daganzo (2010) and Estrada et al. (2011) to include analysis of GHG emissions
no no no no

Bus Network Design Problem: a review of approaches and solutions
91
Nº YEAR AUTHOR(S) TITLE OBJECTIVES CONSTRAINTS DECISION VARIABLES METHODOLOGY APP. TYPE APPLICATION CASE SAMPLE SIZE OBSERVATIONS PRESENT IN:
GH KK IR FH
191 2018 Boyer et al. Vehicle and Crew Sched-uling for Flexible Bus Transportation Systems
Minimize operating costs (drivers and vehicles)
labour regulations for drivers (max. driving hours, mandatory breaks); compatibility of trip-driver, vehicle-driver, and trip-vehicle pairs
driver working time (idle time plus driving time); vehicle cost
Variable neigh-bourhood search
Realistic Data from Monterrey, Mexico
400 randomly generated sets based on real data
Considers a three-way compatibility between drivers, vehicles, and routes as constraints for operational optimization
no no no no
192 2018 Buba and Lee
A differential evolution for simultaneous transit net-work design and fre-quency setting problem
Minimize user and operator costs
demand matrix; travel time matrix; existing road network; route length bounds; head-way bounds; bus size
route configuration; travel time; headways; fleet size
Differential evolu-tion algorithm (metaheuristic)
Benchmark Mandl's benchmark network
no no no no
193 2018 Ceder and Liu
Integrated public transport timetable synchronization and vehicle scheduling with demand assignment: A bi-objective bi-level model using deficit func-tion approach
Minimize total travel time and fleet size
network configuration; demand matrix; travel time matrix; vehicle capacity; load factor constraints; average speed
fleet size; travel time; waiting time; departure times; demand assign-ment
Deficit function search method
Example Medium-sized model city
Integration of timetabling and vehicle scheduling
no no no no
194 2018 Krylatov and Shirokolobova
Evolutionary optimization of the public transit net-work
Minimize travel times and fleet ca-pacity
demand matrix; exist-ing road network; bus capacity
fleet size; travel time; number of routes; headways
Evolutionary al-gorithm (me-taheuristic)
Real Omsk, Russia 1280 bus stops, 151 routes
Case application reduced number of buses in opera-tion and number of lines for similar travel time re-sults
no no no no
195 2018 Owais and Os-man
Complete hierarchical multi-objective genetic al-gorithm for transit network design problem
Minimize user and operator costs
network structure; de-mand matrix (with un-certainty); route length; vehicle capac-ity
transfers; frequencies; fleet size; average travel time
Genetic algorithm Realistic Rivera, Uruguay and Mandl's benchmark network
84 nodes, 143 arcs and 378 O/D pairs
no no no no
196 2018 Volotskiy et al.
An Accessibility Driven Evolutionary Transit Net-work Design Approach in the Multi-agent Simulation Environment
Maximize accessi-bility
network structure (zones, stops); subsi-dies; population den-sity
network configuration (routes, stops); acces-sibility index
Agent based sim-ulation
Real Cottbus, Germany and Krasnoyarsk, Russia
33 routes Accessibility maximization model focused on para-transit network
no no no no
197 2019 Ahmed et al. Solving urban transit route design problem using se-lection hyper-heuristics
Minimize passen-ger travel time and operator costs
network structure; travel time matrix; de-mand matrix;
network configuration; transfers; average travel time
Selection hyper-heuristics
Benchmark Mandl's benchmark network
no no no no
198 2019 Carosi et al. A matheuristic for inte-grated timetabling and ve-hicle scheduling
Minimize user (timetabling) and operator costs (ve-hicle scheduling)
network configuration; headways (ideal)
headways; waiting time; travel time; dead-heading time; depar-ture times
Matheuristic Realistic Milan, Italy 12 lines Integration of timetabling and vehicle scheduling in a simultaneous approach
no no no no
199 2019 Cipriani et al. Transit network design for small-medium size cities
Minimize weighted sum of user and operator cost
network structure (roads, terminals); ve-hicle capacity; de-mand matrix
total travel time; trans-fers; fleet size; network configuration; fre-quency
Heuristic Real Foligno, Italy (55000 inhabitants)
16 bus lines
Consideration of specifici-ties of small cities' urban form and the challenges they pose to bus network design, as well as
no no no no

Bus Network Design Problem: a review of approaches and solutions
92
Nº YEAR AUTHOR(S) TITLE OBJECTIVES CONSTRAINTS DECISION VARIABLES METHODOLOGY APP. TYPE APPLICATION CASE SAMPLE SIZE OBSERVATIONS PRESENT IN:
GH KK IR FH
different passenger be-haviour than larger cities
200 2019 Duran et al. Transit network design with pollution minimization
Minimize travel time and emissions
network structure; de-mand matrix (fixed); fleet size bounds; de-mand assignment
network structure; fre-quencies; fleet size; modal split; emissions
Genetic algorithm Benchmark
Mandl's benchmark network and compar-ison with results from previous authors
Three problem definitions with increasing number of constraints, including in-corporation of modal split between cars and buses
no no no no
201 2019 Feng et al.
A new transit network de-sign study in consideration of transfer time composi-tion
Minimize travel time and number of transfers
demand matrix; travel time matrix; average walking times
network configuration; total travel time; num-ber of transfers; trans-fer time; route length
Genetic algorithm Example Abstract bus network based on a medium Chinese city
344 bus stops, 39 lines
Topological generation of a bus network considering impact of variable transfer times in total travel time
no no no no
202 2019 Islam et al.
A heuristic aided Stochas-tic Beam Search algorithm for solving the transit net-work design problem
Maximize demand satisfaction, mini-mize total travel time
demand matrix; travel time matrix; bus ca-pacity; minimum fre-quency
network configuration; headways; total travel time; fleet size; rid-ership
Heuristic, Sto-chastic beam search
Benchmark
Mandl's benchmark network and compar-ison with results from previous authors
no no no no
203 2019 Jha et al.
A multi-objective meta-heuristic approach for transit network design and frequency setting problem in a bus transit system
Minimize travel time and operating costs
road network; de-mand matrix; travel time matrix; fleet size; headway bounds; car-bon emissions
route configuration; headways; number of transfers; demand sat-isfaction; average travel time
Metaheuristic (multi-objective particle swarm optimisation with multiple search strategies)
Benchmark
Mandl's benchmark network and compar-ison with results from previous authors
no no no no
204 2019 Liang et al.
Bus transit network design with uncertainties on the basis of a metro network: A two-step model frame-work
Minimize user and operator costs
network structure; sto-chastic demand func-tion; vehicle capacity; frequency bounds; ex-isting schedules (metro); fleet size
network configuration; frequencies; passen-ger flows
Linear program-ming
Real Beijing Second Ring public transit network
14 metro sta-tions and 38 bus stops, 106 nodes and 1706 arcs
Coordinate bus and metro network under demand and travel time uncertainty
no no no no
205 2019 Nayeem et al.
Solving Transit Network Design Problem Using Many-Objective Evolution-ary Approach
Minimize travel and waiting time, trans-fers, fleet size, route length and unsatisfied demand
network structure (set); demand matrix; frequency bounds; ve-hicle capacity; net-work configuration constraints (routes, stops)
travel time; waiting time; transfers, fleet size; network configu-ration (length, overlap); frequencies
Evolutionary al-gorithm
Benchmark Mandl's benchmark network
no no no no
206 2019 Nnene et al.
Transit network design with meta-heuristic algo-rithms and agent-based simulation
Minimize user and operator cost
network structure (set); frequency bounds; network con-figuration constraints
network configuration; frequencies; demand assignment; travel time
Agent based sim-ulation (metaheu-ristic)
Real Cape Town, South Africa
472 nodes, 46 routes
Agent based simulation of demand and route choice as basis for network de-sign
no no no no
207 2019 Sun and Szeto
Optimal sectional fare and frequency settings for transit networks with elas-tic demand
Maximize operator profit
existing network con-figuration; frequency bounds; fare bounds; vehicle capacity; unit costs; demand func-tion
frequencies; fares; de-mand assignment
Heuristic Real Tin Shui Wai, Hong Kong
7 nodes Determination of sectional fares and frequencies with elastic demand
no no no no

Bus Network Design Problem: a review of approaches and solutions
93
Nº YEAR AUTHOR(S) TITLE OBJECTIVES CONSTRAINTS DECISION VARIABLES METHODOLOGY APP. TYPE APPLICATION CASE SAMPLE SIZE OBSERVATIONS PRESENT IN:
GH KK IR FH
208 2019 Torabi and Salari
Limited-stop bus service: A strategy to reduce the unused capacity of a transit network
Minimize total fleet unused capacity and total travel time
vehicle capacity; travel time matrix; de-mand matrix; fre-quency bounds; rid-ership bounds
route configuration; passenger assignment; frequencies
Metaheuristic Test
Optimize network configu-ration to minimize unused capacity while balancing user costs through service level constraints
no no no no
209 2019 Wu et al.
Stochastic bus schedule coordination considering demand assignment and rerouting of passengers
Minimize user and operator costs
network configuration; unit costs; vehicle ca-pacity; travel time ma-trix
headways; slack times; passenger flow distri-bution
Mixed integer programming
Example Numerical example
Schedule coordination considering service dis-ruptions and rerouting costs
no no no no
210 2020 Abdolmaleki et al.
Transit timetable synchro-nization for transfer time minimization
Minimize total pas-senger waiting time
route structure; fixed headways; travel times
departure times Approximation al-gorithm
Realistic Mashhad, Iran (Shafahi and Khani, 2010)
139 two-way lines, 3618 stopping sta-tions
no no no no
211 2020 Chai and Liang
An Improved NSGA-II Al-gorithm for Transit Net-work Design and Fre-quency Setting Problem
Minimize passen-ger travel time and fleet size
bus capacity; route configuration and headway bounds
headways; fleet size Genetic algorithm (NSGA-II)
Benchmark Mandl's benchmark network
no no no no
212 2020 Duran-Micco et al.
Considering emissions in the transit network design and frequency setting problem with a heteroge-neous fleet
Minimize passen-ger travel time and CO2 emissions
unit costs and CO2 emissions; budget constraint (operator cost limitation); de-mand matrix (fixed)
number of transfers; frequencies; bus type assignment
Memetic algo-rithm
Benchmark Benchmark networks
Travel time and emissions optimization through as-signment of different bus types (different capacity and emissions) for each line
no no no no
213 2020 Oliker and Bekhor
An infeasible start heuris-tic for the transit route net-work design problem
Minimize passen-ger travel time
fleet size; headway bounds; demand as-signment
network configuration; headways; travel time
Heuristic (Infeasi-ble start algo-rithm)
Real Winnipeg, Canada 154 zones, 2975 links, 903 nodes
Candidate route genera-tion in first phase and opti-mization and headway as-signment in second phase. Operator cost as constraint and not objec-tive
no no no no
214 2020 Ranjbari et al.
A network design problem formulation and solution procedure for intercity transit services
Minimize passen-ger travel time and deadheading time
network structure; de-mand matrix; fre-quency bounds; vehi-cle capacity; unit costs
network configuration (number of routes); fleet size; frequencies; total travel time; de-mand coverage
Mixed integer lin-ear programming
Real Intercity bus service in Arizona, USA
22 terminals, 30 routes and 390 vehicles
no no no no
215 2020 Shi and Gao Analysis of a Flexible Transit Network in a Ra-dial Street Pattern
Minimize overall system costs
unit costs; average speed; street pattern;
waiting time; travel time; number of routes; headways; fleet size
Genetic algorithm Test Sensitivity analysis and comparison with fixed models
Idealized evenly spaced ring routes as structure for flexible transit service
no no no no
216 2020 Wu et al. Optimal design of transit networks fed by shared bikes
Minimize user and operator costs
network structure; unit costs; headway bounds; vehicle ca-pacity; average speed
station catchment area (walking/biking dis-tance; station spacing); total travel times; capi-tal and operating costs
Analytical Test Numerical analysis
Shared bikes considered as first and last mile transport as alternative to walking and feeder buses
no no no no

Bus Network Design Problem: a review of approaches and solutions
94
Nº YEAR AUTHOR(S) TITLE OBJECTIVES CONSTRAINTS DECISION VARIABLES METHODOLOGY APP. TYPE APPLICATION CASE SAMPLE SIZE OBSERVATIONS PRESENT IN:
GH KK IR FH
217 2020 Zhang et al.
Transit route network de-sign for low-mobility indi-viduals using a hybrid me-taheuristic approach
Minimize, transfer, and unsatisfied de-mand costs with priority for low mo-bility individuals
min/max headway and route length con-straints; vehicle ca-pacity and speed; fleet size
route length; head-ways; passenger as-signment; travel times
Hybrid Metaheu-ristic
Realistic Wenling, China Priority given to accessi-bility of the network in the design phase
no no no no

Bus Network Design Problem: a review of approaches and solutions
95
APPENDIX B
LEGEND
OBJECTIVE (MIN.) CONSTRAINTS DECISION VARIABLES
UC – User Cost DZ – Demand Data RI – Ridership
AT – Access Time DD – Demand Density DT – Departure Times
TT – Travel Time DF – Demand Function DR – Driver Shifts
WT – Waiting Time DM – Demand Matrix €€ - Fares
TR – Number of Transfers MS – Modal Split F€ - Fixed Cost
OC – Operator Cost PA – Passenger Arrival Rate FS – Fleet Size
FS – Fleet size AS – Average Speed FR - Frequencies
LF – Load Factor BS – Vehicle Capacity NW – Network Configuration
DH – Deadheading Time FS – Fleet Size O€ - Operating Costs
CO – Emissions DW – Dwell Time OO – Other
OO - Other B€ - Budget Constraints DW – Dwell Time
S€ - Subsidies VA – Vehicle Assignment
OBJECTIVE (MAX.) U€ - Unit Costs VC – Vehicle Capacity
CV – Coverage EF – Existing Frequencies
TR – Potential Transfers NC – Existing Network Config. PROBLEM TYPE
WF – Welfare ES – Existing Schedules ND – Network Design
P€ – Profit FR – Frequency Bounds FS – Frequency Setting
RI – Ridership NX – Network Config. Constraints TT – Timetabling
PF – Passenger Flow NS – Network Structure VS – Vehicle Scheduling
OO – Other TT – Travel Time Matrix DS – Driver Scheduling
CX – Driver Shift Constraints
CO – Emissions
LF – Load Factor
OO – Other

Bus Network Design Problem: a review of approaches and solutions
96
Nº YEAR AUTHOR(S) OBJECTIVE (MIN) OBJECTIVE (MAX) CONSTRAINT CATEGORIES
DECISION VARIABLE CATEGORIES PROBLEM TYPE USER OPERATOR USER OPERATOR DEMAND FLEET BUDGET NETWORK OTHER
UC AT TT WT TR OC FS LF DH CO OO CV TR WF P€ RI PF OO DZ DD DF DM MS PA AS BS FS DW B€ S€ U€ EF NC ES FR NX NS TT CX CO LF OO RI DT DR €€ F€ FS FR NW O€ OO DW VA VC ND FS TT VS DS
1 1967 Lampkin and Saalmans
● ● ● ● ● ● ● ● ● ●
2 1971 Newell ● ● ● ● ● ●
3 1971 Rea ● ● ● ● ● ● ● ●
4 1972 Salzborn ● ● ● ● ● ● ●
5 1973 Hurdle ● ● ● ● ● ● ● ●
6 1974 Silman et al. ● ● ● ● ● ● ● ● ●
7 1975 Byrne ● ● ● ● ● ● ● ● ●
8 1975 Clarens and Hurdle ● ● ● ● ● ● ● ● ● ●
9 1976 Byrne ● ● ● ● ● ● ● ● ●
10 1976 Rapp ● ● ● ● ● ● ● ●
11 1978 Black ● ● ● ● ● ● ● ● ● ●
12 1979 Dubois et al. ● ● ● ● ● ● ● ● ● ●
13 1979 Newell ● ● ● ● ● ● ● ●
14 1980 Mandl ● ● ● ● ● ● ● ● ●
15 1980 Salzborn ● ● ● ● ● ● ●
16 1980 Scheele ● ● ● ● ● ● ●
17 1981 Furth and Wil-son
● ● ● ● ● ● ● ● ● ●
18 1982 Han and Wil-son
● ● ● ● ● ● ● ● ● ● ● ●
19 1982 Kocur and Hendrickson
● ● ● ● ● ● ● ● ● ● ●
20 1983 Tsao and Schonfeld ● ● ● ● ● ● ● ● ●
21 1984 Ceder ● ● ● ● ● ● ● ● ● ● ● ●
22 1984 Marwah et al. ● ● ● ● ● ● ● ● ● ●
23 1984 Morlok and Viton
● ● ● ● ● ● ● ● ● ● ●

Bus Network Design Problem: a review of approaches and solutions
97
Nº YEAR AUTHOR(S) OBJECTIVE (MIN) OBJECTIVE (MAX) CONSTRAINT CATEGORIES
DECISION VARIABLE CATEGORIES PROBLEM TYPE USER OPERATOR USER OPERATOR DEMAND FLEET BUDGET NETWORK OTHER
UC AT TT WT TR OC FS LF DH CO OO CV TR WF P€ RI PF OO DZ DD DF DM MS PA AS BS FS DW B€ S€ U€ EF NC ES FR NX NS TT CX CO LF OO RI DT DR €€ F€ FS FR NW O€ OO DW VA VC ND FS TT VS DS
24 1986 Ceder and Wilson ● ● ● ● ● ● ● ● ● ● ● ● ● ● ● ● ●
25 1986 Vaughan ● ● ● ● ● ● ● ● ● ●
26 1987 Klemt and Stemme ● ● ● ● ● ●
27 1987 Van Oudheusden et al
● ● ● ● ● ● ● ●
28 1988 Leblanc ● ● ● ● ● ● ●
29 1988 Van Nes et al. ● ● ● ● ● ● ● ● ● ● ●
30 1989 Domschke ● ● ● ● ● ●
31 1991 Baaj and Mahmassani
● ● ● ● ● ● ● ● ● ●
32 1991 Chang and Schonfeld
● ● ● ● ● ● ● ● ● ● ●
33 1992 Bookbinder and Désilets
● ● ● ● ●
34 1993 Chang and Schonfeld
● ● ● ● ● ● ● ● ● ● ●
35 1993 Chang and Schonfeld ● ● ● ● ● ● ● ● ●
36 1993 Spasovic and Schonfeld ● ● ● ● ● ● ● ● ● ●
37 1994 Spasovic et al.
● ● ● ● ● ● ● ● ● ● ●
38 1995 Baaj and Mahmassani ● ● ● ● ● ● ● ● ● ●
39 1995 Chakroborty et al.
● ● ● ● ● ● ● ● ●
40 1995 Constantin and Florian
● ● ● ● ● ● ●
41 1995 Daduna and Voss
● ● ● ● ●
42 1997 Chien and Schonfeld ● ● ● ● ● ● ● ● ● ●
43 1998 Bielli et al. ● ● ● ● ● ● ●
44 1998 Ceder and Is-raeli ● ● ● ● ● ● ● ● ● ● ● ● ● ● ● ● ●

Bus Network Design Problem: a review of approaches and solutions
98
Nº YEAR AUTHOR(S) OBJECTIVE (MIN) OBJECTIVE (MAX) CONSTRAINT CATEGORIES
DECISION VARIABLE CATEGORIES PROBLEM TYPE USER OPERATOR USER OPERATOR DEMAND FLEET BUDGET NETWORK OTHER
UC AT TT WT TR OC FS LF DH CO OO CV TR WF P€ RI PF OO DZ DD DF DM MS PA AS BS FS DW B€ S€ U€ EF NC ES FR NX NS TT CX CO LF OO RI DT DR €€ F€ FS FR NW O€ OO DW VA VC ND FS TT VS DS
45 1998 Imam ● ● ● ● ● ● ● ● ●
46 1998 Pattnaik et al. ● ● ● ● ● ● ● ● ● ● ●
47 1998 Shih et al. ● ● ● ● ● ● ● ● ● ● ● ● ● ● ●
48 2000 Soehodho and Nahry
● ● ● ● ● ● ● ● ● ●
49 2000 Furth and Rahbee ● ● ● ● ● ●
50 2001 Ceder et al. ● ● ● ● ● ● ●
51 2001 Chakroborty et al.
● ● ● ● ● ● ● ● ●
52 2001 Chien et al. ● ● ● ● ● ● ● ● ● ● ●
53 2001 De Palma and Lindsey ● ● ● ●
54 2001 Delle site and Fillippi
● ● ● ● ● ●
55 2002 Bielli et al. ● ● ● ● ● ● ● ● ● ● ● ●
56 2002 Ceder ● ● ● ● ● ● ● ● ● ● ●
57 2002 Chakroborty and Wivedi
● ● ● ● ●
58 2002 Chien and Spasovic
● ● ● ● ● ● ● ● ● ● ● ●
59 2002 Chowdhury and Chien ● ● ● ● ● ● ● ● ● ●
60 2002 El-Hifnawi, M. ● ● ● ● ● ● ● ● ●
61 2002 Fusco et al. ● ● ● ● ● ● ● ● ● ●
62 2002 Shrivastava and Dhingra
● ● ● ● ● ● ● ● ●
63 2002 Shrivastava et al.
● ● ● ● ● ● ● ● ● ● ● ● ●
64 2002 Yan and Chen
● ● ● ● ● ● ● ● ●
65 2003 Ceder ● ● ● ● ● ● ● ● ● ●
66 2003 Chakroborty ● ● ● ● ● ● ● ● ● ● ●
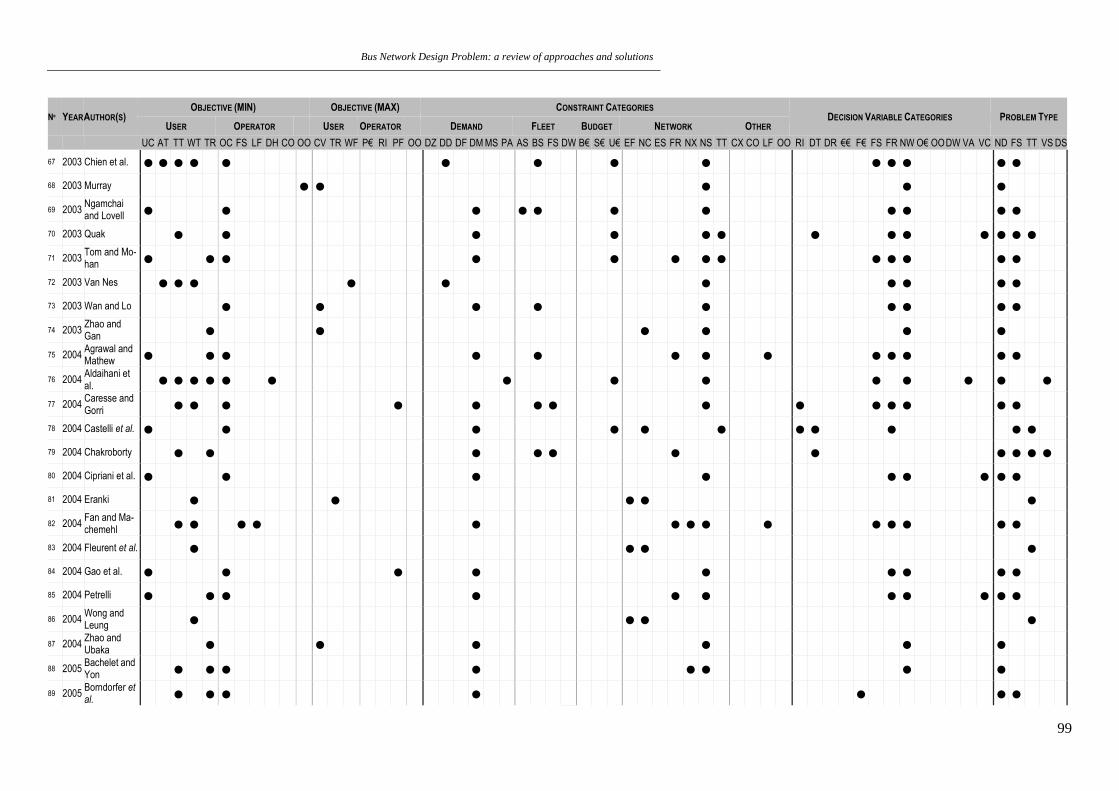
Bus Network Design Problem: a review of approaches and solutions
99
Nº YEAR AUTHOR(S) OBJECTIVE (MIN) OBJECTIVE (MAX) CONSTRAINT CATEGORIES
DECISION VARIABLE CATEGORIES PROBLEM TYPE USER OPERATOR USER OPERATOR DEMAND FLEET BUDGET NETWORK OTHER
UC AT TT WT TR OC FS LF DH CO OO CV TR WF P€ RI PF OO DZ DD DF DM MS PA AS BS FS DW B€ S€ U€ EF NC ES FR NX NS TT CX CO LF OO RI DT DR €€ F€ FS FR NW O€ OO DW VA VC ND FS TT VS DS
67 2003 Chien et al. ● ● ● ● ● ● ● ● ● ● ● ● ● ●
68 2003 Murray ● ● ● ● ●
69 2003 Ngamchai and Lovell ● ● ● ● ● ● ● ● ● ● ●
70 2003 Quak ● ● ● ● ● ● ● ● ● ● ● ● ●
71 2003 Tom and Mo-han ● ● ● ● ● ● ● ● ● ● ● ● ●
72 2003 Van Nes ● ● ● ● ● ● ● ● ● ●
73 2003 Wan and Lo ● ● ● ● ● ● ● ● ●
74 2003 Zhao and Gan
● ● ● ● ● ●
75 2004 Agrawal and Mathew ● ● ● ● ● ● ● ● ● ● ● ● ●
76 2004 Aldaihani et al.
● ● ● ● ● ● ● ● ● ● ● ● ● ●
77 2004 Caresse and Gorri
● ● ● ● ● ● ● ● ● ● ● ● ● ●
78 2004 Castelli et al. ● ● ● ● ● ● ● ● ● ● ●
79 2004 Chakroborty ● ● ● ● ● ● ● ● ● ● ●
80 2004 Cipriani et al. ● ● ● ● ● ● ● ● ●
81 2004 Eranki ● ● ● ● ●
82 2004 Fan and Ma-chemehl
● ● ● ● ● ● ● ● ● ● ● ● ● ●
83 2004 Fleurent et al. ● ● ● ●
84 2004 Gao et al. ● ● ● ● ● ● ● ● ●
85 2004 Petrelli ● ● ● ● ● ● ● ● ● ● ●
86 2004 Wong and Leung
● ● ● ●
87 2004 Zhao and Ubaka
● ● ● ● ● ●
88 2005 Bachelet and Yon
● ● ● ● ● ● ● ●
89 2005 Borndorfer et al.
● ● ● ● ● ● ●

Bus Network Design Problem: a review of approaches and solutions
100
Nº YEAR AUTHOR(S) OBJECTIVE (MIN) OBJECTIVE (MAX) CONSTRAINT CATEGORIES
DECISION VARIABLE CATEGORIES PROBLEM TYPE USER OPERATOR USER OPERATOR DEMAND FLEET BUDGET NETWORK OTHER
UC AT TT WT TR OC FS LF DH CO OO CV TR WF P€ RI PF OO DZ DD DF DM MS PA AS BS FS DW B€ S€ U€ EF NC ES FR NX NS TT CX CO LF OO RI DT DR €€ F€ FS FR NW O€ OO DW VA VC ND FS TT VS DS
90 2005 Hu et al. ● ● ● ● ● ● ● ● ● ●
91 2005 Jansen et al. ● ● ● ●
92 2005 Lee and Vuchic ● ● ● ● ● ● ● ● ● ● ● ●
93 2005 Lee and Vuchic ●
● ● ● ● ● ● ●
● ● ● ●
94 2005 Park ● ● ● ● ● ● ● ●
95 2005 Yu et al. ● ● ● ● ● ● ●
96 2005 Zhao et al. ● ● ● ● ● ● ● ● ● ●
97 2006 Cevallos and Zhao
● ● ● ● ● ● ● ●
98 2006 Fan and Ma-chemehl ● ● ● ● ● ● ● ● ● ● ● ● ●
99 2006 Fan and Ma-chemehl ● ● ● ● ● ● ● ● ● ● ● ● ●
100 2006 Guan et al. ● ● ● ● ● ● ● ●
101 2006 Matisziw et al. ● ● ● ● ● ● ● ●
102 2006 Schröder and Solchenbach
● ● ● ● ● ●
103 2006 Yu and Yang ● ● ● ● ● ● ● ● ●
104 2006 Zhao ● ● ● ● ● ● ● ●
105 2006 Zhao and Zeng
● ● ● ● ● ● ● ●
106 2007 Barra et al. ● ● ● ● ● ● ● ● ●
107 2007 Liu et al. ● ● ● ● ● ●
108 2007 Yang et al. ● ● ● ● ●
109 2007 Zhao and Zeng ● ● ● ● ● ● ● ● ● ● ●
110 2008 Borndorfer et al.
● ● ● ● ● ● ● ● ● ● ● ●
111 2008 Fan and Ma-chemehl ● ● ● ● ● ● ● ● ● ● ● ● ● ● ● ●
112 2008 Fernández et al. ● ● ● ● ● ● ● ● ● ● ● ●

Bus Network Design Problem: a review of approaches and solutions
101
Nº YEAR AUTHOR(S) OBJECTIVE (MIN) OBJECTIVE (MAX) CONSTRAINT CATEGORIES
DECISION VARIABLE CATEGORIES PROBLEM TYPE USER OPERATOR USER OPERATOR DEMAND FLEET BUDGET NETWORK OTHER
UC AT TT WT TR OC FS LF DH CO OO CV TR WF P€ RI PF OO DZ DD DF DM MS PA AS BS FS DW B€ S€ U€ EF NC ES FR NX NS TT CX CO LF OO RI DT DR €€ F€ FS FR NW O€ OO DW VA VC ND FS TT VS DS
113 2008 Kwan and Chang
● ● ● ● ● ●
114 2008 Marin and Jaramillo ● ● ● ● ● ● ● ● ●
115 2008 Wong et al. ● ● ● ● ● ● ● ● ● ● ● ● ●
116 2008 Zhao and Zeng ● ● ● ● ● ● ● ● ● ●
117 2009 Matta and Pe-ters
● ● ● ● ● ●
118 2009 Mauttone and Urquhart ● ● ● ● ● ● ● ● ● ●
119 2009 Mohaymany and Amiripour
● ● ● ● ● ● ● ● ●
120 2009 Pacheco et al. ● ● ● ● ● ● ● ● ● ● ● ● ●
121 2010 Daganzo ● ● ● ● ● ● ● ● ● ● ●
122 2010 Fan and Mumford
● ● ● ● ● ● ● ●
123 2010 Guihaire and Hao
● ● ● ● ● ● ● ● ● ● ●
124 2010 Guihaire and Hao
● ● ● ● ●
125 2010 Lownes and Machemehl ● ● ● ● ● ● ● ● ● ●
126 2010 Yoo et al. ● ● ● ● ● ● ● ●
127 2010 Yu et al. ● ● ● ● ● ● ● ●
128 2011 Bagloee and Ceder ● ● ● ● ● ● ● ● ● ● ● ● ●
129 2011 Curtin and Biba
● ● ● ● ● ●
130 2011 Estrada et al. ● ● ● ● ● ● ● ● ● ● ●
131 2011 Fan and Ma-chemehl ● ● ● ● ● ● ● ● ● ● ● ● ● ● ● ● ●
132 2011 Szeto and Wu ● ● ● ● ● ● ● ● ● ● ●
133 2011 Wirasinghe and Van-debona
● ● ● ● ● ● ● ● ● ● ●
134 2012 Cipriani et al. ● ● ● ● ● ● ● ● ● ● ●

Bus Network Design Problem: a review of approaches and solutions
102
Nº YEAR AUTHOR(S) OBJECTIVE (MIN) OBJECTIVE (MAX) CONSTRAINT CATEGORIES
DECISION VARIABLE CATEGORIES PROBLEM TYPE USER OPERATOR USER OPERATOR DEMAND FLEET BUDGET NETWORK OTHER
UC AT TT WT TR OC FS LF DH CO OO CV TR WF P€ RI PF OO DZ DD DF DM MS PA AS BS FS DW B€ S€ U€ EF NC ES FR NX NS TT CX CO LF OO RI DT DR €€ F€ FS FR NW O€ OO DW VA VC ND FS TT VS DS
135 2012 dell'Olio et al. ● ● ● ● ● ● ● ●
136 2012 Hadas and Shnaiderman
● ● ● ● ● ●
137 2012 Hassold and Ceder
● ● ● ● ● ● ● ●
138 2012 Ibarra-Rojas and Rios-So-lis
● ● ● ● ● ● ● ●
139 2012 Liebchen and Stiller
● ● ● ● ●
140 2012 Roca-Riu et al. ● ● ● ● ● ● ● ● ● ●
141 2012 Sivakumaran et al. ● ● ● ● ● ● ● ● ● ●
142 2012 Song et al. ● ● ● ● ● ● ● ● ●
143 2012 Szeto and Jiang
● ● ● ● ● ● ● ● ● ● ● ● ●
144 2012 Tilahun and Ong
● ● ● ●
145 2012 Tribby and Zandbergen
● ● ● ● ● ● ●
146 2012 Yu et al. ● ● ● ● ● ● ● ● ●
147 2013 Ceder et al. ● ● ● ● ● ● ● ●
148 2013 Chew et al. ● ● ● ● ● ● ● ● ●
149 2013 Huang et al. ● ● ● ● ● ● ●
150 2013 Jiang et al. ● ● ● ● ● ● ● ● ● ● ● ●
151 2013 Kermanshahi et al.
● ● ● ● ● ● ● ● ● ●
152 2013 Kuo ● ● ● ● ● ● ● ●
153 2013 Li et al. ● ● ● ● ● ● ● ●
154 2013 Medina et al. ● ● ● ● ● ● ● ● ●
155 2013 Mesa et al. ● ● ● ● ● ● ● ● ●
156 2013 Nikolic and Teodorovic
● ● ● ● ● ● ● ●

Bus Network Design Problem: a review of approaches and solutions
103
Nº YEAR AUTHOR(S) OBJECTIVE (MIN) OBJECTIVE (MAX) CONSTRAINT CATEGORIES
DECISION VARIABLE CATEGORIES PROBLEM TYPE USER OPERATOR USER OPERATOR DEMAND FLEET BUDGET NETWORK OTHER
UC AT TT WT TR OC FS LF DH CO OO CV TR WF P€ RI PF OO DZ DD DF DM MS PA AS BS FS DW B€ S€ U€ EF NC ES FR NX NS TT CX CO LF OO RI DT DR €€ F€ FS FR NW O€ OO DW VA VC ND FS TT VS DS
157 2013 Sun et al. ● ● ● ● ● ● ● ● ●
158 2013 Verbas and Mahmassani ● ● ● ● ● ● ● ● ● ● ●
159 2013 Yan et al. ● ● ● ● ● ● ● ● ● ●
160 2014 Amiripour et al.
● ● ● ● ● ● ● ● ● ● ● ● ● ●
161 2014 Badia et al. ● ● ● ● ● ● ● ● ●
162 2014 Cooper et al. ● ● ● ● ● ● ● ● ● ●
163 2014 Ibeas et al. ● ● ● ● ● ● ● ● ●
164 2014 Kenneth Loh ● ● ● ● ● ● ● ●
165 2014 Kiliç and Göh ● ● ● ● ● ● ●
166 2014 Kim and Schonfeld ● ● ● ● ● ● ● ● ● ● ● ● ●
167 2014 Martinez et al. ● ● ● ● ● ● ● ●
168 2014 Martynova et al.
● ● ● ● ● ● ● ●
169 2014 Nayeem et al. ● ● ● ● ● ● ● ● ● ●
170 2014 Nikolic and Teodorovic
● ● ● ● ● ● ● ● ● ● ●
171 2014 Ouyang et al. ● ● ● ● ● ● ● ● ● ● ● ●
172 2014 Schmid ● ● ● ● ● ● ● ● ● ● ●
173 2014 Szeto and Jiang
● ● ● ● ● ● ● ● ● ● ● ●
174 2014 Tirachini et al. ● ● ● ● ● ● ● ● ● ● ●
175 2014 Wu et al. ● ● ● ● ● ● ● ● ●
176 2014 Yao et al. ● ● ● ● ● ● ●
177 2014 Zhang et al. ● ● ● ● ● ●
178 2015 An and Lo ● ● ● ● ● ● ● ● ● ● ●
179 2015 Arbex and Da Cunha ● ● ● ● ● ● ● ● ● ●

Bus Network Design Problem: a review of approaches and solutions
104
Nº YEAR AUTHOR(S) OBJECTIVE (MIN) OBJECTIVE (MAX) CONSTRAINT CATEGORIES
DECISION VARIABLE CATEGORIES PROBLEM TYPE USER OPERATOR USER OPERATOR DEMAND FLEET BUDGET NETWORK OTHER
UC AT TT WT TR OC FS LF DH CO OO CV TR WF P€ RI PF OO DZ DD DF DM MS PA AS BS FS DW B€ S€ U€ EF NC ES FR NX NS TT CX CO LF OO RI DT DR €€ F€ FS FR NW O€ OO DW VA VC ND FS TT VS DS
180 2015 Cancela, et al.
● ● ● ● ● ● ● ● ● ● ●
181 2015 Klier and Haase
● ● ● ● ● ● ● ● ● ● ●
182 2015 Pternea et al. ● ● ● ● ● ● ● ● ● ● ● ● ●
183 2015 Saleeshya and Anirudh
● ● ● ● ● ● ● ● ●
184 2015 Verbas and Mahmassani
● ● ● ● ● ● ● ● ● ● ●
185 2015 Verbas et al. ● ● ● ● ● ● ● ● ● ● ●
186 2015 Wang and Qu ● ● ● ●
187 2015 Zhao et al. ● ● ● ● ● ● ● ● ● ●
188 2016 An and Lo ● ● ● ● ● ● ● ● ● ● ●
189 2016 Fouilhoux et al.
● ● ● ● ●
190 2017 Griswold et al. ● ● ● ● ● ● ● ● ● ●
191 2018 Boyer et al. ● ● ● ● ● ● ● 192 2018 Buba and Lee ● ● ● ● ● ● ● ● ● ● ● ● ● ●
193 2018 Ceder and Liu ● ● ● ● ● ● ● ● ● ● ● ● ●
194 2018 Krylatov and Shirokolobova
● ● ● ● ● ● ● ● ● ●
195 2018 Owais and Osman ● ● ● ● ● ● ● ● ● ● ● ●
196 2018 Volotskiy et al.
● ● ● ● ● ● ●
197 2019 Ahmed et al. ● ● ● ● ● ● ● ●
198 2019 Carosi et al. ● ● ● ● ● ● ● ● ● ● ●
199 2019 Cipriani et al. ● ● ● ● ● ● ● ● ● ● ● ● ● ●
200 2019 Duran et al. ● ● ● ● ● ● ● ● ● ● ●
201 2019 Feng et al. ● ● ● ● ● ● ● ● ●
202 2019 Islam et al. ● ● ● ● ● ● ● ● ● ● ● ● ● ●

Bus Network Design Problem: a review of approaches and solutions
105
Nº YEAR AUTHOR(S) OBJECTIVE (MIN) OBJECTIVE (MAX) CONSTRAINT CATEGORIES
DECISION VARIABLE CATEGORIES PROBLEM TYPE USER OPERATOR USER OPERATOR DEMAND FLEET BUDGET NETWORK OTHER
UC AT TT WT TR OC FS LF DH CO OO CV TR WF P€ RI PF OO DZ DD DF DM MS PA AS BS FS DW B€ S€ U€ EF NC ES FR NX NS TT CX CO LF OO RI DT DR €€ F€ FS FR NW O€ OO DW VA VC ND FS TT VS DS
203 2019 Jha et al. ● ● ● ● ● ● ● ● ● ● ● ● ●
204 2019 Liang et al. ● ● ● ● ● ● ● ● ● ● ● ● ●
205 2019 Nayeem et al. ● ● ● ● ● ● ● ● ● ● ● ● ● ● ● ●
206 2019 Nnene et al. ● ● ● ● ● ● ● ● ● ● ●
207 2019 Sun and Szeto
● ● ● ● ● ● ● ● ● ● ●
208 2019 Torabi and Salari
● ● ● ● ● ● ● ● ● ● ● ● ●
209 2019 Wu et al. ● ● ● ● ● ● ● ● ● ●
210 2020 Abdolmaleki et al.
● ● ● ● ● ●
211 2020 Chai and Liang
● ● ● ● ● ● ● ● ●
212 2020 Duran-Micco et al.
● ● ● ● ● ● ● ● ● ●
213 2020 Oliker and Bekhor
● ● ● ● ● ● ●
214 2020 Ranjbari et al. ● ● ● ● ● ● ● ● ● ● ● ● ● ● ●
215 2020 Shi and Gao ● ● ● ● ● ● ● ● ● ● ● ●
216 2020 Wu et al. ● ● ● ● ● ● ● ● ● ● ● ● ● ●
217 2020 Zhang et al. ● ● ● ● ● ● ● ● ● ● ● ● ● ● ●

Bus Network Design Problem: a review of approaches and solutions
106