Alpha Reliable Network Design Problem
9
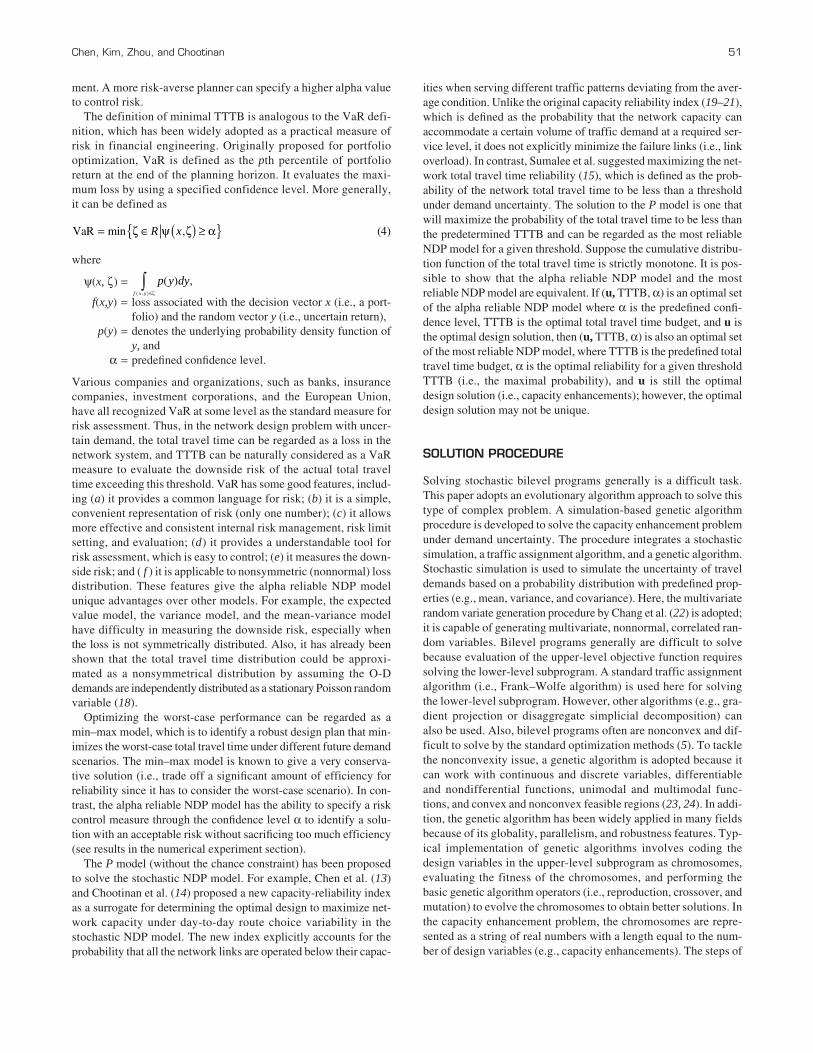
• Optimizing the worst-case performance of the system, and • Maximizing the probability of achieving a predefined threshold of the system performance (13–15). This paper proposes a new NDP model, called the alpha reliable NDP model, which optimizes the performance measure by consid- ering demand uncertainty for different risk aversion levels. This alpha reliable NDP model is different from the preceding models and has a number of attractive features: (a) it adopts the value-at-risk (VaR) risk measure instead of the utility function to model planner risk preferences, (b) the risk preference is specified by using the per- formance measure with some confidence level (planners might find it easier by selecting their own level of risk), (c) VaR is a commonly used risk measure adopted in finance to evaluate the maximum loss with a specified confidence level, and (d ) VaR is applicable to non- symmetrical performance distribution, which is suitable to measure downside risk. NOTATION AND MODEL FORMULATION This section describes the alpha reliable network design problem as a variant of the chance-constrained model for optimal capacity enhancement under demand uncertainty. Notation A = set of links in the network; A – = set of capacity enhancement links in the network; W = set of origin–destination (O-D) pairs; R w = set of routes between O-D pair w ∈ W; f w r = flow on route r ∈ R w ; v a = flow on link a ∈ A; v = vector of link flows, v = (. . . , v a , . . .) T , which is the decision variable vector of the lower level subprogram; u a = capacity enhancement of link a ∈ A – ; u = vector of link capacity enhancements u = (. . . , u a , . . .) T , which is the design vector of the upper-level subprogram; t a (v a , u a ) = travel cost on link a ∈ A, which is a function of link-flow v a and link capacity enhancement u a ; u a max = upper bound of u a , a ∈ A – ; Q w = random demand between O-D pair w ∈ W; q w = realization of Q w ; Q = vector of random variables Q w ; q = vector of realization q w ; g a (u a ) = capacity expansion cost for link a ∈ A – ; δ w ar = 1 if route r of O-D pair w uses link a, and 0 otherwise; B = fixed improvement budget; and α= confidence level in the chance constraint. Alpha Reliable Network Design Problem Anthony Chen, Juyoung Kim, Zhong Zhou, and Piya Chootinan 49 Uncertainties are unavoidable in engineering applications. A new model is proposed for designing networks under uncertainty of future demands. The objective is to minimize the total travel time budget required to satisfy the total travel time reliability constraint while considering the route choice behavior of network users. The model adopts the value- at-risk risk measure instead of the utility function to model planner risk preferences. It allows the planners to specify their risk preferences by using a confidence level of alpha on the total travel time reliability. This alpha reliable network design model is formulated as a stochastic bilevel optimization problem. The upper-level subprogram is a variant of the chance-constrained model that minimizes the total travel time budget subject to a chance constraint with a user-specified confidence level, a budget constraint, and design variable constraints; the lower-level sub- program is a user-equilibrium problem under demand uncertainty. A simulation-based genetic algorithm procedure is developed to solve this complex network design problem (NDP). Two numerical examples are presented to illustrate the features of the proposed NDP model. The network design problem (NDP) has long been recognized as one of the most difficult and challenging problems in transportation, and many researchers have devoted significant effort to the modeling and algorithmic development for NDP (1–5). However, most NDP mod- els in the literature have been posed as a deterministic problem in which all relevant inputs are known with certainty. For example, travel demands often are assumed to be known exactly in the future, but there is no guarantee that the travel demand forecast would pre- cisely materialize under uncertainty. This is because travel demand forecast is affected by many factors, such as economic growth, land use pattern, and socioeconomic characteristics. All these factors cannot be measured accurately but can only be roughly estimated. Evaluation of network performance without accounting demand uncertainty could lead to biased investment decisions (6). To account for demand uncertainty, a few recent studies extended the NDP to consider the uncertainty regarding future travel demands by defining a number of possible future scenarios. Several different criteria may be used to assess the goodness of an improvement scheme: • Optimizing the expected performance of the system (7–10), • Optimizing or restraining the variance performance of the system, • Optimizing the mean-variance performance of the system (11, 12), A. Chen, J. Kim, and Z. Zhou, Department of Civil and Environmental Engineering, Utah State University, Logan, UT 84322-4110. P. Chootinan, Department of Highways, Bangkok 10400, Thailand. Corresponding author: A. Chen, achen@cc. usu.edu. Transportation Research Record: Journal of the Transportation Research Board, No. 2029, Transportation Research Board of the National Academies, Washington, D.C., 2007, pp. 49–57. DOI: 10.3141/2029-06
-
Upload
independent -
Category
Documents
-
view
0 -
download
0
Transcript of Alpha Reliable Network Design Problem
• Optimizing the worst-case performance of the system, and• Maximizing the probability of achieving a predefined threshold
of the system performance (13–15).
This paper proposes a new NDP model, called the alpha reliableNDP model, which optimizes the performance measure by consid-ering demand uncertainty for different risk aversion levels. Thisalpha reliable NDP model is different from the preceding modelsand has a number of attractive features: (a) it adopts the value-at-risk(VaR) risk measure instead of the utility function to model plannerrisk preferences, (b) the risk preference is specified by using the per-formance measure with some confidence level (planners might findit easier by selecting their own level of risk), (c) VaR is a commonlyused risk measure adopted in finance to evaluate the maximum losswith a specified confidence level, and (d) VaR is applicable to non-symmetrical performance distribution, which is suitable to measuredownside risk.
NOTATION AND MODEL FORMULATION
This section describes the alpha reliable network design problemas a variant of the chance-constrained model for optimal capacityenhancement under demand uncertainty.
Notation
A = set of links in the network;A– = set of capacity enhancement links in the network;
W = set of origin–destination (O-D) pairs;Rw = set of routes between O-D pair w ∈ W;f w
r = flow on route r ∈ Rw;va = flow on link a ∈ A;v = vector of link flows, v = (. . . , va, . . .)T, which is the
decision variable vector of the lower level subprogram;ua = capacity enhancement of link a ∈ A
–;u = vector of link capacity enhancements u = (. . . , ua,
. . .)T, which is the design vector of the upper-levelsubprogram;
ta(va, ua) = travel cost on link a ∈ A, which is a function of link-flowva and link capacity enhancement ua;
uamax = upper bound of ua, a ∈ A
–;Qw = random demand between O-D pair w ∈ W;qw = realization of Qw;Q = vector of random variables Qw;q = vector of realization qw;
ga(ua) = capacity expansion cost for link a ∈ A–;
δwar = 1 if route r of O-D pair w uses link a, and 0 otherwise;B = fixed improvement budget; andα = confidence level in the chance constraint.
Alpha Reliable Network Design Problem
Anthony Chen, Juyoung Kim, Zhong Zhou, and Piya Chootinan
49
Uncertainties are unavoidable in engineering applications. A new modelis proposed for designing networks under uncertainty of future demands.The objective is to minimize the total travel time budget required tosatisfy the total travel time reliability constraint while considering theroute choice behavior of network users. The model adopts the value-at-risk risk measure instead of the utility function to model planner riskpreferences. It allows the planners to specify their risk preferences byusing a confidence level of alpha on the total travel time reliability. Thisalpha reliable network design model is formulated as a stochastic bileveloptimization problem. The upper-level subprogram is a variant of thechance-constrained model that minimizes the total travel time budgetsubject to a chance constraint with a user-specified confidence level, abudget constraint, and design variable constraints; the lower-level sub-program is a user-equilibrium problem under demand uncertainty. Asimulation-based genetic algorithm procedure is developed to solve thiscomplex network design problem (NDP). Two numerical examples arepresented to illustrate the features of the proposed NDP model.
The network design problem (NDP) has long been recognized as oneof the most difficult and challenging problems in transportation, andmany researchers have devoted significant effort to the modeling andalgorithmic development for NDP (1–5). However, most NDP mod-els in the literature have been posed as a deterministic problem inwhich all relevant inputs are known with certainty. For example,travel demands often are assumed to be known exactly in the future,but there is no guarantee that the travel demand forecast would pre-cisely materialize under uncertainty. This is because travel demandforecast is affected by many factors, such as economic growth, landuse pattern, and socioeconomic characteristics. All these factorscannot be measured accurately but can only be roughly estimated.Evaluation of network performance without accounting demanduncertainty could lead to biased investment decisions (6). To accountfor demand uncertainty, a few recent studies extended the NDP toconsider the uncertainty regarding future travel demands by defininga number of possible future scenarios. Several different criteria maybe used to assess the goodness of an improvement scheme:
• Optimizing the expected performance of the system (7–10),• Optimizing or restraining the variance performance of the system,• Optimizing the mean-variance performance of the system
(11, 12),
A. Chen, J. Kim, and Z. Zhou, Department of Civil and Environmental Engineering,Utah State University, Logan, UT 84322-4110. P. Chootinan, Department ofHighways, Bangkok 10400, Thailand. Corresponding author: A. Chen, [email protected].
Transportation Research Record: Journal of the Transportation Research Board,No. 2029, Transportation Research Board of the National Academies, Washington,D.C., 2007, pp. 49–57.DOI: 10.3141/2029-06

Mathematical Formulation
Stochastic NDP generally is formulated as a bilevel optimizationproblem to reflect the different aims of two decision makers: the net-work users and the planner. The network users are free to choose theirroutes such that their individual travel costs are minimized, whereasthe planner aims to make the best use of limited resources to opti-mize network performance (e.g., reducing congestion, minimizingenvironmental impact, maximizing throughputs), while taking intoaccount users’ route choice behavior. The general stochastic bilevelmathematical program can be formulated as follows, where UP isthe upper-level subprogram and LP is the lower-level subprogram:
where
F = objective function,u = design vector of the upper-level subprogram,G = constraint set of UP,f = objective function,
v(�) = decision variable vector of the lower-level subprogram asa function of the random vector �, and
g = constraint set of lower-level subprogram.
The upper-level subprogram describes the leader or planner problem,and the lower-level subprogram represents the follower or user’sbehavioral problem. This paper considers the continuous NDP, wherelink capacity enhancements are treated as continuous variables.
Alpha Reliable Network Design Model
The problem studied in this paper is to determine the optimal capac-ity enhancements by minimizing the total travel time budget (TTTB)required to satisfy the user-specified reliability constraint on the totaltravel time, the budget constraint, and the design variable constraints,while taking into account the behavior of network users under demanduncertainty.
TTTB is defined as
where Σa∈A ta (va (u, Q), ua)va (u, Q) represents the random total traveltime of the network under the design vector u and the randomdemand vector, and Pr is referred to as a probability measure. Thatis, the probability that ensures the total travel time of the networknot greater than TTTB. TTTB is at least equal to or greater than theuser-specified confidence level α. Hence, the alpha reliable NDPmodel can be described as follows (upper-level subprogram):
TTTB TTTB Pr , ,= ( )( ) ( )∈
∑ ≤min ,u
u Q u Qt va a aa A
av u TTTTB
(1)
⎛⎝⎜
⎞⎠⎟ ≥{ }α
UP minimize
subject to
u( ) ( )( )
( )( )
F v u
G v u
�
�
,
, ≤≤
( ) = ( )
0
v v uwhere , is implicitly defined� � bby
LP minimize
subject to
v( ) ( )( )
( )
ƒ ,
,
v u
g v
�
� uu 0( ) ≤
50 Transportation Research Record 2029
subject to
where Equation 2b is the chance constraint that guarantees the prob-ability of total travel time less than the TTTB is greater than or equalto the predefined confidence level α, Equation 2c is the budgetaryconstraint, and Equation 2d sets the lower and upper bounds of thepossible link capacity enhancements, and where va(u, Q) is a ran-dom variable; for a realization q, va(u, q) is the equilibrium flow onlink a which can be obtained by solving the lower-level subprogram:
where Equation 3a is the objective function for the user-equilibriumproblem (i.e., sum of the integrals of the link cost function), Equa-tion 3b is the flow conservation constraint, Equation 3c represents thelink-path flow relationship, and Equation 3d ensures the nonnegativityof path flows.
From the formulation provided, one can observe that the upper-level subprogram is to minimize the TTTB under different possibledesigns (link capacity enhancements) and demand realizations,whereas the lower-level subprogram solves for the equilibrium link-flow pattern for each realization of random demand and a given designvector prescribed by the upper-level subprogram.
Remarks
Equations 2a through 2d can be regarded as a variant of thechance-constrained model (16). However, it is different from thethree chance-constrained models originally proposed by Charnesand Cooper (17); that is, E (expected value) model, V (variance)model, and P (probability) model. For instance, the chance con-straint in the original models requires specifying both the pre-defined confidence level and the predetermined threshold (i.e.,TTTB). In the alpha reliable NDP model (Equations 2a through2d), the TTTB required to satisfy a predefined confidence level inthe chance constraint is not predetermined. It is a decision variableand is used as the objective function. Once the confidence level αis specified, the alpha reliable NDP model automatically optimizesthe TTTB required to satisfy the total travel time reliability require-
ƒrw r R w W d≥ ∀ ∈ ∈0 (3 )
v ca rw
arw a A
r Rww W
= ∀ ∈∈∈∑∑ ƒ δ (3 )
subject to
(3 )ƒrw
wq bw Wr Rw
= ∀ ∈∈∑
min ,v
a a
v
t u d aa
a A
ω ω( )∫∈
∑0
(3 )
0 ≤ ≤ ∀ ∈u u a A da amax (2 )
g u B ca aa A
( ) ≤∈∑ (2 ),
Pr ,t va a av u ba
a A
u Q u Q, TTTB (2,( )( ) ( ) ≤⎛⎝⎜
⎞⎠⎟ ≥
∈∑ α ))
minu
TTTB (2 )a
ment. A more risk-averse planner can specify a higher alpha valueto control risk.
The definition of minimal TTTB is analogous to the VaR defi-nition, which has been widely adopted as a practical measure ofrisk in financial engineering. Originally proposed for portfoliooptimization, VaR is defined as the pth percentile of portfolioreturn at the end of the planning horizon. It evaluates the maxi-mum loss by using a specified confidence level. More generally,it can be defined as
where
ψ(x, ζ) =
f(x,y) = loss associated with the decision vector x (i.e., a port-folio) and the random vector y (i.e., uncertain return),
p(y) = denotes the underlying probability density function ofy, and
α = predefined confidence level.
Various companies and organizations, such as banks, insurancecompanies, investment corporations, and the European Union,have all recognized VaR at some level as the standard measure forrisk assessment. Thus, in the network design problem with uncer-tain demand, the total travel time can be regarded as a loss in thenetwork system, and TTTB can be naturally considered as a VaRmeasure to evaluate the downside risk of the actual total traveltime exceeding this threshold. VaR has some good features, includ-ing (a) it provides a common language for risk; (b) it is a simple,convenient representation of risk (only one number); (c) it allowsmore effective and consistent internal risk management, risk limitsetting, and evaluation; (d) it provides a understandable tool forrisk assessment, which is easy to control; (e) it measures the down-side risk; and ( f ) it is applicable to nonsymmetric (nonnormal) lossdistribution. These features give the alpha reliable NDP modelunique advantages over other models. For example, the expectedvalue model, the variance model, and the mean-variance modelhave difficulty in measuring the downside risk, especially whenthe loss is not symmetrically distributed. Also, it has already beenshown that the total travel time distribution could be approxi-mated as a nonsymmetrical distribution by assuming the O-Ddemands are independently distributed as a stationary Poisson randomvariable (18).
Optimizing the worst-case performance can be regarded as amin–max model, which is to identify a robust design plan that min-imizes the worst-case total travel time under different future demandscenarios. The min–max model is known to give a very conserva-tive solution (i.e., trade off a significant amount of efficiency forreliability since it has to consider the worst-case scenario). In con-trast, the alpha reliable NDP model has the ability to specify a riskcontrol measure through the confidence level α to identify a solu-tion with an acceptable risk without sacrificing too much efficiency(see results in the numerical experiment section).
The P model (without the chance constraint) has been proposedto solve the stochastic NDP model. For example, Chen et al. (13)and Chootinan et al. (14) proposed a new capacity-reliability indexas a surrogate for determining the optimal design to maximize net-work capacity under day-to-day route choice variability in the stochastic NDP model. The new index explicitly accounts for theprobability that all the network links are operated below their capac-
p y dyf x y
( ) ,( , )≤∫
ζ
VaR (4)= ∈ ( ) ≥{ }min ,ζ ψ ζ αR x
Chen, Kim, Zhou, and Chootinan 51
ities when serving different traffic patterns deviating from the aver-age condition. Unlike the original capacity reliability index (19–21),which is defined as the probability that the network capacity canaccommodate a certain volume of traffic demand at a required ser-vice level, it does not explicitly minimize the failure links (i.e., linkoverload). In contrast, Sumalee et al. suggested maximizing the net-work total travel time reliability (15), which is defined as the prob-ability of the network total travel time to be less than a thresholdunder demand uncertainty. The solution to the P model is one thatwill maximize the probability of the total travel time to be less thanthe predetermined TTTB and can be regarded as the most reliableNDP model for a given threshold. Suppose the cumulative distribu-tion function of the total travel time is strictly monotone. It is pos-sible to show that the alpha reliable NDP model and the mostreliable NDP model are equivalent. If (u, TTTB, α) is an optimal setof the alpha reliable NDP model where α is the predefined confi-dence level, TTTB is the optimal total travel time budget, and u isthe optimal design solution, then (u, TTTB, α) is also an optimal setof the most reliable NDP model, where TTTB is the predefined totaltravel time budget, α is the optimal reliability for a given thresholdTTTB (i.e., the maximal probability), and u is still the optimaldesign solution (i.e., capacity enhancements); however, the optimaldesign solution may not be unique.
SOLUTION PROCEDURE
Solving stochastic bilevel programs generally is a difficult task.This paper adopts an evolutionary algorithm approach to solve thistype of complex problem. A simulation-based genetic algorithmprocedure is developed to solve the capacity enhancement problemunder demand uncertainty. The procedure integrates a stochasticsimulation, a traffic assignment algorithm, and a genetic algorithm.Stochastic simulation is used to simulate the uncertainty of traveldemands based on a probability distribution with predefined prop-erties (e.g., mean, variance, and covariance). Here, the multivariaterandom variate generation procedure by Chang et al. (22) is adopted;it is capable of generating multivariate, nonnormal, correlated ran-dom variables. Bilevel programs generally are difficult to solvebecause evaluation of the upper-level objective function requiressolving the lower-level subprogram. A standard traffic assignmentalgorithm (i.e., Frank–Wolfe algorithm) is used here for solvingthe lower-level subprogram. However, other algorithms (e.g., gra-dient projection or disaggregate simplicial decomposition) canalso be used. Also, bilevel programs often are nonconvex and dif-ficult to solve by the standard optimization methods (5). To tacklethe nonconvexity issue, a genetic algorithm is adopted because itcan work with continuous and discrete variables, differentiableand nondifferential functions, unimodal and multimodal func-tions, and convex and nonconvex feasible regions (23, 24). In addi-tion, the genetic algorithm has been widely applied in many fieldsbecause of its globality, parallelism, and robustness features. Typ-ical implementation of genetic algorithms involves coding thedesign variables in the upper-level subprogram as chromosomes,evaluating the fitness of the chromosomes, and performing thebasic genetic algorithm operators (i.e., reproduction, crossover, andmutation) to evolve the chromosomes to obtain better solutions. Inthe capacity enhancement problem, the chromosomes are repre-sented as a string of real numbers with a length equal to the num-ber of design variables (e.g., capacity enhancements). The steps of
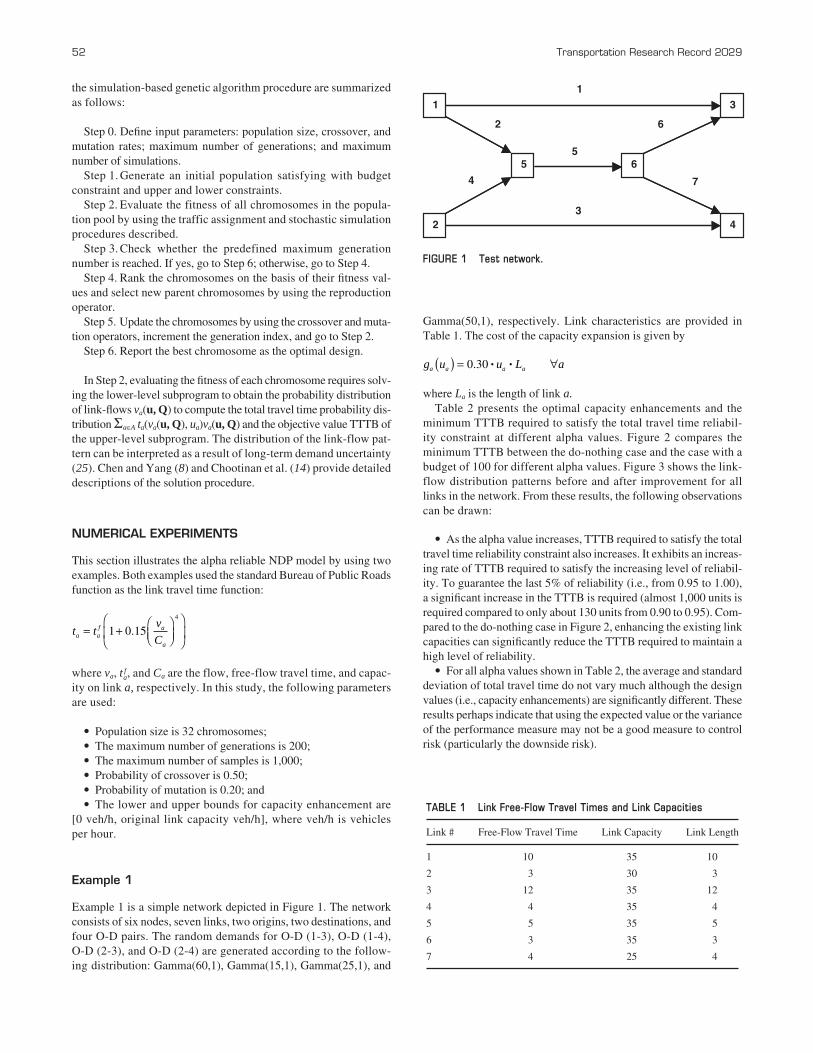
the simulation-based genetic algorithm procedure are summarizedas follows:
Step 0. Define input parameters: population size, crossover, andmutation rates; maximum number of generations; and maximumnumber of simulations.
Step 1. Generate an initial population satisfying with budgetconstraint and upper and lower constraints.
Step 2. Evaluate the fitness of all chromosomes in the popula-tion pool by using the traffic assignment and stochastic simulationprocedures described.
Step 3. Check whether the predefined maximum generationnumber is reached. If yes, go to Step 6; otherwise, go to Step 4.
Step 4. Rank the chromosomes on the basis of their fitness val-ues and select new parent chromosomes by using the reproductionoperator.
Step 5. Update the chromosomes by using the crossover and muta-tion operators, increment the generation index, and go to Step 2.
Step 6. Report the best chromosome as the optimal design.
In Step 2, evaluating the fitness of each chromosome requires solv-ing the lower-level subprogram to obtain the probability distributionof link-flows va(u, Q) to compute the total travel time probability dis-tribution Σa∈A ta(va(u, Q), ua)va(u, Q) and the objective value TTTB ofthe upper-level subprogram. The distribution of the link-flow pat-tern can be interpreted as a result of long-term demand uncertainty(25). Chen and Yang (8) and Chootinan et al. (14) provide detaileddescriptions of the solution procedure.
NUMERICAL EXPERIMENTS
This section illustrates the alpha reliable NDP model by using twoexamples. Both examples used the standard Bureau of Public Roadsfunction as the link travel time function:
where va, t fa, and Ca are the flow, free-flow travel time, and capac-
ity on link a, respectively. In this study, the following parametersare used:
• Population size is 32 chromosomes;• The maximum number of generations is 200;• The maximum number of samples is 1,000;• Probability of crossover is 0.50;• Probability of mutation is 0.20; and• The lower and upper bounds for capacity enhancement are
[0 veh/h, original link capacity veh/h], where veh/h is vehicles per hour.
Example 1
Example 1 is a simple network depicted in Figure 1. The networkconsists of six nodes, seven links, two origins, two destinations, andfour O-D pairs. The random demands for O-D (1-3), O-D (1-4),O-D (2-3), and O-D (2-4) are generated according to the follow-ing distribution: Gamma(60,1), Gamma(15,1), Gamma(25,1), and
t tv
Ca aa
a
= + ⎛⎝⎜
⎞⎠⎟
⎛
⎝⎜
⎞
⎠⎟
ƒ .1 0 154
52 Transportation Research Record 2029
Gamma(50,1), respectively. Link characteristics are provided inTable 1. The cost of the capacity expansion is given by
where La is the length of link a.Table 2 presents the optimal capacity enhancements and the
minimum TTTB required to satisfy the total travel time reliabil-ity constraint at different alpha values. Figure 2 compares theminimum TTTB between the do-nothing case and the case with abudget of 100 for different alpha values. Figure 3 shows the link-flow distribution patterns before and after improvement for alllinks in the network. From these results, the following observationscan be drawn:
• As the alpha value increases, TTTB required to satisfy the totaltravel time reliability constraint also increases. It exhibits an increas-ing rate of TTTB required to satisfy the increasing level of reliabil-ity. To guarantee the last 5% of reliability (i.e., from 0.95 to 1.00),a significant increase in the TTTB is required (almost 1,000 units isrequired compared to only about 130 units from 0.90 to 0.95). Com-pared to the do-nothing case in Figure 2, enhancing the existing linkcapacities can significantly reduce the TTTB required to maintain ahigh level of reliability.
• For all alpha values shown in Table 2, the average and standarddeviation of total travel time do not vary much although the designvalues (i.e., capacity enhancements) are significantly different. Theseresults perhaps indicate that using the expected value or the varianceof the performance measure may not be a good measure to controlrisk (particularly the downside risk).
g u u L aa a a a( ) = ∀0 30. i i
FIGURE 1 Test network.
4
5
31
2
6
1
2
3
7
6
4
5
TABLE 1 Link Free-Flow Travel Times and Link Capacities
Link # Free-Flow Travel Time Link Capacity Link Length
1 10 35 10
2 3 30 3
3 12 35 12
4 4 35 4
5 5 35 5
6 3 35 3
7 4 25 4

• The critical links are 1, 3, and 5. From a pure network topologystandpoint, Link 5 is a critical link. It serves all four O-D pairs, andit is part of the only route that serves O-D pairs (1,4) and (2, 3).Hence, as the alpha value increases, enhancing the capacity of Link 5becomes more important.
• By adjusting the alpha value, the alpha reliable NDP model cangenerate a portfolio of design plans that accounts for different lev-els of risk aversion. The results allow the planner to trace the trade-off between the reliability of the solution and the TTTB and to selectan appropriate design plan with acceptable risk.
• Behavioral responses of network users are explicitly capturedin the stochastic bilevel programming formulation. As shown in
Chen, Kim, Zhou, and Chootinan 53
Figure 3, flow distribution on Link 5 is reduced (shifted to the left)after the capacity enhancement because of the improved level of ser-vice on Link 1 and Link 3 [i.e., flow distributions on these two linksare increased (shifted to the right)].
Example 2
Example 2 is the Sioux Falls, South Dakota network depicted in Fig-ure 4. The network contains 24 nodes, 76 links, and 528 O-D pairs withpositive demand. The link characteristics, capacity expansion costfunctions, and O-D demands are available elsewhere (26). Similar to
FIGURE 2 Minimum TTTBs as function of different alpha values.
1250
1650
2050
2450
2850
3250
3650
50 55 60 65 70 75 80 85 90 95 100
Alpha Value
Min
imu
m T
ota
l Tra
vel T
ime
Bu
dg
et
Budget=100
Budget=0
TABLE 2 Link Capacity Enhancements for Different Alpha Values, Budget � 100
Total Travel StandardDesign ValuesTime (TTT) Average Deviation
α 1 2 3 4 5 6 7 Budget TTT of TTT
0.50 16.8 — 13.8 — — — — 1,345.0 1,388.7 255.0
0.55 13.9 — 16.2 — — — — 1,374.3 1,388.5 250.5
0.60 8.5 — 20.1 — 1.4 — — 1,403.9 1,385.9 245.3
0.65 7.8 — 17.7 — 8.7 — — 1,430.2 1,386.1 241.2
0.70 5.0 — 21.9 — 4.1 — — 1,467.0 1,386.1 243.0
0.75 5.5 — 18.6 — 10.2 0.7 — 1,517.0 1,387.0 240.5
0.80 3.7 — 19.2 — 11.0 — 2.8 1,557.9 1,387.5 239.3
0.85 4.3 — 18.6 — 13.4 — — 1,617.8 1,387.4 239.3
0.90 2.0 3.7 15.2 — 18.3 0.6 5.2 1,700.9 1,392.5 238.3
0.95 1.0 — 18.5 — 17.5 — 3.5 1,834.0 1,390.2 238.2
1.00 3.8 — 14.4 — 22.6 — 2.6 2,827.4 1,392.4 238.8

05
1015
2025
3035
40
Link
Flo
w
Bef
ore
Afte
r
2530
3540
4550
5560
6570
Link
Flo
w
Bef
ore
Afte
r
05
1015
2025
3035
4045
Link
Flo
w
Bef
ore
Afte
r
05
1015
2025
3035
4045
Link
Flo
w
Bef
ore
Afte
r
05
1015
2025
3035
4045
50Li
nk F
low
Bef
ore
Afte
r
98.3
34.2
Exi
stin
g ca
paci
ty=
35
= 4
8.4
1 2
3 4
56
510
1520
2530
3540
4550
5560
65Li
nk F
low
Bef
ore
Afte
r
0
0.2
0.4
0.6
0.81
2025
3035
4045
5055
Link
Flo
w
Cumulative Probability Density
0
0.2
0.4
0.6
0.81
Cumulative Probability Density
0
0.2
0.4
0.6
0.81
Cumulative Probability Density
0
0.2
0.4
0.6
0.81
Cumulative Probability Density
0
0.2
0.4
0.6
0.81
Cumulative Probability Density
0
0.2
0.4
0.6
0.81
Cumulative Probability Density
0
0.2
0.4
0.6
0.81
Cumulative Probability Density
Bef
ore
Afte
r
link
7
link
6
Exi
stin
g/E
nhan
ced
capa
city
= 2
5
93.0
68.8
Bef
ore
= 9
8.8
Afte
r
= 9
9.0 E
xist
ing/
Enh
ance
dca
paci
ty =
35
85.1
Enh
ance
d ca
paci
ty=
39.
3 51
.6E
xist
ing
capa
city
= 3
5
link
2
link
3
link
5
link
4
link
1B
efor
e/A
fter
95.8
/96.
3
Exi
stin
g/E
nhan
ced
capa
city
= 3
0
99.5
94.0
Exi
stin
g/E
nhan
ced
capa
city
= 3
5
89.
2
Exi
stin
g ca
paci
ty=
35
Enh
ance
d ca
paci
ty=
53.
6 16
.0
Enh
ance
d ca
paci
ty
FIG
UR
E 3
Link
–flo
w d
istr
ibut
ion
patt
erns
bef
ore
and
afte
r ca
paci
ty e
nhan
cem
ents
for
alp
ha �
0.8
5 a
nd b
udge
t �
10
0.

Chen, Kim, Zhou, and Chootinan 55
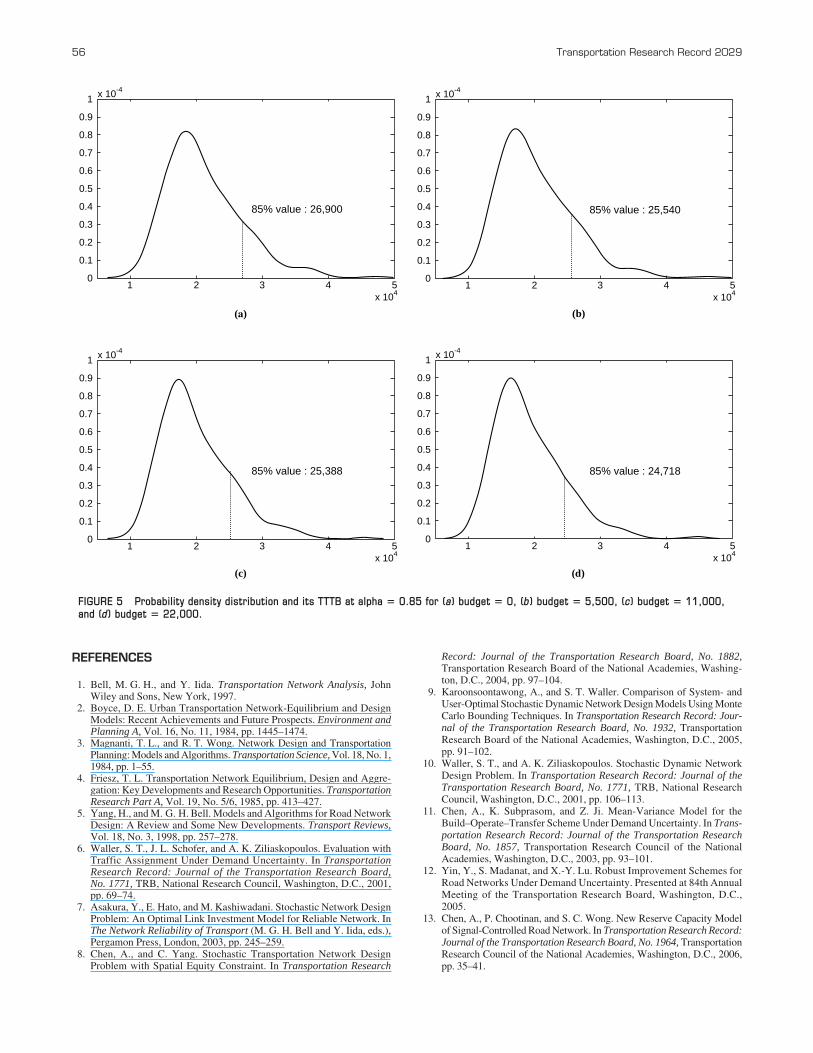
time reliability constraint at different alpha values. Figure 5 exam-ines the effect of increasing budget on the TTTB at a reliabilitylevel of 0.85. Similar observations can be drawn from the SiouxFalls network. A larger alpha value would reflect a greater degreeof risk aversion to large total travel time (i.e., severe congestion).Also, increasing budget level can reduce the TTTB for the samelevel of reliability.
CONCLUSIONS AND FUTURE RESEARCH
In this paper, a new stochastic NDP model was developed to deter-mine the optimal link capacity enhancement under demand uncer-tainty. The new model used the VaR measure to account for plannerrisk preferences by using a confidence level of alpha on the totaltravel time reliability. A stochastic bilevel programming formula-tion was provided in which the upper-level subprogram is a variantof the chance-constrained model and the lower-level subprogramis a user-equilibrium problem under demand uncertainty. Numer-ical examples were used to demonstrate the features of the pro-posed alpha reliable NDP model. So far, only demand uncertaintyis considered. Future research should consider the degradation ofnetwork capacity in designing reliable roadway networks. It is alsoworthwhile to investigate the mathematical properties of the alphareliable model and its relationship with the most reliable model(i.e., the P model). On the computational side, the authors plan toenhance the efficiency of the simulation-based genetic algorithmprocedure. In addition, the authors plan to explore the design ofmore effective algorithms that can guarantee certain optimalityfor some special cases of the reliable NDP models, by using theinsights obtained from the mathematical properties derived fromthe mathematical programming formulations for the NDP underuncertainty.
ACKNOWLEDGMENT
The work described in this paper was supported by a CAREER grantfrom the National Science Foundation.
TABLE 3 Link Capacity Enhancements for Different Alpha Values, Budget � 5,500
StandardDesign Variable (link number)TTT Average Deviation
α 1 (16) 2 (17) 3 (19) 4 (20) 5 (25) 6 (26) 7 (29) 8 (39) 9 (48) 10 (74) Budget TTT of TTT
0.50 1.77 8.29 3.99 4.90 2.76 4.97 1.15 2.35 1.71 1.66 18,874.2 20,135.4 5,436.9
0.55 2.14 5.63 2.31 6.28 5.40 5.85 1.95 2.74 2.14 2.14 19,221.0 20,773.4 5,611.3
0.60 2.15 2.59 3.90 9.63 2.91 4.03 1.47 1.23 0.93 2.37 20,028.3 19,912.3 5,327.1
0.65 1.72 3.06 5.07 8.58 4.58 3.70 1.45 2.99 1.27 1.61 21,019.4 20,057.2 5,327.4
0.70 1.88 5.81 5.45 5.63 6.74 4.12 1.84 1.54 1.66 1.59 22,446.0 20,353.0 5,450.4
0.75 2.07 5.54 5.82 5.26 4.70 2.69 1.87 1.94 2.27 5.13 24,076.6 21,165.2 5,898.3
0.80 2.06 5.03 4.98 4.54 7.63 4.97 2.59 2.11 1.88 2.39 25,386.6 21,071.2 5,689.2
0.85 1.69 5.57 5.42 7.36 3.19 4.63 1.13 3.05 1.13 0.89 25,540.7 20,085.3 5,420.5
0.90 1.95 5.95 5.84 5.60 5.16 4.89 1.08 1.60 1.95 2.74 27,096.1 20,284.5 5,430.3
0.95 3.38 5.07 8.73 4.89 1.99 2.64 1.73 4.01 1.48 2.23 30,897.3 21,044.5 5,836.9
1.00 4.76 3.23 6.01 5.88 4.08 3.58 2.87 4.79 1.72 1.86 46,382.2 21,892.9 6,106.5
Link proposed for capacity enhancement
1 2
3 4 5 6
9 8 7
12 11 10 16 18
17
191514
23
24
22
21 2013
2 5
1
4 14
8
6
11
9
15
191612
2313
2625
21
24
17
205122 5418
55
505249
48
29
27
32
33
36
7 35
37 38
34 40 28 43
53 58
30
51
59
61
59 61
68
63
57
45
62
64
66
75
42 71
73 76
41
44
70
72
69 65
10 31
74
39
3
FIGURE 4 Sioux Falls network.
Example 1, the gamma distribution (a,b) is adopted to generate therandom O-D demand, where a is set equal to the demand specified bySuwansirikul et al. (26) and b is set to 1.0 for all O-D pairs. Ten linksare selected for capacity enhancement: Links 16, 17, 19, 20, 25, 26,29, 39, 48, and 74. The budget is set to be 5,500 (27).
Table 3 presents the optimal capacity enhancements for the 10 listedlinks and the minimum TTTB required to satisfy the total travel
REFERENCES
1. Bell, M. G. H., and Y. Iida. Transportation Network Analysis, JohnWiley and Sons, New York, 1997.
2. Boyce, D. E. Urban Transportation Network-Equilibrium and DesignModels: Recent Achievements and Future Prospects. Environment andPlanning A, Vol. 16, No. 11, 1984, pp. 1445–1474.
3. Magnanti, T. L., and R. T. Wong. Network Design and TransportationPlanning: Models and Algorithms. Transportation Science, Vol. 18, No. 1,1984, pp. 1–55.
4. Friesz, T. L. Transportation Network Equilibrium, Design and Aggre-gation: Key Developments and Research Opportunities. TransportationResearch Part A, Vol. 19, No. 5/6, 1985, pp. 413–427.
5. Yang, H., and M. G. H. Bell. Models and Algorithms for Road NetworkDesign: A Review and Some New Developments. Transport Reviews,Vol. 18, No. 3, 1998, pp. 257–278.
6. Waller, S. T., J. L. Schofer, and A. K. Ziliaskopoulos. Evaluation withTraffic Assignment Under Demand Uncertainty. In TransportationResearch Record: Journal of the Transportation Research Board,No. 1771, TRB, National Research Council, Washington, D.C., 2001,pp. 69–74.
7. Asakura, Y., E. Hato, and M. Kashiwadani. Stochastic Network DesignProblem: An Optimal Link Investment Model for Reliable Network. InThe Network Reliability of Transport (M. G. H. Bell and Y. Iida, eds.),Pergamon Press, London, 2003, pp. 245–259.
8. Chen, A., and C. Yang. Stochastic Transportation Network DesignProblem with Spatial Equity Constraint. In Transportation Research
56 Transportation Research Record 2029
Record: Journal of the Transportation Research Board, No. 1882,Transportation Research Board of the National Academies, Washing-ton, D.C., 2004, pp. 97–104.
9. Karoonsoontawong, A., and S. T. Waller. Comparison of System- andUser-Optimal Stochastic Dynamic Network Design Models Using MonteCarlo Bounding Techniques. In Transportation Research Record: Jour-nal of the Transportation Research Board, No. 1932, TransportationResearch Board of the National Academies, Washington, D.C., 2005,pp. 91–102.
10. Waller, S. T., and A. K. Ziliaskopoulos. Stochastic Dynamic NetworkDesign Problem. In Transportation Research Record: Journal of theTransportation Research Board, No. 1771, TRB, National ResearchCouncil, Washington, D.C., 2001, pp. 106–113.
11. Chen, A., K. Subprasom, and Z. Ji. Mean-Variance Model for theBuild–Operate–Transfer Scheme Under Demand Uncertainty. In Trans-portation Research Record: Journal of the Transportation ResearchBoard, No. 1857, Transportation Research Council of the NationalAcademies, Washington, D.C., 2003, pp. 93–101.
12. Yin, Y., S. Madanat, and X.-Y. Lu. Robust Improvement Schemes forRoad Networks Under Demand Uncertainty. Presented at 84th AnnualMeeting of the Transportation Research Board, Washington, D.C.,2005.
13. Chen, A., P. Chootinan, and S. C. Wong. New Reserve Capacity Modelof Signal-Controlled Road Network. In Transportation Research Record:Journal of the Transportation Research Board, No. 1964, TransportationResearch Council of the National Academies, Washington, D.C., 2006,pp. 35–41.
85% value : 24,718
1 20
0.1
0.2
0.3
0.4
0.5
0.6
0.7
0.8
0.9
x 10-4
x 104
1
3 4 5
85% value : 25,388
1 20
0.1
0.2
0.3
0.4
0.5
0.6
0.7
0.8
0.9
x 10-4
x 104
1
3 4 5
(c) (d)
85% value : 25,540
1 20
0.1
0.2
0.3
0.4
0.5
0.6
0.7
0.8
0.9
x 10-4
x 104
1
3 4 5
(b)
85% value : 26,900
1 20
0.1
0.2
0.3
0.4
0.5
0.6
0.7
0.8
0.9
x 10-4
x 104
1
3 4 5
(a)
FIGURE 5 Probability density distribution and its TTTB at alpha � 0.85 for (a) budget � 0, (b) budget � 5,500, (c) budget � 11,000,and (d) budget � 22,000.
14. Chootinan, P., S. C. Wong, and A. Chen. A Reliability-Based NetworkDesign Problem. Journal of Advanced Transportation, Vol. 39, 2005,pp. 247–270.
15. Sumalee, A., D. P. Watling, and S. Nakayama. Reliable Network DesignProblem: Case with Uncertain Demand and Total Travel Time Reliabil-ity. In Transportation Research Record: Journal of the TransportationResearch Board, No. 1964, Transportation Research Council of theNational Academies, Washington, D.C., 2006, pp. 81–90.
16. Liu, B. Uncertainty Programming. John Wiley and Sons, New York, 1999.17. Charnes, A., and W. W. Cooper. Chance-Constrained Programming.
Management Science, Vol. 6, No. 1, 1959, pp. 73–79.18. Clark, S., and D. Watling. Modeling Network Travel Time Reliability
Under Stochastic Demand. Transportation Research B, Vol. 39, 2005,pp. 119–140.
19. Chen, A., M. Tatneni, D.-H. Lee, and H. Yang. Effect of Route ChoiceModels on Estimating Network Capacity Reliability. In TransportationResearch Record: Journal of the Transportation Research Board, No. 1733, TRB, National Research Council, Washington, D.C., 2000,pp. 63–70.
20. Chen, A., H. Yang, H. K. Lo, and W. H. Tang. A Capacity Related Reli-ability for Transportation Networks. Journal of Advanced Transporta-tion, Vol. 33, No. 2, 1999, pp. 183–200.
Chen, Kim, Zhou, and Chootinan 57
21. Chen, A., H. Yang, H. K. Lo, and W. H. Tang. Capacity Reliability of aRoad Network: An Assessment Methodology and Numerical Results.Transportation Research B, Vol. 36, 2002, pp. 225–252.
22. Chang, C.-H., Y.-K. Tung, and J.-C. Yang. Monte Carlo Simulation forCorrelated Variables with Marginal Distributions. Journal of HydraulicEngineering, Vol. 120, No. 3, 1994, pp. 313–331.
23. Gen, M., and R. Cheng. Genetic Algorithms and Engineering Optimiza-tion. John Wiley and Sons, New York, 2000.
24. Goldberg, D. Genetic Algorithms in Search, Optimization, and MachineLearning. Addison-Wesley, Reading, Mass., 1989.
25. Duthie, J., A. Unnikrishnan, and S. T. Waller. Network Evaluation withUncertain and Correlated Long-Term Demand. Presented at 85th AnnualMeeting of the Transportation Research Board, Washington, D.C., 2006.
26. Suwansirikul, C., T. L. Friesz, and R. L. Tobin. Equilibrium Decom-posed Optimization: A Heuristic for the Continuous Equilibrium Network Design Problem. Transportation Science, Vol. 21, No. 4, 1987,pp. 254–263.
27. Meng, Q., and H. Yang. Benefit Distribution and Equity in Road NetworkDesign. Transportation Research B, Vol. 36, 2002, pp. 19–35.
The Transportation Network Modeling Committee sponsored publication of thispaper.