HEDONIC ESTIMATION OF HOUSING MARKET PRICES IN TURKEY
16
HEDONIC ESTIMATION OF HOUSING MARKET PRICES IN TURKEY Rüştü YAYAR * Derya DEMİR ** ABSTRACT In this study, there has been aimed to determine the factors that affect the price of flats in the housing sector in Turkey with a hedonic pricing model. According to the model results, the house’s having residential swimming pool, a jacuzzi and a water tank, its being a duplex, its central heating system, its being closer to the center, the size of the house, the bathroom floor’s being vinyl or PVC, being closer to banking services and compulsory education services, its having cable TV, telephone lines and parking opportunities increases the value of the house. The house is in the basement or ground floor of the building construction date is first, the room is the floor of ceramic tiles, bathroom floor screed (concrete road) the fuel used is coal, reduces the value of the house. Keywords: Housing Prices, Hedonic Pricing Model, Housing Market, Turkey. TÜRKİYE’DEKİ KONUT PİYASASI FİYATLARININ HEDONİK TAHMİNİ ÖZ Bu çalışmada, Türkiye konut sektöründe apartman dairelerinin fiyatını etkileyen faktörlerin belirlenmesi amaçlanmıştır Model sonuçlarına göre, konutlarda havuz, jakuzi ve su deposu bulunması, konutun dubleks daire olması, ısı sisteminin müşterek/merkezi olması, konutun büyüklüğü, banyo zemininin marley ya da PVC olması, banka hizmetlerine ve zorunlu eğitim hizmetlerine yakın olması, kablolu yayın, telefon hattı ve garaj bulunması konutun değerini artırmaktadır. Konutun bodrum ya da zemin kat olması, binanın yapım tarihinin eski olması, oda zemininin karo seramik olması, banyo zemininin şap (kara beton) olması, kullanılan yakıtın kömür olması konutun değerini düşürmektedir. Anahtar Kavramlar: Konut Fiyatları, Hedonik Fiyatlama Modeli, Konut Piyasası, Türkiye. * Doç. Dr., Gaziosmanpaşa Üniversitesi, İktisadi ve İdari Bilimler Fakültesi, İktisat Bölümü. ** Öğr. Gör. Gaziosmanpaşa Üniversitesi, Reşadiye Meslek Yüksekokulu. Makalenin kabul tarihi: Temmuz 2014.
Transcript of HEDONIC ESTIMATION OF HOUSING MARKET PRICES IN TURKEY
HEDONIC ESTIMATION OF HOUSING MARKET PRICES IN TURKEY
Rüştü YAYAR*
Derya DEMİR**
ABSTRACT
In this study, there has been aimed to determine the factors that affect the price of flats in
the housing sector in Turkey with a hedonic pricing model. According to the model results, the
house’s having residential swimming pool, a jacuzzi and a water tank, its being a duplex, its
central heating system, its being closer to the center, the size of the house, the bathroom floor’s
being vinyl or PVC, being closer to banking services and compulsory education services, its
having cable TV, telephone lines and parking opportunities increases the value of the house. The
house is in the basement or ground floor of the building construction date is first, the room is the
floor of ceramic tiles, bathroom floor screed (concrete road) the fuel used is coal, reduces the
value of the house.
Keywords: Housing Prices, Hedonic Pricing Model, Housing Market, Turkey.
TÜRKİYE’DEKİ KONUT PİYASASI FİYATLARININ HEDONİK
TAHMİNİ
ÖZ
Bu çalışmada, Türkiye konut sektöründe apartman dairelerinin fiyatını etkileyen faktörlerin
belirlenmesi amaçlanmıştır Model sonuçlarına göre, konutlarda havuz, jakuzi ve su deposu
bulunması, konutun dubleks daire olması, ısı sisteminin müşterek/merkezi olması, konutun
büyüklüğü, banyo zemininin marley ya da PVC olması, banka hizmetlerine ve zorunlu eğitim
hizmetlerine yakın olması, kablolu yayın, telefon hattı ve garaj bulunması konutun değerini
artırmaktadır. Konutun bodrum ya da zemin kat olması, binanın yapım tarihinin eski olması, oda
zemininin karo seramik olması, banyo zemininin şap (kara beton) olması, kullanılan yakıtın
kömür olması konutun değerini düşürmektedir.
Anahtar Kavramlar: Konut Fiyatları, Hedonik Fiyatlama Modeli, Konut Piyasası,
Türkiye.
*Doç. Dr., Gaziosmanpaşa Üniversitesi, İktisadi ve İdari Bilimler Fakültesi, İktisat Bölümü. ** Öğr. Gör. Gaziosmanpaşa Üniversitesi, Reşadiye Meslek Yüksekokulu.
Makalenin kabul tarihi: Temmuz 2014.
68 Erciyes Üniversitesi İktisadi ve İdari Bilimler Fakültesi Dergisi, Sayı: 43, Ocak-Haziran 2014 ss. 67-82
INTRODUCTION
One of humanity’s most basic needs is shelter needs. With the
advancement of technology and the development of communities where the
properties of basic consumption goods have increased, as have the shelter of the
features that eliminate the need for housing has also increased. With rapid
population growth, technological developments, the change in the economic
structure of society, the acceleration of rural-urban migration and urbanization,
social and economic development of the housing sector has become more
important and diversified housing properties. Residences of individuals with
physical needs such as shelter, psychological and social needs meet together has
become a consumer good.
Either as being the owner of a house or the one who benefits from the
tenancy, each individual certainly has a house demand in which they will want
to live inside. The housing demand can be consumption intended or investment
property. One of the most important factors that affect consumption-intended
housing demand has been individual’s pleasure and preferences. While the
individual demand consumption intended housing, they have been under the
influence of benefits that provide pleasure to themselves such as being different,
strong, achieving success, obtaining social statue or of rational benefits such as
the price and quality. The benefits that provide pleasure to the individuals create
intrinsic satisfaction going beyond the satisfaction obtained through the sense
organs. So, hedonic consumption means consumed productions’ providing
intrinsic satisfaction to individuals.
The factors that specify the housing demand provided by pleasure and
preferences have been the qualities of the demanded house. Housing market is a
heterogeneous market and each house has different distinctive characteristics.
Houses’ having different characteristics results in their having different values
and prices. The characteristics of a house affect its value positively or
negatively, so that an implicit price occurs. In order to reveal implicit effect of
the characteristics that determine the value of a house upon the value of the
house, there has been benefited from hedonic pricing models.
In this study, there has been aimed to determine which house
characteristics have negative or positive effects upon the value of the house in
Turkey and measure those effects using hedonic pricing model. The data used in
the study have been the data of Turkish Statistical Institute (TSI) Household
Budget Survey that belongs to 3709 houses. There have been included forty five
independent variables considered to explain the market price of the house into
the model. In the study, there have been carried out with linear, logarithmic
linear and full logarithmic models and effects upon the prices have been
69 Hedonic Estimation Of Housing Market Prices in Turkey
calculated. There has been established a general model including quantitative
and dummy variables.
I. HEDONIC PRICING MODEL
Hedonic consumption which has been an important field of consumer
behavior has been a form of consumption focusing upon completing instrinsic
satisfaction (Sapangenberg vd., 1997: 239). According to the study carried out
by Hirschman and Holbrook in 1982, the consumer not only does the shopping
in order to provide benefit from the purchased goods. Together with the
obtained profit, individuals also do the shopping in order to satisfy their pleasure
regarding shopping experience as a pleasure. The preferences that create the
basic factors of hedonic consumption have been related to sight, hearing, touch,
smell and taste. Individuals not only respond to multiple affective impressions
of external stimulus, but also they responds creating an image within
themselves, at the same time (Hirschman, Holbrook, 1992: 92-101).
While the individuals choose a product they behave in a way in which they
will maximize their own benefits according to some characteristics of that
product. Those chatacteristics have been in a quality that increase or decrease
the value of the product. The value of a product also differs from region to
region and country to country. The reason for this is the meaning attributed to
the product by the individuals. The benefit means the happiness obtained by the
individual from a product; in other words, a satisfaction criteria (Mankiw, 2001:
471). There have been developed some models to measure the benefit. One of
them is hedonic pricing model. There has been asserted in hedonic pricing
model that the value of a product (in current situation, a house) depends upon
the quantity of its features; so that, the price of a product will be the function of
its features/characteristics (Parmeter vd., 2007: 696). Using the hedonic pricing
model, there has been determined the marginal value consented by individuals
to be paid to the preferred product. So, hedonic pricing model can be applied to
differentiated product market. This method helps consumers to determine the
most important factors when they have preferred the features and relative prices
of the houses (Yang, 2001: 51). “Regression” side of hedonic regression
expresses how implicit prices of the characteristics have been measured (Hill,
Melser, 2008: 593). So that, there has been determined for what features the
consumers have paid more.
A.T. Court created the first hedonic price model in 1939 with his study and
discussed the price of car as a function of the car’s various features and analyzed
hedonic prices of heterogeneous products (Griliches,1991: 185). Haas (1922)
created a simple hedonic pricing model using distance to city center and city
size as variables in his study (Wen vd., 2005: 908).

70 Erciyes Üniversitesi İktisadi ve İdari Bilimler Fakültesi Dergisi, Sayı: 43, Ocak-Haziran 2014 ss. 67-82
Consumer demand theory of Lancaster (1966) assumes that people have
accepted goods as the total of valued characteristics. So that, it depends upon the
relative benefit of each characteristic that creates the purchase decision of the
consumer. According to Lancaster, the good does not directly provide benefit to
the consumer; however, the benefit increases because of the features that a good
has. In general, a good has more than one features and one feature can be
available in more than one goods.
In his study in 1976, Rosen discussed the first hedonic equilibrum supply
and demand model depending upon good characteristics. Under perfect
competition assumption, he analyzed short and long term equilibrum that
maximize the profit of producer and maximize the benefit of consumer. He
deduced that hedonic price characteristics function has not been determined by
supply and demand (Rosen, 1976: 22).
In Rosen’s model, goods (Z) have been the total of n numbered
characteristics that belong to goods.
(1)
Rosen’s model has been expressed as such (Rosen, 1974:37); the goods
have been defined with the possible numerical values of Z and presented
different characteristics components to the buyers. Existence of product
differentiation occurred with goods’ having different characteristics reveals a
wide range of alternative characteristics compound. In this sense, product
demand function is shown as;
This demand function expresses the hedonic price regression obtained after
comparison of label prices that have different characteristics. Implicit price of
house characteristics can be obtained by calculating the partial differentiation of
(1) numbered equity with each house characteristic variable (Wen, Jia and Guo,
2005:908):
Both Lancaster’s approach and Rosen’s approach have tried to determine
the qualities that affect the benefit, have been measured objectively and created
gathering a great number of product qualities valued by the consumer.
Lancaster’s model assumes that products have occurred from qualitative
components depending upon the budget constraint and those have been the
members of the same group; and Rosen’s model reveals that consumers haven’t
had preferences related to qualities while buying product combinations and there
has been a preference order among the products (Yayar, 2011:23). Whereas
71 Hedonic Estimation Of Housing Market Prices in Turkey
Lancaster’s model has been valid for whole consumption goods, Rosen’s model
has only been valid for only durable consumer goods; because it has been
possible for products to be used together in Lancaster’s model. According to
Rosen, there has been a nonlinear relationship between prices of products and
their inner qualities.
II. LITERATURE SUMMARY
In this section of the study, there have been given place to studies carried
out with hedonic regression model and taken place in the literature. There have
been a great number of national and international studies implementing the
aforementioned model upon the housing market as our research subject.
One of the first studies in which hedonic price theory has been applied to
the housing market has been a study carried out by Ridker and Henning in 1967.
In this study, there was revealed the effect of developing nature quality (such as
eliminating the air pollution) upon house prices (Ridker, Henning, 1967: 257).
In their study, Kain and Quigley (1970) found that qualities such as the quality
of housing services, number of rooms, number of bathrooms and acreage have
affected housing prices in semi logarithmic and linear model they carried out
854 restricted observation and totally 1184 observations of house selling. Yang
(2001) analyzed certain price of house characteristics including physical
structure, location, environment and structure quality risk in his study carried
out in China. Implementation results showed that consumers have been ready to
pay much money in order to avoid from the risk of low structure quality. Wen,
Lu and Lin (2004) have revealed that only 6 of 18 variables such as age of
house, location (north-south, east-west), distance to university, distance to
important institutions as hospital, post office, bank, distance to city center (km),
distance to the lake in south (km) have affected the price of the house
negatively, rest of the variables housing sale price positively. Toda and
Nozdrina (2004) have determined in their study that the variables of distance to
the closest metro station (meter), distance to city center (km) and accrued taxes
have affected housing prices negatively and variables as house size (the one that
have hall and bathroom), kitchen size and number of workers desired by
entrepreneurs to be worked in apartments have affected positively. In their
study, Cohen and Coughlin (2005) analyzed the effects of distance to the airport,
level of noise and house characteristics upon the housing prices near the airport.
Recovery in characteristics of a house and distance of the house to the airport
have affected housing prices positively. There has been determined a negative
relationship between the decrease at the level of noise and housing prices. Wen,
Jia and Guo (2005) chose 18 features as independent variables in their study
they carried out for the province of Hangzhou and they created a linear hedonic
price model. The model was tested with 2473 house examples and 290 housing
72 Erciyes Üniversitesi İktisadi ve İdari Bilimler Fakültesi Dergisi, Sayı: 43, Ocak-Haziran 2014 ss. 67-82
property data. They found that 14 of 18 independent variables had significant
effect upon the housing prices. Moreover, they categorized those variables under
5 groups according to their degree of influence. In his study in which he
searched for the houses for sale and rent in ıstanbul, Levent (1995) determined
that some of house characteristics have been efficient upon the price. On the
other hand, there could not be found a variable that is efficient upon the price
except from standard house characteristics in houses for rent. In his study,
Üçdogruk (2001) included the market price of the house as the dependent
variable and self characteristics of the house (number of rooms, heating system,
hall floor, roof insulation, etc.) as the independent variables into his study. There
has been established a general model including first the quantitative variables
and then both the quantitative and dummy variables. In quantitative-variable
hedonic model, number of rooms has been found as statistically insignificant. In
the other model, room heater, central heating and geothermal energy have been
noticed as increasing the price of the house more than the heating stove. When
the variables have been analyzed in the study of Yankaya and Çelik (2005),
whereas walking distance to metro station (meter), distance to the bus station
(meter) and age of the house have affected the housing prices negatively, the
other variables have had positive effect upon the housing prices. According to
linear and logarithmic model, the most significant indicator of the value has
been the size of the house. Model results have revealed that the investment in
transportation sub-structure increases the housing prices within their influence
area. Selim (2008) analyzed the factors that determined housing prices using the
2004 Hosehold Budget Survey data. The most important variables that affect
housing prices have been determined as the variables such as type of the house,
type of the structure, number of rooms, size of the house and other structural
variables such as water system of the house, swimming pool, the house’s having
natural gas. In their study Çubukçu and Çetintahra (2011) tried to measure the
effect of environment aesthetics upon the housing prices gathering the two
different literatures relevant to the housing using hedonic price model. Results
have proved that “desire to own a house” of spatial aesthetics has affected the
purchase price and “complicated” and “well-cared” situations of the house
surrounding has affected the price for rent.
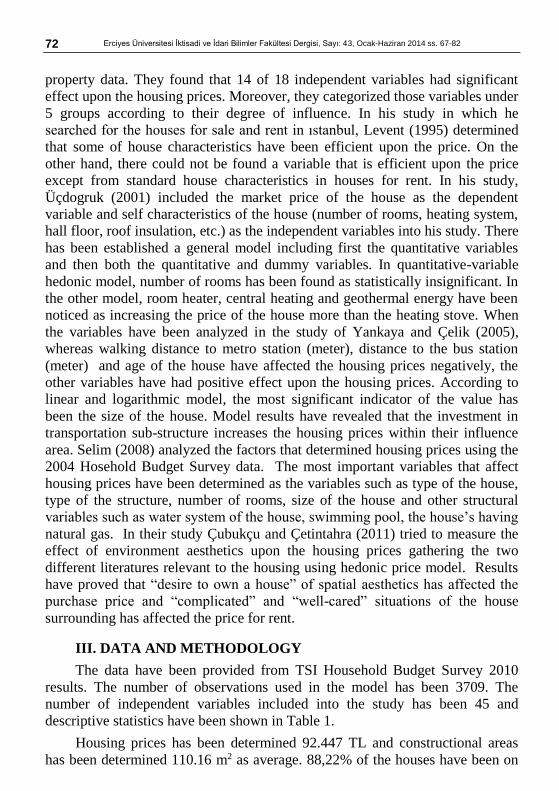
III. DATA AND METHODOLOGY
The data have been provided from TSI Household Budget Survey 2010
results. The number of observations used in the model has been 3709. The
number of independent variables included into the study has been 45 and
descriptive statistics have been shown in Table 1.
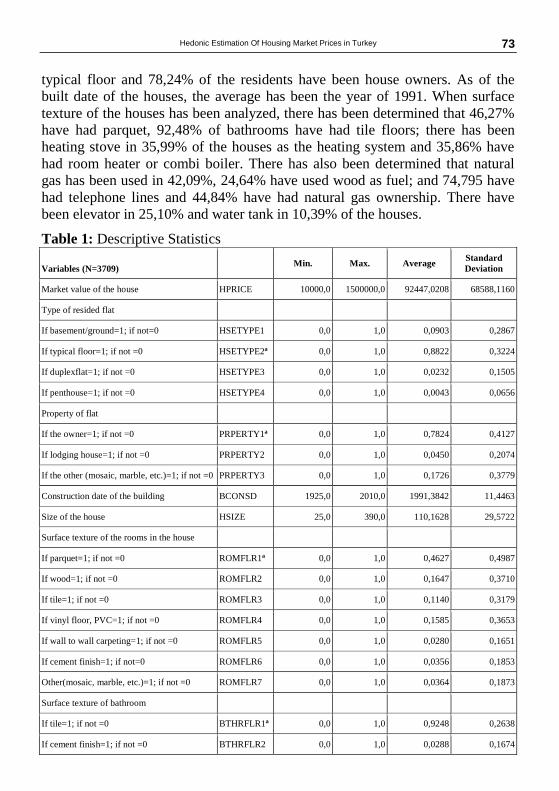
Housing prices has been determined 92.447 TL and constructional areas
has been determined 110.16 m2 as average. 88,22% of the houses have been on
73 Hedonic Estimation Of Housing Market Prices in Turkey
typical floor and 78,24% of the residents have been house owners. As of the
built date of the houses, the average has been the year of 1991. When surface
texture of the houses has been analyzed, there has been determined that 46,27%
have had parquet, 92,48% of bathrooms have had tile floors; there has been
heating stove in 35,99% of the houses as the heating system and 35,86% have
had room heater or combi boiler. There has also been determined that natural
gas has been used in 42,09%, 24,64% have used wood as fuel; and 74,795 have
had telephone lines and 44,84% have had natural gas ownership. There have
been elevator in 25,10% and water tank in 10,39% of the houses.
Table 1: Descriptive Statistics
Variables (N=3709) Min. Max. Average
Standard
Deviation
Market value of the house HPRICE 10000,0 1500000,0 92447,0208 68588,1160
Type of resided flat
If basement/ground=1; if not=0 HSETYPE1 0,0 1,0 0,0903 0,2867
If typical floor=1; if not =0 HSETYPE2a 0,0 1,0 0,8822 0,3224
If duplexflat=1; if not =0 HSETYPE3 0,0 1,0 0,0232 0,1505
If penthouse=1; if not =0 HSETYPE4 0,0 1,0 0,0043 0,0656
Property of flat
If the owner=1; if not =0 PRPERTY1a 0,0 1,0 0,7824 0,4127
If lodging house=1; if not =0 PRPERTY2 0,0 1,0 0,0450 0,2074
If the other (mosaic, marble, etc.)=1; if not =0 PRPERTY3 0,0 1,0 0,1726 0,3779
Construction date of the building BCONSD 1925,0 2010,0 1991,3842 11,4463
Size of the house HSIZE 25,0 390,0 110,1628 29,5722
Surface texture of the rooms in the house
If parquet=1; if not =0 ROMFLR1a 0,0 1,0 0,4627 0,4987
If wood=1; if not =0 ROMFLR2 0,0 1,0 0,1647 0,3710
If tile=1; if not =0 ROMFLR3 0,0 1,0 0,1140 0,3179
If vinyl floor, PVC=1; if not =0 ROMFLR4 0,0 1,0 0,1585 0,3653
If wall to wall carpeting=1; if not =0 ROMFLR5 0,0 1,0 0,0280 0,1651
If cement finish=1; if not=0 ROMFLR6 0,0 1,0 0,0356 0,1853
Other(mosaic, marble, etc.)=1; if not =0 ROMFLR7 0,0 1,0 0,0364 0,1873
Surface texture of bathroom
If tile=1; if not =0 BTHRFLR1a 0,0 1,0 0,9248 0,2638
If cement finish=1; if not =0 BTHRFLR2 0,0 1,0 0,0288 0,1674

74 Erciyes Üniversitesi İktisadi ve İdari Bilimler Fakültesi Dergisi, Sayı: 43, Ocak-Haziran 2014 ss. 67-82
Table 1: (Continued)
If mosaic=1; if not =0 BTHRFLR3 0,0 1,0 0,0361 0,1866
Other(mosaic, marble, etc.)=1; if not =0 BTHRFLR4 0,0 1,0 0,0102 0,1007
Heating system of the house
If heating stove=1; if not =0 HEATSYST1 0,0 1,0 0,3599 0,4801
If common/central=1; if not =0 HEATSYST2 0,0 1,0 0,2017 0,4013
If room heater/combi boiler=1; if not =0 HETSYST3a 0,0 1,0 0,3586 0,4797
If air conditioning=1; if not =0 HEATSYST4 0,0 1,0 0,0752 0,2638
If the other=1; if not =0 HEATSYST5 0,0 1,0 0,0046 0,0676
Type of fuel
If wood=1; if not =0 FUEL1 0,0 1,0 0,2464 0,4310
If coal=1; if not =0 FUEL2 0,0 1,0 0,1974 0,3981
If natural gas=1; if not =0 FUEL3a 0,0 1,0 0,4209 0,4938
If electricity=1; if not =0 FUEL4 0,0 1,0 0,1151 0,3192
Other(Fueloil, diesel oil, etc.) =1; if not =0 FUEL5 0,0 1,0 0,0202 0,1408
Transportation difficulty to banking services
(1=very hard; 2=hard; 3=easy; 4=very easy) BNKSERV 1,0 4,0 2,9841 0,7102
Transportation difficulty to health services
(1=very hard; 2=hard; 3=easy; 4=very easy) HLTHSERV 1,0 4,0 3,1564 0,6295
Transportation difficulty to education services
(1=very hard; 2=hard; 3=easy; 4=very easy) CEDUSERV 1,0 4,0 3,2041 0,5981
Sauna ownership (yes=1; no=0) SAUNA 0,0 1,0 0,0008 0,0284
Jakuzzi ownership (yes =1; no=0) JAKUZZI 0,0 1,0 0,0089 0,0939
Garbage disposalownership (yes=1; no=0) GARDIS 0,0 1,0 0,0011 0,0328
Underfloor heating ownership (yes =1; no=0) UNDRHEAT 0,0 1,0 0,0078 0,0881
Water tankownership (yes=1; no=0) WATTNK 0,0 1,0 0,1939 0,3954
Natural gasownership (yes=1; no=0) NATGAS 0,0 1,0 0,4484 0,4974
Cable castownership (yes=1; no=0) CABCAST 0,0 1,0 0,0871 0,2820
Elevatorownership (yes=1; no=0) ELEVTR 0,0 1,0 0,2510 0,4337
Garage ownership (yes=1; no=0) PARKNG 0,0 1,0 0,0733 0,2607
Swimming pool ownership (yes=1; no=0) SWPOOL 0,0 1,0 0,0092 0,0953
Generatorownership (yes=1; no=0) GNRTOR 0,0 1,0 0,0205 0,1417
Telephone line ownership/number TLPHLINE 0,0 2,0 0,7479 0,4543
aThe reference has been taken as category.
75 Hedonic Estimation Of Housing Market Prices in Turkey
In general, linear, semi-logarithmic (Log-dog) and full-logarithmic
functions have been used for hedonic model during the analysis. In this study, as
well, there has been experimented linear, semi and full-logarithmic regression
models. There has been established an empirical model accepting market price
of the house (HPRICE) as the dependent and the others as independent variables
among the ones that take place within Table 1. There has been encountered to
the variance problem in established models and the problem has been tried to be
overcome using White has developed consistent variance-covariance matrix.
IV.EMPIRICAL EVIDENCE
Linear, semi-logarithmic and full-logaritmic regresion model results have
been presented in Table 2. The variables of HSETYPE4, HLTHSERV, SAUNA,
UNDRHEAT and GNRTOR included in the regression model have been found
as statistically insignificant in all three models at 10% level of significance. The
variables that positively affect housing prices have been the variables of
HSETYPE3, PRPERTY3, HSIZE, BTHRFLR4, HEATSYST1, HEATSYST2,
HEATSYST4, HEATSYST5, BNKSERV, CEDUSERV, JAKUZZI, GARDIS,
WATTNK, CABCAST, PARKNG, SWPOOL, GNRTOR andTLPHLINE. The
variables that negatively affect housing prices have been the variables of
HSETYPE1, PRPERTY2, BCONSD, ROMFLR2, ROMFLR3, ROMFLR4,
ROMFLR5, ROMFLR6, ROMFLR7, BTHRFLR2, BTHRFLR3, FUEL1,
FUEL2, FUEL4, FUEL5, HLTHSERV, NATGAS and ELEVTR.
76 Erciyes Üniversitesi İktisadi ve İdari Bilimler Fakültesi Dergisi, Sayı: 43, Ocak-Haziran 2014 ss. 67-82
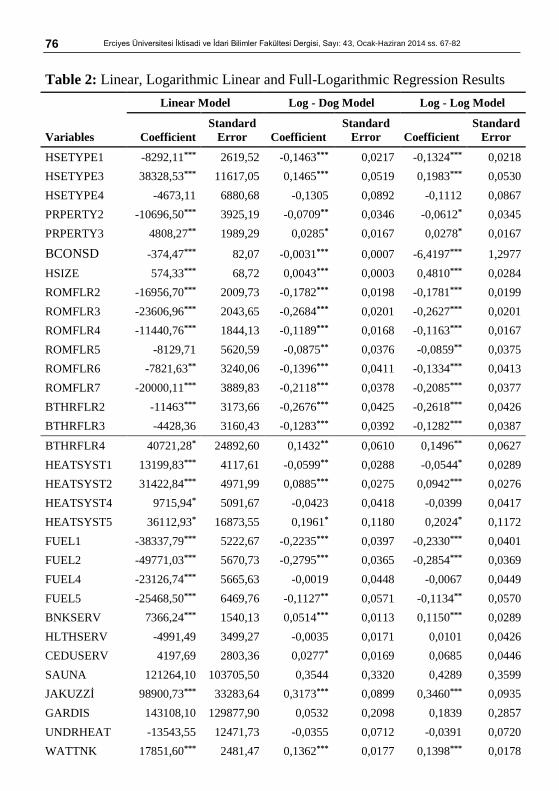
Table 2: Linear, Logarithmic Linear and Full-Logarithmic Regression Results
Variables
Linear Model Log - Dog Model Log - Log Model
Coefficient
Standard
Error Coefficient
Standard
Error Coefficient
Standard
Error
HSETYPE1 -8292,11*** 2619,52 -0,1463*** 0,0217 -0,1324*** 0,0218
HSETYPE3 38328,53*** 11617,05 0,1465*** 0,0519 0,1983*** 0,0530
HSETYPE4 -4673,11 6880,68 -0,1305 0,0892 -0,1112 0,0867
PRPERTY2 -10696,50*** 3925,19 -0,0709** 0,0346 -0,0612* 0,0345
PRPERTY3 4808,27** 1989,29 0,0285* 0,0167 0,0278* 0,0167
BCONSD -374,47*** 82,07 -0,0031*** 0,0007 -6,4197*** 1,2977
HSIZE 574,33*** 68,72 0,0043*** 0,0003 0,4810*** 0,0284
ROMFLR2 -16956,70*** 2009,73 -0,1782*** 0,0198 -0,1781*** 0,0199
ROMFLR3 -23606,96*** 2043,65 -0,2684*** 0,0201 -0,2627*** 0,0201
ROMFLR4 -11440,76*** 1844,13 -0,1189*** 0,0168 -0,1163*** 0,0167
ROMFLR5 -8129,71 5620,59 -0,0875** 0,0376 -0,0859** 0,0375
ROMFLR6 -7821,63** 3240,06 -0,1396*** 0,0411 -0,1334*** 0,0413
ROMFLR7 -20000,11*** 3889,83 -0,2118*** 0,0378 -0,2085*** 0,0377
BTHRFLR2 -11463*** 3173,66 -0,2676*** 0,0425 -0,2618*** 0,0426
BTHRFLR3 -4428,36 3160,43 -0,1283*** 0,0392 -0,1282*** 0,0387
BTHRFLR4 40721,28* 24892,60 0,1432** 0,0610 0,1496** 0,0627
HEATSYST1 13199,83*** 4117,61 -0,0599** 0,0288 -0,0544* 0,0289
HEATSYST2 31422,84*** 4971,99 0,0885*** 0,0275 0,0942*** 0,0276
HEATSYST4 9715,94* 5091,67 -0,0423 0,0418 -0,0399 0,0417
HEATSYST5 36112,93* 16873,55 0,1961* 0,1180 0,2024* 0,1172
FUEL1 -38337,79*** 5222,67 -0,2235*** 0,0397 -0,2330*** 0,0401
FUEL2 -49771,03*** 5670,73 -0,2795*** 0,0365 -0,2854*** 0,0369
FUEL4 -23126,74*** 5665,63 -0,0019 0,0448 -0,0067 0,0449
FUEL5 -25468,50*** 6469,76 -0,1127** 0,0571 -0,1134** 0,0570
BNKSERV 7366,24*** 1540,13 0,0514*** 0,0113 0,1150*** 0,0289
HLTHSERV -4991,49 3499,27 -0,0035 0,0171 0,0101 0,0426
CEDUSERV 4197,69 2803,36 0,0277* 0,0169 0,0685 0,0446
SAUNA 121264,10 103705,50 0,3544 0,3320 0,4289 0,3599
JAKUZZİ 98900,73*** 33283,64 0,3173*** 0,0899 0,3460*** 0,0935
GARDIS 143108,10 129877,90 0,0532 0,2098 0,1839 0,2857
UNDRHEAT -13543,55 12471,73 -0,0355 0,0712 -0,0391 0,0720
WATTNK 17851,60*** 2481,47 0,1362*** 0,0177 0,1398*** 0,0178
77 Hedonic Estimation Of Housing Market Prices in Turkey
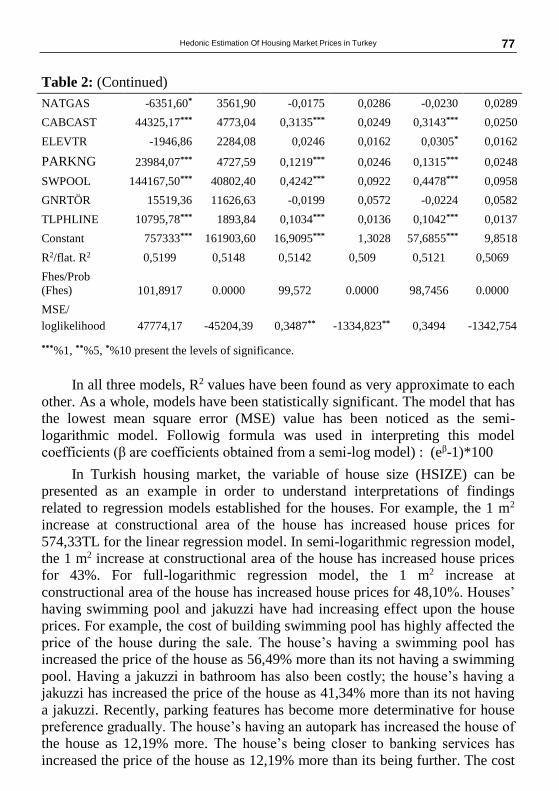
Table 2: (Continued)
NATGAS -6351,60* 3561,90 -0,0175 0,0286 -0,0230 0,0289
CABCAST 44325,17*** 4773,04 0,3135*** 0,0249 0,3143*** 0,0250
ELEVTR -1946,86 2284,08 0,0246 0,0162 0,0305* 0,0162
PARKNG 23984,07*** 4727,59 0,1219*** 0,0246 0,1315*** 0,0248
SWPOOL 144167,50*** 40802,40 0,4242*** 0,0922 0,4478*** 0,0958
GNRTÖR 15519,36 11626,63 -0,0199 0,0572 -0,0224 0,0582
TLPHLINE 10795,78*** 1893,84 0,1034*** 0,0136 0,1042*** 0,0137
Constant 757333*** 161903,60 16,9095*** 1,3028 57,6855*** 9,8518
R2/flat. R2 0,5199 0,5148 0,5142 0,509 0,5121 0,5069
Fhes/Prob
(Fhes) 101,8917 0.0000 99,572 0.0000 98,7456 0.0000
MSE/
loglikelihood 47774,17 -45204,39 0,3487** -1334,823** 0,3494 -1342,754
***%1, **%5, *%10 present the levels of significance.
In all three models, R2 values have been found as very approximate to each
other. As a whole, models have been statistically significant. The model that has
the lowest mean square error (MSE) value has been noticed as the semi-
logarithmic model. Followig formula was used in interpreting this model
coefficients (β are coefficients obtained from a semi-log model) : (eβ-1)*100
In Turkish housing market, the variable of house size (HSIZE) can be
presented as an example in order to understand interpretations of findings
related to regression models established for the houses. For example, the 1 m2
increase at constructional area of the house has increased house prices for
574,33TL for the linear regression model. In semi-logarithmic regression model,
the 1 m2 increase at constructional area of the house has increased house prices
for 43%. For full-logarithmic regression model, the 1 m2 increase at
constructional area of the house has increased house prices for 48,10%. Houses’
having swimming pool and jakuzzi have had increasing effect upon the house
prices. For example, the cost of building swimming pool has highly affected the
price of the house during the sale. The house’s having a swimming pool has
increased the price of the house as 56,49% more than its not having a swimming
pool. Having a jakuzzi in bathroom has also been costly; the house’s having a
jakuzzi has increased the price of the house as 41,34% more than its not having
a jakuzzi. Recently, parking features has become more determinative for house
preference gradually. The house’s having an autopark has increased the house of
the house as 12,19% more. The house’s being closer to banking services has
increased the price of the house as 12,19% more than its being further. The cost
78 Erciyes Üniversitesi İktisadi ve İdari Bilimler Fakültesi Dergisi, Sayı: 43, Ocak-Haziran 2014 ss. 67-82
of going to the bank that has been called as shoe cost have been efficient upon
preferring the houses’ being close to banking services. Fuel type’s being wood
and coal has decreased the price of the house in all three types of model. Room
floor’s being tile has also decreased the price of the house.
CONCLUSION AND SUGGESTIONS
Houses are structures covering a maximum area in the physical structure of
cities. With infrastructure works, construction of motorways and bridges, rapid
population growth, urbanization, the increase in housing need, urbanization of
agricultural and forest land, construcition of multi-storey buildings, construction
of villa-style houses, construction of large shopping centers, the city is
undergoing a major transformation occurred, qualifications sought and claimed
in structures vary. Residences of individuals with physical needs such as shelter,
psychological and social needs meet together has become a consumer good.
The factors that affect house prices are very complex. House prices are
closely related to residential properties. Many features such as comfort that it
provides to its users, proximity to business centers and to areas of social
reinforcement, quality of local services, infrastructure facilities, impurity, noise,
the amount of tax are determining factor in the value of house prices. There are
different features of each house, so house is a heterogeneous commodity and
house market is a heterogeneous market. Because of heterogeneity hedonic price
model is used to determine the effect of different characteristics on house prices.
The purpose of this study is to determine tha factors that affect housing
prices in Turkey. For this reason, TSI Houselhold Budget Survey 2010 data
have been used. There have been established three different models
experimenting three different function types as linear, semi-logarithmic and full-
logarithmic.
Five of 45 variables included in regression models (HSETYPE4,
HLTHSERV, SAUNA, UNDRHEAT, GNRTOR) have not been found as
statistically significant in none of the models. Coefficient indicators of the
variables have been in accordance with the theoretical expectations. Houses’
having swimming pool, jakuzzi and water tank, the houses’ being duplex flat,
those’s having central heating system, size of the house, batroom floor’s being
vinyl or PVC, its being closer to banking and compulsory education services,
houses’ having cable cast, telephone line and parking area have increased the
value of the houses. The house’s being on ground or basement floor,
construction year of the building, bathroom floor’s being cement finish and used
fuel’s being coal have had decreasing effect upon the value of the house.
Majority of the studies carried out previously on this subject have included
urban areas. In the study in which determinatives of housing prices in turkey has
79 Hedonic Estimation Of Housing Market Prices in Turkey
been specified and carried out by Selim in 2008, there have been used 2004
Household Budget Survey. According to the aforementioned study, the most
important variables that affect house prices have been the type of house, the type
of structure, number of rooms, size of the house, and the house’s having water
tank, swimming pool and natural gas.
This study has been used more variables from previous studies. Whereas
earlier studies focused on house properties related to the the environment or
transformation. In this study in which 2010 Household Budget Survey micro
data set and one dependent and 45 independent variables have been used have
had similar results to the one that has been carried out by Selim (2008). The
survey is more recent used in this study than the survey used in the study Selim
(2008) made on this subject. In this study, as well, there have been brought more
house characterisitics to the forefront. With this study, there has been
precipitated that the variables such as house’s being duplex, central heating
system, bathroom floor’s being vinyl or PVC, its being closer to banking and
compulsory education services, its having cable cast, telephone line and parking
area, the house’s being on basement or ground floor, construction year of the
building, room floor’s being tile, bathroom’s being cement finish and fuel’s
being coal have affected the value of the house.
Studies on this subject can be varied in the number of variables. Because
the factors that affect house prices are increasing over time. This study has been
considered as a set of information for both producers and consumers. There can
be said that producers’ making their plans considering the factors that have been
efficient or not upon the house prices has been highly important for their
efficient use of their sources.
80 Erciyes Üniversitesi İktisadi ve İdari Bilimler Fakültesi Dergisi, Sayı: 43, Ocak-Haziran 2014 ss. 67-82
REFERENCES
ARCAN, Enis Faik and Fikret EVCİ; (1999), Approach to Architectural
Design, Second Edition, Istanbul: Design Publishing Group.
ARIKAN, Fatma Eban; (2008), “Determination of Factors that Affect House
Rents with Hedonic Pricing Method”, Unpublished Postgraduate Thesis,
Istanbul: Marmara University Social Sciences Institute.
BALDEMİR, Ercan; Cüneyt Yenal KESBİÇ and Mustafa İNCİ; (2008),
“Estimating Hedonic Demand Parameters in Real Estate Market (Muğla
Example)”, İnönü University Journal of Social Sciences Enstitue, 20,
pp. 41-66.
BOYACIGİL, Onur; (2003), “A Case Study on the Hedonic Pricing
Methodology in Iskenderun Urban Space”, Unpublished Postgraduate
Thesis, Adana: Çukurova University Institute of Science.
COHEN, Jeffrey P. and Cletus C. COUGHLIN; (2006), “Airport-Related Noise,
Proximity, and Housing Prices in Atlanta”, Working Paper Federal
Reserve Bank of St. Louis, pp. 1-34. Internet Address:
http://papers.ssrn.com/sol3/papers.cfm?abstract_id=840184, Date of
Access: 21.11.2012.
ÇUBUKÇU, Ebru and Gözde Ekşioğlu ÇETINTAHRA; (2011), “Investigating
the Influence of Environmental Aesthetics on House Prices Using
Hedonic Models”, İTÜ Journal, 10(1), pp. 3–12.
GRILICHES, Zvi; (1991), “Hedonic Price Indexes and the Measurement of
Capital and Productivity: Some Historical Reflections”, Fifty Years of
Economic Measurement: The Jubilee of the Conference on
Research in Income and Wealth , Conferans Seminer, University Of
Chicago Press, 12-14 May, pp. 185-206. Internet Address:
http://www.nber.org/chapters/ c5976.pdf, Date of Access: 20.11.2012.
HARSMAN, Bjorn and John M. QUIGLEY; (1990), Housing Markets and
Housing Institutions: An International Comparison, Boston: Kluwer
Academic Publishers.
HILL, Robert J. and Daniel MELSER; (2008), “Hedonic Impution and The
Price Index Problem: An Application to Housing”, Economic Inquiry,
46(4), pp. 593-609.
HIRCHMAN, Elizabeth C. and Morris B. HOLBROOK; (1982), “Hedonic
Consumption: Emerging Concepts, Method sand Propositions”, Journal
of Marketing, 46(3), pp. 92-101.
81 Hedonic Estimation Of Housing Market Prices in Turkey
KAIN, John F. and John M. QUIGLEY; (1970), “Measuring the Value of
Housing Quality”, Journal of the American Statistical Association,
65(330), pp. 532–548.
LANCESTER, Kelvin J.; (1966), “ A New Approach to Consumer Theory”,
The Journal of Political Economy, 74(2), pp. 132–157.
LEVENT, Haluk; (1995), “Hedonic Approach to Demand Theory and A Case
Study: Determination of Real Estate Prices in Istanbul”, Unpublished
Doctoral Thesis, Istanbul: Istanbul University Social Sciences Institute.
MANKIW, N. Gregory; (2001), Principles of Economics, Second Edition,
USA: Harcourt College Publishers.
PARMETER, Christopher F.; Daniel J. HENDERSON and Subal C.
KUMBHAKAR; (2007), “Nonparametric Estimation of A Hedonic
Price Function”, Journal of Applied Econometrics, 22, pp. 695-699.
RIDKER, Ronald G. and John A. HENNING; (1967), “The Determinants of
Residential Property Values with Special Reference to Air Pollution”,
The Review of Economics and Statistics, 49(2), pp. 246–257.
ROSEN, Sherwin; (1974), “Hedonic Prices and Implicit Markets: Product
Differentiation in Pure Competition”, Journal of Political Economy,
8(1), pp. 34–55.
ROSEN, Sherwin; (1976), “A Theory of Life Earnings”, The Journal of
Political Economy, Part 2: Essays in Labor Economics in Hanor of H.
Gregglewis, 84(4), pp. 45–67.
SELİM, Sibel; (2008), “Determinants of House Prices in Turkey: Hedonic
Regression Model”, Doğuş University Journal, 9(1), pp. 65–76.
SELİM, Hasan; (2009), “Determinants of House Prices in Turkey: Hedonic
Regression Versus Artificial Neural Network”, Expert Systems with
Applications, 36, pp. 2843–2852.
SPANGENBERG, Eric R.; Kevin E. VASS and Ayn E. CROWLEY; (1997),
“Measuring the Hedonic and Utilitarian Dimensions of Attitude: A
Generally Applicable Scale”, Advances in Consumer Research, 24,
pp. 235–241, Internet Address: http://www.acrwebsite.org/search/view-
conference-proceedings.aspx?Id=8048, Date of Access: 19.11.2012.
TODA, Yasushi and Nadezhda N. NOZDRINA; (2004), “The Spatial
Distribution of the Apartment Prices in Moscow In 2002: Hedonic
Estimation From Micro Data”, ENHR Conference, 2-6 July,
Cambridge, pp. 1-9, Internet Address:http://isites.harvard.edu/fs/docs/
icb.topic871787.files/Moscow_Hedonic_Pricing.pdf, Date of Access:
19.11.2012.
82 Erciyes Üniversitesi İktisadi ve İdari Bilimler Fakültesi Dergisi, Sayı: 43, Ocak-Haziran 2014 ss. 67-82
Turkish Statistics Institutes; (2011), “Household Budget Survey Microdata Set
2010”, Internet Address: http://www.tuik.gov.tr/ Ki-
tap.do?metod=KitapDetay&KT_ID=7&KITAP_ID=255, Date of Ac-
cess: 20.11.2012.
ÜÇDOĞRUK, Şenay; (2001), “Factors that Affect Real Estate Prices in Izmir:
Hedonic Approach”, Dokuz Eylül University Faculty of Economics
and Administrative Sciences Journal, 16(2), pp. 149–161.
WEN, Hai-zhen; Jyh-Feng LU and Ling LIN; (2004), “An Improved Method of
Real Estate Evaluation Based on Hedonic Price Model”, IEEE
International Publisher, Center for Real Estate Studying, Engineering
Management Conference,18-21 October, China: Zhejiang University,
pp. 1329-1332.
WEN, Hai-zhen; Sheng-hua JIA and Xiao-yu GUO; (2005), “Hedonic Price
Analysis of Urban Housing: An Empirical Research on Hangzhou”,
Journal of Zhejiang University Science A, 6(8), pp. 907–914.
YANG, Zan; (2001), “An Application Of The Hedonic Price Model With
Uncertain Attribute, The Case Of The People’s Republic Of China”,
Property Management, 19(1), pp. 50-63.
YANKAYA, Uğur and Murat ÇELIK; (2005), (2005), “Modeling the Impact of
Izmir Subway on the Housing Values with Hedonic Price Model”,
Dokuz Eylül University İ.İ.B.F. Magazine, 20(2), pp. 61–79.
YAYAR, Rüştü; (2011), “Estimating Hedonic Demand Parameters in Laptop
Computer Market”, KMÜ Social and Economic Researches Journal,
13 (21), pp. 21-27.