Group hedonic balance and pair programming performance
10
Group Hedonic Balance and Pair Programming Performance: Affective Interaction Dynamics as Indicators of Performance Malte F. Jung Management Science & Engineering Stanford University Stanford, CA, 94305, USA [email protected] Jan Chong OnLive 181 Lytton Avenue, Palo Alto, CA, 94301, USA [email protected] Larry J. Leifer Mechanical Engineering Stanford University Stanford, CA, 94305, USA [email protected] ABSTRACT Inspired by research on the role of affect in marital interactions, the authors examined whether affective interaction dynamics occurring within a 5-minute slice can predict pair programming performance. In a laboratory experiment with professional programmers, Group Hedonic Balance, a measure of the balance between positive and negative expressed affect, accounted for up to 35% of the variance in not only subjective but also objective pair programming performance. Implications include a new set of methods to study pair programming interactions and recommendations to improve pair programming performance. Author Keywords Pair programming; affective interaction dynamics; emotion; systematic observation of behavior; thin slicing; team performance ACM Classification Keywords H.5.0 [Information Interfaces And Presentation]: General General Terms Human Factors, Theory INTRODUCTION Pair programming is a method where two people work together shoulder-to-shoulder at a single computer. Studies of pair programming in university programming classes have shown that pair programming yields better design, more compact code, and fewer defects for roughly equivalent person-hours [13, 30, 46, 55, 56]. Studies have also noted that pair programmers exhibit greater confidence in their code and more enjoyment of the programming process [8, 29, 30, 44, 47]. Positive results with pair programming have led to speculation that a collateral benefits of the practice may include improved morale and project knowledge shared efficiently across the development team in a manner that can be expected to improve productivity in subsequent development cycles [8]. In spite of these compelling results, the adoption of pair programming has faced resistance and skepticism from both managers and programmers. While this may simply be a result of either the novelty of the practice or skepticism of the larger methodological context (Extreme Programming/Agile methods) in which pair programming is often introduced, there is some evidence that pair programming may not necessarily be appropriate for everyone [16]. Furthermore there is evidence that demonstrates that pair programming can be less efficient than solo programming [4, 45]. Given these contradictions it is still an open question as to when and why pair programming works. While past research focusing on pair programming interactions has looked at personality type influences [31, 50, 51, 53], and collaborative behavior such a keyboard switching [10], driving and navigating behavior [10, 12], communication [16, 52], and system complexity [4], no research up to date has focused on the quality of pair programming interactions by investigating affective interaction dynamics nor have methods been proposed to measure and study these dynamics. Group Hedonic Balance: From Marital Interactions to Programming Pairs In contrast to researchers of pair programmers, researchers of married couples have developed powerful methods to gain insights into relationship between affective interaction dynamics and long term subjective as well as objective outcomes [23]. Especially illustrative is a study in which Gottman and Levenson [27] showed that it is possible to accurately (93%) predict the fate of a marriage based on the affective interaction quality determined from just a 15 minute video sample of a couple’s interaction. In another study, divorce could be predicted based on the affective interaction quality during the first 3 minutes of a conflict episode with 80% accuracy [9]. Using the same methods, it was possible to predict subjective marital outcomes such as Permission to make digital or hard copies of all or part of this work for personal or classroom use is granted without fee provided that copies are not made or distributed for profit or commercial advantage and that copies bear this notice and the full citation on the first page. To copy otherwise, or republish, to post on servers or to redistribute to lists, requires prior specific permission and/or a fee. CHI’12, May 5–10, 2012, Austin, Texas, USA. Copyright 2012 ACM 978-1-4503-1015-4/12/05...$10.00. Session: Affective Presence CHI 2012, May 5–10, 2012, Austin, Texas, USA 829
Transcript of Group hedonic balance and pair programming performance
Group Hedonic Balance and Pair Programming Performance: Affective Interaction Dynamics
as Indicators of Performance Malte F. Jung
Management Science & Engineering
Stanford University Stanford, CA, 94305, USA
Jan Chong OnLive
181 Lytton Avenue, Palo Alto, CA, 94301, USA
Larry J. Leifer Mechanical Engineering
Stanford University Stanford, CA, 94305, USA
ABSTRACT Inspired by research on the role of affect in marital interactions, the authors examined whether affective interaction dynamics occurring within a 5-minute slice can predict pair programming performance. In a laboratory experiment with professional programmers, Group Hedonic Balance, a measure of the balance between positive and negative expressed affect, accounted for up to 35% of the variance in not only subjective but also objective pair programming performance. Implications include a new set of methods to study pair programming interactions and recommendations to improve pair programming performance.
Author Keywords Pair programming; affective interaction dynamics; emotion; systematic observation of behavior; thin slicing; team performance
ACM Classification Keywords H.5.0 [Information Interfaces And Presentation]: General
General Terms Human Factors, Theory
INTRODUCTION Pair programming is a method where two people work together shoulder-to-shoulder at a single computer. Studies of pair programming in university programming classes have shown that pair programming yields better design, more compact code, and fewer defects for roughly equivalent person-hours [13, 30, 46, 55, 56]. Studies have also noted that pair programmers exhibit greater confidence in their code and more enjoyment of the programming process [8, 29, 30, 44, 47]. Positive results with pair programming have led to speculation that a collateral
benefits of the practice may include improved morale and project knowledge shared efficiently across the development team in a manner that can be expected to improve productivity in subsequent development cycles [8]. In spite of these compelling results, the adoption of pair programming has faced resistance and skepticism from both managers and programmers. While this may simply be a result of either the novelty of the practice or skepticism of the larger methodological context (Extreme Programming/Agile methods) in which pair programming is often introduced, there is some evidence that pair programming may not necessarily be appropriate for everyone [16]. Furthermore there is evidence that demonstrates that pair programming can be less efficient than solo programming [4, 45]. Given these contradictions it is still an open question as to when and why pair programming works.
While past research focusing on pair programming interactions has looked at personality type influences [31, 50, 51, 53], and collaborative behavior such a keyboard switching [10], driving and navigating behavior [10, 12], communication [16, 52], and system complexity [4], no research up to date has focused on the quality of pair programming interactions by investigating affective interaction dynamics nor have methods been proposed to measure and study these dynamics.
Group Hedonic Balance: From Marital Interactions to Programming Pairs In contrast to researchers of pair programmers, researchers of married couples have developed powerful methods to gain insights into relationship between affective interaction dynamics and long term subjective as well as objective outcomes [23]. Especially illustrative is a study in which Gottman and Levenson [27] showed that it is possible to accurately (93%) predict the fate of a marriage based on the affective interaction quality determined from just a 15 minute video sample of a couple’s interaction. In another study, divorce could be predicted based on the affective interaction quality during the first 3 minutes of a conflict episode with 80% accuracy [9]. Using the same methods, it was possible to predict subjective marital outcomes such as
Permission to make digital or hard copies of all or part of this work for personal or classroom use is granted without fee provided that copies arenot made or distributed for profit or commercial advantage and that copiesbear this notice and the full citation on the first page. To copy otherwise,or republish, to post on servers or to redistribute to lists, requires priorspecific permission and/or a fee. CHI’12, May 5–10, 2012, Austin, Texas, USA. Copyright 2012 ACM 978-1-4503-1015-4/12/05...$10.00.
Session: Affective Presence CHI 2012, May 5–10, 2012, Austin, Texas, USA
829
satisfaction and objective outcomes such as divorce across a wide range of studies [24, 25, 33, 40-42]. Central to these studies was the idea of a balance theory of marriage which posits that couple’s ability to regulate the hedonic balance of positive and negative affect is critical for the quality of their interaction and long-term outcomes [22]. A classification of couples based on their hedonic balance into regulated (more positive than negative) and non-regulated (more negative than positive) couples in the studies cited above was repeatedly shown to be predictive of marital satisfaction and divorce. The notion of hedonic balance as a predictor of individual well being has been established in several studies [17-19, 35, 36], but besides the work of Losada [20, 43], to the authors’ knowledge no research has been done to explore the relationship between hedonic balance and outcomes in work groups and programming pairs in particular.
The first aim of the research presented here was therefore to adapt a set of methods that have been successful in predicting satisfaction and divorce in marriages to solve the problem of understanding the relationships between affective interaction dynamics and performance in pair programming teams. Core to this set of methods are two techniques: Thin Slicing and Systematic Observation of Behavior. The second aim was to extend Gottman’s balance theory of affect to pair programming groups and explore the role of Group Hedonic Balance as an indicator of pair programming performance. Specifically we hypothesized that Group Hedonic Balance would correlate with performance relevant outcomes:
Hypothesis: Pairs with a higher group hedonic balance will outperform those with a lower group hedonic balance.
Thin Slicing Thin-slicing refers to the process of making accurate classifications based on small samples, or “thin slices” of expressive behaviors [2]. The thin-slicing research showed powerfully that certain behavioral characteristics are stable over time and that only a small interaction sample is necessary to make meaningful judgments about behavior
occurring over longer durations such as hours, or even months. For example, in a frequently cited study, Ambady and Rosenthal [3] showed that end-of-semester teacher evaluations could be accurately classified based on judgments of 30 second silent video clips of the respective teachers. In addition to its more prominent applications in predicting teacher evaluations [3] and marital outcomes [9, 27], the method of thin slicing has been applied successfully across a wide range of other contexts such as doctor-patient interactions, family interactions, interviews, or work related interactions [2]. Particularly relevant is also a study by Curhan and Pentland who used thin slicing to show that the affective interaction patterns occurring in a short time interval are predictive of performance in dyadic negotiation interactions [15].
Systematic Observation of Behavior Systematic observation refers to a particular approach of quantifying behavior according to which trained observers record occurrences of specific behaviors in correspondence with a preciously defined coding scheme [5]. The goal of this approach is “for properly trained observers to produce identical protocols, given that they observed the same stream of behavior” [5]. Often audio or video recordings are used as a basis for coding. One of two central components of the method of Systematic Observation is the catalog of behavior codes or “Coding Scheme”. Two approaches can be distinguished in developing a coding scheme: To (1) derive it from existing theory “top down”, or (2) develop it using a more grounded approach “bottom up”, deriving it from the close observation of behavior itself [54]. The other central component of Systematic Observation is the demonstration of reliability of coders. Coder reliability refers to the level of agreement between two independent observers of the same stream of behavior. A common measure for the assessment of coder reliability is Cohen’s Kappa [14] which determines the level of agreement corrected for chance agreements, in comparison to the often used percent-agreement. To test our hypothesis we employed both methods of Thin Slicing and Systematic Observation of Behavior as described in the following sections.
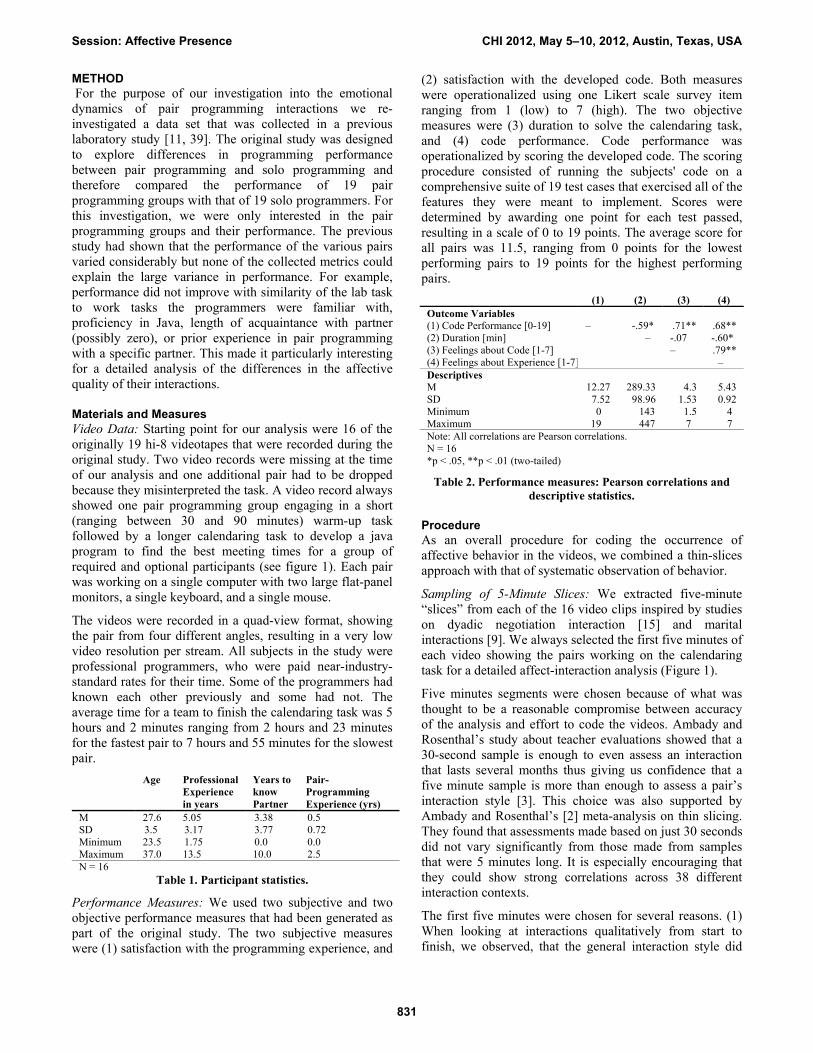
Figure 1. Pair programming study: Procedure overview.
Session: Affective Presence CHI 2012, May 5–10, 2012, Austin, Texas, USA
830
METHOD For the purpose of our investigation into the emotional dynamics of pair programming interactions we re-investigated a data set that was collected in a previous laboratory study [11, 39]. The original study was designed to explore differences in programming performance between pair programming and solo programming and therefore compared the performance of 19 pair programming groups with that of 19 solo programmers. For this investigation, we were only interested in the pair programming groups and their performance. The previous study had shown that the performance of the various pairs varied considerably but none of the collected metrics could explain the large variance in performance. For example, performance did not improve with similarity of the lab task to work tasks the programmers were familiar with, proficiency in Java, length of acquaintance with partner (possibly zero), or prior experience in pair programming with a specific partner. This made it particularly interesting for a detailed analysis of the differences in the affective quality of their interactions.
Materials and Measures Video Data: Starting point for our analysis were 16 of the originally 19 hi-8 videotapes that were recorded during the original study. Two video records were missing at the time of our analysis and one additional pair had to be dropped because they misinterpreted the task. A video record always showed one pair programming group engaging in a short (ranging between 30 and 90 minutes) warm-up task followed by a longer calendaring task to develop a java program to find the best meeting times for a group of required and optional participants (see figure 1). Each pair was working on a single computer with two large flat-panel monitors, a single keyboard, and a single mouse.
The videos were recorded in a quad-view format, showing the pair from four different angles, resulting in a very low video resolution per stream. All subjects in the study were professional programmers, who were paid near-industry-standard rates for their time. Some of the programmers had known each other previously and some had not. The average time for a team to finish the calendaring task was 5 hours and 2 minutes ranging from 2 hours and 23 minutes for the fastest pair to 7 hours and 55 minutes for the slowest pair.
Age Professional Experience in years
Years to know Partner
Pair-Programming Experience (yrs)
M 27.6 5.05 3.38 0.5 SD 3.5 3.17 3.77 0.72 Minimum 23.5 1.75 0.0 0.0 Maximum 37.0 13.5 10.0 2.5 N = 16
Table 1. Participant statistics.
Performance Measures: We used two subjective and two objective performance measures that had been generated as part of the original study. The two subjective measures were (1) satisfaction with the programming experience, and
(2) satisfaction with the developed code. Both measures were operationalized using one Likert scale survey item ranging from 1 (low) to 7 (high). The two objective measures were (3) duration to solve the calendaring task, and (4) code performance. Code performance was operationalized by scoring the developed code. The scoring procedure consisted of running the subjects' code on a comprehensive suite of 19 test cases that exercised all of the features they were meant to implement. Scores were determined by awarding one point for each test passed, resulting in a scale of 0 to 19 points. The average score for all pairs was 11.5, ranging from 0 points for the lowest performing pairs to 19 points for the highest performing pairs.
(1) (2) (3) (4) Outcome Variables (1) Code Performance [0-19] – -.59* .71** .68** (2) Duration [min] – -.07 -.60* (3) Feelings about Code [1-7] – .79** (4) Feelings about Experience [1-7] – Descriptives M 12.27 289.33 4.3 5.43 SD 7.52 98.96 1.53 0.92 Minimum 0 143 1.5 4 Maximum 19 447 7 7 Note: All correlations are Pearson correlations. N = 16 *p < .05, **p < .01 (two-tailed)
Table 2. Performance measures: Pearson correlations and descriptive statistics.
Procedure As an overall procedure for coding the occurrence of affective behavior in the videos, we combined a thin-slices approach with that of systematic observation of behavior.
Sampling of 5-Minute Slices: We extracted five-minute “slices” from each of the 16 video clips inspired by studies on dyadic negotiation interaction [15] and marital interactions [9]. We always selected the first five minutes of each video showing the pairs working on the calendaring task for a detailed affect-interaction analysis (Figure 1).
Five minutes segments were chosen because of what was thought to be a reasonable compromise between accuracy of the analysis and effort to code the videos. Ambady and Rosenthal’s study about teacher evaluations showed that a 30-second sample is enough to even assess an interaction that lasts several months thus giving us confidence that a five minute sample is more than enough to assess a pair’s interaction style [3]. This choice was also supported by Ambady and Rosenthal’s [2] meta-analysis on thin slicing. They found that assessments made based on just 30 seconds did not vary significantly from those made from samples that were 5 minutes long. It is especially encouraging that they could show strong correlations across 38 different interaction contexts.
The first five minutes were chosen for several reasons. (1) When looking at interactions qualitatively from start to finish, we observed, that the general interaction style did
Session: Affective Presence CHI 2012, May 5–10, 2012, Austin, Texas, USA
831
not change over time. This notion is also supported by the thin slicing literature that showed that accurate predictions are possible, independent of the time the sample is taken at. (2) In research on marital interactions, it has been shown that particularly the startup phase of an interaction can give valuable insights and higher predictive accuracy. Therefore, even though any five-minute sample would have probably given us sufficient insight of the interaction style of a pair, this research suggests that the first 5 minutes are particularly useful in making accurate assessments.
Coding of the Selected Samples: For systematic observation, we used a slightly adapted version of the Rapid Couples Interaction Scoring System (RCISS) [37]. We chose RCISS for two reasons: First, it is faster than the Specific Affect Coding System (SPAFF), and second, it is more granular in capturing minute differences in listener behavior. The modifications to the original coding scheme were necessary to adapt the coding system so that it would capture the affective differences between the various pairs. Couples interactions such as the ones that were used to develop RCISS, show huge differences in expressive behavior because they were generated in the context of a highly engaging conflict discussion. The pair programming teams, on the other hand, were not set out to be in conflict, and they did not share a long history together and thus affective differences in between them were much more subtle. For example expressions of contemptuous or frustrated behavior are common in marital conflict interactions but could hardly be observed during interactions of programming pairs. The adapted RCISS used for this study consisted of 13 speaker codes and 10 listener codes (see table 3).
Speaker Codes Listener Codes
Interest Backchannels present Validation Facial movement present Excitement Looking at each other Humor/Laugh Positive facial expression Empathy Responsive facial movement
Other Positive Complain No backchannels Criticize No facial movement Constrained Anger No looking at each other Defensive Negative facial expression Yes-but Stonewalling Put down Tension/Tense humor
Other negative
Table 3. Modified RCISS coding scheme.
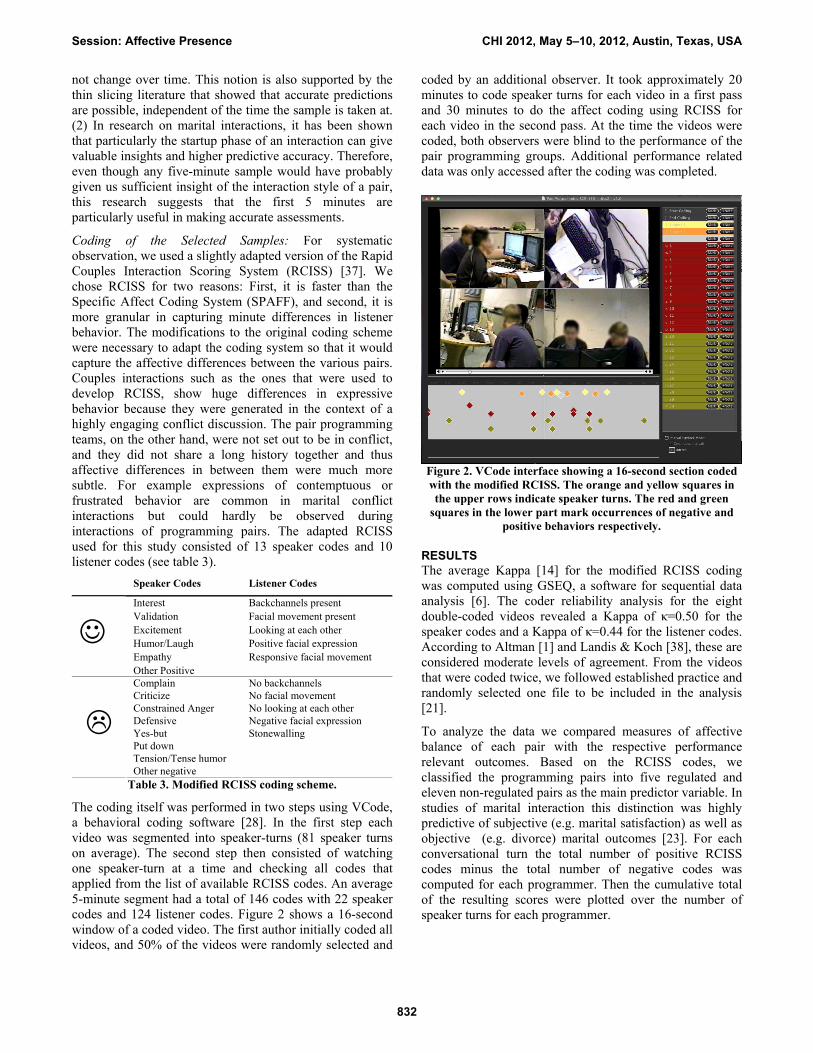
The coding itself was performed in two steps using VCode, a behavioral coding software [28]. In the first step each video was segmented into speaker-turns (81 speaker turns on average). The second step then consisted of watching one speaker-turn at a time and checking all codes that applied from the list of available RCISS codes. An average 5-minute segment had a total of 146 codes with 22 speaker codes and 124 listener codes. Figure 2 shows a 16-second window of a coded video. The first author initially coded all videos, and 50% of the videos were randomly selected and
coded by an additional observer. It took approximately 20 minutes to code speaker turns for each video in a first pass and 30 minutes to do the affect coding using RCISS for each video in the second pass. At the time the videos were coded, both observers were blind to the performance of the pair programming groups. Additional performance related data was only accessed after the coding was completed.
Figure 2. VCode interface showing a 16-second section coded with the modified RCISS. The orange and yellow squares in the upper rows indicate speaker turns. The red and green
squares in the lower part mark occurrences of negative and positive behaviors respectively.
RESULTS The average Kappa [14] for the modified RCISS coding was computed using GSEQ, a software for sequential data analysis [6]. The coder reliability analysis for the eight double-coded videos revealed a Kappa of κ=0.50 for the speaker codes and a Kappa of κ=0.44 for the listener codes. According to Altman [1] and Landis & Koch [38], these are considered moderate levels of agreement. From the videos that were coded twice, we followed established practice and randomly selected one file to be included in the analysis [21].
To analyze the data we compared measures of affective balance of each pair with the respective performance relevant outcomes. Based on the RCISS codes, we classified the programming pairs into five regulated and eleven non-regulated pairs as the main predictor variable. In studies of marital interaction this distinction was highly predictive of subjective (e.g. marital satisfaction) as well as objective (e.g. divorce) marital outcomes [23]. For each conversational turn the total number of positive RCISS codes minus the total number of negative codes was computed for each programmer. Then the cumulative total of the resulting scores were plotted over the number of speaker turns for each programmer.
Session: Affective Presence CHI 2012, May 5–10, 2012, Austin, Texas, USA
832
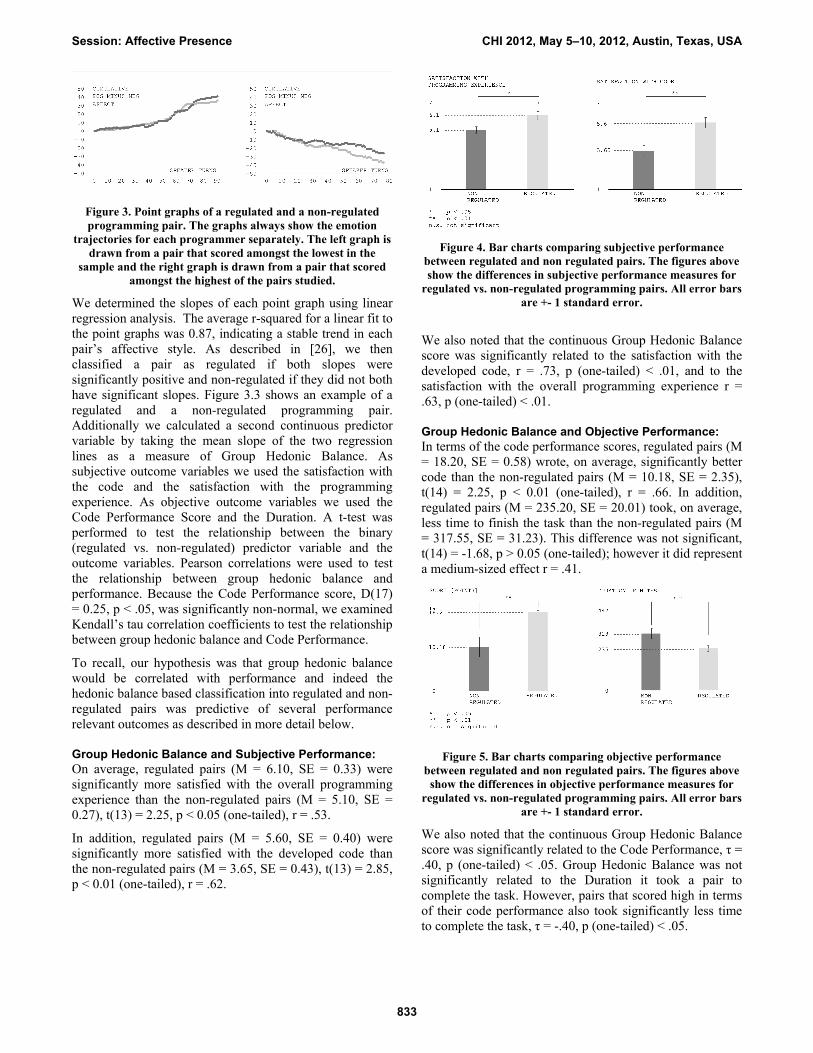
Figure 3. Point graphs of a regulated and a non-regulated programming pair. The graphs always show the emotion
trajectories for each programmer separately. The left graph is drawn from a pair that scored amongst the lowest in the
sample and the right graph is drawn from a pair that scored amongst the highest of the pairs studied.
We determined the slopes of each point graph using linear regression analysis. The average r-squared for a linear fit to the point graphs was 0.87, indicating a stable trend in each pair’s affective style. As described in [26], we then classified a pair as regulated if both slopes were significantly positive and non-regulated if they did not both have significant slopes. Figure 3.3 shows an example of a regulated and a non-regulated programming pair. Additionally we calculated a second continuous predictor variable by taking the mean slope of the two regression lines as a measure of Group Hedonic Balance. As subjective outcome variables we used the satisfaction with the code and the satisfaction with the programming experience. As objective outcome variables we used the Code Performance Score and the Duration. A t-test was performed to test the relationship between the binary (regulated vs. non-regulated) predictor variable and the outcome variables. Pearson correlations were used to test the relationship between group hedonic balance and performance. Because the Code Performance score, D(17) = 0.25, p < .05, was significantly non-normal, we examined Kendall’s tau correlation coefficients to test the relationship between group hedonic balance and Code Performance.
To recall, our hypothesis was that group hedonic balance would be correlated with performance and indeed the hedonic balance based classification into regulated and non-regulated pairs was predictive of several performance relevant outcomes as described in more detail below.
Group Hedonic Balance and Subjective Performance: On average, regulated pairs (M = 6.10, SE = 0.33) were significantly more satisfied with the overall programming experience than the non-regulated pairs (M = 5.10, SE = 0.27), t(13) = 2.25, p < 0.05 (one-tailed), r = .53.
In addition, regulated pairs (M = 5.60, SE = 0.40) were significantly more satisfied with the developed code than the non-regulated pairs (M = 3.65, SE = 0.43), t(13) = 2.85, p < 0.01 (one-tailed), r = .62.
Figure 4. Bar charts comparing subjective performance between regulated and non regulated pairs. The figures above show the differences in subjective performance measures for
regulated vs. non-regulated programming pairs. All error bars are +- 1 standard error.
We also noted that the continuous Group Hedonic Balance score was significantly related to the satisfaction with the developed code, r = .73, p (one-tailed) < .01, and to the satisfaction with the overall programming experience r = .63, p (one-tailed) < .01.
Group Hedonic Balance and Objective Performance: In terms of the code performance scores, regulated pairs (M = 18.20, SE = 0.58) wrote, on average, significantly better code than the non-regulated pairs (M = 10.18, SE = 2.35), t(14) = 2.25, p < 0.01 (one-tailed), r = .66. In addition, regulated pairs (M = 235.20, SE = 20.01) took, on average, less time to finish the task than the non-regulated pairs (M = 317.55, SE = 31.23). This difference was not significant, t(14) = -1.68, p > 0.05 (one-tailed); however it did represent a medium-sized effect r = .41.
Figure 5. Bar charts comparing objective performance between regulated and non regulated pairs. The figures above
show the differences in objective performance measures for regulated vs. non-regulated programming pairs. All error bars
are +- 1 standard error.
We also noted that the continuous Group Hedonic Balance score was significantly related to the Code Performance, τ = .40, p (one-tailed) < .05. Group Hedonic Balance was not significantly related to the Duration it took a pair to complete the task. However, pairs that scored high in terms of their code performance also took significantly less time to complete the task, τ = -.40, p (one-tailed) < .05.
Session: Affective Presence CHI 2012, May 5–10, 2012, Austin, Texas, USA
833
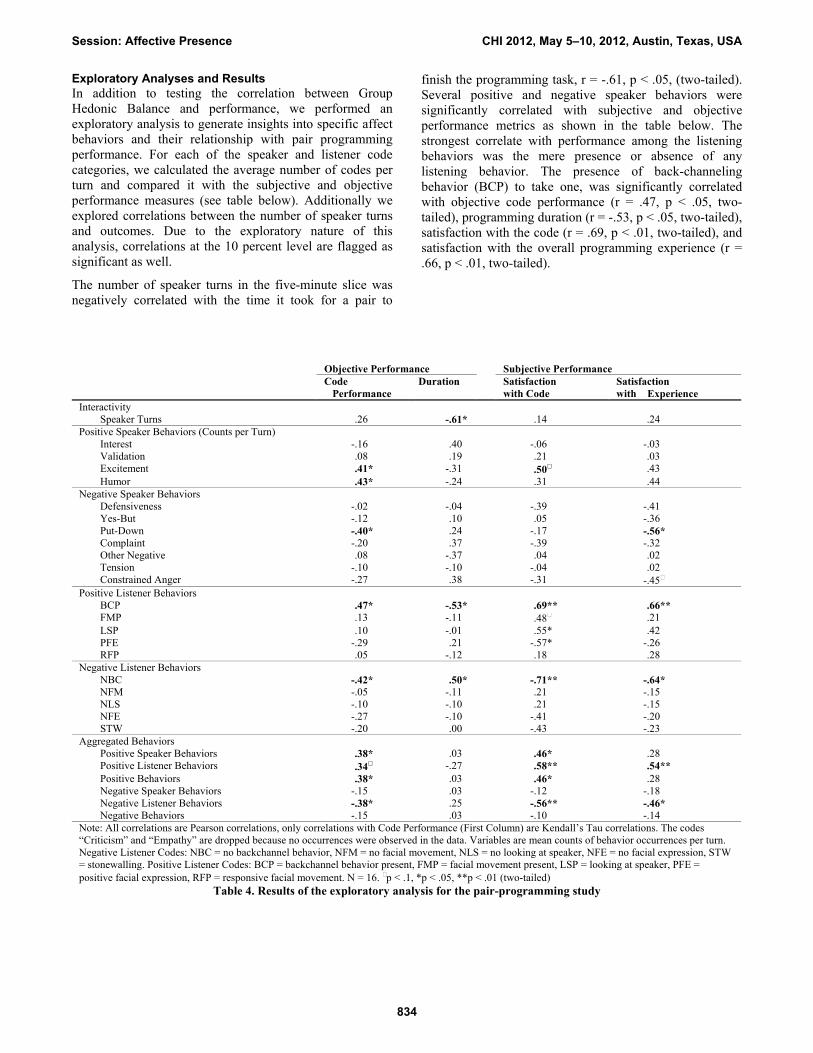
Exploratory Analyses and Results In addition to testing the correlation between Group Hedonic Balance and performance, we performed an exploratory analysis to generate insights into specific affect behaviors and their relationship with pair programming performance. For each of the speaker and listener code categories, we calculated the average number of codes per turn and compared it with the subjective and objective performance measures (see table below). Additionally we explored correlations between the number of speaker turns and outcomes. Due to the exploratory nature of this analysis, correlations at the 10 percent level are flagged as significant as well.
The number of speaker turns in the five-minute slice was negatively correlated with the time it took for a pair to
finish the programming task, r = -.61, p < .05, (two-tailed). Several positive and negative speaker behaviors were significantly correlated with subjective and objective performance metrics as shown in the table below. The strongest correlate with performance among the listening behaviors was the mere presence or absence of any listening behavior. The presence of back-channeling behavior (BCP) to take one, was significantly correlated with objective code performance (r = .47, p < .05, two-tailed), programming duration (r = -.53, p < .05, two-tailed), satisfaction with the code (r = .69, p < .01, two-tailed), and satisfaction with the overall programming experience (r = .66, p < .01, two-tailed).
Objective Performance Subjective Performance
Code �Performance
Duration Satisfaction with Code
Satisfaction with� Experience
Interactivity Speaker Turns .26 -.61* .14 .24 Positive Speaker Behaviors (Counts per Turn) Interest -.16 .40 -.06 -.03 Validation .08 .19 .21 .03 Excitement .41* -.31 .50 .43 Humor .43* -.24 .31 .44 Negative Speaker Behaviors Defensiveness -.02 -.04 -.39 -.41 Yes-But -.12 .10 .05 -.36 Put-Down -.40* .24 -.17 -.56* Complaint -.20 .37 -.39 -.32 Other Negative .08 -.37 .04 .02 Tension -.10 -.10 -.04 .02 Constrained Anger -.27 .38 -.31 -.45 Positive Listener Behaviors BCP .47* -.53* .69** .66** FMP .13 -.11 .48 .21 LSP .10 -.01 .55* .42 PFE -.29 .21 -.57* -.26 RFP .05 -.12 .18 .28 Negative Listener Behaviors NBC -.42* .50* -.71** -.64* NFM -.05 -.11 .21 -.15 NLS -.10 -.10 .21 -.15 NFE -.27 -.10 -.41 -.20 STW -.20 .00 -.43 -.23 Aggregated Behaviors Positive Speaker Behaviors .38* .03 .46* .28 Positive Listener Behaviors .34 -.27 .58** .54** Positive Behaviors .38* .03 .46* .28 Negative Speaker Behaviors -.15 .03 -.12 -.18 Negative Listener Behaviors -.38* .25 -.56** -.46* Negative Behaviors -.15 .03 -.10 -.14 Note: All correlations are Pearson correlations, only correlations with Code Performance (First Column) are Kendall’s Tau correlations. The codes “Criticism” and “Empathy” are dropped because no occurrences were observed in the data. Variables are mean counts of behavior occurrences per turn. Negative Listener Codes: NBC = no backchannel behavior, NFM = no facial movement, NLS = no looking at speaker, NFE = no facial expression, STW = stonewalling. Positive Listener Codes: BCP = backchannel behavior present, FMP = facial movement present, LSP = looking at speaker, PFE = positive facial expression, RFP = responsive facial movement. N = 16. p < .1, *p < .05, **p < .01 (two-tailed)
Table 4. Results of the exploratory analysis for the pair-programming study
Session: Affective Presence CHI 2012, May 5–10, 2012, Austin, Texas, USA
834
DISCUSSION We introduced the concept of Group Hedonic Balance to describe the affective quality of pair programming interactions. We found Group Hedonic Balance to be a powerful indicator for the performance of pair programming groups. A continuous Group Hedonic Balance measure assessed during the first five minutes of a software engineering interaction significantly correlated not only with subjective performance measures but also with the objective quality of the developed code. Overall the continuous measure was able to account for up to 53% of the variance in subjective performance and up to 20% of the variance in objective performance. In addition, we found that it is possible and meaningful to draw a binary distinction between regulated and non-regulated programming pairs based on differences in their affective interaction dynamics. This classification of programming teams into regulated and non-regulated pairs was predictive of subjective (up to 38% of variance) as well as objective performance measures (up to 44% of variance).
The usefulness of the distinction between regulated and non-regulated pairs was also supported by qualitative observations. What characterized non-regulated pairs were generally low levels of energy, with little interactivity, evidence of non-listening, and a constant presence of friction between the programmers. There was rarely any humor, or curiosity expressed in those pairs. Regulated pairs, on the other hand, exhibited high levels of energy and interactivity, participants often laughed or told jokes, and there were ample signs that the participants were listening to each other and visibly seemed to enjoy working with each other.
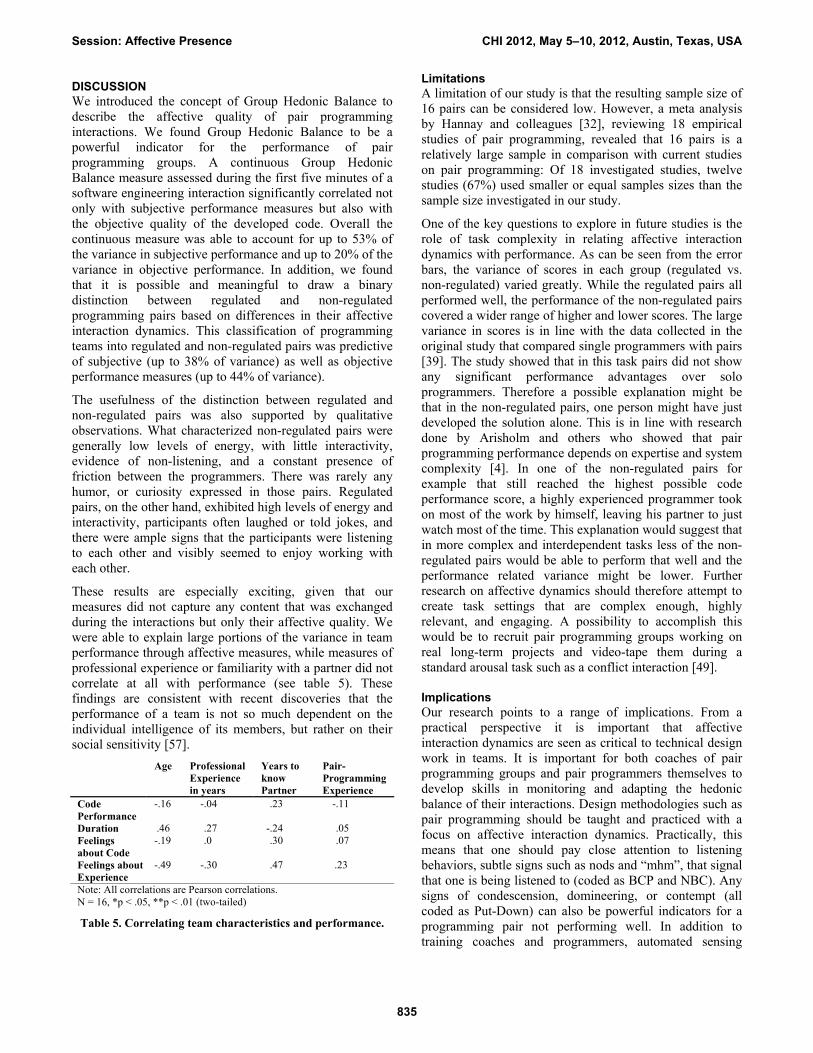
These results are especially exciting, given that our measures did not capture any content that was exchanged during the interactions but only their affective quality. We were able to explain large portions of the variance in team performance through affective measures, while measures of professional experience or familiarity with a partner did not correlate at all with performance (see table 5). These findings are consistent with recent discoveries that the performance of a team is not so much dependent on the individual intelligence of its members, but rather on their social sensitivity [57].
Age Professional Experience in years
Years to know Partner
Pair-Programming Experience
Code Performance
-.16 -.04 .23 -.11
Duration .46 .27 -.24 .05 Feelings about Code
-.19 .0 .30 .07
Feelings about Experience
-.49 -.30 .47 .23
Note: All correlations are Pearson correlations. N = 16, *p < .05, **p < .01 (two-tailed)
Table 5. Correlating team characteristics and performance.
Limitations A limitation of our study is that the resulting sample size of 16 pairs can be considered low. However, a meta analysis by Hannay and colleagues [32], reviewing 18 empirical studies of pair programming, revealed that 16 pairs is a relatively large sample in comparison with current studies on pair programming: Of 18 investigated studies, twelve studies (67%) used smaller or equal samples sizes than the sample size investigated in our study.
One of the key questions to explore in future studies is the role of task complexity in relating affective interaction dynamics with performance. As can be seen from the error bars, the variance of scores in each group (regulated vs. non-regulated) varied greatly. While the regulated pairs all performed well, the performance of the non-regulated pairs covered a wider range of higher and lower scores. The large variance in scores is in line with the data collected in the original study that compared single programmers with pairs [39]. The study showed that in this task pairs did not show any significant performance advantages over solo programmers. Therefore a possible explanation might be that in the non-regulated pairs, one person might have just developed the solution alone. This is in line with research done by Arisholm and others who showed that pair programming performance depends on expertise and system complexity [4]. In one of the non-regulated pairs for example that still reached the highest possible code performance score, a highly experienced programmer took on most of the work by himself, leaving his partner to just watch most of the time. This explanation would suggest that in more complex and interdependent tasks less of the non-regulated pairs would be able to perform that well and the performance related variance might be lower. Further research on affective dynamics should therefore attempt to create task settings that are complex enough, highly relevant, and engaging. A possibility to accomplish this would be to recruit pair programming groups working on real long-term projects and video-tape them during a standard arousal task such as a conflict interaction [49].
Implications Our research points to a range of implications. From a practical perspective it is important that affective interaction dynamics are seen as critical to technical design work in teams. It is important for both coaches of pair programming groups and pair programmers themselves to develop skills in monitoring and adapting the hedonic balance of their interactions. Design methodologies such as pair programming should be taught and practiced with a focus on affective interaction dynamics. Practically, this means that one should pay close attention to listening behaviors, subtle signs such as nods and “mhm”, that signal that one is being listened to (coded as BCP and NBC). Any signs of condescension, domineering, or contempt (all coded as Put-Down) can also be powerful indicators for a programming pair not performing well. In addition to training coaches and programmers, automated sensing
Session: Affective Presence CHI 2012, May 5–10, 2012, Austin, Texas, USA
835
technology such as the sociometer [48] can be used to assess Group Hedonic Balance in order to give automated feedback about the state of a team. Possibilities could be considered to integrate affective sensing technology into software development environments to give feedback that can be acted upon by designers.
CONCLUSION We showed in this study that methods and findings from studies of marital interactions generalize from those to work-groups such as pair programming teams. Our findings provide evidence that a balance theory of affect can be adapted from marital interactions to work groups. There is initial evidence that our methods and findings apply to design teams with three or four designers in longitudinal project settings [34].
Previous literature on affect and team-performance have focused on several aspects: (1) Trait affect or how people’s emotional personality affects outcomes, (2) mood or how team member’s internal emotional state affects outcomes, and (3) interpersonal trait attributions or liking, i.e. how the kind of attributions that people have about each other affect outcomes [7]. In contrast, we have focused on measuring specific emotion behaviors and the overall affective quality of team interactions and their dynamics. Rather than examining static affective properties of people, or their surroundings, with the methods introduced here we can unfold the dynamic affective properties of team interactions and how they relate to performance in ways never accessible before.
The quality of technical work in groups is often seen as dependent on the level of expertise, specific skills, or cognitive capabilities. We provided evidence that emotions are more than just ornament. On the contrary, they are critical not only for successful romantic relationships but also for high performance team work.
ACKNOWLEDGMENTS We want to thank particularly Dan Lopez for coding videos, and for his incredibly valuable support without which this paper would not have been possible. We also want to thank Pamela Hinds, Scott Klemmer, and Robert Plummer for providing generous help in making this paper happen. Finally we would like to acknowledge unrestricted gifts from Microsoft Corporation, and the Kempe Foundation, that were used to support this research.
REFERENCES 1. 1. Altman, D.G., Practical statistics for medical
research. 1991: Chapman & Hall.
2. 2. Ambady, N. and R. Rosenthal, Thin slices of expressive behavior as predictors of interpersonal consequences: A meta-analysis. Psychological Bulletin, 1992. 111(2): p. 256-274.
3. 3. Ambady, N. and R. Rosenthal, Half a minute: Predicting teacher evaluations from thin slices of
nonverbal behavior and physical attractiveness. Journal of Personality and Social Psychology, 1993. 64(3): p. 431-441.
4. 4. Arisholm, E., et al., Evaluating Pair Programming with Respect to System Complexity and Programmer Expertise. IEEE Trans. Softw. Eng., 2007. 33(2): p. 65-86.
5. 5. Bakeman, R. and J. Gottman, Observing interaction: An introduction to sequential analysis. 1997, Cambridge, UK: Cambridge University Press.
6. 6. Bakeman, R. and V. Quera, Analyzing interaction: Sequential analysis with SDIS & GSEQ. 1995, Cambridge, UK: Cambridge University Press.
7. 7. Barsade, S.G. and D.E. Gibson, Why Does Affect Matter in Organizations? The Academy of Management Perspectives (formerly The Academy of Management Executive)(AMP), 2007. 21(1): p. 36-59.
8. 8. Beck, K. and C. Andres, Extreme Programming Explained: Embrace Change (2nd Edition). 2004: Addison-Wesley Professional.
9. 9. Carrere, S. and J.M. Gottman, Predicting divorce among newlyweds from the first three minutes of a marital conflict discussion. Family Process, 1999. 38(3): p. 293-301.
10. 10. Chong, J. and T. Hurlbutt, The Social Dynamics of Pair Programming, in 29th International Conference on Software Engineering (ICSE'07). 2007, IEEE Computer Society: Minneapolis, Minnesota. p. 354-363.
11. 11. Chong, J., et al., Pair programming: When and why it works, in 17th Workshop of the Psychology of Programming Interest Group PPIG17. 2005, Citeseer: Brighton, UK.
12. 12. Chong, J., et al. Pair programming: When and why it works. in The 17th Workshop of the Psychology of Programming Interest Group PPIG17. 2005. Brighton, UK: Citeseer.
13. 13. Cockburn, A. and L. Williams, The costs and benefits of pair programming, in First International Conference on Extreme Programming and Flexible Processes in Software Engineering (XP2000). 2000, Citeseer: Cagliari, Sardinia, Italy. p. 223-248.
14. 14. Cohen, J., A coefficient of agreement for nominal scales. Educational and Psychological Measurement, 1960. 20: p. 37-46.
15. 15. Curhan, J.R. and A. Pentland, Thin slices of negotiation: Predicting outcomes from conversational dynamics within the first 5 minutes. Journal of Applied Psychology, 2007. 92(3): p. 802-811.
16. 16. Dick, A. and B. Zarnett. Paired programming and personality traits. in XP2002. 2002. Sardinia, Italy.
Session: Affective Presence CHI 2012, May 5–10, 2012, Austin, Texas, USA
836
17. 17. Diener, E., Subjective well-being: The science of happiness and a proposal for a national index. American Psychologist, 2000. 55(1): p. 34-43.
18. 18. Diener, E. and C. Diener, Most people are happy. Psychological Science, 1996. 7(3): p. 181-185.
19. 19. Diener, E. and E. Suh, Measuring quality of life: Economic, social, and subjective indicators. Social Indicators Research, 1997. 40(1-2): p. 189-216.
20. 20. Fredrickson, B.L. and M.F. Losada, Positive Affect and the Complex Dynamics of Human Flourishing. American Psychologist, 2005. 60(7): p. 678-686.
21. 21. GIESE-DAVIS, J., et al., Macrovariables in affective expression in women with breast cancer participating in support groups, in The New Handbook of Methods In Nonverbal Behavior Research, J.A. Harrigan, R. Rosenthal, and K.R. Scherer, Editors. 2005, Oxford University Press: Oxford, UK. p. 397-446.
22. 22. Gottman, J.M., A theory of marital dissolution and stability. Journal of Family Psychology, 1993. 7(1): p. 57-75.
23. 23. Gottman, J.M., What predicts divorce? The relationship between marital processes and marital outcomes. 1994: Hillsdale, NJ, England: Lawrence Erlbaum Associates, Inc. xvi, 521.
24. 24. Gottman, J.M., et al., Predicting marital happiness and stability from newlywed interactions. Journal of Marriage & the Family, 1998. 60(1): p. 5-22.
25. 25. Gottman, J.M., L.F. Katz, and C. Hooven, Parental meta-emotion philosophy and the emotional life of families: Theoretical models and preliminary data. Journal of Family Psychology, 1996. 10(3): p. 243-268.
26. 26. Gottman, J.M. and R.W. Levenson, Marital processes predictive of later dissolution: Behavior, physiology, and health. Journal of Personality and Social Psychology, 1992. 63(2): p. 221-233.
27. 27. Gottman, J.M. and R.W. Levenson, The timing of divorce: Predicting when a couple will divorce over a 14-year period. Journal of Marriage & the Family, 2000. 62(3): p. 737-745.
28. 28. Hagedorn, J., J. Hailpern, and K.G. Karahalios, VCode and VData: illustrating a new framework for supporting the video annotation workflow, in Proceedings of the working conference on Advanced visual interfaces. 2008, ACM: Napoli, Italy. p. 317-321.
29. 29. Hanks, B., et al., Program quality with pair programming in CS1, in Proceedings of the 9th annual SIGCSE conference on Innovation and technology in computer science education. 2004, ACM: Leeds, United Kingdom. p. 176-180.
30. 30. Hanks, B.F., Empirical studies of distributed pair programming. 2005, University of California at Santa Cruz: Santa Cruz. p. 168.
31. 31. Hannay, J., et al., Effects of personality on pair programming. Software Engineering, IEEE Transactions on, 2010. 36(1): p. 61-80.
32. 32. Hannay, J., et al., The effectiveness of pair programming: A meta-analysis. Information and Software Technology, 2009. 51(7): p. 1110-1122.
33. 33. Jacobson, N.S., et al., Psychological factors in the longitudinal course of battering: When do the couples split up? When does the abuse decrease? Violence and Victims, 1996. 11(4): p. 371-392.
34. 34. Jung, M.F., Engineering Team Performance and Emotion: Affective Interaction Dynamics as Indicators of Design Team Performance, in Mechanical Engineering. 2011, Stanford University: Stanford, CA. p. 109.
35. 35. Kahneman, D., Objective happiness, in Well-being: The foundations of hedonic psychology., D. Kahneman, E. Diener, and N. Schwarz, Editors. 1999, New York, NY, US: Russell Sage Foundation. p. 3-25.
36. 36. Kahneman, D. and A.B. Krueger, Developments in the Measurement of Subjective Well-Being. The Journal of Economic Perspectives, 2006. 20(1): p. 3-24.
37. 37. Krokoff, L.J., J.M. Gottman, and S.D. Hass, Validation of a global rapid couples interaction scoring system. Behavioral Assessment, 1989. 11(1): p. 65-79.
38. 38. Landis, J.R. and G. Koch, The measurement of observer agreement for categorical data. Biometrics, 1977. 33(1): p. 159-174.
39. 39. Leifer, L., et al., Pair Programming: Myths Dispelled by Evidence. Unpublished Paper. Stanford University. 2008: Stanford, CA.
40. 40. Levenson, R.W., L.L. Carstensen, and J.M. Gottman, Influence of age and gender on affect, physiology, and their interrelations: A study of long-term marriages. Journal of Personality and Social Psychology, 1994. 67(1): p. 56-68.
41. 41. Levenson, R.W. and J.M. Gottman, Marital interaction: Physiological linkage and affective exchange. Journal of Personality and Social Psychology, 1983. 45(3): p. 587-597.
42. 42. Levenson, R.W. and J.M. Gottman, Physiological and affective predictors of change in relationship satisfaction. Journal of Personality and Social Psychology, 1985. 49(1): p. 85-94.
43. 43. Losada, M. and E. Heaphy, The role of positivity and connectivity in the performance of business
Session: Affective Presence CHI 2012, May 5–10, 2012, Austin, Texas, USA
837
teams: A nonlinear dynamics model. American Behavioral Scientist, 2004. 47(6): p. 740-765.
44. 44. McDowell, C., et al., The impact of pair programming on student performance, perception and persistence, in 25th International Conference on Software Engineering (ICSE'03). 2003, Published by the IEEE Computer Society: Portland, Oregon. p. pp.602.
45. 45. Nawrocki, J. and A. Wojciechowski, Experimental evaluation of pair programming, in European Software Control and Metrics (Escom 2001). 2001, Citeseer: London, England. p. 99-101.
46. 46. Nicolescu, R. and R. Plummer, A pair programming experiment in a large computer course. Romanian Journal of Information Science and Technology, 2003. 6(1-2): p. 199-216.
47. 47. Nosek, J.T., The case for collaborative programming. Commun. ACM, 1998. 41(3): p. 105-108.
48. 48. Pentland, A., Honest Signals: How They Shape Our World. 2008: MIT Press.
49. 49. Roberts, N.A., J.L. Tsai, and J.A. Coan, Emotion elicitation using dyadic interaction tasks, in Handbook of emotion elicitation and assessment., J.A. Coan and J.J.B. Allen, Editors. 2007, New York, NY, US: Oxford University Press. p. 106-123.
50. 50. Salleh, N., et al., An empirical study of the effects of personality in pair programming using the five-factor model. 2009.
51. 51. Sfetsos, P., et al., An experimental investigation of personality types impact on pair effectiveness in pair programming. Empirical Software Engineering, 2009. 14(2): p. 187-226.
52. 52. Stapel, K., et al., Towards Understanding Communication Structure in Pair Programming. Agile Processes in Software Engineering and Extreme Programming, 2010: p. 117-131.
53. 53. Walle, T. and J. Hannay. Personality and the nature of collaboration in pair programming. 2009: IEEE.
54. 54. Weingart, L.R., M. Olekalns, and P.L. Smith, Quantitative Coding of Negotiation Behavior. International Negotiation, 2004. 9(3): p. 441-456.
55. 55. Williams, L. and R. Kessler, Pair Programming Illuminated. 2002: Addison-Wesley Longman Publishing Co., Inc. 288.
56. 56. Williams, L., et al., Strengthening the case for pair programming. IEEE software, 2000. 17(4): p. 19-25.
57. 57. Woolley, A.W., et al., Evidence for a Collective Intelligence Factor in the Performance of Human Groups. Science, 2010. 330(6004): p. 686-688.
Session: Affective Presence CHI 2012, May 5–10, 2012, Austin, Texas, USA
838