Testing the Temporal Stability of Accessibility Value in Residential Hedonic Prices
Upload
khangminh22Category
view
0download
0
THE ROLE OF HEDONIC MOTIVATION, REFERENCE GROUP, AND
DISCOUNT GIVEN ON HARBOLNAS TOWARD ONLINE IMPULSE
BUYING BEHAVIOR: A CASE STUDY IN MALANG
By:
Natasya Ramadhani Putri
NIM. 145020207121007
MINOR THESIS
Presented in Partial Fulfillment of the Requirements
for the Degree of Bachelor of Economics
INTERNATIONAL UNDERGRADUATE PROGRAM
MAJORING IN MARKETING MANAGEMENT
FACULTY OF ECONOMICS AND BUSINESS
UNIVERSITAS BRAWIJAYA
MALANG
2018
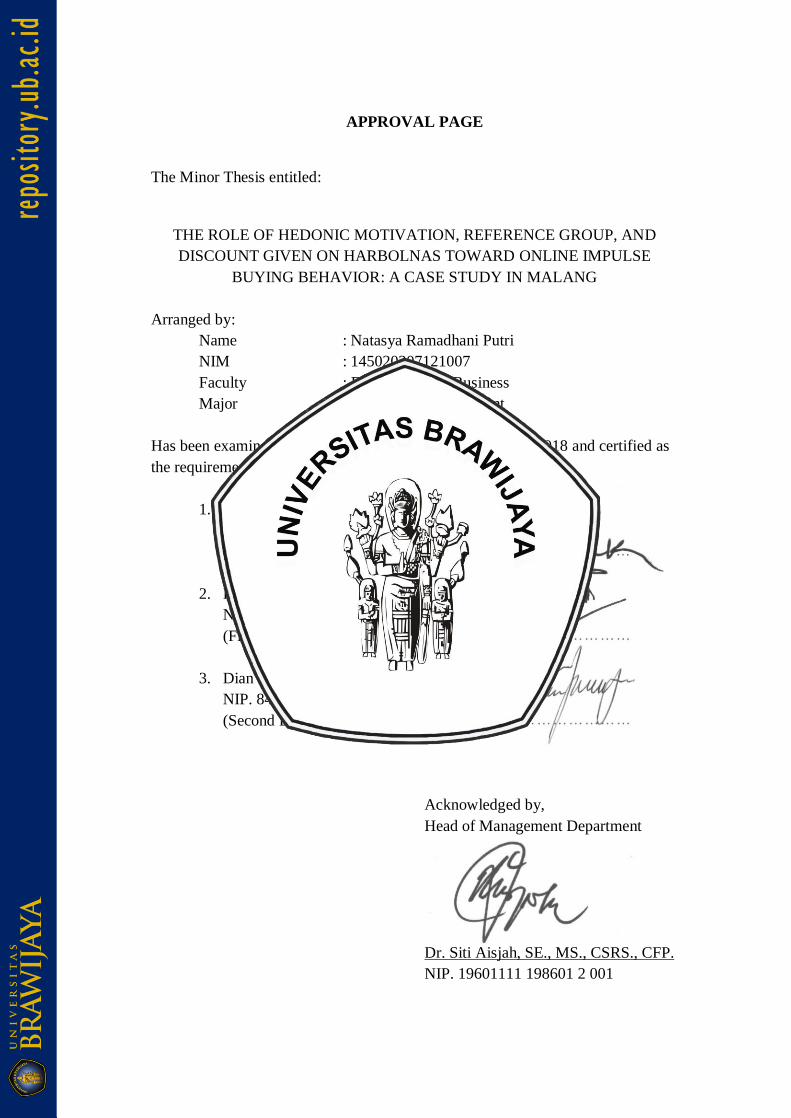
APPROVAL PAGE
The Minor Thesis entitled:
THE ROLE OF HEDONIC MOTIVATION, REFERENCE GROUP, AND
DISCOUNT GIVEN ON HARBOLNAS TOWARD ONLINE IMPULSE
BUYING BEHAVIOR: A CASE STUDY IN MALANG
Arranged by:
Name : Natasya Ramadhani Putri
NIM : 145020207121007
Faculty : Economics and Business
Major : Marketing Management
Has been examined by the board of examiners on June 25th, 2018 and certified as
the requirements for the degree Bachelor of Economics.
1. Dr. Fatchur Rohman, SE., M.Si.
NIP. 19610121 198601 1 002
(Supervisor) ………………………
2. Dimas Hendrawan, SE., MM
NIP. 19820825 200812 1 003
(First Examiner) ………………………
3. Dian Ari Nugroho, SE., MM.
NIP. 840109 02 1 1 0121
(Second Examiner) ………………………
Acknowledged by,
Head of Management Department
Dr. Siti Aisjah, SE., MS., CSRS., CFP.
NIP. 19601111 198601 2 001
STATEMENT OF ORIGINALITY
I, the undersigned:
Name : Natasya Ramadhani Putri
Student ID : 145020207121007
Department : Management
Faculty : Economics and Business
Address : Jl. Bunga Widuri No. 9, Lowokwaru, Malang
hereby certify that I am the sole author of the minor thesis under the title:
“THE ROLE OF HEDONIC MOTIVATION, REFERENCE GROUP, AND
DISCOUNT GIVEN ON HARBOLNAS ON ONLINE IMPULSE BUYING
BEHAVIOR: A Case Study in Malang”
and this minor thesis has not previously been submitted for a degree in any other university or
institution.
I certify that, to the best of my knowledge, my minor thesis does not infringe upon anyone’s
copyright nor violate any proprietary rights and that any ideas, techniques, quotations, or any
other material from the work of other people included in my thesis, published or otherwise, are
fully acknowledged in accordance with the standard referencing practices.
If my statement is proven to be incorrect, I agree to accept existing academic sanctions. This
statement was made under full awareness and consciousness, to be used when necessary.
Malang, May 30th, 2018
Natasya Ramadhani Putri
NIM. 145020207121007
CURRICULUM VITAE
Name : Natasya Ramadhani Putri
Place & Date of Birth : Malang, 18 February 1996
Gender : Female
Marital Status : Single
Nationality : Indonesian
Home Address : Taman Permata Cikunir B2/14, Bekasi Selatan
Address in Malang : Jl. Bunga Widuri No. 9, Malang
Phone : 081286300100
E-mail : [email protected]
Skills
Language Bahasa Indonesia (Native), English (Intermediate)
IT Ms. Word, Ms. Excel, Ms. Power Point, Adobe Photoshop,
Adobe Illustrator
Formal Education
Year Educational History Level
2014 - 2018 Brawijaya University Undergraduate
2011 - 2014 SMAN 71 Jakarta High School
Work Experience
Year Workplace Position
Sep 2017 - Present INGDO Translation Co-Founder
Sep 2017 – Jan 2018 PayAccess Brand Ambassador
Organization & Organizing Committee Experiences
Year Organization / Event Position
2017 Brawijaya Economic Choir Head of Multimedia
2017 ARTi Head of Multimedia
2016 Management Edutainment Head of Multimedia
2015 PEMILWA Assistant Coordinator of
Multimedia
2015 WEPS Assistant Coordinator of
Human Relation
PERAN MOTIVASI HEDONIS, KELOMPOK REFERENSI, DAN DISKON
YANG DIBERIKAN PADA HARBOLNAS TERHADAP PERILAKU
PEMBELIAN IMPULSIF ONLINE: STUDI DI MALANG
Oleh:
Natasya Ramadhani Putri
145020207121007
Dosen Pembimbing:
Dr. Drs. Fatchur Rohman, M.Si
ABSTRAK
Perkembangan teknologi informasi telah menjadikan Internet bagian besar dari kehidupan
semua orang. Belanja pun dilakukan sebagian besar secara online sebagai dampak dari
perubahan gaya hidup ini. Maka dari itu, Hari Belanja Online Nasional atau Harbolnas
diadakan untuk mempromosikan belanja online di Indonesia. Penelitian ini bertujuan untuk
mengetahui peran motivasi hedonis, pengaruh dari kelompok referensi, dan diskon yang
diberikan selama Hari Belanja Online Nasional terhadap perilaku konsumen untuk
berbelanja secara impulsif online. 100 sampel yang pernah berbelanja selama Harbolnas di
Malang dikumpulkan dengan menggunakan kuesioner. Hasil dari penelitian ini
menunjukkan bahwa hanya motivasi hedonis dan diskon yang diberikan pada Harbolnas
yang memiliki efek pada perilaku pembelian impulsif secara online. Itu berarti grup
referensi tidak memengaruhi keputusan orang untuk membeli sesuatu secara impulsif.
Kata Kunci: Motivasi Hedonis, Kelompok Referensi, Perilaku Membeli Impulsif Online,
Harbolnas.
THE ROLE OF HEDONIC MOTIVATION, REFERENCE GROUP, AND
DISCOUNT GIVEN ON HARBOLNAS TOWARD ONLINE IMPULSE BUYING
BEHAVIOR: A CASE STUDY IN MALANG
By:
Natasya Ramadhani Putri
145020207121007
Supervisor:
Dr. Drs. Fatchur Rohman, M.Si
ABSTRACT
The development of information technology has made the Internet a huge part of
everyone’s live. As shopping is also largely done online due to this change in lifestyle, Hari
Belanja Online Nasional or Harbolnas is held to promote online shopping in Indonesia.
This study aims to examine the role of hedonic motivation, influences from reference
group, and discounts that are given during Hari Belanja Online Nasional toward
consumers’ behavior to shop impulsively online. A sample of 100 people who had ever
shopped during Harbolnas was collected in Malang by using random sampling and a
survey-based questionnaire. The results reveal that only hedonic motivation and discount
given on Harbolnas that have an effect on online impulse buying behavior. That means that
reference group does not affect people’s decision to buy things impulsively.
Keywords: Motivation, Reference Group, Online Impulse Buying Behavior, Harbolnas
ACKNOWLEDGEMENT
Author would like to address the sincerest gratefulness to the one and only
God, Allah SWT., for making it possible for author to finish this minor thesis titled:
“The Role of Hedonic Motivation, Reference Group, and Discount Given on
Harbolnas toward Online Impulse Buying Behavior: A Case Study in Malang.”
This minor thesis has been designed to be presented in partial fulfillment of
the requirements for the degree of Bachelor of Economics as well as a learning
process in writing a research paper from the field of practice.
Author realized that the completion of this writing is fully supported by the
involvement of other support systems and beliefs. For this reason, author would like
to give an honor to express the gratitude to:
1. Dr. Drs. Fatchur Rohman, M.Si. as my minor thesis supervisor who has
guide me in doing this minor thesis
2. Mr. Dimas Hendrawa, SE., MM. and Mr. Dian Ari Nugroho SE., MM.
as my examiners who have given suggestions on finishing this minor
thesis.
3. Mr. Nurkholis, SE., M.Bus.(Acc)., Ak., Ph.D. as the Dean of Faculty of
Economics and Business in Brawijaya University.
4. Dr. Sumiati, SE., MSi., CSRS., CFP., as the Head of Management
Department in FEB UB.
5. Dr. Siti Aisjah, SE., MS., as the Head of Management Program in FEB
UB.
6. Dr. Dra. Andarwati, ME., CSRS., CFP., as the Head of International
Program in Management FEB UB.
7. My parents and my sister for the endless support and motivation, as well
as providing me with all the facilities that made me possible to finish
this minor thesis.
8. My lovely classmates, MI’14, who are in the same journey as I am and
helped me throughout every process of the way. May we all make it in
the end.
9. My dear friends who had made my journey of becoming a student in
Malang exciting and full of good things.
10. Every single person I met in New Zealand during my exchange program
that have motivate and inspire me to be a better human being.
11. Everyone who had helped me in surviving while writing this minor
thesis.
Lastly, author hoped that this minor thesis might be helpful for other people
and could be used for further use.
Malang, June 6th, 2018
Natasya Ramadhani Putri
LIST OF TABLE
No. Page Number
Table 1.1. Factors Influencing Consumer Behavior………………………………4
Table 2.1. Previous Research…………………………………………………….13
Table 3.1. Variable Indicators………………………………………..…………..35
Table 3.2. Measurement Scale…………………………………………………...37
Table 4.1. Age of Respondents…………………………………………………..46
Table 4.2. Gender of Respondents…………………………………………….…47
Table 4.3. Latest Education of Respondents…………………………………..…48
Table 4.4. Occupation of Respondents……………………………………….….49
Table 4.5. Earnings of Respondents………………………………………….…..49
Table 4.6. Measurement Scale…………………………………………….…......50
Table 4.7. The Distribution Frequency of Hedonic Motivation…….…….……..51
Table 4.8. The Distribution Frequency of Reference Group…..………….……..52
Table 4.9. The Distribution Frequency of Discount……………………….…….53
Table 4.10. The Distribution Frequency of Online Impulse Buying Behavior.…54
Table 4.11. The Result of Validity Test of Hedonic Motivation………….……..55
Table 4.12. The Result of Validity Test of Reference Group..…………………..56
Table 4.13. The Result of Validity Test of Discount…………………………….56
Table 4.14. The Result of Validity Test of Impulse Buying Behavior…………..56
Table 4.15. The Result of Reliability Test………………………………….……57
Table 4.16. Linearity Test Result…………………………………….…………..58
Table 4.17. Sample of K-S Normality Residual…………………………….…...59
Table 4.18. Multicollinearity Test Result…………………………………….….60
Table 4.19. Summary of Regression Results……………………………….……62
Table 4.20. Coefficient of Determination…………………………………….….62
Table 4.21. T-Test Result…………………………………………………….…..64
LIST OF FIGURE
No. Page Number
Figure 2.1. Research Framework……………………………………………….24
Figure 2.1. Hypothesis Model….……………………………………………….25
Figure 4.1. Harbolnas Logo…………………………………………………….44
Figure 4.2. Scatterplot of Impulse Buying Behavior…………………………...61
Figure 4.3. Hypotheses Testing Result…………………………………………67
1
CHAPTER 1
INTRODUCTION
1.1. Background of the Study
The development of information technology has made the Internet a huge
part of people’s life. People of all ages use the internet, from toddlers who just want
to watch their favorite cartoon on YouTube to seniors who are exchanging emails
with their friends and family. People cannot go a day without connecting to the
Internet. Internet is used daily to get things done or simply to communicate. This
broad use of Internet has changed the way people do things, like how they
communicate, how they read a book, listen to music, watch movies, and even
shopping. With this development in technology, doing transactions online is no
longer a strange new thing that people have trust issue in. E-commerce,
marketplaces, and online shops has also become a huge part of people’s lives.
E-commerce uses a Web site to transact or facilitate the sale of products
and services online (Kotler & Keller, 2016). E-commerce, or electronic commerce,
is any type of business or commercial transaction that happens in an online
platform. Every transaction, every service, and every sale are made online. It
includes mobile commerce, supply chain management, electronic funds transfer,
Internet marketing, online transaction processing, electronic data interchange
(EDI), inventory management and automated data collection systems (Wikipedia,
2018). The most typical form of e-commerce would be a purchasing transaction of
goods online such as books, clothes, electronics, etc. There are three areas of e-
commerce: online retailing, electric markets, and online auctions (Wienclaw,
1
2
2013). These areas are similar to the conventional ones we all know and go to, only
all the transactions and processes happened through the Internet. Other than e-
commerce, there are also two other terms which are marketplace and online shop.
Marketplace refer to an online platform that include several brands in one website
while online shop doesn’t have a website and only sell their goods through social
media.
Online shopping is very easy and convenient. The convenience of online
shopping had driven consumers to turn to the internet to purchase everything from
clothing to housewares and even groceries (Lee, 2016). Online retailers can
predictably provide convenient, informative, and personalized experiences for
vastly different types of consumers and businesses (Kotler & Keller, 2016), which
makes it even more convenient for every one of every background and intention to
do online shopping. When consumers want to buy something, they could just look
up what they are looking for in several different platforms and find what they are
looking for in one simple click. Other than that, consumers can also get the best
deals and cheaper prices without having to go out and go to several different stores.
By doing online shopping, consumers can easily compare the prices between
different stores by just opening multiple tabs and get the best price on the goods
they wanted to buy. This easiness in online shopping makes more and more users
turn from conventional shopping to online shopping to save more time, money, and
energy.
Though online shopping is very easy to use and convenient, there are also
some drawbacks to online shopping. Other than its safety that are seem to no longer
be a big issue now, the two big drawbacks from online shopping would be the
3
waiting time for the goods to arrive and the inability to try on the goods (especially
clothing) before purchasing it, but that never stop people to shop online.
Furthermore, the availability of hard-to-find products or products that are not
available in a certain country or continent are always able to be found online. By
doing online shopping, consumers can easily buy goods from overseas without
having to go through so much trouble to get it shipped to their houses.
Online shopping can be done by people of all ages and is done every day
in all countries, especially Indonesia. People who have an internet connected device
and an access to a bank account can shop online. Indonesian E-Commerce
Association (idEA) Chairman, Aulia E. Marinto (2017) said that Badan Pusat
Statistik (BPS) stated that Indonesia’s E-Commerce industry had grown
approximately seventeen percent in the past 10 years with a total of 26,2 million E-
Commerce businesses. This means that Indonesia has a vast growing e-commerce
business and people use e-commerce daily. According to Ministry of
Communication and Information of Indonesia, in 2016, the biggest percentage of
people using e-commerce based on age are people from age 26-35, then followed
by 56-65, 36-45, and 16-25, which shows that not only millennials are using e-
commerce, but older people are using them quite a lot too.
Consumer behavior is the study of a purchasing process of an individual
from choosing what to buy to the end experience to satisfy their needs and wants
(Solomon, 2017). There are factors influencing consumer behavior that can be seen
on Table 1.1 below.
4
Table 1.1 Factors Influencing Consumer Behavior
Social Cultural Factors Psychological Factors
Reference Group Motivation
Family Perception
Roles Learning
Status Memory
Marketing Mix Personal Factors
Product Age and Stage in the Life Cycle
Price Occupation and Economic Circumstances
Place Personality
Promotion Lifestyle
Source: Rajendran Krishnan, 2012
The factors listed in table 1.1 above are divided in 4 groups which are
social cultural, psychological, marketing mix, and personal factors. Author would
like to take three different factors from three different groups. Based on previous
researches, this paper will only focus on discussing three factors which are hedonic
motivation, reference group, and discounts.
Motivation is a process that lead people to behave the way they do
(Solomon, 2017). When a need that needs to be satisfied is triggered, there is a
motivation. There are two types of motivation which are utilitarian and hedonic.
However, the research by Hausman (2000), Miao (2010), Chang, Eckman, and Yan
(2011) concluded that hedonic motivation affects an impulse buying behavior.
Lake (2009) stated that A dauntless need that drives the long-term goals in
a customer to fulfil their desire is called motivation. There is an uncomfortable
tension provided by motivation by drives, urges, wishes, or desires if the need is
not fulfilled. In order to know the motivation of a person to purchase something,
we must first know their basic general motivation. Motivation can be in many
different forms, it could be hunger, lust, curiosity, security, power, and so on. There
are two types of motivation for people to purchase something which are utilitarian
5
and hedonic. Utilitarian is a more basic need where people purchase something for
its use and benefits while hedonic is more to fulfilling the wants or emotional desire
to purchase something. Utilitarian need is also known as basic need while hedonic
need is usually referred to the wants. When fulfilling a hedonic motivation, people
usually do not really need the goods and/or services they are purchasing, they are
usually doing it for pleasure or leisure. People tend to purchase something
impulsively for the sake of pleasure and feeling good. Therefore, the motivation
used in this research is hedonic motivation. Hedonic motivation is the need to
purchase something based on multisensory, fantasy, and emotional aspects of
consumer’s interaction with products (Solomon, 2017). So, hedonic motivation
relies more on consumer’s emotional aspects that therefore could trigger the feeling
of wanting to buy something to fulfil that emotional needs.
Reference group is the people in the environment that influence a person’s
decision making or behavior (Solomon, 2017). A reference group is usually the
closest people to the individual or a certain group of people that the individual care
about the opinion or preferences. Tinne (2011) argued that if a family members or
friends that fall under reference group accompanying a consumer when purchasing
something then they will motivate the consumer to be impulsive by suggesting any
new product or existing brands.
Reference group influences do not work the same way for all types of
products and consumption activities (Solomon, 2017). Reference group give an
individual a point of reference in consuming something or making a decision. The
easiest example to a reference group would be family or peers. Let’s say someone
need to purchase a new laptop to do his or her work and 60% of his or her closest
6
friends and families are using a certain brand, then he or she will most likely to seek
for that one particular brand also. In contrast, when someone just want to buy a rim
of paper then they do not actually need references from other people because it is
less complex. Reference group can give an influence to an individual to purchase a
certain goods and/or services.
Discount is a deducted price from the original price so people can pay less
to get the product. Discount is given usually on special days or occasion or if the
company needs to clear their storage to make room for something new. Discount
can lead to an impulse buying behavior, as stated by Santini et.al. (2015) and A.K.
and M.G.S. (2015). Tinne (2011) noticed that product with reduced price is bought
as impulse purchase. When a consumer sees a less price in the price tag then it will
draw them more into making an impulse purchase on the item.
Without marketing, prospective consumers would not be able to know
about the goods sold, let alone getting interested in purchasing them. In order to put
their product out there, a company must have a good marketing strategy, including
the marketing communication and how they would like to market their product to
make it stand out. Marketing is about identifying and meeting human and social
needs (Kotler & Keller, 2016). When a company is able to meet the needs of the
consumers then the marketing efforts are considered successful and more and more
consumers will make a purchase.
One of the most popular marketing efforts done by a company to boost its
sales is giving discount. According to the dictionary, discount is a deduction from
the full amount of price, so when there is a discount, consumers will be able to buy
a product with less money spend, which will make consumers feel more attracted
7
to buy more from the company. Discounts come in many different form, like a
percentage discount (10% off, 20% off, and so on) or a “buy one get one free” kind
of deal. Holidays are known to be the perfect occasion for a company to give
discounts to boost their sales, as in holidays people tend to be willing to spend more
money and buy new things to make changes. Occasions like the seasons’ changing,
new year, Christmas, thanksgiving, ‘Eid, etc., are always identic with its sales
promotion, because on those days, people will meet with their friends and relatives
that they have not met in a long time that they will feel the urge to give gifts or a
little something as a souvenir. Therefore, it is the perfect shopping opportunity.
The end of the year and the beginning of the year is usually when people
make the most purchases as Christmas is there and new year are always identified
with new changes. Companies also take that opportunity to make more and more
promotional discounts with different names, different terms, and different deals.
For example, “Black Friday”, originated from the United States, refer to the day
following Thanksgiving Day regarded as the beginning of the country’s Christmas
shopping season since 1952 (Wikipedia, 2018). Originated in the United Kingdom
and is being celebrated in a number of countries that previously formed part of the
British Empire, is “Boxing Day”. Just like “Black Friday”, “Boxing Day” is
celebrated on the day after Christmas Day for a big shopping spree.
Indonesia, being a country filled with consumptive people, have its own
“big shopping day” called “Harbolnas”. Harbolnas, or Hari Belanja Online
Nasional (National Online Shopping Day) is an annual event every December 12th
held jointly by various e-commerce platforms in Indonesia with a number of
partners to support the event. Harbolnas was first held in 2012 through the
8
initiatives from Lazada Indonesia, Zalora, Blanja, PinkEmma, BerryBenka, and
Bukalapak; some of the biggest e-commerce and marketplaces in Indonesia.
Harbolnas, now on its way to its sixth year, have over 200 participating e-
commerce, marketplaces, and online stores all across Indonesia. Starting by the big
e-commerce and marketplace platforms, throughout the years, more and more e-
commerce and online stores come to enliven and participate in Harbolnas. On its
fifth year in 2017, Harbolnas initiated to reach out to SME’s in Indonesia to
participate in the largest e-commerce event to go online and experience the business
impact of Harbolnas along with major e-commerce platforms. In addition,
Harbolnas also prepared a series of roadshows and events for Indonesian SMEs to
ensure that they are ready to join in Harbolnas. Other than the big e-commerce and
the SMEs officialy trained and prepared by Harbolnas to join the event, small
Instagram online shops also like to join in the party and give special discount on
December 12th, to also try to celebrate and promote Harbolnas.
These discounts given by a company is believed to make their consumers
making more purchases than if it is on its normal price. Therefore, it is believed to
be promoting an impulse buying behavior to its customers. Impulse buying
behavior is a behavior in which a person makes a purchase almost immediately
without having much deliberation or thinking. To simplify, it is a sudden buying
decision that is made at that second. Impulse buying behavior can be influenced by
so many things, like good online communication efforts (Samson & Rohan, 2014),
visual merchandising (Gudonavičiene & Alijosiene, 2015), sales promotion, and
many more. Having to see a good deal and a deducted price, consumers will be
more interested in buying in buying the goods and/or services that they might not
9
think about buying earlier, which is a practice of an impulse buying behavior.
Consumers encountered with tantalizing deals will tend to make a sudden
purchasing decision on the spot. For example, a working mom needing to buy a
new pair of shoes for work when is faced with a “buy-one-get-one-free” deal will
end up checking out with two new pairs of shoes, because she will only have to pay
for one while getting two new pairs of shoes, even though she does not need the
other pair.
Impulse buying behavior is a sudden and powerful urge in the consumer
to buy immediately (Faber, 2010). It occurs when a consumer has a sudden
irresistible urge to buy (Solomon, 2002). Related to motivation, an impulse buying
behavior is included in a hedonic motivation. Specified dates with shopping events
like “Black Friday”, “Boxing Day”, and “Harbolnas” will certainly lead to an
impulse buying behavior, as discounts are believed to be the best sales boosters.
Harbolnas, being the biggest national event for online shopping in Indonesia, will
definitely lead to an impulse buying behavior to consumers of e-commerce in
Indonesia. The discounts and great deals offered by almost every single e-
commerce and online stores will make consumers who do not really have the urge
to shop want to shop for something on that day.
Malang, being a city that is highly improving in the past several years, has
attract researcher’s attention to do the research there. Malang was not always a high
developed city, back in the days Malang was more of a small town that is not really
exposed to what’s in the big cities like Jakarta, Jogjakarta, and Surabaya. The
increasing number of University and College students coming from other cities to
Malang has made Malang had to improve and develop vastly, in order to fulfil the
10
needs and the wants of the more metropolitan students. This high improvement in
Malang made Malang more open to changes and therefore the citizen will
participate in events such as Harbolnas.
Assuming that there is a certain drive to hedonic motivation in an
individual, a pressure from its reference group, and the appearance of discounts
given on Harbolnas that can lead to an impulse buying behavior to Indonesian e-
commerce, marketplace, and online stores consumers in Malang, Author would like
to see how big of an effect does this do. Based on previous explanations, the study
aims to investigate the effect of hedonic motivation, reference group, and discounts
given on Harbolnas on online impulse buying behavior to the citizen of Malang.
Therefore, the study will be conducted with the title of “THE ROLE OF
HEDONIC MOTIVATION, REFERENCE GROUP, AND DISCOUNT
GIVEN ON HARBOLNAS TOWARD ONLINE IMPULSE BUYING
BEHAVIOR IN INDONESIA: A CASE STUDY IN MALANG”.
1.2. Research Problems
Based on the previous background of the study, the core problems
investigated in this study are as follows:
1. Does hedonic motivation affect online impulse buying behavior?
2. Does reference group affect the decision making to an online impulse
buying behavior?
3. Does discount given on Harbolnas affect online impulse buying
behavior?
11
1.3. Research Objectives
Based on the formulation of the problems explained before, the objectives
of this study are:
1. To know the effect of hedonic motivation to online impulse buying
behavior.
2. To know the effect of reference group to an online impulse buying
behavior.
3. To know the effect of discount given on Harbolnas to online impulse
buying behavior.
1.4. Significances of the Study
The results from this study is expected to be used theoretically and
practically. They are explained as follow:
1. Theoretical Contribution
a. The findings of this study are expected to contribute the knowledge
of marketing management and impulse buying behavior.
b. The findings of this study can be used as reference for learning and
teaching processes in order to enrich the knowledge of the
application of marketing management.
c. The findings of this study can be used as reference for other
researchers who want to conduct similar studies regarding impulse
buying behavior.
12
2. Practical Contribution
a. The results of this study can be used as reference for online business
practitioners to consider their discounting strategies to promote
impulse buying behavior.
13
CHAPTER 2
THEORETICAL FRAMEWORK
2.1 Previous Research
This research used some previous researches that have similarity with the
topic as references to describe and explain the theoretical basis of the research. The
previous researches can be used as examples to write and conduct the research. The
relevant researches used as references for this research are listed in table 2.1 below:
Table 2.1
Previous Researches
No
Name of
Researcher and
Year of Research
Research Title
Research
Method and
Tools
Variables
Used Results
1 Angela Hausman
(2000)
A multi-method
investigation of
consumer
motivations in
impulse buying
behavior
Grounded
theory
approach
using in-
depth
interviews
Hedonic needs,
desire to satisfy
social needs
and esteem,
perceptions,
perceived
decision effort
Hedonic
needs, desire
to satisfy
esteem, and
perception
moderate
impulse
buying
behavior.
2 Li Miao (2010) Guilty pleasure
or pleasurable
guilt? Affective
experience of
impulse buying
in hedonic-
driven
consumption
Using
questionnaire
distributed to
a total of 278
people in an
art festival in
a college
town in
Pennsylvania
Hedonic-driven
consumption,
impulse buying
The
consumption
of hospitality
product and
services are
driven by
hedonic
motivations.
3 Wahida Shahan
Tinne (2011)
Factors affecting
impulse buying
behavior of
consumers at
Structured
questionnaire
distributed to
50
respondents
Impulse
buying, pricing
strategies, store
characteristics,
situational
Pricing
strategies,
store
characteristics,
situational
14
No
Name of
Researcher and
Year of Research
Research Title
Research
Method and
Tools
Variables
Used Results
superstores in
Bangladesh
collected
from Agora
and Meena
Bazar
factor,
promotional
activities
factors, and
promotional
activities
mostly affect
the
impulsiveness
of a consumer,
while
situational
factors such as
brand
popularity,
comments of
reference
group, and
festival
seasons also
promote
impulse
buying.
4 Hyo-Jung Chang,
Molly Eckman, &
Ruoh-Nan Yan
(2011)
Application of
the stimulus-
organism-
response model
to the retail
environment: the
role of hedonic
motivation in
impulse buying
behavior
Stimulus –
Organism –
Response
model using
questionnaire
distributed to
212
consumers of
a retail store
Hedonic
motivation,
impulse buying
Hedonic
motivation
indirectly
influenced
consumers’
positive
emotions that
therefore lead
to impulse
buying.
5 Yi-Hsin Lin and
Ching-Fu Chen
(2012)
Passengers’
shopping
motivations and
commercial
activities at
airports – the
moderating
effects of time
pressure and
impulse buying
tendency
Questionnaire
distributed to
600
respondents
at Taiwan’s
Taoyuan
International
Airport
Shopping
motivations,
time pressure,
impulse buying
tendency,
commercial
activities
Passenger
shopping
motivations
have positive
impacts on
commercial
activities at
the airport,
and
furthermore
both time
pressure and
impulse
buying
15
No
Name of
Researcher and
Year of Research
Research Title
Research
Method and
Tools
Variables
Used Results
tendency
moderate the
relationship
between
shopping
motivations
and
commercial
activities.
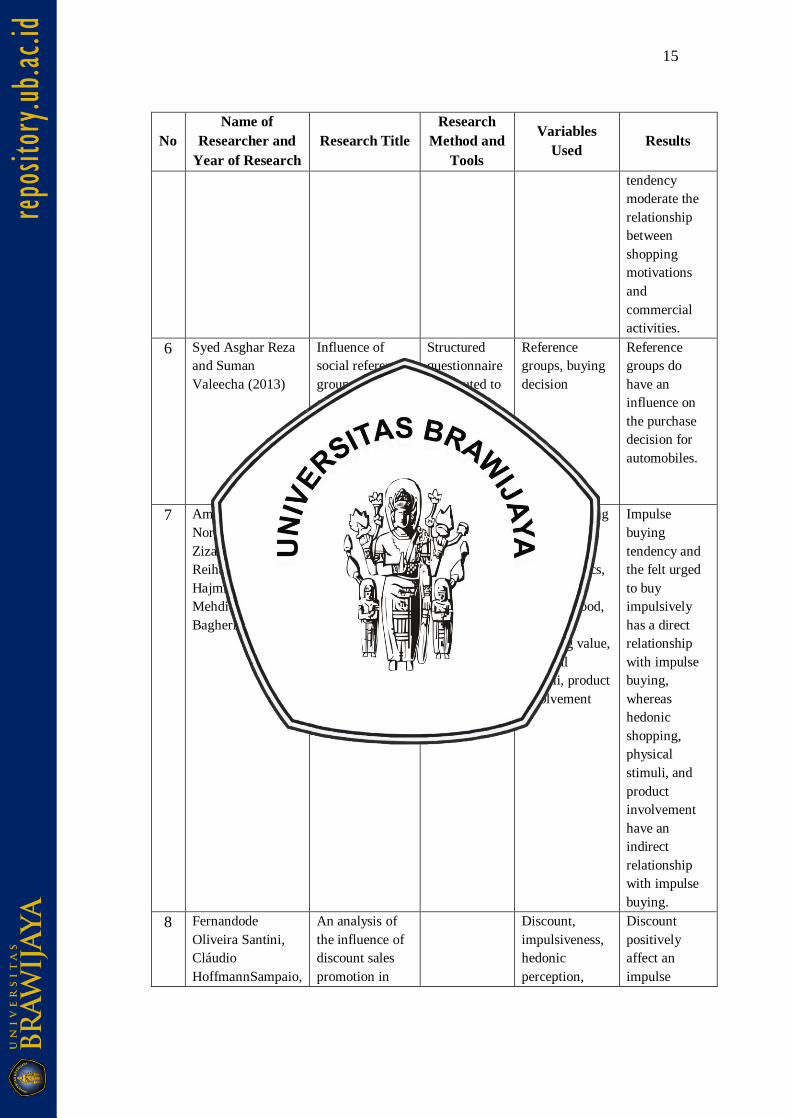
6 Syed Asghar Reza
and Suman
Valeecha (2013)
Influence of
social reference
groups on
automobile
buying decision
– research on
young
executives
Structured
questionnaire
distributed to
125
respondents
working in
local or
multinational
companies
Reference
groups, buying
decision
Reference
groups do
have an
influence on
the purchase
decision for
automobiles.
7 Amir Foroughim
Nor Aishah Buang,
Zizah Che Senik,
Reihaneh Sadat
Hajmirsadeghi, &
Mehdi Mohamad
Bagheri (2014)
The causes of
impulse buying
behavior among
Iranian shoppers
Cross-
sectional
survey design
using
Questionnaire
distributed to
207
participants
Impulse buying
tendency,
product
characteristics,
felt urge,
positive mood,
hedonic
shopping value,
physical
stimuli, product
involvement
Impulse
buying
tendency and
the felt urged
to buy
impulsively
has a direct
relationship
with impulse
buying,
whereas
hedonic
shopping,
physical
stimuli, and
product
involvement
have an
indirect
relationship
with impulse
buying.
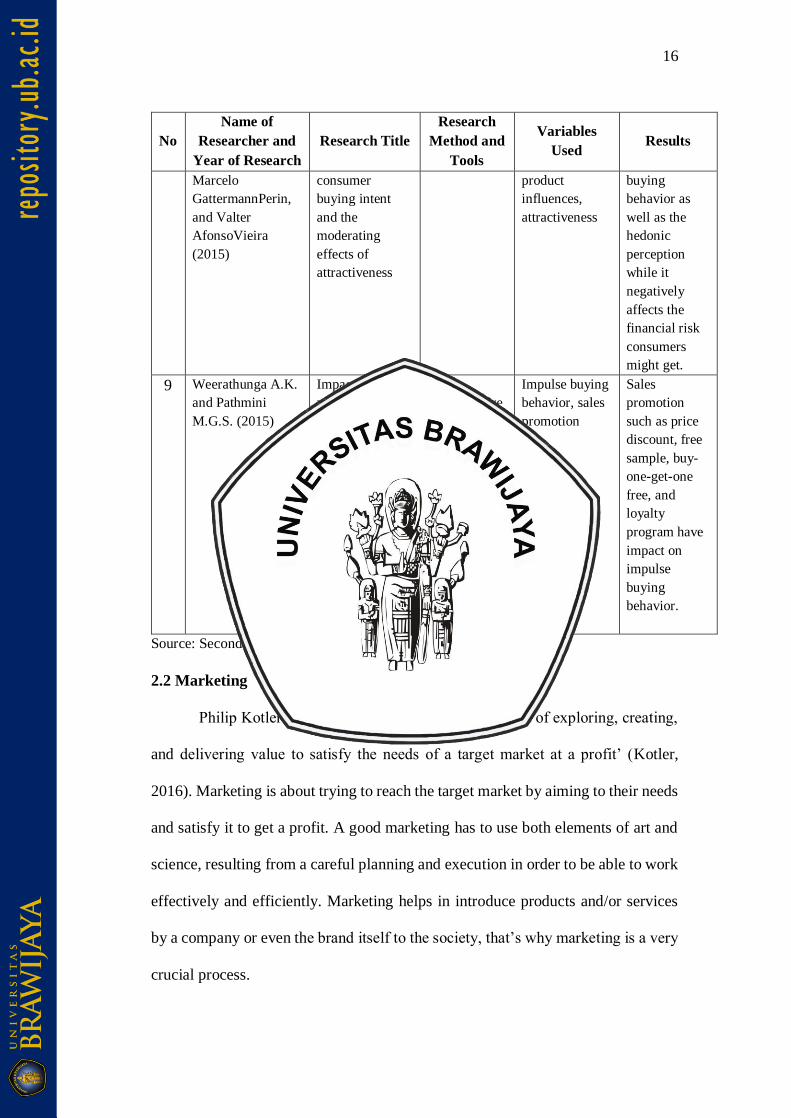
8 Fernandode
Oliveira Santini,
Cláudio
HoffmannSampaio,
An analysis of
the influence of
discount sales
promotion in
Discount,
impulsiveness,
hedonic
perception,
Discount
positively
affect an
impulse
16
No
Name of
Researcher and
Year of Research
Research Title
Research
Method and
Tools
Variables
Used Results
Marcelo
GattermannPerin,
and Valter
AfonsoVieira
(2015)
consumer
buying intent
and the
moderating
effects of
attractiveness
product
influences,
attractiveness
buying
behavior as
well as the
hedonic
perception
while it
negatively
affects the
financial risk
consumers
might get.
9 Weerathunga A.K.
and Pathmini
M.G.S. (2015)
Impact of sales
promotion on
consumer’s
impulse buying
behavior (IBB);
study in
supermarkets in
Anuradhapura
city
Using
questionnaire
distributed to
106
consumers of
four
supermarkets
in
Anuradhapura
city
Impulse buying
behavior, sales
promotion
Sales
promotion
such as price
discount, free
sample, buy-
one-get-one
free, and
loyalty
program have
impact on
impulse
buying
behavior.
Source: Secondary data, 2018.
2.2 Marketing
Philip Kotler says, ‘Marketing is the science and art of exploring, creating,
and delivering value to satisfy the needs of a target market at a profit’ (Kotler,
2016). Marketing is about trying to reach the target market by aiming to their needs
and satisfy it to get a profit. A good marketing has to use both elements of art and
science, resulting from a careful planning and execution in order to be able to work
effectively and efficiently. Marketing helps in introduce products and/or services
by a company or even the brand itself to the society, that’s why marketing is a very
crucial process.
17
A good marketing will be targeted appropriately to the target market and is
interesting enough to make people want to look at it and want to know more. If a
marketing effort is not aimed to reach the right market then it will be useless. For
example, an advertisement about the newest smartphone put in a billboard near a
river close to countryside is not appropriately put, as people who will buy the
newest smartphone are likely the people who live in the big city and work in
buildings. Furthermore, if a marketing effort is being targeted properly and actually
hit the target market but fail to make people stop and stare then it could be useless.
An advertisement of a new range of products of winter coats put in a fashion
magazine if not being arranged well and make as interesting as possible then it
would not make people want to see further.
Marketing is a crucial process that determines whether or not a product
and/or goods will be successful in the market. If the marketing is not done right,
then a product, even though it is way cheaper than the competitors and have higher
quality will not be acknowledged or be able to penetrate the market. Marketing is
not only about putting goods and/or services out there but also related to things as
stated by Kotler (2016) that there are 10 main types of entities which are goods,
services, events, experiences, persons, places, properties, organizations,
information, and ideas. Though the entities all seems different from one another,
the main idea of marketing them is the same. For example, a person who want to
market him/her self, should think of him/her self as a brand.
2.3 Consumer Behavior
In order to deliver a good marketing message to the target market, the
company must be aware of what drives the target market to purchase the particular
18
product and that is where consumer behavior takes place. Consumer behavior
studies the processes of individuals or groups in selecting, purchasing, using, or
disposing products, services, ideas, or experiences to satisfy their needs and wants
(Solomon, 2017). To simplify, it is about knowing the behavior of a consumer to
know how they make decisions on their products.
Consumer behavior provides information about the individuals that
purchase a certain product and/or service (Lake, 2009). When a company
understands a consumer better, then they will be able to reach to the consumer
directly. That way, more and more consumers will be drawn upon the products
marketed and therefore will lead to more sales and more profit for the company.
Consumer behavior is about studying the consumption patterns of
consumers as well as the internal and external influences affecting them (Lake,
2009). There are various factors influencing consumer behavior and those factors
are grouped into four, as already mentioned in chapter 1; social culture,
psychological, marketing mix, and personal. Psychological and personal influences
are internal influences while social culture and marketing mix influences are
external influences
2.3.1 Internal Factors
Internal factors or internal influences affecting consumer behavior comes
from inside the consumer. The factors come from within based on one’s own
experiences. It includes psychological and personal influences which are the
personal considerations of an individual including their motivation, perception,
learning, memory, age and life cycle, occupation and economic condition,
personality, and lifestyle.
19
2.3.1.1 Motivation
Motivation is a process that leads people to behave the way they do
(Solomon, 2017). Motivation is like a reason for someone to do something. For
example, people eat when they are hungry, cry when they are sad, and laugh when
they are happy. The feeling of hunger, sadness, and happiness are the motivation or
the triggers for the individual to eat, cry, and laugh.
There are two types of motivation in consumer behavior as a fundamental
to understand it which are utilitarian and hedonic. Utilitarian motivation or
utilitarian needs (rational needs) are the need to purchase something efficiently to
achieve something or to fulfil a certain need that needs to be fulfilled (Childers, et
al., 2001). Utilitarian needs are also known as basic needs. For example, a consumer
buying a portion of chicken rice to fulfil his hunger. In contrast, hedonic motivation
or hedonic needs are the need to purchase something based on multisensory,
fantasy, and emotional aspects of consumer’s interaction with products (Solomon,
2017). Hedonic needs are more on the effort to fulfill the emotional feeling of
consumer to purchase or own something, so it is not necessarily a need but a want
or desire. For example, a consumer who is hungry will not only buy a portion of
chicken rice but also will buy some extra side dish or dessert because it looks good
on the display. So, utilitarian and hedonic motivations are very different from one
another.
Hedonic motivation is believed to be more beneficial for a company, as
consumers will purchase more when it is based on hedonic needs. When companies
want to aim to attract people to fulfil their hedonic desires on them, they must focus
on the sensory and emotional experiences of a consumers. Hedonic motivation is
20
believed to be promoting an impulse buying behavior to a consumer when it is
alongside with other factors. Hedonic motivation can be triggered by various
factors. A good display, good atmosphere, or a simple driver of pleasure can
promote a hedonic motivation.
2.3.2 External Factors
External factors or external influences affecting consumer behavior comes
from outside the consumer. The factors come from outside based on what kind of
environment one’s in. It includes marketing mix and social cultural factors which
are product, price, place, promotion, reference group, family, roles, and status.
2.3.2.1 Reference Group
One of the social cultural factors influencing consumer behavior is reference
group (Lake, 2009). Reference group refers to two or more individuals who share
a set of norms, values, or beliefs. It is other individual or a group of people whom
influences will significantly affect consumer’s evaluations, aspirations, or behavior
(Solomon, 2017). Reference group can influence an individual to purchase or not
to purchase something. However, the influences given by a reference group may
not work the same way to all types of products.
Products that a consumer will feel like needing an influence from a
reference group are usually products that are more complex or are considered new
to the consumer. When a consumer can try a product before purchasing it or the
product do not really have a long-term commitment to it then usually a reference
group’s influence is not really take into account. But if the product is more complex
or too general that there are too many variety and different brands offering the same
then there is where a reference group will be needed.
21
2.3.2.2 Discount
Promotion or sales promotion is one of the marketing mix that can influence
consumer behavior. Sales promotion or also known as discount is a deducted price
of a product from its original price. When there is a promotion or discount then
consumers can purchase a product with cheaper prices from usual. Companies use
discount and promotion to make people purchase more items with low prices.
Discount is believed to be driving consumer to buy more product than usual, as the
good deal will make them think that “tomorrow I won’t be able to buy this much
product with only this amount of money”.
There are various types of discounts and different terms applies in different
stores or different companies. Some companies may give discount to its loyal
customers by having loyalty cards with points that then can be traded with discounts
or vouchers and other companies may give discount to a customer who purchase a
certain number of products or buy in bulk. However, the most common type of
discounting used by companies is seasonal discount.
Discount is useful for driving traffic and sales in the short-term (Watkins,
n.d.) and that is why discounts are usually seasonal. Seasonal discounts are done
during the off-peak times or the times when the items are not needed the most. For
example, season’s changing; when the weather starts to get cold which marks that
summer is coming to an end, retails who sell clothes will start giving discount on
the summer clothes to make room for the autumn clothes. Seasonal discount given
at holidays are also aimed to boost a company’s sales, as in holidays people tend to
want to spend a lot to buy presents or new goods so giving discounts will make
them want to purchase even more.
22
2.4 Online Impulse Buying Behavior
Impulse buying is the act of purchasing something that an individual has not
planned before and it occurs when there is a feeling of sudden urge to get the item
(Rent.com, 2015). Impulse buying or impulsive behavior is also referred to buying
without thinking, in which a consumer will purchase a certain good just because it
looks good on the display or the price is very cheap that it becomes appealing.
Online impulse buying behavior is buying things without thinking through an
online platform.
Online impulse buying is promoted by a sudden, strong, and irresistible urge
to buy. Online impulse buying is usually associated with a negative behavior which
will make people more financially unstable and is bad for one’s economy because
there will be more unplanned expenses but it is beneficial for a company. The more
impulse purchases done by consumers, the more profit will the company get.
There are four classifications to impulse buying. These types of
impulse buying, might apply a bit differently online. The classification of impulse
buying began with the study by Stern (1962) that then modified by Han et al. (1991)
to four types which are listed as follows.
1. Planned impulse buying
2. Reminded impulse buying
3. Suggestion or fashion-oriented impulse buying
4. Pure impulse buying
Planned impulse buying is partially planned but it is undecided, the specific
product or category are not known yet (Muruganantham and Bhakat, 2013). The
product and/or category then will be decided inside the shop by seeing different
23
sales promotion or what is happening there. For example, a consumer has a plan to
go to the grocery store to buy some food without knowing the exact type or brand
he/she would like to purchase. When seeing a particular brand has a discounted
price, that consumer could end up impulsively purchase the product.
Reminded impulse buying occurs when the buyer is reminded to purchase
something when noticing the product in the store (Muruganantham and Bhakat,
2013). For example, when purchasing a gallon of ice cream, usually near the
refrigerator there will be some options of ice cream cone. Although intentionally
the consumer planned to only buy the gallon of ice cream, he or she will be
reminded to buy the ice cream cone when noticing it on the rack.
Suggestion or fashion-oriented impulse buying is introduced by Stern
(1962) as the purchase of new product based on suggestion without any prior
experience. This usually happened in fashion stores, that’s why it is called fashion-
oriented. This type of impulse buying is influenced by an individual’s own
suggestion or emotion when noticing something new and decided to purchase it on
the spot.
Pure impulse buying is a new thing in which a shopper chooses to not do
the usual shopping. It is the pure and basic form of impulse buying where a
consumer just breaks the trend of a usual shopping by shopping impulsively or
spontaneously.
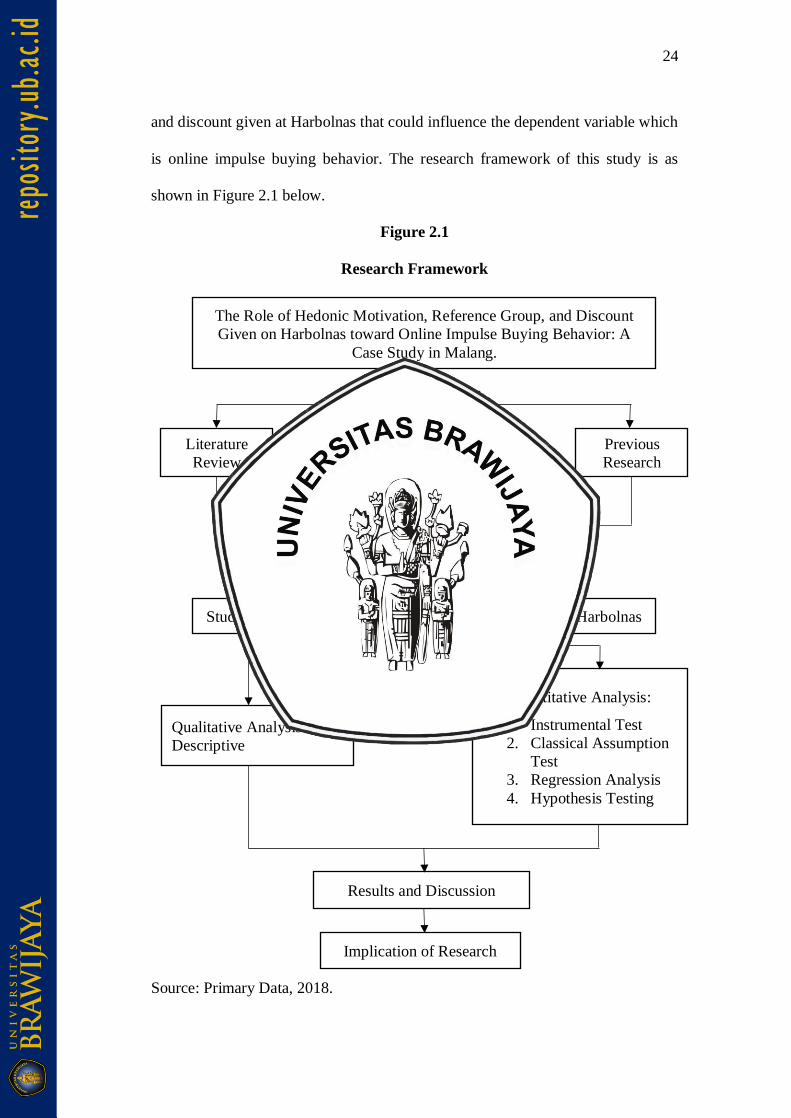
2.5 Research Framework
This study aims to describe the role of hedonic motivation, reference group,
and discount given at Harbolnas toward online impulse buying behavior in Malang.
So, this study has 3 independent variables which are motivation, reference group,
24
and discount given at Harbolnas that could influence the dependent variable which
is online impulse buying behavior. The research framework of this study is as
shown in Figure 2.1 below.
Figure 2.1
Research Framework
Source: Primary Data, 2018.
The Role of Hedonic Motivation, Reference Group, and Discount
Given on Harbolnas toward Online Impulse Buying Behavior: A
Case Study in Malang.
Background
Literature
Review Previous
Research Research Variables:
Hedonic Motivation (X1)
Reference Group (X2)
Discount (X3)
Online Impulse Buying
Behavior (Y)
Study on People in Malang who had ever shopped during Harbolnas
Quantitative Analysis:
1. Instrumental Test
2. Classical Assumption
Test
3. Regression Analysis
4. Hypothesis Testing
Results and Discussion
Implication of Research
Qualitative Analysis:
Descriptive
25
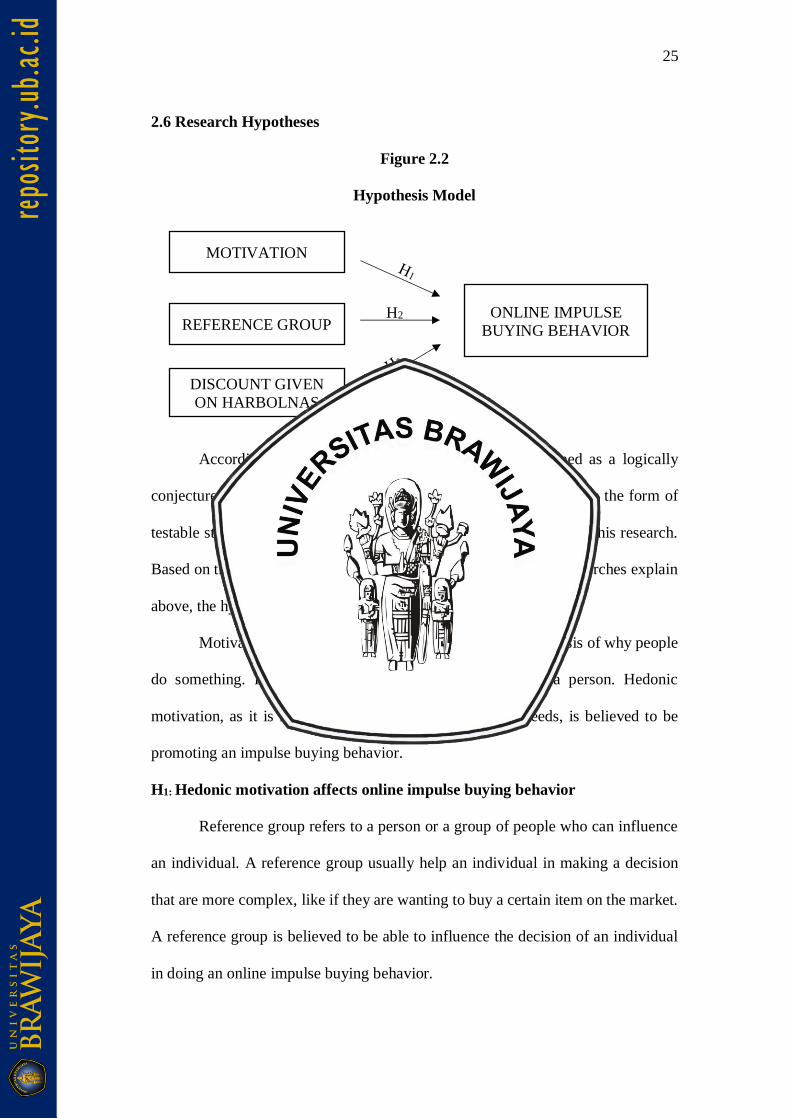
2.6 Research Hypotheses
Figure 2.2
Hypothesis Model
According to Sekaran (2010) a hypothesis can be defined as a logically
conjectured relationship between two or more variables expressed on the form of
testable statement. Figure 2.2 above shows the hypothesis model of this research.
Based on the research framework formulated from the previous researches explain
above, the hypotheses to this research are as follows:
Motivation comes in many different forms and it is the basis of why people
do something. It is the reason to every activity done by a person. Hedonic
motivation, as it is more about pleasure and wants than needs, is believed to be
promoting an impulse buying behavior.
H1: Hedonic motivation affects online impulse buying behavior
Reference group refers to a person or a group of people who can influence
an individual. A reference group usually help an individual in making a decision
that are more complex, like if they are wanting to buy a certain item on the market.
A reference group is believed to be able to influence the decision of an individual
in doing an online impulse buying behavior.
MOTIVATION
DISCOUNT GIVEN
ON HARBOLNAS
REFERENCE GROUP ONLINE IMPULSE
BUYING BEHAVIOR H2
26
H2: Reference group affects the decision making to online impulse buying
behavior.
Discounts are believed to make people want to purchase more. Discounts
given on Harbolnas, as it is promoted all around the nation and is done in all e-
commerce sited in Indonesia, is perceived to be promoting an online impulse buying
behavior.
H3: Discounts given on Harbolnas affects online impulse buying behavior.
27
CHAPTER 3
RESEARCH METHODOLOGY
3.1 Type of Research
This research uses a quantitative method with a descriptive study design.
Quantitative approach involves the generation of data in quantitative for which can
be subjected to rigorous quantitative analysis in a formal and rigid fashion (Kothari,
2009, p.5). Quantitative methods are used to examine the relationship between
variables with the primary goal being to analyze and represent that relationship
mathematically through statistical analysis. A descriptive design seeks to describe
the current status of a variable or phenomenon.
3.2 Research Location
As the subject of the research is considerable common to people who uses
e-commerce or online shopping on Harbolnas, researcher limits the location of this
research to areas around Malang. The questionnaire will be distributed directly
around Malang city and also distributed via online survey to have better exposure.
3.3 Research Population and Sample
3.3.1 Research Population
A population is defined as the group of all items of interest to a statistic
practitioner (Keller, 2014). A population can be a group of people, a group of
institutions or organizations, or a group of events. The population of this research
is people in Malang aged 16-35. That is because in 2016 according to Ministry of
Communication and Information of Indonesia, the biggest percentage of people
using e-commerce in Indonesia based on age are people aged 26-35, then followed
28
by 56-65, 36-45, and 16-25, and the variables used in this study are believed to be
more influential to people of productive age. However, the exact number of the
population used in this research in unknown due to the unavailability of data. Age
changes every year therefore there are no updated data that could be found.
3.3.2 Research Sample
A sample is a set of data drawn from the studied population (Keller, 2014).
Thus, a sample is a subgroup or a smaller group that are chosen more specifically
from the people of the population. The sampling technique used in this research is
a non-probability sampling, which according to Hair et al. (2010) means that the
probability of selection of each sampling unit is unknown. The selection of the
sample is based on researcher’s judgment and it may or may not represent the whole
target population.
Using a judgement or purposive sampling, researcher distributes
questionnaires to samples which are selected because the researcher believes they
meet the requirements for the study (Hair et al., 2010). The considerations of some
criteria for the sample are as follows:
1. Respondents are citizen of Malang or currently living in Malang.
2. Respondents are at least 16 years old and no more than 35 years old.
3. Respondents who ever uses e-commerce or online shop on Harbolnas.
3.3.3 Sample Size
Determining the sample size for non-probability sampling is usually a
subjective, intuitive judgement made by the researchers based on either past study,
industry standards, or the amount of resources available (Hair et al., 2010). Due to
the large population and the sample size that cannot be calculated, Roscoe (1975)
29
suggested to approach the problem of sample size with the following rules of thumb
believed to be appropriate for most behavioral research (Hill, 1998). The rules,
might not all be applicable, are as follow:
1. The use of statistical analyses with samples less than 10 is not
recommended.
2. In simple experimental research with tight controls, successful research may
be conducted with samples as small as 10 to 20.
3. In most ex post facto and experimental research, samples of 30 are
recommended.
4. When samples are to be broken into sub-samples and generalizations drawn
from these, then the rules of thumb for sample size should apply to those
sub samples.
5. In multivariate research, sample size should be at least ten times larger than
the number of variables being considered.
6. There is a seldom justification in behavioral research for sample sizes less
than 30 or larger than 500. Within these limits (30 to 500), the use of a
sample about 10% size of parent population is recommended.
7. Generally, choice of sample size is as much a function of budgetary
considerations as it is statistical considerations. When they can be afforded,
large samples are usually preferred over smaller ones.
According to point number 5 and six on the rule of thumb above, the researcher
can decide the sample size. As this research is a multivariate research (multiple
regression analysis) then the sample size must be at least ten times larger than the
number of variable and stays between the number of 30 and 500. This research has
30
three independent variables which are Motivation (X1), Reference Group (X2),
Discount Given at Harbolnas (X3) and one dependent variable which is Impulse
Buying Behavior (Y). Therefore, the number of total samples would be 100
respondents that represent the population which obtained from the following
calculation:
1. 4𝑥10 = 40.
40, being the minimum number of respondents for this research is
gained from the four variables used in the research multiplied by 10,
based on rule number 5.
2. Based on rule number 6, the sample size should be more than 30 and
less and 500. Although the number of minimum sample on this research
is already larger than 30, researcher feels that it is too small of a sample
to be analyzed. Therefore, researcher took a sample of 100 that believed
to be able to represent the population.
3. The larger number of respondents is believed to be more accurate in
representing the research population.
3.4 Data Collection Method
This study uses a survey-based methodology for collecting data. By using a
survey, researcher can collect a large amount of data at one time. To gather the
primary data from the respondents, a questionnaire is distributed. The questionnaire
is filled with the list of questions in order to obtain the information needed for the
research that can be provided by the respondents. The series of questions written
on the questionnaire will provide a better understanding about the role of hedonic
31
motivation, reference group, and discount given at Harbolnas toward online
impulse buying behavior.
As this research is conducted in Malang, which is in a Bahasa Indonesia
speaking country, researcher provides the questionnaire in Bahasa Indonesia. This
study distributes 100 questionnaires to the respondents around Malang city area for
appropriate data and result.
3.5 Research Variable and Variable Operational Definition
3.5.1 Research Variable
This research has three independent variables that influences the one
dependent variable. These variables are related to the effort of defining a concept
to make it measureable. The independent variables are hedonic motivation,
reference group, and discount given at Harbolnas while the dependent variable is
online impulse buying behavior, or better listed and explained below:
A. Independent variable
Independent variables are variables whose values are directly manipulated
by the researcher (Hair et al., 2010). Independent can influence a dependent
variable in both positive and negative way. The independent variables of
this research are:
1. Hedonic Motivation (X1)
2. Reference Group (X2)
3. Discount Given on Harbolnas (X3)
B. Dependent variable
Dependent variable is a measure of effects or outcomes that occur as a result
of changes in levels of independent or causing variables (Hair et al., 2010).
32
In other words, dependent variable is the variable influenced by independent
variables. The dependent variable of this research is Online Impulse Buying
Behavior (Y).
3.5.2 Variable Operational Definition
The four variables used in this research will be explained as follows:
1. Hedonic Motivation (X1)
Motivation is a process that leads people to behave the way they do
(Solomon, 2017). Motivation is the reason that makes someone do
something, or in the case of shopping, the reasons are needs and wants.
Motivation in this research refers to the hedonic motivation that people has
when they purchase something impulsively. The indicators for hedonic
motivation are:
a. Finding unique things makes me excited (Foroughi et al., 2014).
b. Compared to others, spending time on shopping is so enjoyable
(Foroughi et al., 2014).
c. During shopping, I feel excited (Foroughi et al., 2014).
d. It seems that I explore a new world when I go shopping (Foroughi
et al., 2014).
2. Reference Group (X2)
Reference group is one of the social cultural factors that influences
consumer behavior (Lake, 2009). Reference groups are groups that
consumers compare themselves to or associate with. Reference group refer
to other individuals or groups of individuals who share a set of norms,
values, or beliefs. Reference group used in this research refers to other
33
people who might make consumers buy something impulsively. The
reference group could be a family member, peers, or influencers that
endorsed to promote goods and/or services.
a. I seek for information from other people when purchasing
something (Carmen, 2008).
b. I care about what other people think when purchasing a certain
product and/or service (Carmen, 2008).
c. I need validation from other people when purchasing something
(Carmen, 2008).
d. Expectations of fellow work associates will influence my decision
in purchasing something (Reza and Valeecha, 2013).
3. Discount Given on Harbolnas (X3)
Discount is a deducted price of a product from its original price. Watkins
(n.d.) says that companies use discount to make people purchase more items
with low prices. Discount given on Harbolnas are all price deduction on
December 12th known in Indonesia as national online shopping day. These
discounts are thoroughly applicable in all e-commerce sites and online
stores in Indonesia.
a. Promotional activities such as discount make you want to buy
products (Tinne, 2011).
b. I wait to buy things until they go for sale (Rudolph, 2016).
c. I look for promo codes before buying anything online (Rudolph,
2016).
34
d. I buy things when it is offered at a lower price than its original
(Rudolph, 2016).
4. Online Impulse Buying Behavior (Y)
Impulse buying is a sudden urge that could not be resist (Solomon, 2017).
So, online impulse buying behavior is a sudden urge to buy something that
an individual gets when he or she is shopping online. Online impulse buying
in this research refers to the impulse buying behavior consumer done online
during Harbolnas. The indicators for online impulse buying behavior are:
a. I am a person who makes unplanned purchase (Foroughi et al.,
2014).
b. When I go shopping, I buy things that I had not intended to purchase
(Foroughi et al., 2014).
c. I often buy things spontaneously (Foroughi et al., 2014).
d. I feel the desire to buy an item as quickly as possible to terminate
the pain of not buying (Foroughi et al., 2014)
e. When I see something that really interests me, I buy it without
considering the consequences (Foroughi et al., 2014).
35
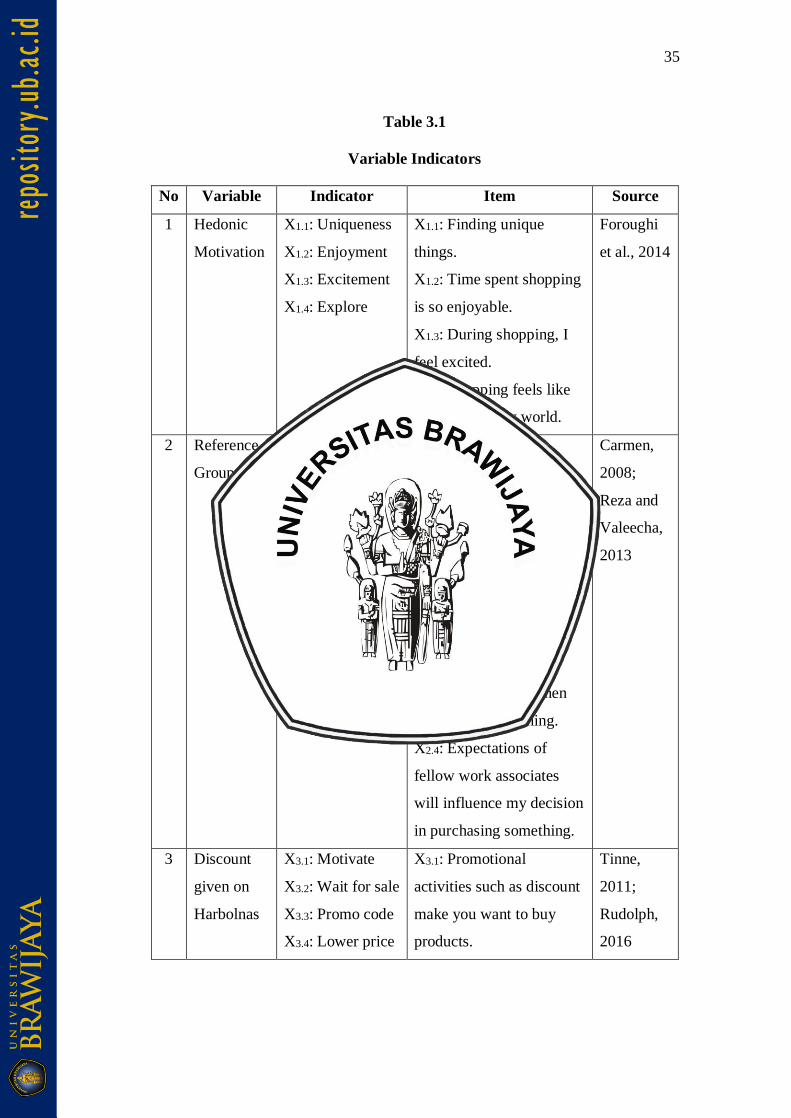
Table 3.1
Variable Indicators
No Variable Indicator Item Source
1 Hedonic
Motivation
X1.1: Uniqueness
X1.2: Enjoyment
X1.3: Excitement
X1.4: Explore
X1.1: Finding unique
things.
X1.2: Time spent shopping
is so enjoyable.
X1.3: During shopping, I
feel excited.
X1.4: Shopping feels like
exploring a new world.
Foroughi
et al., 2014
2 Reference
Group
X2.1: Information
X2.2: Judgement
X2.3: Validation
X2.4: Expectation
X2.1: I seek for
information from other
people when purchasing
something.
X2.2: I care about what
other people think when
purchasing a certain
product and/or service.
X2.3: I need validation
from other people when
purchasing something.
X2.4: Expectations of
fellow work associates
will influence my decision
in purchasing something.
Carmen,
2008;
Reza and
Valeecha,
2013
3 Discount
given on
Harbolnas
X3.1: Motivate
X3.2: Wait for sale
X3.3: Promo code
X3.4: Lower price
X3.1: Promotional
activities such as discount
make you want to buy
products.
Tinne,
2011;
Rudolph,
2016
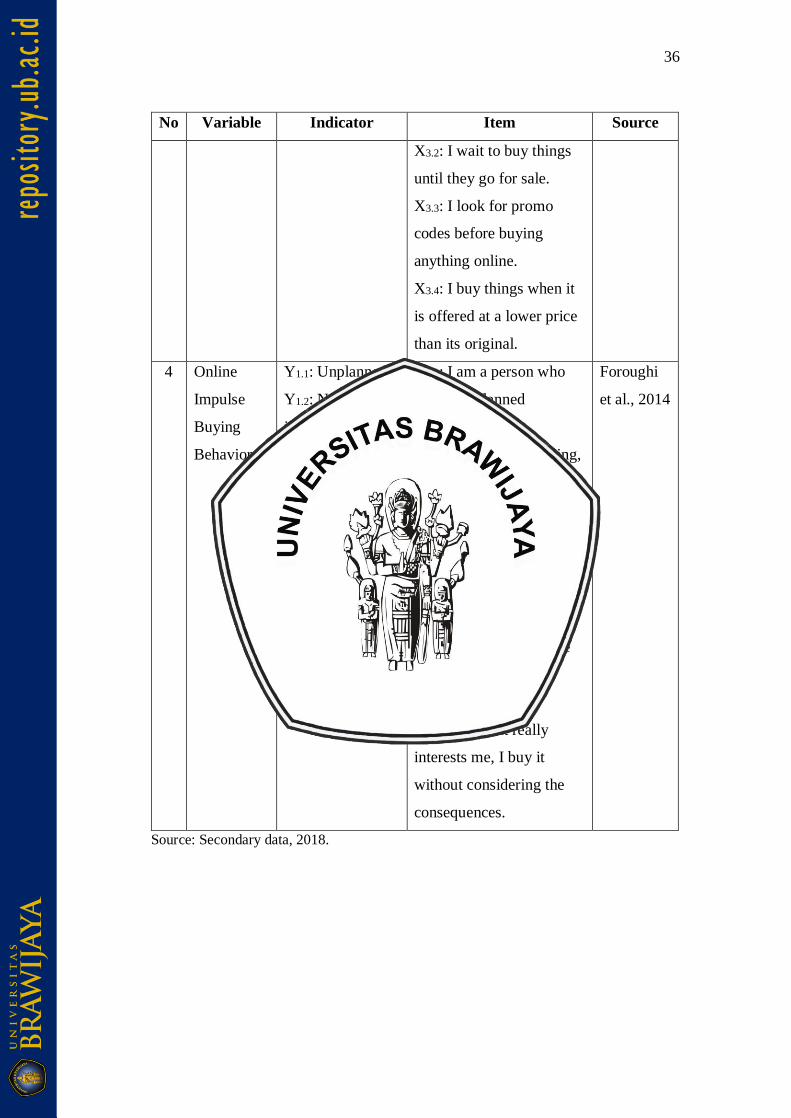
36
No Variable Indicator Item Source
X3.2: I wait to buy things
until they go for sale.
X3.3: I look for promo
codes before buying
anything online.
X3.4: I buy things when it
is offered at a lower price
than its original.
4 Online
Impulse
Buying
Behavior
Y1.1: Unplanned
Y1.2: Not
intended
Y1.3: Spontaneous
Y1.4: Desire
Y1.5: No
consideration
Y1.1: I am a person who
makes unplanned
purchase.
Y1.2: When I go shopping,
I buy things that I had not
intended to purchase.
Y1.3: I often buy things
spontaneously.
Y1.4: I feel the desire to
buy an item as quickly as
possible to terminate the
pain of not buying.
Y1.5: When I see
something that really
interests me, I buy it
without considering the
consequences.
Foroughi
et al., 2014
Source: Secondary data, 2018.
37
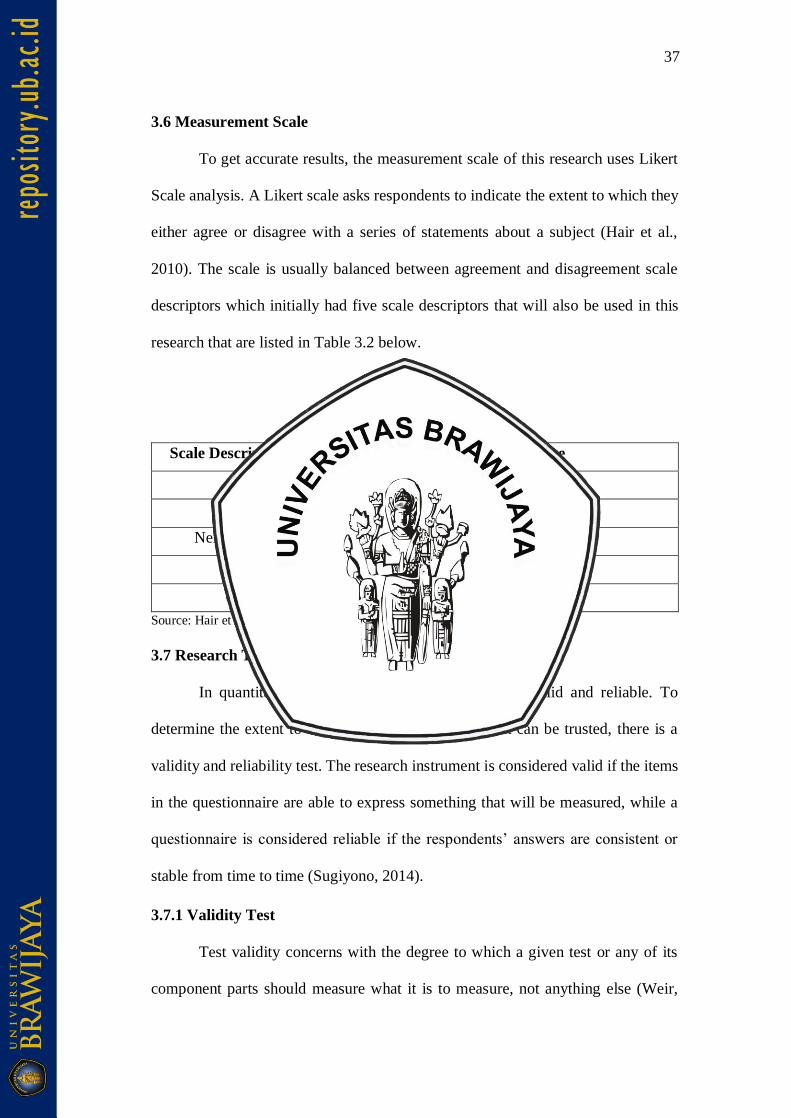
3.6 Measurement Scale
To get accurate results, the measurement scale of this research uses Likert
Scale analysis. A Likert scale asks respondents to indicate the extent to which they
either agree or disagree with a series of statements about a subject (Hair et al.,
2010). The scale is usually balanced between agreement and disagreement scale
descriptors which initially had five scale descriptors that will also be used in this
research that are listed in Table 3.2 below.
Table 3.2
Measurement Scale
Scale Descriptors/Answer Choice Score
Strongly Agree 5
Agree 4
Neither Agree nor Disagree 3
Disagree 2
Strongly Disagree 1
Source: Hair et al. (2010:163)
3.7 Research Test Instrument
In quantitative research, research data has to be valid and reliable. To
determine the extent to the instruments of this research can be trusted, there is a
validity and reliability test. The research instrument is considered valid if the items
in the questionnaire are able to express something that will be measured, while a
questionnaire is considered reliable if the respondents’ answers are consistent or
stable from time to time (Sugiyono, 2014).
3.7.1 Validity Test
Test validity concerns with the degree to which a given test or any of its
component parts should measure what it is to measure, not anything else (Weir,
38
1993). According to Hair et al. (2009), validity is a degree to which a measurement
accurately represents what is supposed to measure. Ensuring validity starts with a
thorough understanding of what is to be measured then making the measurement as
correct and as accurate as possible. However, accuracy does not ensure validity.
To find validity, the Pearson product-moment correlation formula is often
used. A questionnaire is said to be valid if each questions of the questionnaire is
able to represent what is measured. Cooper and Schindler (2011) mentions the
criteria used in decision making in the validity test, which are:
a. If the value of r > r table, then the item is valid.
b. If the value of r < r table, then the item is invalid.
The correlation coefficient is valid when the coefficient of item and total
item has a significance level below or equal to 0.05 (5%).
3.7.2 Reliability Test
Reliability is the degree to which the observed variable measures the “true”
value and is “error free”; this, it is the opposite of measurement error (Hair et al.,
2009). If the same measure is asked repeatedly, more reliable measures will show
greater consistency than less reliable measures. The variables being used must
constantly be assess and if valid alternative measures are available then the variable
with higher reliability should be chosen. Reliability is calculated by using Cronbach
Alpha coefficients formula as follows:
𝑟1 = (𝑘
𝑘 − 1) (1 −
∑ℴ𝑏2
ℴ𝑡2 )
Where r is the reliability of the instrument, k is the number of questions, ℴ1 is the
number of variant item, and ℴ2 is the total variant
39
Instruments can be considered reliable if the validity of the calculation is
bigger than the critical value at 0.05 significance level ( = 5%). Using Cronbach
Alpha test, a variable is considered reliable if the value of Cronbach Alpha is bigger
than 0.60.
3.7.3 Classical Assumption Test
Before testing the multiple linear regression, there are several key
assumptions that have to be made for prediction.
3.7.3.1 Linearity Test
Linearity test aims to determine whether the relationship between
independent variables and the dependent variable is linear. A good regression
model will have a linear relationship between the independent variables and the
dependent variable. It can be known from the deviation from linearity significant
value. If it is lower than the alpha of 0.05 then it can be concluded that there is a
linear relationship between the variables.
3.7.3.2 Normality Test
Normality test is a test to see whether or not the distribution of the data used
is normal. Multiple regression assumes that the residuals are normally distributed.
Regression model can be said to meet the assumptions of normality if the residuals
obtained from the model are in normal distribution. Using the Kolmogorov-
Smirnov normality test, the data can be said to have a normal distribution if the
significant level is bigger than 0.05.
40
3.7.3.3 Non-multicollinearity Test
Multicollinearity test is done to determine whether there is similarity
between the independent variables in a model. Multiple regression assumes that he
independent variables are not highly correlated with each other. It is to avoid habits
in the decision-making process regarding the partial effect of independent variables
on the dependent variable. To test the multicollinearity of a model, Variance
Inflation Factor (VIF) is used. If the VIF value lies between 1-10 then there is no
multicollinearity.
3.7.3.4 Non-heteroscedasticity Test
Heteroscedasticity is useful to examine whether there is a difference in the
residual variance of the observation period to another period of observation. This
assumption states that the variance of error terms is similar across the values of the
independent variables. A good regression model will have no heteroscedasticity.
Using the scatterplot graph, a model can be said to have to heteroscedasticity if
there is no clear pattern.
3.8 Data Analysis Method
Data analysis involves the identification and measurement of variation in a
set of variables, either among themselves or between a dependent variable and one
or more independent variables (Hair et al., 2009).
3.8.1 Multiple Regression Analysis
Hair et al. (2009) states that multiple regression is the appropriate method
of analysis when the research problem involves a single metric dependent variable
presumed to be related to two or more metric independent variables. Multiple
41
regression analysis will predict the changes in the dependent variable in response
to the change in the independent variables.
The formulation of multiple regression analysis model based on Hair et al.
(2009) that can be used for this study is as follows:
𝑌 = 𝑏1𝑋1 + 𝑏2𝑋2 + 𝑏3𝑋3 + 𝑒
Where 𝑌 is the value relationship of independent variables on the dependent
variable, 𝑏 is the regression coefficient, 𝑋 is the independent variable, and 𝑒 is error.
Each of the variables will be put in the model of equation above to predict
the influence of the independent variables on the dependent variable. The X’s would
be the each of the independent variables so X1 is hedonic motivation, X2 is reference
group, and X3 is discount given on Harbolnas while the Y is online impulse buying
behavior.
3.8.2 Coefficient of Determination (R2 Test)
According to Hair et al. (2009), coefficient of determination, or 𝑟2,
describes the amount of variation in the dependent variable associated with the
variation in the independent variable. The regression 𝑟2 also tells you what
percentage of the total variation in the dependent variable can be explained by using
independent variables. The 𝑟2 measure varies between .00 and 1.00 and is
calculated by dividing the amount of variation explained by regression equation.
Basic weakness on using 𝑟2 is that it is biased against the number of
independent variables included in the model. It is found that there is always an
increase of 𝑟2 whether the independent variable has a significant effect on the
dependent variable or not. Therefore, many researchers recommend using adjusted
𝑟2 to evaluate the best regression model. The larger value of adjusted 𝑟2, the greater
42
is the variation in the dependent variable that can be explained by the variation in
the variables, predictors, or the independent variable. Conversely, the smaller the
value of adjusted 𝑟2 the smaller is the variation in the dependent variable that can
be explained by the independent variable.
3.9 Hypothesis Testing
3.9.1 Partial Significance Test (t Test)
Hair et al. (2009) says that t-Test is a hypothesis test that utilizes the t
distribution to measure a significance of the partial correlation of the variable
reflected in the regression coefficient. This test is used to determine the influence
of independent variables on the dependent variable partially. According to
Sugiyono (2014), t-Test can be determined by using the following formula:
𝑇 = 𝑟√𝑛 − 2
√1 − 𝑟2
Where r is the partial correlation found and n is the number of samples.
The test is done by comparing tcount and ttable with a significance level of t >
0.05 (5%). To simplify, the comparation of tvalue and ttable is done to see whether or
not a hypothesis is accepted or rejected. If tvalue < ttable then Ho (independent variable
has no influence over dependent variable) is rejected and Ha (independent variable
has influence over dependent variable) is accepted, and vice versa.
43
CHAPTER 4
RESULTS AND DISCUSSION
4.1 Description of Research Object
The object of this research is a holiday shopping event in Indonesia known
as Harbolnas or Hari Belanja Online Nasional (National Online Shopping Day).
4.1.1 History of Harbolnas
Harbolnas or Hari Belanja Online Nasional is first started in 2012. The event
was started by some of the biggest e-commerce platforms in Indonesia that are
incorporated in Asosiasi Ecommerce Indonesia (IdeA) or Indonesian e-commerce
association. Those e-commerce sites are Lazada, Zalora, Blanja, PinkEmma,
Berrybenka, and Bukalapak.
Inspired by some online shopping celebrations in other countries like US,
Canada, UK, Germany, and Japan called Cyber Monday, Harbolnas was initiated.
Cyber Monday is done every Monday after Thanksgiving Day to attract consumers
to shop online. Having the same concept and implementation, Harbolnas is done
every year on December 12 (debuted on December 12, 2012 or 12/12/12). During
the event, online retailers and various e-commerce platforms will give big discounts
and promotion to attract more consumers to shop online and gain more profit. Being
held a couple weeks before Christmas, Harbolnas is believed to mark as the start of
online Christmas Shopping in Indonesia.
The Harbolnas campaign is aimed at educating the public about the easiness
of online shopping that are safe and convenient that it can be done at any time. Not
44
only that, this 24-hour event also has a mission to promote the e-commerce industry
of Indonesia. That is because Indonesia has a fairly high growth of Internet users
which currently has reached 63 million users (Wikipedia, 2017).
The participants of the event increase every year. Starting from 2017,
Harbolnas initiated to reach out to small and medium online enterprises to join in
the celebration. Using the tagline of #BelanjaOnlineBersama (online shop together)
Harbolnas hoped to attract more SMEs to go online and feel the impact of
Harbolnas alongside with other big e-commerce in Indonesia. That is so that in
Harbolnas, consumers can be more motivated to shop online in many different
platforms because of the discounts and promotions that are all across the online
shops.
4.1.2 Harbolnas Logo and Profile
Figure 4.1
Harbolnas Logo
Source: Harbolnas, 2017
The logo of Harbolnas is shown in figure 4.1 above. It’s a rather simple logo
that is easy to notice. The appearance of a shopping cart in the logo emphasizes that
Harbolnas is a shopping event. The color red used in the logo represents celebration
45
and desire, which could translate to Harbolnas being a celebration of online
shopping and will generate people’s desire to shop on that day.
Harbolnas or National Online Shopping Day is a national event held in
Indonesia to promote online shopping. Every single e-commerce platform and even
small online shops we found on Instagram, Facebook, etc. also participate in the
event by giving special discount on the day or even for the whole week.
4.2 The Characteristic of the Respondents
This study aims to understand several variables which are hedonic
motivation, reference group, and discount given on Harbolnas toward online
impulse buying behavior. A set of questions in a form of questionnaire was used to
collect data from the respondents that are determined by purposive sampling. The
data were collected from April 11 to April 23 2018. A total of 120 questionnaires
were distributed to e-commerce users or online shoppers who fulfilled the criteria
around Malang area. The questionnaires that can be used are the ones being
answered completely by the respondents. From 120 questionnaires, 100 fulfilled
the criteria. Thus, there are 100 questionnaires that can be processed. The detailed
characteristics of the respondents are described as follow.
4.2.1 The Characteristic of Respondents Based on Age
The age of respondents is classified in Table 4.1 below. The age of
respondents is divided into 4 groups which are 16 – 20, 21 – 25, 26 – 30, and 31 –
35 based on the e-commerce users in Indonesia. Based on the data processed, it is
found that the majority of respondents are those on the age of 21 – 25 years old with
a total number of 59 respondents (59%), more than half of the number of total
respondents. Then it is followed with the age group of 16 – 20 with a total number
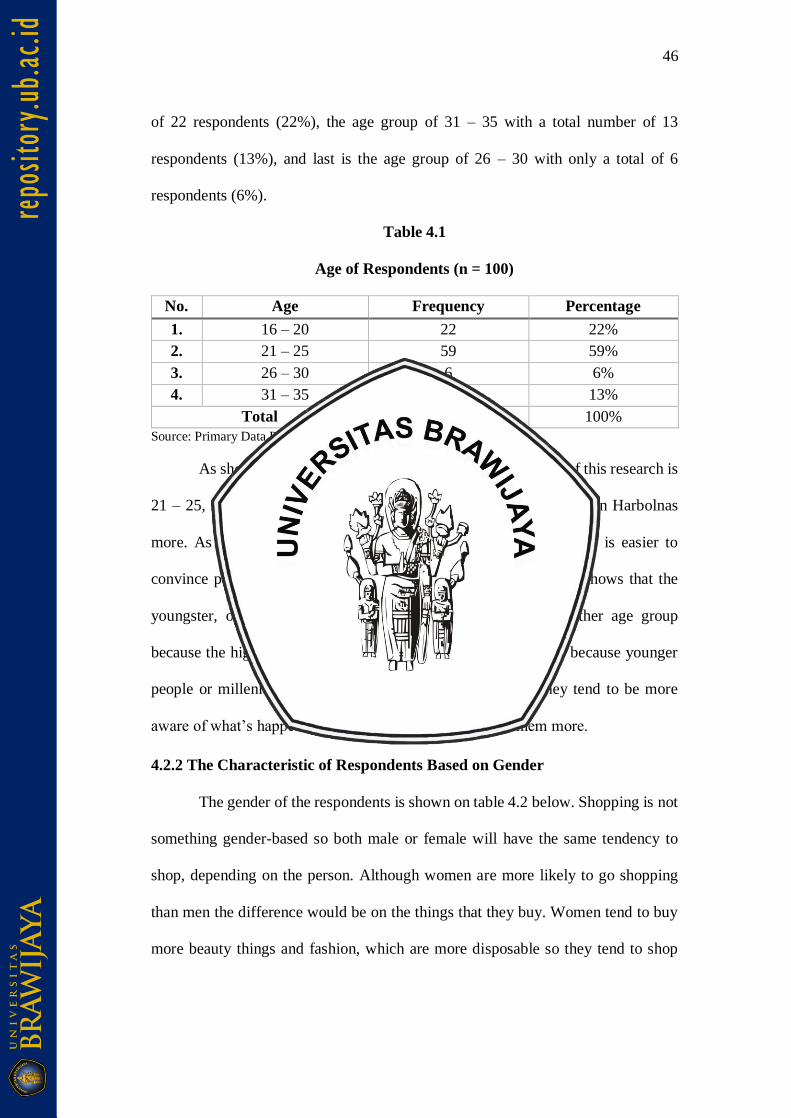
46
of 22 respondents (22%), the age group of 31 – 35 with a total number of 13
respondents (13%), and last is the age group of 26 – 30 with only a total of 6
respondents (6%).
Table 4.1
Age of Respondents (n = 100)
No. Age Frequency Percentage
1. 16 – 20 22 22%
2. 21 – 25 59 59%
3. 26 – 30 6 6%
4. 31 – 35 13 13%
Total 100 100%
Source: Primary Data Processed, 2018
As shown in table 4.1 above, the age of most respondents of this research is
21 – 25, showing that young adults in Malang are those who shop on Harbolnas
more. As researcher is also in that age group, it is possible that it is easier to
convince people of the same age group to participate. This result shows that the
youngster, or millennials, do online shopping more than the other age group
because the highest percentage are for the age below 25. That is because younger
people or millennials are more exposed to technology that they tend to be more
aware of what’s happening that online shop will intrigue them more.
4.2.2 The Characteristic of Respondents Based on Gender
The gender of the respondents is shown on table 4.2 below. Shopping is not
something gender-based so both male or female will have the same tendency to
shop, depending on the person. Although women are more likely to go shopping
than men the difference would be on the things that they buy. Women tend to buy
more beauty things and fashion, which are more disposable so they tend to shop
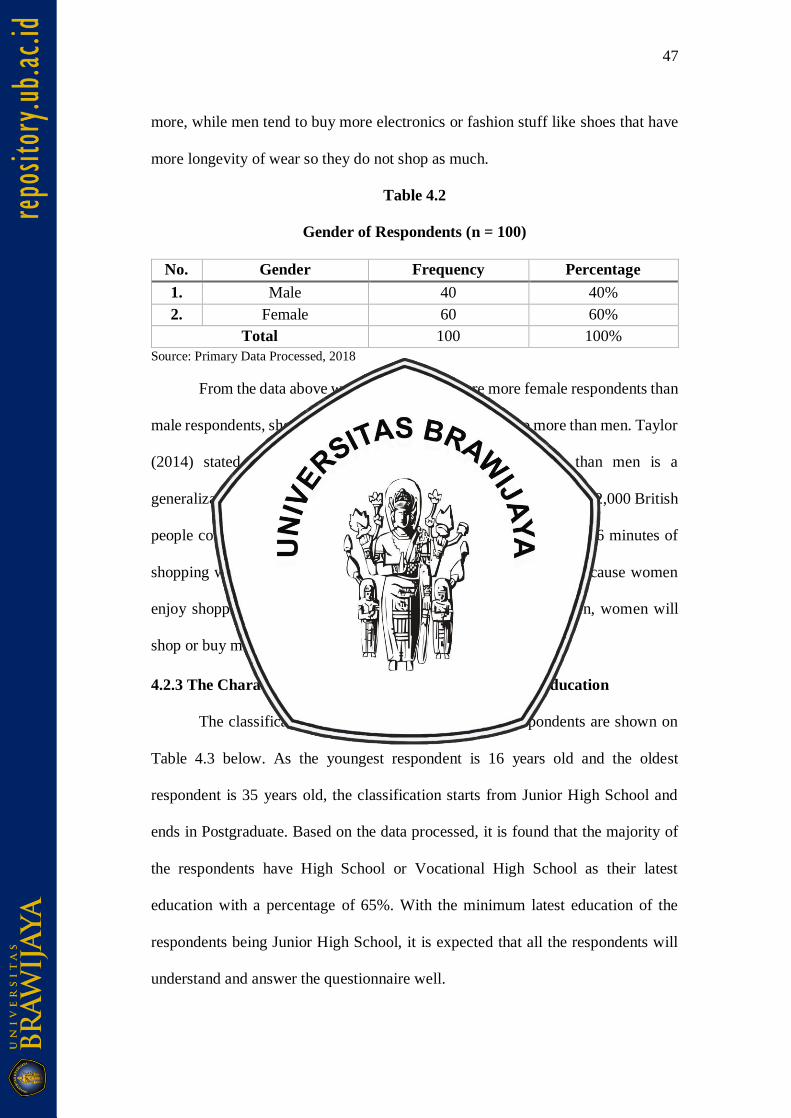
47
more, while men tend to buy more electronics or fashion stuff like shoes that have
more longevity of wear so they do not shop as much.
Table 4.2
Gender of Respondents (n = 100)
No. Gender Frequency Percentage
1. Male 40 40%
2. Female 60 60%
Total 100 100%
Source: Primary Data Processed, 2018
From the data above we can see that there are more female respondents than
male respondents, showing that in this case, women do shop more than men. Taylor
(2014) stated that although saying that women shop more than men is a
generalization, there is evidence that it is not just a myth. A survey of 2,000 British
people conducted in 2013 found that men become bored after only 26 minutes of
shopping while it took women a full two hours. That shows that because women
enjoy shopping more and can spend more time shopping than men, women will
shop or buy more things than men.
4.2.3 The Characteristic of Respondents Based on Latest Education
The classification of the latest education of the respondents are shown on
Table 4.3 below. As the youngest respondent is 16 years old and the oldest
respondent is 35 years old, the classification starts from Junior High School and
ends in Postgraduate. Based on the data processed, it is found that the majority of
the respondents have High School or Vocational High School as their latest
education with a percentage of 65%. With the minimum latest education of the
respondents being Junior High School, it is expected that all the respondents will
understand and answer the questionnaire well.
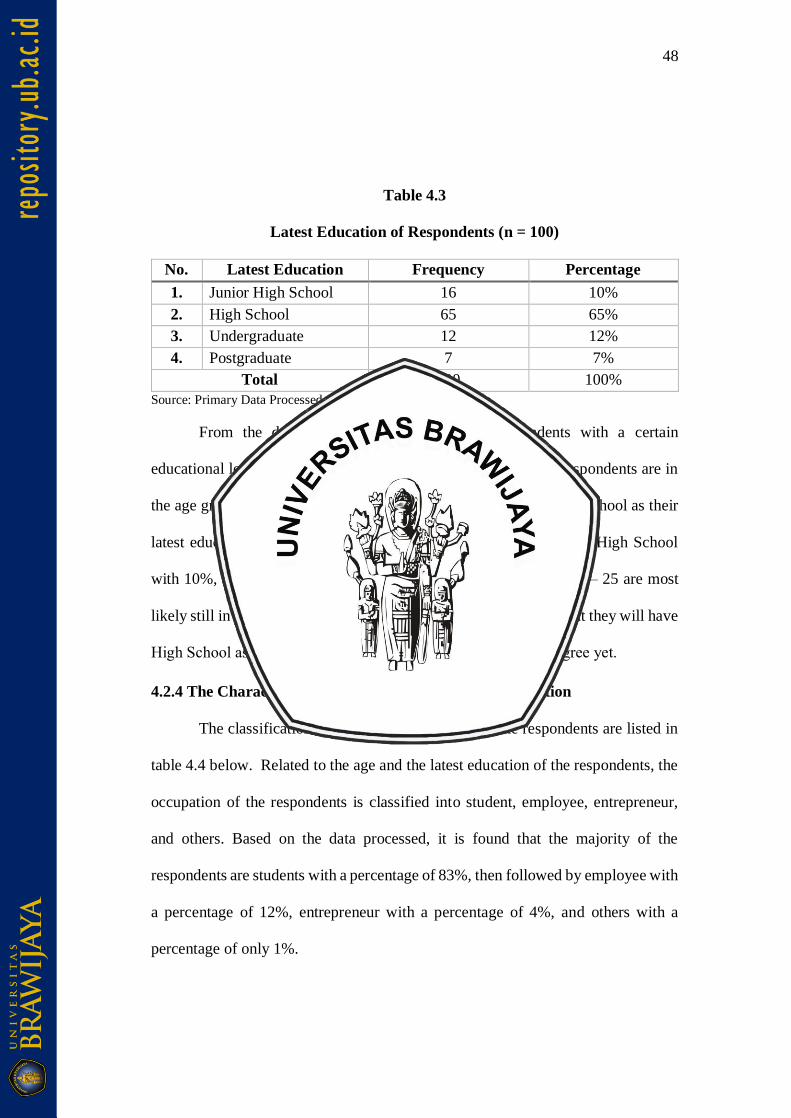
48
Table 4.3
Latest Education of Respondents (n = 100)
No. Latest Education Frequency Percentage
1. Junior High School 16 10%
2. High School 65 65%
3. Undergraduate 12 12%
4. Postgraduate 7 7%
Total 100 100%
Source: Primary Data Processed, 2018
From the data processed, the number of respondents with a certain
educational level is in sync with the age classification. As most respondents are in
the age group of 21 – 25 and 16 – 20, most respondents have High School as their
latest education, then followed by Undergraduate with 12%, Junior High School
with 10%, and last is Postgraduate with only 7%. People of age 21 – 25 are most
likely still in the journey of pursuing their undergraduate degree, that they will have
High School as their latest education as they haven’t got their degree yet.
4.2.4 The Characteristic of Respondents Based on Occupation
The classification of the current occupation of the respondents are listed in
table 4.4 below. Related to the age and the latest education of the respondents, the
occupation of the respondents is classified into student, employee, entrepreneur,
and others. Based on the data processed, it is found that the majority of the
respondents are students with a percentage of 83%, then followed by employee with
a percentage of 12%, entrepreneur with a percentage of 4%, and others with a
percentage of only 1%.
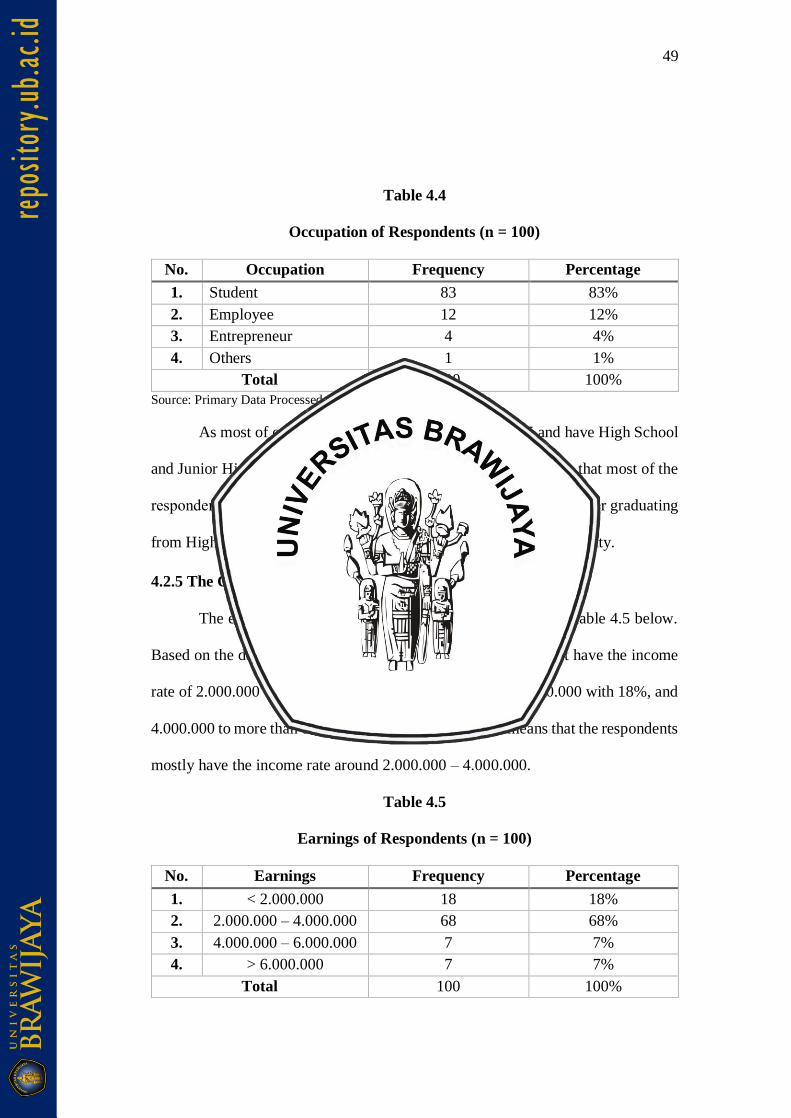
49
Table 4.4
Occupation of Respondents (n = 100)
No. Occupation Frequency Percentage
1. Student 83 83%
2. Employee 12 12%
3. Entrepreneur 4 4%
4. Others 1 1%
Total 100 100%
Source: Primary Data Processed, 2018
As most of our respondents are on the age of 16 – 25 and have High School
and Junior High School as their latest education, it is only suitable that most of the
respondents’ current occupation is Student. That is because usually after graduating
from High School, people will still be a student at College or University.
4.2.5 The Characteristic of Respondents Based on Earnings
The earnings or income of the respondents can be seen in table 4.5 below.
Based on the data processed, there are 68 respondents (68%) that have the income
rate of 2.000.000 – 4.000.000, then followed by less than 2.000.000 with 18%, and
4.000.000 to more than 6.000.000 with 7% each. Which means that the respondents
mostly have the income rate around 2.000.000 – 4.000.000.
Table 4.5
Earnings of Respondents (n = 100)
No. Earnings Frequency Percentage
1. < 2.000.000 18 18%
2. 2.000.000 – 4.000.000 68 68%
3. 4.000.000 – 6.000.000 7 7%
4. > 6.000.000 7 7%
Total 100 100%
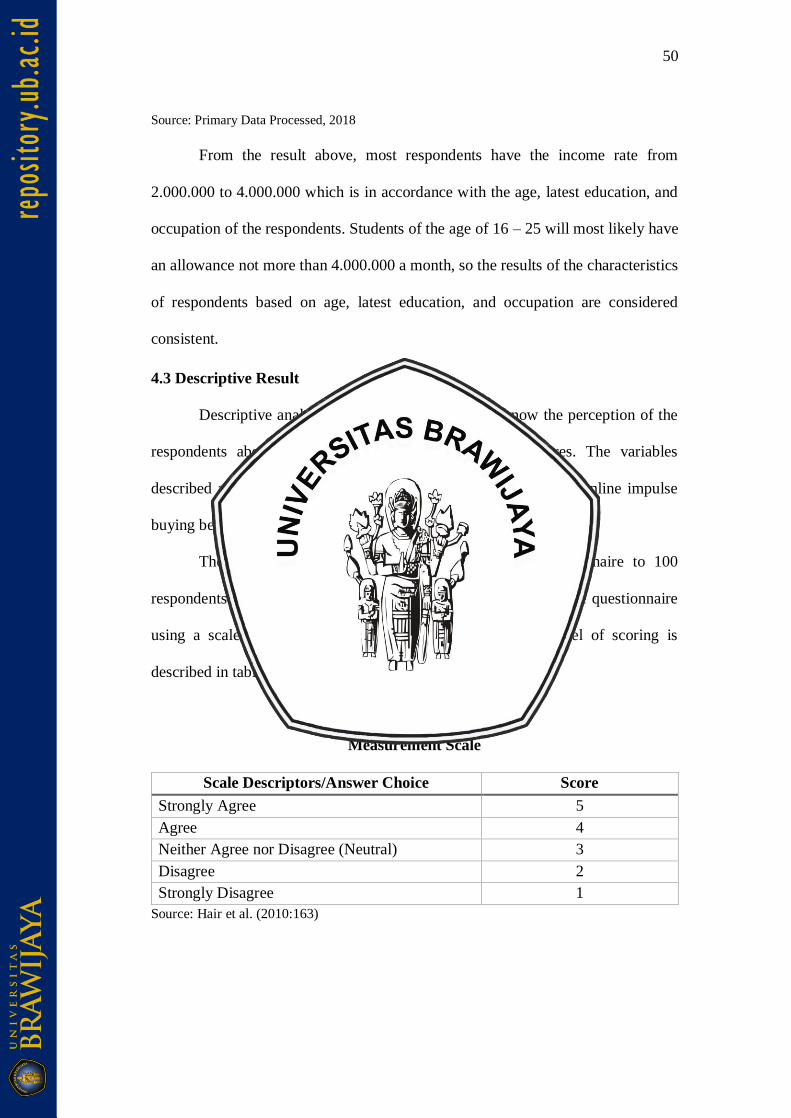
50
Source: Primary Data Processed, 2018
From the result above, most respondents have the income rate from
2.000.000 to 4.000.000 which is in accordance with the age, latest education, and
occupation of the respondents. Students of the age of 16 – 25 will most likely have
an allowance not more than 4.000.000 a month, so the results of the characteristics
of respondents based on age, latest education, and occupation are considered
consistent.
4.3 Descriptive Result
Descriptive analysis of the research is done to know the perception of the
respondents about the questions given on the questionnaires. The variables
described are hedonic motivation, reference group, discount, and online impulse
buying behavior.
The research was conducted by distributing the questionnaire to 100
respondents in Malang area in which they were asked to fill in the questionnaire
using a scale representing a certain level of scoring. The level of scoring is
described in table 4.6 below:
Table 4.6
Measurement Scale
Scale Descriptors/Answer Choice Score
Strongly Agree 5
Agree 4
Neither Agree nor Disagree (Neutral) 3
Disagree 2
Strongly Disagree 1
Source: Hair et al. (2010:163)

51
4.3.1 The Frequency Distribution of Hedonic Motivation
Table 4.7
The Distribution Frequency of Hedonic Motivation
No
Items
The Distribution Frequency of Motivation
SA A N D SD
Mean F % F % F % F % F %
1 X1.1 42 42 42 42 16 16 0 0 0 0 4.26
2 X1.2 22 22 25 25 44 44 9 9 0 0 3.60
3 X1.3 29 29 44 44 25 25 2 2 0 0 4.00
4 X1.4 40 40 41 41 13 13 5 5 1 1 3.60
Mean of Hedonic Motivation Variable 3.86
Source: Primary Data Processed, 2018
Information:
X1.1 = Finding unique things makes me excited
X1.2 = Compared to others, spending time on shopping online is so enjoyable
X1.3 = During shopping, I feel excited
X1.4 = It seems that I explore a new world when I go shopping
Table 4.7 above describes the frequencies of respondents’ answers towards
the Hedonic Motivation variable. As we can see, the mean of Hedonic Motivation
(X1) is 3.86 which means that respondents have a perception that hedonic
motivation is one of the driver to impulse buying behavior. Feeling excited when
finding unique things has the highest score, then followed by feeling excited while
shopping, and then the last two items with the same score are enjoying time spent
shopping and feeling like exploring a new world while shopping.
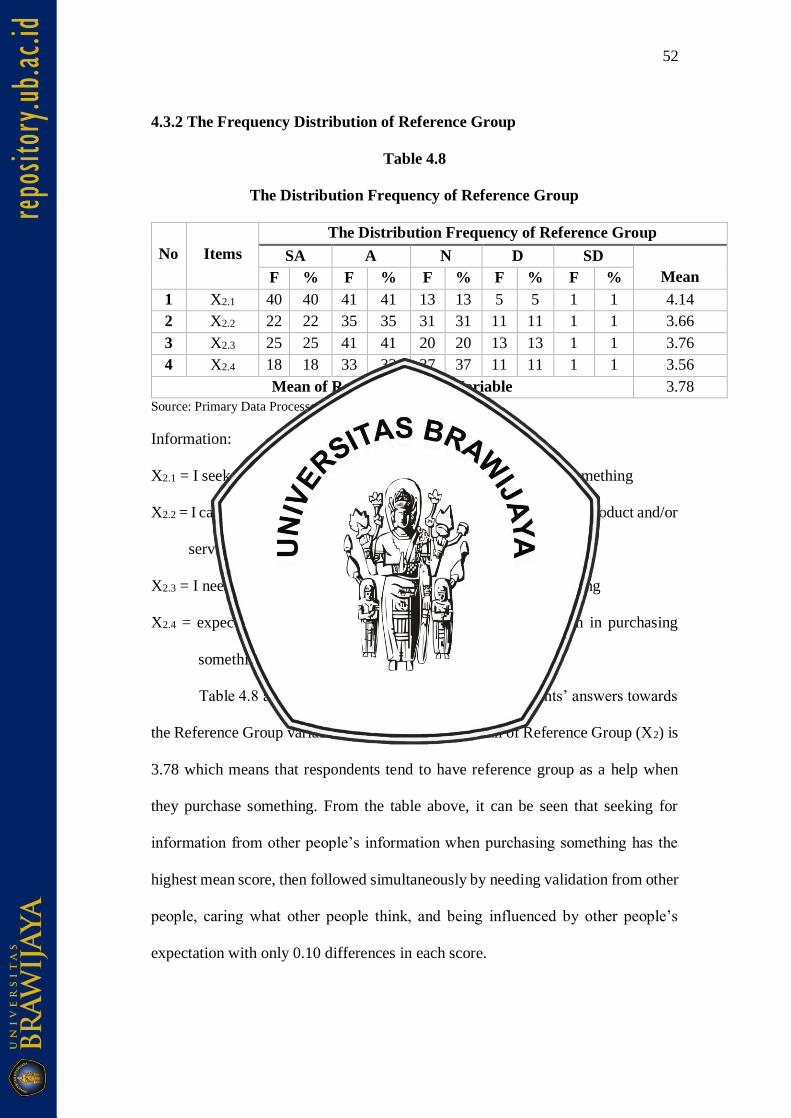
52
4.3.2 The Frequency Distribution of Reference Group
Table 4.8
The Distribution Frequency of Reference Group
No
Items
The Distribution Frequency of Reference Group
SA A N D SD
Mean F % F % F % F % F %
1 X2.1 40 40 41 41 13 13 5 5 1 1 4.14
2 X2.2 22 22 35 35 31 31 11 11 1 1 3.66
3 X2.3 25 25 41 41 20 20 13 13 1 1 3.76
4 X2.4 18 18 33 33 37 37 11 11 1 1 3.56
Mean of Reference Group Variable 3.78
Source: Primary Data Processed, 2018
Information:
X2.1 = I seek for information from other people when purchasing something
X2.2 = I care about what other people think when purchasing a certain product and/or
service
X2.3 = I need validation from other people when purchasing something
X2.4 = expectations from other people will influence my decision in purchasing
something
Table 4.8 above describes the frequencies of respondents’ answers towards
the Reference Group variable. As we can see, the mean of Reference Group (X2) is
3.78 which means that respondents tend to have reference group as a help when
they purchase something. From the table above, it can be seen that seeking for
information from other people’s information when purchasing something has the
highest mean score, then followed simultaneously by needing validation from other
people, caring what other people think, and being influenced by other people’s
expectation with only 0.10 differences in each score.
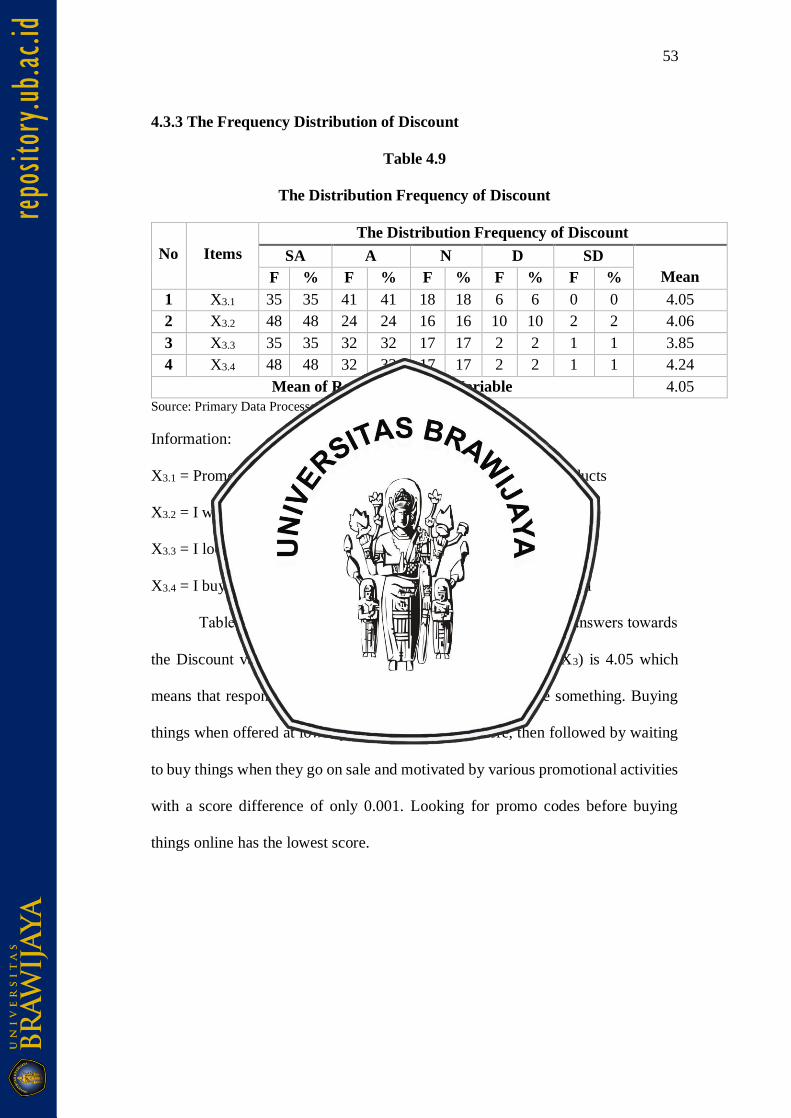
53
4.3.3 The Frequency Distribution of Discount
Table 4.9
The Distribution Frequency of Discount
No
Items
The Distribution Frequency of Discount
SA A N D SD
Mean F % F % F % F % F %
1 X3.1 35 35 41 41 18 18 6 6 0 0 4.05
2 X3.2 48 48 24 24 16 16 10 10 2 2 4.06
3 X3.3 35 35 32 32 17 17 2 2 1 1 3.85
4 X3.4 48 48 32 32 17 17 2 2 1 1 4.24
Mean of Reference Group Variable 4.05
Source: Primary Data Processed, 2018
Information:
X3.1 = Promotional activities such as discount make me to buy products
X3.2 = I wait to buy things until they go on sale
X3.3 = I look for promo codes before buying anything online
X3.4 = I buy things when it is offered at a lower price than its original
Table 4.9 above describes the frequencies of respondents’ answers towards
the Discount variable. As we can see, the mean of Discount (X3) is 4.05 which
means that respondents have discount as a driver to purchase something. Buying
things when offered at lower price has the highest score, then followed by waiting
to buy things when they go on sale and motivated by various promotional activities
with a score difference of only 0.001. Looking for promo codes before buying
things online has the lowest score.
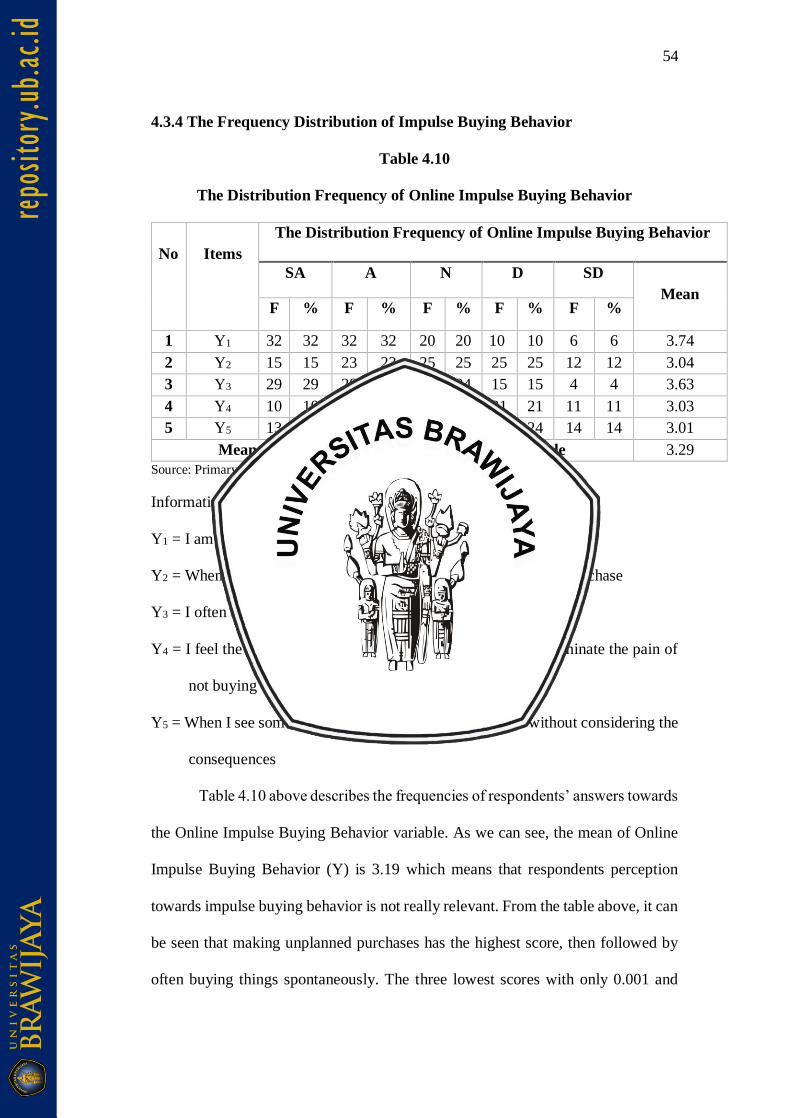
54
4.3.4 The Frequency Distribution of Impulse Buying Behavior
Table 4.10
The Distribution Frequency of Online Impulse Buying Behavior
No
Items
The Distribution Frequency of Online Impulse Buying Behavior
SA A N D SD
Mean F % F % F % F % F %
1 Y1 32 32 32 32 20 20 10 10 6 6 3.74
2 Y2 15 15 23 23 25 25 25 25 12 12 3.04
3 Y3 29 29 28 28 24 24 15 15 4 4 3.63
4 Y4 10 10 26 26 32 32 21 21 11 11 3.03
5 Y5 13 13 27 27 22 22 24 24 14 14 3.01
Mean of Online Impulse Buying Behavior Variable 3.29
Source: Primary Data Processed, 2018
Information:
Y1 = I am a person who makes unplanned purchases
Y2 = When I go shopping, I buy things that I had not intended to purchase
Y3 = I often buy things spontaneously
Y4 = I feel the desire to buy an item as quickly as possible to terminate the pain of
not buying
Y5 = When I see something that really interests me, I buy it without considering the
consequences
Table 4.10 above describes the frequencies of respondents’ answers towards
the Online Impulse Buying Behavior variable. As we can see, the mean of Online
Impulse Buying Behavior (Y) is 3.19 which means that respondents perception
towards impulse buying behavior is not really relevant. From the table above, it can
be seen that making unplanned purchases has the highest score, then followed by
often buying things spontaneously. The three lowest scores with only 0.001 and
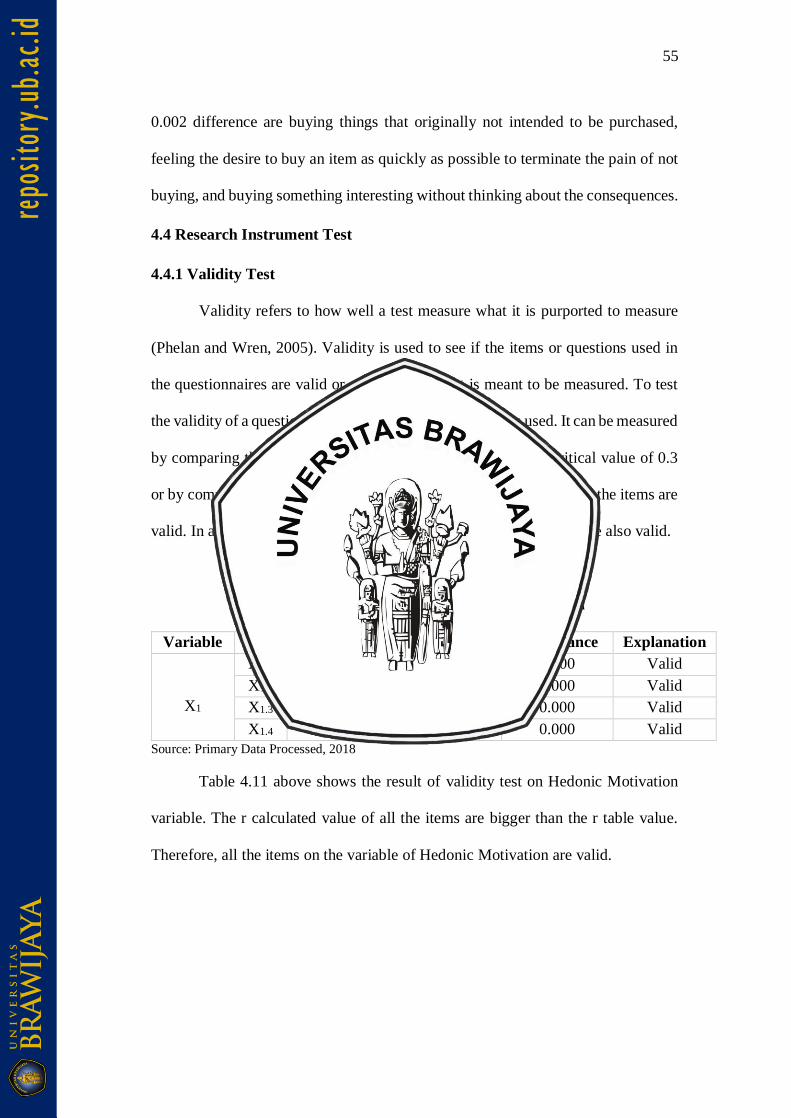
55
0.002 difference are buying things that originally not intended to be purchased,
feeling the desire to buy an item as quickly as possible to terminate the pain of not
buying, and buying something interesting without thinking about the consequences.
4.4 Research Instrument Test
4.4.1 Validity Test
Validity refers to how well a test measure what it is purported to measure
(Phelan and Wren, 2005). Validity is used to see if the items or questions used in
the questionnaires are valid or can measure what is meant to be measured. To test
the validity of a questionnaire, Pearson Correlation value is used. It can be measured
by comparing the corrected item-total correlation (r) with the critical value of 0.3
or by comparing r table with r calculated. If r table < r calculated then the items are
valid. In addition, if the value of r is greater than 0.3 then the items are also valid.
Table 4.11
The Result of Validity Test of Hedonic Motivation
Variable Items R Calculated R Table Significance Explanation
X1
X1.1 0.615 0.196 0.000 Valid
X1.2 0.778 0.196 0.000 Valid
X1.3 0.774 0.196 0.000 Valid
X1.4 0.823 0.196 0.000 Valid
Source: Primary Data Processed, 2018
Table 4.11 above shows the result of validity test on Hedonic Motivation
variable. The r calculated value of all the items are bigger than the r table value.
Therefore, all the items on the variable of Hedonic Motivation are valid.
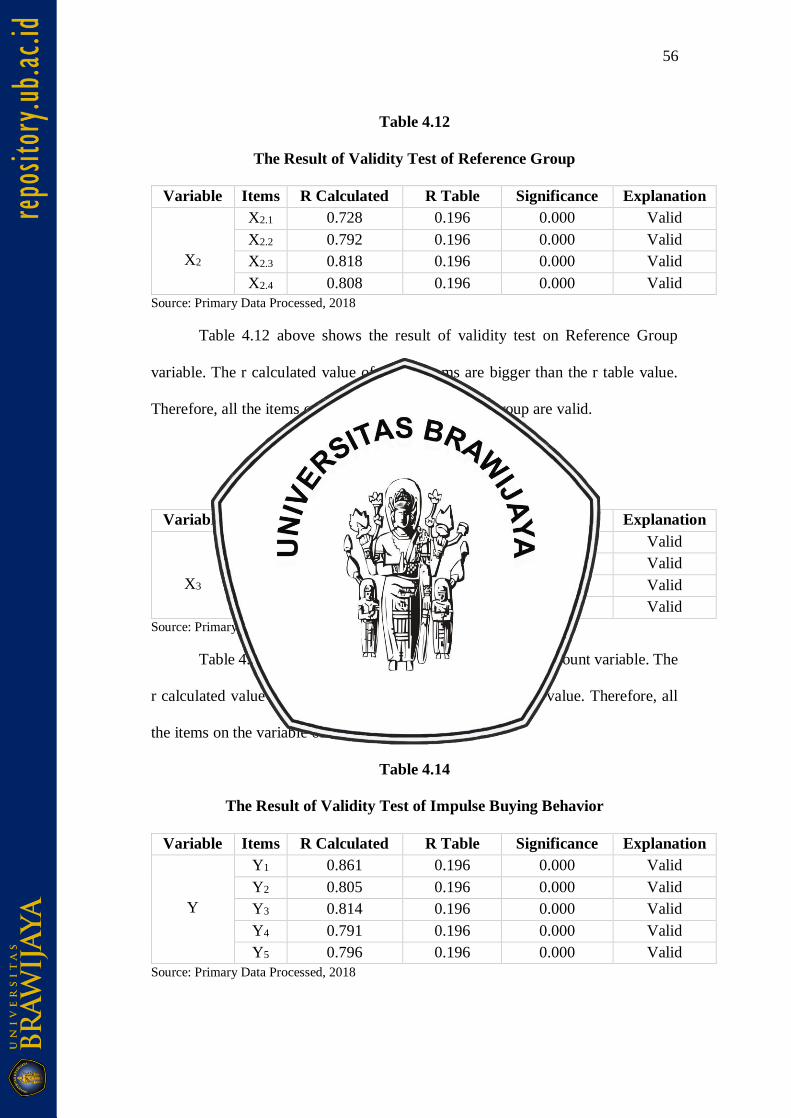
56
Table 4.12
The Result of Validity Test of Reference Group
Variable Items R Calculated R Table Significance Explanation
X2
X2.1 0.728 0.196 0.000 Valid
X2.2 0.792 0.196 0.000 Valid
X2.3 0.818 0.196 0.000 Valid
X2.4 0.808 0.196 0.000 Valid
Source: Primary Data Processed, 2018
Table 4.12 above shows the result of validity test on Reference Group
variable. The r calculated value of all the items are bigger than the r table value.
Therefore, all the items on the variable of Reference Group are valid.
Table 4.13
The Result of Validity Test of Discount
Variable Items R Calculated R Table Significance Explanation
X3
X3.1 0.740 0.196 0.000 Valid
X3.2 0.882 0.196 0.000 Valid
X3.3 0.850 0.196 0.000 Valid
X3.4 0.835 0.196 0.000 Valid
Source: Primary Data Processed, 2018
Table 4.13 above shows the result of validity test on Discount variable. The
r calculated value of all the items are bigger than the r table value. Therefore, all
the items on the variable of Discount are valid.
Table 4.14
The Result of Validity Test of Impulse Buying Behavior
Variable Items R Calculated R Table Significance Explanation
Y
Y1 0.861 0.196 0.000 Valid
Y2 0.805 0.196 0.000 Valid
Y3 0.814 0.196 0.000 Valid
Y4 0.791 0.196 0.000 Valid
Y5 0.796 0.196 0.000 Valid
Source: Primary Data Processed, 2018
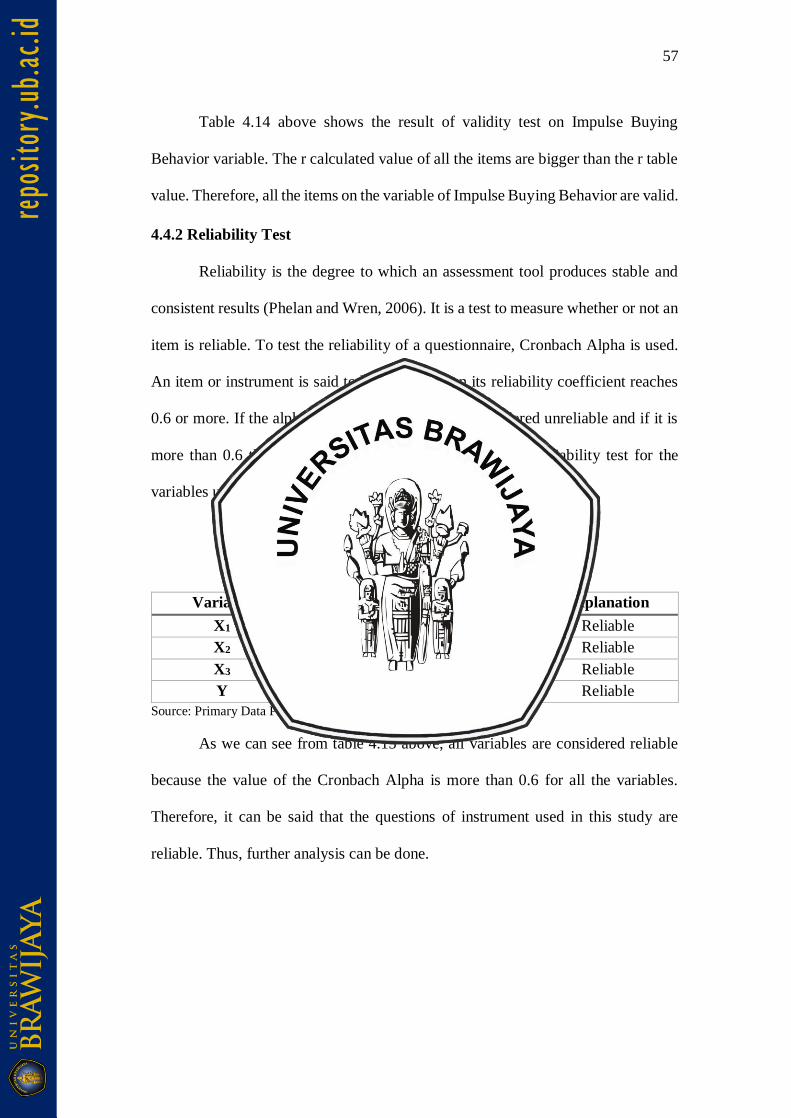
57
Table 4.14 above shows the result of validity test on Impulse Buying
Behavior variable. The r calculated value of all the items are bigger than the r table
value. Therefore, all the items on the variable of Impulse Buying Behavior are valid.
4.4.2 Reliability Test
Reliability is the degree to which an assessment tool produces stable and
consistent results (Phelan and Wren, 2006). It is a test to measure whether or not an
item is reliable. To test the reliability of a questionnaire, Cronbach Alpha is used.
An item or instrument is said to be reliable when its reliability coefficient reaches
0.6 or more. If the alpha is less than 0.6 then it is considered unreliable and if it is
more than 0.6 then it is considered reliable. The result of reliability test for the
variables used in this research can be seen on table 4.10 below.
Table 4.15
The Result of Reliability Test
Variable Cronbach Alpha Coefficient Explanation
X1 0.799 Reliable
X2 0.811 Reliable
X3 0.823 Reliable
Y 0.809 Reliable
Source: Primary Data Processed, 2018
As we can see from table 4.15 above, all variables are considered reliable
because the value of the Cronbach Alpha is more than 0.6 for all the variables.
Therefore, it can be said that the questions of instrument used in this study are
reliable. Thus, further analysis can be done.
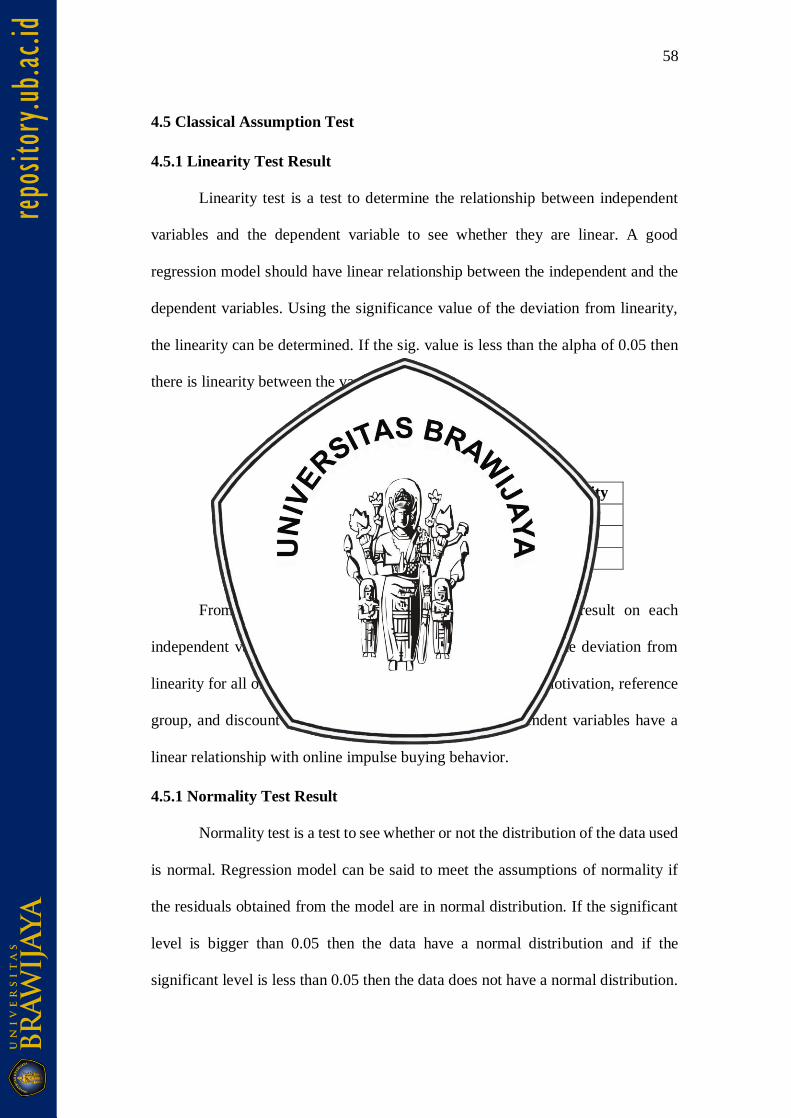
58
4.5 Classical Assumption Test
4.5.1 Linearity Test Result
Linearity test is a test to determine the relationship between independent
variables and the dependent variable to see whether they are linear. A good
regression model should have linear relationship between the independent and the
dependent variables. Using the significance value of the deviation from linearity,
the linearity can be determined. If the sig. value is less than the alpha of 0.05 then
there is linearity between the variables.
Table 4.16
Linearity Test Result
Variable Deviation from Linearity
Hedonic Motivation (X1) 0.485
Reference Group (X2) 0.399
Discount (X3) 0.276
Source: Primary Data Processed, 2018.
From table 4.16 above, we can see the linearity test result on each
independent variable to the dependent variable. The value of the deviation from
linearity for all of the independent variables namely hedonic motivation, reference
group, and discount are less than 0.05 so all of the independent variables have a
linear relationship with online impulse buying behavior.
4.5.1 Normality Test Result
Normality test is a test to see whether or not the distribution of the data used
is normal. Regression model can be said to meet the assumptions of normality if
the residuals obtained from the model are in normal distribution. If the significant
level is bigger than 0.05 then the data have a normal distribution and if the
significant level is less than 0.05 then the data does not have a normal distribution.
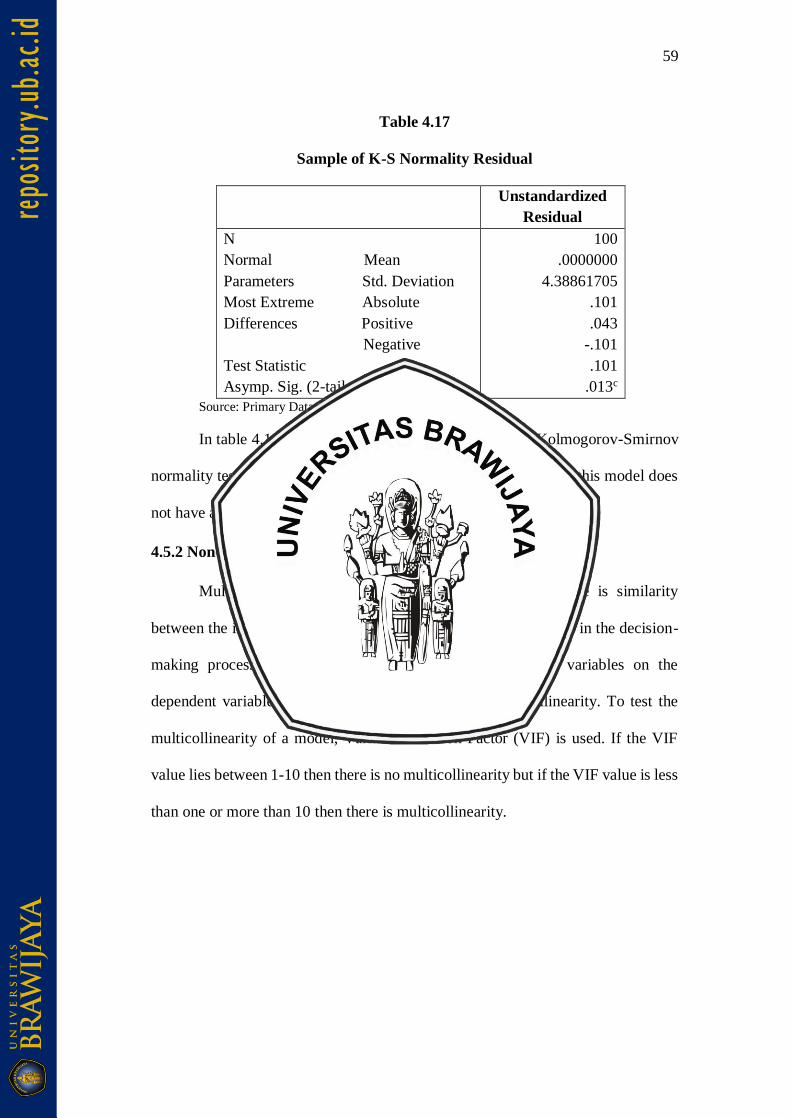
59
Table 4.17
Sample of K-S Normality Residual
Unstandardized
Residual
N
Normal Mean
Parameters Std. Deviation
Most Extreme Absolute
Differences Positive
Negative
Test Statistic
Asymp. Sig. (2-tailed)
100
.0000000
4.38861705
.101
.043
-.101
.101
.013c
Source: Primary Data Processed, 2018
In table 4.17 showing the significant level using the Kolmogorov-Smirnov
normality test, the result is 0.013 which means that the residual in this model does
not have a normal distribution, as it is less than 0.05.
4.5.2 Non-Multicollinearity Test Result
Multicollinearity test is done to determine whether there is similarity
between the independent variables in a model. It is to avoid habits in the decision-
making process regarding the partial effect of independent variables on the
dependent variable. A good model will not have a multicollinearity. To test the
multicollinearity of a model, Variance Inflation Factor (VIF) is used. If the VIF
value lies between 1-10 then there is no multicollinearity but if the VIF value is less
than one or more than 10 then there is multicollinearity.
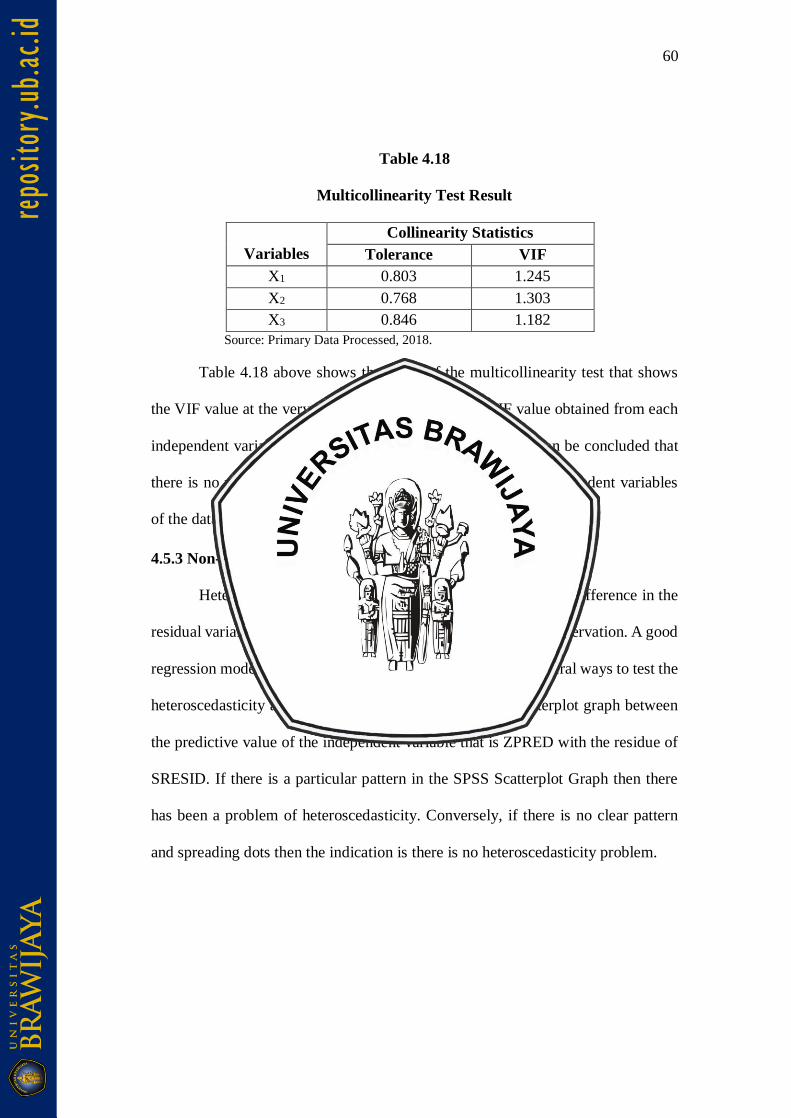
60
Table 4.18
Multicollinearity Test Result
Variables
Collinearity Statistics
Tolerance VIF
X1 0.803 1.245
X2 0.768 1.303
X3 0.846 1.182
Source: Primary Data Processed, 2018.
Table 4.18 above shows the result of the multicollinearity test that shows
the VIF value at the very right part of the table. The VIF value obtained from each
independent variable (X1, X2, and X3) lies between 1-10. It can be concluded that
there is no multicollinearity or no relationship between the independent variables
of the data. Therefore, the non-multicollinearity assumptions are met.
4.5.3 Non-Heteroscedasticity Test Result
Heteroscedasticity is useful to examine whether there is a difference in the
residual variance of the observation period to another period of observation. A good
regression model will have no heteroscedasticity. There are several ways to test the
heteroscedasticity and one of them is by looking at the scatterplot graph between
the predictive value of the independent variable that is ZPRED with the residue of
SRESID. If there is a particular pattern in the SPSS Scatterplot Graph then there
has been a problem of heteroscedasticity. Conversely, if there is no clear pattern
and spreading dots then the indication is there is no heteroscedasticity problem.
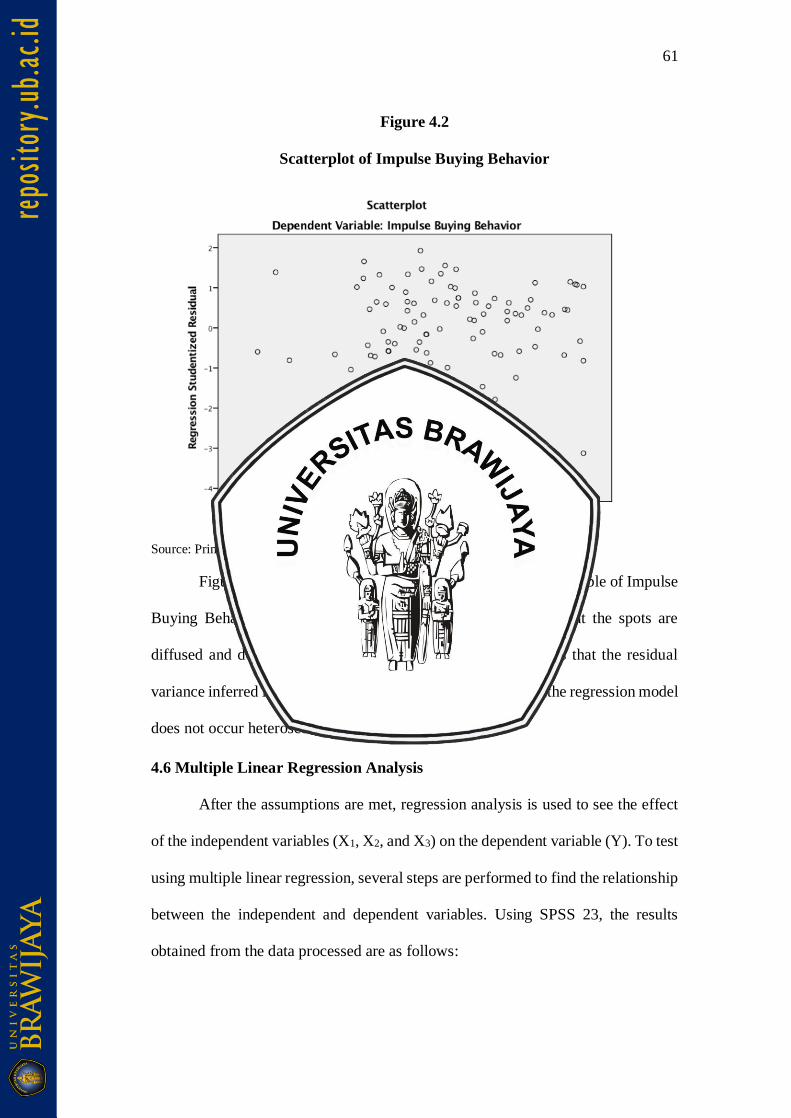
61
Figure 4.2
Scatterplot of Impulse Buying Behavior
Source: Primary Data Processed, 2018.
Figure 4.3 above shows the scatterplot of the dependent variable of Impulse
Buying Behavior. Based on the scatterplot above, it appears that the spots are
diffused and do not form a clear specific pattern, which means that the residual
variance inferred is homogeneous. So, it can be concluded that the regression model
does not occur heteroscedasticity problem.
4.6 Multiple Linear Regression Analysis
After the assumptions are met, regression analysis is used to see the effect
of the independent variables (X1, X2, and X3) on the dependent variable (Y). To test
using multiple linear regression, several steps are performed to find the relationship
between the independent and dependent variables. Using SPSS 23, the results
obtained from the data processed are as follows:
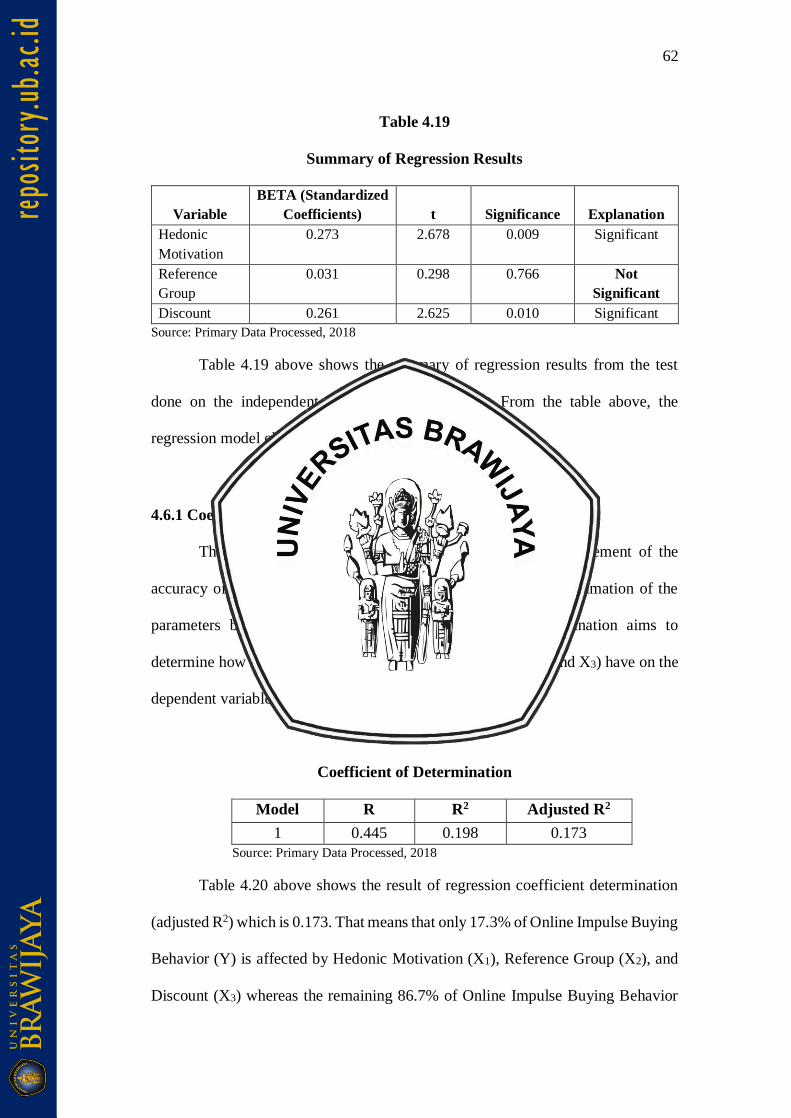
62
Table 4.19
Summary of Regression Results
Variable
BETA (Standardized
Coefficients)
t
Significance
Explanation
Hedonic
Motivation
0.273 2.678 0.009 Significant
Reference
Group
0.031 0.298 0.766 Not
Significant
Discount 0.261 2.625 0.010 Significant
Source: Primary Data Processed, 2018
Table 4.19 above shows the summary of regression results from the test
done on the independent and dependent variables. From the table above, the
regression model obtained is as follows:
𝑌 = 0.273 𝑋1 + 0.031 𝑋2 + 0.261 𝑋3 + 𝑒
4.6.1 Coefficient of Determination (Adjusted R2)
The coefficient of determination (adjusted R2) is a measurement of the
accuracy of suitability of the regression line obtained from the estimation of the
parameters based on the example. The coefficient of determination aims to
determine how much effect the independent variables (X1, X2, and X3) have on the
dependent variable (Y).
Table 4.20
Coefficient of Determination
Model R R2 Adjusted R2
1 0.445 0.198 0.173
Source: Primary Data Processed, 2018
Table 4.20 above shows the result of regression coefficient determination
(adjusted R2) which is 0.173. That means that only 17.3% of Online Impulse Buying
Behavior (Y) is affected by Hedonic Motivation (X1), Reference Group (X2), and
Discount (X3) whereas the remaining 86.7% of Online Impulse Buying Behavior
63
(Y) is affected by other variables that are not yet discussed and explored in this
research.
4.7 Hypotheses Test
Hypotheses test is done to test the hypotheses of the research, whether they
are accepted or rejected. There are three hypotheses in this research that are tested
by using Partial Regression Model using T-Test.
4.7.1 T-Test (Partial Test)
Partial regression model testing is used to determine whether each of the
independent variable forming the regression model individually has a significant
effect on the dependent variable. To test this, a t-test can be used by comparing the
values of t calculated and t table. The hypotheses used is as follows:
• H0: 𝛽i = 0 (there is no significant influence between Hedonic Motivation,
Reference Group, and Discount toward Online Impulse Buying Behavior)
• H1: 𝛽i ≠ 0 (there is a significant influence between Hedonic Motivation,
Reference Group, and Discount toward Online Impulse Buying Behavior)
If the result is significant, then H0 is rejected and H1 is accepted. Meanwhile,
if the result is not significant, then H0 is accepted and H1 is rejected. In other words,
it can be said as follows:
• H0 is rejected if t calculated > t table
• H0 is accepted if t calculated < t table
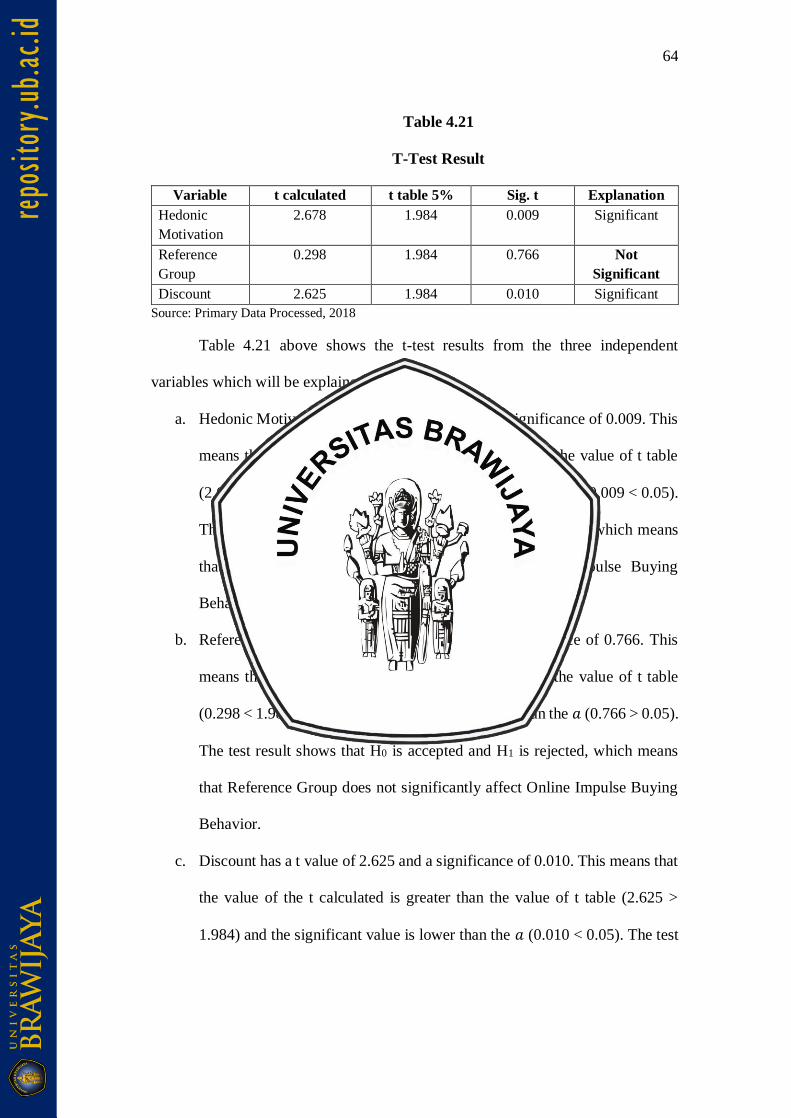
64
Table 4.21
T-Test Result
Variable t calculated t table 5% Sig. t Explanation
Hedonic
Motivation
2.678 1.984 0.009 Significant
Reference
Group
0.298 1.984 0.766 Not
Significant
Discount 2.625 1.984 0.010 Significant
Source: Primary Data Processed, 2018
Table 4.21 above shows the t-test results from the three independent
variables which will be explained below:
a. Hedonic Motivation has a t value of 2.678 and a significance of 0.009. This
means that the value of the t calculated is greater than the value of t table
(2.678 > 1.984) and the significant value is lower than the 𝑎 (0.009 < 0.05).
The test result shows that H0 is rejected and H1 is accepted, which means
that Hedonic Motivation significantly affects Online Impulse Buying
Behavior.
b. Reference Group has a t value of 0.298 and a significance of 0.766. This
means that the value of the t calculated is lower than the value of t table
(0.298 < 1.984) and the significant value is greater than the 𝑎 (0.766 > 0.05).
The test result shows that H0 is accepted and H1 is rejected, which means
that Reference Group does not significantly affect Online Impulse Buying
Behavior.
c. Discount has a t value of 2.625 and a significance of 0.010. This means that
the value of the t calculated is greater than the value of t table (2.625 >
1.984) and the significant value is lower than the 𝑎 (0.010 < 0.05). The test
65
result shows that H0 is rejected and H1 is accepted, which means that
Discount significantly affects Online Impulse Buying Behavior.
4.8 Discussion
Hedonic Motivation, Reference Group, and Discount are used in this
research to reveal the Online Impulse Buying Behavior during Harbolnas in
Malang. The analysis used is the data testing method of multiple linear regression.
The data were collected by using questionnaires which have been tested in terms of
its validity and reliability so it is valid and reliable. Then the data were tested using
classical assumptions tests consisting of linearity test, normality test,
multicollinearity test, and heteroscedasticity test. After all the tests were done, the
data were analyzed by using multiple linear regression to determine the effect of
the independent variables on the dependent variable. Last but not least, hypotheses
testing was also done using t test.
From the results that were gained from the tests done, it can be concluded
that from three independent variables, only one variable that has no effect on the
dependent variable, that is Reference Group. So, Hedonic Motivation and Discount
do have an effect on Online Impulse Buying Behavior during Harbolnas in Malang.
It means that potential shoppers with an impulsive intention on Harbolnas are
usually driven by their own hedonic motivation and the discounts offered.
Considering these results, as Harbolnas is held to promote online shopping
and get people to do online shopping more, then Harbolnas and the stores who
celebrate it have to realize and enhance the things that will trigger people’s hedonic
motivation and the discounts offered to make people want to shop more on the day.
66
4.8.1 Hedonic Motivation
The hedonic motivation discussed in this research is the motivation that
people refer to the motivation of pleasure rather than fulfilling needs. Based on the
results mentioned before, Hedonic Motivation influences Online Impulse Buying
Behavior on Harbolnas, Furthermore, this finding is in accordance to the previous
researches done by Hausman (2000), Miao (2010), Chang, Eckman, and Yan
(2011), Lin and Chen (2012), sand Santini et al. (2015) who also found that hedonic
motivation can lead to an impulse buying behavior. The indicators used for hedonic
motivation in this research are uniqueness, enjoyment, excitement, and exploration.
So, if the stores or Harbolnas itself want to trigger the hedonic motivation of the
consumers, they have to enhance the said indicators.
By making the websites more unique and enjoyable with the simple, easy,
but interesting layout and design, it could trigger people’s desire to want to shop.
When the layout is easy to understand and it is supported with unique and pretty
design then it will make the consumers feel excites to explore more and therefore
could lead to more purchase.
4.8.2 Reference Group
Based on the results of this research, Reference Group does not have a
significant effect toward Online Impulse Buying Behavior on Harbolnas. This
result is not in accordance with the previous research by Tinne (2011) that says that
comments of reference group could promote impulse buying and Reza and
Valeecha (2013) that says that reference groups do have an influence on the
purchase decision for automobiles. The indicators used in this research to measure
impulse buying are information, judgement, validation, and expectation.
67
Seeing from the result and the fact that the previous research is done seven
years ago, there might have been a change in society. When wanting to purchase
something, impulsively or not, people nowadays don’t really take into consideration
of what other people might think or say. Seeing someone having a particular item
or promoting it by making comments and judgement is not influential to one’s
purchase intention.
Moreover, the abundance of influencers dominating the internet through
social media, make it easier for companies to promote their products and have
endorsements. However, when influencers are promoting too much stuff then
people will start losing their trust toward them, because it will seem like the
influencers will endorse everything as long as they get paid.
4.8.3 Discount
According to the results gained from this research, Discount significantly
affects Online Impulse Buying Behavior. This result is in accordance with the
previous researches by Tinne (2011), Santini et al. (2015), and A.K. and M.G.S.
(2015) who also found that discount or promotional activities can lead to an impulse
buying behavior. As Harbolnas is an event that promotes online shopping by giving
discount, it is believed from the result of this research that the more discount the
event or the stores give, the more interested the consumers would be in purchasing
something, that then will lead to an online impulse buying behavior.
The appearance of discount, especially during Harbolnas, will trigger
people’s desire to get the goods because they might not be able to buy it again the
next day with such a good deal. Therefore, consumers will feel persuaded to buy
the products on that day due to them being on sale.
68
4.9 Implication
The results of this research provide some theoretical and practical
implication to the effect of hedonic motivation, reference group, and discount given
on Harbolnas to promote online impulse buying behavior. The results of this
research provide some insights for Harbolnas to improve and be more effective in
promoting online shopping.
Hedonic Motivation and discount both affect online impulse buying
behavior that it is important to trigger both in order to make people buy things
online more impulsively. This can be done by trying to spark the triggers to
consumers’ hedonic motivation and giving more interesting discount offers. To
drive people’s hedonic motivation, the e-commerce sites or online stores
participating in Harbolnas can make the experience of shopping online on their sites
more unique and enjoyable that therefore it could create more excitement so
consumers will want to explore more. That could be done by giving various types
of discount and promotion on the site that consumers will want to explore more and
is more interested in seeing what the site and the event of Harbolnas have to offer.
69
CHAPTER 5
CONCLUSION AND RECOMMENDATIONS
5.1 Conclusion
This research examines the effect of Hedonic Motivation, Reference Group,
and Discount toward Online Impulse Buying Behavior on Harbolnas. Based on the
analysis using multiple linear regression and the discussions, the conclusion are as
follow:
1. Hedonic motivation gives a rise to the drive to do online impulse buying
behavior.
2. Comments of reference group does not promote an online impulse buying
behavior.
3. Discount given on Harbolnas will lead to an online impulse buying
behavior.
5.2 Recommendations
Based on the conclusions above, there are several suggestions and
recommendations that can be done by Harbolnas and the other parties that
expectedly can bring benefits. The suggestions and recommendations are:
1. Harbolnas as the event as well as the e-commerce and the online stores
participating should try to trigger potential consumers’ hedonic motivation
as much as they can. To trigger people’s hedonic motivation is not a very
hard thing to do, although it is a bit complicated. As the two lowest mean
score of the items on hedonic motivation are enjoying time spent shopping
70
and feeling like exploring a new world while shopping, those two things are
the ones that should be enhanced. Starting from making the shopping
experience more pleasurable and enjoyable will make consumers want to
spend more time and therefore will want to explore further. The further
exploration, if made more interesting will feel like exploring a new world.
That can be done by enhancing the e-commerce sites that participate in
Harbolnas by making more layout more interesting and user friendly, as
well as providing some widgets.
2. Reference group in this study is considered to have no effect on online
impulse buying behavior which means that the information provided by
other people, their expectation and validation, and their comments of what
consumers have to buy or not will not affect consumer’s decision to buy
something that it will not lead to an online impulse buying behavior.
Marketing efforts such as endorsement or having influencer trying to
influence people to buy on Harbolnas is not really effective to promote the
online impulse buying behavior, so Harbolnas itself and the e-commerce
participating in it don’t have to focus on that.
3. As the main attraction of Harbolnas is the big discount given on almost all
e-commerce sites and online shops in Indonesia, it can also be enhanced by
spreading it more evenly throughout all the online platform.
4. Harbolnas, as the first national online shopping event in Indonesia should
continue to improve as well as enhancing and broadening its scope so that
every single online platform in Indonesia could participate in Harbolnas and
promote online shopping better.
BIBLIOGRAPHY
Abdurrahman, M. S. (2017, May 20). Tekno Liputan6.com. Retrieved from Liputan
6 Web site: https://www.liputan6.com/tekno/read/2957050/pertumbuhan-e-
commerce-indonesia-tertinggi-di-dunia
Anindita, A. (2017, December 12). Okezone Finance. Retrieved April 12, 2018,
from https://economy.okezone.com/read/2017/12/11/320/1828631/sejarah-
harbolnas-sudah-berlangsung-sejak-5-tahun-lalu
Carmen, P. (2008). Considerations About Group Influences on Consumer
Behavior. Management Marketing, 4(209), 1136-1139.
Chang, H.-J., Eckman, M., & Yan, R.-N. (2011). Application of the Stimulus-
Organism-Response Model to the Retail Environment: The Role of Hedonic
Motivation in Impulse Buying Behavior. The International Review of
Retail, Distribution, and Consumer Research, 21(3), 234-248.
Childers, T. L., Carr, C. L., Peck, J., & Carson, S. (2001, July 19). Hedonic and
Utilitarian Motivations for Online Retail Shopping Behavior. Journal of
Retailing, -(77), 511-535.
Coey, D., Larsen, B. J., & Platt, B. C. (2017, May 17). A Theory of Discounts and
Deadlines in Retail Search.
Color-Meanings. (2018). Red Color Meaning - The Color Red. Retrieved April 29,
2018, from https://www.color-meanings.com/red-color-meaning-the-color-
red/
Cooper, D. R., & Schindler, P. S. (2011). Business Research Methods (11th Edition
ed.). New York: McGraw-Hill/Irwin.
Daruwati, M. K. (2017, December 12). Nakita ID. Retrieved April 12, 2018, from
http://nakita.grid.id/read/0219941/bagaimana-sejarah-harbolnas-ternyata-
ini-pelopornya-di-indonesia?page=all
Dynamicweb Software. (2015, August 4). DynamicWeb. Retrieved March 21,
2018, from https://www.dynamicweb.com/resources/blog/the-impulse-for-
ecommerce-pt-1-what-is-impulse-buying-and-who-does-it
Foroughi, A., Buang, N. A., Senik, Z. C., Hajmirsadeghi, R. S., & Bagheri, M. M.
(2014). The Causes of Impulse Buying Behavior among Iranian Shopper.
Asian Social Science, 10(21), 64-72.
Gleeson, P. (2018). Chron. Retrieved March 21, 2018, from
http://smallbusiness.chron.com/discount-pricing-strategy-794.html
Grand Canyon University. (n.d.). Center for Innovation in Research and Teaching.
Retrieved March 22, 2018, from cirt.gcu.edu
Gujarati, N. D., & Porter, D. C. (2008). Basic Econometrics (5th Edition ed.). New
York: McGraw-Hill Education.
Hair, J. F., Black, W. C., Babin, B. J., & Anderson, R. E. (2009). Multivariate Data
Analysis (7th Edition ed.). New York: Prentince Hall.
Hair, J. F., Wolfinbarger, M. F., Ortinau, D. J., & Bush, R. P. (2009). Essentials of
Marketing Research (2nd Edition ed.). New York: McGraw Hill Book Co.
Harbolnas. (2017, - -). Harbolnas. Retrieved February 20, 2018, from Harbolnas:
https://www.harbolnas.com/
Hausman, A. (2000). A Multi-method Investigation of Consumer Motivations in
Impulse Buying Behavior. Journal of Consumer Marketing, 17(5), 403-419.
Hill, D. (1998). What Sample Size id "Enough" in Internet Survey Research.
Interpersonal Computing and Technology: An Electronic Journal for the
21st Century, 6(3-4), 1-10.
Kementrian Komunikasi dan Informatika RI. (2016). Data & Statistik Kominfo.
Retrieved January 20, 2018, from Kominfo Web site:
https://statistik.kominfo.go.id/site/data?idtree=430&iddoc=1525
Kothari, C. (2009). Research Methodology: Methods and Techniques (2nd Edition
ed.). New Delhi: New Age International Publishers.
Kotler, P., & Keller, K. L. (2016). Marketing Management (Vol. 15). Harlow:
Pearson Education Limited.
Krishnan, R. A. (2012). SlideShare. Retrieved January 20, 2018, from
https://www.slideshare.net/ialwaysthinkprettythings/rm-module-31
Lake, L. (2009). Consumer Behavior for Dummies. Hoboken: Wiley Publishing.
Lee, I. (2016). Encyclopedia of E-Commerce Development, Implementation, and
Management. Illinois: IGI Global.
Lin, Y.-H., & Chen, C.-F. (2012). Passengers' Shopping Motivations and
Commercial Activities at Airports - The Moderating Effects of Time
Pressure and Impulse Buying Tendency. Tourism Management, 36(-), 426-
434.
Lo, L. Y.-S., Lin, S.-W., & Hsu, L.-Y. (2016, October). Motivation for Online
Impulse Buying: A Two-Factor Theory Perspective. International Journal
of Information Management, 36(5), 759-772.
MBA Skool. (n.d.). Impulse Buying Definition: Marketing Dictionary. Retrieved
March 21, 2018, from MBA Skool Web site:
https://www.mbaskool.com/business-concepts/marketing-and-strategy-
terms/10806-impulse-buying.html
Miao, Li;. (2011). Guilty Pleasure or Pleasurable Guilt? Affective Experience of
Impulse Buying in Hedonic-Driven Consumption. Journal of Hospitality
and Tourism Research, 35(79), 79-101.
Muruganantham, G., & Bhakat, R. S. (2013). A Review of Impulse Buying
Behavior. International Journal of Marketing Studies, 5(3), 149-160.
Ohio University. (2016, June 23). Ohio University: Online Graduate Degree
Program. Retrieved March 2018, 2018, from Ohio University Web site:
https://onlinemasters.ohio.edu/four-consumer-behavior-theories-every-
marketer-should-know/
Phelan, C., & Wren, J. (2005). Reliability and Validity: UNI. Retrieved May 1,
2018, from https://chfasoa.uni.edu/reliabilityandvalidity.htm
Prasad, S. S. (n.d.). International School of Management Excellence: The Blog.
Retrieved March 21, 2018, from ISME Web site:
http://www.isme.in/marketing-is-it-a-science-or-an-art/
Rent.com. (2015, July 7). Forbes: Real Estate. Retrieved March 2018, 2018, from
https://www.forbes.com/sites/rent/2015/07/07/impulse-buying-are-you-
guilty/#5423aa2357aa
Reza, S. A., & Valeecha, S. (2013, November). Influence of Social Reference
Groups on Automobile Buying Decision - Research on Young Executives.
World Review of Business Research, 3(4), 197-210.
Roscoe, J. (1975). Fundamental Research Statistics for the Behavioral Sciences.
New York: Holt, Reinhart, and Winston, Inc.
Rudolph, S. (2016, June 19). How Discounts Affect Online Consumer Buying
Behavior. Retrieved April 2, 2018, from B2C:
https://www.business2community.com/consumer-marketing/discounts-
affect-online-consumer-buying-behavior-infographic-01575471
Santini, F. d., Sampaio, C. H., Perin, M. G., & Vieira, V. A. (2015). An analysis of
the influence of discount sales promotion in consumer buying intent and the
moderating effects of attractiveness. -, 50(4), 416-431.
SIS International Research. (2018). What is Quantitative Research?: SIS
International Research. Retrieved March 22, 2018, from
https://www.sisinternational.com/what-is-quantitative-research/
Solomon, M. R. (2017). Consumer Behavior: Buying, Having, and Being (Vol. 12).
Essex: Pearson.
Stern, H. (1962, April). The Significance of Impulse Buying Today. Journal of
Marketing, 26(2), 59-62.
Sugiyono. (2014). Metode Penelitian Pendidikan Pendekatan Kuantitatif,
Kualitatid, dan R&D. Bandung: Alfabeta.
Taylor, S. (2014, February 14). Psychology Today. Retrieved May 26, 2018, from
https://www.psychologytoday.com/us/blog/out-the-darkness/201402/why-
men-dont-shopping-and-most-women-do
Tinne, W. S. (2011). Factors Affecting Impulse Buying Behavior of Consumers at
Superstores in Bangladesh. ASA University Review, 5(1), 210-220.
Weerathunga, A., & Pathmini, M. (2015). Impact of Sales Promotion on
Consumer's Impulse Buying Behavior (IBB): Study in Supermarkets in
Anuradhapura City. International Research Symposium, -(-), -.
Wienclaw, R. A. (2013). E-Commerce. Research Starters: Business.
Wikipedia. (2017, December 19). Hari Belanja Online Nasional. Retrieved April
12, 2018, from
https://id.wikipedia.org/wiki/Hari_Belanja_Online_Nasional
Wikipedia. (2018, February 14). Black Friday (Shopping). Retrieved from
Wikipedia: https://en.wikipedia.org/wiki/Black_Friday_(shopping)
Wikipedia. (2018, February 4). E-commerce. Retrieved from Wikipedia:
https://en.wikipedia.org/wiki/E-commerce
APPENDICES
76
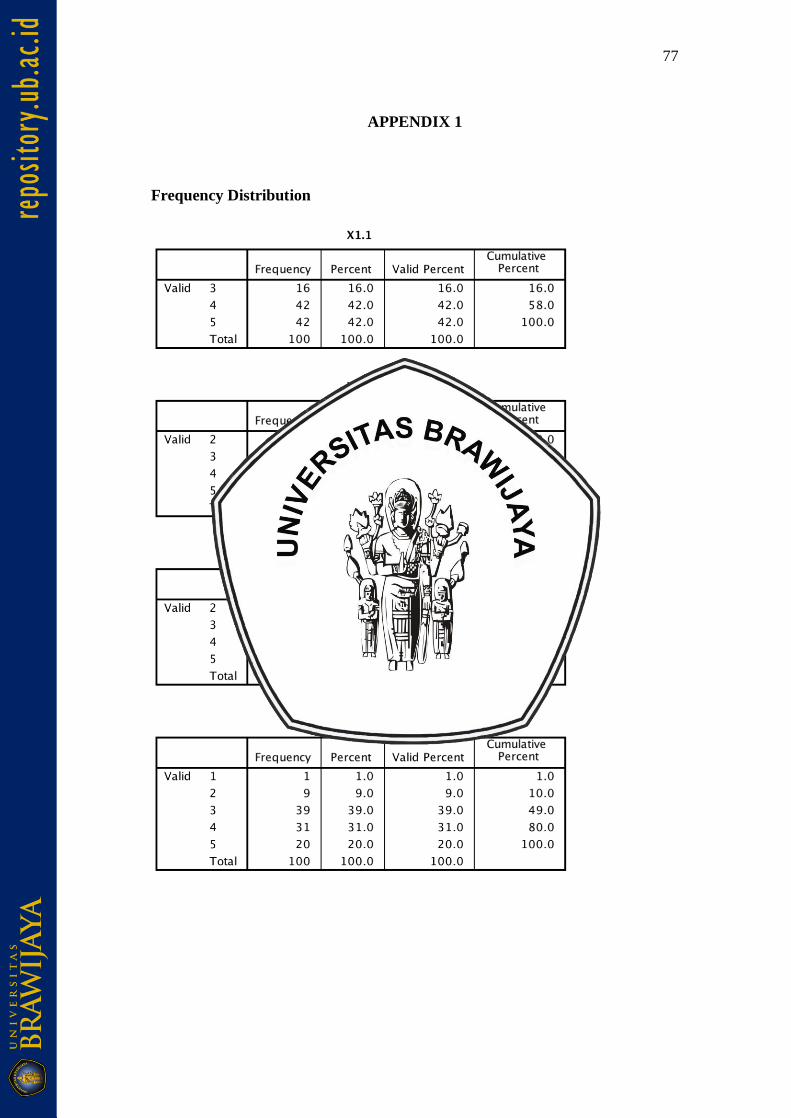
77
APPENDIX 1
Frequency Distribution
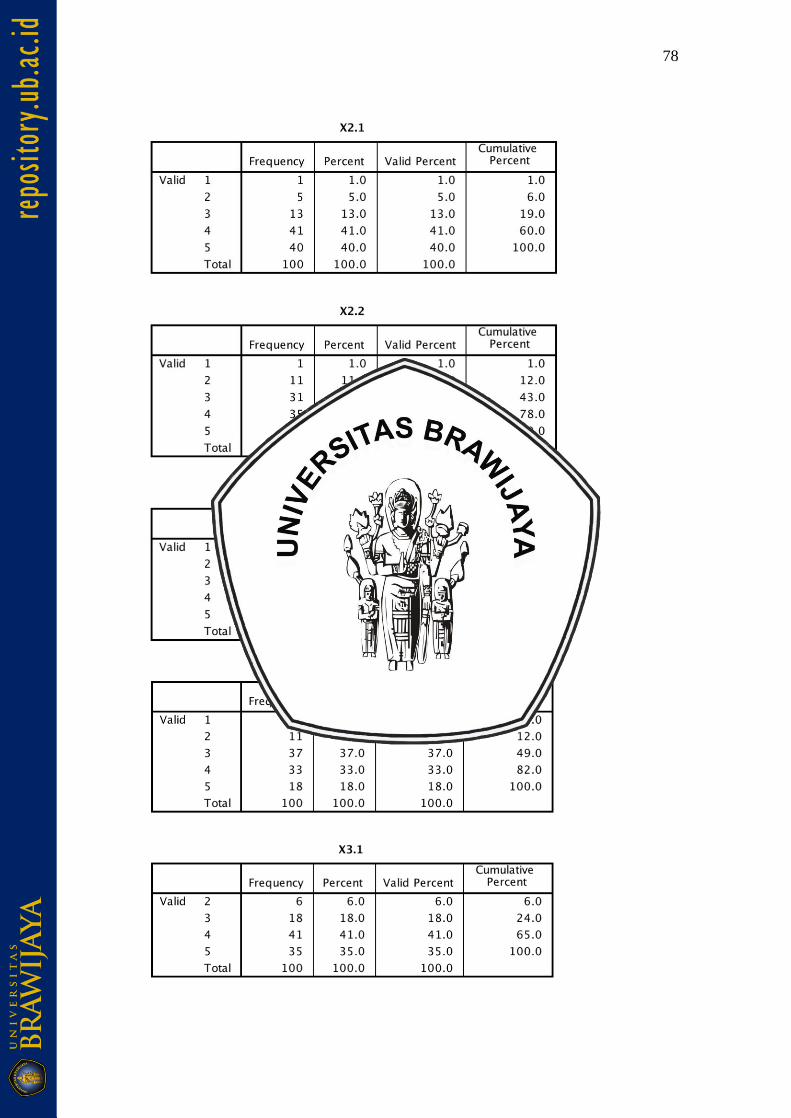
78
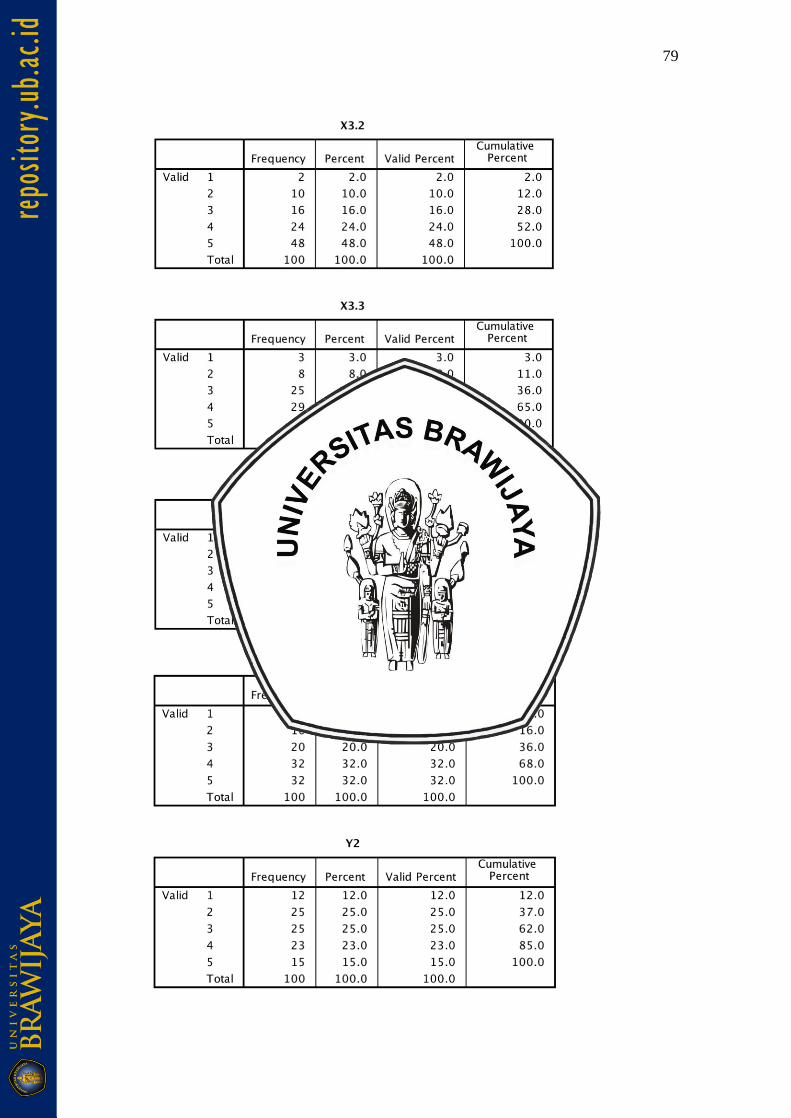
79
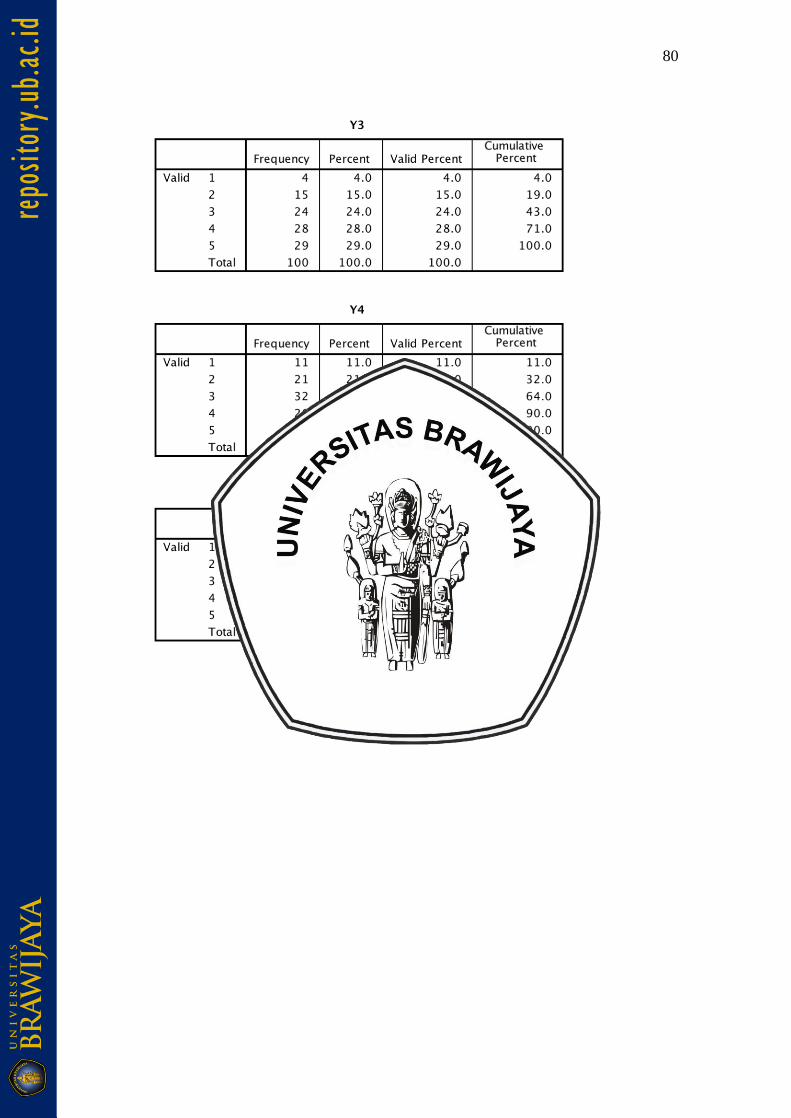
80
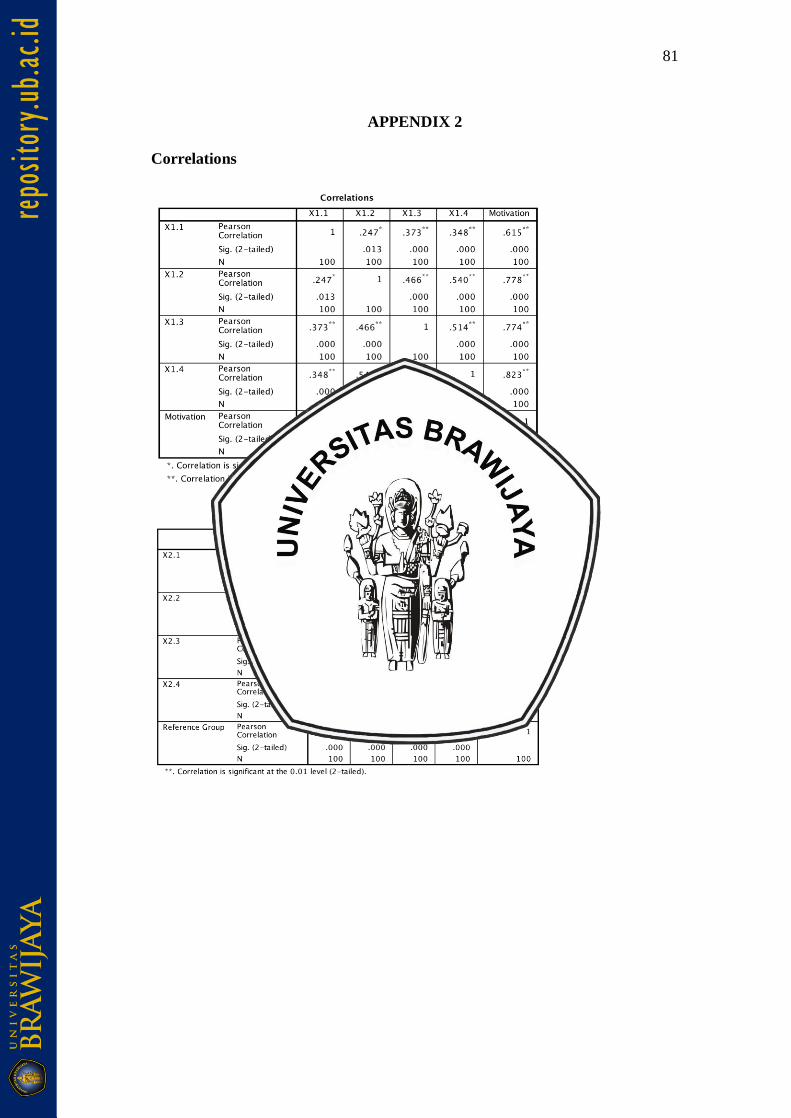
81
APPENDIX 2
Correlations
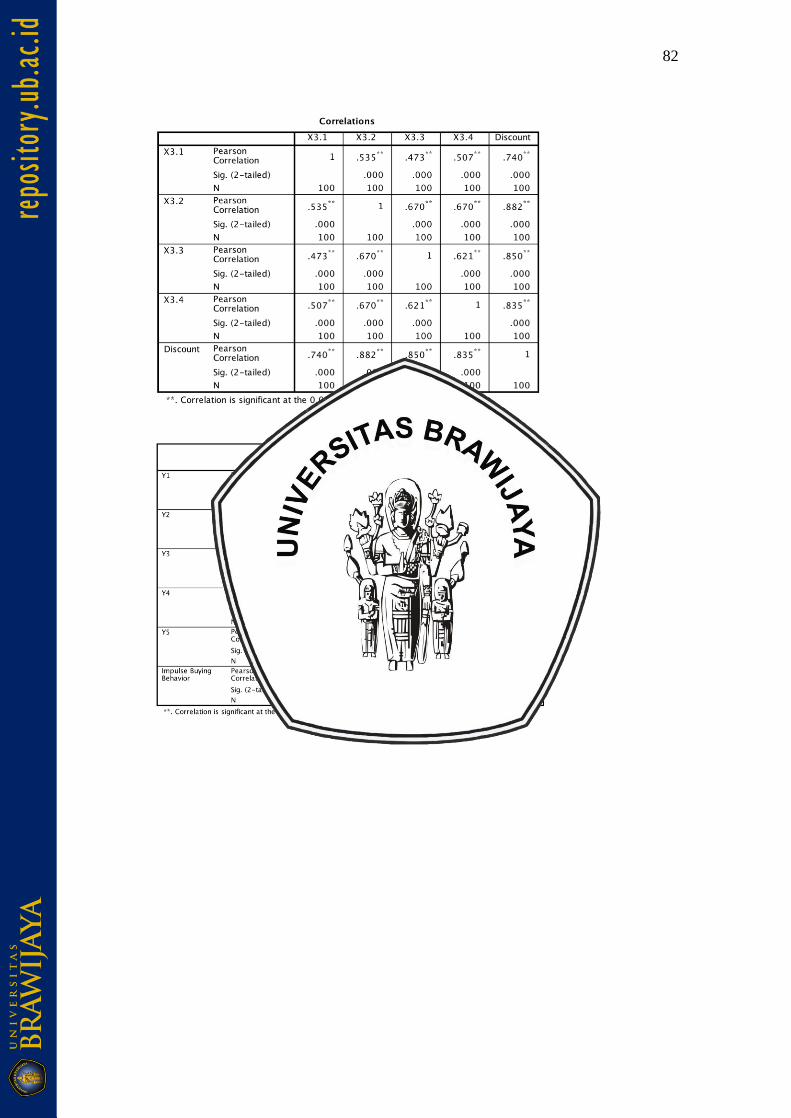
82
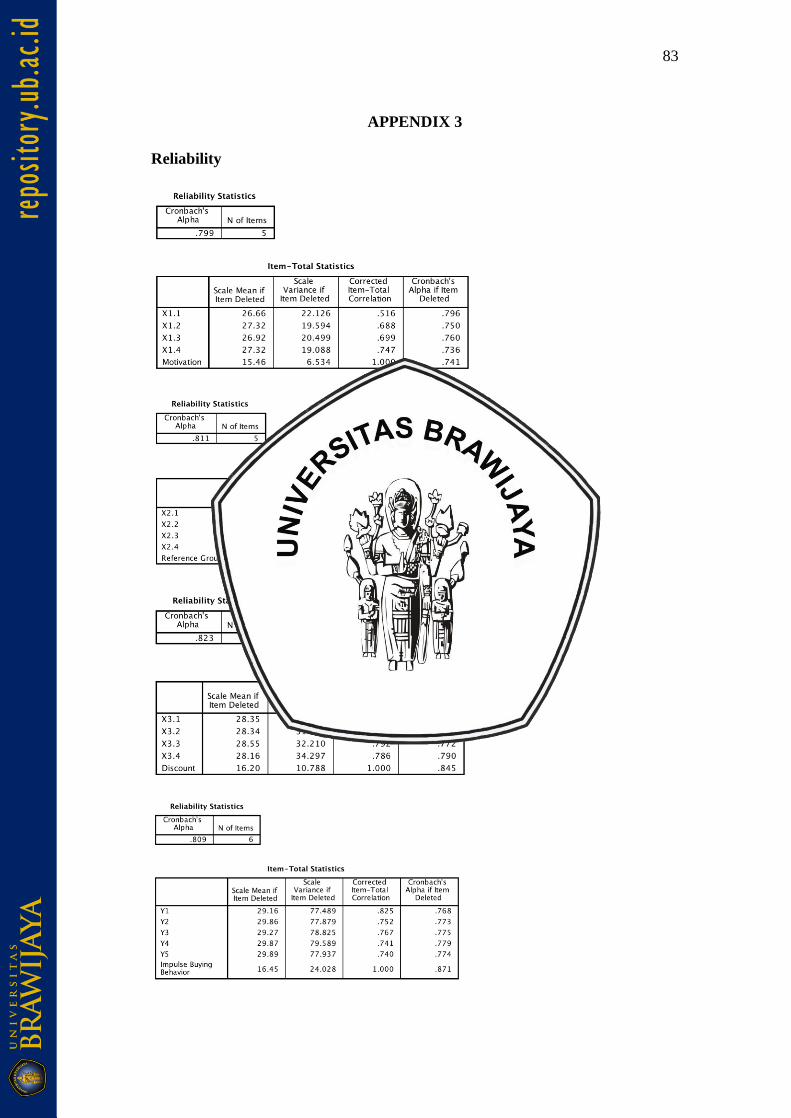
83
APPENDIX 3
Reliability
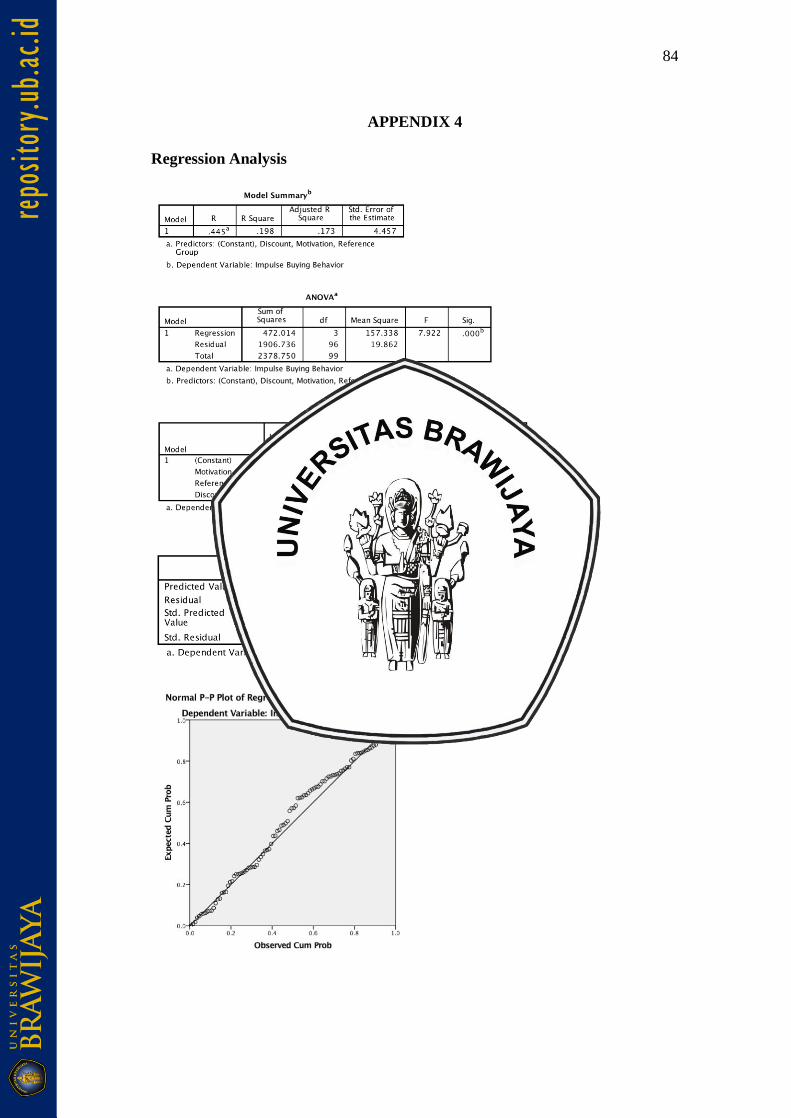
84
APPENDIX 4
Regression Analysis
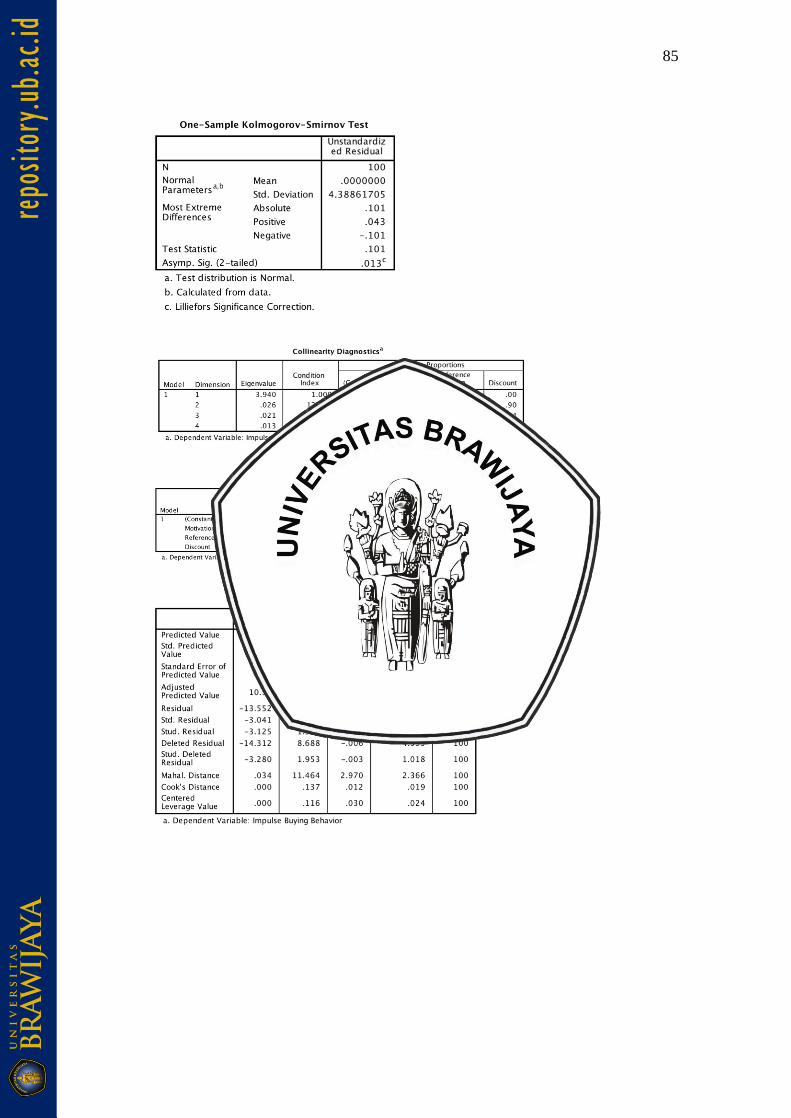
85
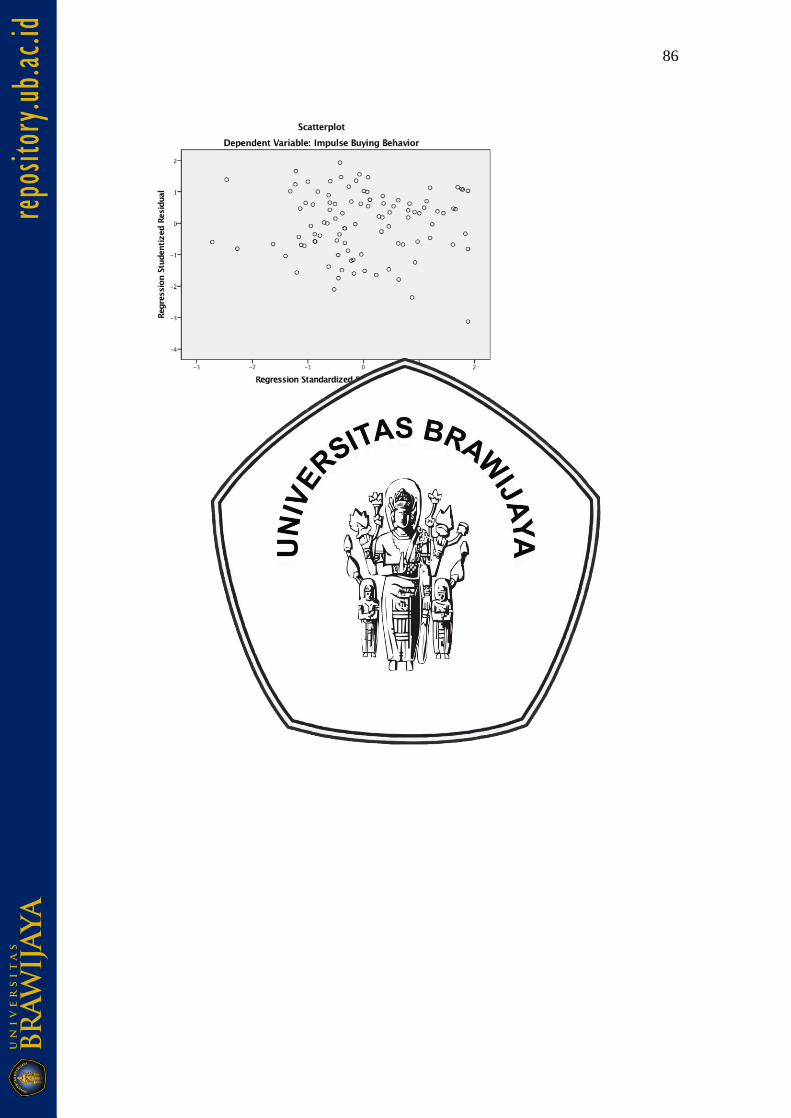
86
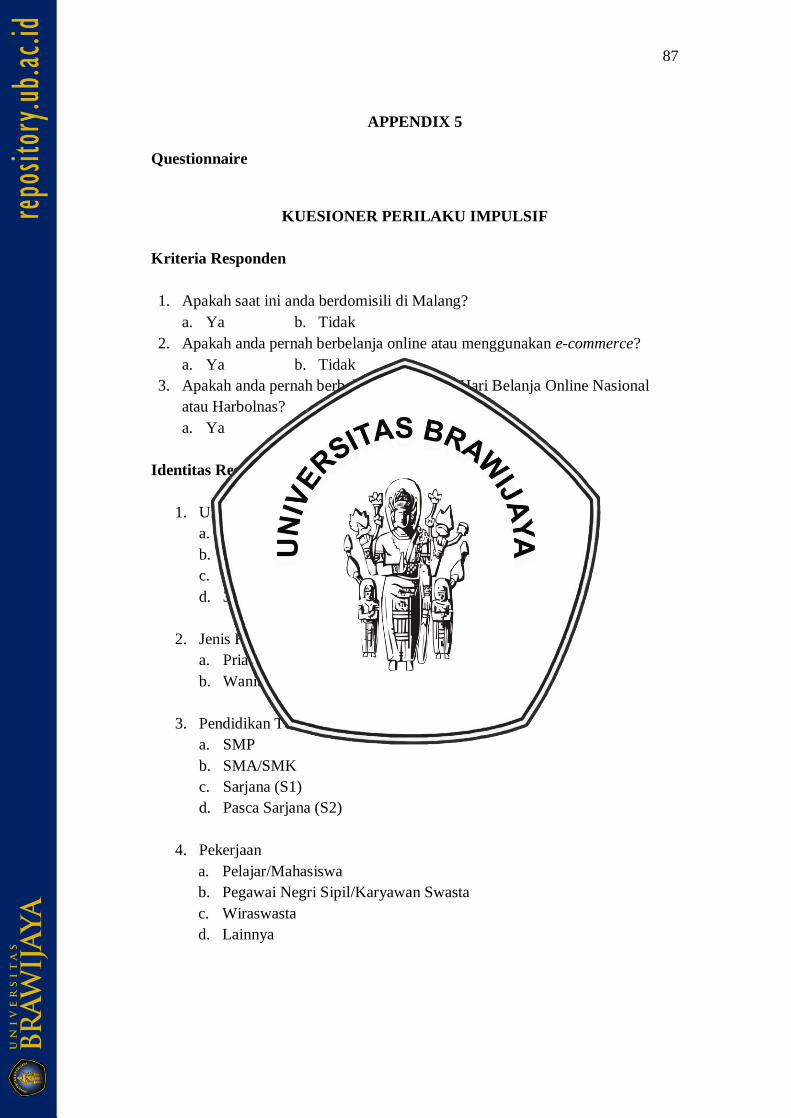
87
APPENDIX 5
Questionnaire
KUESIONER PERILAKU IMPULSIF
Kriteria Responden
1. Apakah saat ini anda berdomisili di Malang?
a. Ya b. Tidak
2. Apakah anda pernah berbelanja online atau menggunakan e-commerce?
a. Ya b. Tidak
3. Apakah anda pernah berbelanja online saat Hari Belanja Online Nasional
atau Harbolnas?
a. Ya b. Tidak
Identitas Responden
1. Umur
a. 16 – 20
b. 21 – 25
c. 26 – 30
d. 30 – 35
2. Jenis Kelamin
a. Pria
b. Wanita
3. Pendidikan Terakhir
a. SMP
b. SMA/SMK
c. Sarjana (S1)
d. Pasca Sarjana (S2)
4. Pekerjaan
a. Pelajar/Mahasiswa
b. Pegawai Negri Sipil/Karyawan Swasta
c. Wiraswasta
d. Lainnya
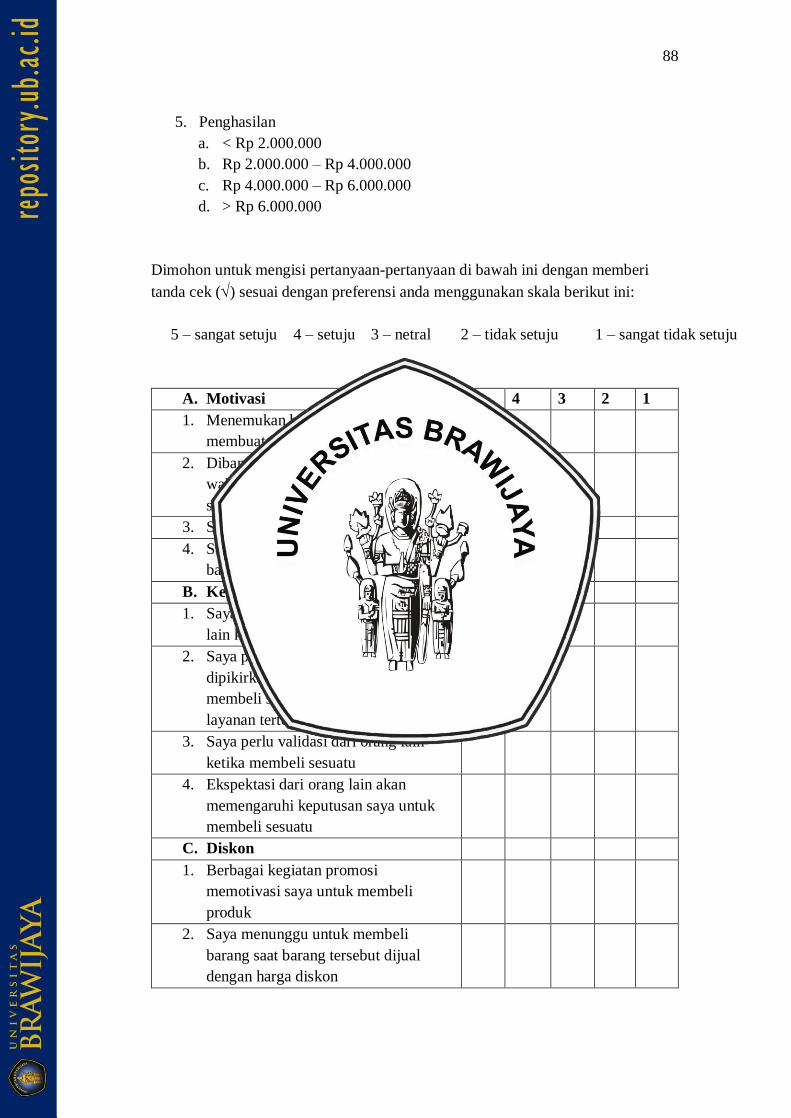
88
5. Penghasilan
a. < Rp 2.000.000
b. Rp 2.000.000 – Rp 4.000.000
c. Rp 4.000.000 – Rp 6.000.000
d. > Rp 6.000.000
Dimohon untuk mengisi pertanyaan-pertanyaan di bawah ini dengan memberi
tanda cek () sesuai dengan preferensi anda menggunakan skala berikut ini:
5 – sangat setuju 4 – setuju 3 – netral 2 – tidak setuju 1 – sangat tidak setuju
A. Motivasi 5 4 3 2 1
1. Menemukan barang yang unik
membuat saya gembira
2. Dibandingkan hal lain, menghabiskan
waktu untuk berbelanja online itu
sangat menyenangkan
3. Saat berbelanja, saya merasa gembira
4. Saya merasa seperti menjelajahi dunia
baru saat berbelanja
B. Kelompok Referensi
1. Saya mencari informasi dari orang
lain ketika akan membeli sesuatu
2. Saya peduli dengan apa yang
dipikirkan oleh orang lain ketika
membeli sebuah produk dan/atau
layanan tertentu
3. Saya perlu validasi dari orang lain
ketika membeli sesuatu
4. Ekspektasi dari orang lain akan
memengaruhi keputusan saya untuk
membeli sesuatu
C. Diskon
1. Berbagai kegiatan promosi
memotivasi saya untuk membeli
produk
2. Saya menunggu untuk membeli
barang saat barang tersebut dijual
dengan harga diskon
89
3. Saya mencari kode promo sebelum
membeli sesuatu secara online
4. Saya membeli barang saat ditawarkan
harga yang lebih murah dari biasanya
D. Perilaku Impulsif
1. Saya adalah orang yang melakukan
pembelian yang tidak direncanakan
2. Saat berbelanja, saya membeli barang-
barang yang tidak ingin saya beli
3. Saya seringkali membeli sesuatu
secara spontan
4. Saya merasakan keinginan untuk
membeli suatu barang secepat
mungkin untuk mengakhiri rasa sakit
karena tidak membeli
5. Ketika saya melihat sesuatu yang
sangat menarik bagi saya, saya akan
membelinya tanpa
mempertimbangkan konsekuensinya
Copyright © 2022 FDOKUMEN