Hedonic Housing Price Indices: The Turinese Experience
36
Hedonic Housing Price Indices: The Turinese Experience Piermassimo Pavese* University of Eastern Piedmont, Alessandria and Agenzia del Territorio, Asti This study presents the methodology used by the Agenzia del territorio to produce real-estate indices for the analysis of the housing market in the Turinese area districts. The importance of an index is highlighted by the fact that a significant percentage of national wealth is the property sector. To this end, we use a rich and detailed database on transaction prices which allows us to study the dynamics of the residential housing market through the estimation of hedonic price indexes for Turin. This study carried out an hedonic methodology, not yet applied in Italy, on data collected and aggregates in homogeneous areas for the city of Turin. The results obtained appear to be of valid significance in the ratios, also in terms of values. Home price increased 40 percent from first semester of 2003 through the second semester of 2007. [JEL Classification: D49, D69, C4, R2] 1. - Introduction This work is based on two independent assumptions. A rapid review of the real estate indices available at the international level highlights a lack of information about the general Italian real 113 * <[email protected]>. The Author is grateful to Roberto Zanola, Alberto Martini and Mario Ferrero for guidance and advice while he was working on his B.A. thesis and on this paper. Thanks are due to colleagues there, expecially Nicola Lazzari, Alberto Trabucco and Maria Cristina Sartor. Special thanks are due to Gina Werth and Giuseppe Villari. The Author wishes to thank the referees of Rivista di Politica Economica for useful advice that allowed improving the final version of this paper. The Author thanks the partecipants at AREUEA International Conference for their useful finally contribution. The usual disclaimers apply.
Transcript of Hedonic Housing Price Indices: The Turinese Experience
Hedonic Housing Price Indices: The Turinese Experience
Piermassimo Pavese*University of Eastern Piedmont, Alessandria
andAgenzia del Territorio, Asti
This study presents the methodology used by the Agenzia delterritorio to produce real-estate indices for the analysis of thehousing market in the Turinese area districts. The importance ofan index is highlighted by the fact that a significant percentage ofnational wealth is the property sector. To this end, we use a richand detailed database on transaction prices which allows us tostudy the dynamics of the residential housing market through theestimation of hedonic price indexes for Turin. This study carriedout an hedonic methodology, not yet applied in Italy, on datacollected and aggregates in homogeneous areas for the city of Turin.The results obtained appear to be of valid significance in the ratios,also in terms of values. Home price increased 40 percent from firstsemester of 2003 through the second semester of 2007. [JELClassification: D49, D69, C4, R2]
1. - Introduction
This work is based on two independent assumptions. A rapidreview of the real estate indices available at the international levelhighlights a lack of information about the general Italian real
113
* <[email protected]>. The Author is grateful to RobertoZanola, Alberto Martini and Mario Ferrero for guidance and advice while he wasworking on his B.A. thesis and on this paper. Thanks are due to colleagues there,expecially Nicola Lazzari, Alberto Trabucco and Maria Cristina Sartor. Specialthanks are due to Gina Werth and Giuseppe Villari. The Author wishes to thankthe referees of Rivista di Politica Economica for useful advice that allowedimproving the final version of this paper. The Author thanks the partecipants atAREUEA International Conference for their useful finally contribution. The usualdisclaimers apply.

estate market and, on the other hand, notable attention given tohedonic regression (Eigslsperger, 2006). Hedonics are the “mostintellectually satisfying of the various quality-adjustment methodsbecause (they) appeal to an underlying economic structure ratherthan opportunistic proxies” (Hulten, 2003). The idea is to detectthe quality of a product or, in other words, «the potentialcontribution to the welfare and happiness of its purchaser and thecommunity» (Court, 1939) through a characteristic’s vector. Realestate price indices have recently played a crucial role incontributing to both capacity and inflationary pressures. A highpercentage of national wellness is based on the real estate sectorand how dynamic house prices affect investment decision, financialorder, inflation and working mobility. In Italy, surprisingly, there isno official real estate market index. This anomaly was reportedby Eurostat (1999), and it created a lot of problems for the statisticagency (Boskin et al., 1998), but also for the Central Bank(Cannari, 2006) because it could not base its decisions on anofficial index. Some nations use housing price indices in thenational budget, as a deflator of the indices on residentialconstruction and in order to determine the value of the housingstock. We decided to use the Territory Agency’s tools to analyzeTurin’s real estate market. These tools were also used by literature.The Territory Agency both manages the updating of the real estatedata bank and is a technical organ of the Financial and EconomicMinistry that analyzes real estate prices and a lot of othercharacteristics. Using the bases of hedonic method, we analyzedthe elementary prices derived by extraction of the OMI relevationcard. For every six months, we derived a vector of characteristicscompatible with what literature says, and then, valued theregression coefficients and extracted the real estate index for thecity of Turin. This index covers the gap in the current estatespecialistic literature, in fact the hedonic approach has not yetbeen applied in Italy. Despite the abundance of informationprovided by the current literature, it is not easily used. In fact,price variations influence budget and also sellers’ and buyers’investment decisions, which, in turn, influence price stability inthe Euro area. The rest of the paper is organized as follows.
RIVISTA DI POLITICA ECONOMICA NOVEMBER-DECEMBER 2007
114
Section 2 defines the housing price indexes. Data and theeconometric specification of the hedonic function is presented inSection 3. Section 4 shows the results of the hedonic regression.Section 5 concludes.
2. - Housing Price Indices
There are several methods for constructing house priceindices. Some of these methods were created decades ago but theproblem is open. The variation in the median (or average) saleprice is often used to measure price changes. The index formula,so-called Dutox index, is easily understood and available for mostareas in Italy. The index is sensitive to quality changes because ahouse is not a homogeneous product1. In the real estate market,matched methods are so called repeat sales methods. Theyestimate price trends from transactions for houses that have beensold more than once over the period (Bailey et al., 1963;Ashenfelter and Graddy, 2003).
The main advantage of the repeat sales approach isreproducibility and the main disavantage of the approach is asfollows:
(a) It does not use all of the available information on housingunit sales;
(b) It does not allow for changes in the implicit price ofparticular charateristics over time (Diewert, 2003);
(c) It does not take into account repairs or renovations in thehousing units;
(d) It does not take into account depreciation of the housingunits.
The repeat sales model, advanced by Bailey et al., (1963) wasfirst used as an alternative method of analyzing the hedonic price
Hedonic Housing Price Indices, etc.P. PAVESE
115
1 The median price is immune from measurement errors in the upper quantileor the lower quantile, however the model is unable to reflect the price changes inthe upper quantile. Median price is used in several studies (MARK J. - GOLDBERG
M., 1984; WANG F. - ZORN P., 1997) in the index calculated from the US Real EstateAssociation, instead average price is used in studies available in Italy. This indexis known to be sensitive to quality changes (CASE B. - SHILLER R., 1987).

index. If the assumption of unchanged house charateristics is notviolated the repeat sales method may be expressed as:
(1)
where Pit is the sales price of house unit i at time t and Dit is aset of time dummy variables, we assume the characterisctics andthe implicit prices of the same housing unit do not change overthe time. When the assumption of unchanged house charateristicsis not violated, the repeat sales method is not needed to estimatecharacteristics. However the disavantages are the non randomnessof the sample, reductions in sample size, and selectivity. The repeatsales method holds quality constant by mesuring the same assetin two periods. The selection corrected repeat-sales index estimateswhether a housing unit is sold twice or not. Iit is an indicatorvariable which takes the value of 1 if the housing unit is sold attime and zero otherwise.
(2)
where Φ is the standard normal distribution; Zkit is the relevanthedonic charateristics vector of the housing unit i at time t (k =1,…, K) and γ is a set of parameters. The second step is to findthe Mills ratio parameter:
(3)
is included in hedonic regression to obtain unbiased price indicescorrecting for the non randomness of the sample:
(4)
A hedonic price index uses a hedonic function in some way(Triplett, 2004). Most research hedonic price indices have used thetime dummy variable method (Gordon 1990; Griliches, 1990;Triplett, 2004) which allows shadow price and price index to besimultaneously estimated (Locatelli and Zanola, 2003). The
p p Dit s itt
T
t it it s it it s+=
+ +− = + − + −∑1
( ) (β χ λ λ ε εiit )
λ
φ γγit
it
it
Z
Z=
( )
( )Φ
prob( ) ( )I Zitk
K
k kit= = +=
∑1 01
Φ γ γ
p p Dit s itt
T
t it it s it+=
+− = + −∑1
β ε ε( )
RIVISTA DI POLITICA ECONOMICA NOVEMBER-DECEMBER 2007
116

hedonic price model attributes an implicit price to each of thetime-invariant and time-varying characteristics of the item. A setof charateristics is identified for a regression of the price of thehouse i such that:
(5)
where ln pit is the logarithm of the price of house i sold in periodt; β is the implicit price, X is a vector of charateristics; εit is therandom error term; Dj is a dummy equal to 1 when a sale occursin semester j, 0 otherwise. The social valuation of housecharateristics does not change over time. The regressioncoefficient γ is the logarithm of the price index at the time t, sothe price index at time t is:
(6)
If the assumption of unchanged house charateristics over timeis violated only the data of two periods are pooled into regression.The model is such as:
(7)
The adjacent period regression is preferred because of thepossible presence of structural change across time. Structuralchange and coefficients instability from one cross section toanother are due to technological innovations or changes inconsumer preferences. In the real estate market, it is reasonableto suppose that constructive technology and tastes do not changeso quickly (Li, 2006). Chow test can be used to test if structuralchange is present. Triplett (2004) noted that the index numberformula implied by the dummy variable method can be derivedfrom the expression for the regression coefficient for the timevariable because the index formula depends on the functionalform for the hedonic function. The first hedonic price index,introduced by the US Census Bureau in 1968, was a characteristic
ln P X Diti
K
i it j j it= + + +=
∑β β γ ε01
I It t t t= −− −1 1[exp( )]γ γ
ln P X Diti
K
i itj
T
j j it= + + += =
∑ ∑β β γ ε01 1
Hedonic Housing Price Indices, etc.P. PAVESE
117

price index. The charateristic price method uses the implicitcharacteristic prices (the regression coefficients from the hedonicfunction) in a conventional weighted index number formula(Triplett, 2004). Housing buyers want the location and living area,and the number of bathrooms contained in the housing unit. Thisinterpragetion of the characteristic price index method onlyrequires that the quantities of characteristics are the variables thatbuyers want and use and that sellers produce and market. Thelinear model is such as:
(8)
where p is price of housing unit at time t, X is a set ofcharateristics, the regression coefficients are the implicit pricesand the constant is the price of the housing unit withoutcharacteristics held in the regression equation. The Laspeyresprice index is:
(9)
In a weighted index number formula, weights are quantitiesof characteristics in the sample (Li, 2006; Triplett, 2004) or in atypical or average housing unit, or more correctly, the totalquantity of characteristics purchased by the index population.The regression is carried out for each period and coefficients areallowed to change over the time. When the hedonic price surfaceis nonlinear, because a characteristic does not have a singlemarket price and different buyers pay different prices forcharacteristics depending on their preferences, the characteristicsprice index is biased. Griliches (1971) called this method a “price-of-characteristics index”. The method has several advantages(Triplett, 2004):
— the index number formula. The index number formula isseparated from the form of the hedonic function. In the timedummy method the form of hedonic index depends on theempirical relation between prices and charateristics (Rosen, 1974).
I X Xi
K
i iti
K
i it= + += =
−∑ ∑β β β β01
01
1
ln P Xiti
K
i it it= + +=
∑β β ε01
RIVISTA DI POLITICA ECONOMICA NOVEMBER-DECEMBER 2007
118

— the time dummy method constrains the hedoniccoefficients to be unchanged over the time periods included in theregression. Schultze and Mackie (2002) urge the statisticalagencies to avoid putting resources into the dummy variablemethod.
A Chow test can be used to investigate if hedonic coefficientsdiffer statistically across the periods.2 According to Silver andHeravi (2001), the main problems are:
(a) we must estimate a number of parameters equal to thenumber of characteristics;
(b) if, reducing the number of parameters reduces the numberof classes of characteristics, the variance of coefficients analyzedinevitably increases;
(c) Theory provides little guidance to help determine theappropriate functional form and the characteristics vector forhedonic equations.
The hedonic method controls for quality by using multipleregressions; the problems are to determine the charateristicsvector, instability of coefficients from one cross section to another,specification of the hedonic functional form (Knight et al., 1995).The disavantages of repeat-sales is the non randomness of thesample, reductions in sample size, and selectivity. Case andQuigley (1991) go beyond two approaches (hedonic and repeat);this metodology combines information on repeat sales withhedonic approach to capture the variation of prices within therepeat sales model and the serial correlation. Case and Shiller(1987) developed the method that involves two steps. The first isto estimate a repeat sales equation and the second uses theresiduals to correct for heteroskedasticity using GeneralzatedLeast Squares3. Empirical evidence in the real estate marketindicates that hybrid models are unbiased (Case and Szymanoski,1995). However, when the sample is too small and does notrepresent the population of properties, or when there is more than
Hedonic Housing Price Indices, etc.P. PAVESE
119
2 Empirical evidence in the real estate market indicates that all of three hedonicmethods (pooled, adjacent, characteristic) produce almost identical results (LI W.et AL., 2006).
3 US Office of FHEO uses a modified version to construct house price indices.
one sale repeated during the time period, even the hybrid modelstend to produce distorted results. (Hwang and Quigley, 2004).Carter Hill et al. (1997) extended this approach by assuming thehypothesis about the first order autoregressive properties of errorsin the repeat model.
3. - Hedonic Approach
Griliches (1971) proposed to use the technique of the hedonicregression in order to fix the prices to varying quality; from then,began a discussion about whether traditional methods should bereplaced by hedonic methods in the work of the statistic agencies.In 1939 Andrew Court published the first article on hedonichousing price indices. Hedonic indices have been subsequentlyadopted in varying countries in the field of electronics and realestate. A hedonic function is a regression and explanatoryvariables are based on the notion that the transaction observableis a bundle of lower order transactions that determine the valueof the bundle. The definition of hedonic indices of price can bepursued in various ways; typically the studies use one regressionwith dummy variables. The time dummy variable method was themajor method employed for hedonic price indices, however,Griliches’s original paper was the first to produce hedonic indicesby methods other than the dummy variable one. The first hedonicprice index was introduced by the US Census Bureau in1968 andin the national budget in 1974. We can use hedonic withheterogenous goods. There are a number of studies that have usedhedonic approach to estimate the value of goods such asautomobiles (Griliches, 1971), PCs (Triplett, 1990; Berndt, 1993),houses, (Blackley et al., 1986; Laferrere, 2006; Vinhay and Lall,2006; Li, 2006), paintings (Berndt et al., 1995; Chanel, 1996;Candela and Scorcu, 1997; Locatelli-Biey, and Zanola, 2003),human capital wage from the labour economics (Griliches, 1990),wines (Nerlove, 1995; Combris et al., 1997). Environmentalcharacteristics distinguish a particular category of attributes; fromwhich emerges the necessity to know the willingess to pay for
RIVISTA DI POLITICA ECONOMICA NOVEMBER-DECEMBER 2007
120

improvements in environmental quality. In our case the market isthat one of real estate. According to Rosen (1974) each good ischaracterized by the set
(10)
of all its characteristcs. The assumpion underlaying the theory isthat: notion of a homogeneous good is an “idealtype” in the senseof Max Weber. Goods, as such, empirically do not exist but thereare only variants of the idea of a certain good. Under the hedonichypothesis, a good is:
(a) characterized by the set of model which fit under a samehedonic regression equation;
(b) identified with the set of all variants j whose prices canbe explained by characteristics xk = {x1,…,xk} and the parametersβ = {β0,…,βk} typical of a regression function (Brachinger, 2002).
This definition is adapted to the real estate market. Followinga remarkable variability of the national real estate market and,particularly, Torino, due to historical, cultural and urban planningreasons, we see meaningful price variations due to the variation,sometimes, of one characteristic. For example, the price of a storeon Via Roma depends on the side of the road where it is. Formallythe functional relationship if between price p and characteristicsx is as follows:
(11)
From the first order conditions associated with a solution ofproblem we differentiate the hedonic function according to:P=constant (= Pa) we have:
(12)
The coefficient shows the increment to the price of a goodarising from a one unit increase in characteristic xk (othervariables in the regression constant). To explain what we want to
∂∂
= ∂∂
=Px
xfx
x k kk k( ) ( )( ,..., )1
p f xk= ( )
x x xk k= { ,..., }1
Hedonic Housing Price Indices, etc.P. PAVESE
121
say, we show a simplified representation of one possiblespecification of the hedonic housing function:
(13)
Rosen (1974) represents a perfect competitive market in whichconsumers and producers interact to form the equilibrium prices.In order to analyze this market and to understand the behaviorsof the consumers, we consider the consumers’ choices for everysingle characteristic and therefore divide this market in manyimplicit markets. From the action between consumers andpurchasers, on these implicit n - markets, we define a matrix ofthe prices in which it expresses the equilibrium’s price in the everysingle characteristic’s market. The main problems are:
(a) Determine the charateristics vector x typical for each good; (b) Coefficients are unstable from one cross section to
another; (c) Specify the hedonic functional form f(xk). The applicable procedures in the determination of the
needed variables are different: to choose on the base of theeconomic theory of the market; to use same variables used inprevious studies; to implement methods statistically in order totry to extrapolate from the data the behavior of the actors onthe market4. Second the coefficients regression can be unstablefrom one cross section to another. The third problem of theeconomic model relates to the choice of the functional form andimplies one decision on the way to express the variables; it mustuse the linear form, or transform the variable ones in order tobetter succeed to identify the relation that elapses between priceand the characteristics. The functional form has a determiningimpact on results and deserves therefore one particularreflection.
price livingarea location phouseunit = f ([ ],[ ],[ iiano])
RIVISTA DI POLITICA ECONOMICA NOVEMBER-DECEMBER 2007
122
4 The first two procedures bring up similar results based on the existingliterature with the advantage of being able to confront results with analogousstudies.
3.1 Estimating the Hedonic Prices
To calculate the hedonic price index researcher uses aprocedure in two steps. First, the investigator must estimate ahedonic function and in the second part, the investigator decideshow to use the hedonic function to calculate a price index. Inanalyzing the hedonic function, the first step is to choose thevariables to utilize as characterisctics and obtain a precise dataset.To obtain unbiased estimates of house price indices the regressionshould be specified correctly with respect to both functional formand independent variables. The hedonic method is a technique tocontrol for the heterogeneous nature of properties; it recognizesthat properties are composite products. While attributes are notsold separately, regressing the sale price of housing units on theirvarious characteristics yields the marginal contributions of eachcharateristic. For example, an estimated hedonic function forhouses might be:
(14)
In this example, the price of the house unit depends on itsliving area, measured in square meters, its location, and the level,uit is the random error term. The economic theory underlyinghedonic functions rests on the hedonic hypothesis: heterogeneousgoods are a set of characteristics that are outputs for producersand commodities for consumers. Under hedonic hypothesis, onedoes not buy a housing unit as a “box”; one buys the bundle ofcharacteristics that the producer packages into the box and «thepotential contribution ... to the welfare and happiness of itspurchaser and the community» (Court, 1939). Rosen (1974)developed the output theory for producers in a competitiveindustry focusing on product differentiation in pure competition.Obviously this assumption implies that also the construction costsdepend on the characteristics; in fact the urban planninginstruments put into effect preview the possibility to build up toa million cubic meters and uncertain number of homes. Toestimate hedonic price indices, researchers need the estimated
P c c c cit it it it= + + + +0 1 2 3(sup) ( ) ( )ZonaOMI piano uuit
Hedonic Housing Price Indices, etc.P. PAVESE
123
regression coefficients, c1, c2, and c3 from equation (14). Theclassical assumptions for the error term will be reasonable if allthe price observations are independent.
(15)
In practice, this assumption may not be fulfilled because someof the prices may be correlated. The main problem is to constrainthe hedonic coefficients to be unchanged over the time periodsincluded in the regression. The regression coefficient, when theregressions are estimated by OLS, indicates how much the priceof a housing unit changes if this house is endowed with anadditional unit of the characteristic. The equation (14) is the linearapproach; the regression coefficient indicates how much the priceof a housing unit changes if this house is endowed with anadditional unit of the living area. If the relationship between priceand characteristics is such as that:
(16)
the regression coefficient indicates the partial elasticity, how manypercent the price changes if the supit (living area) changes by onepercent. The regression coefficients are not the implicit price ofcharacteristics. A hedonic function is a relation between the pricesof different varieties of a housing unit and the quantities ofcharacteristics in them. The regression coefficients are often calledimplicit prices or characteristics prices, because they indicate theprices charged and paid for an increment of one unit of, i.e., livingarea. If a characteristic is desired by the users, one does not expecta negative sign in the hedonic function. Coeteris paribus, forestimating regression coefficient ci it is better to have lesscorrelation between charateristic xi and the other independentvariables (Wooldridge, 1999, page 96). In the regression model,explanatory variables in equation (16) are correlated with the price.Multicollinearity arises when there are statistical dependenciesamong explanatory variables in a regression. Multicollinearity is a
ln ln(sup) ( ) ln(P c c c cit it it= + + +0 1 2 3ZonaOMI pianno)it itu+
E u X
Cov u X I
( | )
( | )
=
=
0
2σ
RIVISTA DI POLITICA ECONOMICA NOVEMBER-DECEMBER 2007
124
problem stressed in hedonic studies, for a review see Shultze andMackie (2002). In several studies, hedonic regression standarderrors blow up and coefficients are unstable from one cross sectionto another. According to Triplett (2004) instability in hedonicfunctions is often caused empirically by data errors combined withmulticollinearity, missing variables and proxy variables. The firstrequirement for absence of multicollinearity is absence of technicalrelations among the characteristics that restrict possibilities forchanging one characteristic without concomitant increases ordecreases in the other characteristics. The second requirement isabsence of economic relations among regression variables. Gujarati(1995) gives as a regression of electricity use on income and housesize, where income and house size are usually correlated. Absenceof multicollinearity in the universe also requires absence ofcorreations among explanatory variables in the sample. When theliving area increases, there are no technical reasons to increase thenumber of bathrooms or luxury items. However, usually, consumerpreferences are similar. When certain house characteristics areconsidered desirable by the buyer, housing unit sales will tend tocluster in the center of the characteristics’ area. Finally, on thebuyers’ side, the sample based only on market transactions, over-represents the most requested homes, those with two or threerooms. It is correct to say that multicollinearity is a problem butlarge samples and data cleaning often reduce it.
3.2 Functional Forms in Hedonic Studies
In the history on hedonics a few number of functional formshave been used (Triplett, 2004). The linear form is often used topreliminary approach but the semilog and the double log are mostcommon forms in study about real estate. The functional formsconsidered in this paper are listed as follows:
(a) Linear Model:
(17) P X uit it it it= + +∑β β0 ( )
Hedonic Housing Price Indices, etc.P. PAVESE
125
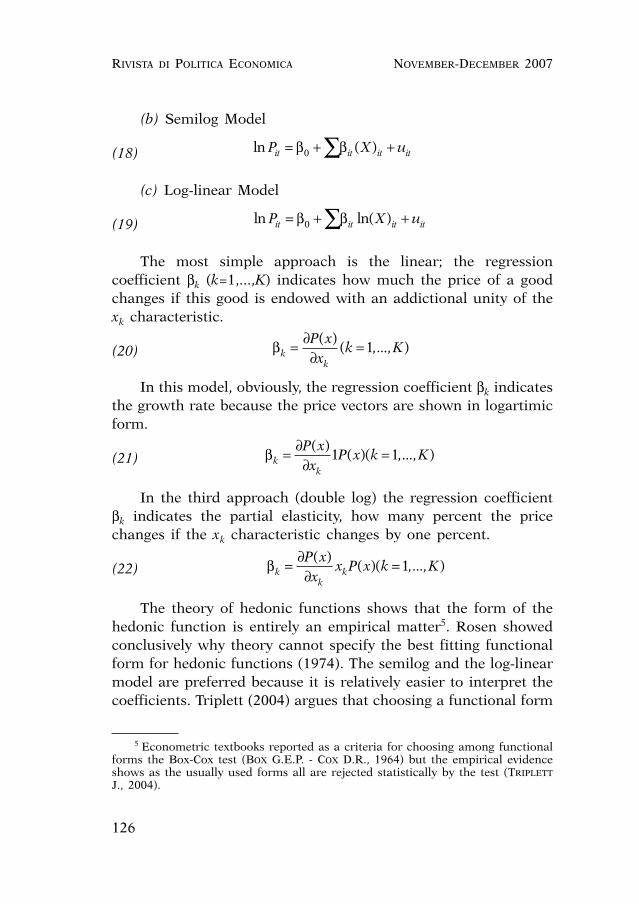
(b) Semilog Model
(18)
(c) Log-linear Model
(19)
The most simple approach is the linear; the regressioncoefficient βk (k=1,...,K) indicates how much the price of a goodchanges if this good is endowed with an addictional unity of thexk characteristic.
(20)
In this model, obviously, the regression coefficient βk indicatesthe growth rate because the price vectors are shown in logartimicform.
(21)
In the third approach (double log) the regression coefficientβk indicates the partial elasticity, how many percent the pricechanges if the xk characteristic changes by one percent.
(22)
The theory of hedonic functions shows that the form of thehedonic function is entirely an empirical matter5. Rosen showedconclusively why theory cannot specify the best fitting functionalform for hedonic functions (1974). The semilog and the log-linearmodel are preferred because it is relatively easier to interpret thecoefficients. Triplett (2004) argues that choosing a functional form
βkk
k
P xx
x P x k K= ∂∂
=( )( )( ,..., )1
βkk
P xx
P x k K= ∂∂
=( )( )( ,..., )1 1
βkk
P xx
k K= ∂∂
=( )( ,..., )1
ln ln( )P X uit it it it= + +∑β β0
ln ( )P X uit it it it= + +∑β β0
RIVISTA DI POLITICA ECONOMICA NOVEMBER-DECEMBER 2007
126
5 Econometric textbooks reported as a criteria for choosing among functionalforms the Box-Cox test (BOX G.E.P. - COX D.R., 1964) but the empirical evidenceshows as the usually used forms all are rejected statistically by the test (TRIPLETT
J., 2004).
to reduce heteroskedasticity is not correct because heteroskeda-sticity does not bias the expected values but the standard errors.Heteroskedasticity, not constant variance in the residuals, violatesone of the basic assumptions for OLS methods. The hedonicfunction estimates the relation between the prices of housing unitsand the characteristics embedded in them and an inappropriatefunctional form biases our estimates of the hedonic indices.Halvorsen and Pollakowski (1981) proposed a criteria based onquadratic Box-Cox functional form. Often in the first step resear-chers use the linear form where coefficients are implicit prices.Rosen (1974) showed that the linear form should be used only fordivisible goods. On the buyers’ side consumer should be indifferentfrom one housing unit with living area of 80 m2 or two with livingarea of 80 m2. According to several studies in real estate hedonicwe tested the semilogaritmic form on available data.
4. - Results
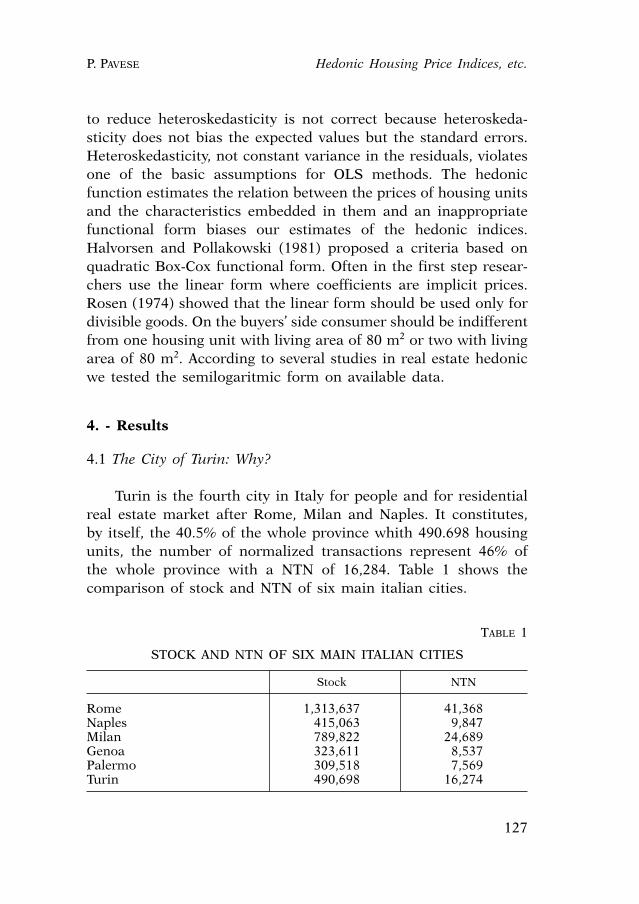
4.1 The City of Turin: Why?
Turin is the fourth city in Italy for people and for residentialreal estate market after Rome, Milan and Naples. It constitutes,by itself, the 40.5% of the whole province whith 490.698 housingunits, the number of normalized transactions represent 46% ofthe whole province with a NTN of 16,284. Table 1 shows thecomparison of stock and NTN of six main italian cities.
Hedonic Housing Price Indices, etc.P. PAVESE
127
TABLE 1
STOCK AND NTN OF SIX MAIN ITALIAN CITIES
Stock NTN
Rome 1,313,637 41,368Naples 415,063 9,847Milan 789,822 24,689Genoa 323,611 8,537Palermo 309,518 7,569Turin 490,698 16,274

4.2 Data and Variables
Data as reported in the Osservatorio del Mercato Immobiliare(OMI) Agenzia del Territorio for the city of Turin. Since 2002OMI has collected semester data in more than 1,500 Italianmunicipalities using standardized housing information data. Thedata span from 2003 to 2007 and the survey is task of Agenziaof Territorio6 using also data from real estate associations. OMIhas collected several prices: the selling price, the estimated priceand the offer price. We use only actual selling price according tothe law 243/2006. The collected data has the advantage of beingunbiased in that it is not influenced by the individual owner asin the Inquiry of National Gross Income of the Bank of Italy. Themain problem is the possibility of selection bias. The followinglist gives a description of original data and the process of variableconstruction.
(a) Location classification:(a1) Downtown core: includes central zones except San Salvario
between Corso Roma, Regina Margherita, Corso Inghilterra;(a2) San Salvario: The characteristics of the houses located at
San Salvario are peculiar but we have the problem about numberof observations;
(a3) North Semi-Central: includes San Donato, Porta Palazzo,Duchessa Iolanda, Palermo;
(a4) South Semi-Central: includes Valentino, Dante, SanSecondo, Galileo Ferraris, De Gasperi, Michelotti, Crimea, SanPaolo, Spina1, Marmolada, Duca d’Aosta;
(a5) North Suburban: includes Spina 3, Euro Torino, Madonnadi Campagna, Spina 4, Docks Dora, Rebaudengo, Corona, BarcaBertolla, Vanchiglia;
(a6) South Suburban: includes Zara, Carducci, Unità d’Italia,Lingotto, Santa Rita, Mirafiori North, Mirafiori South, PozzoStrada and Aereonautica Parella;
(a7) Hill: includes only data from Hill; in the data set, 89%of resale detached houses are located in Hill suburb.
RIVISTA DI POLITICA ECONOMICA NOVEMBER-DECEMBER 2007
128
6 For more information see: www.agenziateritorio.it
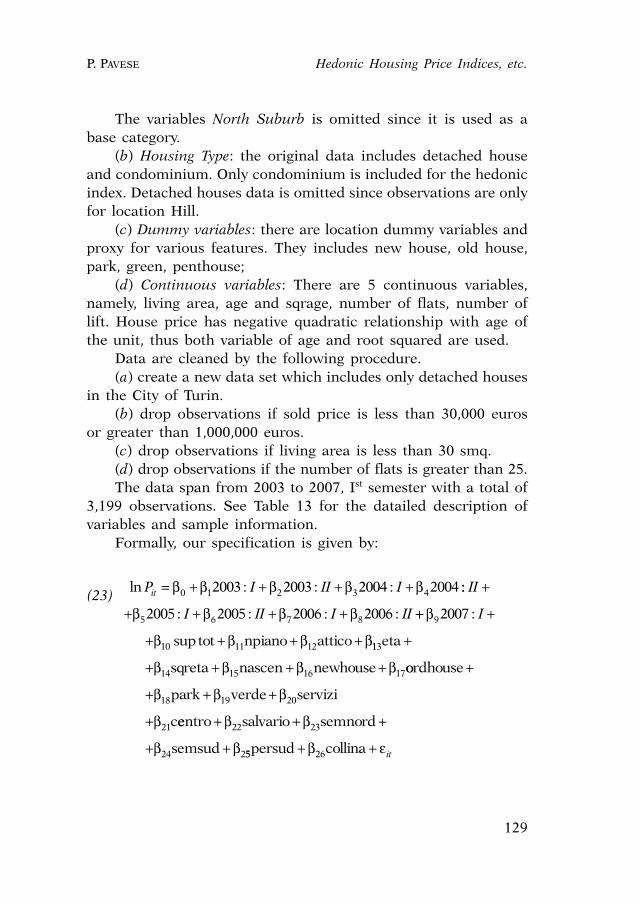
The variables North Suburb is omitted since it is used as abase category.
(b) Housing Type: the original data includes detached houseand condominium. Only condominium is included for the hedonicindex. Detached houses data is omitted since observations are onlyfor location Hill.
(c) Dummy variables: there are location dummy variables andproxy for various features. They includes new house, old house,park, green, penthouse;
(d) Continuous variables: There are 5 continuous variables,namely, living area, age and sqrage, number of flats, number oflift. House price has negative quadratic relationship with age ofthe unit, thus both variable of age and root squared are used.
Data are cleaned by the following procedure. (a) create a new data set which includes only detached houses
in the City of Turin. (b) drop observations if sold price is less than 30,000 euros
or greater than 1,000,000 euros. (c) drop observations if living area is less than 30 smq. (d) drop observations if the number of flats is greater than 25.The data span from 2003 to 2007, Ist semester with a total of
3,199 observations. See Table 13 for the datailed description ofvariables and sample information.
Formally, our specification is given by:
(23)
ln : : :P I II Iit = + + + +β β β β β0 1 2 3 42003 2003 2004 2004 ::
: : : :
II
I II I II
+
+ + + +β β β β5 6 7 82005 2005 2006 2006 ++ +
+ + + +
β
β β β β9
10 11 12
2007 :
sup
I
tot npiano attico 113
14 15 16 17
eta
sqreta nascen newhouse
+
+ + + +β β β β oordhouse
park verde servizi
c
+
+ + +
+
β β β
β18 19 20
21 eentro salvario semnord
semsud
+ + +
+ +
β β
β β22 23
24 255 26persud collina+ +β εit
Hedonic Housing Price Indices, etc.P. PAVESE
129
4.3 Analysis of Results
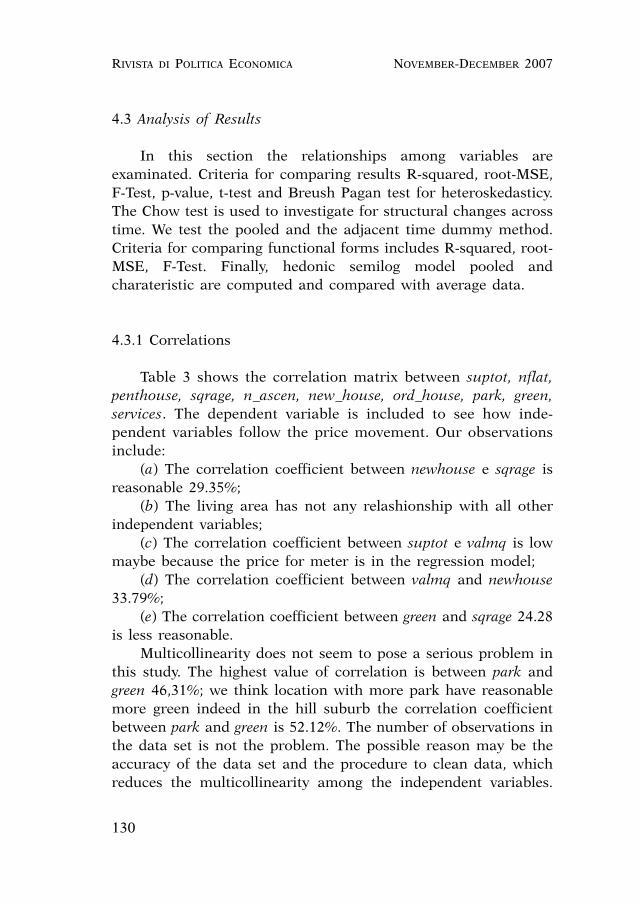
In this section the relationships among variables areexaminated. Criteria for comparing results R-squared, root-MSE,F-Test, p-value, t-test and Breush Pagan test for heteroskedasticy.The Chow test is used to investigate for structural changes acrosstime. We test the pooled and the adjacent time dummy method.Criteria for comparing functional forms includes R-squared, root-MSE, F-Test. Finally, hedonic semilog model pooled andcharateristic are computed and compared with average data.
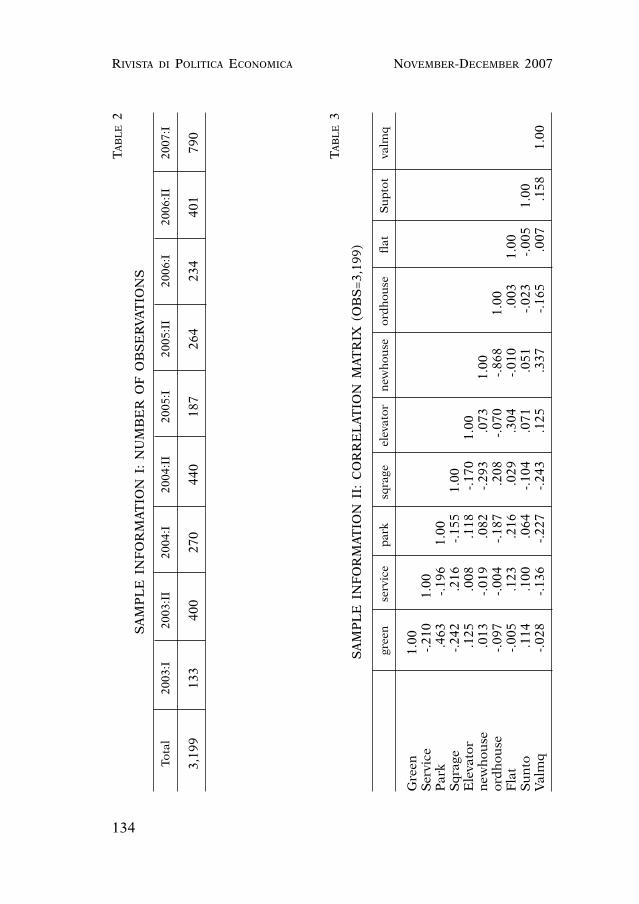
4.3.1 Correlations
Table 3 shows the correlation matrix between suptot, nflat,penthouse, sqrage, n_ascen, new_house, ord_house, park, green,services. The dependent variable is included to see how inde-pendent variables follow the price movement. Our observationsinclude:
(a) The correlation coefficient between newhouse e sqrage isreasonable 29.35%;
(b) The living area has not any relashionship with all otherindependent variables;
(c) The correlation coefficient between suptot e valmq is lowmaybe because the price for meter is in the regression model;
(d) The correlation coefficient between valmq and newhouse33.79%;
(e) The correlation coefficient between green and sqrage 24.28is less reasonable.
Multicollinearity does not seem to pose a serious problem inthis study. The highest value of correlation is between park andgreen 46,31%; we think location with more park have reasonablemore green indeed in the hill suburb the correlation coefficientbetween park and green is 52.12%. The number of observations inthe data set is not the problem. The possible reason may be theaccuracy of the data set and the procedure to clean data, whichreduces the multicollinearity among the independent variables.
RIVISTA DI POLITICA ECONOMICA NOVEMBER-DECEMBER 2007
130
For example Table 8 shows the correlation matrix for the firstsemester of 2007.
4.3.2 Comparing Hedonic and Median Index
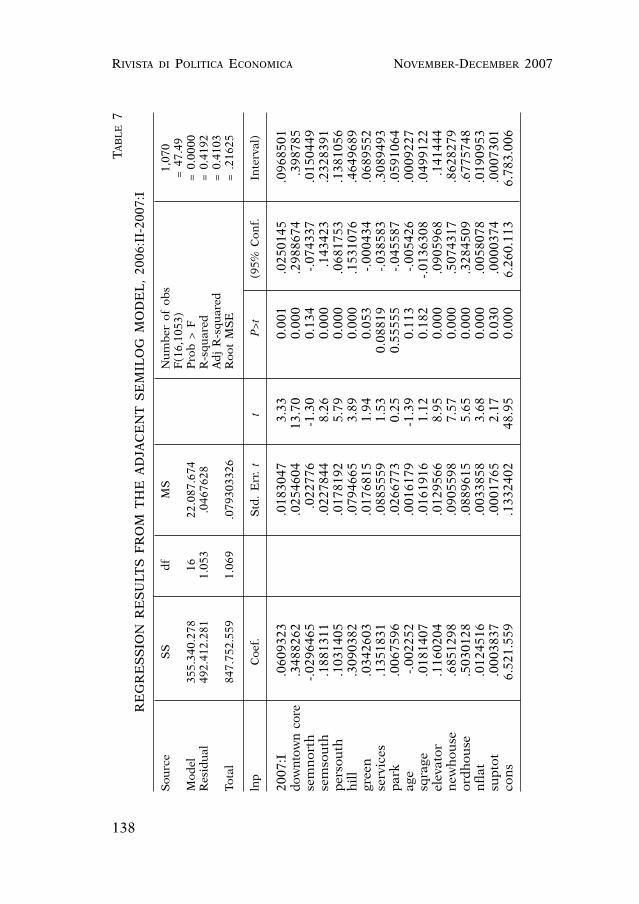
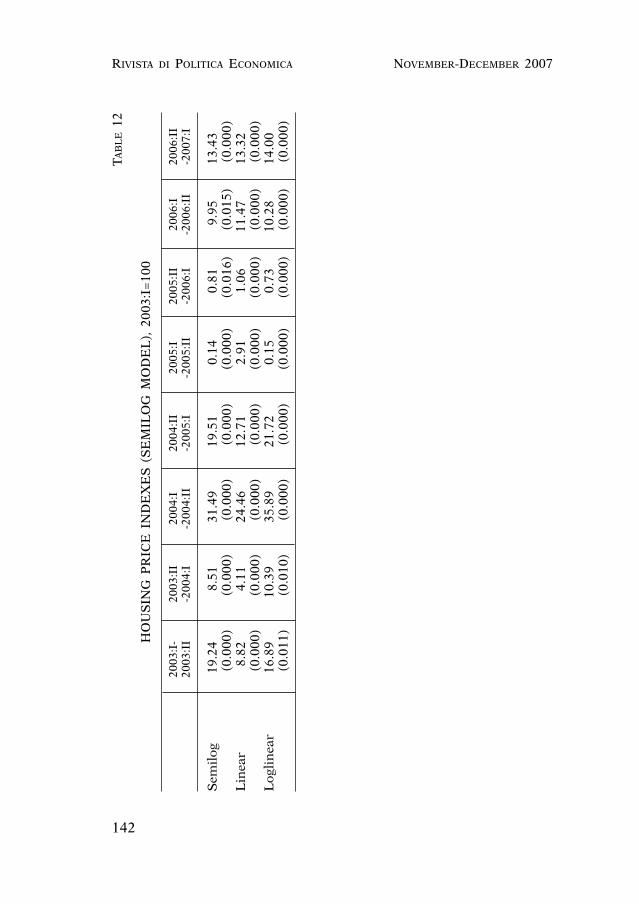
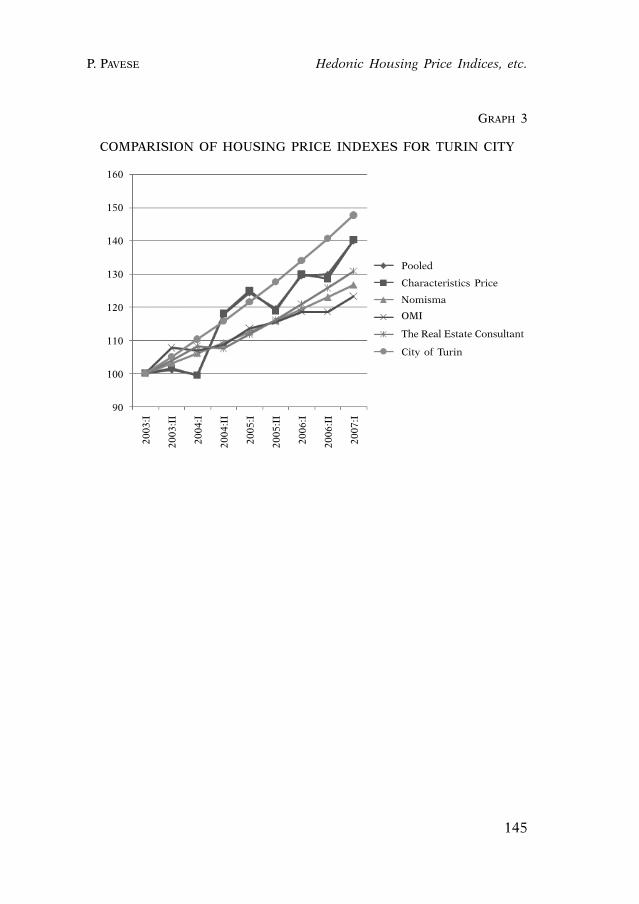
Table 4 shows the sample information, the minimum price is950 euros and the maximum is 6,000 euros. Table 5 shows theresults for the pooled regression for the semilog model. Robuststandard errors of the estimated coefficients accounting forheteroskedasticity are obtained, Table 12 shows the results ofBreusch-Pagan test. For the dummy variables all the individual t-statistics are significant at the 5% significance level. All thelocation dummy variables have negative signs because Perifericanord is used as a base category. Using as a criteria the p - valuethe regression coefficients are statistically significant at the levelof 95% except san_salvario; we think it for the small observation’snumber. All the coefficients have expected signs except the variablegreen. R-squared is 0.5885 and R-squared adjusted is 0.5887 aremoderate. After we run an adjacent year regression which includesone time dummy variable that distinguishes the two periods withthe same results. Table 7 shows, for example, the period 2006:II-2007:I. Some coefficients are not statistically significant probablyrelation to size of the sample (1,070). The semilog model best fitsthe data as it is shown in Table 9 and in Table 10. Based on Chowtest as reported on Table 11 there are not structural changes ondata so we can use pooled semilog method. Graph 2 shows thetrends of the hedonic housing price index obtained withsemilogartimic pooled and characteristics price method (Fisherand Laspeyres formula) and the results are reported in Table 6.All of these three hedonic methods produce identical trends, butLaspeyres price index imposes the upper limit consistent with theliterature. The average index absorbs the variations and between2005 and 2007 is lower than hedonic which better controls for thequality variation. The variation of the prices in the consideredperiod turns out to be 40.01% and it does not seem to arrest itself,in spite of the forecasts of the analysts not even in first semester
Hedonic Housing Price Indices, etc.P. PAVESE
131
2007. Comparing the results with panel data of “ConsulenteImmobiliare” of il Sole24ore, Nomisma we see some relevantdifference, the comparision of housing price indexes are reportedin Graph 3. The data of Osservatorio di Torino are the highest,Nomisma and OMI the lowest.
5. - Conclusions
This paper brings together two assumptions: the notableattention given by the statistic agency to hedonic methods and thepublic database information. We tested both time dummy andcharacteristic price, highlighting the likeness of both methods. Thesemilogaritmic form best fit to data, according to main hedonicstudies of the real estate sector, it gives similar results both withdummy method and pooled method. It appears obvious, for theapplication of a real estate price index, the necessity of anextension to the regional and national level. The possible lines ofdevelopment of this study are the production of batteries of indicesat the provincial level and tested the robustness of the data andadopted a system of weights we can produce indices for theresidential field on a national level. Finally, it could be interestingto test the local spatial effect with spatial models and to test thespatial correlation between the error terms.
RIVISTA DI POLITICA ECONOMICA NOVEMBER-DECEMBER 2007
132

APPENDIX
Hedonic Housing Price Indices, etc.P. PAVESE
133
FIGURE 1
THE CITY OF TURIN: LOCATION CLASSIFICATION
North Semi-Central
Downtown Core
South Suburb
North Suburb
Hill
South Semi-Central
RIVISTA DI POLITICA ECONOMICA NOVEMBER-DECEMBER 2007
134
TA
BL
E2
SA
MP
LE
IN
FO
RM
AT
ION
I:
NU
MB
ER
OF
OB
SE
RV
AT
ION
S
Tota
l20
03:I
2003
:II
2004
:I20
04:I
I20
05:I
2005
:II
2006
:I20
06:I
I20
07:I
3,19
913
340
027
044
018
726
423
440
179
0
TA
BL
E3
SA
MP
LE
IN
FO
RM
AT
ION
II:
CO
RR
EL
AT
ION
MA
TR
IX (
OB
S=
3,19
9)
gree
nse
rvic
ep
ark
sqra
geel
evat
orn
ewh
ouse
ord
hou
sefl
atS
up
tot
valm
q
Gre
en1.
00S
ervi
ce-.
210
1.00
Par
k.4
63-.
196
1.00
Sqr
age
-.24
2.2
16-.
155
1.00
Ele
vato
r.1
25.0
08.1
18-.
170
1.00
new
hou
se.0
13-.
019
.082
-.29
3.0
731.
00or
dh
ouse
-.09
7-.
004
-.18
7.2
08-.
070
-.86
81.
00F
lat
-.00
5.1
23.2
16.0
29.3
04-.
010
.003
1.00
Su
nto
.114
.100
.064
-.10
4.0
71.0
51-.
023
-.00
51.
00V
alm
q-.
028
-.13
6-.
227
-.24
3.1
25.3
37-.
165
.007
.158
1.00

Hedonic Housing Price Indices, etc.P. PAVESE
135
TABLE 4
SAMPLE INFORMATION III: VARIABLE SUMMARY
Variables Summary Value
Valmq Media 1,875.08Std.dev 645.43Minimum 945.00Maximum 6,469.00
suptot Media 103.85Std.dev 78.10Minimum 12.00Maximum 360.00
Flat Media 0.14Std.dev 0.10Minimum 0.00Maximum 11.00
penthouse Media 0.25Std.dev 0.15Minimum 0.00Maximum 1.00
elevator Media 0.06Std.dev 0.04Minimum 0.00Maximum 8.00
age Media 29.91Std.dev 0.89Minimum 1.00Maximum 112.00
green Media 0.47Std.dev 0.49Minimum 0.00Maximum 1.00
Services Media 0.37Std.dev 0.29Minimum 0.00Maximum 1.00

RIVISTA DI POLITICA ECONOMICA NOVEMBER-DECEMBER 2007
136
TABLE 5
REGRESSION RESULTS FROM SEMILOG MODEL
Robust standard errors,Number of obs = 3,199F (22, 1884)=12246Prob > F = 0.00000R-squared = 0.5887Adj R-squared = 0.5885Root MSE = .23261
lnp Coef. Robust. t P>t (95% Conf. Interval)Std. Err.
2003:I -.0869587 .0419532 -2.07 0.038 -.1692383 -.00467912003:II -.2110567 .0359539 -5.87 0.000 -.2815703 -.14054312004:I -.2347592 .0362724 -6.47 0.000 -.3058975 -.16362082004:II 0.0498288 .0375026 2.33 0.016 -.0237222 .12337982005:I 0.28999 .004089 10.43 0.000 .36578 .3816572005:II .1295655 .0359353 5.16 0.000 .0590882 .20004272006:I .1171842 .0372957 3.14 0.002 .044039 .19032932006:II .1594054 .0333753 3.22 0.000 .093949 .22486182007:I .2372293 .0332466 7.14 0.000 .1720253 .3024333downtowncore .5146694 .0186165 27.65 0.000 .4781583 .5511804salvario .0035176 .052569 0.07 4.57 -.099582 .1066171semnord .0295014 .0203731 2.45 0.000 -.0104548 .0694576semsud .3226514 .0169452 19.04 0.000 .2894181 .3558848persud .1291854 .0151755 8.51 0.000 .0994228 .158948hill .466898 .052706 4.55 0.000 .3635298 .5702662green -.0026776 .0127632 -4,67 0.000 -.0277092 .022354services .0641992 .0268181 -2.39 0.017 -.1167956 -.0116028sqrage .0191794 .0039893 -4.81 0.000 -.0270034 -.0113554elevator .0802965 .0093784 8.56 0.000 .0619034 .0986897newhouse .4002738 .0330003 12.13 0.000 .3355528 .4649948ordhouse .2053156 .0300877 3.06 0.000 .1463069 .2643243nflat .0133284 .0027578 4.83 0.000 .0079197 .018737suptot .000049 .0000591 3.4 0.000 -.0000669 .000165

Hedonic Housing Price Indices, etc.P. PAVESE
137
TABLE 6
HOUSING PRICE INDEXES, (SEMILOG MODEL), 2003:I=100
Semester Pooled Laspeyres Fisher Average
2003:I 100 100 100 1002003:II 101.05 101.56 101.45 107.7
(0.000) (0.001) (0.000) (0.000)2004:I 99.69 99.45 98.99 107.00
(0.000) (0.000) (0.000) (0.000)2004:II 117.88 118.02 117.34 108.70
(0.015) (0.016) (0.005) (0.000)2005:I 124.41 125.01 124.45 113.60
(0.000) (0.000) (0.000) (0.000)2005:II 119.66 118.89 118.23 115.60
(0.000) (0.000) (0.000) (0.000)2006:I 129.54 129.89 129.23 118.60
(0.000) (0.000) (0.000) (0.000)2006:II 129.95 128.56 130.11 118.60
(0.000) (0.000) (0.000) (0.000)2007:I 140.10 140.23 140.99 123.20
(0.000) (0.015) (0.000) (0.000)
RIVISTA DI POLITICA ECONOMICA NOVEMBER-DECEMBER 2007
138
TA
BL
E7
RE
GR
ES
SIO
N R
ES
ULT
S F
RO
M T
HE
AD
JAC
EN
T S
EM
ILO
G M
OD
EL
, 20
06:I
I-20
07:I
Sou
rce
SS
df
MS
Nu
mb
er o
f ob
s1,
070
F(1
6,10
53)
= 4
7.49
Mod
el35
5.34
0.27
816
22.0
87.6
74P
rob
> F
= 0
.000
0R
esid
ual
492.
412.
281
1.05
3.0
4676
28R
-squ
ared
= 0
.419
2A
dj
R-s
quar
ed=
0.4
103
Tota
l84
7.75
2.55
91.
069
.079
3033
26R
oot
MS
E=
.21
625
lnp
Coe
f.S
td.
Err
. t
tP
>t
(95%
Con
f.In
terv
al)
2007
:I.0
6093
23.0
1830
473.
330.
001
.025
0145
.096
8501
dow
ntow
n co
re.3
4882
62.0
2546
0413
.70
0.00
0.2
9886
74.3
9878
5se
mn
orth
-.02
9646
5.0
2277
6-1
.30
0.13
4-.
0743
37.0
1504
49se
mso
uth
.188
1311
.022
7844
8.26
0.00
0.1
4342
3.2
3283
91p
erso
uth
.103
1405
.017
8192
5.79
0.00
0.0
6817
53.1
3810
56h
ill
.309
0382
.079
4665
3.89
0.00
0.1
5310
76.4
6496
89gr
een
.034
2603
.017
6815
1.94
0.05
3-.
0004
34.0
6895
52se
rvic
es.1
3518
31.0
8855
591.
530.
0881
9-.
0385
83.3
0894
93p
ark
.006
7596
.026
6773
0.25
0.55
555
-.04
5587
.059
1064
age
-.00
2252
.001
6179
-1.3
90.
113
-.00
5426
.000
9227
sqra
ge.0
1814
07.0
1619
161.
120.
182
-.01
3630
8.0
4991
22el
evat
or.1
1602
04.0
1295
668.
950.
000
.090
5968
.141
444
new
hou
se.6
8512
98.0
9055
987.
570.
000
.507
4317
.862
8279
ord
hou
se.5
0301
28.0
8896
155.
650.
000
.328
4509
.677
5748
nfl
at.0
1245
16.0
0338
583.
680.
000
.005
8078
.019
0953
sup
tot
.000
3837
.000
1765
2.17
0.03
0.0
0003
74.0
0073
01co
ns
6.52
1.55
9.1
3324
0248
.95
0.00
06.
260.
113
6.78
3.00
6

Hedonic Housing Price Indices, etc.P. PAVESE
139
TA
BL
E8
CO
RR
EL
AT
ION
MA
TR
IX 2
007:
I
gree
nse
rvic
esp
ark
sqra
geel
evat
orn
ewh
ouse
ord
hou
sen
flat
sup
tot
valm
q
gree
n1.
000
serv
ices
-.08
71.
000
par
k0.
230
-.12
11.
000
sqra
ge-.
1676
0.21
5-.
167
1.00
0el
evat
or0.
732
0.26
4.2
81-0
.213
1.00
0n
ewh
ouse
0.00
5-0
.636
0.25
9-0
.248
.005
1.00
0or
dh
ouse
-.00
20.
427
-.03
30.
169
0.00
4-0
.098
1.00
0n
flat
0.00
10.
496
-.00
6-0
.003
0.22
5-0
.042
0.31
01.
000
sup
tot
0.20
4-.
0981
.112
-0.2
110.
205
-0.0
090.
085
0.80
4.0
00va
lmq
0.13
2-0
.010
0.14
7-0
.134
0.21
60.
202
-0.2
633
0.11
4 0.
184
.000

RIVISTA DI POLITICA ECONOMICA NOVEMBER-DECEMBER 2007
140
TABLE 9
MODEL SELECTION STATISTICS
Period Parameter linear semilog Loglin
2003:I-2003:II R-squared 0.6885 0.6817 0.682Adj R-squared 0.664 0.6566 0.6569Root MSE 360.36 0.2548 0.2547F 28.05 27.17 27.21
2003:I-2004:II R-squared 0.8482 0.8653 0.8663Adj R-squared 0.8399 0.858 0.859Root MSE 269.57 0.1734 0.172F 102.79 118.21 119.18
2004:I-2004:II R-squared 0.7214 0.7031 0.6982Adj R-squared 0.7037 0.6943 0.679Root MSE 434.74 0.2696 0.2718F 40.79 37.3 36.43
2004:II-2005:I R-squared 0.6331 0.4916 0.4812Adj R-squared 0.6002 0.446 0.4346Root MSE 448.58 0.2673 0.2701F 19.21 10.77 10.33
2005:I-2005:II R-squared 0.8429 0.8266 0.8471Adj R-squared 0.8311 0.8136 0.8356Root MSE 257.69 0.1337 0.1256F 71.55 63.57 73.87
2005:II-2006:I R-squared 0.7554 0.7544 0.759Adj R-squared 0.7408 0.7398 0.7447Root MSE 312.954 0.1544 0.153F 51.87 51.61 52.91
2006:I-2006:II R-squared 0.5941 0.6193 0.6124Adj R-squared 0.5768 0.6031 0.5958Root MSE 329.06 0.1586 0.1601F 34.3 38.13 37.03
2006:II-2007:I R-squared 0.4015 0.4192 0.4174Adj R-squared 0.3924 0.4085Root MSE 452.24 0.2165 0.2165F 44.15 42.07 47.15

Hedonic Housing Price Indices, etc.P. PAVESE
141
TA
BL
E10
RE
GR
ES
SIO
N R
ES
ULT
S F
OR
ST
UC
TU
RA
L F
OR
MS
2003
:II
2004
:I20
04:I
I20
05:I
2005
:II
2006
:I20
06:I
I20
07:I
Sem
ilog
0.11
0-0
.034
0.24
3-0
.097
0.20
40.
028
0.01
40.
061
(0.0
00)
(0.0
10)
(0.0
00)
(0.0
09)
(0.0
10)
(0.0
15)
(0.0
00)
(0.0
00)
Lin
-140
.23
-35.
7532
5.91
-284
.62
-18.
5715
.51
40.1
616
3.16
(0.0
00)
(0.0
16)
(0.0
00)
(0.0
00)
(0.0
08)
(0.0
00)
(0.0
00)
(0.0
00)
Log
lin
-0.0
97-0
.032
0.28
3-0
.103
-0.0
400.
026
0.01
70.
062
(0.0
00)
(0.0
00)
(0.0
00)
(0.0
15)
(0.0
16)
(0.0
00)
(0.0
00)
(0.0
00)
TA
BL
E11
CH
OW
TE
ST
FO
R S
TR
UC
TU
RA
L C
HA
NG
E
2003
:I-
2003
:II
2004
:I20
04:I
I20
05:I
2005
:II
2006
:I20
06:I
I20
03:I
I-2
004:
I-2
004:
II-2
005:
I-2
005:
II-2
006:
I-2
006:
II-2
007:
I
Sem
ilog
27.1
711
8.21
37.3
10.7
763
.57
51.6
138
.13
47.4
9(0
.000
)(0
.000
)(0
.000
)(0
.000
)(0
.000
)(0
.000
)(0
.000
)(0
.000
)
RIVISTA DI POLITICA ECONOMICA NOVEMBER-DECEMBER 2007
142
TA
BL
E12
HO
US
ING
PR
ICE
IN
DE
XE
S (
SE
MIL
OG
MO
DE
L),
200
3:I=
100
2003
:I-
2003
:II
2004
:I20
04:I
I20
05:I
2005
:II
2006
:I20
06:I
I20
03:I
I-2
004:
I-2
004:
II-2
005:
I-2
005:
II-2
006:
I-2
006:
II-2
007:
I
Sem
ilog
19.2
48.
5131
.49
19.5
10.
140.
819.
9513
.43
(0.0
00)
(0.0
00)
(0.0
00)
(0.0
00)
(0.0
00)
(0.0
16)
(0.0
15)
(0.0
00)
Lin
ear
8.82
4.11
24.4
612
.71
2.91
1.06
11.4
713
.32
(0.0
00)
(0.0
00)
(0.0
00)
(0.0
00)
(0.0
00)
(0.0
00)
(0.0
00)
(0.0
00)
Log
lin
ear
16.8
910
.39
35.8
921
.72
0.15
0.73
10.2
814
.00
(0.0
11)
(0.0
10)
(0.0
00)
(0.0
00)
(0.0
00)
(0.0
00)
(0.0
00)
(0.0
00)

Hedonic Housing Price Indices, etc.P. PAVESE
143
GRAPH 2
HOUSING PRICE INDEXES (SEMILOG MODEL), 2003:I=100
Pooled Laspeyres Fisher Medio
150
140
130
120
110
100
90
0 2 4 6 8 10
RIVISTA DI POLITICA ECONOMICA NOVEMBER-DECEMBER 2007
144
TABLE 13
VARIABLE DESCRIPTION
Variable Description
price Sale price valmq Sale price for sqm (euro/sqm) Tot surface Total square footage in the unit (mq) nflat number of flat penthouse If flat is penthouse=1, otherwise=0 age age of housing unit sqrage roor squared of housing unit elevator If the unit is in a property building with an elevator newhouse* If unit’s age is zero=1, otherwise=0 ordhouse If the conservation of unit is normal=1,
otherwise=0 park If number of garage is not zero=1, otherwise=0 green If unit has an indoor or outdoor green (500m)=1,
otherwise=0 services If shopping center or kindergarten or school is
nearby (500m) =1, otherwise=0 downtown core** If unit is located at Downtown core=1, otherwise=0 salvario If unit is located at San Salvario=1, otherwise=0 North Semi-Central If unit is located at North Semi-Central=1,
otherwise=0 South Semi-Central If unit is located at South Semi-Central=1,
otherwise=0 South Suburb If unit is located at South Suburb=1, otherwise=0 hill If unit is located at Hill suburb=1, otherwise=0 2003:I If unit is sold in the first semester 2003=1,
otherwise=0 2003:II If unit is sold in the second semester 2003=1,
otherwise=0 2004:I If unit is sold in the first semester 2004=1,
otherwise=0 2004:II If unit is sold in the second semester 2004=1,
otherwise=0 2005:I If unit is sold in the first semester 2005=1,
otherwise=0 2005:II If unit is sold in the second semester 2005=1,
otherwise=0 2006:I If unit is sold in the first semester 2006=1,
otherwise=0 2006:II If unit is sold in the second semester 2006=1,
otherwise=0 2007:I If unit is sold in the first semester 2007=1,
otherwise=0
*Note: The variable oldhouse is omitted since it is used as a base category. **Note: The variable North Suburb is omitted since it is used as a base category.
Hedonic Housing Price Indices, etc.P. PAVESE
145
GRAPH 3
COMPARISION OF HOUSING PRICE INDEXES FOR TURIN CITY
Pooled
Characteristics Price
Nomisma
OMI
City of Turin
The Real Estate Consultant
160
150
140
130
120
110
100
90
2003
:I
2003
:II
2004
:I
2004
:II
2005
:I
2005
:II
2006
:I
2006
:II
2007
:I
BIBLIOGRAPHY
ASHENFELTER O. - GRADDY K., «Auctions and the Price of Art», Journal of Econo-mic Literature, vol. 41, 2003, pages 763-87.
BAILEY M.J. - MUTH R.F. - NOURSE H.O., «A Regression Method for Real Estate Pri-ce Index Construction», Journal of the American Statistical Association, vol. 58,December, 1963, pages 933-944.
BARZYK F., «Updating the Hedonic Equation for the Price of Computer», WorkingPaper of Statistics Canada, Price Division, November, 1999.
BERNDT E.R., «The U.S. Pharmaceutical Industry: Why Significant Growth in Ti-mes of Cost Containement?», Health Affairs, March/April, 2001.
BERNDT E.R. - GRILICHES Z., «Price Indexes for Microcomputer: An ExploratoryStudy», in FOSS M.F. - MANSER M.E. - YONG A.H. (eds.), Price Measurement andtheir Uses: Studies in Income and Wealth, The University of Chicago Press, 1993.
BLACKLEY D.M. - FOLLAIN J.R. - LEE H., «An Evaluation of Hedonic Price Indexesfor Thirty-four Large SMSAs», AREUEA Journal, vol. 14 (2), 1986, pages 179-205.
BOSKIN M.J. - DULBERGER E.R. - GORDON R.J. - GRILICHES Z. - JORGENSON D., «Towarda More Accurate Mesure of the Cost of Living, Final Report to the Senate Fi-nance Committee», in Advisory Commission to Study the Consumer Price Index,no. 4, 1996.
BOX G.E.P. - COX D.R. «An Analysis of Transformations», Journal of the Royal Sta-tistical Society, Series B (Methodological), no. 26 (2), 1964, pages 211-252.
BRACHINGER H.W., «Statistical Theory of Hedonic Price Indices», Department ofQuantitative Economics, University of Freiburg/Fribourg Switzerland, WorkingPaper, 2002.
CAN A. - MEGBOLUGBE I., «Spatial Dependence and House Price Index Construc-tion», Journal of Real Estate Finance and Economics, no. 14 (1-2), 1997, pages203-222.
CANDELA G. - SCORCU A., «A Price Index for Art Market Auction», Journal of Cul-tural Economics, vol. 21, no. 3, 1997, pages 175-196.
CASE B. - POLLAKOWSKI H.O. - WACHTER S., «On Choosing among House Price In-dex Methodologies», AREUEA Journal, no. 19 (3), 1991, pages 286-307.
— — - — — - — —, «Frequency of Transaction and House Price Modelling», Jour-nal of Real Estate Finance and Economics, no. 14 (1-2), 1997 pages 173-187.
CASE B. - QUIGLEY J., «The Dynamics of Real Estate Prices», Review of Economicsand Statistics, no. 73 (1), 1991, pages 50-58.
CASE B. - QUIGLEY J. - SHILLER R., «Comparing Wealth Effects: The Stock Marketversus the Housing Market», Advances in Macroeconomics, vol. 5, Issue 1, Ar-ticle 1, 2005.
CASE B. - SZYMANOSKI E., «Precision in House Price Indices: Findings of a Com-parative Study of House Price Index Methods», Journal of Housing Research,no. 6, 1985, pages 483-496.
CASE K.E. - SHILLER R., «Prices of Single-Family Homes Since 1970: New Indexesfor Four Cities», New England Economic Rewiew, Federal Reserve Bank of Bo-ston, Issue Sept., 1987, pages 45-56.
CASSEL E. - HENDELSOHN R., «The Choice of Functional Forms for Hedonic PriceEquations: Comment», Journal of Urban Economics, vol. 18, 1985, pages 135-142.
RIVISTA DI POLITICA ECONOMICA NOVEMBER-DECEMBER 2007
146

CHANEL O. - VARET L.A., Auction Theory and Practise Evidence from Market for Jewel-lery, G.R.E.Q.A.M. 96B05, Universitè Aix-Marseille, 1996.
CHOW G., «Tests of Equality Between Sets of Coefficients in Two Linear Regres-sions», Econometrica, vol. 28 (3), 1960, pages 591-605.
COLOMBINO U. - LOCATELLI-BIEY M., «Disponibilità a pagare per le aree verdi e sti-ma dei benefici derivanti da un loro ampliamento. Un’applicazione del metododei prezzi edonici», Quaderni del dipartimento di Economia dell’Università di To-rino, no. 4, 1995.
COMBRIS P. - LECOCQ S. - VISSIER M., «Estimation for a Hedonic Price Equation forBordeaux Wine: Does Quality Matter?», Economic Journal, Royal Economic So-ciety, vol. 107 (441), 1997, pages 390-402.
COURT A.T., «Hedonic Price Indexes with Automotive Examples», in The Dynamicsof Automobile Demand, General Motors Corporation, New York, 1939, pages 99-117.
DIEWERT E., «Hedonic Regression: A Consumer Theory Approach», in FEENSTRA R.- SHAPIRO M. (eds.), Income and Wealth, vol. 64, in Scanner Data and Price In-dexes, Conference on Research, The University of Chicago Press, 2003, pages317-348.
DREIMAN H. - PENNINGTON-CROSS A., «Alternative Methods of Increasing the Preci-sion of Weighted Repeat Sales House Price Indices», Journal of Real Estate Fi-nance and Economics, Springler, vol. 28 (4), 2004, pages 299-317.
GRILICHES Z., Hedonic Price Indexes for Automobiles: An Econometric Anaysis ofQuality Change, hearings in the US Congress, 1971.
— —, «Patent Statistics as Economic Indicators: A Survey», Journal of EconomicLiterature, vol. 28 (4), 1990, pages 16671-1707.
GUJARATI D., Basic Econometrics, 3rd Edition, New York, Mc Graw- Hill, 1995, pa-ges 987-1011.
HALVORSEN R. - POLLAKOWSKI O., «Choice of Functional Form for Hedonic PriceEquations», Journal of Urban Economics, vol. 10 (1), 1981, pages 37-49.
HECKMANN J., «Sample Selection Bias as a Specification Error», Econometrica, vol.47 (1), 1979, pages 153-161.
HULTEN C., «Price Hedonics: A Critical Review», Economic Policy Review, no. 9,2003, pages 5-15.
ILO IMF, OECD, UNECE, EUROSTAT, THE WORLD BANK (eds.), Consumer Price IndexManual: Theory and Practice, International Labour Office, Geneva, 2004.
LANCASTER K., «A New Approach to Consumer Theory», Journal of Political Eco-nomy, vol. 82, 1964, pages 34-55.
LAFERRERE A. «Hedonic Housing Price Indices: the french experience», Working Pa-per, in OECD-IMF, Workshop Real Estate Price Indexes, November 6-7, 2006,OECD Publishing, 2006.
LI W. - PRUD’HOMME M. «Studies in Hedonic Resale Housing Price Indexes»,Working Paper, in OECD-IMF, Workshop Real Estate Price Indexes, November 6-7, 2006, OECD Publishing, 2006.
LOCATELLI-BIEY M. - ZANOLA R., «The Market for Picasso Print: An Hybrid ModelApproach», Department of Public Policy and Public Choice, Università del Pie-monte Orientale, Working Paper, Alessandria, 2003.
— — - — —, «The Market for Sculptures: An Adjacent Year Regression Index», De-partment of Public Policy and Public Choice, Università del Piemonte Orienta-le, Working Paper, Alessandria, 2003.
Hedonic Housing Price Indices, etc.P. PAVESE
147

MAGGI R., Immobilienmarkt Zürich: Immobilienpreise und Bauninvestitionen unterder Lupe, Zürich, Zürcher Kantonalbank, 2006.
MARK J. - GOLDBERG M., «Alternative Housing Price Indices: An Evaluation», RealEstate Economics, vol. 12 (1), 1984, pages 30-49.
MCDONALD J., «The Use of Proxy Variables in Housing Price Analysis», Journal ofthe Urban Economics, no. 7, 1963, pages 75-83.
NERLOVE M., «Hedonic Price Functions and the Measurement of Preferences. TheCase of Swedish Wine Consumers», European Economics Review, no. 3, 1995,pages 134-167.
ROSEN S., «Hedonic Price and Implicit Markets: Product Differentiation in PureCompetition», Journal of Political Economy, vol. 82 (1), January-February, 1974,pages 34-55.
SAARNIO M., «Housing Price Statistics at Statistics Finland», Statistics Finland,Working Paper, in OECD-IMF, Workshop Real Estate Price Indexes, November 6-7, 2006, OECD Publishing, 2006.
SCHULTZE C. - MACKIE C., «At What Price? Conceptualizing and Measuring Cost-of-Living and Price Indexes. The Use of Proxy Variables in Housing Price Analy-sis», Panel on Conceptual, Measurement, and Other Statistical Issues in develo-ping Cost-of-Living, Committee on National Statistics, National Research Coun-cil, National Academy Press, 1963.
SILVER M. - HERAVI S., «Scanner Data and the Measurement of Inflation», RoyalEconomic Society, vol. 111 (472), 2001, pages 383-404.
TREWIN D., «A Guide to House Price Indexes: Australia», Australian Bureau of Sta-tistics, Working Paper, in OECD-IMF, Workshop Real Estate Price Indexes, No-vember 6-7, 2006, OECD Publishing, Room Document 2, 2006.
TRIPLETT J.E., «Hedonic Method in Statistical Agency Environments: An Intellec-tual Biopsy», in BERNDT E.R. - TRIPLETT J.E. (eds.), Fifty Years of Economic Mea-surement: The Jubilee of the Conference on Research in Income and Wealth, Chi-cago, University of Chicago Press for the National Bureau of Economic Re-search, 1990.
— —, Handbook on Hedonic Indexes and Quality Adjustmente in Price Indexes,OECD Publishing, 2004.
VINHAY D. - LALL D. «Housing Price Indexes for India», Working Paper, in OECD-IMF, Workshop Real Estate Price Indexes, November 6-7, 2006, OECD Publishing,2006.
DER WAL V. - TER STEEGE D., «House Price Indices in the Netherlands», StatisticsFinland, Working Paper, in OECD-IMF, Workshop Real Estate Price Indexes, No-vember 6-7, 2006, OECD Publishing, 2006.
WANG F. - ZORN P., «Estimating House Price Growth with Repeat Sales Data: What’sthe Aim of the Game?», Journal of Housing Economics, vol. 6 (2), 1997, pages93-118.
WOOLDRIDGE J., Introductory Econometrics: A Modern Approach, South-Western Col-lege Publishing, 1999.
RIVISTA DI POLITICA ECONOMICA NOVEMBER-DECEMBER 2007
148