Stereotype Threat and Job Performance:Role of Hedonic ...
260
Stereotype Threat and Job Performance:Role of Hedonic Wellbeing, Coping Strategy and Workplace Ostracism among Teachers A Thesis Submitted to For the award of DOCTOR OF PHILOSOPHY IN EDUCATION By ALMAAS SULTANA 41500106 Supervised By DR. VIJAY KUMAR CHECHI LOVELY FACULTY OF BUSINESS AND ARTS LOVELY PROFESSIONAL UNIVERSITY PUNJAB 2019
-
Upload
khangminh22 -
Category
Documents
-
view
4 -
download
0
Transcript of Stereotype Threat and Job Performance:Role of Hedonic ...
Stereotype Threat and Job Performance:Role of Hedonic
Wellbeing, Coping Strategy and Workplace Ostracism
among Teachers
A
Thesis
Submitted to
For the award of
DOCTOR OF PHILOSOPHY
IN
EDUCATION
By
ALMAAS SULTANA
41500106
Supervised By
DR. VIJAY KUMAR CHECHI
LOVELY FACULTY OF BUSINESS AND ARTS
LOVELY PROFESSIONAL UNIVERSITY
PUNJAB
2019
ii
DECLARATION
I, Almaas Sultana, hereby declare that the work presented herein is genuine,
work done originally by me and has not been published or submitted elsewhere for
the requirement of a degree programme. Any literature data or work done by others
cited in this dissertation has been given due acknowledgment and listed in the
reference section.
Almaas Sultana
Reg. No. 41500106
School of Education
Lovely Professional University
Phagwara, Punjab, India.
Dated: _______________
iii
CERTIFICATE
This is to certify that the dissertation titled “Stereotype Threat and Job
Performance: Role of Hedonic Wellbeing, Coping Strategy and Workplace
Ostracism among Teachers” carried out by Ms. Almaas Sultana D/o Md. Aslam
and Rukhsana Siddiqui have been accomplished as a duly registered Ph.D. research
scholar of Lovely Professional University (Phagwara), under my guidance and
supervision. This dissertation is being submitted by her in the partial fulfillment of
the requirements for the award of the Doctor of Philosophy in Education from
Lovely Professional University.
Her dissertation represents his original work and is worthy of consideration
for the award of the degree of Doctor of Philosophy.
Dr. Vijay Kumar
(Supervisor)
Professor
School of Education
Lovely Profession University
Phagwara, Punjab, India
Dated : ________________
iv
ACKNOWLEDGMENT
This research work required a lot of effort. It required high concentration
and the whole hearted support without which it would not have been possible to
accomplish the task at hand. Thanks to Almighty Allah (Glory to thee), whose
Mercy, Blessing and Compassion have guided me to this stage.
I express my sincere thanks to my esteemed supervisor Dr. Vijay Kumar
Chechi for his guidance, motivation, and encouragement during the course of the
programme. I want to extend my sincere gratitude to the School of Education, LPU
especially Prof. Sanjay Modi and Prof. P.P.Singh for their valuable suggestions
during the course of this research programme.
I would like to extend my gratitude to Prof. K.S.Misra, Allahabad University
and Prof R.C. Tripathi of Banaras Hindu University for their valuable insights and
suggestions. I wish to express my sincere appreciation to Ishita Mallick, Dr.Rayees
Farooq, Irfan Bashir and Komal Sharma for their continuous support.
I am also thankful to non-teaching staffs of the school of education for
extending their support during my stay in the department and I would like to extend
special thanks to the staffs of Library of School of Education, LPU.
I would like to extend my gratitude to my brothers Md Shahabuddin Aslam
(elder brother) and Md Shuaibuddin Aslam (elder brother) for their constant
support and motivation. I owe my deep sense of gratitude to my parents Md Aslam
(Father) and Rukhsana Siddiqui (Mother), who were a source of unlimited strength
to me, and provided constant motivation and encouragement. I would like to
dedicate my thesis to ‘Almighty God’ who always helped me through thick and thin.
Almaas Sultana
v
ABSTRACT
This study explored the influence of stereotype threat on job performance of
the teachers with Hedonic wellbeing, coping strategy and workplace ostracism as
mediators. The experience of stereotype threat negatively impacts the performance
of individuals. Mostly people are judged because of negative or deleterious
stereotypes prevalent related to one’s social-identity. Every individual is associated
with at least one social identity. Individuals’ group membership(s) includes one’s
ethnicity, race, gender, age, and religious affiliation. Stereotypes about a person’s
group membership(s) can either be a positive or negative stereotype. These negative
and positive stereotypes elicit a wide array of emotions. Negative responses are the
aftermaths of negative stereotypes faced by the target. These aftermaths of negative
stereotypes further are manifested in the reactions of the target which includes
performance on task-assigned, motivation for the task and his/her self-esteem. It was
stated by the previous researchers that there are some physiological and
psychological variables which mediate the relation shared by stereotype threat and
job performance. But very few studies have tried to explore those underlying
mechanism due to which stereotype threat affects the job performance.
The objectives of this present investigation were to explore the factors which
activate the experience of stereotype threat in an individual and to establish the type
of relation stereotype threat (ST) shares with job performance (JP) in an academic
context. The study also intends to study the relationship between Hedonic wellbeing
(HWB) and coping strategy (COPE), Hedonic wellbeing (HWB) and Workplace
ostracism (WOS) and coping strategy (COPE) and workplace ostracism (WOS).
Finally, the role of hedonic wellbeing (HWB), workplace ostracism (WOS) and
coping strategy (COPE) were also studied on the stereotype threat (ST) and job
performance (JP) link.
The study was conducted on 591 school teachers of Uttar Pradesh. For
collecting data stereotype threat and job performance scales was developed by the
investigator whereas for other variables like tokenism, Hedonic wellbeing,
workplace ostracism, and coping strategy were adapted. The results revealed that
vi
gender, religion, caste category, and tokenism activate the acquaintance of
stereotype threat among teachers. The study also explored that the experience of
stereotype threat among teachers negatively impacts their job performance. Further
analysis revealed that hedonic wellbeing positively effects coping strategy whereas
Hedonic wellbeing and coping strategy negatively affects the experience of
workplace ostracism among teachers.
The mediation analysis for variables Hedonic wellbeing, Coping Strategy
and workplace ostracism on the mechanism of stereotype threat and job performance
link advocates about the existence of a negative relationship between Stereotype
threat (ST) and Hedonic wellbeing (HWB) and a positive relationship between
Hedonic wellbeing and Job Performance (JP). For another variable coping strategy it
indicated the existence of a negative relationship between Stereotype threat (ST) and
Coping Strategy (COPE) and a positive relationship between Coping Strategy
(COPE) and Job Performance (JP). Lastly, for variable workplace ostracism, the
analysis specified the presence of a positive relationship between Stereotype threat
(ST) and Workplace Ostracism (WOS) and negative relationship between
Workplace Ostracism (WOS) and Job Performance (JP). Therefore, the outcomes of
the mediation analysis revealed that hedonic wellbeing, coping strategy, and
workplace ostracism partially mediated the relation shared by stereotype threat and
job performance.
vii
STRUCTURE OF THE THESIS
The present thesis is structured into six chapters. The chapters are presented
as:
CHAPTER I: INTRODUCTION
In the present study, chapter I provides a brief introduction about the
constructs Viz. Hedonic Wellbeing (HWB), Coping Strategy (COPE), Workplace
Ostracism (WOS), Stereotype Threat (ST), Tokenism (TOK) and Job Performance
(JP). The chapter also highlights the effects of Stereotype Threat (ST) on Job
Performance (JP). In the present study, the researcher has built a framework of
Stereotype threat (ST) and Job Performance (JP) considering Hedonic wellbeing
(HWB), Coping Strategy (COPE) and Workplace Ostracism (WOS) as underlying
psychological variables which affect their relationships.
CHAPTER II: LITERATURE REVIEW
The present chapter deals with the past literature on the concept of
Stereotype Threat (ST), Job Performance (JP), Tokenism (TOK), Hedonic
Wellbeing (HWB), Coping Strategy (COPE) and Workplace Ostracism (WOS). The
chapter also presents the literature on the conceptualization of Stereotype Threat
(ST) and its effect on Performance. The chapter presents a wide range of literature
review by various researchers who conducted researches in the respective areas. The
reviews presented in the chapters identified the research gaps and thus provided a
guideline in the formation of objectives and hypothesis for the present study.
CHAPTER III RESEARCH METHODOLOGY
The present chapter deals with the research methods used in the present
study. This chapter provides an overview of the sample size, Sampling Frame,
Sampling Techniques and the Research Design. The chapter further contains the
proposed hypothesis for the framed objectives. It also highlights the statistical tools
and techniques to be used to interpret collected data.
viii
CHAPTER IV: SCALE VALIDATION
The present chapter in the study deals with the procedure followed by the
researchers in the development of the scales. In the present study, the researcher has
followed the guidelines of scale development suggested by Nunnally and Bernstein
(1994) and Henkin (1995). To measure stereotype threat (ST), Job Performance (JP),
Hedonic wellbeing (HWB), Tokenism (TOK), Coping Strategy (COPE), and
Workplace Ostracism (WOS) a theoretically anchored, reliable and valid scales were
used which was developed by facing stages viz, review of the literature, experts
views, content validity, pilot testing, Exploratory Factor Analysis (EFA) and
Confirmatory Factor Analysis (CFA).
CHAPTER V: DATA ANALYSIS
In the present study, the chapter deals with the testing of the conceptual
framework taken in the study. The conceptual framework has been tested in two
phases- first, the effect of Stereotype Threat (ST) on Job performance (JP) is
validated and then the relationship between variables Hedonic Wellbeing (HWB),
Coping Strategy (COPE) and Workplace Ostracism (WOS) has been tested with
each other in the framework. After testing of the conceptual model mediation
analysis was performed.
The mediation analysis was performed to explore the effects of mediators on
the link between Stereotype Threat (ST) and Job performance (JP). The mediators
considered are Hedonic Wellbeing (HWB), Coping Strategy (COPE) and Workplace
Ostracism. Each variable is tested separately to check the mediation effect of their
on the ST JP link.
CHAPTER VI: DISCUSSION, CONCLUSION AND IMPLICATION
The present chapter discusses the key findings from the objectives of the
study. The chapter also describes the various implications and future direction for
further research.

ix
TABLE OF CONTENTS
Page No.
Declaration .................................................................................................................. ii
Certificate ................................................................................................................... iii
Acknowledgement ..................................................................................................... iv
Abstract ........................................................................................................................ v
Table of Contents ....................................................................................................... ix
List of Tables ............................................................................................................ xii
List of Figures ........................................................................................................ xviii
SR. NO. TITLE PAGE NO.
1. CHAPTER – I : INTRODUCTION 1-32
1.1 Stereotype Threat 1
1.2 Job Performance 7
1.3 Hedonic Well-Being 11
1.4 Coping Strategy 15
1.5 Workplace Ostracism 21
1.6 Significance of The Problem 27
1.7 Research Topic 29
1.8 Operational Definitions of The Constructs 29
1.9 Research Objectives 30
1.10 Research Hypotheses 31
1.11 Research Questions 31
1.12 Delimitation 32
2. CHAPTER – II : REVIEW OF LITERATURE 33-63
2.1 Stereotype Threat (ST) 33
2.2 Job Performance (JP) 40
2.3 Hedonic Wellbeing (HWB) 49
x
SR. NO. TITLE PAGE NO.
2.4 Coping Strategy (COPE) 51
2.5 Tokenism (TOK) 55
2.6 Workplace Ostracism (WOS) 58
2.7 Summary of The Chapter 62
3. CHAPTER – III: RESEARCH METHODOLOGY 64-75
3.1 Population/ Sampling Frame 64
3.2 Sample 66
3.3 Procedure 67
3.4 Research Instruments 68
3.5 The Development of Research Instruments 69
3.6 Reliability and Validity of Research Instrument 69
3.6.1 Validity of the Instruments 70
3.6.2 Reliability of the Instruments 70
3.7 Conceptual Framework of the Study 71
3.8 Research Design 73
3.9 Data Collection 73
3.10 Data Analysis 74
3.11 Statistical Techniques 75
4. CHAPTER – IV : SCALE VALIDATION 76-129
4.1 The Development and Validation of Stereotype
Threat (ST) Scale
79
4.2 The Development and Validation of Job
Performance (JP) Scale
100
4.3 The Validation of Tokenism (TOK) Scale 115
4.4 The Validation of Workplace Ostracism (WOS)
Scale
118
4.5 The Validation of Coping Strategy (COPE) Scale 122
xi
SR. NO. TITLE PAGE NO.
4.6 The Validation of Hedonic Wellbeing (HWB)
Scale
127
5. CHAPTER – V: DATA ANALYSIS 130-179
5.1 Descriptive Statistics 130
5.2. Testing of Conceptual Model 136
5.2.1 Objective-1: To identify the role of caste
category, religion, gender, and tokenism
causing stereotype threat.
136
5.2.2 Objective-2: To establish the relationship
between stereotype threat and job
performance.
144
5.2.3 Objective-3: To study the relationship
between (a) hedonic well-being and coping
strategies; (b) hedonic well-being and
workplace ostracism; (c) relationship
between coping strategies and workplace
ostracism.
159
5.2.4 Objective-4: To study the role of hedonic
wellbeing, workplace ostracism and coping
strategies on the relationship between
stereotype threat and job performance.
171
6. CHAPTER – VI : FINDINGS, CONCLUSION,
IMPLICATIONS AND SUGGESTIONS
180-189
6.1 Finding and Discussion 180
6.2 Conclusion of The Study 184
6.3 Implication of The Study 186
6.4 Limitations and Suggestions for Future Research 188
7. REFERENCES 190-227
8. ANNEXURES i-xiii

xii
LIST OF TABLES
TABLE NO. TITLE PAGE NO.
3.1 Sample Profile 68
4.1 Items Selected to Measure Occupational
Identification (Oi)
80
4.2 Items Selected to Measure Gender Identification
(Gi)
81
4.3 Items Selected to Measure Gender Stigma
Consciousness (Gs)
81
4.4 Items Selected to Measure Caste category
Identification (Ci)
82
4.5 Items Selected to Measure Caste-category Stigma
Consciousness (Cs)
82
4.6 Items Selected to Measure Religion Identification
(Ri)
83
4.7 Items Selected to Measure Religion Stigma
Consciousness (Rs)
84
4.8 Items Selected to Measure Negative Affect (Na) 84
4.9 Construct Definitions Provided to Experts for
Content Validity of Stereotype Threat (ST) Scale
85
4.10 List of Experts Consulted for Content Validity of
Stereotype Threat (ST) Scale
86
4.11 Rating Presented to Experts for Content Validity 86
4.12 Content Validity Rates for Items Considered for
Stereotype Threat (ST) Scale
87
4.13 Reliability Statistics of Stereotype Threat (ST) Scale 90
4.14 Reliability Statistics of Sub-dimensions of
Stereotype Threat (ST) Scale
90
4.15 Model Fit Indices for Occupational Identification
(Oi) Scale
91
xiii
TABLE NO. TITLE PAGE NO.
4.16 Model Fit Indices for Gender Identification (Gi)
Scale
92
4.17 Model Fit Indices for Gender Stigma Consciousness
(Gs) Scale
93
4.18 Model Fit Indices for Caste Category Identification
(Ci) Scale
94
4.19 Model Fit Indices for Caste Category Stigma
Consciousness (Cs) Scale
95
4.20 Model Fit Indices for Religion Identification (Ri)
Scale
96
4.21 Model Fit Indices for Religion Stigma
Consciousness (Rs) Scale
96
4.22 Model Fit Indices for Negative Affect (Na) Scale 97
4.23 Model Fit Indices for Stereotype Threat (ST) Scale 98
4.24 Reliability Statistics of Stereotype Threat (ST) Scale 99
4.25 Reliability Statistics of Sub-dimension of Stereotype
Threat (ST) Scale
99
4.26 Items Selected to Measure Task Performance (TP) 101
4.27 Items Selected to Measure Contextual Performance
(CP)
101
4.28 Items Selected to Measure Counterproductive Work
Behavior (CWB)
102
4.29 Items Selected to Measure Adaptive Performance
(AP)
103
4.30 Construct Definitions Provided to Experts for
Content Validity of Job Performance (JP) Scale
105
4.31 List of Experts Consulted for Content Validity of
Job Performance (JP) Scale
105
4.32 Rating Presented to Experts for Content Validity 106
4.33 Content Validity Rates for Items Considered for Job
Performance (JP) Scale
106
xiv
TABLE NO. TITLE PAGE NO.
4.34 Reliability Statistics of Job Performance (JP) Scale 109
4.35 Reliability Statistics of Sub-dimensions of Job
Performance (JP) Scale
109
4.36 KMO and Bartlett’s Test Values 110
4.37 Results of Exploratory Factor Analysis for the
Construct ‘Job Performance’ (JP) Construct
111
4.38 Model Fit Indices for Job Performance (JP) Scale 113
4.39 Reliability Statistics of Job Performance (JP) Scale 114
4.40 Reliability Statistics of Sub-constructs of Job-
Performance
114
4.41 Items Selected to Measure Tokenism (TOK) 115
4.42 Reliability Statistics of Tokenism (TOK) Scale 116
4.43 Model Fit Indices for Tokenism (TOK) Scale 117
4.44 Reliability Statistics of Tokenism (TOK) Scale 118
4.45 Items Selected to Measure Workplace Ostracism
(WOS)
119
4.46 Reliability Statistics of Workplace Ostracism (WOS)
Scale
120
4.47 Model Fit Indices for Workplace Ostracism (WOS)
Scale
121
4.48 Reliability Statistics of Workplace Ostracism (WOS)
Scale
121
4.49 Items Selected to Measure Coping Strategy (COPE) 122
4.50 Reliability Statistics of Coping Strategy (COPE)
Scale
125
4.51 Model Fit Indices for Coping Strategy (COPE) Scale 126
4.52 Reliability Statistics of Coping Strategy (COPE)
Scale
126

xv
TABLE NO. TITLE PAGE NO.
4.53 Reliability Statistics of Sub-dimensions of Coping
Strategy (COPE) Scale
126
4.54 Items Selected to Measure Hedonic Wellbeing
(HWB) Scale
127
4.55 Reliability Statistics of Hedonic Wellbeing (HWB)
Scale
128
4.56 Model Fit Indices for Hedonic Wellbeing (HBW)
Scale
129
4.57 Reliability Statistics of Hedonic Wellbeing (HWB)
Scale
129
5.1 Descriptive Statistics for Construct “Stereotype
Threat” (ST)
130
5.2 Descriptive Statistics for Construct “Job
Performance” (JP)
131
5.3 Descriptive Statistics for Construct “Coping
Strategy” (COPE)
132
5.4 Descriptive Statistics for construct “Hedonic
Wellbeing” (HWB)
132
5.5 Descriptive Statistics for construct “Tokenism”
(TOK)
133
5.6 Descriptive Statistics for construct “Workplace-
Ostracism” (WOS)
133
5.7 Normality Test 135
5.8 Summary of t-Test on Stereotype Threat (ST) with
respect to Gender of Teachers
137
5.9 Summary of t-Test on Stereotype Threat (ST) with
respect to Religion of Teachers
138
5.10 Summary of ANOVA Test on Stereotype Threat
(ST) with respect to Category of Teacher
139
5.11 Summary of ANOVA Test on Stereotype Threat
(ST) with respect to Category of Teacher
140

xvi
TABLE NO. TITLE PAGE NO.
5.12 Summary of Tukey Test for Pair Wise Comparison
on Stereotype Threat (ST) with respect to Category
of Teacher
140
5.13 Regression Analysis of Tokenism with Stereotype
Threat among Teachers
142
5.14 Summary of ANOVA Result of Regression Analysis
Tokenism with Stereotype Threat among Teachers
142
5.15 Summary of Coefficients of Regression Analysis
Tokenism with Stereotype Threat among Teacher
143
5.16 Model Fit Indices of Measurement-Model for
Stereotype Threat (ST) and Job-Performance (JP)
146
5.17 Model Fit Indices of Structural Model for Stereotype
Threat (ST) and Job-Performance (JP)
148
5.18 Model Fit Indices of Measurement Model for
Stereotype Threat (ST) and Task-Performance (TP)
149
5.19 Model Fit Indices of Structural Model for Stereotype
Threat (ST) and Task-Performance (TP)
151
5.20 Model Fit Indices of Measurement Model for
Stereotype Threat (ST) and Contextual-Performance
(CP)
153
5.21 Model Fit Indices of Structural Model for Stereotype
Threat (ST) and Contextual-Performance (CP)
155
5.22 Model Fit Indices of Measurement Model for
Stereotype Threat (ST) and Counterproductive Work
Behavior (CWB)
156
5.23 Model Fit Indices of Structural Model for Stereotype
Threat (ST) and Counterproductive Work Behaviour
(CWB)
158
5.24 Model Fit Indices of Measurement-Model for
Hedonic Wellbeing (HWB) and Coping Strategy
(COPE)
161

xvii
TABLE NO. TITLE PAGE NO.
5.25 Model Fit Indices of Structural Model for Hedonic
Wellbeing (HWB) and Coping Strategy (COPE)
163
5.26 Model Fit Indices of Measurement-Model for
Hedonic Wellbeing (HWB) and Workplace
Ostracism (WOS)
165
5.27 Model Fit Indices of Structural Model for Hedonic
Wellbeing (HWB) and Workplace Ostracism (WOS)
167
5.28 Model Fit Indices of Measurement-Model for
Coping Strategy (COPE) and Workplace Ostracism
(WOS)
168
5.29 Model Fit Indices of Structural Model for Coping
Strategy (COPE) and Workplace Ostracism (WOS)
170
5.30 Results of Hedonic Wellbeing (HWB) as a Mediator 174
5.31 Results of Coping Strategy (COPE) as a Mediator 176
5.32 Results of Workplace Ostracism (WOS) as a
Mediator
178

xviii
LIST OF FIGURES
FIGURE NO. TITLE PAGE NO.
3.1 Number of Schools in Each District of Eastern Uttar
Pradesh (U.P)
65
3.2 Conceptual Model of the Study 71
4.1 Steps Followed in Scale Development 76
4.2 Confirmatory Factor Analysis Model of
Occupational Identification
91
4.3 Confirmatory Factor Analysis Model for Gender
Identification (Gi)
92
4.4 Confirmatory Factor Analysis Model for Gender
Stigma Consciousness (Gs)
93
4.5 Confirmatory Factor Analysis Model for Caste
Category Identification (Ci)
94
4.6 Confirmatory Factor analysis model for Caste
Category Stigma Consciousness
95
4.7 Confirmatory Factor Analysis Model for Religion
Identification (Ri)
95
4.8 Confirmatory Factor Analysis Model For Religion
Stigma Consciousness (Rs)
96
4.9 Confirmatory Factor Analysis Model for Negative
Affect (Na)
97
4.10 Confirmatory Model of Stereotype Threat (ST)
Scale
98
4.11 Confirmatory Factor Analysis Model of Job-
Performance (JP) Scale
113
4.12 Confirmatory Model of Tokenism (TOK) Scale 117

xix
FIGURE NO. TITLE PAGE NO.
4.13 Confirmatory Model of Workplace Ostracism
(WOS) Scale
120
4.14 Confirmatory Model of Coping Strategy (COPE)
Scale
125
4.15 Confirmatory Model of Hedonic Wellbeing (HWB)
Scale
128
5.1 Normality Graph 135
5.2 Graph with Mean Score on Stereotype Threat of
Teachers Category-wise
139
5.3 Measurement Model of Stereotype Threat (ST) and
Job Performance (JP)
145
5.4 Validated Structural Model of Stereotype Threat
(ST) and Job Performance (JP)
147
5.5 Measurement Model of Stereotype Threat (ST) and
Task Performance (TP)
149
5.6 Validated Structural Model of Stereotype Threat
(ST) and Task Performance (TP)
151
5.7 Measurement Model of Stereotype Threat (ST) and
Contextual Performance (CP)
152
5.8 Validated Structural Model of Stereotype Threat
(ST) and Contextual Performance (CP)
154
5.9 Measurement Model of Stereotype Threat (ST) and
Counterproductive Work Behavior (CWB)
156
5.10 Validated Structural Model of Stereotype Threat
(ST) and Counterproductive Work Behavior (CWB)
158
5.11 Measurement Model of Hedonic Wellbeing (HWB)
and Coping Strategy (COPE)
161
5.12 Validated Structural Model of Hedonic Wellbeing
(HWB) and Coping Strategy (COPE)
163
xx
FIGURE NO. TITLE PAGE NO.
5.13 Measurement Model of Hedonic Wellbeing (HWB)
and Workplace Ostracism (WOS)
164
5.14 Validated Structural Model of Hedonic Wellbeing
(HWB) and Workplace Ostracism (WOS)
166
5.15 Measurement Model of Coping Strategy (COPE)
and Workplace Ostracism (WOS)
168
5.16 Validated Structural Model of Coping Strategy
(COPE) and Workplace Ostracism (WOS)
170
5.17 Hedonic Wellbeing (HWB) as a Mediator 174
5.18 Coping Strategy (COPE) as Mediator 176
5.19 Workplace Ostracism (WOS) as a Mediator 178

1
CHAPTER – I
INTRODUCTION
1.1. STEREOTYPE THREAT
The stereotype is a Greek term which is a combination of two words
‘Stereos’ + ‘Typos’. The word Stereos stands for a firm or solid and Typos stands
for impression. Therefore, the word stereotype signifies concrete imprint on one or
more ideas or theory. It was an American journalist Lipmann (1922) who first used
the word stereotype in a modern psychological sense in his work Public Opinion and
the outcomes of empirical tests of stereotypes were first made available by Katz and
Braly (1933). Lippmann (1922) described stereotype as a ‘Pseudo-environment’ or
‘fiction’ and Katz and Braly (1933) described it as an unfounded and incongruous
reaction given to an out-group member. Basically, the word stereotype can be best
described by the phrase ‘picture in our heads’ which refers to dogmas, knowledge,
and expectations of an individual for other individual or social group. It also refers
to an internal, mental representation for individual or social-groups in comparison to
their external veracity.
Stereotypes can be categorized under two classifications i.e. positive
stereotype and negative stereotype. Generally, the stereotype is considered a
negative set of ideas that one individual has for another individual or group. The
after-effect of negative stereotyping is ‘Stereotype-threat’, whereas the after-effect
of positive stereotyping is ‘Stereotype boost’.
Various media outlets like magazines, television shows, commercials, and
socialization, etc. are the sources through which individuals get exposed to negative
stereotypes which result in stereotype threat. Generally, it’s been observed that
female students from the very beginning are exposed to negative stereotypes about
their performances related to STEM subjects, which results in the occurrence of the
challenging situation for them to disprove the negative stereotype. This has been
further supported by Neuville and Croizet (2007) by stating that exposure of
negative stereotypes leads to the phenomenon of stereotype threat which further
2
contributes to performance decrements of girls in STEM subjects. It was Ambady et
al. (2001) who further added that activation of gender-relevant stereotypes
negatively impacts the performance of the targeted gender (Ambady et al., 2001).
Stereotype threat is a social psychological phenomenon. It concerns being
observed through the lens of negative stereotypes. It is a negative result of
stereotyping in which minority group members experience an apprehension that they
may behave or act in a manner that endorses prevailing traditional stereotypes
(Steele, 1997). The apprehension after experiencing negative stereotypes interferes
with an individual’s capability to perform well, and thus leads them to approve the
negative stereotypes about one’s group.
The term “stereotype threat” was given by psychologists Steele and Aronson
(1995). It is dread or fretfulness which an individual might experience when they are
antagonized with confirming a negative stereotype about the group they are
associated with (Schneider, et al., 2012). It is also considered as self-confirming
belief where an individual might get evaluated based on a negative stereotype. It
takes place in a status quo where there is expectancy that one might be arbitrated
negatively based on one’s group membership or ones social identity (Steele et al.,
2002) which may oblige to interrupt and destabilize individual performance as well
as his/ her aspiration (Davies et al., 2002; Steele and Davies, 2003).
The phenomenon of stereotype threat occurs under certain circumstances.
Some of the most observed conditions are (1) when a person is assigned with such
duty which is related to the negative stereotypes about a person’s group identity; (2)
when an individual finds the assigned task challenging; (3) the circumstance in
which a person is performing is expected to strengthen the prevailing negative
stereotype.
The influence of stereotype threat on academic tasks has been demonstrated
by various people in different types of stereotyped groups, including high school
girls and college women taking math tests described as diagnostic of math ability
(Keller and Dauenheimer, 2003; Spencer et al., 1999). In addition, stereotype threat
effects on performance are found for: whites males who take math test after
comparing their math ability to that of “Asian males” (Aronson et al.1999); Latino

3
men and women who take a math test as diagnostic of their aptitude (Gonzales et al.,
2002) and children from low socio-economic backgrounds who take intellectual
tests labelled as diagnostic of their overall intellectual-ability (Croizet and Claire,
1998).
Stereotype threat can impact the same individual in altered ways which
depend on which characteristic of their identity is made silent. It was found that
‘Asian women's’ do better in maths assessments when ethnic-identity is primed
whereas they performed worse when gender is clued-up (Shih et al., 1999).
The following studies have been presented to substantiate that stereotype
threat effects is produced in diverse groups like females showed similar decrement
in performance of mathematical ability when compared to males in a situation where
a test is said to measure the extent of mathematical aptitude of individuals instead
focussing on gender (Brown and Josephs, 1999; Quinn and Spencer, 2001; Spencer
et al., 1999); race (Gonzales et al., 2002), socio-economic status (Croizet and Claire,
1998).
Although in many cases researcher creates stereotype threat as attest as
diagnostic of one’s true aptitude, it can also be activated in more subtle ways, as will
be described. Women who see gender-stereotypic commercials perform poorer on a
mathematical ability test than those who viewed the counter-stereotypic-
commercials (Davies et al., 2002). Women who watched gender-stereotypic-
commercials also generally show a reduced amount of interest in careers requiring
quantitative skills (such as engineer, mathematician, computer scientist, and
accountant) than those who watched the counter stereotypic ads.
Researchers are now investigating how stereotype threat leads to decreased
peer performance. One explanation is that stereotype threat leads to lesser working-
memory capacity. To support the above line or view, Latino students who are told
that a memory-test is extremely extrapolative of intelligence recall fewer words on a
memory task than those who are not given information (Schmader and Johns, 2003).
Another explanation is that such intimidation increases anxiety which in turn
disrupts performance. There are some recent researches which examine how
stereotype threat is associated with activation of a particular part of the brain (Krendl

4
et al., 2008). This work indicates that although women who are not solving math
problems usually show activation in part of the brain that controls mental math tasks
(not surprising), those who are under conditions of threat instead show activation in
a part of the brain that regulates emotion.
Adherents of low-status groups are more probable than those who
belong to high-status groups to report experiences related to personal discrimination
(Major et al., 2002; Schmitt et al., 2002). Discrimination or prejudice negatively
affects psychological wellbeing. Individuals who are targets of prejudice or negative
stereotyping generally experience depression, sadness, and helplessness
(Branscombe et al., 1999; Schmitt and Branscombe, 2002). The cognitive ability of
an individual is affected when one observes deliberate discrimination towards
another individual of the same group (Salvatore and Shelton, 2007). Thus, it can be
said that experiencing discrimination can lead to negative effects on ones mental as
well as physical health.
Although minority group members overall report experiencing more personal
and group discrimination than majority group members, those who have a strong
identification with one’s group, report they feel more discriminated. Individuals who
are token representative of their group in any organization, often experience
stereotype threat (Roberson and Kulik, 2007). Therefore, it can be concluded that the
context of the workplace often buffers the phenomenon of stereotype threat.
The literature on tokenism contains the antecedents of stereotype theory. The
theory explains a wide range of devastating effect of tokenism on tokens. It was also
established that black learners of college accomplished the provided task better
when it was announced that their performance will be equated to ‘African-
Americans’ but they performed poorly when they were informed that their task will
be compared to white college students (Katz, 1963). It can be stated that tokens feel
visible when placed in the dominant group.
The token representation of individuals of demographic minority increases
the probability of negative stereotypes about the minority group which promotes
stereotype threat phenomenon in an organization (Ely, 1995). Previous researches
support the fact that being an only representative of one's social- group in a
5
workplace very often elevates a robust awareness about the phenomenon of
stereotype threat (Roberson et al., 2003). Simply being an only person of your
gender, caste, religion or race in a group can activate the experience of stereotype
threat which disrupts performance, particularly for members from disadvantaged or
negatively stereotyped groups (Inzlicht and Ben-Zeev, 2000; Sekaquaptewa and
Thompson, 2002). However, as described in the education connections, subtle
manipulations can also minimize the negative effects of stereotype threat.
Though the deleterious effect of stereotype threat on an individual’s
performance has been documented by various researchers, the mechanism due to
which stereotype threat have deleterious effects on one’s job performance is still not
much explored. Researchers tried to explore such factors due to which the
phenomenon of stereotype threat can have its deleterious impact on performance.
Factors like heightened physiological arousal (Blascovich, Spencer, Quinn, and
Steele, 2001; Osborne, 2006, 2007), decreased working memory capability (Croizet
et al. 2004; Schmader and Johns, 2003), impaired self-law (Cadinu et al. 2005;
Inzlicht et al. 2006), and lowered performance expectancies (Cadinu et al., 2003;
Stangor et al. 1998) are amongst the few factors due to which stereotype threat
negatively impacts one’s performance. It is obvious that when an individual
encounters a negative stereotype or experience stereotype threat might get
heightened physiological arousal which further might result in fewer cognitive
resources with lowered performance expectancies eventually leading to decreased
performance.
The research conducted in the past suggests that there is some psychological
and physiological mechanism which mediates the relation shared by stereotype
threat and performance (Schmader and Johns, 2003; Spencer et al., 1999; Steele,
1997). The extent of individual identification with their social group or with their
domain like mathematical ability etc. has an influence on the impact of stereotype
threat on job performance. It not only causes decrement in performance but also
influence major life decisions of targets. Gupta and Bhawe (2007) found that the
experience of stereotype threat influences the target in choosing profession
ultimately preventing from the accomplishment of his/her potential in the threatened
6
domain. Similarly, the following researchers support the same concept about
stereotype threat phenomenon Good et al. (2008), Brown and Pinel (2003), Keller
and Dauenheimer (2003), Davies et al.(2002), Marx and Roman (2002), Schmader
(2002), Brown and Josephs (1999), Spencer et al.(1999).
In reality, academics have clinched that “dependent measures used in
stereotype threat research have been narrow in scope” and that “academic
performance may be neither the most important consequence of stereotype threat nor
the most effective measure for inferring its existence” (Shapiro and Neuberg, 2007,
pp. 110, 111). The progressive and continuous researches on phenomena of
stereotype threat are helping the educators and organizational heads to become
aware of its negative effects and mechanism due to which it occurs (O’Brien and
Crandall, 2003; Schmader and Johns, 2003).
The researchers have conducted numerous researches in experimental as well
as in real life setting which demonstrates the negative effect of stereotype threat, but
very few studies have been piloted in the Indian context. The latest study on
stereotype threat was conducted by Trott (2014) on female managers. Another study
was conducted on stereotype threat in India context on gender and leadership
choices by Prasad (2011). Hoff and Pandey (2004) also contributed to the literature
of stereotype threat by revealing corrosive effects of the caste system on Indian
society and how lower caste identity of an individual is viewed negatively.
Stereotype threat is most commonly measured in terms of impaired academic
test performance by the target of the threat (Shapiro and Neuberg, 2007) for
example; a woman who is aware of negative stereotypes regarding women and
mathematical ability is likely to demonstrate decreased performance if she is
presented with a test that is described to measure mathematical ability (Spencer et al.
1999) Impaired test performance can be measured in a variety of ways the total
number of items attempted on a test, the total number of correct answers on a test,
the number of correct answers out of the total items attempted, and the amount of
time spent on a test have all been used to operationalized test performance (Nguyen
and Ryan, 2008).
7
1.2. JOB PERFORMANCE
Job performance gauges how an individual accomplishes the task assigned to
him/her in an organization. It is concentrated scholastically as a major aspect of
industrial and organizational psychology. Performance in any job is a critical
standard for authoritative results and achievement.
A great amount of research work has been conducted on job performance but
there is still not much clarity about an individual’s performance in an organization.
The researchers from the field of management, occupational-health, work, and
organizational-psychology have conducted ample investigation on job performance
with different approaches but still, the area needs much consideration.
The concept of job performance is quite broader and complex which cannot
be measured at once. Basically, it can be concluded that it has got multiple
dimensions which further has indicators which can be measured at once. Therefore,
to theorize or hypothesize the construct of job performance there is a great need to
elucidate the area of job performance. This clarity in concept leads to the exploration
of the dimension as well as indicators of job performance.
Job-Performance ought to be recognized from work efficiency, two ideas that
regularly appear to be utilized reciprocally in the writing. Work efficiency is
characterized as information isolated by yield. Along these lines, work efficiency is
a smaller idea than work-performance. It is additionally critical to recognize
contributory factors as well as indicators of work performance. Causal factors decide
or foresee one's dimension of work performance, while indicators are impressions of
work performance.
The description of job performance has wide range viz quantitative to
qualitative dimension and from general to specific. Job performance is defined as
“all the behaviors’ employees engage in while at work” (Jex, 2002) whereas Lindsay
(1995) and Griffin, (2012) referred job performance “as an act of accomplishing or
executing a given task”. Frequently performance of any employee is explained as
his/ her performance in job-specific tasks.

8
It was the Campbell whose definition of job performance has been widely
used and supported by the researchers. Campbell (1990) stated that the job
performance of an employee is the overall behavior as well as actions which aim to
achieve the objectives set by the organization. The definition given by him is
accompanied by three notions: First, work overall performance need to be described
in terms of conduct as opposed to consequences; Second, paintings overall
performance consists of the simplest one’s behaviors which can be applicable to the
organization’s desires, and third, work overall performance is multidimensional.
It was Murphy (1989) who first defined individual work performance. He
specified dimensions of job performance i.e. task behaviors; interpersonal behaviors
(communicating and cooperating with others); downtime behaviors (work-avoidance
behaviors) and destructive or hazardous behaviors. Whereas, Campbell (1990)
proposed eight dimensions of job performance which are: job-specific task
proficiency; non–job-specific task proficiency; written and oral communications;
demonstrating effort; maintaining personal discipline; facilitating peer and team
performance; supervision and management and administration. The researchers of
organizational behavior firstly considered only task and contextual performance as
the dimension of job performance but later, majority of the researchers classified the
job behavior of the employees into three broad dimensions i.e. Task Performance,
Contextual Performance, and Counterproductive Work Behaviour.
Task performance & contextual performance are the two identified
employee’s behavior which is considered as an essential factor for organizational
effectiveness (Borman and Motowidlo 1993). Task performance is that behavior of
an employee which is either directly involved in producing goods and services or is
concerned with those activities which indirectly support core technical processes in
the organization (Borman and Motowidlo, 1997; Werner, 2000). Meanwhile, the
contextual performance of an employee is concerned with those individual efforts
which are either indirectly related to the main task or are not directly related to the
main job. Contextual performance is important for shaping the institutional, social
and psychological-contexts which serve as an acute facilitator of task performance
and its processes (Werner, 2000).

9
Almost all the frameworks stated project overall task-performance as a vital
measurement of an individual’s job performance. Task performance may be
described as a person proficiency (i.e., competency) with which one plays
significant job responsibilities. Job-specific task proficiency, technical proficiency
or in-role-performance are few terms sometimes used to denote task performance.
Task performance includes job knowledge, work-quantity, and work quality.
Campbell in his work stated that job-specific task-proficiency and non-job specific
task-proficiency represent task performance.
Although traditional awareness of previous studies has been the task-
performance of an individual later researchers came to a point where they explored
that job performance of an individual is much more than task performance. The
concept of contextual performance is supported and can be well-defined as
behaviors supporting the organizational, social, and mental environment of the
organization. Contextual performance has been labeled differently by several
researchers which include labels like ‘non-job-specific task proficiency’; ‘Extra-
role-performance’; ‘Organizational-citizenship-behaviour’ and ‘Interpersonal-
relations. The concepts put forth by various researchers indicate contextual
performance that behavior that goes beyond the formally described work objectives
of the organization which includes taking on greater responsibilities, displaying
initiative, or education novices at the job. Performance of teachers in particular
relies upon the teacher characteristics consisting of know-how base, sense of
obligation, and inquisitiveness; the scholar traits along with the opportunity to
analyse, and educational work; the coaching factors along with lesson structure, and
communication; the gaining knowledge of elements such as involvement and
success; and the school room.
Previous researchers used one broad-sized framework to explain the
contextual performance. Four wide-spread frameworks used more than one
dimension to describe the contextual-performance. For instance, in Campbell’s
framework, six of the 8 dimensions (written and oral communications,
demonstrating effort, keeping personal discipline, facilitating peer and team
performance, supervision and management, and management and administration)
might be regarded contextual overall performance. Also, six of Viswesvaran’s

10
dimensions (communique competence, attempt, leadership, administrative
competence, interpersonal competence, and compliance with/recognition of
authority) may appear as contextual performance.
Counterproductive work behavior is considered as third dimensions of job
performance (Rotundo and Sackett 2002). The counterproductive work behavior of
an employee is that behavior and actions of an employee which either harms the
well-being of other employee or organization. Some of the counterproductive
behavior is absenteeism, defaming other employees or organization, stealing,
substance abuse, etc. Murphy (1989) explained counterproductive work behavior by
considering negative or dangerous behaviors and downtime behavior as a dimension
of job performance in his framework.
The definition of job performance and its dimensions might vary according
to the individual’s specific job field. There is no consensus among the researchers
regarding the concept of job performance among teachers. There are numerous
definitions given by previous researchers which support the complexity and multi-
faceted nature of teacher’s job performance concept. Obilade (1999) described a
teacher’s job performance as an accomplishment of liabilities and duties by teachers
during school hours to achieve organizational goals. Similarly, Akinyemi (1993) and
Okeniyi (1995) described it as the capability of a teacher to effectively combine the
pertinent inputs for the enhancement of the teaching-learning process. Whereas,
Selamat, et al. (2013) related teacher job performance with teachers’ effectiveness.
However, it was Meindl (1995) who portrayed job performance by an employee’s
extent of involvement in their daily assigned job activities by the organization.
A famous theorist named McGregor (1960) postulated a theory which states
that negative attribute is responsible for lower performance whereas positive
attribute is responsible for high performance of individuals. There are a few reasons
or factors which contribute to the low level of teachers’ job performance those
factors can be organizational or personal factors like exclusion in workplace,
emotional well-being, etc. Educator’s job performance is one of the essential aspects
of the triumph of any educational activities. Performance of teachers is directly
related to the processing as well as the product of education. The successful
11
accomplishment and execution of an assigned task are described as work-
performance Okunola (1990). Similarly, it can also be explained as a skillful
capability of an employee to combine a set of specific behaviors in order to achieve
the assigned goals and objectives set by the organization (Olaniyan, 1999). It is also
determined by the involvement of workers in their daily assigned job activities by
the organization (Peretemode, 1996). Milkovich et al. (1991) stated performance as
a convoluted series of intermingling variables which are related to the several
aspects of employees assigned task and his/her job environment. Traditionally
performance was defined as a function of outcomes, behavior and personal traits
(Milkovich et al., 1991), but later on, researchers focussed only on outcomes and
behavior because of the objectivity when compared to personal traits (Hersen et al.,
2004).
1.3. HEDONIC WELL-BEING
The idea of happiness is the nook stone of the suppositions of “Positive-
Psychology”. Happiness is characterized by the experience of greater common
“Positive-Affective” states than poor ones in addition to a perception that one is
moving ahead in a direction so as to achieve an important life-objectives (Tkach and
Lyubomirsky, 2006).
Haybron (2000) distinguished happiness into three philosophical principles:
‘Psychological-happiness’; ‘Prudential-happiness’ and ‘Perfectionist-happiness’.
Psychological Happiness is also called as ‘Hedonic or emotional wellbeing’. Martin
Seligman who is considered as the father of positive psychology in his book named
“Authentic-Happiness” (Seligman, 2002) distinguished among pleasant, engaged
and meaningful life. Various philosophers used the concept of Psychological-
happiness which is relatively analogous with Seligman's idea of high-quality life
(Sirgy and Wu, 2009).
Haybron (2000) stated Hedonic well-being as mental happiness that's
concerned with a character’s kingdom of mind (feeling of joy, serenity, and
affection). It may be comprehended as Experience of effective feelings over time
that is termed as Hedonic wellbeing (Benditt (1974, 1978), Carson (1978a, 1978b,
1979, 1981), Davis (1981a, 1981b), Gauthier (1967), Griffin (1986), Mayerfield

12
(1996, 1999), Nozick (1989), Rescher (1972), Sen (1987), Sumner (1996), Von
Wright (1963), Wilson (1968) and Wolf (1997).
A rationalist of happiness Phillips (2006) stated that hedonic tradition
highlights individual assuming that one is roused to upgrade personal-freedom along
with one’s self-protection and self-improvement. Basically, the hedonic tradition
expounded by Hobbes, Locke, and Rousseau which gives emphasis to the
trustworthiness of the individual and his own judgment about what fulfills him
(Sirgy, 2012).
Hedonic well-being is related to the feeling of liking, pain, interest, boredom,
joy, unhappiness, satisfaction and dis-satisfaction. Hedonic wellbeing is sometimes
also called as ‘Emotional wellbeing’ or ‘Experienced happiness’ (Kahneman and
Deaton, 2010). The term hedonic well-being and emotional well-being are
synonyms and sometimes hedonic is used interchangeably with emotional well-
being (Zou et al., 2013). It talks about the everyday experience of a person’s quality
of emotion. Hedonic wellbeing can be summarised as the frequency and intensity of
an individual’s experience of joy, fascination, anxiety, sadness, anger, and affection
which make one’s life either pleasant or unpleasant.
Hedonic wellbeing depends on the thought that increased pleasure and
diminished agony prompts happiness in one’s life. The concept of hedonic wellbeing
depends on the belief of subjective wellbeing which is usually used to mean the 'glad
or great life'. It includes an emotional part (high positive effect and low negative
effect) and a cognitive or psychological segment (fulfillment with life). It is
recommended that an individual encounters bliss when high-quality effect and
success with life are both excessive (Carruthers and Hood, 2004).
Emotions or feelings in the broadest sense incorporate regularly utilized
terms, for example, outrage, dread, satisfaction, blame, desire, love, mettle, and
misery. The feeling is vitality complex including nerves, muscles, gut, bone marrow,
glandular action, and other various cells of the body (Goleman, 2006).
"Emotion" rose up out of the French expression "emouvoir". The expression
"emouvoir" signifies "to work up". A feeling included a couple of parts viz. positive
13
or negative subject understanding, real excitement, activation of explicit mental
procedures with putting away data and trademark conduct. Another view on feeling
recommends five segments, for example, psychological evaluation, real indications,
activity inclinations, articulation, and sentiments. Frequently feeling is considered
equally persuasive with one's state of mind, demeanor, character, mien, and
inspiration. It is likewise influenced by one's body hormones and synapse resembles
Dopamine, Nor-adrenaline, Serotonin, Oxytocin, Cortisol, and GABA. Insight is a
significant part of a person's feeling particularly in deciphering an occasion.
An individual’s decreased hedonic well-being is related to serious mental
health concerns viz. stress, depression, and anxiety. These mental health issues
directly or indirectly contribute to one’s physical ill-health like Digestive-disorders,
Sleep-Disturbances, and fatigue. Whereas it is observed that positive emotions of an
individual are a predictor of improved broad-minded coping and vice-versa and thus
this support that positive emotions initiate upward spirals towards enhanced hedonic
well-being (Fredrickson and Joiner, 2002).
A positive sense of wellbeing is termed as Hedonic Wellbeing. It is very
important to move forward in life in a positive direction. It assists human beings in
smooth functioning in society so as to meet the everyday demands of life. Positive
emotions make an individual feel good about them as well as about the surrounding.
The judgment about an individual’s life satisfaction largely depends on one’s ability
to balance positive and negative emotions (Diener and Larsen,1993).
For the interpretation of any event, cognition is an important aspect of
emotion e.g. individuals own perception about one’s gender can lead him/her to
threat under test conditions. There are recent researches which explored that under
stereotype threat situation an individual’s emotional processing restricts or impedes
one's cognitive processing (Wraga et al., 2007; Krendl et al., 2008). The interference
occurs because of the direct/indirect undermining of the working memory resources
which are required for one’s effective task performance (Schmader et al., 2008).
Emotional disturbances occur either from increased attentiveness towards threat-
related signs (Forbes et al., 2008) or from counterproductive attempts. Rumination
and emotion-suppression are the two ways through which the negative emotions

14
emerged from such information can be regulated (Beilock et al., 2007; Johns et al.,
2008).
Keyes et al. (2002) characterized Hedonic Well‐being as Subjective Well‐
being, which integrates the concepts of life satisfaction and happiness which are a
balance between positive and negative affect. They also reported that usually it is
defined as ones overall satisfaction with life and happiness. Higher hedonic
wellbeing may help preserve positive feelings. Diener et al.(2003) described hedonic
wellbeing as an individual’s evaluation of their life which include emotional
reactions to events, moods, fulfillment, and satisfaction with domains like marriage,
work, etc. According to Diener (1984) wellbeing if observed from a hedonistic
perspective is completely based on the idea of one’s subjective cognitive appraisals
about life in general (Diener, 1984). Hedonic view of happiness is the pre-
dominance of an individual’s positive affects over the negative affects or the
affective balance (Andrews and Whithey, 1976; Campbell et al., 1976; Diener, 1984
and Christopher, 1999).
From the above reviews, we can conclude that hedonic well-being is very
important as it contributes to the judgment of one’s life satisfaction and its decreased
level contributes to both physical as well as an individual’s mental health which
directly or indirectly serves as a barrier to one’s performance. Higher hedonic
wellbeing needs identifying, building, and operating one's strengths rather focusing
on negative aspects which include fixing problems or weaknesses. The greater we
obtain mastery on our emotions (Coping with stress) the greater we will be able to
enjoy life and focus on our important priorities.
The teaching profession has been ranked on the top as one of the highest
stressful jobs which hamper the performance of teachers. Previous researches on the
wellbeing of teachers have focused on stress and burnout (Spilt et al., 2011).
Researchers explored several causal factors for stress and burnout which effects
teacher’s wellbeing. Factors like organizational pressure, social-pressure,
administrative-workload, issues in classroom-management, less team support
contribute to stress and burnout among teachers which directly or indirectly affects
their wellbeing (Borg and Riding 1991; Burke and Greenglass 1995; Greenglass et
15
al., 1997; Kokkinos, 2007; Smith and Bourke 1992). Researches on Hedonic
wellbeing are growing in multitude with various fields contributing to it like
Psychology, Neuroscience, Medicine, History and Computer Science but till date, its
role in stereotype threat and job performance link has not been studied in academics.
1.4. COPING STRATEGY
The word coping emerged from the English word cope in the mid- of the 16th
century which originally means ‘dress in a cope’, hence ‘to cover’. The process of
management and reduction of stress by people caused through issues or adverse
situations is termed as coping. According to Breuer and Freud (1955), the concept of
coping can be understood by referring to the introduction of psychoanalysis by
Freud in the 19th
century. Freudian theory stressed the concept of defense and
pointed out the ego’s struggle with niggling feelings. The 1960s witnessed the
emergence of a new research line labeled as ‘coping’. Most popular work on
psychological stress and the coping process has been accomplished by Lazarus
(1966). It’s because of Lazarus’ (1966) work on psychological stress and coping, the
coping strategy has evolved as a prominent field of research.
Coping is an individual’s cognitive and behavioral endeavors to subjugate,
endure or minimize external and internal demands and clashes amidst them
(Folkman and Lazarus, 1980). Coping can also be described as an attempt in order to
control the circumstances of anguish or any challenge when the spontaneous
response is impossible (Monat and Lazarus, 1977). Chang and Strunk (1999) view
coping as one's effort which provides enough strength to manage the demands of
demanding circumstances. The aim of coping is not achieving success rather it
focuses on making attempts and forming links between environmental stress and an
individual’s adaptation. Basically, it is regulating oneself in a stressful situation
(Compas et al. 2001; Eisenberg et al. 1977; Skinner, 1999; Skinner and Zimmer-
Gembeck, 2007, 2009).
The management of problems and associated negative emotions is included
in the process of coping. The use of a coping strategy is influenced by individual
aspirations, credence, and attributes besides the environmental circumstances. Being
multidimensional and flexible, coping allows individuals to modify their numerous
16
attempts to meet the demands of particular situations, so as to observe the
consequence of their actions, determine whether their goals have been achieved or
not in that situation and improvise their approach accordingly.
Coping deals with one’s ability to organize, regulate, handle and synchronize
numerous aspects of the self under stress. The polarity between regulation and
coping rests in the fact that the former is concerned with the management of specific
aspect e.g. emotional regulation or attention regulation whereas the latter as an
organizational contrast focuses on the regulation of all aspects an individual which
are affected by stress, encompassing physiology, behavior, motivation, emotion,
cognition, and attention.
The level of stress experienced and strategies of dealing with it differ from
one individual to another which is totally fine. How well strategies work for
different people is influenced by individual strengths and skills, hence there is no
‘right’ way to cope. These various psychological mechanisms to cope with stressful
situations are generally termed as coping skills or strategies. Coping, in general,
refers to flexible and productive strategies for reduction of stress levels.
Coping strategies are behavioral as well as psychological efforts. An
individual employs these efforts either to master or to tolerate or to minimize
stressful event or situation. Numerous coping strategies have been discerned.
Categorization of these strategies into a wider architecture has not yet been approved
of. Common distinctions are frequently made between various differing strategies,
like emotion-focused versus a problem-focused; disengagement versus engagement;
behavioral versus cognitive. Three coping strategies have been identified broadly by
Weiten et al. (2014): (i) Appraisal- focused (ii) Problem-focused (iii) Emotion-
focused.
Appraisal-focused coping strategies deal with challenging our own
speculation and improvising the way we think. In short, we can say that it involves
challenging one's assumption as well as it is adaptive cognitive. Generally, it
involves strategies like one can distance oneself from challenging situations or from
problems, an individual can modify his goals or values according to the situation or
one can identify or include humor in the situation which might bring about a positive
spin.

17
Problem-focused strategies are those strategies which are directed towards
either eliminating or reducing the stressor or the source of the problem by finding or
exploring more information about the issue, discovering new strategies or skills for
managing it, or evaluating pros and cons of the alternatives.
Emotion-focused coping strategies are those which are directed towards
reducing or preventing our own emotional reaction. These strategies help in
releasing suppressed emotions either by distracting oneself in another direction or by
managing hostile feelings. These strategies also help in mediating or using
systematic relaxation procedures. Five emotion-focused strategies were identified by
which are accepting responsibility or blaming, disclaiming, exercising self- control,
escape-avoidance and positive reappraisal (Lazarus and Folkman, 1987).
As per Allision (1998), Clark et al. (1999), Pascoe and Richman (2009) the
presence of the phenomenon of stereotype threat can be traced in the framework of
stress and coping proposed by Lazarus and Folkman (1987). As per numerous
viewpoints on coping with stigma (Major and O’Brien, 2005; Miller and Kaiser,
2001), social identity threat and stereotype post appraisal may result in
physiological, cognitive, emotional and behavioral reactions which could be either
voluntary or involuntary responses.
A chain of involuntary responses takes place once an identity- threat
appraisal is made. The probability of failing one’s group results in physiological
stress reaction due to intensified arousal (Ben-Zeev et al., 2005; Blascovich et al.,
2001; O’Brien and Crandall, 2003) and distracting thoughts (Cadinu et al., 2005)
that grip limited functioning memory (Beilock et al., 2007; Schmader and Johns,
2003). Voluntary coping strategies usually accompany such involuntary reactions.
As per Steele and Aronson (1995), it is imperative for individuals to repudiate
negative stereotypes. For example, individuals put in a lot of effort to perform well
(Jamieson and Harkins, 2007). Nevertheless, according to Johns, Inzlicht, and
Schmader (2008); Logel et al. (2009) when confronted with the possibility of failing
their group, individuals may suppress thoughts and deny troubling emotions as a
means of coping.
18
Geving (2007) has said that stress is a widespread phenomenon amongst
teachers and they experience serious stress symptoms (Austin et al. 2005) as teacher
work requires professional competencies and skills, subject or content knowledge as
well as emotional or psychological stability in order to promote effectiveness in job.
An individual’s productivity, efficiency, and quality of work are influenced by stress
resulting in ill effects on one’s health (Comish and Swindle, 1994).
Performance decrease under stereotype threat is a result of three interlinked
factors and one of the factors is physiological stress (Schamander et al., 2008) that
frequently gives rise to stereotype threat. According to Inzlicht et al. (2006),
stereotype threat does not necessarily cause a fall in the performance level in the
stereotyped domain. An individual under stereotype threat can continue performing
at an identical level as a non- threatened person yet would have to put in more effort
to do so. In other words, according to Eysenck and Calvo (1992), performance gets
affected adversely only when an individual fails to cope with and make up for the
inept processing caused by a threat by working harder and putting in more effort.
Whether or not stereotype threat causes performance deficits, individuals will
anyway be led to work harder than in the absence of stereotypes. The extra effort put
in for coping is at times enervating and may leave individuals devitalized for
upcoming tasks – especially ones which demand relentless self- control.
To manage the stress of negative stereotyping ‘resource-demanding’ coping
strategy is suggested. Resource demanding coping strategy includes emotion
regulation and suppression of thoughts (Johns et al., 2008; Logel et al., 2009).
Therefore, to overcome the barriers in the way of job performance of teachers they
have to adapt coping strategies for better adjustment as suggested by Kyriacou and
Chien (2009) that adopting coping strategies is the perfect way to beat stress. An
individual’s mental health keeps getting better the more he adopts adaptive coping
strategies, according to Chaturvedi and Purushottam, (2009) low and under
developed coping ability might result in negative emotional responses and fatigue
amongst teachers, as per Montgomery and Rupp (2005).
In the context of teachers, coping strategies can be defined as any factor such
as physical, social, material or psychological which aid teachers curb stressors
19
related to the job and achieve the valued result with pupils. According to Folkman
and Lazarus (1980), as indicated by research, individuals tackle most stressful events
by using both kinds of strategy. Coping ability differs from one individual to
another. Hence the preponderance of one strategy over the other is partly governed
by individual style as well the stressful event’s type. A problem-solving coping
strategy is a most frequently chosen strategy by teachers to cope with a stressful
situation (Austin et al., 2005). As per Sprenger (2011), social support has also been
explored as the factor which diminishes the negativity of stressors on teachers’
satisfaction with the job, well- being as well as the risk of physical illness.
Griffin (2006) has said that in order to obtain advice, discuss feelings,
receive support emotionally, and receive sympathy and understanding support is
sought by teachers from friends, family and fellow workers. Also, the teachers
having more support within personal lives show a tendency of feeling less stressed
out at the workplace.
According to Gulwadi (2006), when stress is let out by teachers in places
away from the school environment, it is referred to as restorative coping
experiences. The places are chosen for the same show features which are beneficial
in neutralizing the effects of source of stress. Under stress, teachers tend to choose
places that rejuvenate them like home, natural open-air places, places of worship and
cafeterias. Such environments work as stress relievers as teachers experience
sensory conditions, social connection, support and a connection with nature which
mitigate stress.
Guwaldi (2006) has also said that in addition to restorative experiences,
environmental coping resources may also be employed by teachers. Their awareness
of environmental conditions can be of utmost value. The ability of an individual to
be aware of his surroundings can be quite resourceful. Their competence to alter
such a setting with the aim of achieving personal goals is termed as environmental
competence. The readily accessible environmental resources to teachers which can
be used for their spatial and sensory properties are time, social ties, money,
organizational resources and physical environmental resources like locations, etc.
20
According to Bindhu and Kumar (2006) coping with stress can be broadly
divided into two categories: to provide maximal thoughtfulness to a traumatic event
or not pay attention to it at all. Whereas according to Hemmings and Hockley (2002)
stress can be coped up with in several ways like by communicating with others,
helping oneself, relaxing, organizing, engaging oneself in sports, etc. Recreation is
another strategy which moderates the stress thus improving one's quality of life
(McKay, 2008). According to Yang et al., (2009), self- care influences stress
reduction and boosting life quality considerably. One may take care of self by
exercising regularly, engaging in sports, getting appropriate sleep every day,
maintaining the right diet plan, and applying some relaxation technique, etc.
Coping can also be categorized into two i.e. active coping and passive coping
strategy (Montogomery and Rupp, 2005). Active coping strategy includes cognitive
strategies and Behavioral strategies. Cognitive strategies mean imposing control to
self as well as distancing oneself rationally whereas behavioral coping strategy
means appealing advice from others and engaging oneself in easing exercises. The
other is passive coping strategy includes resigning, drinking, wishful thinking,
avoidance which are further ensued by lack of commitment with the stressful event.
There are a number of approaches of coping such as feeling in control,
optimism and pessimism, appraisal and coping (Rubin et al., 1993), approach and
avoidant coping (Chang and Strunk, 1999). Three coping styles were expounded by
Endler and Purker (1990) which are task-oriented (problem-focused), emotion-
oriented coping and avoidance-oriented coping.
Coping generally ranges from positive thinking, resigning from one’s job to
sharing problems at work with one’s partner. Some of these coping behaviors take
place are also observed in frontline workers when they interact with their clients
during public encounters (Bartels, 2013). Coalescing Folkman and Lazarus’ (1985)
definition of coping during the public encounter is the behavioral efforts put in by
staffs of the frontline profession while interacting with their respective consumers,
so as to master, endure and minimalize internal or external demands as well as
clashes faced by them on an everyday basis (Tummers, 2015)

21
1.5. WORKPLACE OSTRACISM
The variable ostracism has been studied extensively in the field of
organizational psychology. The term ostracism is defined as “being ignored and
excluded” (Williams, 1997), has been a feature of human life since ages. It has been
present from the time of Greek legends wherein the deviant people were ostracized
by the natives from their society as a means of retribution. While expulsion and
extradition seem to be severe types of ostracism, at some point of time we have all
been either a subject or initiator of ostracism. Recall the silent treatment given to
loved ones, the cold shoulder given to colleagues when we are disregarded in an
intense discussion (Williams,2001). Ostracism is well rooted in our daily life and we
are well aware of it. For human beings, it is impossible to brush aside the feeling of
being disregarded.
Being one of the targets of the phenomenon of ostracism is hurting.
Laboratory assessments show that brain structures activated by ostracism is similar
to the ones activated while a person experiences physical agony. This indicates that
‘social pain’ induced by ostracism and physical pain are equally real (Eisenberger et
al.,2003; MacDonald and Leary, 2005). A perusal of literature suggests that four
basic human needs are threatened by ostracism which is the need for belongingness,
self- esteem, control and meaningful existence (Williams, 1997, 2001). These
fundamental necessities, which are vital for human motivation and survival, underlie
a wide spectrum of social behavior (e.g. Baumeister et al., 1994; Baumeister and
Leary, 1995; Branden, 2001; Taylor and Brown, 1988; Tesser, 2000). A string of
research work has been undertaken by social psychologists to analyze the effect of
ostracism on the four basic needs. It had been observed that ostracism strips a person
from the group, inducing series of adverse psychological outcomes like dejection,
apprehension, and tension, as per Williams (2001).
Ostracized people have a tendency to regard themselves at fault as a cause of
the displeasing behavior inflicted towards them by others which at times threatens
their self- esteem, says William (2001). Moreover, ostracized individuals experience
a loss of control as their questions, provocations, or other actions prompt no
response. The interaction is one-sided does in no way help in exterminating

22
ostracism, according to Ferris et al. (2008) Williams and Richardson. Eventually,
ostracism coaxes individuals to feel unworthy and having meaningless existence in
others’ eyes and makes them wonder what life would be like if they cease to exist.
According to Sommer et al. (2001) Pyszczynski et al. (2004), such implications of
‘social death’ threaten individuals’ sense of a meaningful existence.
Reports on ostracism primarily encompass studies administered in a
laboratory setting. Although we are aware of ostracism and its devastating impact on
an individual’s basic needs in work setting, little is known about the occurrence of
ostracism at the workplace and its repercussions.
For decades social psychologists have shown a keen interest in ostracism and
conducted numerous experimental laboratory studies to decipher its social
ramifications. Yet organizational psychologists have only recently directed their
attention towards ostracism at the workplace (Ferris et al.,2008). In the light, if the
wide arrangement of theoretical, anecdotal and empirical discoveries from diverse
branches of social science, we believe that ostracism may affect various
organizational consequences like attitude towards work, well- being as well as
behavior. We think this deletion holds significance for various practical and
theoretical reasons.
Firstly, ostracism isn’t uncommon in organizations. Indeed, two recent
surveys indicate that ostracism is actually prevalent in the workplace. One survey
covering more than 5,000 employees revealed 13% of the respondents to have been
debarred from their work (Hitlan et al., 2006). Another survey revealed 66% of
employees to have been given the silent treatment over, 29% disclosed that others
intentionally went away from the place when they entered, and 18% revealed that
they had been positioned in a physically isolated location. (Fox and Stallworth,
2005)
Second, although the concept of ostracism is usually subsumed under
broader concepts such as deviance, socials undermining, aggression and workplace
bullying (Bennett and Robison, 2000; Duffy et al., 2002; Neuman and Baron,1998),
there are merits to examining ostracism as a distinct construct. There have been calls
for researchers to study subtle forms of deviant behavior rather than focusing only
23
on plant floor types of deviance like theft and damage, as per Bennett and Robinson
(2000).
Further, the concept of ostracism is fundamentally related to the failure of an
individual in terms of interaction with others in society i.e. social engagement
(Robinson, et al., 2013) which is described as lack of communication with other
members in organization, institution or society. However, deviance and social
undermining still allow interaction, albeit in an aversive way (Duffy et al.,2002; Fox
and Stallworth, 2005; Neuman and Baron, 1998). For example, aggressive behavior
includes verbal or physical assault and social undermining behavior includes
belittling or criticizing others. These types of aversive behavior involve
interpersonal interactions. This is where ostracism differs because the pain of
ostracism resides in others’ avoidance of interactions (Ferris et al.,2008). Researches
have shown that individuals would rather prefer physical or verbal abuse than be
subjected to ostracism (Williams, 2001) because it is expulsion from interactions
with other individuals that profoundly affect human beings’ fundamentals need for
belongingness and meaningful existence & control. (Zadro et al., 2004). Therefore,
ostracism at the workplace should be separated from broader concepts such as
deviance, social undermining or aggression to avoid any conceptual confusion and
to allow an examination of the unique influence of this workplace phenomenon.
The chances of being subjected to ostracism soar up when those individuals
do not plan to resign from the organization, thus interacting more with the ones who
ostracize. At the same time, there is also a possibility that the subjects of ostracism
would have more impact on the offenders and turning the whole messed up situation
around, according to Romero et al., 2010). Such differences induce targets of
ostracism to react in a different manner than those who feel there’s no chance of
influence to be exerted, as per the subjects in experimental studies (Burgeois and
Leary, 2001; Warburton et al., 2006). The empirical corroboration comes majorly
from laboratory studies, we know little about what happens to people who are
excluded, shunned and ostracized in the workplace. A more systematic investigation
of ostracism in the workplace is thus worthwhile.
To enrich our understanding of workplace ostracism, three lines of research
merit attention. First, the extant ostracism literature reveals little about the factors
24
that affect why certain kinds of individuals are ostracized in a group or organization.
As far as our knowledge serves, the antecedents of workplace ostracism have been
analyzed by just two studies. One examined the Big Five personality traits as
antecedents (Wu and Wei, 2010) and the other investigated goal structure and the
targets’ social skills (Wu, 2010). There is much more that is unknown than is known
about the causes of workplace ostracism. Examples of what is unknown include the
dispositional variables interact with situational variables to jointly influence the
emergence of workplace ostracism. More research attention is needed to investigate
the antecedents of workplace ostracism.
Second, it is well established in the literature that ostracism induces a wide
array of negative emotional consequences, including depression, distress, stress,
sadness, anger and shame (Eisenberger et al., 2003; MacDonald and Leary, 2005;
Leary et al., 2001; Smith and Williams, 2004; Stroud et al., 2000). However, all of
these findings are at the individual level and reveals the triggered feelings in general.
An interesting and fruitful line of investigation would be a focus on interpersonal
emotions, or elicited emotions when interacting with a particular person. Ostracism
is generally regarded as ‘dyadic phenomenon’ that involves an actor and a target
(Hershcovis and Barlign, 2007). It would be thus meaningful to examine a target’s
aroused emotions triggered by a specific actor, rather than simply focusing on
feelings in general. Furthermore, we know little about the factors that moderate the
ostracism- emotion- work performance link. Research is needed to lay the
foundations of borderline conditions under which the distressful emotions resulting
from ostracism may either be aggravated or impaired.
Ostracism is more likely to threaten those for whom the acceptance of the
group is of particular importance (Ellermers et al., 2004; Tyler and Lind, 1992). The
literature suggests that ostracized individuals react to ostracism in various ways out
of which many appear to be contradictory (Williams, 2007). For example, according
to experimental laboratory research on social exclusion ostracized individuals are
prone to decreased prosocial behaviour such as help and cooperation (Tice et al.,
2002; Twenge et al., 2007), whereas other studies show that excluded individuals
can be more supportive, encouraging and obliging (Gardener et al., 2000; Williams
and Sommer, 1997). It has also been found from prior researches that ostracized
25
individuals are more prone to be antagonistic and to demean the perpetrators as well
as those who are not involved in ostracism (Twenge et al., 2001; Warburton et al.,
2006).
According to Griffin (2006), an individual’s performance is determined by
three factors that are the environment at the workplace, motivation, and potential to
work. According to Chandrasekar (2011), the impact of the workplace environment
can influence the morale, job performance and productivity of an employee in both a
positive and negative way. Employees are subject to get demotivated and their
performance adversely affected in case they don’t like the workplace environment.
Workplace ostracism is a word which is assigned to the experience of being
excluded or overlooked in the workplace (Ferris et al., 2008) is a common
phenomenon in organizations (Fox and Stallworth, 2005). Distinctive examples of
workplace ostracism include “silent treatment”; “avoiding conversations or eye
contact” and giving the “cold shoulders” (Ferris et al., 2008; Williams, 2001).
Though the prevalence of this phenomenon is very general in organizations,
researchers have paid very scant attention until recently. Workplace ostracism
significantly impacts both the organization and its employees in a negative way as
suggested by preliminary evidence (Ferris et al., 2008) in aspects of psychological
well- being, attitude towards the job, performance at the workplace and
organizational citizenship behavior, yet little is known about the causes of ostracism.
When individuals at a workplace feel ignored by their colleagues, it is termed
as workplace ostracism (Ferris et al., 2008; Wu et al. 2012). Research on working
bodies revealed that the majority of them felt ignored by their colleagues whereas
others revealed that their colleagues intentionally left the room when they went
inside (Fox and Stallworth, 2005). The phenomena of ostracism impair societal
communication, which is important for human beings in order to attain their
psychological needs. The effects of ostracism in the workplace definitely influence
the psychological wellbeing as well as physical health of the employees (Heaphy
and Dutton, 2008). At present, teamwork has increased considerably in workplaces.
This indicates that social interaction with colleagues is one of the utmost need of
26
employees in an organization (Sundstrom et al., 2000). O'Reilly and Robinson
(2009) labeled ostracism as a variable which best describes the reason for employees
for a discontented sense of fellowship and diminished contributions in the
workplace. According to Ferris et al. (2008), it is surprising that that minimal fact-
finding on workplace ostracism has been done despite its pervasiveness and gravity.
Therefore, to have an understanding of the impact of ostracism on the job-related
outcome is imperative. According to Luthans and Youssef (2007) in recent times,
researchers of positive organizational behavior have stressed upon employee well-
being at the workplace. Such constructive psychological techniques have surfaced
with the aim of focusing on what is right rather than applying the traditional
techniques of understanding the faults within oneself (Luthans, 2002). This school
of thinking has led to the devising of new terminology, ‘psychological-capital’
(Avey et al., 2010). Four elements constitute Psychological Capital – optimism,
hope, self- efficacy, and resilience (Luthans et al., 2007). An employee’s belief
about his/her capability to successfully execute the assigned task is termed as self-
efficacy (Luthans and Stajkovic, 1999). Secondly, having a positive attitude towards
attaining success at present as well as in the future, that is optimism. Thirdly,
perseverance towards goal attainment, and if need be, rechanneling tracks to goals
(hope) in order to achieve success. Fourthly, while experiencing problems and
adverse situations, enduring and rebounding and even beyond (resilience) to achieve
desired outcomes, says Luthans et al. (2007).
The abovementioned review implies that stereotype threat and its linkage to
job performance have been extensively studied in the western world though little
research is available in India despite the length and breadth of the country.
Moreover, the role of negative emotion, anxiety, fear has been studied well but in
India setting the variable has been less researched. The structure of India is a multi-
colored collage of various languages, creed, cuisines, and traditions. The mingling of
people from diverse background facilitates us in broadening the range of our vision
to integrate alternative viewpoints. As we know from our experience that differences
also create partitions which can either be real, imagined or both. An unfortunate rub-
off when boundaries become rigid is the perpetuation of stereotypes around a
particular group of people. In our hierarchical culture, it is crucial for us to
27
understand how stereotypes can alter the mindset and behavior of people, and what
we can do to diminish or moderate their baneful effects. Ostracism and
psychological well-being have not been properly understood in the Indian context.
Therefore, this study will enrich the understanding of Indian culture melee and
devise ways to reduce the harmful impact of divisions in society.
1.6. SIGNIFICANCE OF THE PROBLEM
The teaching profession is considered as one of the highly noble professions.
A teacher has always been considered as a boon to society. The job of a teacher
incudes to aware students what to learn, to challenge them by setting high standards
meanwhile criticizing so as to spur further achievement of students.
Stress at the workplace among teachers is a psychological and physiological
response to the event that upset their personal balance. Experience of Stereotype
threat at the workplace is one of the potential causes of stress (Manjula, 2012;
Schmander et al., 2008). Very few studies in recent times have been conducted
(Trott, 2014; Prasad, 2007; Hoff and Panda, 2004) which is an emerging issue in the
research world today. It has gained a lot of attention across the globe but has not
attracted a little attraction of researchers in India.
Stereotype threat is an unavoidable phenomenon which affects an assortment
of people in various ways. Its belongings have customarily been concentrated in
ladies and ethnic minorities, individuals from different gatherings might be affected
by generalization danger also. For instance, past research likewise has discovered
that when old people are informed that an assignment surveys memory, the resulting
execution is hindered (Levy, 1996). Comparable impacts have been found for non-
defamed bunches too. In particular, when white men are informed that an
assignment surveys athletic capacity, their presentation on a consequent undertaking
is additionally impeded contrasted with dark men (Stone et al., 1999; Stone and
Whinnie, 2008). Its outcomes among females in classrooms, employment context,
leadership context, and entrepreneurial arenas have been studied extensively (Gupta
and Bhawe, 2007; Bergeron et al., 2006; Davies et al.,2002, 2005; Krendl, et al.,
2008). Ford et al. (2004) explored that the activities which demand verbal skills in
males, and on that very moment if men’s are prompted about the relationship of
28
gender with verbal skills making them realize that they have deficient verbal skills,
their performance on that specific activity depreciates. This was further supported by
Seibt and Forster (2004). Thus, we can say that gender and race are the source of
variable stereotype threat and impairing one's performance.
In the Indian setting, there are other potential sources which cause stereotype
threat i.e. religion, caste, and tokenism at the workplace might trigger stereotype
threat among employees in the different job context. Caste and religion are a system
of social stratification and people from different caste and religion have different
beliefs about their caste and religion which foster stereotype thinking. It was
European researchers who explored that in what way or by what means group
processes and an individual’s social identity affect bias (e.g., Tajfel and Turner,
1979).
Stereotype threat has been examined in an academic context which includes
samples of the elementary, middle, high school as well as college-going learners
(Ambady et al., 2001; Mckown and Weinstein, 2003; Neuville and Croizet, 2007;
Kellow and Jones, 2008). However, in the Indian settings, no study has been
conducted in the teaching sector involving students, teachers or administration.
High level of self-consciousness and threat is experienced by tokens. The
experience of the high level of self-consciousness reduces their ability to think as
well as act effectively (Lord and Saenz, 1985; Sekaquaptewa and Thompson, 2003).
Negative stereotyping results in stereotype threat among individuals and
threat evoke negative emotions and feelings of being ostracized by the dominant
group members. The development of these emotions in the target of stereotype
threat, increases the probability of mental-exhaustion and burnout (Hall et al., 2015),
negatively affects family and health outcomes, increases work-family conflict and
workplace deviance (Grandey et al., 2005; Lee and Allen, 2002), decreases
organizational citizenship behavior and job performance (Lee and Allen, 2002;
Cropanzano et al., 2003).
At the point when the stereotype threat is evoked, people endeavor to
manage their feelings or emotions. They endeavor to check their nervousness. To
29
accomplish this objective, they regularly endeavor to smother or dismissal the
negative stereotypes of their gathering or group. Dealing with the worry of negative
stereotypes includes Resource demanding coping techniques, for example,
regulation of emotions and thought concealment (Johns et al., 2008; Logel et al.,
2009).
While scientists have started to dig into the complexities with respect to the
process due to which stereotype threat diminishes employees’ performance as well
as promote additional negative impacts. There is still much research required so as
to totally comprehend the mechanisms of Stereotype Threat
The phenomenon of stereotype threat is very much prevalent in today’s
society. Every individual especially those who are working, at least once in his
lifetime must have experienced stereotype threat. Stereotypes are often
unintentionally reinforced by educational officers or by the government itself.
Therefore, the present study is an effort to add to research knowledge on stereotype
and job performance in the teaching sector. Current research will offer us insight
about the role of social identity (gender, caste, religion, and tokenism) in triggering
stereotype threat as well as its impacts on teaching fraternity. The study is also an
attempt to explore the mechanisms stereotype threat due to which it affects job
performance. This exploration of the mechanism will help us to instigate so as to
remediate some of the destructive impacts of stereotype threat on humans. Though
some constructs have been studied there is still no definitive answer and there is a
need to do research on this important aspect which gets triggered by even small
daily happenings in and around the society.
1.7. RESEARCH TOPIC
The present study is entitled as “ Stereotype Threat and Job Performance:
Role of Hedonic Wellbeing, Coping Strategy and Workplace Ostracism among
Teachers:
1.8. OPERATIONAL DEFINITIONS OF THE CONSTRUCTS
Stereotype Threat (ST): It is a psychological phenomenon that constrains
the performance of individuals who highly identify themselves with the domain

30
where negative stereotypes about their social identity are highlighted thereby
increasing concerns about being stigmatized by the out-group members.
Job Performance (JP): The job performance of teacher is defined as
“Duties performed by a teacher in the school system in achieving organizational
goals in terms of task performance, contextual performance and counterproductive
work behavior”.
Hedonic Wellbeing (HWB): It refers to the “Emotional quality of an
individual’s everyday experience, the frequency, and intensity of experiences of joy,
fascination, anxiety, sadness, anger, and affection that make one’s life pleasant or
unpleasant”.
Coping Strategies (COPE): It can be defined as specific effort’s which can
be behavioral as well as psychological that individuals employ to master, tolerate,
reduce, or minimize stressful events.
Workplace Ostracism (WOS): Workplace ostracism can be defined as
“The exclusion, rejection, or ignoring of an individual (or group) by another
individual (or group) that, hinders one’s ability to establish or maintain positive
interpersonal relationships, work-related success, or favorable reputation within
one’s place of work”.
Tokenism (TOK): It is a perceptual phenomenon in which tokens or solo
status individuals feels highly visible and polarized in a numerically dominant group
in an organization.
1.9. RESEARCH OBJECTIVES
The main research objectives of the present study are as follow:
1) To identify the role of caste category, religion, gender, and tokenism causing
stereotype threat.
2) To establish the relationship between stereotype threat and job performance.
3) To study the relationship between (a) Hedonic Wellbeing and Coping
Strategies; (b) Hedonic Wellbeing and Workplace Ostracism; (c) Coping
Strategies and Workplace Ostracism.

31
4) To study the role of Hedonic Wellbeing, Workplace Ostracism and Coping
Strategies on the relationship between Stereotype Threat and Job
Performance.
1.10. RESEARCH HYPOTHESES
To study the above-mentioned research objectives following hypotheses
were framed after reviewing the literature.
1) There is no significant difference of caste category (C), gender (G), religion
(R) and tokenism (TOK) on Stereotype Threat (ST).
2) (a) There is no significant relationship between Stereotype Threat (ST)
and Task Performance (TP) dimension of Job Performance (JP).
(b) There is no significant relationship between Stereotype Threat (ST)
and Contextual Performance (CP) dimension of Job Performance
(JP).
(c) There is no significant relationship between Stereotype Threat (ST)
and Counterproductive Work Behavior (CWB) dimension of Job
Performance (JP).
3) (a) There is no significant relationship between Hedonic wellbeing
(HWB) and Coping Strategies (COPE).
(b) There is no significant relationship between Hedonic wellbeing
(HWB) and Workplace Ostracism (WOS)
(c) There is no significant relationship between Coping Strategies
(COPE) and Workplace Ostracism (WOS)
1.11. RESEARCH QUESTIONS
4) (a) Is the causal relationship between Stereotype Threat (ST) and Job
Performance (JP) mediated by Hedonic Wellbeing (HWB)?
(b) Is the causal relationship between Stereotype Threat (ST) and Job
Performance (JP) mediated by Workplace Ostracism (WOS)?
(c) Is the causal relationship between Stereotype Threat and Job
Performance mediated by Coping Strategies (COPE)?

32
1.12. DELIMITATION
The study is delimited to the following areas.
1) The study is delimited to teachers working in government schools only.
2) The study is delimited to eastern districts of Uttar Pradesh.
33
CHAPTER – II
REVIEW OF LITERATURE
The present chapters deal with the review of literature on the constructs
stereotype threat, job performance, hedonic wellbeing, coping strategy, and
workplace ostracism. The review on each construct is followed by the summary of
the presented reviews. Section 2.1 details the review on stereotype threat and its
impact on other constructs, the next section 2.2 provide a review about Job
Performance among employees, the other sections 2.3, 2.4, 2.5 and 2.6 presents the
reviews on Hedonic Wellbeing, coping strategy, Tokenism, and Workplace
Ostracism respectively. The last section 2.7 presents a summary of the reviews on
the aforementioned constructs.
2.1. STEREOTYPE THREAT (ST)
Most of the studies on stereotype threat were conducted on experimental
setups. This section is an attempt to present the review on stereotype threat and its
deleterious effect in an academic setting. The reviews have been presented in
chronological order which is as follow:
Shih et al. (1999) examined identity salience and stereotype susceptibility.
The data were collected from Asian American undergraduate females. The results
reported that activation of individuals social identity does facilitate performance
decrements on assigned tasks. It also explored that when social identity is explored
the performance of the target gets altered towards the predicted direction.
Branscombe et al. (1999) examined perceiving pervasive discrimination and
its implications for group identification and wellbeing. The study involved processes
associated with wellbeing support among African Americans who contrasted in their
attributions to bias were analyzed. The study included African and American males
and females. The result of the data after analysis reveals that a stable attribution
towards biases indicates dismissal by the predominant gathering. Therefore,
observing discrimination or biases on the basis of prejudice adversely impacts
mental-wellbeing.

34
Schmader (2001) examined the correlation between social identity and
stereotype threat. The source of data was Caucasian undergraduates. The study used
a quasi-experimental method which indicated individual differences in gender
identification moderate the effect of gender identity. It was revealed that women
with a higher level of gender identification perform worse when compared to
women with a low level of gender identification.
Ambady et al. (2001) examined the stereotype susceptibility among children.
The study attempts to examine the effects of positive as well as negative stereotypes
on individuals’ cognitive performance of different age groups (lower elementary
school, upper elementary school, and middle school). The results after the analysis
confirmed a shift in the performance of individuals before and after the activation of
positive and negative stereotypes. It has been observed that the cognitive
performance of an individual is decreased when negative stereotypes have been
activated indirectly whereas an increase in cognitive performance is observed when
indirectly positive stereotypes have been activated.
Major et al. (2002) studied personal discrimination and the role of group
status in legitimizing ideology. The data was collected from undergraduate male and
female students from the University of California, Los Angeles. The samples for the
data consist of European American, Latino-Americans and African-Americans. The
analysis of the collected data reveals that high-status ethnic group members perceive
less personal discrimination when compared with members of low-status ethnic
groups.
Schmitt et al. (2002) studied perceived discrimination on gender and its
impact on wellbeing. The data was collected from the undergraduate’s males and
females. The analysis of the collected data was done using structural equation
modeling. The analysis revealed that perceived discrimination harms psychological
wellbeing. Further, it was explored that only female’s psychological wellbeing gets
hampered due to perceived discrimination. The study supported that females do
partially cope with the negative wellbeing by strongly identifying oneself with one’s
gender. Whereas, amongst men, the results indicated that group identification is not
related to perceived discrimination.
35
Roberson et al. (2003) examined the relationship of stereotype threat to
feedback seeking and feedback acceptance. The responses were collected from
employees of utility industries who were also the member of ‘National Association
of African American Professionals’. Regression was used to analyze the data which
indicated that African American who were only representatives of their group
(Tokens) in their department experience more stereotype threat when compared with
other employees of the same department. The results also indicate that experience of
stereotype threat rejects feedback seeking and feedback acceptance.
Steele and Davies (2003) tested the experience of stereotype threat in the
workplace. The study included articles on stereotype threat and workplace setting.
The overview of those articles revealed about the contextual nature of stereotype
threat. It was concluded that negative stereotypes about social-identity i.e. gender,
religion, caste, race, etc. influence the behavior of both in-group as well as out-group
members. The study also stated that the strength of stereotype threat depends on the
numbers as well as the strength of the cues available in the setting in which
stereotypes occurs.
Bergeron (2006) investigated the stereotype threat’s effect on job
performance. The collected data was provided by both men and women. The
respondents were pursuing graduate courses in organizational psychology. The
results indicated that women were more prone towards the experience of stereotype
threat. Though the magnitude of the effects of stereotype threat varies but one with
strong identification to their gender advocates the stereotype threat thereby affecting
their performance negatively.
Neuville and Croizet (2007) examined the salience of gender identity in
relation to math achievement. The data was collected from French children.
Considering the theory of stereotype threat, it was hypothesized that activation of
gender identity was due to the negative reputation of social category an individual
belongs to. The result of ANOVA revealed that on activation of gender identity,
girls underperformed in mathematics whereas boys performed well. It was also
revealed that students belonging to both the genders performed equally well in
difficult problems in the absence of gender identity activation.
36
Gupta (2007) analyzed the proactive personality of entrepreneurs in abating
the impact of gender-related stereotypes to be an entrepreneur. Data which was
collected from young women reflected that proactive women were primarily
affected by the commonly held stereotype about entrepreneurs and exhibited a
considerable reduction in entrepreneurial intents as compared to less proactive
women.
Laar et al. (2008) stereotype threat was influenced by one’s social and
personal identity. The effect was examined on black and Latino students through a
longitudinal study. The results showed that stereotype threat will have
its result owing to issues for the self (identity stereotype threat) or owing to issues
for the cluster (Social identity stereotype threat). It also revealed that activation of
ones’ social identity evokes stereotype threat which negatively affects the
performance. The study further explored that individual who has high domain-
identification are more prone to experience stereotype threat than individuals low in
domain identification. Further, it is also found that individuals who have a strong
identification with one’s domain get easily affected by the negative outcomes of
stereotype threat.
Brunette et al. (2010) examined how individual differences in belief about
the pliability of leadership abilities affected stereotype threat’s responses. Data were
collected from undergraduate women from Liberal Arts College, U.S Southeast. It
was revealed from the results that after experiencing stereotype threat women
exhibited lower self- evaluation.
James et al. (2011) tested the effect of adding job relevant context (which is
traditionally male stereotyped) to cognitive ability test could negatively affect
female performance. The responses were gathered from undergraduate students from
a Midwestern university. The collected data was analyzed and the results indicated
that the perception of subject or face validity of the test negatively affects the
stereotyped sub- group, as well as the negatively viewed sub-groups, experience
emotional and psychological stressors that eventually affect performance-related
outcomes.

37
Berjot et al. (2011) conceptualized transactional stress model, which focused
on assessing how targets reacted to a situation under stereotype threat in the context
of primary appraisals (risk) and also to examine if those appraisals affect the
performance and stereotype threat connection. The data was collected from students
of three different French secondary schools which included French pupils of North
African origin along with students of French origin. The results demonstrated that
members of North African inhabitants of France considered the circumstance more
of a danger and less of a test.
Mangels et al. (2012) discussed how emotions affected learning under
circumstances dealing with stereotype threat. The data was collected from
undergraduate females of Columbia. Both univariate and variable approaches
were thought-about to explore the connection between feeling and stereotype threat.
The analysis discovered that under the influence of stereotype threat, disengagement
and interference in learning as well as in learning attempts can be noticed as an
individual’s emotional response to stereotype threat.
Tagler (2012) examined the effects of a positive social stereotype on
individuals’ math ability. The data was collected from college students of the
American University. The analysis of the data revealed a decrease in the
performance of individuals high in self-consciousness and low in gender
identification when their gender identity was activated.
Pennington et al. (2012) conducted a systematic review of the literature on
stereotype threat from 1995 to 2015. The electronic database search recognized
forty-five experiments from thirty-eight research papers as well as seventeen unique
proposed mediators were also found which was further classified into the affective,
cognitive and motivational mechanism. The study outlined anxiety, negative
thinking, and mind-wandering as mediators in stereotype threat researches. The
study also briefed researches which pointed out the experience of stereotype threat
motivates individuals to disconfirm negative stereotypes.
Galdi et al. (2014) studied the association of stereotype threat on girls
performance. The data was collected from childrens of six years old. The results
indicated that math performance of girls decreased due to the experience of
stereotype threat.

38
Hoyt et al. (2016) reviewed the model of stereotype threat to explore the
effects of this phenomenon on women in leadership context. The study explored
various empricial and conceptual paper on stereotype threat and indicated that
gender related stereotypes about leadership role of women does hamper their
performance.
Weber et al. (2018) conducted research to study the influence of the
experience of stereotype threat on educational trajectories of immigrant students.
The data was collected from four different Austrian schools. The collected data was
analyzed and the results revealed that strong identification with one’s ethnic identity
is found to be positively related to strong stereotype threat experience. Further, it
was also stated that with higher experience of stereotype threat lower level of
academic belonging is observed.
Summary
Stereotype threat is a self-affirming conviction that one might be assessed in
light of a negative generalization about one’s social identity to which he/she belongs
(Steele et al., 2002). An individual’s concern with one’s social as well as personal
identity is responsible for the experience of stereotype threat (Laar et al., 2008).
Activation of social identity (Gender, Religion, Caste, socio-economic status, etc) of
an individual during the performance of the stereotyped domain leads to decreased
performance. It is being observed that activation of gender identity of suppressed
gender (Female) results in performance decrement (Neuville and Croizet, 2007). For
example, a study by Ambady et al., (2001) explored that activation of gender-related
stereotypes is responsible for the poor performance of females in the test which
assesses their mathematical ability whereas male performed comparatively better.
Stereotype threat can also impact the same person in different ways,
depending on which aspect of their identity is made silent. It was observed that
Asian women performed better in math test when their ethnic-identity is activated
whereas it was found that same group of females performed poor on a test when
gender-related stereotypes were activated (Shih et al., 1999)
A higher level of gender identification among women results in their poor
performance when compared with women with low gender identification
39
(Schmander, 2001). Similarly, among men, it is also found that the decrease in
performance of male is noted with high self-consciousness and low in gender
identification (Tagler, 2012). James et al. (2011) concluded in his study that females
underperform in tasks which are traditionally male-dominated task.
Bergeron (2006) reveals that individuals highly identified with one’s gender
more frequently experience the negative effects of stereotype threat which
eventually results in their poor performance. Gupta (2007) claimed that one who has
a more proactive personality was more prone to the experience of stereotype threat.
It has also been observed that people from lower-class or status, more frequently
experience stereotype threat in comparison with those who belong to high status or
class (Major et al., 2002; Schmitt et al., 2002).
Basically, stereotype threat is a situational pickle that influences people when
they are in danger of affirming to an antagonistic group stereotype, which further
disturbs and weaken performance or goals of the target (Davies et al., 2002; Steele
and Davies, 2003).
The relation between job setting and stereotype threat is demonstrated by
Roberson et al. (2003) in his study which revealed that being a token or solo
representative of one’s group in an organization invokes a stronger perception of
being negatively stereotyped which provides the experience of stereotype threat.
Discrimination on the basis of social and personal identity results in the
experience of stereotype threat which further negatively impact one’s psychological
wellbeing (Schmitt et al., 2012). As indicated by “Rejection-Identification” model
proposed by Branscombe et al. (1999) observing discrimination or biases on the
basis of prejudice adversely impacts mental-wellbeing. Individuals who perceive
negative conduct towards them (like failure to get a coveted position or job, being
told a flat you need for lease is inaccessible) due to prejudice often encounter
depression, pity, and helplessness (Schmitt and Branscombe, 2002). Individuals
experiencing stereotype threat also experience emotional and psychological stressors
that eventually affect their performance (James et al., 2011). Mangels et al (2012)
observed that under the influence of stereotype threat, disengagement and
40
interference in learning as well as in learning attempts can be noticed as an
individual’s emotional response to stereotype threat.
After the experience of stereotype threat lower self-evaluation is observed
among the targets (Burnette, 2010) as well as they perceive appraisal more as a
danger than as a test (Berjot et al., 2011). Stereotype-Threat’ is characterized as the
dread or tension that an individual can encounter when they are faced with affirming
a negative stereotype about their social-group to which they belong (Schneider, et
al., 2012).
2.2. JOB PERFORMANCE (JP)
This present section of this chapter deals with the review on the effect of
performance, its outcomes and its relationship with other constructs. It also contains
reviews on factors which affects job performance. The reviews are presented in
chronological order.
Ruth (1992) examined the relationship of external-rated job performance to
self-perceived performance and self-competence. The data was collected from
working nurses. The data were analyzed using the ANOVA technique. The analysis
of the data revealed that there exists no significant difference among sub-groups of
nurses with respect to their demographic variables. Whereas, results from partial
correlation analyses showed no significant relationship among self-perceived overall
performance, personality measures of self-competence, and external-rated overall
performance. Job satisfaction was found to have both intervening and suppressing
effects on the relation shared by perceived performance and external-rated
performance. Additionally, job satisfaction with professional accomplishments,
autonomy in decision making, utilization of knowledge and skills, and overall level
of job satisfaction within an organization, were found to be related to self-perceived
performance abilities
Jamal and Baba (2001) studied the relationship between behavior (type-A),
job performance and well-being. The data was collected from college teachers
working in Canada. Data was collected through a structured questionnaire from
college teachers of Canada. The findings suggest no relationship between behavior
41
(type-A) and three measures of job performance (Teaching hours, No. of course
preparation per semester and No. of students). The analysis further revealed a
positive relationship with employee’s burnout and turnover motivation and negative
relation with perceived social support and work satisfaction.
Rothmann (2003) in his study determined the relationship shared by
personality dimensions with job performance. The data was collected from
employees of the pharmaceutical company by designing a cross-sectional survey.
The collected data was analyzed and the results revealed that emotional stability,
openness to experience, extraversion and conscientiousness relates to the task
performance and creativity of employees.
Janseen (2004) explored employee’s goal orientation, quality of leader-
member-exchange and the aftermaths of performance and satisfaction. The data was
collected from working employees of Dutch organizations. The analysis of the
collected data revealed that the quality of leader-member-exchange mediated the
relationship between mastery-orientations. Whereas, performance orientation was
negatively related to the aftermaths of job performance and job satisfaction. The
findings further suggest that those employees who have stronger mastery
orientations are more effective in their respective jobs.
Carmeli (2007) examined the role of organizational-performance in
summoning workers' identification, alteration, and performance in the workplace.
The outcomes uncovered that organizational-performance is related to employees
organizational-identification. Further, it was additionally investigated that 'Apparent
Social Responsibility and Development' largely affected organizational-
identification than perceived 'market and financial performance' which results in
upgraded work results (Adjustment and Job Performance) of bosses.
Chang (2007) examined the effect of an employee’s job performance on their
project performance. Four dimensions (task, behavior, management, and self) were
extracted though exploratory factor analysis. The extracted four dimensions of
performance were hypothesized as independent variables and project performance as
the dependent variable. The hypothesized model was further tested through path
analysis and the result revealed that the task category of performance is significantly
42
related to project outcomes. Hence it is concluded that attributes like responsibility,
quality of work, job knowledge, experience, efficiency, and accuracy are important
for the success of any project.
Jing (2008) investigated the staff's activity stress and work performance in
the undergrad training appraisal. The data was collected with the help of survey and
interview schedules from teachers working in universities in China. The collected
data was analyzed and the results revealed that scholastics were working under
moderate dimensions of strain and pressure from their activity explicitness and
hierarchical practice and larger amounts of strain and pressure from their self
desires. Secondly, it has been explored that there exists a U-shape connection
between stress and work performance and these work-setting stress negatively
affects the teaching-effectiveness
Saetang (2010) studied the factors affecting the job performance of
employees. A correlational-research design was used to collect the responses
regarding job performance from staffs of juvenile vocational training Centre for
boys in Bangkok. The survey comprises of information regarding demographic
details, goal-setting, role-ambiguity, job-satisfaction and perceived job performance.
The results revealed a negative effect of role ambiguity on perceived job
performance.
Bakker and Bal (2010) tested a model of week work engagement to predict
job performance among starting teachers. The data were collected from teacher
training colleges in Netherland by the use of questionnaire consecutively for five
weeks. The analysis of the collected data revealed that teachers job resources were
found to be positively related to their level engagement. Further, it was also reported
that the level of their work engagement is predicted by their job-performance.
Lin and Chan (2011) examine the influence of employee savoring on the
establishment of perceived job performance. Further, the employee’s positive
affectivity has been hypothesized as a moderator between the relation shared by
savoring and job performance. The responses were collected from sales employees
of the insurance company in Tawain. The results indicated a positive relationship
between savoring and perceived job performance of employees. The analysis also
43
confirmed the hypothesis of employee's positive affectivity as a moderator between
the relation shared by savoring and perceived job performance.
Uchendu (2011) established the relationship between managerial variables
and job performance in an educational context. The data was collected from
secondary school teachers of Cross River State. To collect the data ex-post facto
research design was used. After the examination of the gathered information, the
outcomes uncovered a critical connection between teachers’ motivation and training
with their performance. In light of the discoveries and finish of the investigation, it
was suggested that school administrators (bosses) ought to receive persuasive
systems and give educators chances to attend training programs on a regular basis.
Chuan (2012) investigated the impact of ‘flow experience’ on ‘Job
performance’. The data were collected through a mail survey from elementary
school teachers. The analysis was done through hierarchical regression. The analysis
of the data indicated a positive impact of flow experience in a teacher’s job
performance. Further, the personality traits of conscientiousness and emotional
stability were explored to play the role of moderator between flow experience and
job performance link.
Jankingthong (2012) investigated existing literature to explore factors which
affects job performance. Structural Equation Modelling (SEM) was used to analyze
the data which explored organizational-justice, work-engagement and public-service
motivational directly affects the job performance whereas the other factor
(transformational leadership) has both direct as well as indirect effects on Job-
Performance.
Ushop (2013) explored the relation shared by work performance and job
satisfaction among teachers. The data was collected from working teachers of
Citabato city. Majority of the teachers had 11 to 15 years of teaching experience.
The results indicated that one that has a high level of satisfaction with one’s job was
found to be more creative and productive which eventually results in a high level of
job performance.
44
Azam (2013) investigates the kind of relation shared by Job Stress,
Performance, and Emotional Intelligence. The data was collected with the help of
questionnaire from working teaching staffs of public and private universities of
Pakistan. The collected data was analyzed which explored that job stress and job
performance share a negative relationship. Further, it was also revealed that
emotional intelligence and job performance share a positive relationship.
Hanzaee (2013) investigate the effect of Emotional Intelligence,
organizational citizenship behavior and satisfaction with a job on the performance of
the employees. The study was conducted on employees of the Iranian hotel industry.
A questionnaire was constructed and distributed among employees to collect their
responses. The collected data was analyzed and results indicate that emotional
intelligence positively impacts job satisfaction, organizational citizenship behavior,
and job performance.
Cheng (2013) investigated on principals’ leadership behavior and its effects
on job performance. The study was conducted on teachers of the kindergarten of
Taiwan. The questionnaire was used to collect the data which was analyzed using
regression and structural equation modeling analysis. The analysis of the data
revealed that empathetic concerns and assertive orders showed by the leaders
(principals) towards their teaching staffs have a positive influence on their
performance. Whereas further findings suggest that rewards and punishments had no
huge impact on improving educators' work performance.
Hall (2014) investigated the effects of job-preference and job-matching
assessment on performance and satisfaction of individuals. The data was collected
from 19 to 20yrs old young adults with developmental disabilities. The analysis
results revealed that participants with high-preference and high-matched jobs were
found higher productivity.
Irwaandy (2014) assessed the role of motivation on performance among
teachers. The data were collected from teachers of Indonesia. The analysis of the
data revealed that a good salary is rated high in providing motivation for better
performance among teachers community.

45
Saka (2014) investigated the levels of motivation, job satisfaction, and job
performance. The data were collected with the help of questionnaires from library
staffs of government and the private university of Nigeria. The collected data was
analyzed and the results indicate the presence of a moderate level of motivation and
job satisfaction instead of a high level of job performance among library personnel.
Ahmed (2014) identified the relationship between selected factors of job
satisfaction and job performance. A questionnaire was used to collect the data. The
data was collected from employees working in the oil palm industry located in
Malaysia. The results indicated a significant relationship between factors (pay, work
itself, promotion, supervision, and co-workers) of job satisfaction and Job
Performance.
Yusoff and khan (2014) validated a scale of job performance by Goodman
and Syyntek (1999). The questionnaire was distributed among teachers working in
public and private universities in Pakistan. The reliability and validity of the scale
were calculated by Cronbach Alpha and Exploratory & confirmatory factor analysis
respectively. The result reveals a good psychometric property of adapted scale.
Thus, the scale was considered reliable and valid to assess the performance level
among university teachers.
Fu (2014) conducted a study to explore the role of caring climate, job
satisfaction and organizational commitment on employee’s performance. The
response was recorded with the help of a questionnaire from employees working in
an insurance company in China. The SEM results indicated the significant direct
impact of caring climate on an employee’s satisfaction with the job, and with
performance. The results also indicated an indirect impact of caring climate on
organizational commitment with job satisfaction as a mediator.
Muindi (2015) studied the quality of work life, personality, job satisfaction,
competence, and job performance. The study found that job satisfaction is not the
only factor which can lead to better performance but possessing the right
competence is also important for performance.

46
Bal (2015) anticipated that accessibility and utilization of adaptability HRM
would be emphatically identified with representative commitment, just as higher
occupation Performance. A longitudinal report among US representatives and an
investigation among workers in 11 nations over the world demonstrated that
Engagement mediated the connections between the accessibility of adaptability
HRM and employee performance. Additionally, incomplete help for the directing
job of age in the relations of adaptability HRM with the results: Flexibility HRM
was significant for more youthful laborers to improve commitment, while for more
established specialists, it upgraded their activity execution. The examination
demonstrates that the viability of adaptability HRM relies on worker age and the sort
of result included, and subsequently, the hypothesis on adaptability at work should
consider the time of representatives.
Olumade (2015) studied the relation shared by gender, stress and academic
job performance. A descriptive survey of correlational type was selected as a
research design to collect the data. The data was collected from various institutions
in Anambra State in Nigeria. The results indicated gender and stress as significant
factors which influence the job performance of academic staff. Therefore, it was
concluded that the workload of teaching faculty should be reduced so as to increase
the efficiency and effectiveness in the teaching-learning process.
Aktag (2015) contemplated computer ‘self-efficacy’ and anxiety and their
relation with performance and individual results. The data was collected by adapting
a survey developed by Compeau and Higgins from physical education teachers. The
analysis of the data revealed there exists a positive relationship between employees’
computer self-efficacy, performance, and personal outcome. Further, the findings
also revealed that there exists a negative relationship between employees’ computer
self-efficacy and anxiety level. The study also revealed that increased duration of
computer usage is responsible for increased computer self-efficacy and decreased
anxiety level.
Durrah (2016) studied the influence of an individual’s psychological capital
on their level of job performance. The data was collected from faculty members of
Philadelphia University by using a structured questionnaire. The collected data were
47
analyzed by using multiple regression which indicated a high level of awareness
among the faculty members towards the concept of psychological capital and job
performance. It was found that there exists a significant effect of psychological
capital (‘Hope’, ‘self-efficacy’ and ‘Resilience’) on job performance. Whereas, the
fourth dimension of psychological capital (optimism) does not significantly affect
any dimension of job performance.
Khan (2016) analyzed the link between assets, work-engagement, and
performance. The data was collected from academic staffs working in universities in
Pakistan. The study used a cross-sectional survey design. The analysis of the
demographic data revealed that the majority of academic staffs aged between 20-
40yrs are married and were holding occupational places of Lecturers and Assistant
Professors. Further, the quantitative analysis (SEM) of the data revealed that
organizational resources are positively linked with work engagement and
performance. Work engagement also plays a mediating role in the relationship
between organizational resources and work performance.
Song et al. (2018) examined job performance in learning organizations with
self-efficacy and work engagement as mediating factors. The data was collected
from teachers working in Korean schools. The analysis of the data revealed that
teacher’s self-efficacy is positively related to their job performance.
Summary
Performance of any individual can be described according to their area of
work. In general job, performance is the ability to skillfully combine the required
behavior of employees so as to achieve the organizational goals and objectives.
Psychologists classify behavior in two types Type-A (dominant behaviors and
intense emotional reactions like competition, impatience, hostility, and aggression)
& Type –B behavior (live at lower stress level). Jamal and Baba (2001) in their
study suggested that there exists no relationship between behavior (type-A) and
three measures of job performance (Teaching hours, No. of course preparation per
semester and No. of students). The analysis further revealed a positive relationship
with employee’s burnout and turnover motivation and negative relation with
perceived social support and work satisfaction.
48
It has been revealed that there is a positive impact of flow experience in a
teacher’s job performance. Further, the personality traits of conscientiousness and
emotional stability were explored to play a role of moderator between flow
experience and job performance link (Chaun, 2012). Further Song et al. (2018) also
explored that individuals’ self-efficacy and job performance share a positive
relationship which can be measured using Likert scale e.g. job performance scale by
Goodman and Syyntek (1999) which was re-established by Yousuff and khan
(2014).
Several factors influence the performance of employees in an organization or
institution. Factors like pay or good salary, amount of work, promotion, supervision,
and co-workers share a significant relationship with the work performance of an
employee (Ahmed, 2014; Irwaandy, 2014). Employees satisfied with one’s job
perform better than the employees who are not satisfied with their jobs. Teachers
who are satisfied with their jobs display a high level of performance which
eventually contributes to productivity and creativity (Ushop, 2013). Participants with
high-preference and High-matched jobs were found higher productive (Hall, 2014).
For enhancement in one’s performance satisfaction is not the only factor but
possessing of right competence (Muindi, 2015), Job resources (Bakker and Bal,
2010; Khan, 2016), Computer self-efficacy (Aktag,2015), training (Uchendu, 2011),
Caring climate of organization (Fu, 2014), stronger mastery orientation
(Janseen,2004), organizational justice (Jankingthong, 2012), Emotional stability,
extraversion, and conscientiousness (Rothman,2003) have a significant direct impact
on an employee’s job performance which eventually improves the performance.
It has been reported by various researchers that teaching faculty experience
more stress. It has been explored that stress and performance link share a negative
relationship (Azam, 2013). Stress significantly affects the teaching effectiveness of
teachers which eventually affects productivity (Jing, 2008). Olumade (2015)
reported that gender and job stress are significant factors which influence job
performance. Role ambiguity among teachers is another source of stress which
negatively effects job performance of teachers (Saetang, 2010).
49
Stress in any job can be handled intelligibly if one has good emotional
intelligence. The study empirically validated that emotional intelligence and
performance link share a positive relationship (Azam 2013). The empathetic
concerns by the principal can also to some extent lessen the stress as empathetic
concerns are positively related to teacher’s performance (Cheng, 2013).
A psychological resource like hope, self-efficacy, and resilience also helps
an individual to overcome stressful situations. Durrah (2016) stated in his study that
dimensions of psychological capital (Hope, Self-efficacy, and resilience)
significantly affect all the dimensions of Job Performance.
2.3. HEDONIC WELLBEING (HWB)
The present section is an attempt to present the reviews on Hedonic
wellbeing. There are very few articles which are published with the word ‘Hedonic’
in the title from the year 2000 to 2019. However, in the present section, the
investigator has tried to present the reviews on hedonic wellbeing considering the
word both either in the title or anywhere in the article.
Ryan and Deci (2001) conducted a study on hedonic wellbeing and
Eudaimonic Wellbeing. The study used secondary data for the study. Thus, a
systematic review of the literature was considered for the meta-analysis. The meta-
analysis of the review indicated that hedonic wellbeing as the level of familiarity of
an individual with pleasant and unpleasant life experiences.
Deci and Ryan (2006) explored wellbeing from hedonic and eudemonic
perspective. Recent researches have been included in the study to explore wellbeing
from both the perspectives. The study proposed that wellbeing measure is
incomplete if hedonic wellbeing is not included in the measure. Further, the study
also supported that hedonic wellbeing is based on the concept of experience of the
high level of positive affect and low level of negative affect.
Kashdan et al. (2006) studied the effect of dispositional gratitude on hedonic
wellbeing and eudemonic wellbeing. The data was collected from a combat veteran
with PTSD and without PTSD. The analysis of the data indicated that individuals
with PTSD exhibited lower dispositional gratitude which results in lower positive
50
affect (Hedonic Wellbeing). Moreover, it was also established in the study that
greater daily positive affect is predicted by the dispositional gratitude of an
individual.
Waterman et al. (2008) studied the two concepts Hedonic and Eudaimonia
happiness. The data were collected from undergraduate’s students of the college in
New Jersey through a questionnaire. The collected data were analyzed using
correlation. The correlation analysis indicated there exist a significant strong
relationship between hedonic enjoyment and self-determination eventually resulting
in one’s hedonic wellbeing.
Johnno (2011) investigated the contribution of spirituality and religiousness
to hedonic and eudemonic wellbeing. The data were collected from undergraduate
students from the University of Tehran, Iran. The next step is to analyze the
collected data, which was done with the help of techniques like multiple regression
and bi-variate correlation. The analysis of the data showed that hedonic wellbeing
and eudemonic wellbeing were positively related to spirituality and religiousness.
Further, it was revealed that spirituality is a stronger predictor of hedonic and
eudemonic wellbeing when compared with religiousness.
Stone et al. (2013) studied on the topic titled ‘conceptualizing Experienced
(or Hedonic) Wellbeing. The study briefed previous researchers on hedonic
wellbeing and concluded hedonic wellbeing as an emotional or affect component of
experienced wellbeing. It also indicated that the term hedonic wellbeing and
emotions are one and the same or synonymous. Therefore, it was concluded that
hedonic wellbeing can be interchangeably used for emotional wellbeing.
Nelson et al. (2014) examined Self-affirmation, Hedonic wellbeing, and
Eudemonic wellbeing. An experimental study was conducted for the collection of
data from university students of South Korea. The university students affirmed their
values for continuous two weeks. The analysis of the data showed that that self-
affirmation leads to increase in hedonic wellbeing (Affect Balance) of the university
students.
51
Huta (2016) explained hedonic wellbeing as a concept which contain
feelings of pleasure, enjoyment, satisfaction,ease etc. They further added that these
feelings of individuals represents one mindset like ones focus on self and present
moment.
Joshanloo et al. (2017) stated hedonic wellbeing as one of the dimension of
mental wellbeing. This has further been tested and validated by using Exploratory
factor analysis and confirmatory factor analysis.
Summary
The previous researchers briefed hedonic wellbeing as emotional or as an
affect component of experienced wellbeing. It also indicated that the term hedonic
wellbeing and emotions are one and the same or synonymous. Therefore, it was
concluded that hedonic wellbeing can be interchangeably used for emotional
wellbeing (Stone et al. 2013). It is defined as the more frequent experience of
pleasant experience than with unpleasant life experiences (Ryan and Deci, 2001).
Hedonic wellbeing is based on the concept of experience of the high level of
positive affect and low level of negative affect (Deci and Ryan, 2006).
Self-affirmation leads to increase in hedonic wellbeing (Affect Balance) of
the university students (Nelson et al. 2014). Lower dispositional gratitude results in
lower positive affect (Hedonic Wellbeing) (Kashdan et al. 2006). Hedonic wellbeing
is also positively related to spirituality and religiousness (Joshanloo, 2011).
Spirituality is a stronger predictor of hedonic wellbeing when compared with
religiousness (Joshanloo, 2011). It is also explored that there exists a significant
strong relationship between hedonic enjoyment and self-determination eventually
resulting in one’s hedonic wellbeing (Waterman et al. 2008).
2.4. COPING STRATEGY (COPE)
The present section deals with the review on the coping strategy. The
reviews are about the relationship of coping strategy with other variables,
determinants of coping strategy and the role of mediator its plays in some specific
situation. The reviews on coping strategy are as follow:
52
Stassen (1994) explored the determinants as well as the outcomes of coping
strategy. The data were collected from employees of the telecommunication
industry. The analysis of the data revealed that employees who possess high
optimistic inclinations, as well as robust mastery, are more inclined towards control-
oriented coping. Moreover, it was also found that control coping and escape coping
was related to positive as well as negative outcomes respectively. The outcome
variables of coping have additive as well as interactive effects.
Lu (2002) studies the effect of work stressor and coping strategy on job
performance. The data was collected through a self-administered survey from cities
of China. The collected data was analyzed which indicated that positive coping
strategy was positive with job performance. It was also indicated that passive
adaptation of coping strategy was found to be negatively related to job performance.
Further, it was explored that passive adaptation shares a negative relation with
quantity and quality of work
Brown (2005) in his study considered coping tactics as a moderator between
the relation shared by negative emotion and performance. The data were collected
through a mail survey from companies in the United States. The findings reveal the
adverse effect of emotion on the performance of employees and coping strategy
moderated the relationship between emotions and performance.
Austin et al. (2005) investigated the effect of coping strategies on teachers’
stress. The data were collected using questionnaires of coping strategies and stress
levels. The data was used to collected from teachers of high schools. The analysis of
the collected data was done using a series of correlational analyses which indicated a
significant relationship between coping strategy and stress.
Betoret (2006) explained the relationship between stressors, self-efficacy,
coping resources and burnout. The data were collected using a Likert scale from
secondary school teachers of Spain. The analysis of the collected data was done
using factor analysis, reliability and bivariate relations. The analysis indicated a high
level of self-efficacy and coping resources are responsible for the low-level
experience of stress and burnout among teaching fraternity.

53
Jennings (2007) examined work-family interface experience with coping
strategies. The data for the present study was collected from secondary sources
(research articles). The meta-analysis of the literature reveals that females are more
likely to use a coping strategy when compared with their male counterparts. Further,
it was supported that use of effective coping strategy is helpful for the growth of
their firms. Anticipated work-family conflict motivates entrepreneurs to intact
coping strategies in a proactive manner.
Chan (2007) examined emotional intelligence, self-efficacy and coping
among teachers. The data were collected using three sub-scales assembled in the
form of a questionnaire. The data were collected from in-service teachers in Hong
Kong. The analysis of the data indicated that emotional intelligence (intrapersonal
and interpersonal) predicts an active coping strategy among teaching fraternity.
Shimazu (2010) studied the mediating role of coping strategy on
workaholism, Employees health, and performance. The data was gathered with the
help of a questionnaire distributed among employees of Japanese Construction
Company. The collected data were analyzed using structural equation modeling
technique. The analyzed data revealed a positive relationship between workaholism
and coping strategy. Further, it was also found that workaholism shares a negative
relation with employees’ ill-health and positive relation with job performance.
Arnold (2012) studied the organizational stressors and coping on variables
like positive and negative affect and performance satisfaction. To record the
responses different questionnaires were used for each variable. The questionnaires
were assessed on 414 sports performers. The analysis of the data was done using
multiple regressions. The analysis indicated positive relation is shared by both goals
and development stressor with team and culture stressors on negative affect. Further,
the analysis revealed that there exists a positive relationship between problem-
focused coping with positive affect, and emotion-focused coping with negative
affect.
Fulvio (2016) examined the role of strain facets and coping strategy in
translating techno stressors into adverse job-outcomes. The data was collected from
employees working in a large organization of the United States. Structural equation

54
modeling technique was used to analyze the collected data. The analysis of the
results uncovered that strain-facets of work-family conflict and distress are
responded by coping strategies. The finding further revealed that use of coping
strategy also reduces work exhaustion.
Rabenu (2017) examined the relationship between psychological capital,
coping with stress, wellbeing, and performance. The data was collected from
employees of various organizations of Israel through questionnaires. Structural
equation modeling technique was used to analyze the data. The results of the
analysis explored that coping strategy partially mediates the relation shared by
Psychological Capital and the outcomes of well-being and performance.
Nonis (2018) explored coping strategy and its relationship with personal
characteristics and work outcomes. A self-administered questionnaire was used to
collect the data. The data were collected from employees who are presently working
as sales persons. The analysis indicated that salespersons that are better in time
management more often use a coping strategy which results in desired job outcome.
Summary
Coping is a skill or strategies that individuals use either to master, tolerate,
reduce or minimize stressful events. As our day to day life is becoming stressful
coping strategies are in high demand among the working-class individuals.
Individuals better in time management often use a coping strategy which results in
desired job outcome (Nonis, 2018). It is suggested that the use of a coping strategy
also reduce work exhaustion (Fulvio, 2016). It can be effectively used if an
individual uses his/her intrapersonal and interpersonal emotional intelligence as it is
been observed that emotional intelligence predicts active coping strategy (Chan,
2007) whereas Negative coping strategy is negatively related to job performance
(Lu, 2002). Coping Strategy moderates the relationship between emotion and
performance (Brown, 2005). Coping partially mediate the relationship between the
outcomes of wellbeing and Performance (Rabenu, 2017).
To fulfill the high demands of the organization employees compulsively
works excessively hard for long hours. Workaholism was positively related to
55
Coping Strategy (Shimazu, 2010). A problem-focused coping strategy is quite
popular amongst all the other types and it also found that it is positively related to
positive affect and emotion-focused coping (Arnold, 2012). Female employees were
more likely to use a coping strategy which is helpful for the growth (Jennings,
2007). High level of self-efficacy with more coping resources reports less stress and
burnout (Betoret, 2006). From the above explanation, it can be concluded that
coping strategy has a significant relationship with stress (Austin et al. 2005).
2.5. TOKENISM (TOK)
This section presents the reviews on tokenism which contain its theory,
process and its effect in the workplace. The reviews on tokenism are as follow:
Yoder (1991) assessed the kantars tokenism theory in which it has been
stated that performance pressures, social isolation and role encapsulation were the
consequence of tokenism in organizations. Whereas the review of empirical data
reveals that the outcomes or consequences stated by Kanter in his tokenism theory
occurs only for women is applicable if they select gender inappropriate occupation.
Roth (2004) examined the social psychology of tokenism and homophily
processes. The study examined the cognitive mechanism of homophily preferences
and status expectations. The data were collected from the security industry through
open-ended interview schedule. The qualitative analysis of the data revealed that
homophily preferences and status expectation are the two cognitive process that is
responsible for the occurrence of tokenism which also leads to the experience of
female and male tokens. Moreover, it was also illustrated that how the two cognitive
processes i.e. homophily preference and status processes maintains stratification in
securities firms.
Scott (2005) examined the process of creating a diverse organization through
tokenism. The data for the study was collected through interviews and observation
from organizations. The qualitative analysis of the data indicated that it affects self-
esteem causing individuals either to isolate themselves or leave the organization so
adding more than one representative from a group in the organization will help in
moving beyond tokenism.

56
Arbold and Schulz (2008) explored the effects of tokenism in the workplace.
The data were collected with the help of a face-to-face structured interview
schedule. Female police officers were the samples considered for this study. The
finding of the study contrasted with Kanter's original work of tokenism. The analysis
of the responses indicated that male supervisors encourage their female colleagues to
apply for promotion. Meanwhile, study also explored that this encouragement is
often perceived negatively by most of the female police officer and thus restrict
them to participate in the process.
Ban and Rao (2008) studied the impact of tokenism in village democracies in
South India. The data were collected from both the males as well as females at the
village, president and household levels. The feedback form was administered to a
group of men and women's using PRA techniques (Participatory Rapid Appraisal).
The analysis of the results indicates that at the higher-level token (women) never
perform worse than males whereas token (women) at lower level performs worse
when compared with males.
King et al. (2009) investigated about antecedents and consequences of the
psychological climate of Gender Inequity to understand the Tokenism theory. The
data was collected through questionnaire from female undergraduate research
assistants. The analysis of the survey confirms the fact that tokens perceive
organizational climate to be inequitable towards them further it also revealed that
subjective processes of tokenism give rise to inequitable climate perceptions.
Turco (2010) explored the cultural foundation for tokenism. The data was
collected through the interview from tokens (Females and African American Male)
of the leveraged buyout industry. The findings reveal that social psychological and
cultural theories of exclusion play an important role in token occupational
inequality.
Wallace and Kay (2012) investigated tokenism, organization segregation,
and co-worker relations. The data were collected from practicing married lawyers of
Law firms through questionnaire from the province of Alberta. The analysis of the
data indicated that rising representation of women’s in law firms leads to enhanced
communication which is very essential for lawyers.

57
Ocloo and Matthews (2016) studied about tokenism and empowerment. The
study was continued through a selection of narrative literature search which covers a
wide range of disciplines across health and social care, policy, and research. The
meta-analysis of the collected reviews revealed that organizations should move
beyond tokenism by sharing power and decision making with the token will
eventually promote empowerment.
Lundy (2018) explained tokenism in the context of scholarship and child
participation. They described tokenism as a factor which negatively impacts the
participation of childrens thus effecting their rights of equal participation.
Summary
From the above reviews, it can be concluded that tokenism is the actions
which result in pretending to provide an advantage to groups in our society which
are frequently treated unfairly, in order to give the appearance of fairness. Roth
(2004) explored two cognitive processes i.e. homophily preferences and status
expectation which are responsible for the occurrence of tokenism which also leads to
the experience of female and male tokens. Moreover, these two cognitive processes
i.e. homophily preference and status processes also maintain stratification in
organizations.
The individual gave preference according to the theory of tokenism in the
organization is labeled as ‘Token’. Tokens perceive organizational climate to be
inequitable towards them further it also revealed that subjective processes of
tokenism give rise to inequitable climate perceptions (King et al. 2009). The
findings of several studies reveal that social psychological and cultural theories of
exclusion play an important role in token occupational inequality (Turco, 2010).
Organizations should move beyond tokenism by sharing power and decision making
with the token will eventually promote empowerment (Ocloo and Matthews 2016).
Scott (2005) in his study revealed that tokenism affects self-esteem causing
individuals either isolate themselves or leave the organization so adding more than
one representative from a group in the organization will help in moving beyond
tokenism.
58
The analysis of the data indicates that at the higher-level token (women)
never perform worse than dominant group (males) whereas token (women) at lower
level performs worse when compared with a dominant group (males) (Ban and Rao,
2008). It is been also observed that token (female) are intensely exhilarated by
dominant group members (male) supervisors to participate in the promotion process.
This encouragement by a dominant group member (male) actually deterred some of
the token (female) to participate in the promotion process (Arbold and Schulz,
2008).
Whereas the review of empirical studies reveals that the outcomes or
consequences stated by Kanter in his tokenism theory occurs only for women’s
(tokens) is applicable if they select gender inappropriate occupation (Yoder, 1991).
Whereas Wallace and Kay (2012) support the rising representation of tokens
(Females) in dominant group (Male) stereotyped profession leads to enhanced
communication which is quite essential for one’s growth and development in an
organization.
2.6. WORKPLACE OSTRACISM (WOS)
The current section presents the review on workplace ostracism which
became popular after 2000 and now a considerable amount of research has been
done with this variable. Some of the popular reviews have been presented in this
section which is as follow:
Hitlan (2006) in his study considered gender as a moderator on the relation
shared by exclusion, work-related attitudes, and psychological health. Basically, the
study examined the consequences of exclusion in the organization. The data were
collected though computer-based survey from male and female working students.
The analysis of the data was done using hierarchical moderated regression analyses.
The analysis revealed that perception of a high level of exclusion results in lower
satisfaction as well as lower psychological health when compared to their
counterpart’s or females of the same organizations.
William (20007) attempts to explore the phenomenon of ostracism, social
exclusion, and rejection. The study was continued through a selection of narrative

59
literature search which covers a wide range of reviews from different disciplines.
The Meta-analysis of the review revealed that experience of ostracism results in
sadness and anger which threatens the fundamental needs of the employees. Further,
it explored that behavior consequences of ostracism can be divide into two
categories (a) Attempts to fortify relational needs (b) Attempt to fortify
efficacy/existence needs of control and recognition, the former generally leads
towards prosocial behavior whereas the later leads to anti-social thoughts and
behaviors.
Salvy (2012) assessed the effects of the experience of ostracism and social
connection. The data were collected from adolescents through cyber ball and
Aversion Impact Questionnaire. The collected data were analyzed using a t-test,
MANOVA, and ANOVA. The analyzed data indicated that ostracized individuals
have less positive self-esteem, lack of control and greater negative mood.
Ahmed (2013) studied the importance of social support in the workplace so
as to avoid the feelings of ostracism and its negative outcomes. A literature survey
approach was considered for collecting information for the study. Qualitative
analysis of the survey was done which suggests ways to overcome the negative
effects of ostracism. The study also focussed on the importance of social support in
reducing the phenomenon of ostracism.
Balliet (2013) investigated ostracism and prosocial behavior that whether the
experience of ostracism leads to less prosocial behavior or more prosocial. The data
were collected from University students of Singapore. The collected data
wasanalyzed through Hierarchical Multiple regression analysis. The analyses of the
data revealed that the experience of ostracism at the workplace has a significant
negative relation with helping intentions of the ostracized employee.
Zhang (2015) explored the relation shared by neuroticism and ostracism in
the workplace. The data were collected from new employees including male and
female employees. It was collected through a Likert scale by sending it through E-
mail. The collected data was analyzed uniformly by checking reliability, validity and
then Pearson correlation and Linear regression were applied. The analysis of the data
revealed that neuroticism positively affects the experience of ostracism at the
60
workplace which means that an employee higher in neurotic behavior very strongly
experience the ostracism at the workplace. The analysis of moderating effects
revealed that the lower the task interdependence, the stronger the relationship
between neuroticism and ostracism at the workplace is observed.
Steele (2015) explored the negative consequences of the experience of
ostracism. The study portrayed ostracism as the experience of rejection, exclusion
and being ignored by the fellow members. To collect the data on the same, an
experiment with the Cyberball technique was used. After conducting the experiment,
the results indicated that an ostracized individual experience much enhance the
accessibility of death thoughts due to low self-esteem when compared with less
ostracized individuals
Chung (2015) studied the role of organizational conflict on the type of
relation shared by ostracism with in-role behavior and ostracism with
organizational-citizenship-behaviour. The data for this study was collected through
the questionnaire. The responses were collected from full-time employees. It was
gathered using two waved self-report survey as the longitudinal design was
considered. The collected data was analyzed using Confirmatory Factor Analysis
and Structural Equation Modelling. The analysis of the data revealed that ostracism
is positively related to organizational conflict. Further mediation analysis explored
that the relationship shared by ostracism with in-role behavior and organizational-
citizenship-behaviours is fully mediated by employees’ conflict.
Chung (2018) in his study explore about perceived stress and ostracism. The
study also intends to explore the relation ostracism shares with an employee’s
helping behavior, their voicing behavior and their task-related performance. Further
psychological empowerment is also hypothesized as a moderator on the type of
relation shared by perceived stress and its aftermaths in terms of behavioral
outcomes. The data was collected from full-time employees through a questionnaire
in South Korea. The collected data were analyzed using regression analyses with
bootstrapping. The findings indicated workplace ostracism as a stressor whereas the
psychological empowerment as moderator which negatively effects ostracism.

61
Summary
The experience of ostracism at the workplace is considered a stressor
(Chung, 2018). It results in sadness and anger which threatens the fundamental
needs of the employees (William, 2007). It is also explored that behavior
consequences of ostracism can be divide into two categories (a) Attempts to fortify
relational needs (b) Attempt to fortify efficacy/existence needs of control and
recognition, the former generally leads towards prosocial behavior whereas the later
leads to anti-social thoughts and behaviors (William, 2007). The experience of
ostracism at the workplace has a significant negative relation with helping intentions
of the ostracized employee (Balliet 2013).
It has been explored that neurotic individuals are more prone towards the
experience of ostracism at the workplace because it’s been observed that neuroticism
positively affects the experience of ostracism at the workplace which means that an
employee higher in neurotic behavior very strongly experience the ostracism at the
workplace (Zhang, 2015). The experience of ostracism results in several
consequences like ostracized individuals have less positive self-esteem, lack of
control and greater negative mood (Salvy, 2012) which results in much-enhanced
accessibility of death thoughts when compared with less ostracized individuals
(Steele, 2015). It has also been observed that men perceive a higher level of
exclusion with lower satisfaction and psychological health when compared with the
females of the same organizations (Hitlan, 2006). It was Chung (2015) explored that
some organizational factors also support the phenomenon of ostracism, it has been
proved that conflict, supervisor conflict, and task conflict are positively related to
workplace ostracism.
Previous researchers explored the mediators and moderators of ostracism.
Their researchers claimed a conflict of co-employees as a strong mediator on the
type of relation ostracism shares with in-role behavior and ostracism with
organizational citizenship behaviors (Chung, 2015) whereas Zhang (2015) claimed
that lower task interdependence as a strong moderator between the relationship of
neuroticism and ostracism. Chung (2018) revealed psychological empowerment as a
moderator between the negative effects of ostracism on behavioral outcomes of
employees

62
In an organization, both individual and organizational factors are responsible
for the occurrence of ostracism. Social exchange relations are an effective strategy to
overcome the negative outcomes of ostracism. This has further been supported by
Ahmed (2013) as he mentioned in his study that there is a great need to empirically
prove the importance of social support at work in reducing the side effects of
ostracism.
2.7. SUMMARY OF THE CHAPTER
India is a country with great diversity and diversity has its own pros and
cons. In many context, diversities is the root cause of stereotyping which can be
positive as well as negative. When an individual is exposed to negative stereotyping,
stereotype threat occurs which can further lead an individual to experience ostracism
at the workplace which is considered to be one of the potential causes of stress at the
workplace which adversely affects the job performance of an individual. When a
threat is evoked an individual’s hedonic wellbeing is also affected. Therefore, to
manage the disturbance caused by negative stereotypes “resource-demanding coping
strategies” is very much important.
In this chapter stereotype and its deleterious effects has been reported by
presenting a few reviews on the phenomenon. One of the most widely studied
effects of stereotype threat was its detrimental impact on job performance or
performance of an individual. Thus, the researcher also presented studies on job
performance and explored task, contextual and counterproductive work behavior as
its dimension. Further through the reviews of stereotype threat, it has been explored
that there is an underlying mechanism which affects the link between stereotype
threat and performance, considering this the study included hedonic wellbeing
coping strategy and workplace ostracism as mediators. Therefore, the chapter also
presents reviews on hedonic wellbeing which states that “Emotional quality of an
individual’s everyday experience—the frequency and intensity of experiences of
joy, fascination, anxiety, sadness, anger, and affection makes one’s life pleasant or
unpleasant”. So, therefore hedonic well-being of an individual is a very important
factor in one’s life. Secondly, coping strategy also plays an important role in the
situation with stress or especially in the workplace. It is very much important in our
63
daily life as employees are expecting to contribute more and more in the
organization and gradually the demand is increasing day by day.
To overcome the stressor like ostracism at the workplace, the use of effective
coping strategy is suggested. The reviews on ostracism are also included which
states that due to this phenomenon, few behavioral problems might also occur like
low pro-social behavior and frequent antisocial thoughts. The reviews on ostracism
also included its relationship with one’s personality type and other factors which can
be individual as well as organizational factor.

64
CHAPTER – III
RESEARCH METHODOLOGY
The present chapter highlights the research methodology considered for the
present study. It highlights the procedure of data collection, measures used in data
collection, research design, and sampling frame. The chapter has been systematically
arranged in different sections for more clarity viz. section 3.1 discusses the sampling
frame considered for the study, 3.2 presents the sample size considered by the
researcher, section 3.3 provides a sampling process, 3.4 discusses the research
instruments used in the study, 3.5 presents the details of the instruments used in the
present study. Section 3.6 explains the reliability and validity of research
instruments used in the study. Section 3.7 deals with the conceptual framework of
the study. Section 3.8 discusses the research design whereas section 3.9 discusses
data collection. Section 3.10 will describe the approach for data analysis and section
3.11 deals with the techniques used in the analysis of the data.
3.1. POPULATION/ SAMPLING FRAME
The study has been conducted on the primary and secondary school teachers
of government schools of the eastern region of Uttar Pradesh. There are 15 districts
in eastern region of state namely Allahabad, Azamgarh, Baharaich, Ballia, Basti,
Deoria, Faizabad, Ghazipur, Gonda, Gorakhpur, Jaunpur, Mirzapur, Pratapgarh,
Sultanpur and Varanasi in which total number of primary and secondary school
teachers are 166859 (75%) and 57650 (25%) respectively. The figure below
systematically represents the number of schools in each district.

65
Fig. 3.1: Number of Schools in Each District of Eastern Uttar Pradesh
(U.P)
Districts of Eastern UP
Varanasi
Pri(1436)
Sec.(49)
Sultanpur
Pri (2385)
Sec(21)
Pratapgargh
Pri(2737)
Sec(55)
Mirzapur
Pri(2430)
Sec(115)
Gonda
Pri(3254)
Sec(28)
Ghazipur
Pri(2924)
Sec(32)
Deoria
Pri(2666)
Sec(19)
Faizabad
Pri(2171)
Sec(26)
Basti
Pri(2407)
Sec(19)
Ballia
Pri(2698)
Sec(28)
Baharaich
Pri(3444)
Sec(36)
Azamgarh
Pri(3273)
Sec(20)
Allahabad
Pri(3565)
Sec(32)
Gorakhpur
Pri(3096)
Sec(40)
Jaunpur
Pri(3471)
Sec(34)

66
3.2. SAMPLE
In the present study the investigator used Multi-stage sampling technique for
selecting the samples. The sampling has been divided into 3-stages. In the first stage,
out of 15 districts 6 districts has been selected as per the convienience. The factors
considered for selection of districts are because of the number of schools, number of
teachers and societal setup. In the second stage, proportionate stratified sampling
technique has been used to calculate the number of teachers to be taken from the
primary and secondary schools. The sampling frame of the study such that teachers
working in government schools are 2,24,509. There is no fixed rule to decide the
sample size. Some researcher’s favors utilizing sample frame for selection of sample
(Mesa et al., 2016). Considering the target population to select reasonable sample to
represent the population of teachers website of surveymonkey.com was used. The
sample was calculated considering the confidence level of 95% with margin of error
of 5%. The calculator estimated a valid sample size of 384 which is sufficient to
represent the population of eastern uttar Pradesh. However, in order to cover the
dropout rate and data cleaning processes the investigator planned to collect sample
550 to 600 teachers from the respective districts. The final figure of approached
teachers is 591 respondents. The proportionate representation of teachers working in
primary and secondary schools was also considered. Hence, keeping in view, the
population of primary teachers i.e. 166859 (75%) and the secondary school teachers
57650 (25%) the investigator collected the data final data from 443 primary teachers
(75%) and 148 secondary teachers (25%), which comes out to be 591 teachers in
total.
In the third stage the teachers were contacted personally by the investigator
to collect the data related to the purpose of the study. The final collected data after
the data cleaning and removal of incomplete forms remained 446 teachers. For
supervisory rating on job performance of teachers, 180 principals were also
contacted. The further analysis and interpretation of data was conducted on this
sample which was adequately above the required 384 suggested for the target
population.
67
3.3 PROCEDURE
The present study is the school level study. The data collection process was
done twice for (a) validation of the tools used and (b) data required for analysis and
interpretation.
For tool validation, the criteria of number of items in the different tools was
considered and hence reasonable sample of 390 teachers and Principals were
approached to get their responses on the items of the tools. To collect data from the
respondents, the pilot study for scale validation has adopted convenience sampling
technique.
In final data collection 591 respondents were approached. However, after the
cleaning of the data only 446 respondents data were included. Purposive sampling
technique was used in order to select desired sample arising due to the solo-status in
the school either because of gender, caste or religion. The representations of gender
were also considered while collecting the data. From each school, three to four
teachers were contacted for their consent to participate in the study. The average
strength of the teachers in the schools varied from 7-18.
In order to collect the sample the respondents six districts of Uttar Pradesh
namely Allahabad, Varanasi, Jaunpur, Balia, Deoria and Gorakhpur was visited by
the investigator. Formal ethical approval was taken from the recognized authority.
The investigator explained the purpose of the study to the respective respondents i.e.
teachers and principals. The teachers were informed by the investigator about their
performance evalution by their respective principals.
The primary and secondary government schools from the eastern region of
Uttar Pradesh constituted the population for the study. The personal survey
constituted 180 schools from six districts of Uttar Pradesh. Approximately three to
four respondents were taken from each school which includes teachers and principal.
The investigator personally interacted with the respondents of each school and got
the questionnaire filled from the teachers and their respective heads. In total 591
responses (representing 180 schools) were finally selected for analysis. The average
response of respondents from 180 schools was used for data analyses and
interpretation. A brief description of the sample is given below in table 3.3.
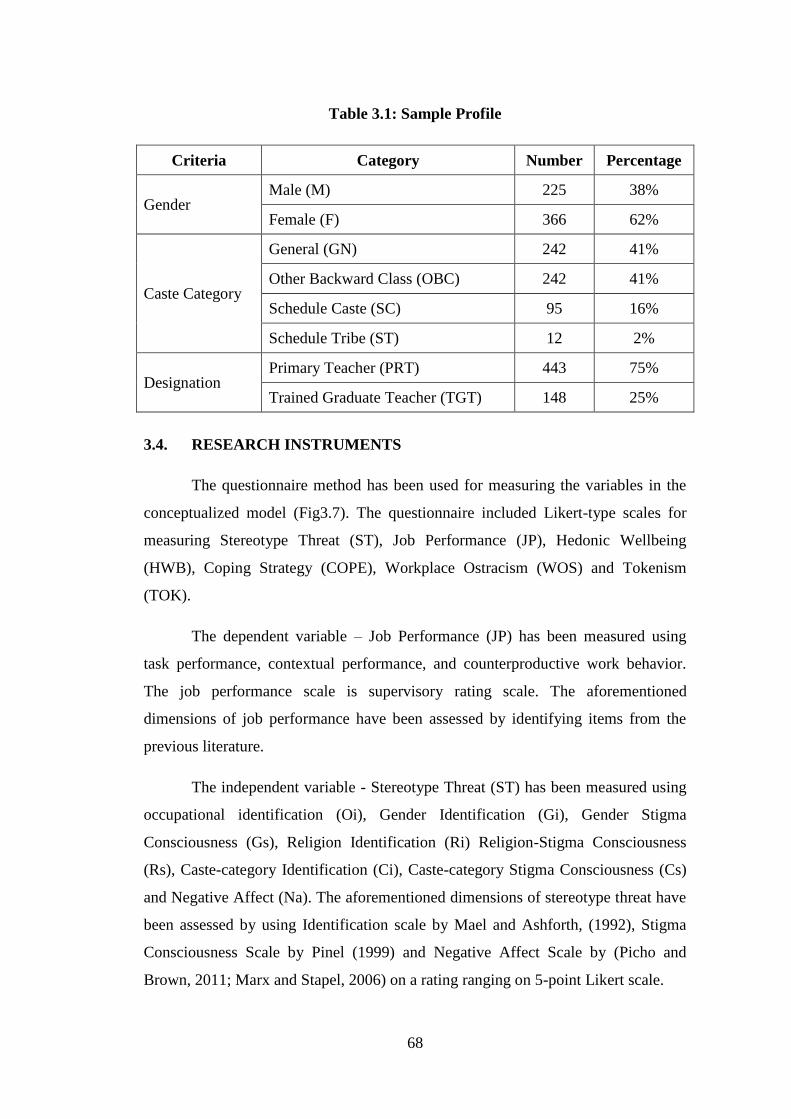
68
Table 3.1: Sample Profile
Criteria Category Number Percentage
Gender Male (M) 225 38%
Female (F) 366 62%
Caste Category
General (GN) 242 41%
Other Backward Class (OBC) 242 41%
Schedule Caste (SC) 95 16%
Schedule Tribe (ST) 12 2%
Designation Primary Teacher (PRT) 443 75%
Trained Graduate Teacher (TGT) 148 25%
3.4. RESEARCH INSTRUMENTS
The questionnaire method has been used for measuring the variables in the
conceptualized model (Fig3.7). The questionnaire included Likert-type scales for
measuring Stereotype Threat (ST), Job Performance (JP), Hedonic Wellbeing
(HWB), Coping Strategy (COPE), Workplace Ostracism (WOS) and Tokenism
(TOK).
The dependent variable – Job Performance (JP) has been measured using
task performance, contextual performance, and counterproductive work behavior.
The job performance scale is supervisory rating scale. The aforementioned
dimensions of job performance have been assessed by identifying items from the
previous literature.
The independent variable - Stereotype Threat (ST) has been measured using
occupational identification (Oi), Gender Identification (Gi), Gender Stigma
Consciousness (Gs), Religion Identification (Ri) Religion-Stigma Consciousness
(Rs), Caste-category Identification (Ci), Caste-category Stigma Consciousness (Cs)
and Negative Affect (Na). The aforementioned dimensions of stereotype threat have
been assessed by using Identification scale by Mael and Ashforth, (1992), Stigma
Consciousness Scale by Pinel (1999) and Negative Affect Scale by (Picho and
Brown, 2011; Marx and Stapel, 2006) on a rating ranging on 5-point Likert scale.
69
The other variables workplace ostracism and Hedonic wellbeing are uni-
dimensional constructs whereas coping strategy and tokenism are multi-dimensional
construct with Self-care, Social-Support, Cognitive- Coping and Recreation as sub-
dimensions of coping strategy and Visibility, Polarization and assimilation as sub-
dimensions of Tokenism.
3.5 THE DEVELOPMENT OF RESEARCH INSTRUMENTS
The development of an estimation scale to measure construct is an extreme,
tedious and awkward job. It includes heaps of reviewing previous literature, fixation,
and devotion. This investigation as of now talked about has built up the scale
according to the rules and techniques of Churchill (1979) and Hekin (1995). The
overview strategy has been produced after profound and careful reviewing previous
researches with a specific end goal to get bits of knowledge into the impact of
stereotype threat on job performance. In the present study only those research
instruments are used which showed high validity and reliability in line with the
research objectives. To measure job performance a pool of item was generated on
five points Likert scale where 1- Strongly Disagree and 5- Strongly Agree). After
the selection of the items for the construct content validity of the research, the
instrument was also assessed by sending the scale to 5 experts of some top-notch
universities. Before finalizing the scale pilot study was done to check the reliability
of the scale. Details of the scale development procedure have been discussed in the
next chapter-IV
3.6. RELIABILITY AND VALIDITY OF RESEARCH INSTRUMENT
It is quite important that the research instrument used to measure construct in
any study should be reliable as well as valid. By following the procedure of
reliability and validity the results produced by the scales will be stable and
consistent. The scale which is not reliable and valid will produce vague and
questionable findings thereby challenging the authenticity of the research. Therefore
in the present study, the process of reliability and validity is followed, so as to
maintain a high level of consistency in the scales used to measure the variables.
70
3.6.1 Validity of the Instruments
There is no consensus among the researchers regarding the definition of
validity. One of the most popular definitions of validity is given by Joppe (2000)
which states that
“Validity determines whether the research truly measures that which it was
intended to measure or how truthful the research results are”. In other words, does
the research instrument allow you to hit "the bull’s eye" of your research object?
Researchers generally determine validity by asking a series of questions, and will
often look for the answers in the research of others. (p. 1)”
Content validity, Convergent validity, and discriminant validity have been
used in the present study to assess the validity of the measures. The instruments
content validity has been assessed by presenting the instruments to the experts of the
top universities. All the experts expressed satisfaction with the validity of the
instruments.
3.6.2 Reliability of the Instruments
Generally, the term reliability is explained as the consistency of the result.
Researchers define reliability as “The extent to which results are consistent over
time and an accurate representation of the total population under study is referred to
as reliability and if the results of a study can be reproduced under a similar
methodology, then the research instrument is considered to be reliable. (Joppe, 2000,
p.1)”
Generally, reliability is categorized as internal and external reliability. The
former assesses the items internal correlations whereas the latter is concerned with
the results generalization (Black, 1999). According to Carmines and Zeller (1979),
internal consistency can be assessed by simply checking the Cronbach's-Alpha of
the instrument. The Cronbach's-Alpha minimum value should be 0.7 (Nunnally,
1994). Therefore, considering the above suggestion given by previous researchers
the instruments used in the present study satisfies the minimum threshold of
reliability. Thus instruments were finalized and can be used for data collection.
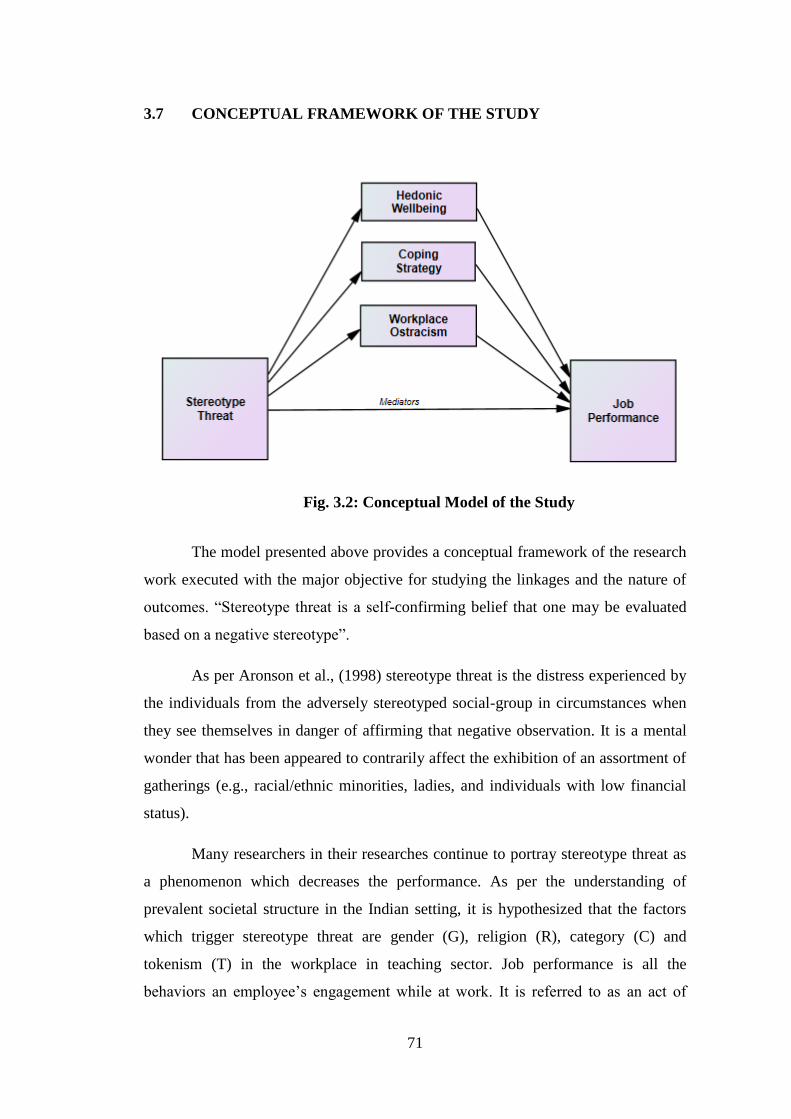
71
3.7 CONCEPTUAL FRAMEWORK OF THE STUDY
Fig. 3.2: Conceptual Model of the Study
The model presented above provides a conceptual framework of the research
work executed with the major objective for studying the linkages and the nature of
outcomes. “Stereotype threat is a self-confirming belief that one may be evaluated
based on a negative stereotype”.
As per Aronson et al., (1998) stereotype threat is the distress experienced by
the individuals from the adversely stereotyped social-group in circumstances when
they see themselves in danger of affirming that negative observation. It is a mental
wonder that has been appeared to contrarily affect the exhibition of an assortment of
gatherings (e.g., racial/ethnic minorities, ladies, and individuals with low financial
status).
Many researchers in their researches continue to portray stereotype threat as
a phenomenon which decreases the performance. As per the understanding of
prevalent societal structure in the Indian setting, it is hypothesized that the factors
which trigger stereotype threat are gender (G), religion (R), category (C) and
tokenism (T) in the workplace in teaching sector. Job performance is all the
behaviors an employee’s engagement while at work. It is referred to as an act of
72
accomplishing or executing a given task (Lindsay, 1995; Griffin, 2012). It can be
stated as any behavior which is focused toward the task or goal accomplishment. Job
performance or work performance of an individual vary from job to job. Thus there
is no clarity on what exactly constitutes individual job performance.
As per meta-analytical study job performance can be measured on three
components i.e., Task Performance (TP), Contextual Performance (CP) and
Counterproductive Work Behavior (CWB). Stereotype threat sources like gender
(G), religion(R), category (C) and tokenism (TOK) will influence task performance,
contextual performance and counterproductive work behavior in a job setting. Being
the mechanism of stereotype threat working at the cognitive and affective level there
are some psychological aspects which mediate its influence positively and
negatively on the functions exhibited in the form of behavior. Fredickson (1998,
2001) in broadening and build theory portrayed positive emotions as vehicles for
one’s growth and social connection. These growth and social connections were built
by one’s personal and social resources, which further facilitate the people in the
transformation for the betterment of their lives in the future. The situational aspect
of the work profile and performance of teachers in Indian setting shows that teachers
mostly experience stressful conditions in the profession. Hepburn and Brown (2001)
reasoned that teacher’s work burden is identified by the amount of paper work,
devoting extra time in teaching and other school activities, etc which gradually make
the teaching profession more stressful.
Identification for stress causing factors like (threat, fear, uncertainty,
cognitive dissonance, life causes, frustration, conflicts, pressures, environment,
fatigue, and overwork) of stress is the first step to deal with stress (Manjula, 2007).
A teacher’s identification or awareness about the aforementioned factors is the most
important step as it helps in increasing the level of positive emotion thereby
increasing ones emotional well-being (Fredickson and Joiner, 2002). Hedonic well-
being or experienced happiness refers to the “emotional quality of an individual’s
everyday experience—the frequency and intensity of experiences of joy, fascination,
anxiety, sadness, anger, and affection that make one’s life pleasant or unpleasant”
(Kahneman and Deaton, 2010). So, therefore, the hedonic well-being of the teacher
is a very important factor which negates/facilitates stereotype threat which is a type
73
of social threat which directly or indirectly leads an individual to feel stressed.
Secondly, the groupism at play due to different sources of stereotype threat leading
to ostracization at work also had a role to play in the show off behavior. Thirdly, the
influence of ostracization and well-being forces the cognitive functioning to employ
coping strategies to adapt to work performance. Therefore through the present study,
the investigator intended to understand the mediating/moderating effect of hedonic
well-being, coping strategies and ostracism on stereotype threat - job performance
link.
3.8 RESEARCH DESIGN
The research design is “A plan, structure, and strategy of the investigation so
conceived as to obtain answers to research questions or problem” (Kerlinger, 1995).
There are numerous definitions given by researchers in the past about research
design which more or less speaks about the fact that basically, it is a roadmap which
guides us towards the research being directed in the best and productive way. The
present study is descriptive in nature and survey method of data collection has been
applied through self-developed and adapted scales.
It involves measurement of the mediation design approach to measuring the
proposed mediating effects of Hedonic well-being coping strategies and workplace
ostracism. The mediating effect has been studied through the use of Baron and
Kenny (1986) bootstrapping method.
3.9. DATA COLLECTION
After the satisfactory results of validity and reliability of the research
instruments, the scales were finalized and again the finalized instrument was
administered for final data. The respondents were first approached via Social-media
‘WhatsApp’ by creating two ‘WhatsApp’ groups namely ‘Teachers Integration
Group’ and ‘Teachers Survey Group’. These groups include primary and secondary
school teachers and principals of different districts of Uttar Pradesh. The
questionnaire was shared using ‘Google-Drive’ but the response rate was very low.
Therefore, the investigator decided not to include the data collected through an
online survey.
74
It was at this point when a self-decision was taken to collect the data by
personally visiting schools. First appointments from principals were taken and then
the hard copy of the questionnaire was distributed to teachers and to principals.
There were two different sets of questionnaires Viz. Teachers-Questionnaire and the
Principals-Questionnaire. The questionnaires for teachers were divided into five-
sections containing questions on Stereotype-Threat (ST), Coping-Strategy (COPE),
Workplace-Ostracism (WOS), Hedonic-Wellbeing (HWB) and Tokenism (TOK).
The questionnaire for principals contains questions on the performance of teachers
in which principals have to rate the performance of teachers working in their school.
Apart from these sections, there was a separate section on the demographic details of
the respondents in both the questionnaire. To fill the questionnaire each respondent
on an average took about 35-45 minutes.
3.10. DATA ANALYSIS
To analyze the collected data it was first punched into the Statistical Package
for Social Sciences (SPSS). Then the entered data was cleaned, as well as outliers
were removed. Then the Mean, Standard Deviation, Skewness, and Kurtosis were
scanned. For empirical findings in the present study, tools viz. Microsoft-Excel
(MS-Excel), Statistical Package for the Social Sciences (SPSS) 22.0 and an added
module of SPSS which is Analysis of Moment Structure (AMOS) were used.
The descriptive statistics were employed to the obtained data-set so as to
apprehend the nature of data. Univariate, Bi-Variate and Multivariate analysis
techniques were used to assess the normality of the data. Mahalanobis D2 was
considered to assess Multivariate Normality of the data.
To explore the dimensionality of the construct Exploratory Factor Analysis
(EFA) was used which was followed by Confirmatory Factor Analysis (CFA) with
maximum Likelihood criteria has been adopted for the measurement and validation
of scales used in the study. It considered to confirm convergent and discriminant
validity and composite reliability of the scales used. By using various model-fit-
indices like RMR, CFI, GFI, AGFI, RMSEA, and Normed Chi-Square the scales
were validated.
75
A t-test was used to find the differences due to gender and Religion in the
experience of stereotype threat whereas ANOVA was used to find out the difference
among categories in the experience of stereotype threat. A regression analysis has
been used to study the impact of tokenism in the occurrence of stereotype threat. To
measure the impact of stereotype threat (ST) on Job Performance (JP), Hedonic
wellbeing (HWB) and coping strategies (COPE), Hedonic wellbeing (HWB) and
workplace ostracism (WOS), Coping Strategies (COPE) and Workplace Ostracism
(WOS) measurement and structural model was tested in AMOS. The mediating role
of Hedonic wellbeing (HWB), Coping Strategy (COPE) and Workplace Ostracism
(WOS) was assessed using mediation analysis through bootstrapping.
3.11 STATISTICAL TECHNIQUES
The collected data has been analyzed using Descriptive Statistics, Reliability
analysis, Bivariate, and Multivariate analysis. Software packages like SPSS and
AMOS were used for computerized data analysis.
1) Descriptive statistics like mean, S.D, normality test has been applied to
understand the nature of the data.
2) t-test and ANOVA has been used to find significant differences between
groups.
3) The regression analysis has been used to predict the outcome variable.
4) A Measurement Model (MM) and Structural Model (SM) through SEM were
used to predict the outcomes of independent variable Stereotype Threat on
dependent variable Job Performance.
5) Baron and Kenny’s method of Bootstrapping has been used to see the
mediation of the variables viz. hedonic wellbeing, coping strategy, and
workplace ostracism.
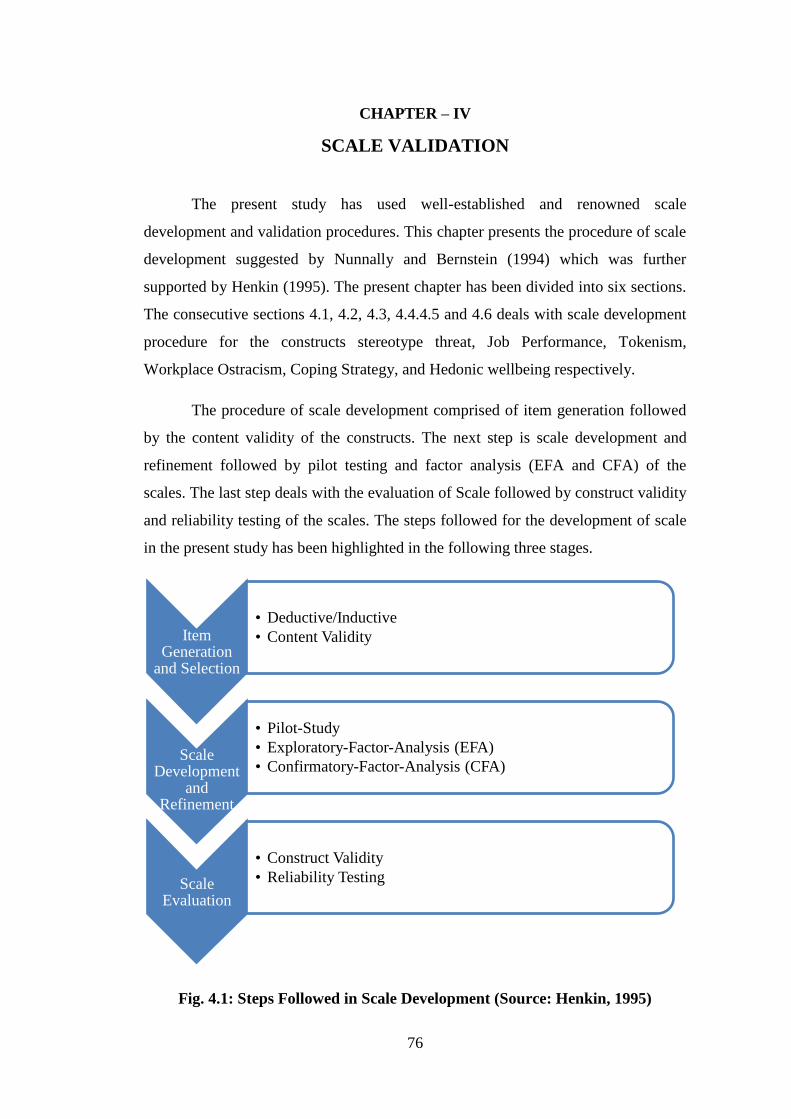
76
CHAPTER – IV
SCALE VALIDATION
The present study has used well-established and renowned scale
development and validation procedures. This chapter presents the procedure of scale
development suggested by Nunnally and Bernstein (1994) which was further
supported by Henkin (1995). The present chapter has been divided into six sections.
The consecutive sections 4.1, 4.2, 4.3, 4.4.4.5 and 4.6 deals with scale development
procedure for the constructs stereotype threat, Job Performance, Tokenism,
Workplace Ostracism, Coping Strategy, and Hedonic wellbeing respectively.
The procedure of scale development comprised of item generation followed
by the content validity of the constructs. The next step is scale development and
refinement followed by pilot testing and factor analysis (EFA and CFA) of the
scales. The last step deals with the evaluation of Scale followed by construct validity
and reliability testing of the scales. The steps followed for the development of scale
in the present study has been highlighted in the following three stages.
Fig. 4.1: Steps Followed in Scale Development (Source: Henkin, 1995)
Item Generation
and Selection
• Deductive/Inductive
• Content Validity
Scale Development
and Refinement
• Pilot-Study
• Exploratory-Factor-Analysis (EFA)
• Confirmatory-Factor-Analysis (CFA)
Scale Evaluation
• Construct Validity
• Reliability Testing
77
Item Generation: The process of scale development carried out with the
generation of a pool of items. The generated items capture the domains specified in
the present research with enough theoretical support as suggested by (Hutz et al.
2015). Basically, there are two methods for the generation of items which are an
inductive and deductive method (Hunt, 1991). Some researchers also determine the
combination of both the methods for the generation of items. Inductive method is
time-consuming as the generation of items using this method is based on the
qualitative evidence or statistics of the construct. The qualitative information can be
obtained through focus group interviews, expert panels and qualitative exploratory
research methodologies from the targeted population (Kapuscinski and Masters,
2010). The deductive method is quite famous among researchers. The generation of
items through this method involves extensive review to develop a theoretical
definition of construct so that it can be used as guiding manual to ease the
development of items (Schwab, 1980, Hinkin, 1995). The present study has used a
deductive approach for the generation of items for specific constructs.
There is no specific thumb rule for a number of items in a scale. Though,
Hinkin and Schriesheim (1979) suggested at least four to five items so that adequate
internal consistency can be achieved.
Content Validity is one of the most fundamental steps after the generation of
items which is mostly overlooked by the researchers. It is generally known as
theoretical analysis which ensures that the developed items reflect the desired
construct (Arias et al.2014). In the present study, internal consistency of the
operationalized items was checked by subject matter experts working in reputed
universities like Banaras Hindu University, Varanasi, Punjabi University, Patiala,
VIT, Vellore, etc. The experts were presented with construct definitions and were
asked to match items with the conforming definition. An acceptable agreement
index was determined prior to administration of the items and definitions. Response
choices ranged from 1 to 4 viz. Not relevant= 1, somewhat relevant =2, quite
relevant=3, highly relevant=4 were presented to the subject experts for rating.
According to Veneziano and Hooper (1997) content validity is determined as
(Number of Experts Positively Answered / Total Number of Experts) – 1. Therefore,
in the present study the items rated by at least 80% of the judges as at least

78
somewhat representative, or by 60% as clearly representative, were retained. The
assessment of items by expert judges in the initial round identified few items which
lack transparency and will eventually result in misinterpretation by the respondents.
Scale Development and Refinement: It alludes to the means taken to
enhance the psychometric execution of a scale. The procedure suggested by
Churchill (1979) and Henkin (1995) was followed for the establishment of better
internal-consistency and verification of content homogeneity. All the necessary and
important steps like Pilot-Study, Exploratory Factor Analysis (EFA) and
Confirmatory Factor Analysis (CFA) have been considered for the refinement of
scale. This examination has refined the scale by experiencing every single stage
guaranteeing that all the fundamental conditions were satisfied.
Pilot Study: In order to purify the measure and to inspect the internal
consistency of retained items, the items finalized were then taken to the next stage
which is ‘Pilot Study’. The method suggested by Churchill (1979) for the
administration of finalized items to the targeted sample was followed.
In the process of scale development, the assessment of reliability and validity
of the scale is an important stage. The validation of the scales used in the present
study has been assessed using Exploratory and confirmatory factor analysis.
According to Child (2006), these methods are used for the simplification of
interrelated measures as well as it also explores patterns in a set of variables.
Exploratory Factor Analysis is a statistical technique used in a situation
where a researcher requirement is to un-cover the essential structure of a construct
which has a relatively large set of variables. It is a procedure suggested to simplify
inter-related measures so as to explore a meaningful set of items into different factor
structure (Child, 2006; Yong and Pearce, 2013). In the present study, the scale
development procedure followed, recommends employing Confirmatory Factor
Analysis (CFA) to the emerged factor structure after Exploratory Factor Analysis
(EFA). According to the majority of the researcher's scale purification through
Confirmatory Factor Analysis (CFA) enhances the scales psychometric properties
(Anderson and Gerbing, 1988; Arnold and Reynolds, 2003; Farooq, 2016).
Therefore in the present study, CFA will be applied to all the contructs.

79
Scale Evaluation: The final stage of the scale development process includes
evaluation of the scale because the main aim of scale development was to generate a
measure which explains validity and reliability. Reliability testing is done after
applying confirmatory factor analysis so as to establish a fact that a significant
degree of internal consistency is achieved after confirmation of factors.
Construct Validity: Nunally (1978) stated that factorial validity is also
named as construct validity. It was Guilford (1946) who claimed that “factorial
validity of the test is given by its loading in meaningful, common reference factors”.
Hence it can be concluded that testing reliability, Exploratory Factor Analysis (EFA)
provides enough details about scales construct validity. It can be assessed by
examining Average Extracted Variance AVEs.
According to previous researchers Average Extracted variance of Factors
should be either 0.4 or more than 0.4 (Forner and Larcker, 1981; Farooq, 2016). The
Average Variance Extracted of the construct used in the present study were above
the suggested threshold value. Further composite reliability of the scales have also
been examined which also satisfies the threshold value suggested by Hair et al.,
(1998).
The scales used in the present study were categorized into two section scale
adaptation and scale construction. Stereotype threat and Job Performance scale were
constructed by the investigator whereas scales of coping strategy, Hedonic
wellbeing, tokens, and workplace ostracism were adapted. The following are the
details of the scales used in the study.
4.1. THE DEVELOPMENT AND VALIDATION OF STEREOTYPE
THREAT (ST) SCALE
Operationalization of Stereotype threat (ST) Construct
In the present study Stereotype threat (ST) is operationalized as
multidimensional construct with Occupational Identification (Oi), Gender
Identification (Gi), Gender Stigma Consciousness (Gs), Caste-category
Identification (Ci), Caste-category Stigma Consciousness (Cs), Religion
Identification (Ri), Religion Stigma Consciousness (Rs) and Negative Affect (Na) as
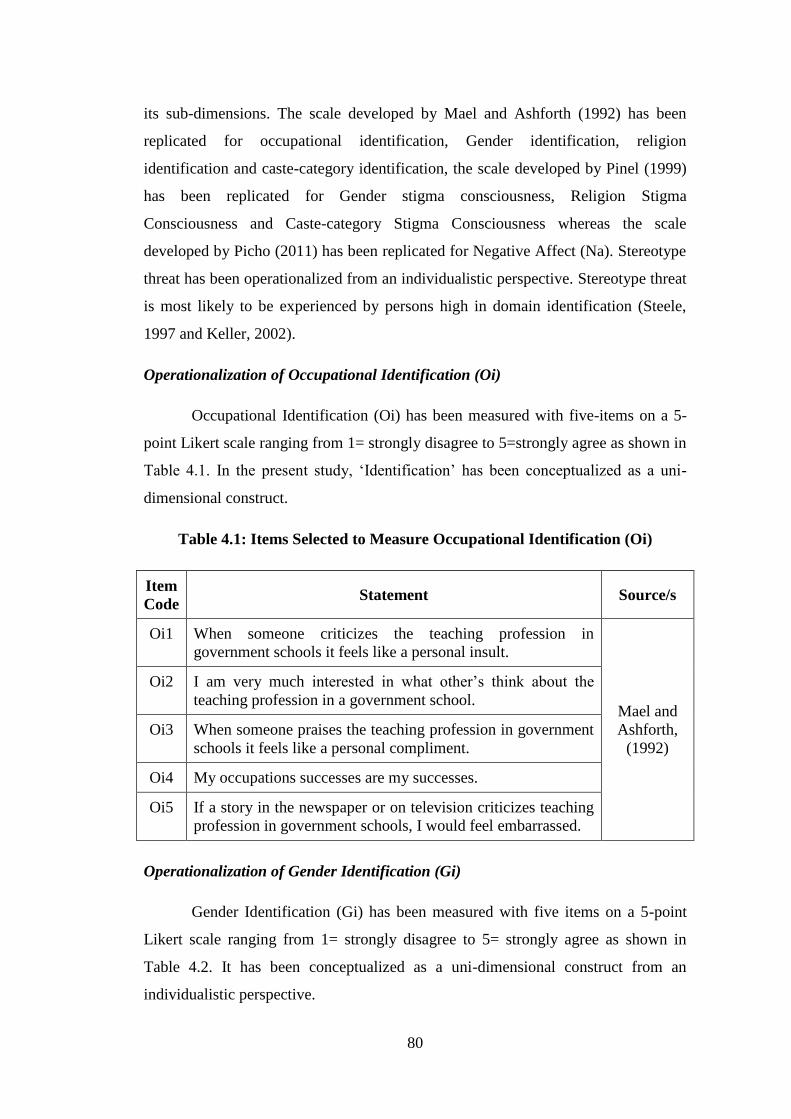
80
its sub-dimensions. The scale developed by Mael and Ashforth (1992) has been
replicated for occupational identification, Gender identification, religion
identification and caste-category identification, the scale developed by Pinel (1999)
has been replicated for Gender stigma consciousness, Religion Stigma
Consciousness and Caste-category Stigma Consciousness whereas the scale
developed by Picho (2011) has been replicated for Negative Affect (Na). Stereotype
threat has been operationalized from an individualistic perspective. Stereotype threat
is most likely to be experienced by persons high in domain identification (Steele,
1997 and Keller, 2002).
Operationalization of Occupational Identification (Oi)
Occupational Identification (Oi) has been measured with five-items on a 5-
point Likert scale ranging from 1= strongly disagree to 5=strongly agree as shown in
Table 4.1. In the present study, ‘Identification’ has been conceptualized as a uni-
dimensional construct.
Table 4.1: Items Selected to Measure Occupational Identification (Oi)
Item
Code Statement Source/s
Oi1 When someone criticizes the teaching profession in
government schools it feels like a personal insult.
Mael and
Ashforth,
(1992)
Oi2 I am very much interested in what other’s think about the
teaching profession in a government school.
Oi3 When someone praises the teaching profession in government
schools it feels like a personal compliment.
Oi4 My occupations successes are my successes.
Oi5 If a story in the newspaper or on television criticizes teaching
profession in government schools, I would feel embarrassed.
Operationalization of Gender Identification (Gi)
Gender Identification (Gi) has been measured with five items on a 5-point
Likert scale ranging from 1= strongly disagree to 5= strongly agree as shown in
Table 4.2. It has been conceptualized as a uni-dimensional construct from an
individualistic perspective.

81
Table 4.2: Items Selected to Measure Gender Identification (Gi)
Item
Code Statement Source/s
Gi1 When a teacher of opposite gender criticizes job performance
of teachers of my gender, it feels like a personal insult.
Mael and
Ashforth,
(1992)
Gi2 I am very much interested in what other’s think about taking
teaching as a profession by people of my gender.
Gi3 When someone praises Job performance of teachers of my
gender it feels like a personal compliment.
Gi4 My gender successes in teaching profession successes are my
successes.
Gi5 If a story in the newspaper or on television criticizes teachers
of my gender, I would feel embarrassed.
Operationalization of Gender Stigma Consciousness (Gs)
Gender Stigma Consciousness (Gs) has been measured with five-items on a
5-point Likert scale ranging from 1=strongly disagree to 5=strongly agree as shown
in Table 4.3. It has been conceptualized as a uni-dimensional construct from an
individualistic perspective.
Table 4.3: Items Selected to Measure Gender Stigma Consciousness (Gs)
Item
Code Statement Source/s
Gs1 Most teachers of opposite gender have a lot more negative
thoughts about the performance of other teachers of my gender
than they actually express.
Pinel
(1999)
Gs2 Most of the teachers judge job performance on the basis of
gender.
Gs3 Most of the teachers have a problem viewing the performance of
other teachers from the opposite gender as equal to their
performance.
Gs4 When interacting with teachers/officials, I feel they interpret all
my behaviors in terms of the fact that I belong to the opposite
gender.
Gs5 Stereotypes about the performance of my gender in the teaching
profession have affected me personally.
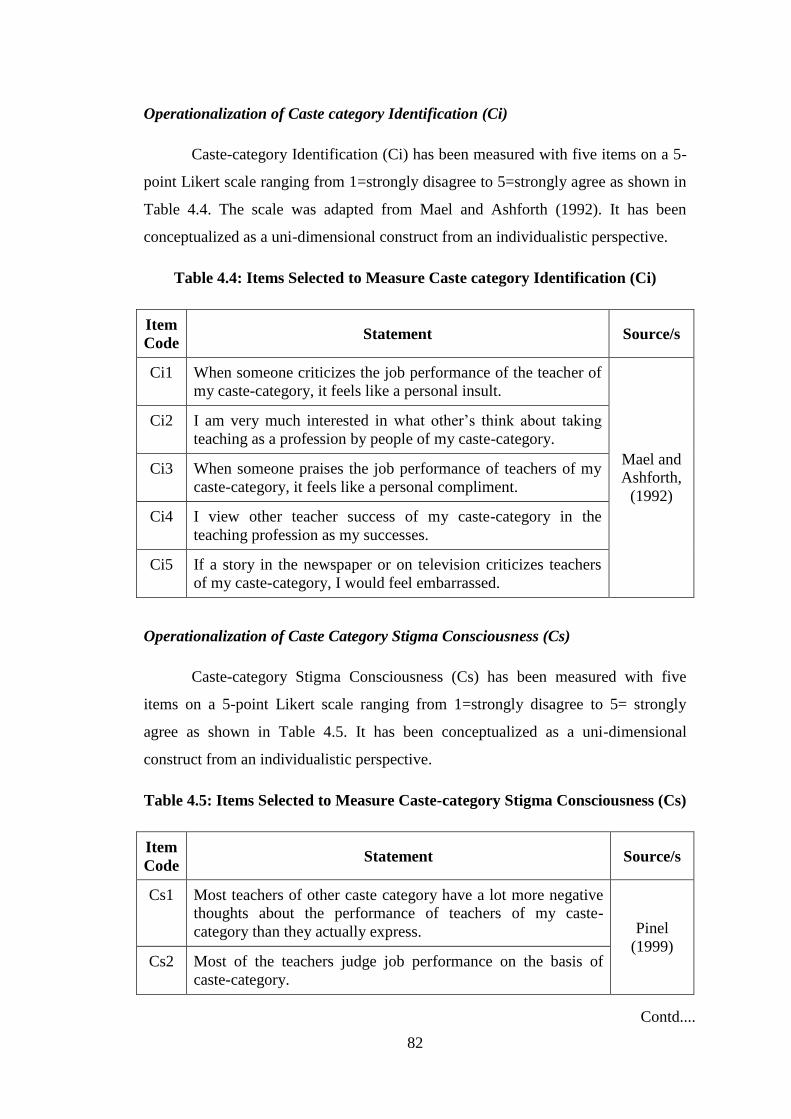
82
Operationalization of Caste category Identification (Ci)
Caste-category Identification (Ci) has been measured with five items on a 5-
point Likert scale ranging from 1=strongly disagree to 5=strongly agree as shown in
Table 4.4. The scale was adapted from Mael and Ashforth (1992). It has been
conceptualized as a uni-dimensional construct from an individualistic perspective.
Table 4.4: Items Selected to Measure Caste category Identification (Ci)
Item
Code Statement Source/s
Ci1 When someone criticizes the job performance of the teacher of
my caste-category, it feels like a personal insult.
Mael and
Ashforth,
(1992)
Ci2 I am very much interested in what other’s think about taking
teaching as a profession by people of my caste-category.
Ci3 When someone praises the job performance of teachers of my
caste-category, it feels like a personal compliment.
Ci4 I view other teacher success of my caste-category in the
teaching profession as my successes.
Ci5 If a story in the newspaper or on television criticizes teachers
of my caste-category, I would feel embarrassed.
Operationalization of Caste Category Stigma Consciousness (Cs)
Caste-category Stigma Consciousness (Cs) has been measured with five
items on a 5-point Likert scale ranging from 1=strongly disagree to 5= strongly
agree as shown in Table 4.5. It has been conceptualized as a uni-dimensional
construct from an individualistic perspective.
Table 4.5: Items Selected to Measure Caste-category Stigma Consciousness (Cs)
Item
Code Statement Source/s
Cs1 Most teachers of other caste category have a lot more negative
thoughts about the performance of teachers of my caste-
category than they actually express. Pinel
(1999) Cs2 Most of the teachers judge job performance on the basis of
caste-category.
Contd....
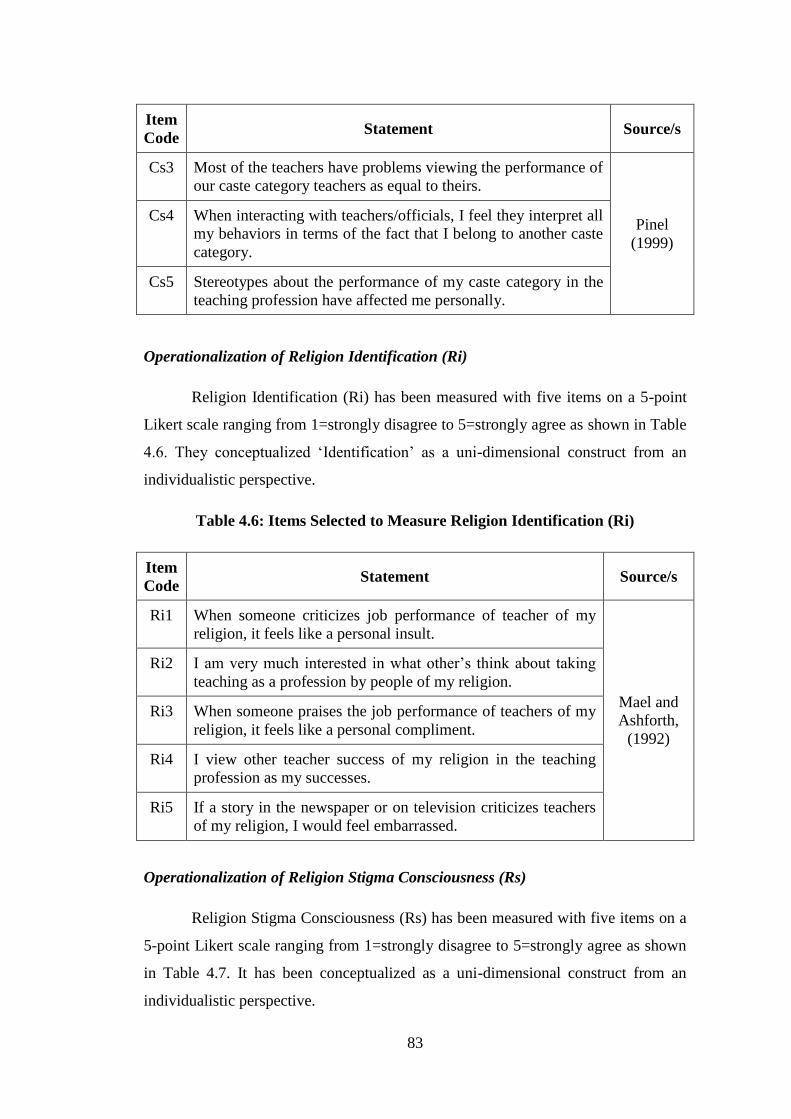
83
Item
Code Statement Source/s
Cs3 Most of the teachers have problems viewing the performance of
our caste category teachers as equal to theirs.
Pinel
(1999)
Cs4 When interacting with teachers/officials, I feel they interpret all
my behaviors in terms of the fact that I belong to another caste
category.
Cs5 Stereotypes about the performance of my caste category in the
teaching profession have affected me personally.
Operationalization of Religion Identification (Ri)
Religion Identification (Ri) has been measured with five items on a 5-point
Likert scale ranging from 1=strongly disagree to 5=strongly agree as shown in Table
4.6. They conceptualized ‘Identification’ as a uni-dimensional construct from an
individualistic perspective.
Table 4.6: Items Selected to Measure Religion Identification (Ri)
Item
Code Statement Source/s
Ri1 When someone criticizes job performance of teacher of my
religion, it feels like a personal insult.
Mael and
Ashforth,
(1992)
Ri2 I am very much interested in what other’s think about taking
teaching as a profession by people of my religion.
Ri3 When someone praises the job performance of teachers of my
religion, it feels like a personal compliment.
Ri4 I view other teacher success of my religion in the teaching
profession as my successes.
Ri5 If a story in the newspaper or on television criticizes teachers
of my religion, I would feel embarrassed.
Operationalization of Religion Stigma Consciousness (Rs)
Religion Stigma Consciousness (Rs) has been measured with five items on a
5-point Likert scale ranging from 1=strongly disagree to 5=strongly agree as shown
in Table 4.7. It has been conceptualized as a uni-dimensional construct from an
individualistic perspective.
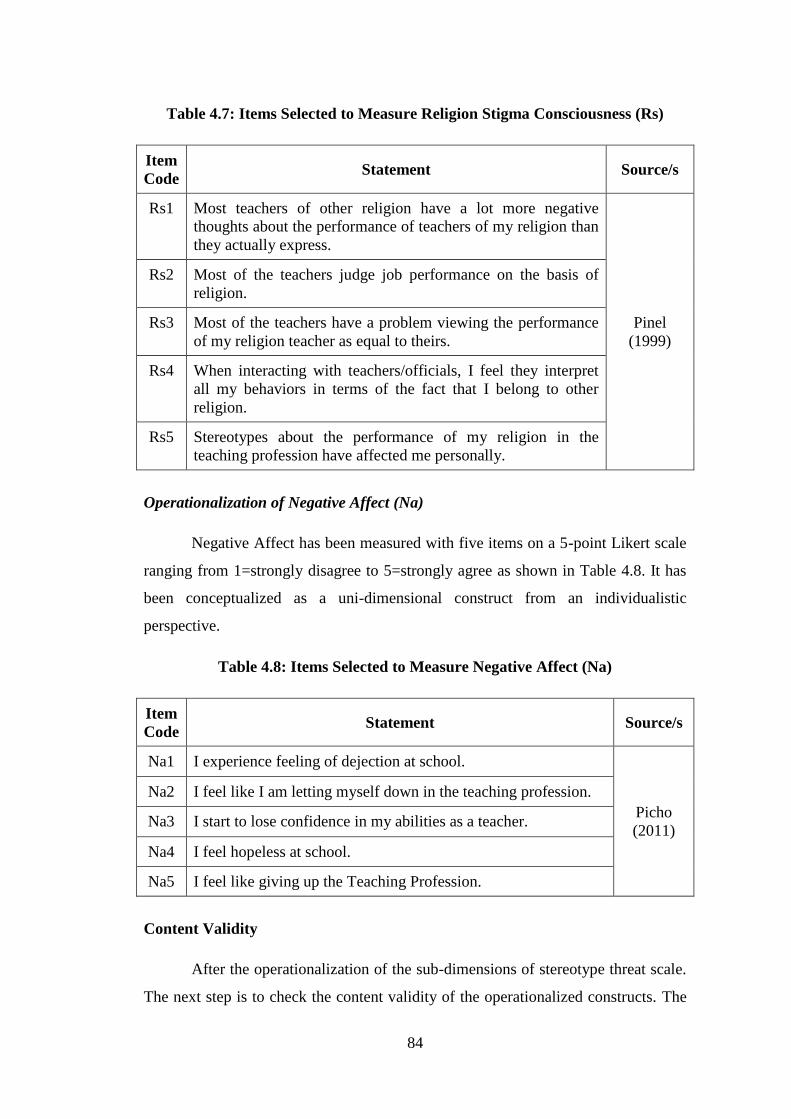
84
Table 4.7: Items Selected to Measure Religion Stigma Consciousness (Rs)
Item
Code Statement Source/s
Rs1 Most teachers of other religion have a lot more negative
thoughts about the performance of teachers of my religion than
they actually express.
Pinel
(1999)
Rs2 Most of the teachers judge job performance on the basis of
religion.
Rs3 Most of the teachers have a problem viewing the performance
of my religion teacher as equal to theirs.
Rs4 When interacting with teachers/officials, I feel they interpret
all my behaviors in terms of the fact that I belong to other
religion.
Rs5 Stereotypes about the performance of my religion in the
teaching profession have affected me personally.
Operationalization of Negative Affect (Na)
Negative Affect has been measured with five items on a 5-point Likert scale
ranging from 1=strongly disagree to 5=strongly agree as shown in Table 4.8. It has
been conceptualized as a uni-dimensional construct from an individualistic
perspective.
Table 4.8: Items Selected to Measure Negative Affect (Na)
Item
Code Statement Source/s
Na1 I experience feeling of dejection at school.
Picho
(2011)
Na2 I feel like I am letting myself down in the teaching profession.
Na3 I start to lose confidence in my abilities as a teacher.
Na4 I feel hopeless at school.
Na5 I feel like giving up the Teaching Profession.
Content Validity
After the operationalization of the sub-dimensions of stereotype threat scale.
The next step is to check the content validity of the operationalized constructs. The

85
experts were presented with construct definitions and were asked to match items
with the conforming definition. The table’s 4.9 and 4.10 presents the construct
definition provided to experts whereas the next table contains the details of the
expert.
Table 4.9: Construct Definitions Provided to Experts for Content Validity of
Stereotype Threat (ST) Scale
Sr. No Dimension Definition
1 Occupational Identification
(Oi)
It is the degree to which one personally
values achievement in a given domain.
2 Gender Identification (Gi)
“The extent to which ones gender forms a
central part of one’s self-concept”
(Picho,2011)
3 Gender Stigma
Consciousness (Gs)
“The extent to which one is chronically self-
conscious of the stigma attached to one's
gender” (Picho, 2011)
4 Caste category Identification
(Ci)
“The extent to which one's caste category
forms a central part of one’s self-concept”
(Steele, 1997)
5 Caste category Stigma
Consciousness (Cs)
“The extent to which one is chronically self-
conscious of the stigma attached to one's
caste category” (Pinel, 1999)
6 Religion Identification (Ri)
“The extent to which one's religion forms a
central part of one’s self-concept”
(Steele,1997)
7 Religion Stigma
Consciousness (Rs)
“The extent to which one is chronically self-
conscious of the stigma attached to one’s
religion” (Pinel, 1999)
8 Negative Affect (Na)
“Negative feelings of dejection experienced
during performing a job or task”
(Picho,2011)
The following table represents the details of the experts approached for the
content validity of the scale. The experts approached were from the filed of
psychology, human resource management and education.
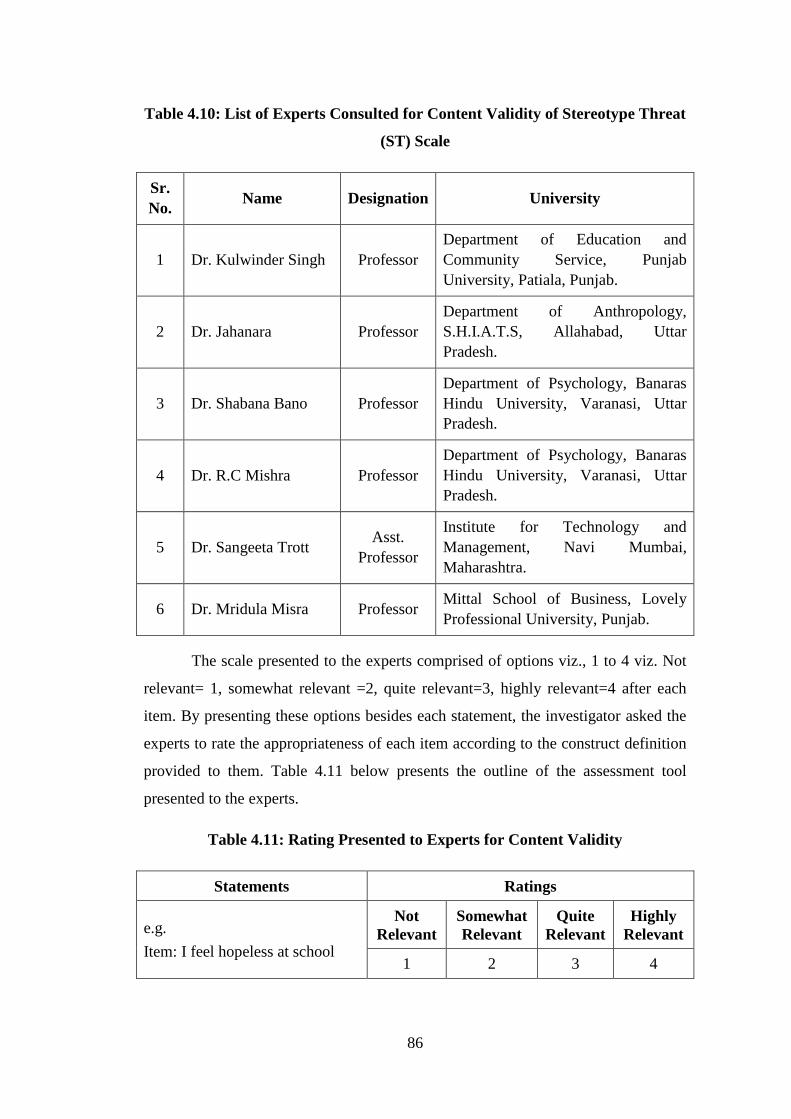
86
Table 4.10: List of Experts Consulted for Content Validity of Stereotype Threat
(ST) Scale
Sr.
No. Name Designation University
1 Dr. Kulwinder Singh Professor
Department of Education and
Community Service, Punjab
University, Patiala, Punjab.
2 Dr. Jahanara Professor
Department of Anthropology,
S.H.I.A.T.S, Allahabad, Uttar
Pradesh.
3 Dr. Shabana Bano Professor
Department of Psychology, Banaras
Hindu University, Varanasi, Uttar
Pradesh.
4 Dr. R.C Mishra Professor
Department of Psychology, Banaras
Hindu University, Varanasi, Uttar
Pradesh.
5 Dr. Sangeeta Trott Asst.
Professor
Institute for Technology and
Management, Navi Mumbai,
Maharashtra.
6 Dr. Mridula Misra Professor Mittal School of Business, Lovely
Professional University, Punjab.
The scale presented to the experts comprised of options viz., 1 to 4 viz. Not
relevant= 1, somewhat relevant =2, quite relevant=3, highly relevant=4 after each
item. By presenting these options besides each statement, the investigator asked the
experts to rate the appropriateness of each item according to the construct definition
provided to them. Table 4.11 below presents the outline of the assessment tool
presented to the experts.
Table 4.11: Rating Presented to Experts for Content Validity
Statements Ratings
e.g.
Item: I feel hopeless at school
Not
Relevant
Somewhat
Relevant
Quite
Relevant
Highly
Relevant
1 2 3 4
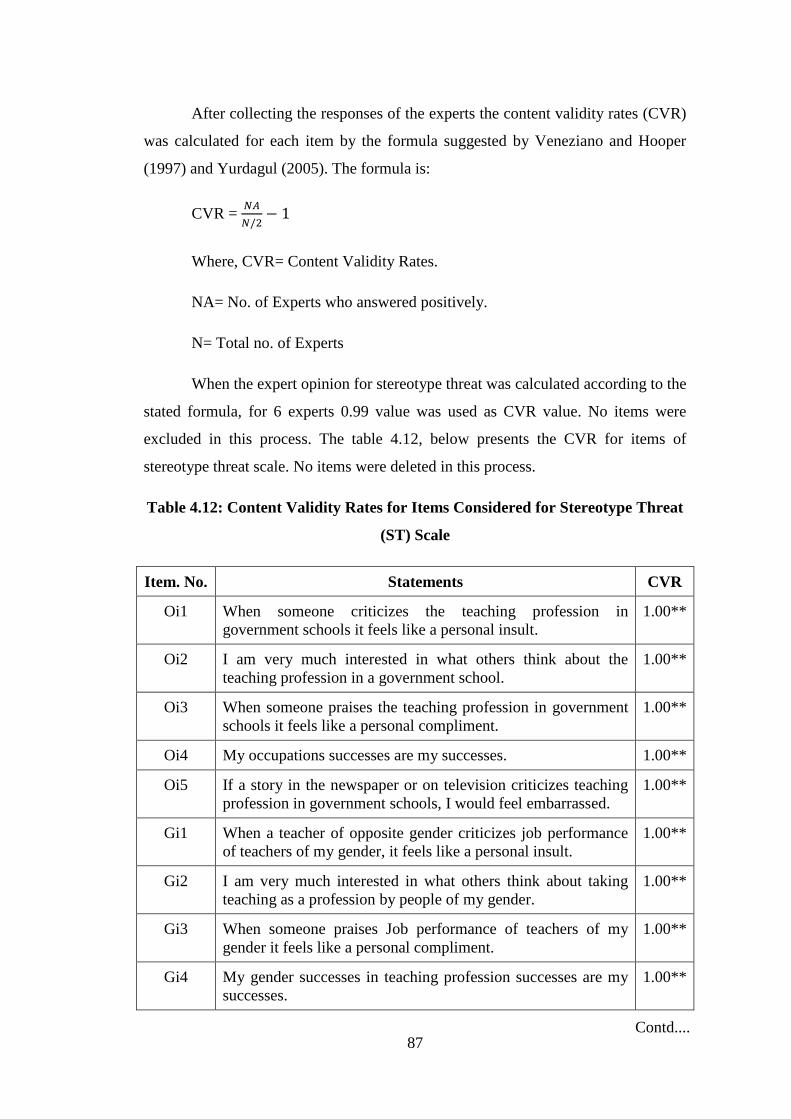
87
After collecting the responses of the experts the content validity rates (CVR)
was calculated for each item by the formula suggested by Veneziano and Hooper
(1997) and Yurdagul (2005). The formula is:
CVR =
Where, CVR= Content Validity Rates.
NA= No. of Experts who answered positively.
N= Total no. of Experts
When the expert opinion for stereotype threat was calculated according to the
stated formula, for 6 experts 0.99 value was used as CVR value. No items were
excluded in this process. The table 4.12, below presents the CVR for items of
stereotype threat scale. No items were deleted in this process.
Table 4.12: Content Validity Rates for Items Considered for Stereotype Threat
(ST) Scale
Item. No. Statements CVR
Oi1 When someone criticizes the teaching profession in
government schools it feels like a personal insult.
1.00**
Oi2 I am very much interested in what others think about the
teaching profession in a government school.
1.00**
Oi3 When someone praises the teaching profession in government
schools it feels like a personal compliment.
1.00**
Oi4 My occupations successes are my successes. 1.00**
Oi5 If a story in the newspaper or on television criticizes teaching
profession in government schools, I would feel embarrassed.
1.00**
Gi1 When a teacher of opposite gender criticizes job performance
of teachers of my gender, it feels like a personal insult.
1.00**
Gi2 I am very much interested in what others think about taking
teaching as a profession by people of my gender.
1.00**
Gi3 When someone praises Job performance of teachers of my
gender it feels like a personal compliment.
1.00**
Gi4 My gender successes in teaching profession successes are my
successes.
1.00**
Contd....
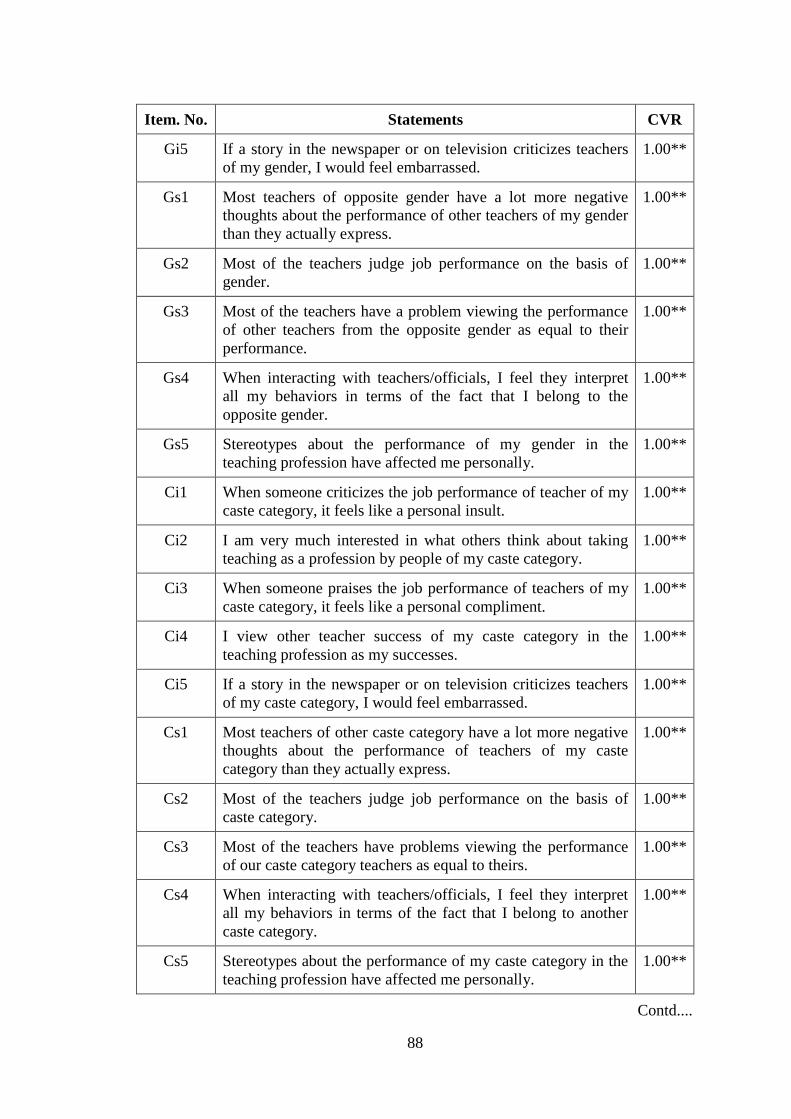
88
Item. No. Statements CVR
Gi5 If a story in the newspaper or on television criticizes teachers
of my gender, I would feel embarrassed.
1.00**
Gs1 Most teachers of opposite gender have a lot more negative
thoughts about the performance of other teachers of my gender
than they actually express.
1.00**
Gs2 Most of the teachers judge job performance on the basis of
gender.
1.00**
Gs3 Most of the teachers have a problem viewing the performance
of other teachers from the opposite gender as equal to their
performance.
1.00**
Gs4 When interacting with teachers/officials, I feel they interpret
all my behaviors in terms of the fact that I belong to the
opposite gender.
1.00**
Gs5 Stereotypes about the performance of my gender in the
teaching profession have affected me personally.
1.00**
Ci1 When someone criticizes the job performance of teacher of my
caste category, it feels like a personal insult.
1.00**
Ci2 I am very much interested in what others think about taking
teaching as a profession by people of my caste category.
1.00**
Ci3 When someone praises the job performance of teachers of my
caste category, it feels like a personal compliment.
1.00**
Ci4 I view other teacher success of my caste category in the
teaching profession as my successes.
1.00**
Ci5 If a story in the newspaper or on television criticizes teachers
of my caste category, I would feel embarrassed.
1.00**
Cs1 Most teachers of other caste category have a lot more negative
thoughts about the performance of teachers of my caste
category than they actually express.
1.00**
Cs2 Most of the teachers judge job performance on the basis of
caste category.
1.00**
Cs3 Most of the teachers have problems viewing the performance
of our caste category teachers as equal to theirs.
1.00**
Cs4 When interacting with teachers/officials, I feel they interpret
all my behaviors in terms of the fact that I belong to another
caste category.
1.00**
Cs5 Stereotypes about the performance of my caste category in the
teaching profession have affected me personally.
1.00**
Contd....
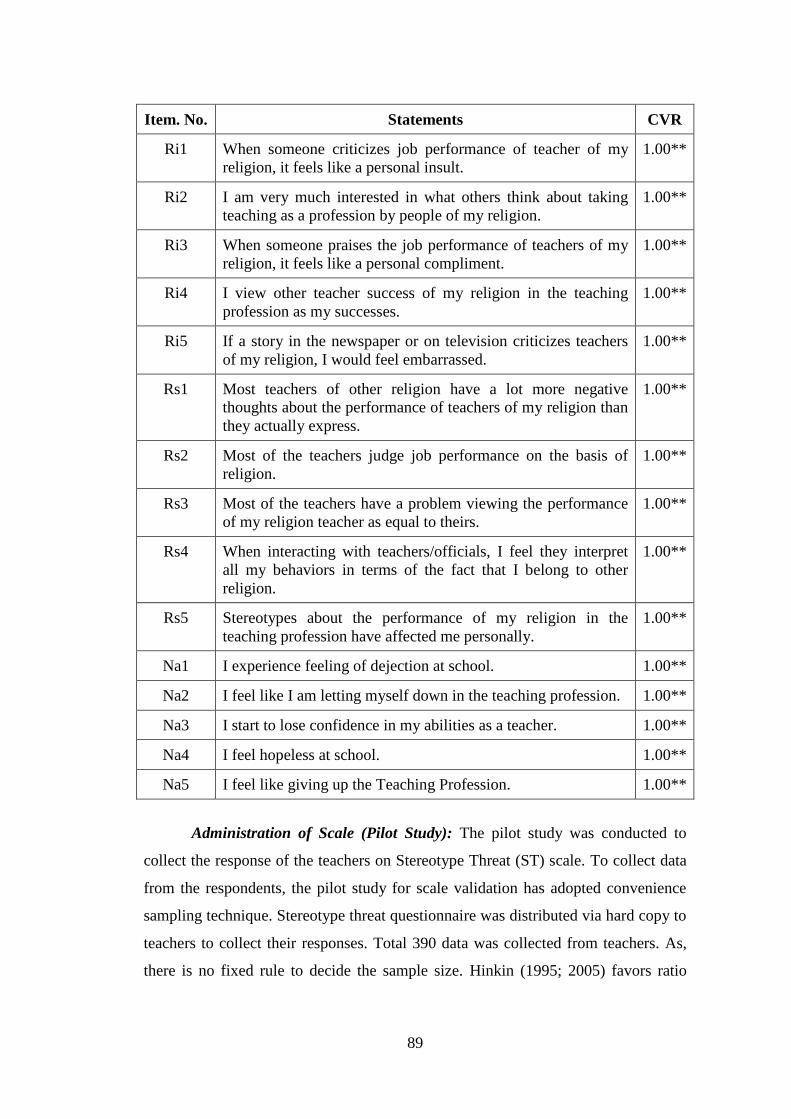
89
Item. No. Statements CVR
Ri1 When someone criticizes job performance of teacher of my
religion, it feels like a personal insult.
1.00**
Ri2 I am very much interested in what others think about taking
teaching as a profession by people of my religion.
1.00**
Ri3 When someone praises the job performance of teachers of my
religion, it feels like a personal compliment.
1.00**
Ri4 I view other teacher success of my religion in the teaching
profession as my successes.
1.00**
Ri5 If a story in the newspaper or on television criticizes teachers
of my religion, I would feel embarrassed.
1.00**
Rs1 Most teachers of other religion have a lot more negative
thoughts about the performance of teachers of my religion than
they actually express.
1.00**
Rs2 Most of the teachers judge job performance on the basis of
religion.
1.00**
Rs3 Most of the teachers have a problem viewing the performance
of my religion teacher as equal to theirs.
1.00**
Rs4 When interacting with teachers/officials, I feel they interpret
all my behaviors in terms of the fact that I belong to other
religion.
1.00**
Rs5 Stereotypes about the performance of my religion in the
teaching profession have affected me personally.
1.00**
Na1 I experience feeling of dejection at school. 1.00**
Na2 I feel like I am letting myself down in the teaching profession. 1.00**
Na3 I start to lose confidence in my abilities as a teacher. 1.00**
Na4 I feel hopeless at school. 1.00**
Na5 I feel like giving up the Teaching Profession. 1.00**
Administration of Scale (Pilot Study): The pilot study was conducted to
collect the response of the teachers on Stereotype Threat (ST) scale. To collect data
from the respondents, the pilot study for scale validation has adopted convenience
sampling technique. Stereotype threat questionnaire was distributed via hard copy to
teachers to collect their responses. Total 390 data was collected from teachers. As,
there is no fixed rule to decide the sample size. Hinkin (1995; 2005) favors ratio

90
ranging from 1:4 to 1: 10 between number of items and respondents for sample
selection. Therfore, the sample considered for validation of the scale is appropriate.
Before starting the data collection formal ethical approval was taken from the
recognized authority. After the collection of data, the technique used to inspect
internal consistency was Cronbach's alpha. The Cronbach’s Alpha was calculated
with the help of IBM, SPSS version 20. The Cronbach's alpha value of stereotype
threat construct was 0.847 which was above the acceptable threshold level. The next
step is the confirmatory factor analysis of the construct. Table 4.13 presents the
reliability statistics of stereotype threat construct.
Table 4.13: Reliability Statistics of Stereotype Threat (ST) Scale
Cronbach's Alpha N of Items
.847 40
Table 4.14: Reliability Statistics of Sub-dimensions of Stereotype Threat (ST)
Scale
Construct Sub-dimension No. of
Items
Cronbach’s
Alpha
Stereotype
Threat
(ST)
Occupational Identification 5 0.683
Gender Identification 5 0.806
Gender Stigma Consciousness 5 0.817
Caste category Identification 5 0.722
Caste category Stigma Consciousness 5 0.802
Religion Identification 5 0.897
Religion Stigma Consciousness 5 0.785
Negative Affect 5 0.845
Construct Validity: Confirmatory Factor Analysis
Confirmatory Factor Analysis (CFA) was run through AMOS 20.version to
study the confirmatory model of the above-stated constructs. The model indices like
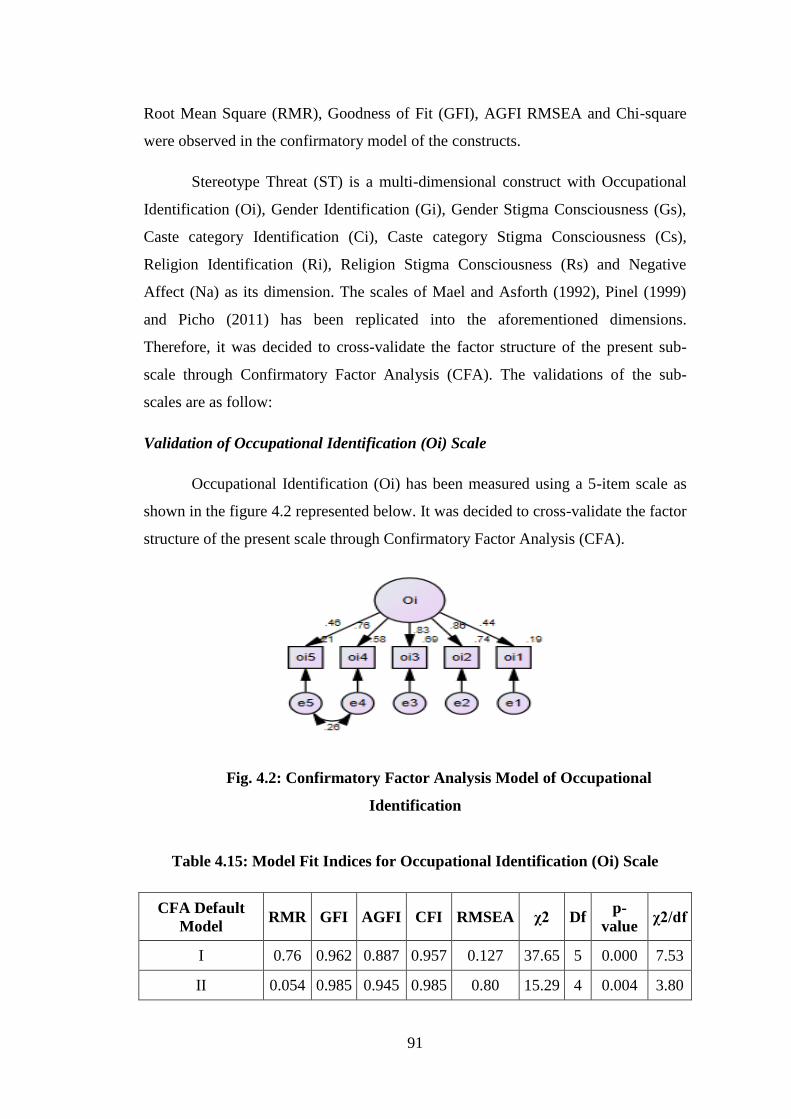
91
Root Mean Square (RMR), Goodness of Fit (GFI), AGFI RMSEA and Chi-square
were observed in the confirmatory model of the constructs.
Stereotype Threat (ST) is a multi-dimensional construct with Occupational
Identification (Oi), Gender Identification (Gi), Gender Stigma Consciousness (Gs),
Caste category Identification (Ci), Caste category Stigma Consciousness (Cs),
Religion Identification (Ri), Religion Stigma Consciousness (Rs) and Negative
Affect (Na) as its dimension. The scales of Mael and Asforth (1992), Pinel (1999)
and Picho (2011) has been replicated into the aforementioned dimensions.
Therefore, it was decided to cross-validate the factor structure of the present sub-
scale through Confirmatory Factor Analysis (CFA). The validations of the sub-
scales are as follow:
Validation of Occupational Identification (Oi) Scale
Occupational Identification (Oi) has been measured using a 5-item scale as
shown in the figure 4.2 represented below. It was decided to cross-validate the factor
structure of the present scale through Confirmatory Factor Analysis (CFA).
Fig. 4.2: Confirmatory Factor Analysis Model of Occupational
Identification
Table 4.15: Model Fit Indices for Occupational Identification (Oi) Scale
CFA Default
Model RMR GFI AGFI CFI RMSEA χ2 Df
p-
value χ2/df
I 0.76 0.962 0.887 0.957 0.127 37.65 5 0.000 7.53
II 0.054 0.985 0.945 0.985 0.80 15.29 4 0.004 3.80
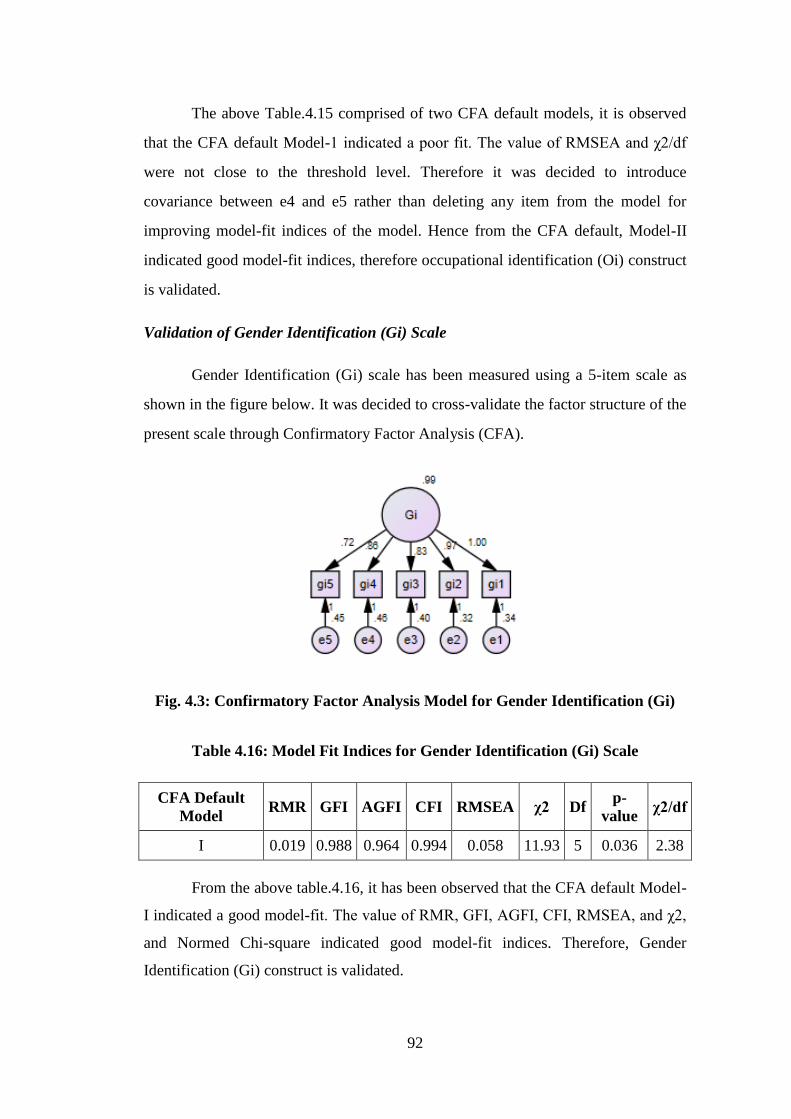
92
The above Table.4.15 comprised of two CFA default models, it is observed
that the CFA default Model-1 indicated a poor fit. The value of RMSEA and χ2/df
were not close to the threshold level. Therefore it was decided to introduce
covariance between e4 and e5 rather than deleting any item from the model for
improving model-fit indices of the model. Hence from the CFA default, Model-II
indicated good model-fit indices, therefore occupational identification (Oi) construct
is validated.
Validation of Gender Identification (Gi) Scale
Gender Identification (Gi) scale has been measured using a 5-item scale as
shown in the figure below. It was decided to cross-validate the factor structure of the
present scale through Confirmatory Factor Analysis (CFA).
Fig. 4.3: Confirmatory Factor Analysis Model for Gender Identification (Gi)
Table 4.16: Model Fit Indices for Gender Identification (Gi) Scale
CFA Default
Model RMR GFI AGFI CFI RMSEA χ2 Df
p-
value χ2/df
I 0.019 0.988 0.964 0.994 0.058 11.93 5 0.036 2.38
From the above table.4.16, it has been observed that the CFA default Model-
I indicated a good model-fit. The value of RMR, GFI, AGFI, CFI, RMSEA, and χ2,
and Normed Chi-square indicated good model-fit indices. Therefore, Gender
Identification (Gi) construct is validated.
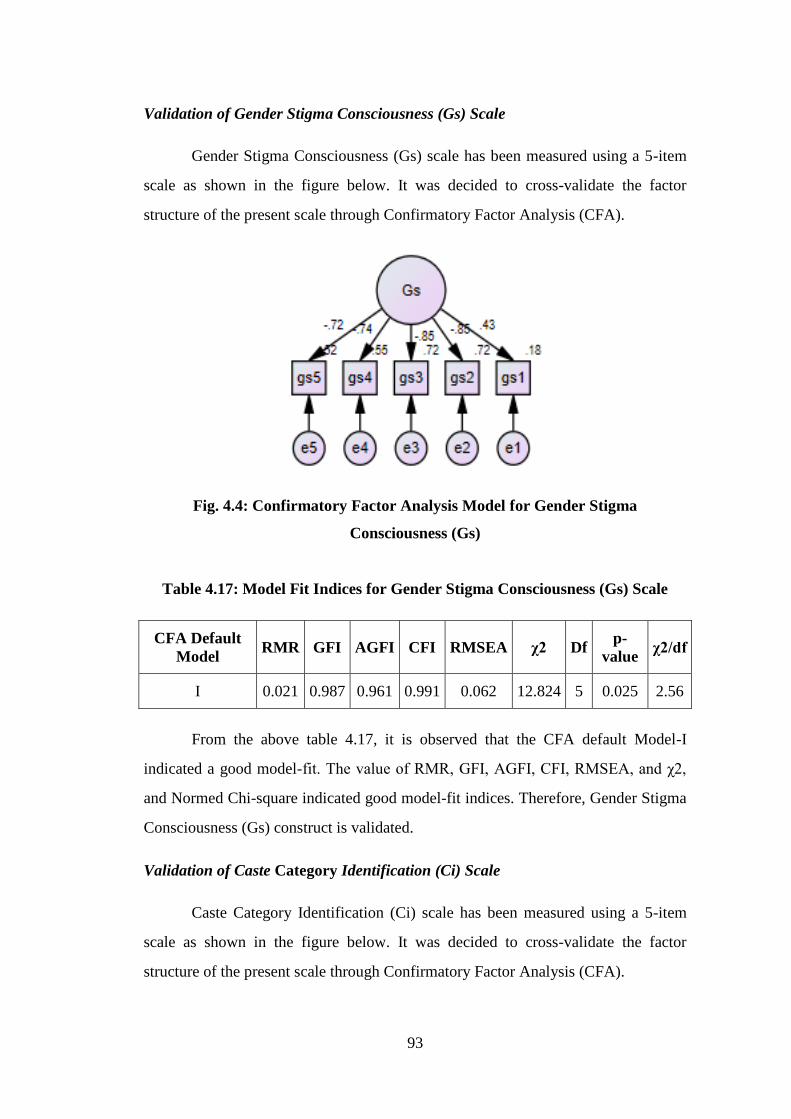
93
Validation of Gender Stigma Consciousness (Gs) Scale
Gender Stigma Consciousness (Gs) scale has been measured using a 5-item
scale as shown in the figure below. It was decided to cross-validate the factor
structure of the present scale through Confirmatory Factor Analysis (CFA).
Fig. 4.4: Confirmatory Factor Analysis Model for Gender Stigma
Consciousness (Gs)
Table 4.17: Model Fit Indices for Gender Stigma Consciousness (Gs) Scale
CFA Default
Model RMR GFI AGFI CFI RMSEA χ2 Df
p-
value χ2/df
I 0.021 0.987 0.961 0.991 0.062 12.824 5 0.025 2.56
From the above table 4.17, it is observed that the CFA default Model-I
indicated a good model-fit. The value of RMR, GFI, AGFI, CFI, RMSEA, and χ2,
and Normed Chi-square indicated good model-fit indices. Therefore, Gender Stigma
Consciousness (Gs) construct is validated.
Validation of Caste Category Identification (Ci) Scale
Caste Category Identification (Ci) scale has been measured using a 5-item
scale as shown in the figure below. It was decided to cross-validate the factor
structure of the present scale through Confirmatory Factor Analysis (CFA).

94
Fig. 4.5: Confirmatory Factor Analysis Model for Caste Category
Identification (Ci)
Table 4.18: Model Fit Indices for Caste Category Identification (Ci) Scale
CFA Default
Model RMR GFI AGFI CFI RMSEA χ2 Df
p-
value χ2/df
I 0.032 0.977 0.932 0.974 0.096 23.58 5 0.000 4.717
II 0.023 0.991 0.966 0.992 0.057 9.34 4 0.053 2.33
From the above Table 4.18, it has been observed that the CFA default
Model-1 indicated a poor fit. The value of RMSEA and χ2/df were not close to the
threshold level. Therefore it was decided to introduce covariance between e1 and e3
rather than deleting any item from the model for improving model-fit indices of the
model. Hence, from the Table 4.18 CFA default, Model-II indicated good model-fit
indices; therefore caste category identification (Ci) construct is validated.
Validation of Caste Category Stigma Consciousness (Cs) Scale
Caste Category Stigma Consciousness (Cs) scale has been measured using a
5-item scale as shown in the figure below. It was decided to cross-validate the factor
structure of the present scale through Confirmatory Factor Analysis (CFA).

95
Fig. 4.6: Confirmatory Factor analysis model for Caste Category Stigma
Consciousness
Table 4.19: Model Fit Indices for Caste Category Stigma Consciousness (Cs)
Scale
CFA Default
Model RMR GFI AGFI CFI RMSEA χ2 Df
p-
value χ2/df
I 0.033 0.986 0.959 0.989 0.067 14.11 5 0.015 2.823
From the above table 4.19, it is observed that the CFA default Model-I
indicated a good model-fit. The value of RMR, GFI, AGFI, CFI, RMSEA, and χ2,
and Normed Chi-square indicated good model-fit indices. Therefore, Caste Category
Stigma Consciousness (Cs) construct is validated.
Validation of Religion Identification (Ri) Scale
Religion Identification (Ri) scale has been measured using a 5-item scale as
shown in the figure below. It was decided to cross-validate the factor structure of the
present scale through Confirmatory Factor Analysis (CFA).
Fig. 4.7: Confirmatory Factor Analysis Model for Religion Identification (Ri)
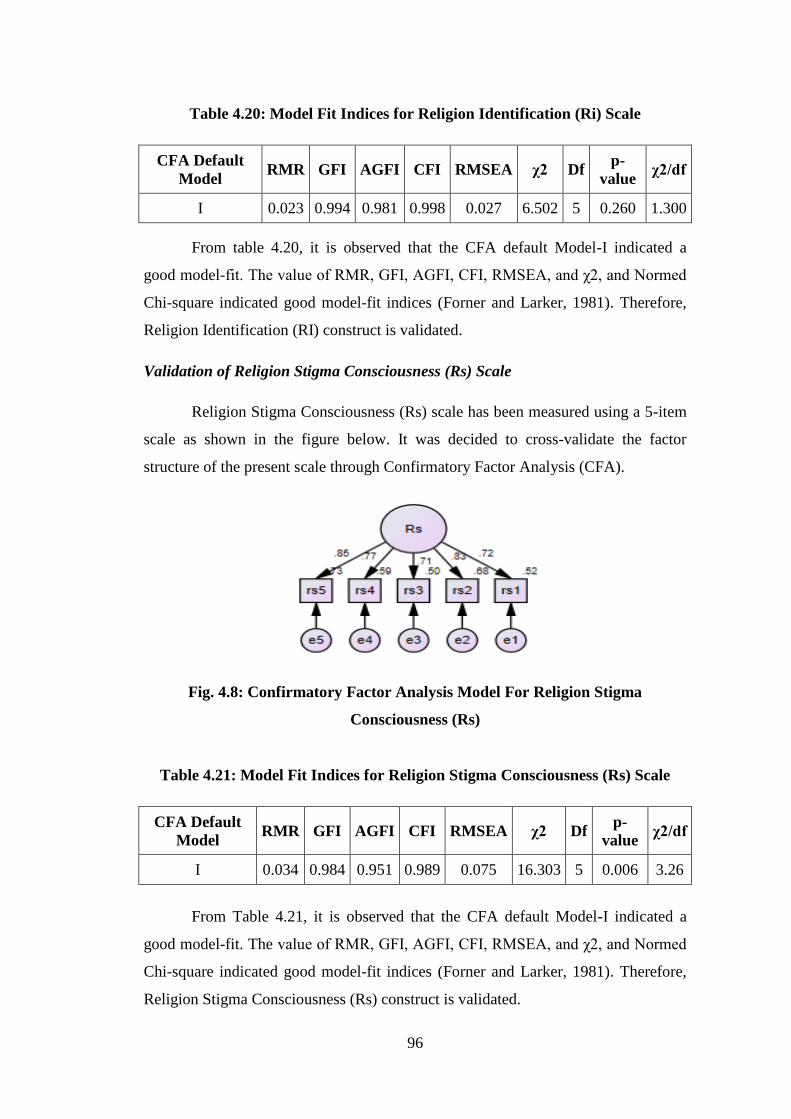
96
Table 4.20: Model Fit Indices for Religion Identification (Ri) Scale
CFA Default
Model RMR GFI AGFI CFI RMSEA χ2 Df
p-
value χ2/df
I 0.023 0.994 0.981 0.998 0.027 6.502 5 0.260 1.300
From table 4.20, it is observed that the CFA default Model-I indicated a
good model-fit. The value of RMR, GFI, AGFI, CFI, RMSEA, and χ2, and Normed
Chi-square indicated good model-fit indices (Forner and Larker, 1981). Therefore,
Religion Identification (RI) construct is validated.
Validation of Religion Stigma Consciousness (Rs) Scale
Religion Stigma Consciousness (Rs) scale has been measured using a 5-item
scale as shown in the figure below. It was decided to cross-validate the factor
structure of the present scale through Confirmatory Factor Analysis (CFA).
Fig. 4.8: Confirmatory Factor Analysis Model For Religion Stigma
Consciousness (Rs)
Table 4.21: Model Fit Indices for Religion Stigma Consciousness (Rs) Scale
CFA Default
Model RMR GFI AGFI CFI RMSEA χ2 Df
p-
value χ2/df
I 0.034 0.984 0.951 0.989 0.075 16.303 5 0.006 3.26
From Table 4.21, it is observed that the CFA default Model-I indicated a
good model-fit. The value of RMR, GFI, AGFI, CFI, RMSEA, and χ2, and Normed
Chi-square indicated good model-fit indices (Forner and Larker, 1981). Therefore,
Religion Stigma Consciousness (Rs) construct is validated.
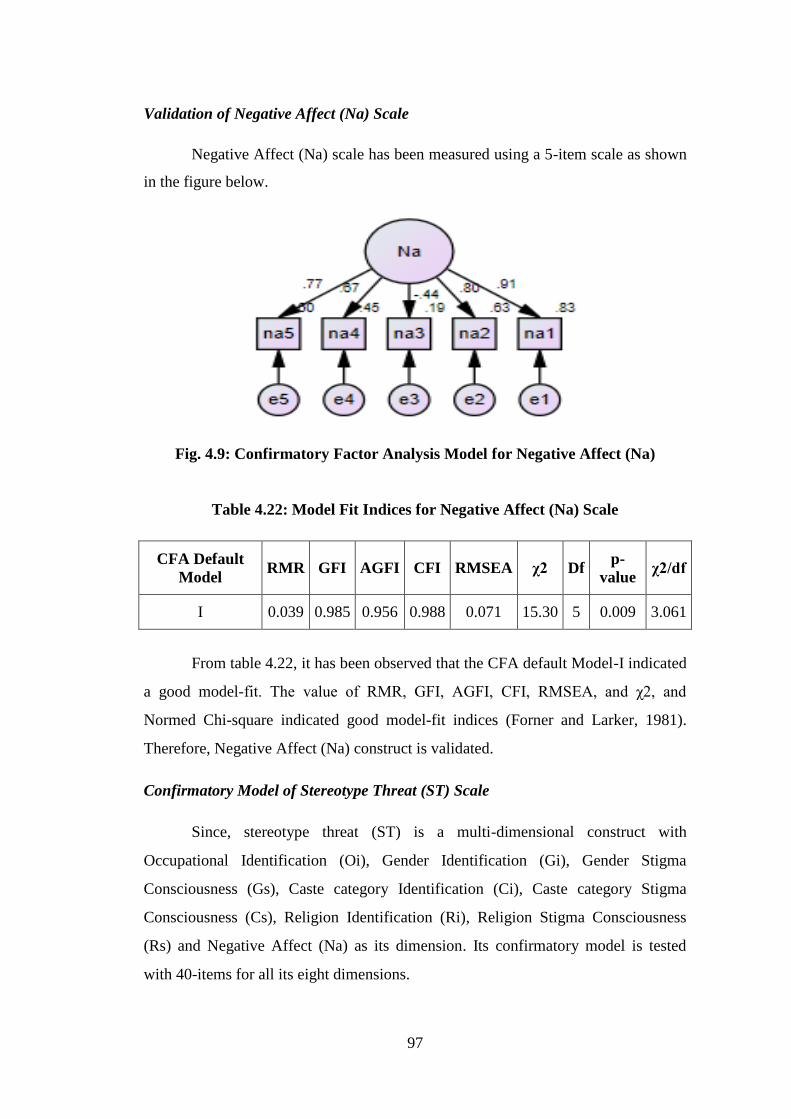
97
Validation of Negative Affect (Na) Scale
Negative Affect (Na) scale has been measured using a 5-item scale as shown
in the figure below.
Fig. 4.9: Confirmatory Factor Analysis Model for Negative Affect (Na)
Table 4.22: Model Fit Indices for Negative Affect (Na) Scale
CFA Default
Model RMR GFI AGFI CFI RMSEA χ2 Df
p-
value χ2/df
I 0.039 0.985 0.956 0.988 0.071 15.30 5 0.009 3.061
From table 4.22, it has been observed that the CFA default Model-I indicated
a good model-fit. The value of RMR, GFI, AGFI, CFI, RMSEA, and χ2, and
Normed Chi-square indicated good model-fit indices (Forner and Larker, 1981).
Therefore, Negative Affect (Na) construct is validated.
Confirmatory Model of Stereotype Threat (ST) Scale
Since, stereotype threat (ST) is a multi-dimensional construct with
Occupational Identification (Oi), Gender Identification (Gi), Gender Stigma
Consciousness (Gs), Caste category Identification (Ci), Caste category Stigma
Consciousness (Cs), Religion Identification (Ri), Religion Stigma Consciousness
(Rs) and Negative Affect (Na) as its dimension. Its confirmatory model is tested
with 40-items for all its eight dimensions.
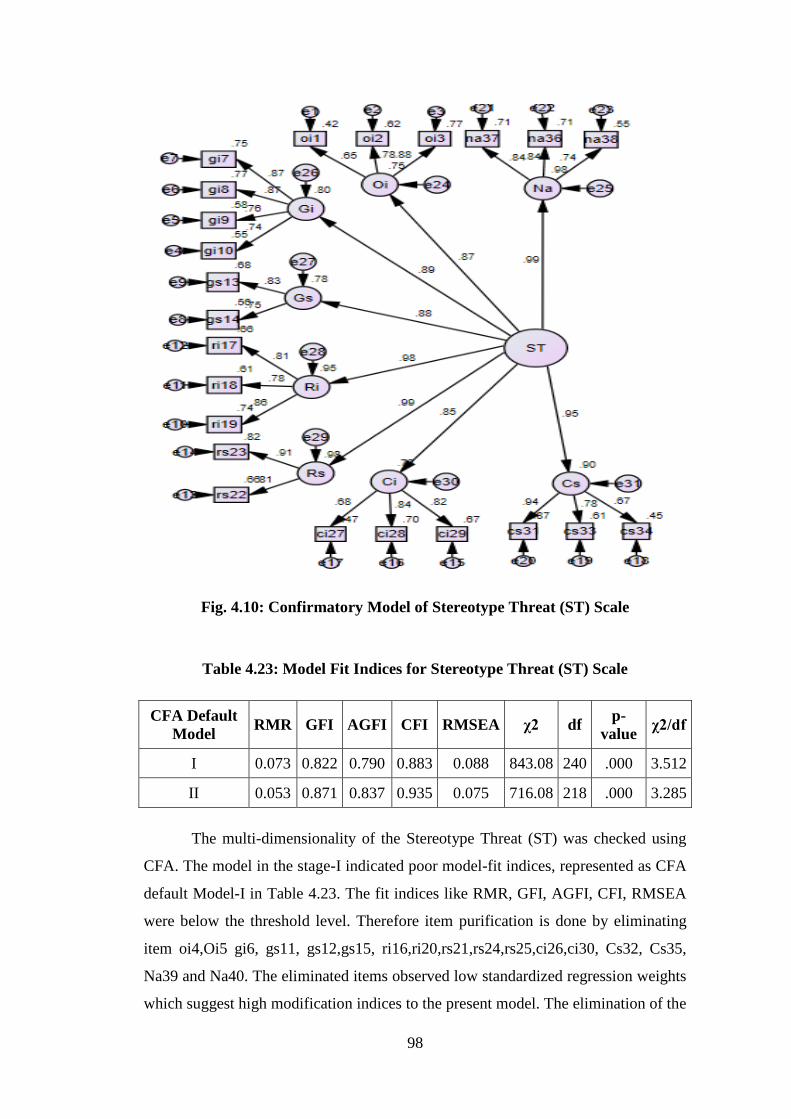
98
Fig. 4.10: Confirmatory Model of Stereotype Threat (ST) Scale
Table 4.23: Model Fit Indices for Stereotype Threat (ST) Scale
CFA Default
Model RMR GFI AGFI CFI RMSEA χ2 df
p-
value χ2/df
I 0.073 0.822 0.790 0.883 0.088 843.08 240 .000 3.512
II 0.053 0.871 0.837 0.935 0.075 716.08 218 .000 3.285
The multi-dimensionality of the Stereotype Threat (ST) was checked using
CFA. The model in the stage-I indicated poor model-fit indices, represented as CFA
default Model-I in Table 4.23. The fit indices like RMR, GFI, AGFI, CFI, RMSEA
were below the threshold level. Therefore item purification is done by eliminating
item oi4,Oi5 gi6, gs11, gs12,gs15, ri16,ri20,rs21,rs24,rs25,ci26,ci30, Cs32, Cs35,
Na39 and Na40. The eliminated items observed low standardized regression weights
which suggest high modification indices to the present model. The elimination of the
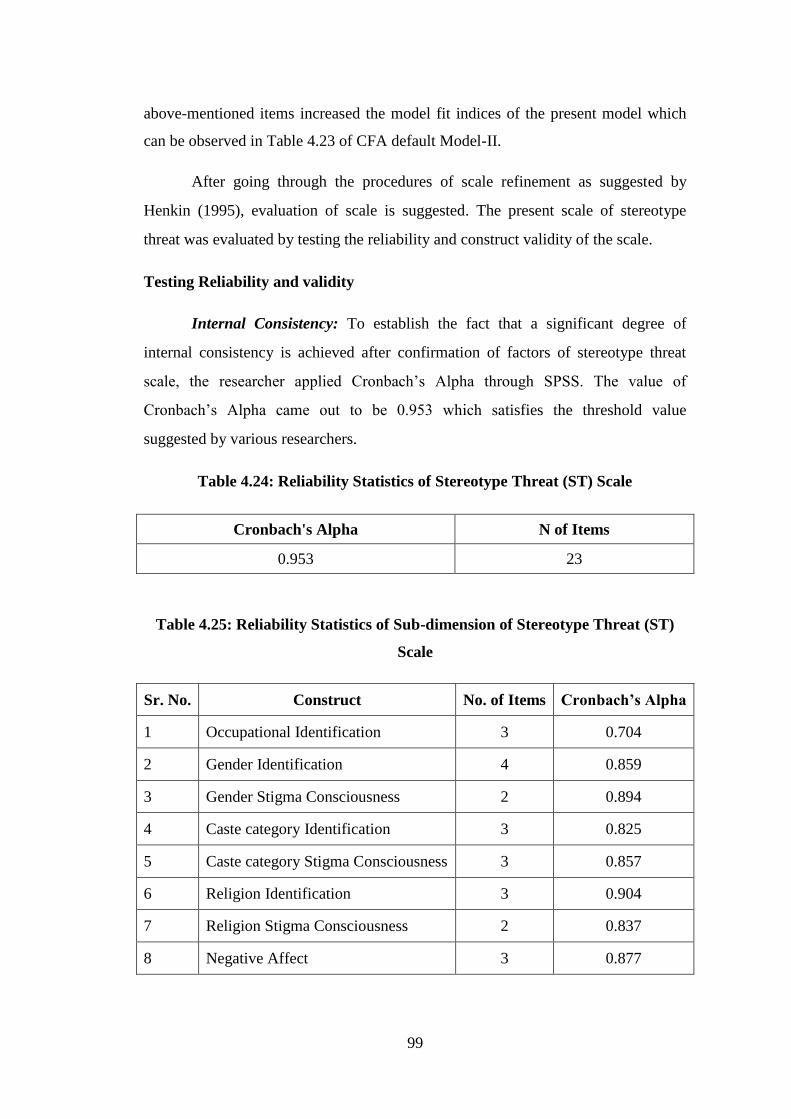
99
above-mentioned items increased the model fit indices of the present model which
can be observed in Table 4.23 of CFA default Model-II.
After going through the procedures of scale refinement as suggested by
Henkin (1995), evaluation of scale is suggested. The present scale of stereotype
threat was evaluated by testing the reliability and construct validity of the scale.
Testing Reliability and validity
Internal Consistency: To establish the fact that a significant degree of
internal consistency is achieved after confirmation of factors of stereotype threat
scale, the researcher applied Cronbach’s Alpha through SPSS. The value of
Cronbach’s Alpha came out to be 0.953 which satisfies the threshold value
suggested by various researchers.
Table 4.24: Reliability Statistics of Stereotype Threat (ST) Scale
Cronbach's Alpha N of Items
0.953 23
Table 4.25: Reliability Statistics of Sub-dimension of Stereotype Threat (ST)
Scale
Sr. No. Construct No. of Items Cronbach’s Alpha
1 Occupational Identification 3 0.704
2 Gender Identification 4 0.859
3 Gender Stigma Consciousness 2 0.894
4 Caste category Identification 3 0.825
5 Caste category Stigma Consciousness 3 0.857
6 Religion Identification 3 0.904
7 Religion Stigma Consciousness 2 0.837
8 Negative Affect 3 0.877

100
Average Extracted Variance: The validity of stereotype threat was assessed
by examining Average Extracted Variance of the scale. The Average Extracted
Variance (AVE) of stereotype threat is 0.77, which ensures that the scale is of the
stereotype threat is valid enough to be used in the present study.
Composite Reliability: Stereotype threat (ST) scale was found to be reliable
with CR = 0.977, ensuring the validation of stereotype threat (ST) scale. Hence, it
can be concluded that the stereotype threat scale used in the present study indicates a
high degree of convergence.
4.2. THE DEVELOPMENT AND VALIDATION OF JOB PERFORMANCE
(JP) SCALE
Operationalization of Job Performance (JP) Construct
In the present study Job, Performance (JP) is operationalized as a
multidimensional construct with Task Performance (TP), Contextual Performance
(CP), Adaptive Performance (AP) and Counterproductive work behavior (CWB) as
its sub-dimensions. Job performance has been operationalized from the supervisor’s
(Head-teachers/Principals) perspective rather than an individual’s (teachers)
perspective. It has been measured as a higher-order-latent construct reflected in Task
Performance (TP), Contextual Performance (CP), Adaptive Behavior and
Counterproductive work behavior (CWB).
Operationalization of Task Performance (TP)
Task performance has been measured with 8-items on a 5-point Likert scale
ranging from 1=Strongly disagree to 5=Strongly agree. The items for task
performance were identified from various literature sources as shown in below Table
4.26.
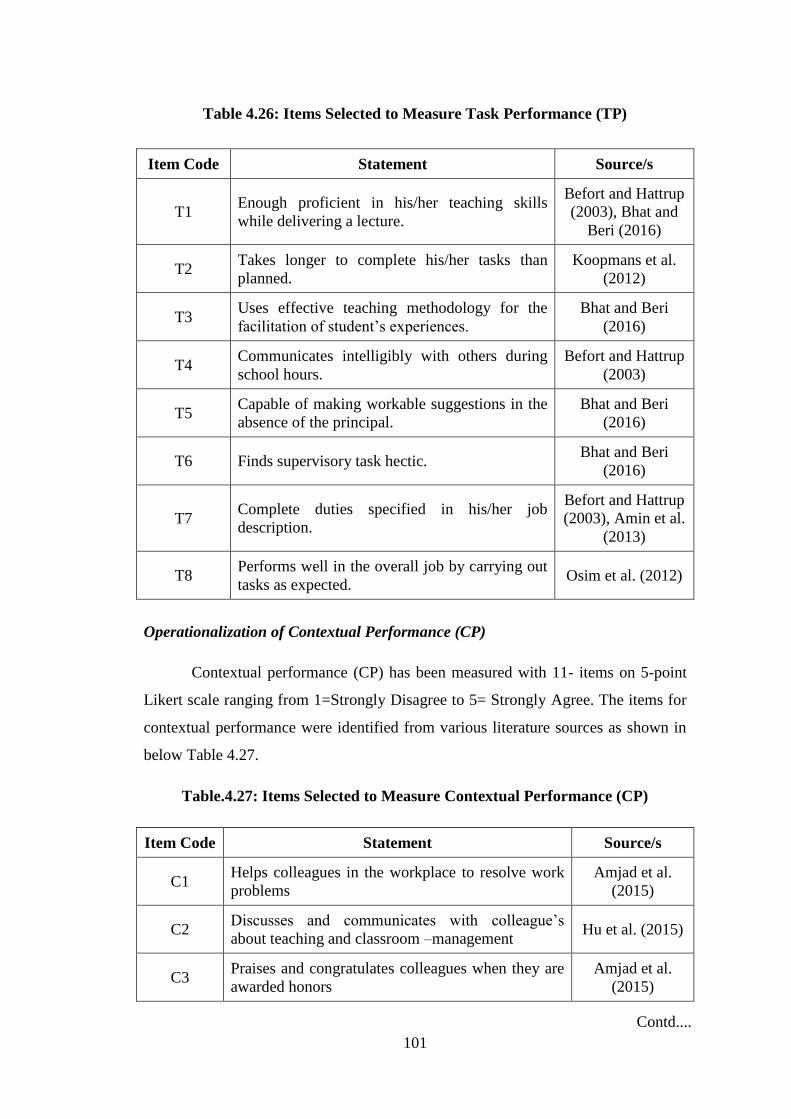
101
Table 4.26: Items Selected to Measure Task Performance (TP)
Item Code Statement Source/s
T1 Enough proficient in his/her teaching skills
while delivering a lecture.
Befort and Hattrup
(2003), Bhat and
Beri (2016)
T2 Takes longer to complete his/her tasks than
planned.
Koopmans et al.
(2012)
T3 Uses effective teaching methodology for the
facilitation of student’s experiences.
Bhat and Beri
(2016)
T4 Communicates intelligibly with others during
school hours.
Befort and Hattrup
(2003)
T5 Capable of making workable suggestions in the
absence of the principal.
Bhat and Beri
(2016)
T6 Finds supervisory task hectic. Bhat and Beri
(2016)
T7 Complete duties specified in his/her job
description.
Befort and Hattrup
(2003), Amin et al.
(2013)
T8 Performs well in the overall job by carrying out
tasks as expected. Osim et al. (2012)
Operationalization of Contextual Performance (CP)
Contextual performance (CP) has been measured with 11- items on 5-point
Likert scale ranging from 1=Strongly Disagree to 5= Strongly Agree. The items for
contextual performance were identified from various literature sources as shown in
below Table 4.27.
Table.4.27: Items Selected to Measure Contextual Performance (CP)
Item Code Statement Source/s
C1 Helps colleagues in the workplace to resolve work
problems
Amjad et al.
(2015)
C2 Discusses and communicates with colleague’s
about teaching and classroom –management Hu et al. (2015)
C3 Praises and congratulates colleagues when they are
awarded honors
Amjad et al.
(2015)
Contd....

102
Item Code Statement Source/s
C4 Devotes extra time for the overall development of
students
Really and
Aronson (2012);
Hu et al. (2015)
C5 Voluntarily helps student’s when they encounter
difficulties’ in studies or in life Hu et al. (2015)
C6 Explore and try new teaching methods. Hu et al. (2015)
C7 Regularly make efforts to introduce or publicize the
merits of my schools
Really and
Aronson (2012)
C8 Puts forward constructive suggestions for the
improvement of school or department Hu et al. (2015)
C9 Encourages co-workers to overcome their
difference
Amjad et al.
(2015)
C10 Takes initiative to orient new employees to the
department
Hu et al. (2015);
Impleman
(2007)
C11 Obey rules and regulation even in unfavorable
situations
Impleman
(2007)
Operationalization of Counterproductive Work Behavior (CWB)
Counterproductive work behavior (CWB) has been measured with 11-items
on a 5-point Likert scale ranging from 1=strongly disagree to 5=strongly agree. The
items for counterproductive work behavior were identified from various literature
sources as shown in below Table 4.28.
Table 4.28: Items Selected to Measure Counterproductive Work Behavior
(CWB)
Item Code Statement Source/s
CW1 Purposely waste schools materials/supplies
Spector et al.
(2010); Raman et
al. (2016)
CW2 Tells people outside the job what a lousy place
he/she works for
Spector et al.
(2010); Koopmans
et al. (2014)
Contd....

103
Item Code Statement Source/s
CW3 Comes to school late without permission
Spector et al.
(2010); Raman et
al. (2016)
CW4 Purposely works slowly when things needed to
get done
Koopmans et al.
(2014)
CW5 Takes a longer break than they were allowed to
take
Raman et al.
(2016)
CW6 Insults other teachers about their performance
Spector et al.
(2010); Raman et
al. (2016)
CW7 Makes fun of other employee’s personal life
Spector et al.
(2010); Raman et
al. (2016)
CW8 Takes supplies or tools of school to home
without permission
Raman et al.
(2016)
CW9 Blame other employees for his/her error at work Raman et al.
(2016)
CW10 Have said something obscene to someone at
work
Raman et al.
(2016)
CW11 Tries to look busy while doing nothing Koopmans et al.
(2014)
Operationalization of Adaptive Performance (AP)
Adaptive performance has been measured with 12- items on a 5-point Likert
scale ranging from 1=Strongly disagree to 5= Strongly agree. The items for adaptive
performance were identified from various literature sources as shown in below Table
4.29.
Table 4.29: Items Selected to Measure Adaptive Performance (AP)
Item Code Statement Source/s
AP1 Able to achieve total focus on the situation to act
quickly Pulakos et al
AP2 Work-related stress impacts the quality of work Voirin and
Roussel (2012)
Contd....
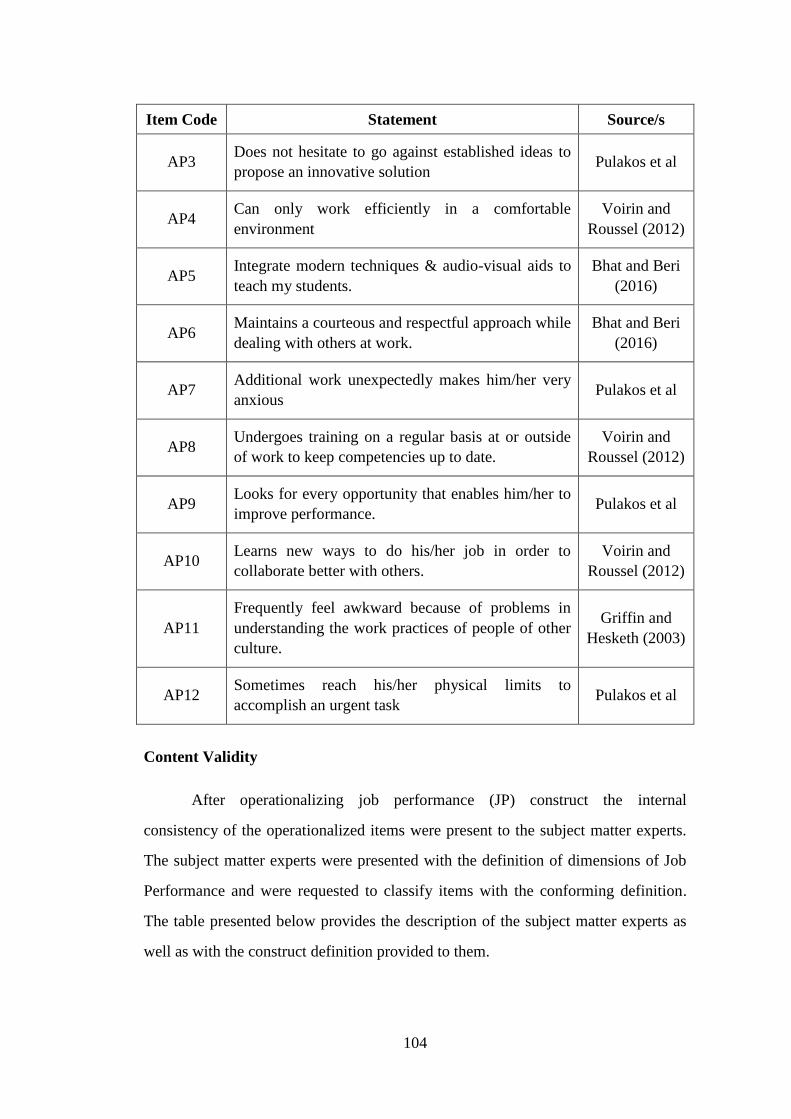
104
Item Code Statement Source/s
AP3 Does not hesitate to go against established ideas to
propose an innovative solution Pulakos et al
AP4 Can only work efficiently in a comfortable
environment
Voirin and
Roussel (2012)
AP5 Integrate modern techniques & audio-visual aids to
teach my students.
Bhat and Beri
(2016)
AP6 Maintains a courteous and respectful approach while
dealing with others at work.
Bhat and Beri
(2016)
AP7 Additional work unexpectedly makes him/her very
anxious Pulakos et al
AP8 Undergoes training on a regular basis at or outside
of work to keep competencies up to date.
Voirin and
Roussel (2012)
AP9 Looks for every opportunity that enables him/her to
improve performance. Pulakos et al
AP10 Learns new ways to do his/her job in order to
collaborate better with others.
Voirin and
Roussel (2012)
AP11
Frequently feel awkward because of problems in
understanding the work practices of people of other
culture.
Griffin and
Hesketh (2003)
AP12 Sometimes reach his/her physical limits to
accomplish an urgent task Pulakos et al
Content Validity
After operationalizing job performance (JP) construct the internal
consistency of the operationalized items were present to the subject matter experts.
The subject matter experts were presented with the definition of dimensions of Job
Performance and were requested to classify items with the conforming definition.
The table presented below provides the description of the subject matter experts as
well as with the construct definition provided to them.
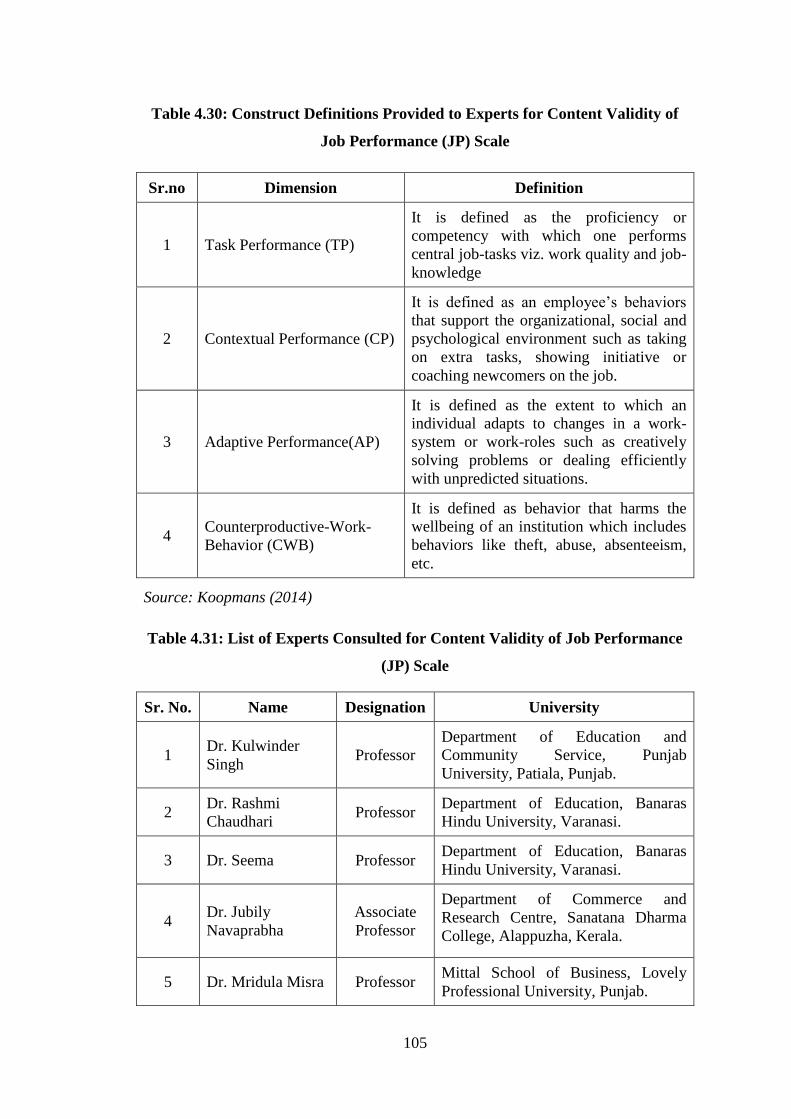
105
Table 4.30: Construct Definitions Provided to Experts for Content Validity of
Job Performance (JP) Scale
Sr.no Dimension Definition
1 Task Performance (TP)
It is defined as the proficiency or
competency with which one performs
central job-tasks viz. work quality and job-
knowledge
2 Contextual Performance (CP)
It is defined as an employee’s behaviors
that support the organizational, social and
psychological environment such as taking
on extra tasks, showing initiative or
coaching newcomers on the job.
3 Adaptive Performance(AP)
It is defined as the extent to which an
individual adapts to changes in a work-
system or work-roles such as creatively
solving problems or dealing efficiently
with unpredicted situations.
4 Counterproductive-Work-
Behavior (CWB)
It is defined as behavior that harms the
wellbeing of an institution which includes
behaviors like theft, abuse, absenteeism,
etc.
Source: Koopmans (2014)
Table 4.31: List of Experts Consulted for Content Validity of Job Performance
(JP) Scale
Sr. No. Name Designation University
1 Dr. Kulwinder
Singh Professor
Department of Education and
Community Service, Punjab
University, Patiala, Punjab.
2 Dr. Rashmi
Chaudhari Professor
Department of Education, Banaras
Hindu University, Varanasi.
3 Dr. Seema Professor Department of Education, Banaras
Hindu University, Varanasi.
4 Dr. Jubily
Navaprabha
Associate
Professor
Department of Commerce and
Research Centre, Sanatana Dharma
College, Alappuzha, Kerala.
5 Dr. Mridula Misra Professor Mittal School of Business, Lovely
Professional University, Punjab.
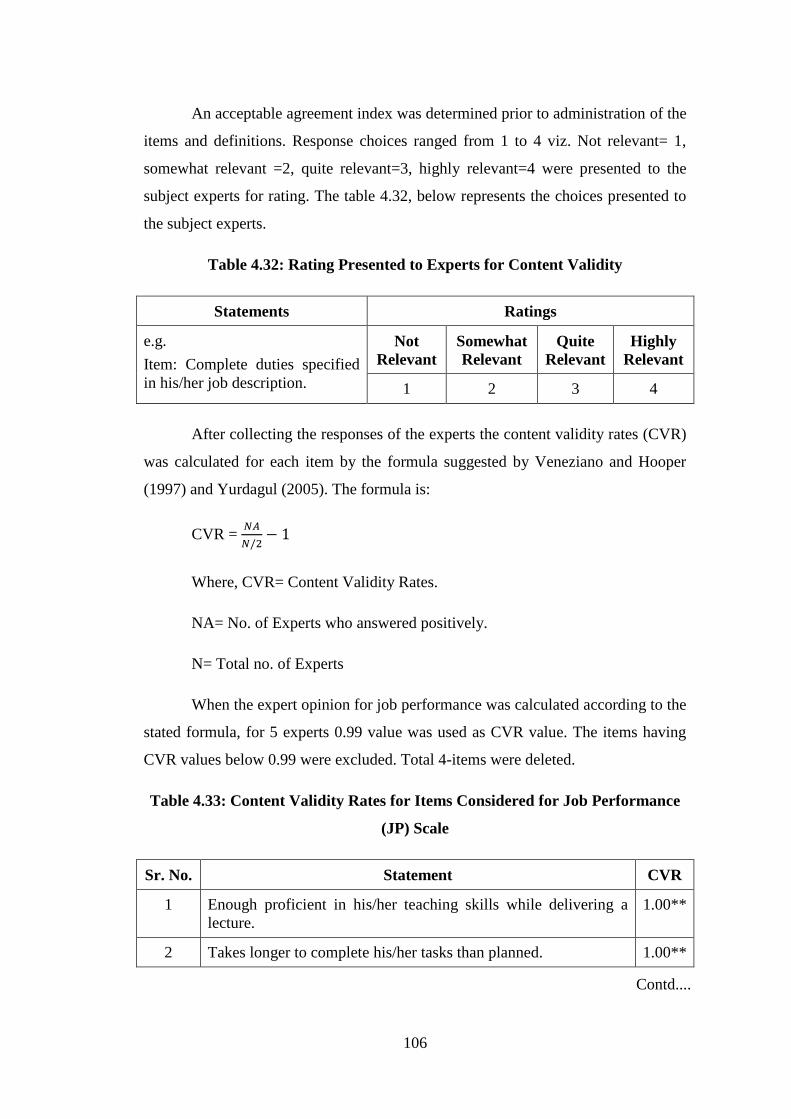
106
An acceptable agreement index was determined prior to administration of the
items and definitions. Response choices ranged from 1 to 4 viz. Not relevant= 1,
somewhat relevant =2, quite relevant=3, highly relevant=4 were presented to the
subject experts for rating. The table 4.32, below represents the choices presented to
the subject experts.
Table 4.32: Rating Presented to Experts for Content Validity
Statements Ratings
e.g.
Item: Complete duties specified
in his/her job description.
Not
Relevant
Somewhat
Relevant
Quite
Relevant
Highly
Relevant
1 2 3 4
After collecting the responses of the experts the content validity rates (CVR)
was calculated for each item by the formula suggested by Veneziano and Hooper
(1997) and Yurdagul (2005). The formula is:
CVR =
Where, CVR= Content Validity Rates.
NA= No. of Experts who answered positively.
N= Total no. of Experts
When the expert opinion for job performance was calculated according to the
stated formula, for 5 experts 0.99 value was used as CVR value. The items having
CVR values below 0.99 were excluded. Total 4-items were deleted.
Table 4.33: Content Validity Rates for Items Considered for Job Performance
(JP) Scale
Sr. No. Statement CVR
1 Enough proficient in his/her teaching skills while delivering a
lecture.
1.00**
2 Takes longer to complete his/her tasks than planned. 1.00**
Contd....
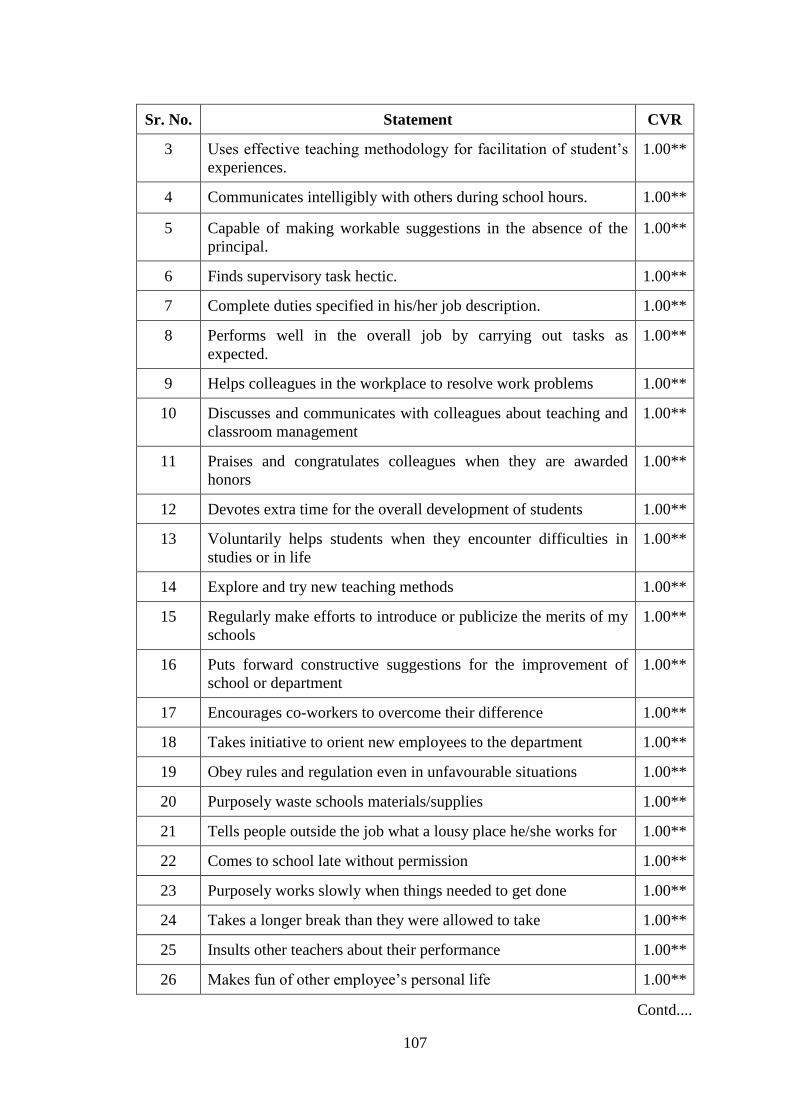
107
Sr. No. Statement CVR
3 Uses effective teaching methodology for facilitation of student’s
experiences.
1.00**
4 Communicates intelligibly with others during school hours. 1.00**
5 Capable of making workable suggestions in the absence of the
principal.
1.00**
6 Finds supervisory task hectic. 1.00**
7 Complete duties specified in his/her job description. 1.00**
8 Performs well in the overall job by carrying out tasks as
expected.
1.00**
9 Helps colleagues in the workplace to resolve work problems 1.00**
10 Discusses and communicates with colleagues about teaching and
classroom management
1.00**
11 Praises and congratulates colleagues when they are awarded
honors
1.00**
12 Devotes extra time for the overall development of students 1.00**
13 Voluntarily helps students when they encounter difficulties in
studies or in life
1.00**
14 Explore and try new teaching methods 1.00**
15 Regularly make efforts to introduce or publicize the merits of my
schools
1.00**
16 Puts forward constructive suggestions for the improvement of
school or department
1.00**
17 Encourages co-workers to overcome their difference 1.00**
18 Takes initiative to orient new employees to the department 1.00**
19 Obey rules and regulation even in unfavourable situations 1.00**
20 Purposely waste schools materials/supplies 1.00**
21 Tells people outside the job what a lousy place he/she works for 1.00**
22 Comes to school late without permission 1.00**
23 Purposely works slowly when things needed to get done 1.00**
24 Takes a longer break than they were allowed to take 1.00**
25 Insults other teachers about their performance 1.00**
26 Makes fun of other employee’s personal life 1.00**
Contd....

108
Sr. No. Statement CVR
27 Takes supplies or tools of school to home without permission 1.00**
28 Blame other employees for his/her error at work 1.00**
29 Have said something obscene to someone at work 1.00**
30 Tries to look busy while doing nothing 1.00**
31 Able to achieve total focus on the situation to act quickly 0.33
32 Work-related stress impacts the quality of work 1.00**
33 Does not hesitate to go against established ideas to propose an
innovative solution
1.00**
34 Can only work efficiently in a comfortable environment 1.00**
35 I integrate modern techniques & audio-visual aids to teach my
students.
0.22
36 Maintain a courteous and respectful approach while dealing with
others at work.
1.00**
37 Additional work unexpectedly makes him/her very anxious 1.00**
38 Undergoes training on a regular basis at or outside of work to
keep competencies up to date.
1.00**
39 Looks for every opportunity that enables him/her to improve
performance.
1.00**
40 Learns new ways to do his/her job in order to collaborate better
with others.
1.00**
41 Frequently feel awkward because of problems in understanding
the work practices of people of other culture.
0.33
42 Sometimes reach his/her physical limits to accomplish an urgent
task
0.33
Administration of Scale (Pilot Study)
The pilot study was conducted to collect the response of principals on Job
Performance (JP) scale. To collect data from the respondents, the pilot study for
scale validation has adopted convenience sampling technique. Job performance
questionnaire was distributed via hard copy to principals to collect their responses
on performance of their teachers. Total 390 data was collected from principals. As,
there is no fixed rule to decide the sample size. Hinkin (1995; 2005) favors ratio
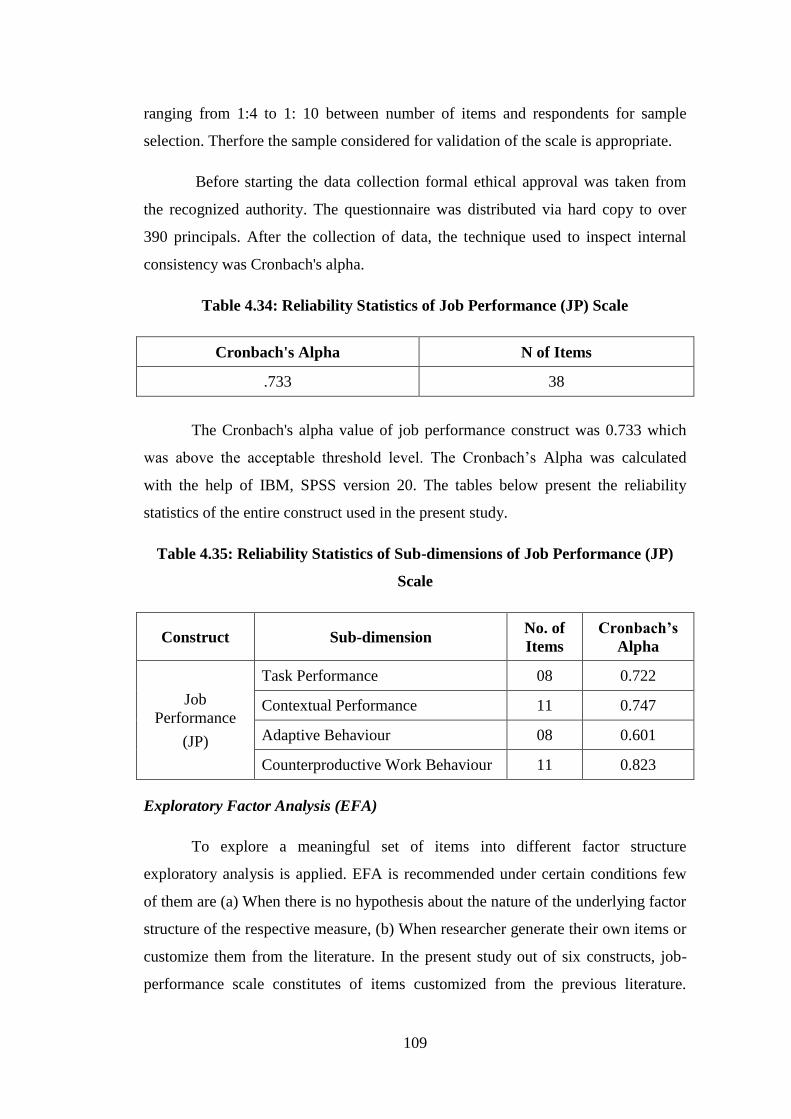
109
ranging from 1:4 to 1: 10 between number of items and respondents for sample
selection. Therfore the sample considered for validation of the scale is appropriate.
Before starting the data collection formal ethical approval was taken from
the recognized authority. The questionnaire was distributed via hard copy to over
390 principals. After the collection of data, the technique used to inspect internal
consistency was Cronbach's alpha.
Table 4.34: Reliability Statistics of Job Performance (JP) Scale
Cronbach's Alpha N of Items
.733 38
The Cronbach's alpha value of job performance construct was 0.733 which
was above the acceptable threshold level. The Cronbach’s Alpha was calculated
with the help of IBM, SPSS version 20. The tables below present the reliability
statistics of the entire construct used in the present study.
Table 4.35: Reliability Statistics of Sub-dimensions of Job Performance (JP)
Scale
Construct Sub-dimension No. of
Items
Cronbach’s
Alpha
Job
Performance
(JP)
Task Performance 08 0.722
Contextual Performance 11 0.747
Adaptive Behaviour 08 0.601
Counterproductive Work Behaviour 11 0.823
Exploratory Factor Analysis (EFA)
To explore a meaningful set of items into different factor structure
exploratory analysis is applied. EFA is recommended under certain conditions few
of them are (a) When there is no hypothesis about the nature of the underlying factor
structure of the respective measure, (b) When researcher generate their own items or
customize them from the literature. In the present study out of six constructs, job-
performance scale constitutes of items customized from the previous literature.

110
Therefore the researcher opts to conduct Exploratory Factor Analysis (EFA) on the
performance scale.
There is no consensus among researchers regarding the adequate sample size
to validate a scale. To conduct an appropriate test for statistical significance, some
researchers favor respondent-to-statement ratio as 4:1 (Rummel, 1970), some favors
it as 5:1 (Hatcher, 1994; Tatham and Black, 1995) whereas some favor a higher ratio
of 10:1 (Schwab,1980). But the majority of the researcher favors the ratio of
3:1(Catell, 1978; Arrindell and Van Der Ende, 1985). Therefore; the dataset used in
the present study satisfies the condition for factor analysis. Hence factor analysis can
be applied to obtain a meaningful set of variables for construct Job-Performance
(EFA).
Researchers suggest that before applying factor analysis to the dataset one
should check the Kaiser-Meyer-Olkin (KMO) value of the data. The Kaiser-Meyer-
Value (KMO) value should be 0.60 or more (Tabachnick and Fidell, 1996) for a
good and effective factor structure. The table 4.36, below presents the KMO and
Bartletts Test values.
Table 4.36: KMO and Bartlett’s Test Values
Kaiser-Meyer-Olkin Measure of Sampling Adequacy .823
Approx.Chi-Square 9972.545
Bartlett’s Test of Sphericity Df 378
Sig. .000
The above table reveals that the performance dataset of the present study
which fulfills the criteria to conduct further analysis. The researcher employed
Principal Component Analysis (PCA) and the varimax method of rotation for
extracting the factors.
The extraction of factors includes the application of several iterations to the
dataset. In every iteration’s ‘total variance explained’ with a number of factors is
observed by the researcher. The main aim of the researcher is to improve ‘total
variance explained’ as well as obtaining a good matrix with good loadings.

111
Table 4.37: Results of Exploratory Factor Analysis for the Construct ‘Job
Performance’ (JP) Construct C
on
stru
ct
Fa
cto
rs (
%
of
Va
ria
nce
)
Dim
ensi
on
s
Item
Co
de
Items
Fa
cto
r
Lo
ad
ing
Job
Per
form
an
ce (
JP
)
Fac
tor
1
(34
.08
5)
Tas
k P
erfo
rman
ce
T1 Enough proficient in his/her teaching skills while
delivering lectures? 0.994
T2 Uses effective teaching methodology for the facilitation
of student’s experience 0.993
T3 Communicates intelligibly with others during school
hours. 0.975
Fac
tor
2
(16.5
15)
Conte
xtu
al P
erfo
rman
ce C1
Praises and congratulates colleagues when they are
awarded honors 0.574
C2 Discusses and communicate with colleagues about
teaching and classroom management. 0.909
C3 Devote extra time for the overall development of
students. 0.928
C4 Put forward constructive suggestions for the
improvement of department or school 0.949
Fac
tor
3
(16
.40
2)
Co
un
terp
rod
uct
ive
Work
Beh
avio
r
CW1 Purposely waste schools materials/supplies. 0.961
CW2 Comes to school late without permission 0.838
CW3 Tries to look busy while doing nothing 0.732
CW4 Blame other employees for his/her error at work. 0.651
CW5 Takes schools supplies and tools home without
permission. 0.609
CW6 Can only work efficiently in a comfortable
environment. 0.580
CW7 Purposely works slowly when things need to get done. 0.552
CW8 Finds supervisory task hectic. 0.949
CW9 Takes longer to complete his/her work tasks than
planned 0.914
CW10 Makes fun of other employees personal life 0.788
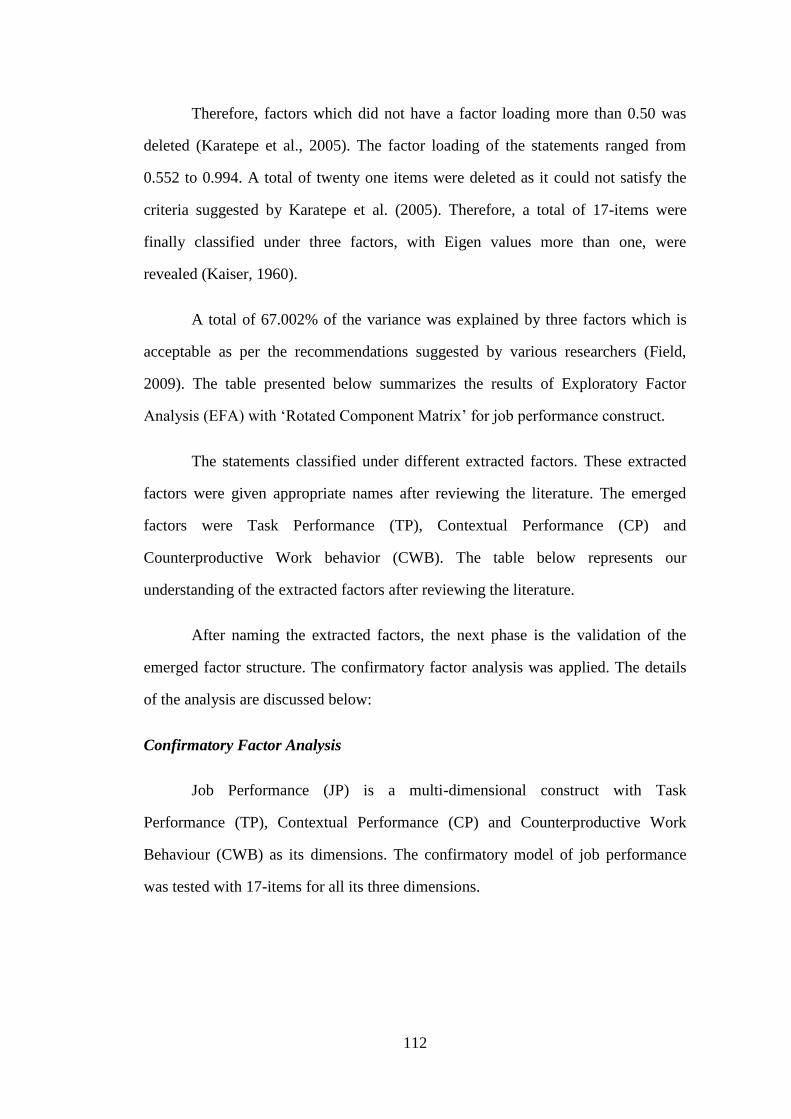
112
Therefore, factors which did not have a factor loading more than 0.50 was
deleted (Karatepe et al., 2005). The factor loading of the statements ranged from
0.552 to 0.994. A total of twenty one items were deleted as it could not satisfy the
criteria suggested by Karatepe et al. (2005). Therefore, a total of 17-items were
finally classified under three factors, with Eigen values more than one, were
revealed (Kaiser, 1960).
A total of 67.002% of the variance was explained by three factors which is
acceptable as per the recommendations suggested by various researchers (Field,
2009). The table presented below summarizes the results of Exploratory Factor
Analysis (EFA) with ‘Rotated Component Matrix’ for job performance construct.
The statements classified under different extracted factors. These extracted
factors were given appropriate names after reviewing the literature. The emerged
factors were Task Performance (TP), Contextual Performance (CP) and
Counterproductive Work behavior (CWB). The table below represents our
understanding of the extracted factors after reviewing the literature.
After naming the extracted factors, the next phase is the validation of the
emerged factor structure. The confirmatory factor analysis was applied. The details
of the analysis are discussed below:
Confirmatory Factor Analysis
Job Performance (JP) is a multi-dimensional construct with Task
Performance (TP), Contextual Performance (CP) and Counterproductive Work
Behaviour (CWB) as its dimensions. The confirmatory model of job performance
was tested with 17-items for all its three dimensions.
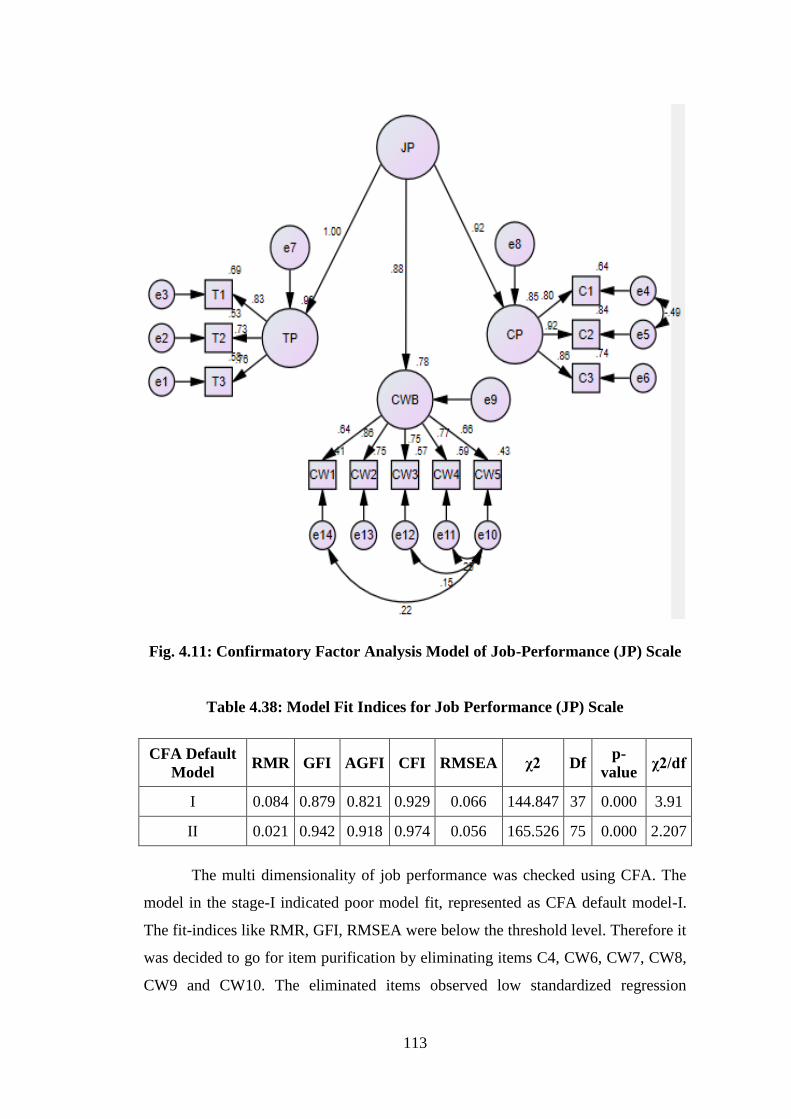
113
Fig. 4.11: Confirmatory Factor Analysis Model of Job-Performance (JP) Scale
Table 4.38: Model Fit Indices for Job Performance (JP) Scale
CFA Default
Model RMR GFI AGFI CFI RMSEA χ2 Df
p-
value χ2/df
I 0.084 0.879 0.821 0.929 0.066 144.847 37 0.000 3.91
II 0.021 0.942 0.918 0.974 0.056 165.526 75 0.000 2.207
The multi dimensionality of job performance was checked using CFA. The
model in the stage-I indicated poor model fit, represented as CFA default model-I.
The fit-indices like RMR, GFI, RMSEA were below the threshold level. Therefore it
was decided to go for item purification by eliminating items C4, CW6, CW7, CW8,
CW9 and CW10. The eliminated items observed low standardized regression
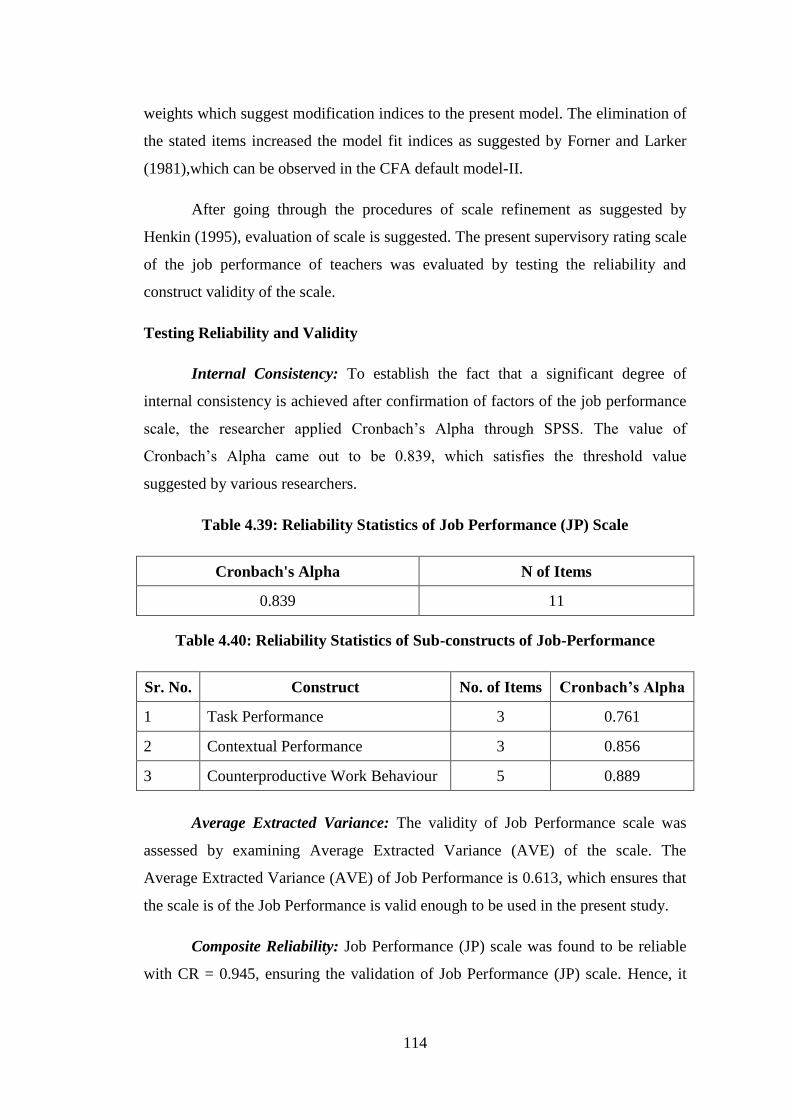
114
weights which suggest modification indices to the present model. The elimination of
the stated items increased the model fit indices as suggested by Forner and Larker
(1981),which can be observed in the CFA default model-II.
After going through the procedures of scale refinement as suggested by
Henkin (1995), evaluation of scale is suggested. The present supervisory rating scale
of the job performance of teachers was evaluated by testing the reliability and
construct validity of the scale.
Testing Reliability and Validity
Internal Consistency: To establish the fact that a significant degree of
internal consistency is achieved after confirmation of factors of the job performance
scale, the researcher applied Cronbach’s Alpha through SPSS. The value of
Cronbach’s Alpha came out to be 0.839, which satisfies the threshold value
suggested by various researchers.
Table 4.39: Reliability Statistics of Job Performance (JP) Scale
Cronbach's Alpha N of Items
0.839 11
Table 4.40: Reliability Statistics of Sub-constructs of Job-Performance
Sr. No. Construct No. of Items Cronbach’s Alpha
1 Task Performance 3 0.761
2 Contextual Performance 3 0.856
3 Counterproductive Work Behaviour 5 0.889
Average Extracted Variance: The validity of Job Performance scale was
assessed by examining Average Extracted Variance (AVE) of the scale. The
Average Extracted Variance (AVE) of Job Performance is 0.613, which ensures that
the scale is of the Job Performance is valid enough to be used in the present study.
Composite Reliability: Job Performance (JP) scale was found to be reliable
with CR = 0.945, ensuring the validation of Job Performance (JP) scale. Hence, it
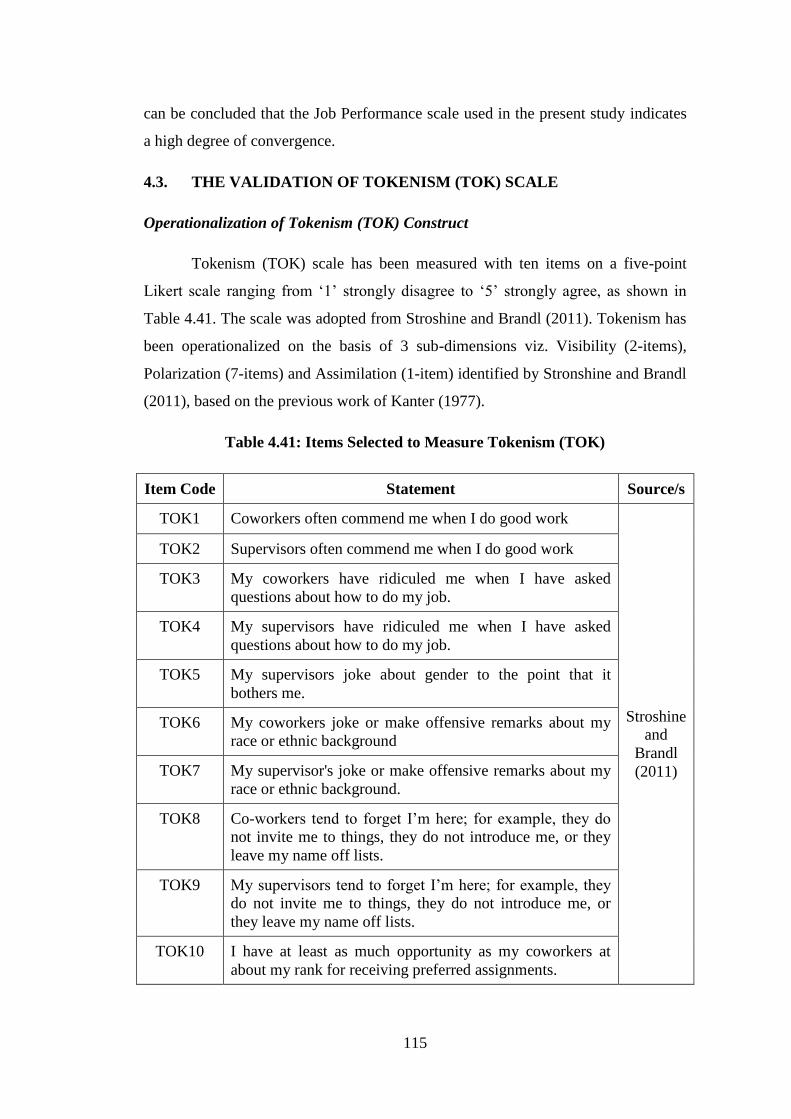
115
can be concluded that the Job Performance scale used in the present study indicates
a high degree of convergence.
4.3. THE VALIDATION OF TOKENISM (TOK) SCALE
Operationalization of Tokenism (TOK) Construct
Tokenism (TOK) scale has been measured with ten items on a five-point
Likert scale ranging from ‘1’ strongly disagree to ‘5’ strongly agree, as shown in
Table 4.41. The scale was adopted from Stroshine and Brandl (2011). Tokenism has
been operationalized on the basis of 3 sub-dimensions viz. Visibility (2-items),
Polarization (7-items) and Assimilation (1-item) identified by Stronshine and Brandl
(2011), based on the previous work of Kanter (1977).
Table 4.41: Items Selected to Measure Tokenism (TOK)
Item Code Statement Source/s
TOK1 Coworkers often commend me when I do good work
Stroshine
and
Brandl
(2011)
TOK2 Supervisors often commend me when I do good work
TOK3 My coworkers have ridiculed me when I have asked
questions about how to do my job.
TOK4 My supervisors have ridiculed me when I have asked
questions about how to do my job.
TOK5 My supervisors joke about gender to the point that it
bothers me.
TOK6 My coworkers joke or make offensive remarks about my
race or ethnic background
TOK7 My supervisor's joke or make offensive remarks about my
race or ethnic background.
TOK8 Co-workers tend to forget I’m here; for example, they do
not invite me to things, they do not introduce me, or they
leave my name off lists.
TOK9 My supervisors tend to forget I’m here; for example, they
do not invite me to things, they do not introduce me, or
they leave my name off lists.
TOK10 I have at least as much opportunity as my coworkers at
about my rank for receiving preferred assignments.

116
Administration of Scale (Pilot Study)
The pilot study was conducted to collect the response of teachers on the scale
measuring tokenism effect (TOK). To collect data from the respondents, the pilot
study for scale validation has adopted convenience sampling technique. Tokenism
effect scale was distributed via hard copy to teachers to collect their responses. Total
390 data was collected from teachers. As, there is no fixed rule to decide the sample
size. Hinkin (1995; 2005) favors ratio ranging from 1:4 to 1: 10 between number of
items and respondents for sample selection. Therfore the sample considered for
validation of the scale is appropriate.
Before starting the data collection formal ethical approval was taken from the
recognized authority. The questionnaire was distributed via hard copy to over 390
teachers. After the collection of data, the technique used to inspect internal
consistency was Cronbach's alpha. The Cronbach's alpha value of Tokenism was
below the acceptable threshold level. It was suggested that items with low
correlation can be deleted to improve the alpha value of a construct (Tavakol and
Dennick, 2011). Therefore to improve the reliability of tokenism construct two of its
items (TOK_9 and TOK_10) were deleted. The Cronbach’s value came out to be
0.820, which is above the threshold value. The Cronbach’s Alpha was calculated
with the help of IBM, SPSS version 20. The table 4.42 presented below the
reliability statistics of the entire construct used in the present study.
Table 4.42: Reliability Statistics of Tokenism (TOK) Scale
Cronbach's Alpha N of Items
0.820 08
Confirmatory Model of Tokenism (TOK) Scale
After the deletion of 2-items from Tokenism (TOK) scale, the scale now
consists of only two dimensions viz Visibility (2-items) and Polarization (6-items).
Confirmatory factor analysis was applied to the emerged factors of tokenism (TOK)
as it enhances the scales psychometric properties. The Tokenism scale was measured
with 8-items as shown in the figure below:
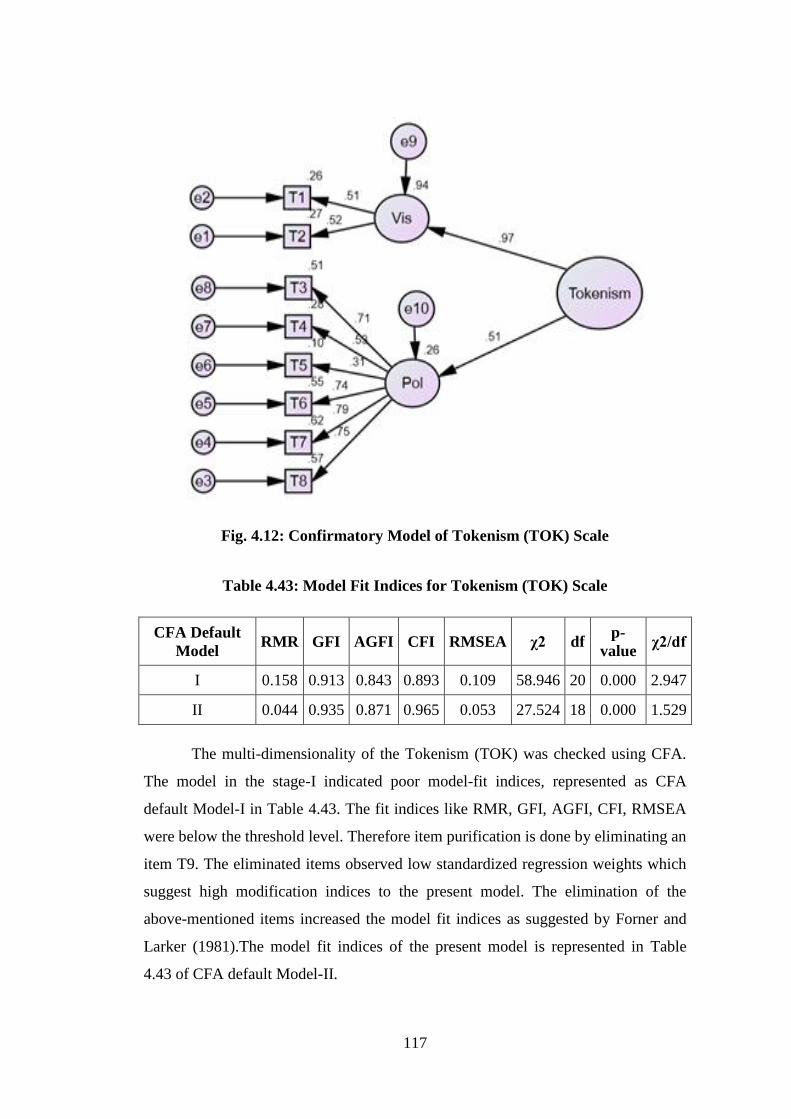
117
Fig. 4.12: Confirmatory Model of Tokenism (TOK) Scale
Table 4.43: Model Fit Indices for Tokenism (TOK) Scale
CFA Default
Model RMR GFI AGFI CFI RMSEA χ2 df
p-
value χ2/df
I 0.158 0.913 0.843 0.893 0.109 58.946 20 0.000 2.947
II 0.044 0.935 0.871 0.965 0.053 27.524 18 0.000 1.529
The multi-dimensionality of the Tokenism (TOK) was checked using CFA.
The model in the stage-I indicated poor model-fit indices, represented as CFA
default Model-I in Table 4.43. The fit indices like RMR, GFI, AGFI, CFI, RMSEA
were below the threshold level. Therefore item purification is done by eliminating an
item T9. The eliminated items observed low standardized regression weights which
suggest high modification indices to the present model. The elimination of the
above-mentioned items increased the model fit indices as suggested by Forner and
Larker (1981).The model fit indices of the present model is represented in Table
4.43 of CFA default Model-II.
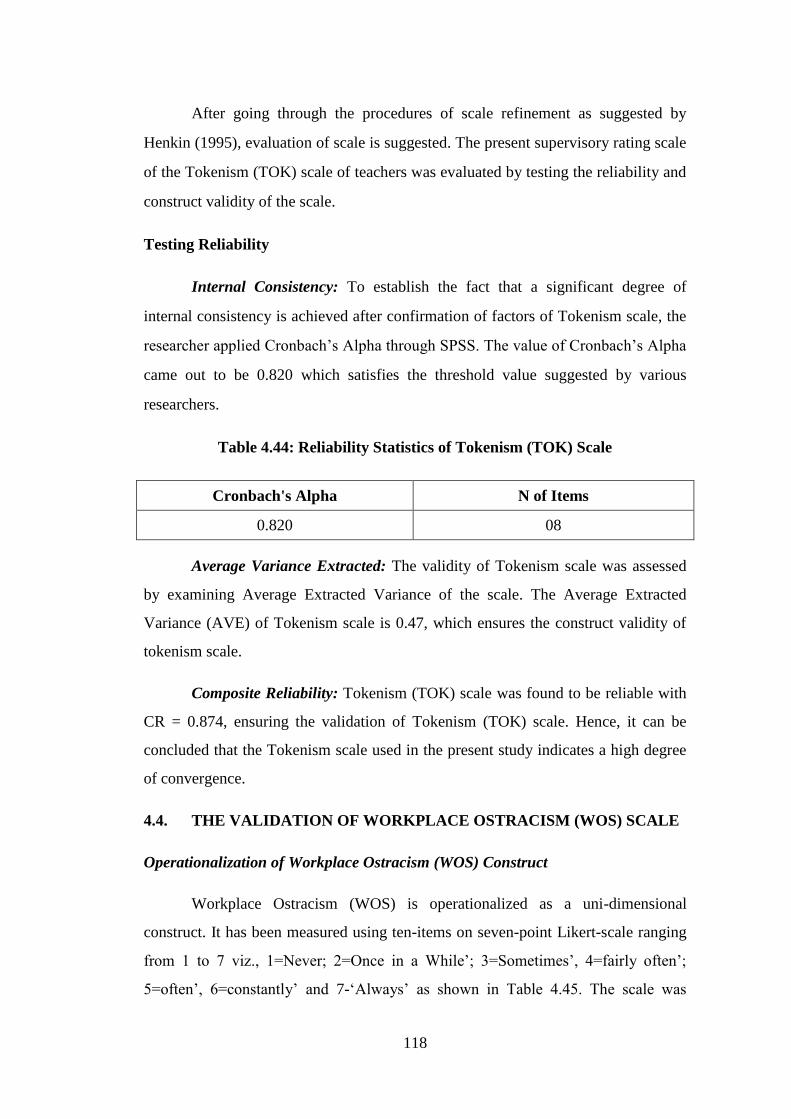
118
After going through the procedures of scale refinement as suggested by
Henkin (1995), evaluation of scale is suggested. The present supervisory rating scale
of the Tokenism (TOK) scale of teachers was evaluated by testing the reliability and
construct validity of the scale.
Testing Reliability
Internal Consistency: To establish the fact that a significant degree of
internal consistency is achieved after confirmation of factors of Tokenism scale, the
researcher applied Cronbach’s Alpha through SPSS. The value of Cronbach’s Alpha
came out to be 0.820 which satisfies the threshold value suggested by various
researchers.
Table 4.44: Reliability Statistics of Tokenism (TOK) Scale
Cronbach's Alpha N of Items
0.820 08
Average Variance Extracted: The validity of Tokenism scale was assessed
by examining Average Extracted Variance of the scale. The Average Extracted
Variance (AVE) of Tokenism scale is 0.47, which ensures the construct validity of
tokenism scale.
Composite Reliability: Tokenism (TOK) scale was found to be reliable with
CR = 0.874, ensuring the validation of Tokenism (TOK) scale. Hence, it can be
concluded that the Tokenism scale used in the present study indicates a high degree
of convergence.
4.4. THE VALIDATION OF WORKPLACE OSTRACISM (WOS) SCALE
Operationalization of Workplace Ostracism (WOS) Construct
Workplace Ostracism (WOS) is operationalized as a uni-dimensional
construct. It has been measured using ten-items on seven-point Likert-scale ranging
from 1 to 7 viz., 1=Never; 2=Once in a While’; 3=Sometimes’, 4=fairly often’;
5=often’, 6=constantly’ and 7-‘Always’ as shown in Table 4.45. The scale was
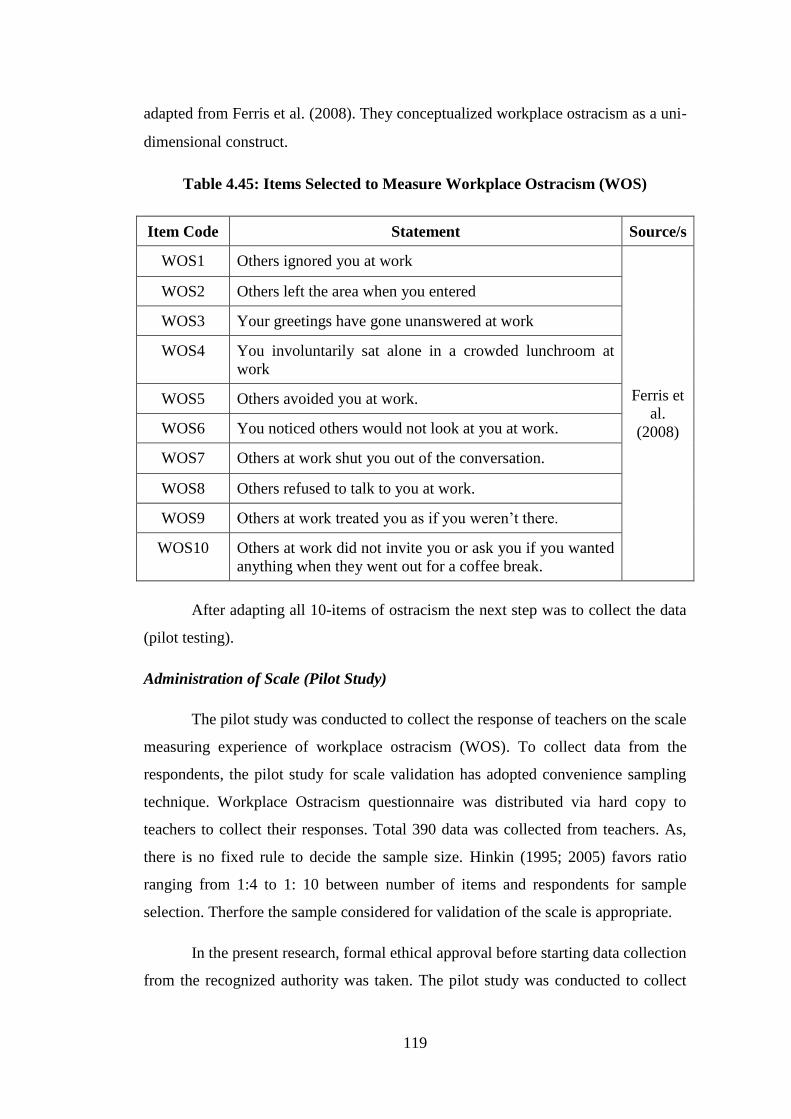
119
adapted from Ferris et al. (2008). They conceptualized workplace ostracism as a uni-
dimensional construct.
Table 4.45: Items Selected to Measure Workplace Ostracism (WOS)
Item Code Statement Source/s
WOS1 Others ignored you at work
Ferris et
al.
(2008)
WOS2 Others left the area when you entered
WOS3 Your greetings have gone unanswered at work
WOS4 You involuntarily sat alone in a crowded lunchroom at
work
WOS5 Others avoided you at work.
WOS6 You noticed others would not look at you at work.
WOS7 Others at work shut you out of the conversation.
WOS8 Others refused to talk to you at work.
WOS9 Others at work treated you as if you weren’t there.
WOS10 Others at work did not invite you or ask you if you wanted
anything when they went out for a coffee break.
After adapting all 10-items of ostracism the next step was to collect the data
(pilot testing).
Administration of Scale (Pilot Study)
The pilot study was conducted to collect the response of teachers on the scale
measuring experience of workplace ostracism (WOS). To collect data from the
respondents, the pilot study for scale validation has adopted convenience sampling
technique. Workplace Ostracism questionnaire was distributed via hard copy to
teachers to collect their responses. Total 390 data was collected from teachers. As,
there is no fixed rule to decide the sample size. Hinkin (1995; 2005) favors ratio
ranging from 1:4 to 1: 10 between number of items and respondents for sample
selection. Therfore the sample considered for validation of the scale is appropriate.
In the present research, formal ethical approval before starting data collection
from the recognized authority was taken. The pilot study was conducted to collect
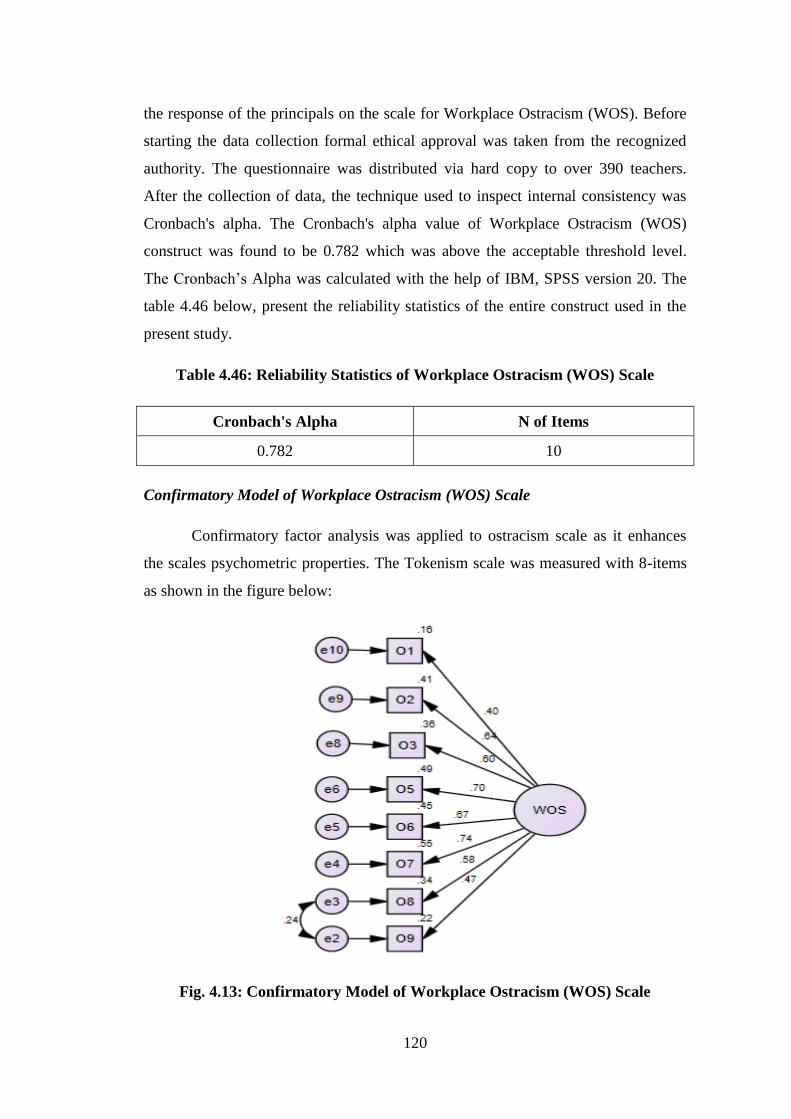
120
the response of the principals on the scale for Workplace Ostracism (WOS). Before
starting the data collection formal ethical approval was taken from the recognized
authority. The questionnaire was distributed via hard copy to over 390 teachers.
After the collection of data, the technique used to inspect internal consistency was
Cronbach's alpha. The Cronbach's alpha value of Workplace Ostracism (WOS)
construct was found to be 0.782 which was above the acceptable threshold level.
The Cronbach’s Alpha was calculated with the help of IBM, SPSS version 20. The
table 4.46 below, present the reliability statistics of the entire construct used in the
present study.
Table 4.46: Reliability Statistics of Workplace Ostracism (WOS) Scale
Cronbach's Alpha N of Items
0.782 10
Confirmatory Model of Workplace Ostracism (WOS) Scale
Confirmatory factor analysis was applied to ostracism scale as it enhances
the scales psychometric properties. The Tokenism scale was measured with 8-items
as shown in the figure below:
Fig. 4.13: Confirmatory Model of Workplace Ostracism (WOS) Scale
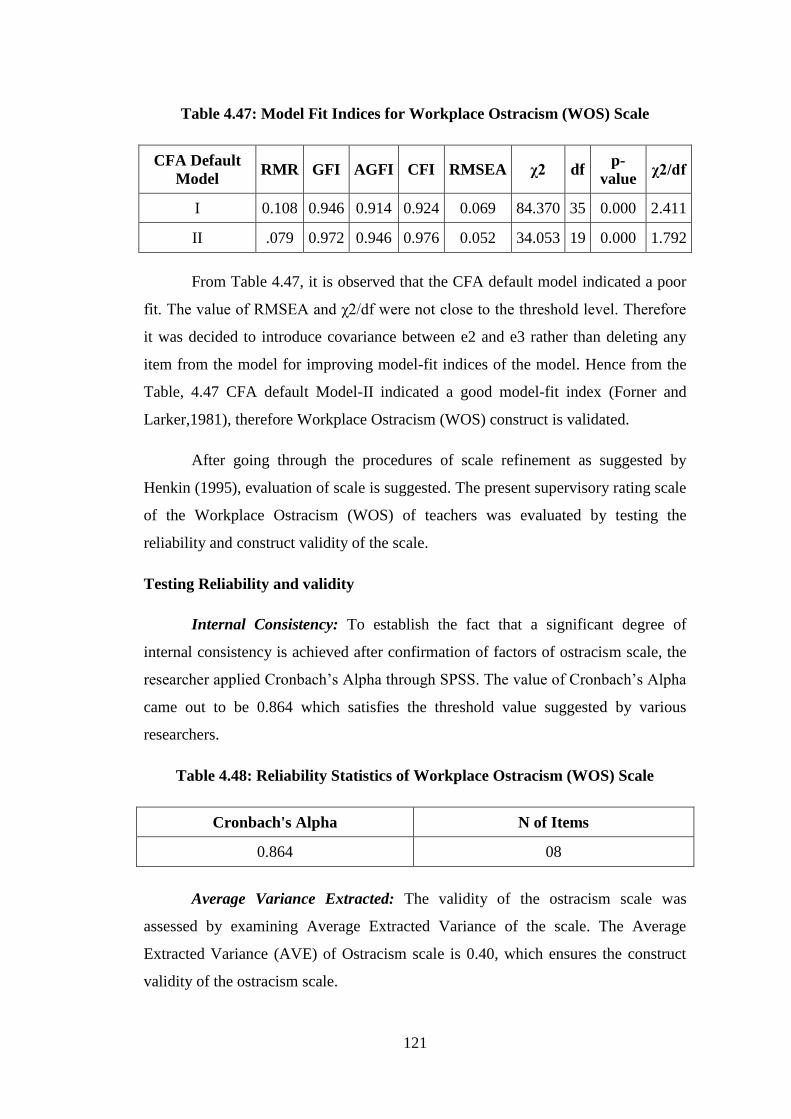
121
Table 4.47: Model Fit Indices for Workplace Ostracism (WOS) Scale
CFA Default
Model RMR GFI AGFI CFI RMSEA χ2 df
p-
value χ2/df
I 0.108 0.946 0.914 0.924 0.069 84.370 35 0.000 2.411
II .079 0.972 0.946 0.976 0.052 34.053 19 0.000 1.792
From Table 4.47, it is observed that the CFA default model indicated a poor
fit. The value of RMSEA and χ2/df were not close to the threshold level. Therefore
it was decided to introduce covariance between e2 and e3 rather than deleting any
item from the model for improving model-fit indices of the model. Hence from the
Table, 4.47 CFA default Model-II indicated a good model-fit index (Forner and
Larker,1981), therefore Workplace Ostracism (WOS) construct is validated.
After going through the procedures of scale refinement as suggested by
Henkin (1995), evaluation of scale is suggested. The present supervisory rating scale
of the Workplace Ostracism (WOS) of teachers was evaluated by testing the
reliability and construct validity of the scale.
Testing Reliability and validity
Internal Consistency: To establish the fact that a significant degree of
internal consistency is achieved after confirmation of factors of ostracism scale, the
researcher applied Cronbach’s Alpha through SPSS. The value of Cronbach’s Alpha
came out to be 0.864 which satisfies the threshold value suggested by various
researchers.
Table 4.48: Reliability Statistics of Workplace Ostracism (WOS) Scale
Cronbach's Alpha N of Items
0.864 08
Average Variance Extracted: The validity of the ostracism scale was
assessed by examining Average Extracted Variance of the scale. The Average
Extracted Variance (AVE) of Ostracism scale is 0.40, which ensures the construct
validity of the ostracism scale.
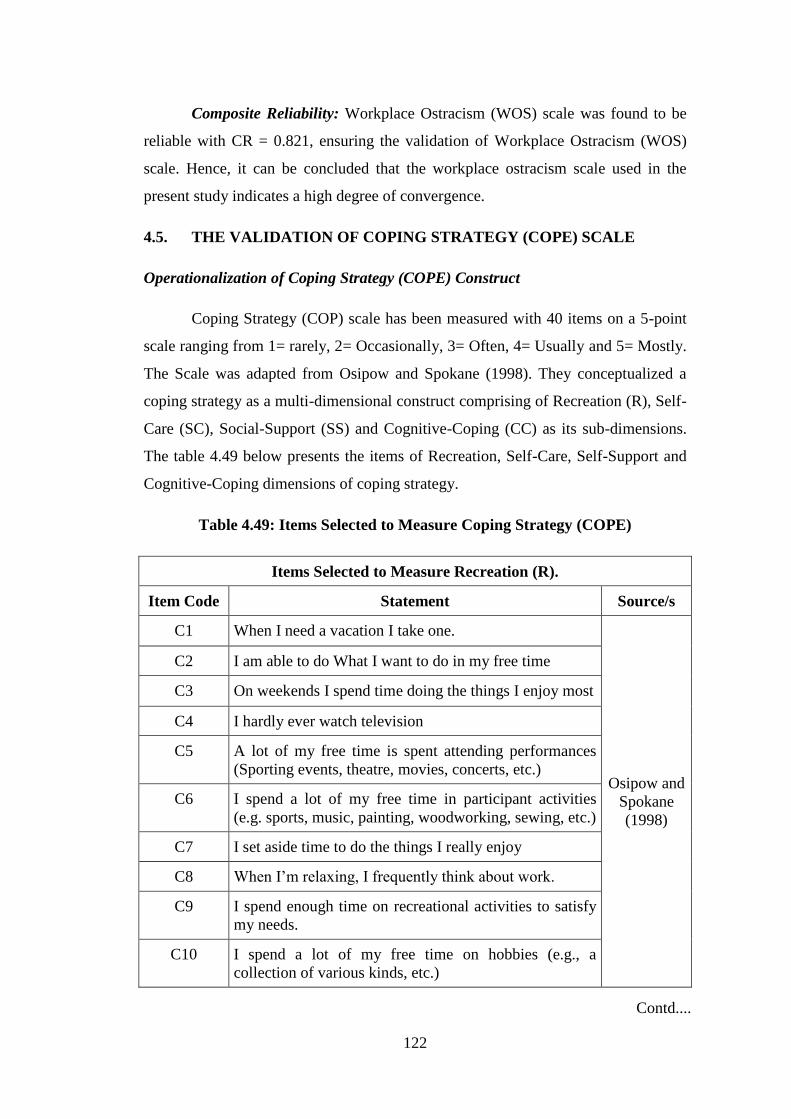
122
Composite Reliability: Workplace Ostracism (WOS) scale was found to be
reliable with CR = 0.821, ensuring the validation of Workplace Ostracism (WOS)
scale. Hence, it can be concluded that the workplace ostracism scale used in the
present study indicates a high degree of convergence.
4.5. THE VALIDATION OF COPING STRATEGY (COPE) SCALE
Operationalization of Coping Strategy (COPE) Construct
Coping Strategy (COP) scale has been measured with 40 items on a 5-point
scale ranging from 1= rarely, 2= Occasionally, 3= Often, 4= Usually and 5= Mostly.
The Scale was adapted from Osipow and Spokane (1998). They conceptualized a
coping strategy as a multi-dimensional construct comprising of Recreation (R), Self-
Care (SC), Social-Support (SS) and Cognitive-Coping (CC) as its sub-dimensions.
The table 4.49 below presents the items of Recreation, Self-Care, Self-Support and
Cognitive-Coping dimensions of coping strategy.
Table 4.49: Items Selected to Measure Coping Strategy (COPE)
Items Selected to Measure Recreation (R).
Item Code Statement Source/s
C1 When I need a vacation I take one.
Osipow and
Spokane
(1998)
C2 I am able to do What I want to do in my free time
C3 On weekends I spend time doing the things I enjoy most
C4 I hardly ever watch television
C5 A lot of my free time is spent attending performances
(Sporting events, theatre, movies, concerts, etc.)
C6 I spend a lot of my free time in participant activities
(e.g. sports, music, painting, woodworking, sewing, etc.)
C7 I set aside time to do the things I really enjoy
C8 When I’m relaxing, I frequently think about work.
C9 I spend enough time on recreational activities to satisfy
my needs.
C10 I spend a lot of my free time on hobbies (e.g., a
collection of various kinds, etc.)
Contd....

123
Items Selected to Measure Self-Care (SC)
Item Code Statement Source/s
C11 I am careful about my diet.
Osipow and
Spokane
(1998)
C12 I am careful about my diet.
C13 I avoid excessive use of alcohol.
C14 I exercise regularly.
C15 I practice “relaxation” techniques.
C16 I get the sleep I need.
C17 I avoid eating or drinking things I know are unhealthy.
C18 I engage in meditation.
C19 I practice deep breathing exercises a few minutes
several times each day.
C20 I floss my teeth regularly.
Items Selected to Measure Social-Support (SS)
Item Code Statement Source/s
C21 There is at least one person important to me who
values me.
Osipow and
Spokane
(1998)
C22 I have help with tasks around the house.
C23 I have help with the important things that have to be
done.
C24 There is at least one sympathetic person with whom I
can discuss my concerns.
C25 There is at least one sympathetic person with whom I
can discuss my work problems.
C26 I feel I have at least one good friend I can count on.
C27 I feel loved.
C28 There is a person with whom I feel really close.
C29 I have a circle of friends who value me.
C30 If I need help at work, I know who to approach.
Contd....

124
Items Selected to Measure Cognitive Coping (CC)
Item Code Statement Source/s
C31 I am able to put my job out of my mind when I go
home.
Osipow and
Spokane
(1998)
C32 I feel that there are other jobs I could do besides my
current one.
C33 I periodically reexamine or recognize my work style
and schedule.
C34 I can establish priorities for the use of my time.
C35 Once they are set I am able to stick to my priorities.
C36 I have techniques to help avoid being distracted.
C37 I can identify important elements of problems I
encounter.
C38 When faced with the need to make a decision I try to
think through the consequences of choices I might
make.
C39 When faced with the need to make a decision I try to
think through the consequences of choices I might
make.
C40 I try to keep aware of the important ways I behave and
the things I do.
Administration of Scale (Pilot Study)
The pilot study was conducted to collect the response of the teachers on
Coping Strategy (COPE) scale. To collect data from the respondents, the pilot study
for scale validation has adopted convenience sampling technique. Coping Strategy
questionnaire was distributed via hard copy to teachers to collect their responses.
Total 390 data was collected from teachers. As, there is no fixed rule to decide the
sample size. Hinkin (1995; 2005) favors ratio ranging from 1:4 to 1: 10 between
number of items and respondents for sample selection. Therfore the sample
considered for validation of the scale is appropriate.
Before starting the data collection formal ethical approval was taken from the
recognized authority. The questionnaire was distributed via hard copy to over 390
teachers. After the collection of data, the technique used to inspect internal
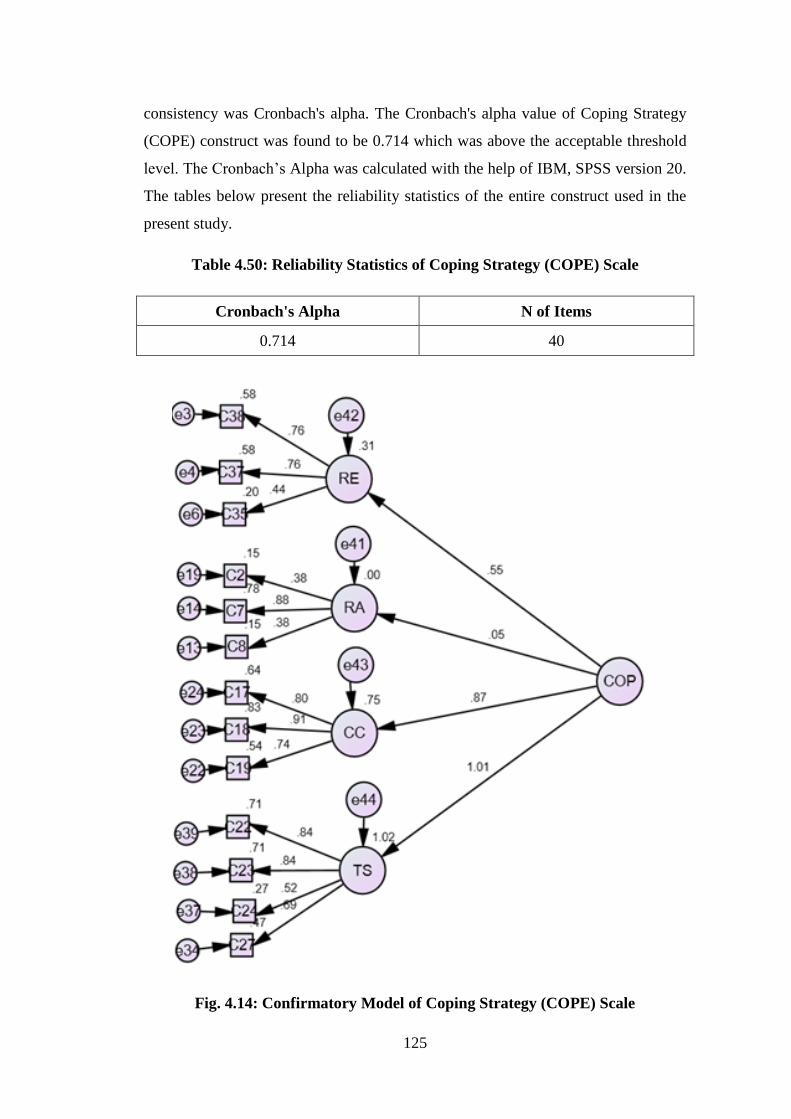
125
consistency was Cronbach's alpha. The Cronbach's alpha value of Coping Strategy
(COPE) construct was found to be 0.714 which was above the acceptable threshold
level. The Cronbach’s Alpha was calculated with the help of IBM, SPSS version 20.
The tables below present the reliability statistics of the entire construct used in the
present study.
Table 4.50: Reliability Statistics of Coping Strategy (COPE) Scale
Cronbach's Alpha N of Items
0.714 40
Fig. 4.14: Confirmatory Model of Coping Strategy (COPE) Scale
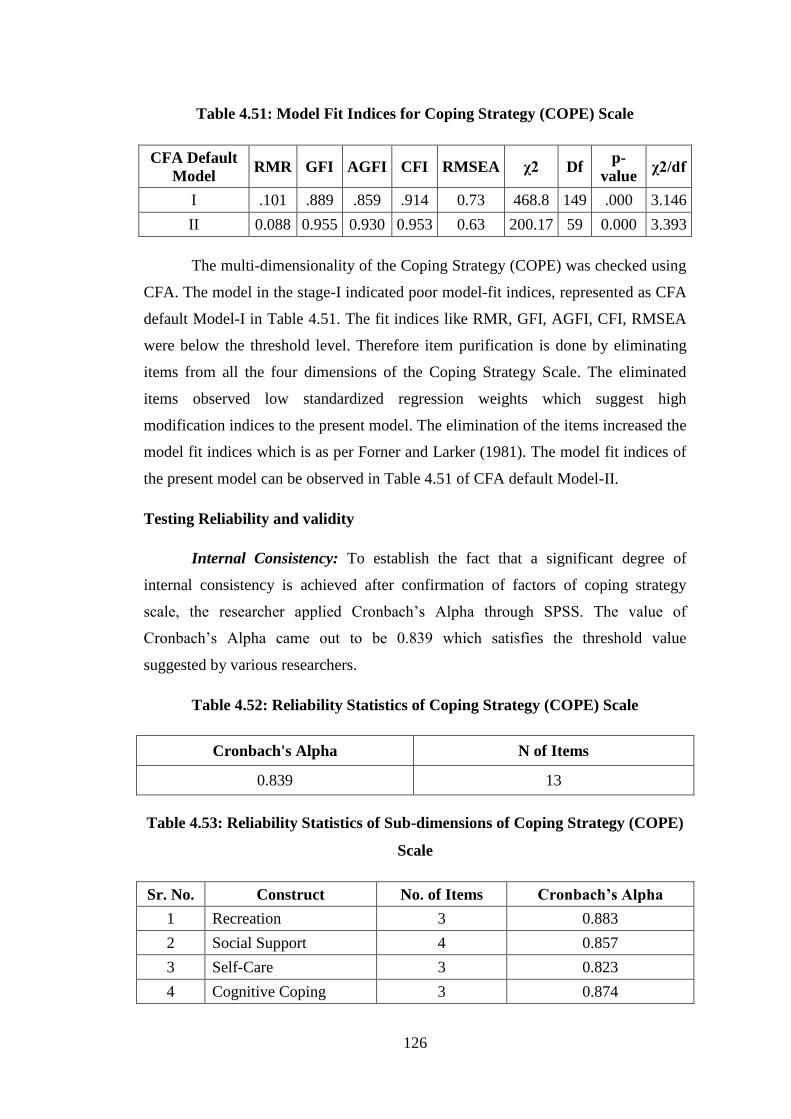
126
Table 4.51: Model Fit Indices for Coping Strategy (COPE) Scale
CFA Default
Model RMR GFI AGFI CFI RMSEA χ2 Df
p-
value χ2/df
I .101 .889 .859 .914 0.73 468.8 149 .000 3.146
II 0.088 0.955 0.930 0.953 0.63 200.17 59 0.000 3.393
The multi-dimensionality of the Coping Strategy (COPE) was checked using
CFA. The model in the stage-I indicated poor model-fit indices, represented as CFA
default Model-I in Table 4.51. The fit indices like RMR, GFI, AGFI, CFI, RMSEA
were below the threshold level. Therefore item purification is done by eliminating
items from all the four dimensions of the Coping Strategy Scale. The eliminated
items observed low standardized regression weights which suggest high
modification indices to the present model. The elimination of the items increased the
model fit indices which is as per Forner and Larker (1981). The model fit indices of
the present model can be observed in Table 4.51 of CFA default Model-II.
Testing Reliability and validity
Internal Consistency: To establish the fact that a significant degree of
internal consistency is achieved after confirmation of factors of coping strategy
scale, the researcher applied Cronbach’s Alpha through SPSS. The value of
Cronbach’s Alpha came out to be 0.839 which satisfies the threshold value
suggested by various researchers.
Table 4.52: Reliability Statistics of Coping Strategy (COPE) Scale
Cronbach's Alpha N of Items
0.839 13
Table 4.53: Reliability Statistics of Sub-dimensions of Coping Strategy (COPE)
Scale
Sr. No. Construct No. of Items Cronbach’s Alpha
1 Recreation 3 0.883
2 Social Support 4 0.857
3 Self-Care 3 0.823
4 Cognitive Coping 3 0.874

127
Average Variance Extracted: The validity of the coping Strategy was
assessed by examining Average Extracted Variance of the scale was also examined.
The Average Extracted Variance (AVE) of coping strategy scale is 0.50 which
ensures the construct validity of the coping strategy scale.
Composite reliability: Coping Strategy (COPE) scale was found to be
reliable with CR = 0.926, ensuring the validation of Coping strategy (COPE) scale.
Hence, it can be concluded that the Coping Strategy scale used in the present study
indicates a high degree of convergence.
4.6. THE VALIDATION OF HEDONIC WELLBEING (HWB) SCALE
Operationalization of Hedonic Wellbeing (HWB) Construct
Hedonic Wellbeing is operationalized as a uni-dimensional construct. It has
been measured using four items on 7-point Likert-scale ranging from 1 to 7 viz 1-
Not at All to 7-A great deal. The scale was adopted from Lyubomirsky and Lepper
(1999). Hedonic wellbeing has been operationalized as a uni-dimensional construct
by Lyubomirsky and Leeper.
Table 4.54: Items Selected to Measure Hedonic Wellbeing (HWB) Scale
Item Code Statement Source/s
H1 In general, I consider myself.
Lyubomirsky
and Lepper
(1999)
H2 Compared with most of my peers, I consider myself.
H3 Some people are generally very happy. They enjoy life
regardless of what is going on, getting the most out of
everything. To what extent does this characterization
describes you.
H4 Some people are generally not very happy. Although
they are not depressed, they never seem as happy as
they might be. To what extent does this
characterization describes you?
Administration of Scale (Pilot Study)
The pilot study was conducted to collect the response of the teachers on
Hedonic Wellbeing (HWB) scale. To collect data from the respondents, the pilot

128
study for scale validation has adopted convenience sampling technique. Hedonic
Wellbeing questionnaire was distributed via hard copy to teachers to collect their
responses. Total 390 data was collected from teachers. As, there is no fixed rule to
decide the sample size. Hinkin (1995; 2005) favors ratio ranging from 1:4 to 1: 10
between number of items and respondents for sample selection. Therfore the sample
considered for validation of the scale is appropriate.
Before starting the data collection formal ethical approval was taken from the
recognized authority. The questionnaire was distributed via hard copy to over 390
teachers. After the collection of data, the technique used to inspect internal
consistency was Cronbach's alpha. The Cronbach's alpha value of Hedonic
Wellbeing (HWB) construct was found to be 0.782 which was above the acceptable
threshold level. The Cronbach’s Alpha was calculated with the help of IBM, SPSS
version 20. The tables 4.55 presented below the reliability statistics of the entire
construct used in the present study.
Table 4.55: Reliability Statistics of Hedonic Wellbeing (HWB) Scale
Cronbach's Alpha N of Items
0.782 04
Confirmatory Factor Analysis of Hedonic Wellbeing (HWB) Scale
Hedonic wellbeing is a uni-dimensional construct. The scale of
hedonic wellbeing was adapted from Lyubomirsky et al. (2005). Hedonic wellbeing
(HWB) was measured with four items as shown in the Figure 4.15 presented below
Fig. 4.15: Confirmatory Model of Hedonic Wellbeing (HWB) Scale
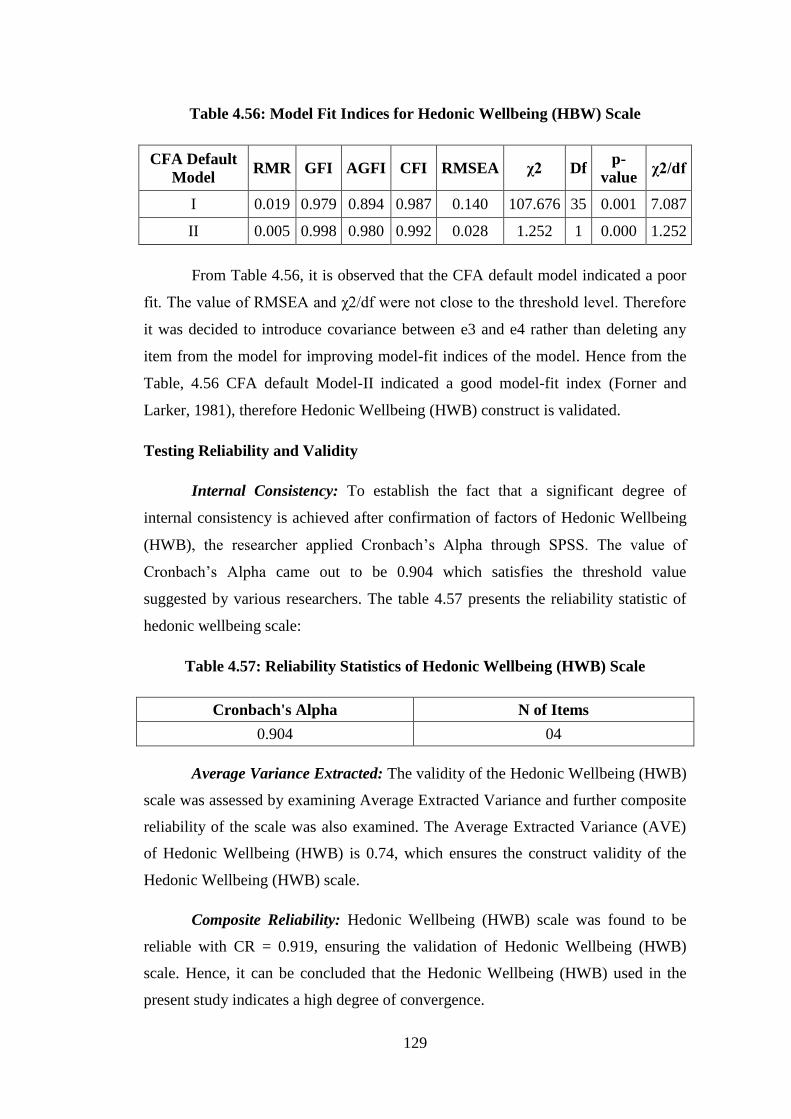
129
Table 4.56: Model Fit Indices for Hedonic Wellbeing (HBW) Scale
CFA Default
Model RMR GFI AGFI CFI RMSEA χ2 Df
p-
value χ2/df
I 0.019 0.979 0.894 0.987 0.140 107.676 35 0.001 7.087
II 0.005 0.998 0.980 0.992 0.028 1.252 1 0.000 1.252
From Table 4.56, it is observed that the CFA default model indicated a poor
fit. The value of RMSEA and χ2/df were not close to the threshold level. Therefore
it was decided to introduce covariance between e3 and e4 rather than deleting any
item from the model for improving model-fit indices of the model. Hence from the
Table, 4.56 CFA default Model-II indicated a good model-fit index (Forner and
Larker, 1981), therefore Hedonic Wellbeing (HWB) construct is validated.
Testing Reliability and Validity
Internal Consistency: To establish the fact that a significant degree of
internal consistency is achieved after confirmation of factors of Hedonic Wellbeing
(HWB), the researcher applied Cronbach’s Alpha through SPSS. The value of
Cronbach’s Alpha came out to be 0.904 which satisfies the threshold value
suggested by various researchers. The table 4.57 presents the reliability statistic of
hedonic wellbeing scale:
Table 4.57: Reliability Statistics of Hedonic Wellbeing (HWB) Scale
Cronbach's Alpha N of Items
0.904 04
Average Variance Extracted: The validity of the Hedonic Wellbeing (HWB)
scale was assessed by examining Average Extracted Variance and further composite
reliability of the scale was also examined. The Average Extracted Variance (AVE)
of Hedonic Wellbeing (HWB) is 0.74, which ensures the construct validity of the
Hedonic Wellbeing (HWB) scale.
Composite Reliability: Hedonic Wellbeing (HWB) scale was found to be
reliable with CR = 0.919, ensuring the validation of Hedonic Wellbeing (HWB)
scale. Hence, it can be concluded that the Hedonic Wellbeing (HWB) used in the
present study indicates a high degree of convergence.

130
CHAPTER – V
DATA ANALYSIS
5.1 DESCRIPTIVE STATISTICS
Descriptive statistics enable the researcher to understand the basic features of
the data which further helps to analyze, summarize and to interpret data in a
significant manner. The present study implied univariate as well as multivariate
analysis techniques. In the present chapter descriptive statistics tables provides
summaries about the responses of the sample on the constructs used in the study.
The descriptive tables include mean, standard deviation Skewness and kurtosis are
provided for all the six constructs i.e stereotype threat, job performance, hedonic
wellbeing, coping strategy, workplace ostracism and tokenism used in the study. The
below tables provide construct wise description.
Table 5.1: Descriptive Statistics for Construct “Stereotype Threat” (ST)
Construct Item Code Number Mean Std. Deviation Skewness Kurtosis
Ste
reoty
pe
Th
rea
t (S
.T)
Oi1 446 1.51 0.85 1.85 1.83
Oi2 446 2.11 0.79 0.35 0.20
Oi3 446 1.8 0.96 0.66 0.78
Gi4 446 2.79 1.14 0.20 0.56
Gi5 446 3.24 0.20 0.26 0.80
Gi6 446 3.19 1.18 0.83 0.95
Gi7 446 3.28 1.25 0.13 1.14
Gs8 446 3.02 1.16 0.12 0.93
Gs9 446 3.08 1.11 0.13 0.61
Ri10 446 3.12 1.20 0.08 0.99
Ri11 446 3.17 1.19 0.10 0.93
Ri12 446 2.99 1.13 0.13 0.91
Rs13 446 2.86 1.14 0.24 0.68
Contd....

131
Construct Item Code Number Mean Std. Deviation Skewness Kurtosis
Ste
reoty
pe
Th
rea
t (S
.T)
Rs14 446 3.08 1.16 0.12 0.81
Ci15 446 2.70 1.08 0.28 0.38
Ci16 446 2.35 1.06 0.60 0.22
Ci17 446 2.61 1.06 0.28 0.63
Cs18 446 2.85 1.12 0.23 0.71
Cs19 446 2.74 1.15 0.08 0.84
Cs20 446 2.93 1.18 0.76 0.99
N21 446 2.78 1.22 0.19 0.89
N22 446 2.72 1.25 0.20 1.02
N23 446 2.40 1.25 0.50 0.75
*All items were measured on five-point Likert type scale
Table 5.2: Descriptive Statistics for Construct “Job Performance” (JP)
Construct Item Code Number Mean Std. Deviation Skewness Kurtosis
Job
Per
form
an
ce(J
.P)
T1 446 2.51 1.20 0.48 0.73
T2 446 2.62 1.14 0.37 0.73
T3 446 2.95 1.24 0.13 1.08
Cp4 446 2.96 1.14 0.13 0.90
Cp5 446 2.47 1.16 0.62 0.33
Cp6 446 2.55 1.17 0.53 0.63
Cw7 446 2.76 1.14 0.19 0.83
Cw8 446 3.34 1.35 0.28 1.21
Cw9 446 3.37 1.23 0.18 0.98
Cw10 446 3.39 1.21 0.21 1.07
Cw11 446 3.49 1.16 0.38 0.77
*All items were measured on five-point Likert type scale
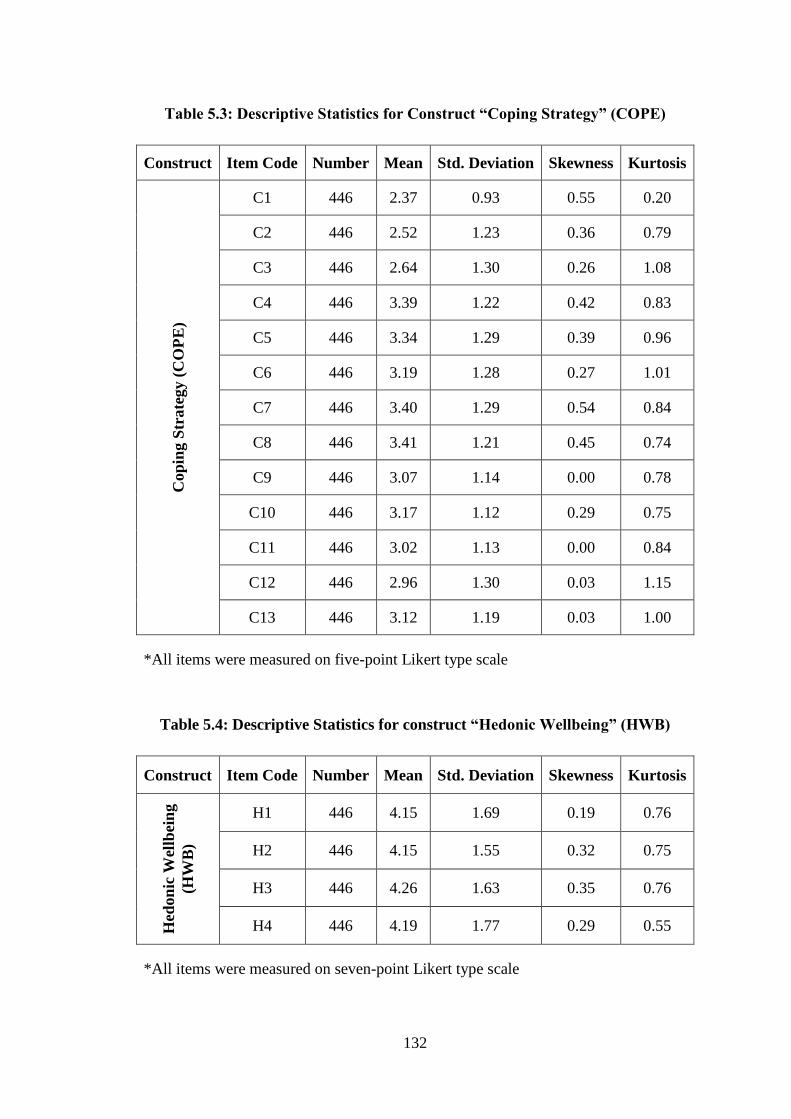
132
Table 5.3: Descriptive Statistics for Construct “Coping Strategy” (COPE)
Construct Item Code Number Mean Std. Deviation Skewness Kurtosis C
op
ing S
trate
gy (
CO
PE
)
C1 446 2.37 0.93 0.55 0.20
C2 446 2.52 1.23 0.36 0.79
C3 446 2.64 1.30 0.26 1.08
C4 446 3.39 1.22 0.42 0.83
C5 446 3.34 1.29 0.39 0.96
C6 446 3.19 1.28 0.27 1.01
C7 446 3.40 1.29 0.54 0.84
C8 446 3.41 1.21 0.45 0.74
C9 446 3.07 1.14 0.00 0.78
C10 446 3.17 1.12 0.29 0.75
C11 446 3.02 1.13 0.00 0.84
C12 446 2.96 1.30 0.03 1.15
C13 446 3.12 1.19 0.03 1.00
*All items were measured on five-point Likert type scale
Table 5.4: Descriptive Statistics for construct “Hedonic Wellbeing” (HWB)
Construct Item Code Number Mean Std. Deviation Skewness Kurtosis
Hed
on
ic W
ellb
ein
g
(HW
B)
H1 446 4.15 1.69 0.19 0.76
H2 446 4.15 1.55 0.32 0.75
H3 446 4.26 1.63 0.35 0.76
H4 446 4.19 1.77 0.29 0.55
*All items were measured on seven-point Likert type scale

133
Table 5.5: Descriptive Statistics for construct “Tokenism” (TOK)
Construct Item Code Number Mean Std. Deviation Skewness Kurtosis T
ok
enis
m (
TO
K)
T1 100 6 0.86 0.05 1.68
T2 100 5.86 0.79 0.25 1.35
T3 100 5.44 0.67 0.24 0.28
T4 100 5.77 0.83 0.45 1.43
T5 100 5.90 0.92 0.20 1.82
T6 100 5.44 0.72 0.32 0.21
T7 100 5.50 0.79 0.59 0.41
T8 100 5.44 0.70 0.29 0.26
* All items were measured on a seven-point Likert type scale
Table 5.6: Descriptive Statistics for construct “Workplace-Ostracism” (WOS)
Construct Item Code Number Mean Std. Deviation Skewness Kurtosis
Work
pla
ce O
stra
cism
(W
OS
)
O1 446 5.12 1.66 0.88 0.14
O2 446 5.11 1.71 0.86 0.08
O3 446 4.27 1.76 0.18 0.97
O4 446 4.57 1.81 0.35 0.97
O5 446 4.60 1.93 0.33 1.05
O6 446 4.10 1.94 0.09 1.20
O7 446 4.03 1.05 0.05 1.34
O8 446 4.35 1.76 0.11 1.08
* All items were measured on a seven-point Likert type scale
The construct Stereotype threat (ST), Job performance (JP) and Coping
Strategy (COPE) were measured on five-point Likert scale whereas other constructs
like Hedonic wellbeing (HWB), Tokenism (TOK) and Workplace Ostracism (WOS)
were measured on seven-point Likert Scale. The descriptive tables describe the

134
characteristics of the data. The first column in the table is of mean which represents
the average response values of the respondents whereas the second column
highlights the degree of variance from the mean. The next two columns are of
skewness and kurtosis.
To check that a distribution of the scores is normal, we considered the values
of skewness and kurtosis (Field, 2009). The independent construct, stereotype threat
skewness ranges from 0 to 1.85 and kurtosis ranges from 0.1 to 1.83. The value of
skewness and kurtosis for job performance ranges from 0.35 to 0.62 and 0.33 to 1.21
respectively. The skewness and kurtosis value for coping strategy ranges from 0 to
0.55 and 0.2 to 1.15 respectively. For construct, hedonic wellbeing skewness values
ranged from 0.19 to 0.35 and kurtosis values ranged from 0.55 to 0.76. The
skewness value of workplace ostracism ranged from 0.05 to 0.88 whereas kurtosis
ranged from 0.08 to 1.20. The skewness value for tokenism ranged from 0.05 to 0.59
and kurtosis ranged from 0.21 to 1.82. George and Mallery (2010) stated that the
value for skewness and kurtosis if ranged between -2 and +2 are considered
acceptable in order to prove the distribution of data normal. Byrne (2010) suggested
a kurtosis value of 3 for a normal, while values which exceed 5 indicates data to be
non-normally distributed (Bentler, 2006). Whereas Hair et al. (2010) and Bryne
(2010) argued that data is considered to be normal if Skewness is between ‐2 to +2
and Kurtosis is between ‐7 to +7. Therefore, the values of skewness and kurtosis in
the descriptive tables for different constructs were within the acceptable limits
indicating that the data was fit for further analysis.
The standard deviation values of Stereotype threat, Job Performance, Coping
Strategy, hedonic wellbeing, tokenism, and workplace ostracism ranged from 0.85 to
1.4, 1.14 to 1.35, 0.93 to 1.3, 1.55 to 1.77, 0.67 to 0.92 and 1.05 to 1.94 respectively.
This specifies that the deviation of the responses from the mean was low.
Multivariate normality of the data was also checked by calculating Mahalanobis-D
which did not indicate any problem with the data.
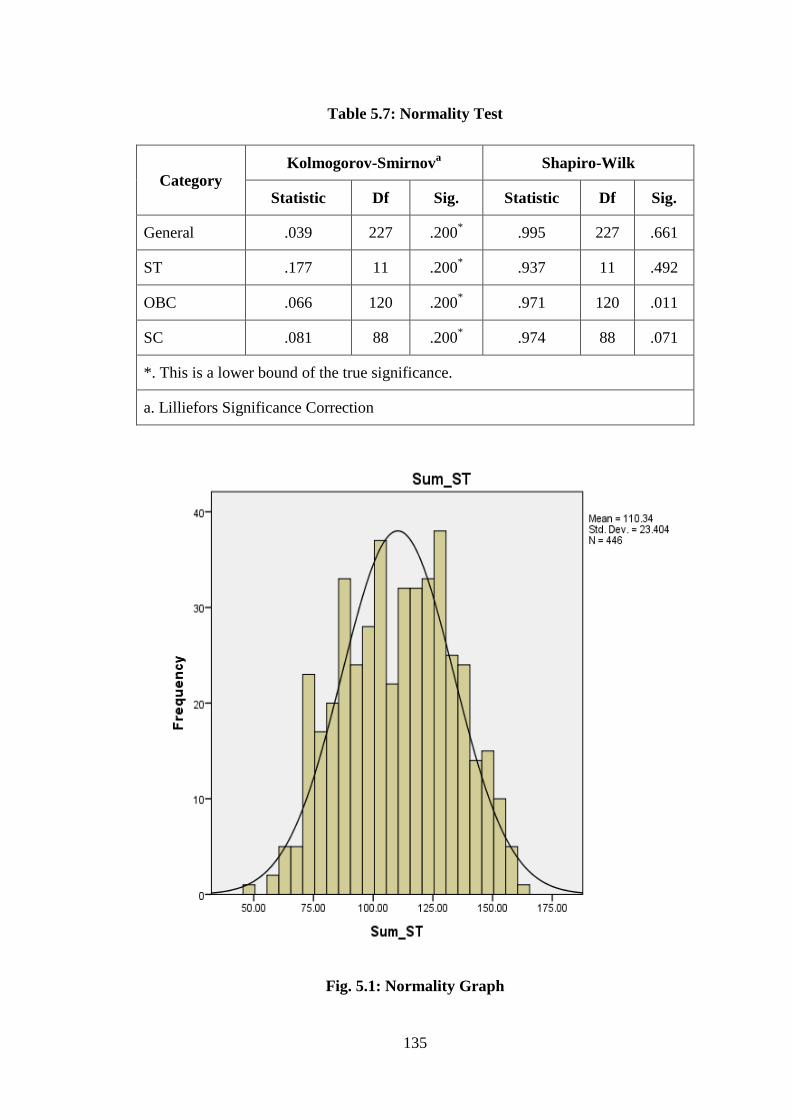
135
Table 5.7: Normality Test
Category Kolmogorov-Smirnov
a Shapiro-Wilk
Statistic Df Sig. Statistic Df Sig.
General .039 227 .200* .995 227 .661
ST .177 11 .200* .937 11 .492
OBC .066 120 .200* .971 120 .011
SC .081 88 .200* .974 88 .071
*. This is a lower bound of the true significance.
a. Lilliefors Significance Correction
Fig. 5.1: Normality Graph
136
5.2. TESTING OF CONCEPTUAL MODEL
The present section deals with the validation of the hypotheses formulated to
achieve the objectives of the study. From the detailed and in-depth literature review,
it has been found that gender (G), religion (R), category (C) and tokenism (TOK)
triggers stereotype threat (ST). Therefore objective was framed as:
5.2.1 Objective-1: To identify the role of caste category, religion, gender, and
tokenism causing stereotype threat.
To achieve the objective following hypotheses were framed and tested.
H01 : There is no significant difference in stereotype threat (ST) with respect to the
gender of teachers.
H02 : There is no significant difference in stereotype threat with respect to the
religion of teachers.
H03 : There is no significant difference in stereotype threat with respect to the
caste category of teachers.
H04 : There is no significant influence of Tokenism on Stereotype threat among
teachers.
The analysis of data was done using t-test (gender &religion) ANOVA
(Caste-Category) and Regression (tokenism). The hypothesis wise analysis is given
here under:
H01: There is no significant difference in stereotype threat (ST) with respect to the
gender of teachers
To find the difference in the experience of stereotype threat on the basis of
gender in the present study the investigator applied t-test and results are discussed
below:
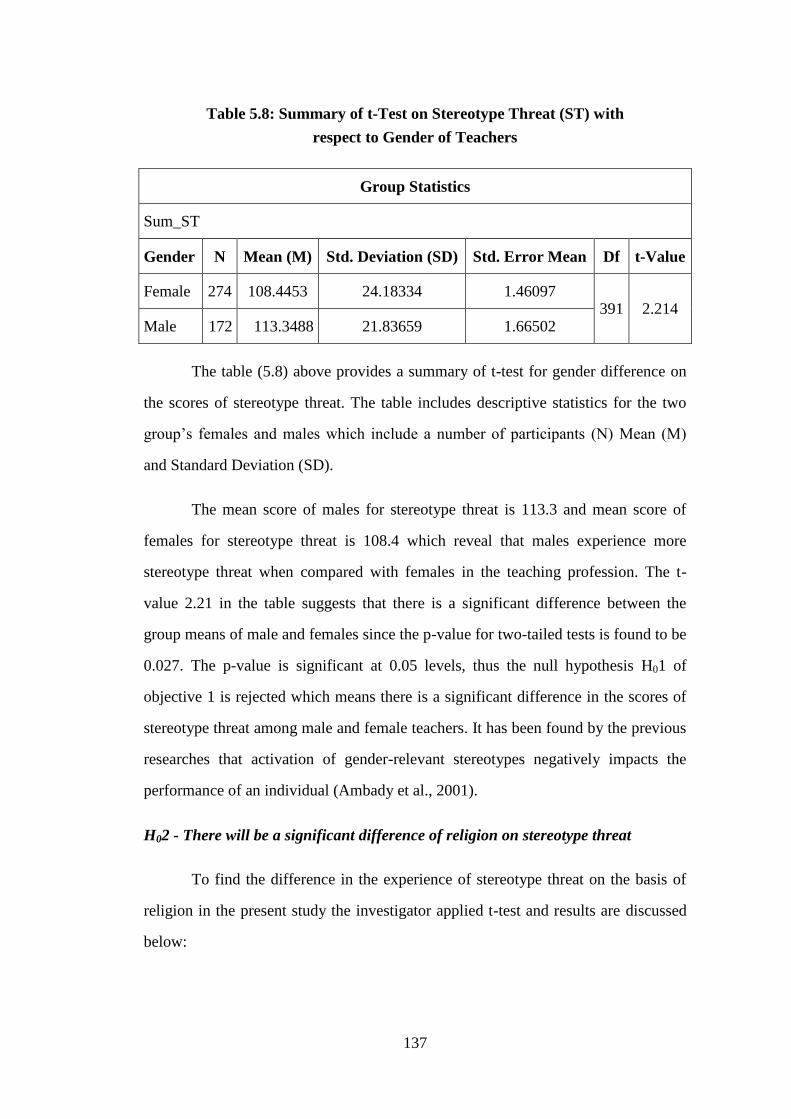
137
Table 5.8: Summary of t-Test on Stereotype Threat (ST) with
respect to Gender of Teachers
Group Statistics
Sum_ST
Gender N Mean (M) Std. Deviation (SD) Std. Error Mean Df t-Value
Female 274 108.4453 24.18334 1.46097 391 2.214
Male 172 113.3488 21.83659 1.66502
The table (5.8) above provides a summary of t-test for gender difference on
the scores of stereotype threat. The table includes descriptive statistics for the two
group’s females and males which include a number of participants (N) Mean (M)
and Standard Deviation (SD).
The mean score of males for stereotype threat is 113.3 and mean score of
females for stereotype threat is 108.4 which reveal that males experience more
stereotype threat when compared with females in the teaching profession. The t-
value 2.21 in the table suggests that there is a significant difference between the
group means of male and females since the p-value for two-tailed tests is found to be
0.027. The p-value is significant at 0.05 levels, thus the null hypothesis H01 of
objective 1 is rejected which means there is a significant difference in the scores of
stereotype threat among male and female teachers. It has been found by the previous
researches that activation of gender-relevant stereotypes negatively impacts the
performance of an individual (Ambady et al., 2001).
H02 - There will be a significant difference of religion on stereotype threat
To find the difference in the experience of stereotype threat on the basis of
religion in the present study the investigator applied t-test and results are discussed
below:
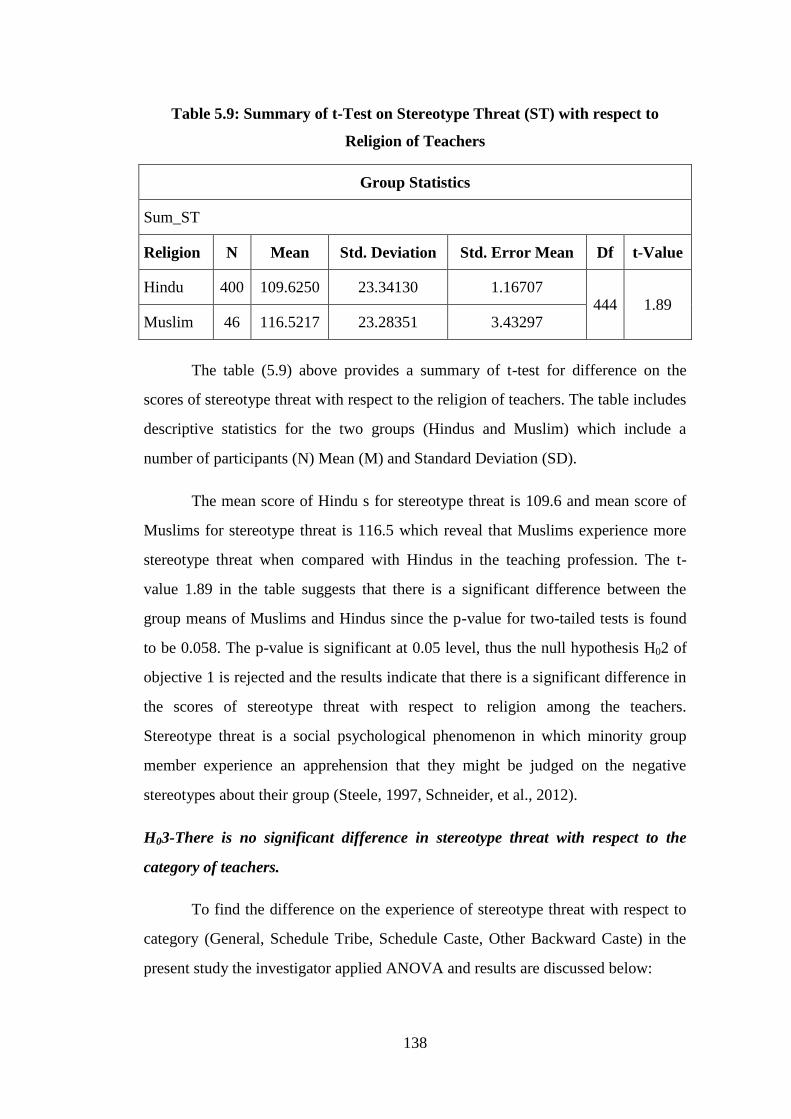
138
Table 5.9: Summary of t-Test on Stereotype Threat (ST) with respect to
Religion of Teachers
Group Statistics
Sum_ST
Religion N Mean Std. Deviation Std. Error Mean Df t-Value
Hindu 400 109.6250 23.34130 1.16707 444 1.89
Muslim 46 116.5217 23.28351 3.43297
The table (5.9) above provides a summary of t-test for difference on the
scores of stereotype threat with respect to the religion of teachers. The table includes
descriptive statistics for the two groups (Hindus and Muslim) which include a
number of participants (N) Mean (M) and Standard Deviation (SD).
The mean score of Hindu s for stereotype threat is 109.6 and mean score of
Muslims for stereotype threat is 116.5 which reveal that Muslims experience more
stereotype threat when compared with Hindus in the teaching profession. The t-
value 1.89 in the table suggests that there is a significant difference between the
group means of Muslims and Hindus since the p-value for two-tailed tests is found
to be 0.058. The p-value is significant at 0.05 level, thus the null hypothesis H02 of
objective 1 is rejected and the results indicate that there is a significant difference in
the scores of stereotype threat with respect to religion among the teachers.
Stereotype threat is a social psychological phenomenon in which minority group
member experience an apprehension that they might be judged on the negative
stereotypes about their group (Steele, 1997, Schneider, et al., 2012).
H03-There is no significant difference in stereotype threat with respect to the
category of teachers.
To find the difference on the experience of stereotype threat with respect to
category (General, Schedule Tribe, Schedule Caste, Other Backward Caste) in the
present study the investigator applied ANOVA and results are discussed below:
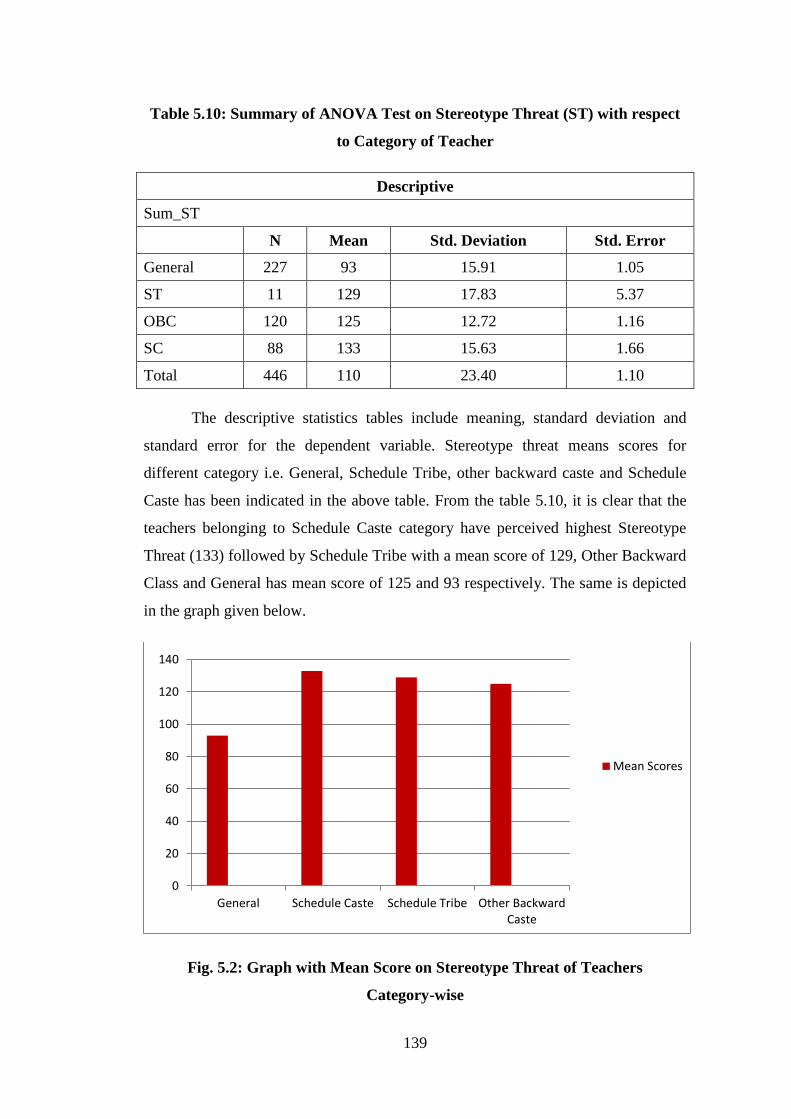
139
Table 5.10: Summary of ANOVA Test on Stereotype Threat (ST) with respect
to Category of Teacher
Descriptive
Sum_ST
N Mean Std. Deviation Std. Error
General 227 93 15.91 1.05
ST 11 129 17.83 5.37
OBC 120 125 12.72 1.16
SC 88 133 15.63 1.66
Total 446 110 23.40 1.10
The descriptive statistics tables include meaning, standard deviation and
standard error for the dependent variable. Stereotype threat means scores for
different category i.e. General, Schedule Tribe, other backward caste and Schedule
Caste has been indicated in the above table. From the table 5.10, it is clear that the
teachers belonging to Schedule Caste category have perceived highest Stereotype
Threat (133) followed by Schedule Tribe with a mean score of 129, Other Backward
Class and General has mean score of 125 and 93 respectively. The same is depicted
in the graph given below.
Fig. 5.2: Graph with Mean Score on Stereotype Threat of Teachers
Category-wise
0
20
40
60
80
100
120
140
General Schedule Caste Schedule Tribe Other BackwardCaste
Mean Scores
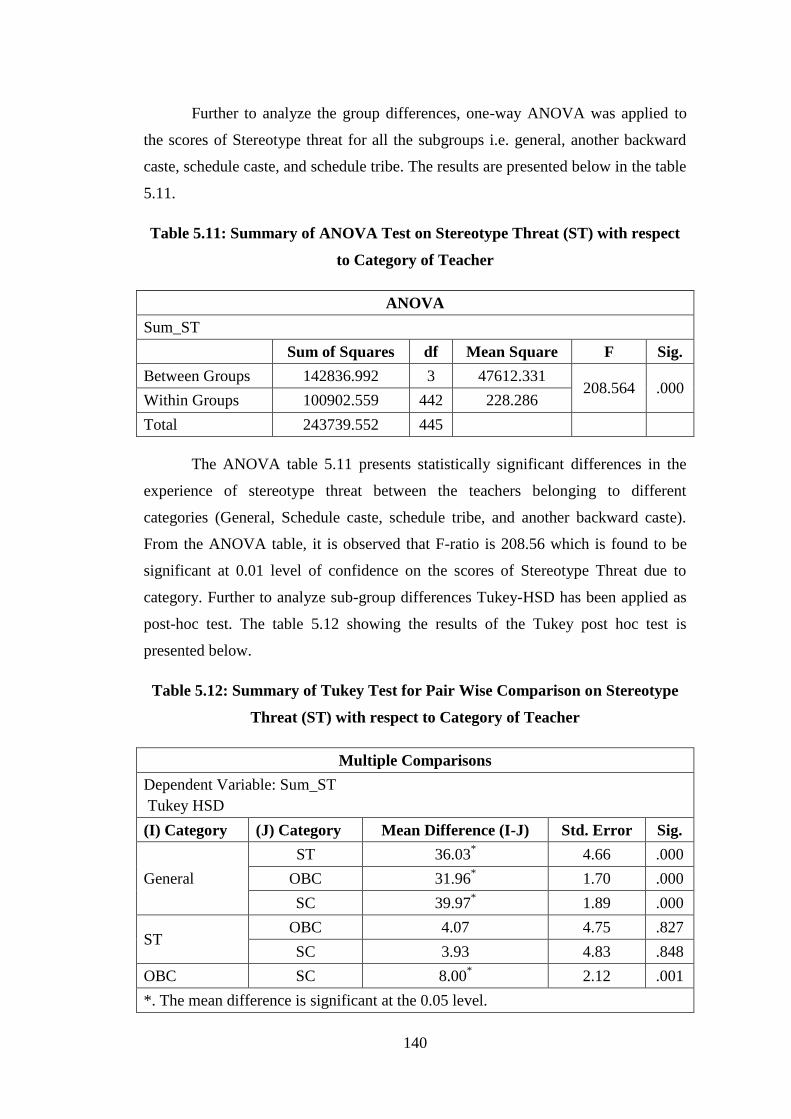
140
Further to analyze the group differences, one-way ANOVA was applied to
the scores of Stereotype threat for all the subgroups i.e. general, another backward
caste, schedule caste, and schedule tribe. The results are presented below in the table
5.11.
Table 5.11: Summary of ANOVA Test on Stereotype Threat (ST) with respect
to Category of Teacher
ANOVA
Sum_ST
Sum of Squares df Mean Square F Sig.
Between Groups 142836.992 3 47612.331 208.564 .000
Within Groups 100902.559 442 228.286
Total 243739.552 445
The ANOVA table 5.11 presents statistically significant differences in the
experience of stereotype threat between the teachers belonging to different
categories (General, Schedule caste, schedule tribe, and another backward caste).
From the ANOVA table, it is observed that F-ratio is 208.56 which is found to be
significant at 0.01 level of confidence on the scores of Stereotype Threat due to
category. Further to analyze sub-group differences Tukey-HSD has been applied as
post-hoc test. The table 5.12 showing the results of the Tukey post hoc test is
presented below.
Table 5.12: Summary of Tukey Test for Pair Wise Comparison on Stereotype
Threat (ST) with respect to Category of Teacher
Multiple Comparisons
Dependent Variable: Sum_ST
Tukey HSD
(I) Category (J) Category Mean Difference (I-J) Std. Error Sig.
General
ST 36.03* 4.66 .000
OBC 31.96* 1.70 .000
SC 39.97* 1.89 .000
ST OBC 4.07 4.75 .827
SC 3.93 4.83 .848
OBC SC 8.00* 2.12 .001
*. The mean difference is significant at the 0.05 level.
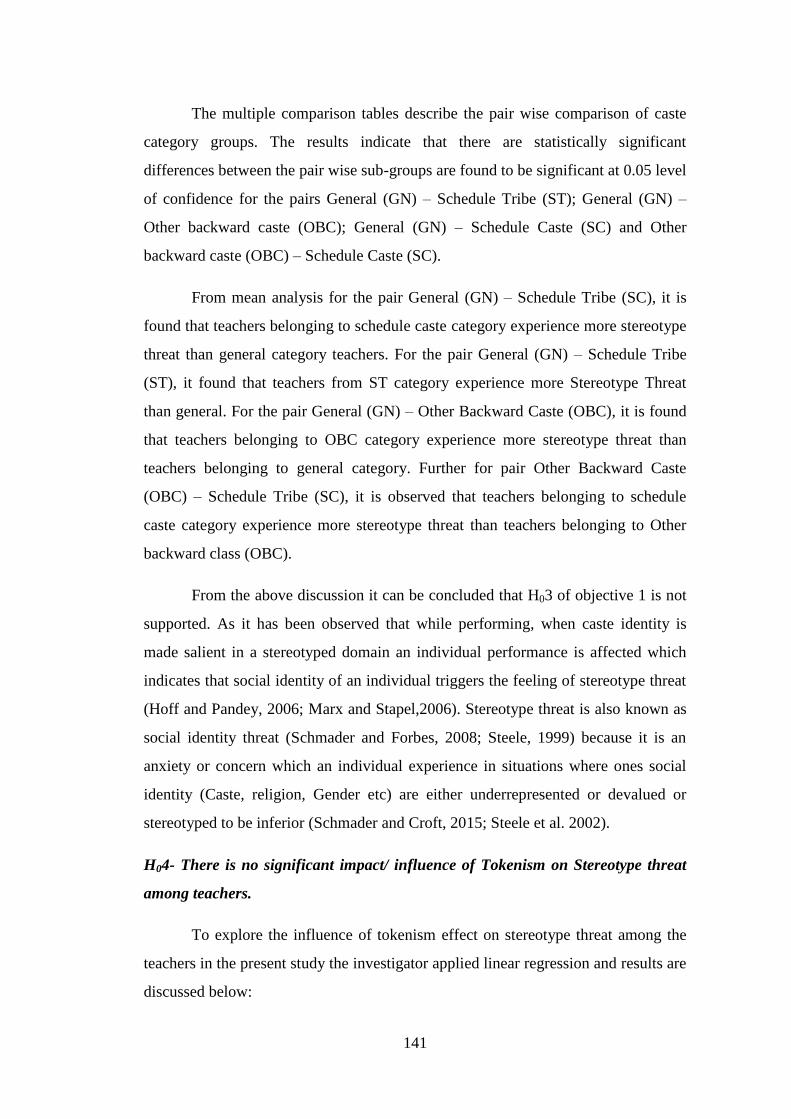
141
The multiple comparison tables describe the pair wise comparison of caste
category groups. The results indicate that there are statistically significant
differences between the pair wise sub-groups are found to be significant at 0.05 level
of confidence for the pairs General (GN) – Schedule Tribe (ST); General (GN) –
Other backward caste (OBC); General (GN) – Schedule Caste (SC) and Other
backward caste (OBC) – Schedule Caste (SC).
From mean analysis for the pair General (GN) – Schedule Tribe (SC), it is
found that teachers belonging to schedule caste category experience more stereotype
threat than general category teachers. For the pair General (GN) – Schedule Tribe
(ST), it found that teachers from ST category experience more Stereotype Threat
than general. For the pair General (GN) – Other Backward Caste (OBC), it is found
that teachers belonging to OBC category experience more stereotype threat than
teachers belonging to general category. Further for pair Other Backward Caste
(OBC) – Schedule Tribe (SC), it is observed that teachers belonging to schedule
caste category experience more stereotype threat than teachers belonging to Other
backward class (OBC).
From the above discussion it can be concluded that H03 of objective 1 is not
supported. As it has been observed that while performing, when caste identity is
made salient in a stereotyped domain an individual performance is affected which
indicates that social identity of an individual triggers the feeling of stereotype threat
(Hoff and Pandey, 2006; Marx and Stapel,2006). Stereotype threat is also known as
social identity threat (Schmader and Forbes, 2008; Steele, 1999) because it is an
anxiety or concern which an individual experience in situations where ones social
identity (Caste, religion, Gender etc) are either underrepresented or devalued or
stereotyped to be inferior (Schmader and Croft, 2015; Steele et al. 2002).
H04- There is no significant impact/ influence of Tokenism on Stereotype threat
among teachers.
To explore the influence of tokenism effect on stereotype threat among the
teachers in the present study the investigator applied linear regression and results are
discussed below:
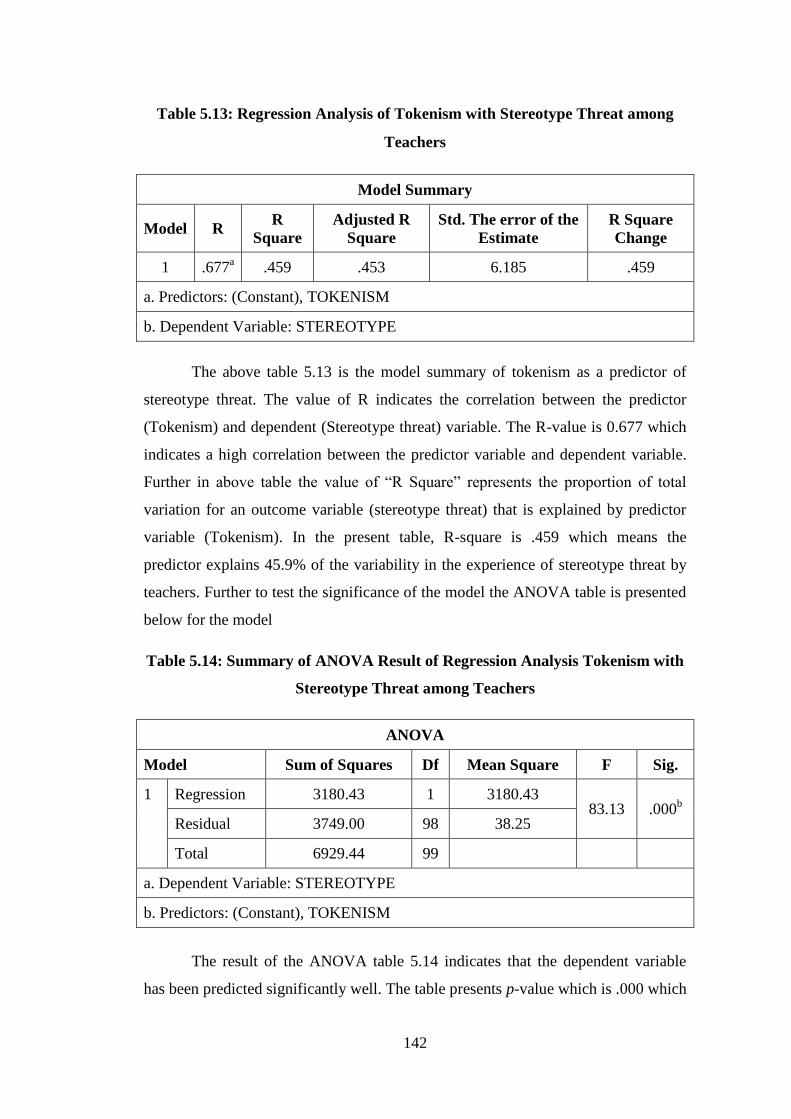
142
Table 5.13: Regression Analysis of Tokenism with Stereotype Threat among
Teachers
Model Summary
Model R R
Square
Adjusted R
Square
Std. The error of the
Estimate
R Square
Change
1 .677a .459 .453 6.185 .459
a. Predictors: (Constant), TOKENISM
b. Dependent Variable: STEREOTYPE
The above table 5.13 is the model summary of tokenism as a predictor of
stereotype threat. The value of R indicates the correlation between the predictor
(Tokenism) and dependent (Stereotype threat) variable. The R-value is 0.677 which
indicates a high correlation between the predictor variable and dependent variable.
Further in above table the value of “R Square” represents the proportion of total
variation for an outcome variable (stereotype threat) that is explained by predictor
variable (Tokenism). In the present table, R-square is .459 which means the
predictor explains 45.9% of the variability in the experience of stereotype threat by
teachers. Further to test the significance of the model the ANOVA table is presented
below for the model
Table 5.14: Summary of ANOVA Result of Regression Analysis Tokenism with
Stereotype Threat among Teachers
ANOVA
Model Sum of Squares Df Mean Square F Sig.
1 Regression 3180.43 1 3180.43 83.13 .000
b
Residual 3749.00 98 38.25
Total 6929.44 99
a. Dependent Variable: STEREOTYPE
b. Predictors: (Constant), TOKENISM
The result of the ANOVA table 5.14 indicates that the dependent variable
has been predicted significantly well. The table presents p-value which is .000 which
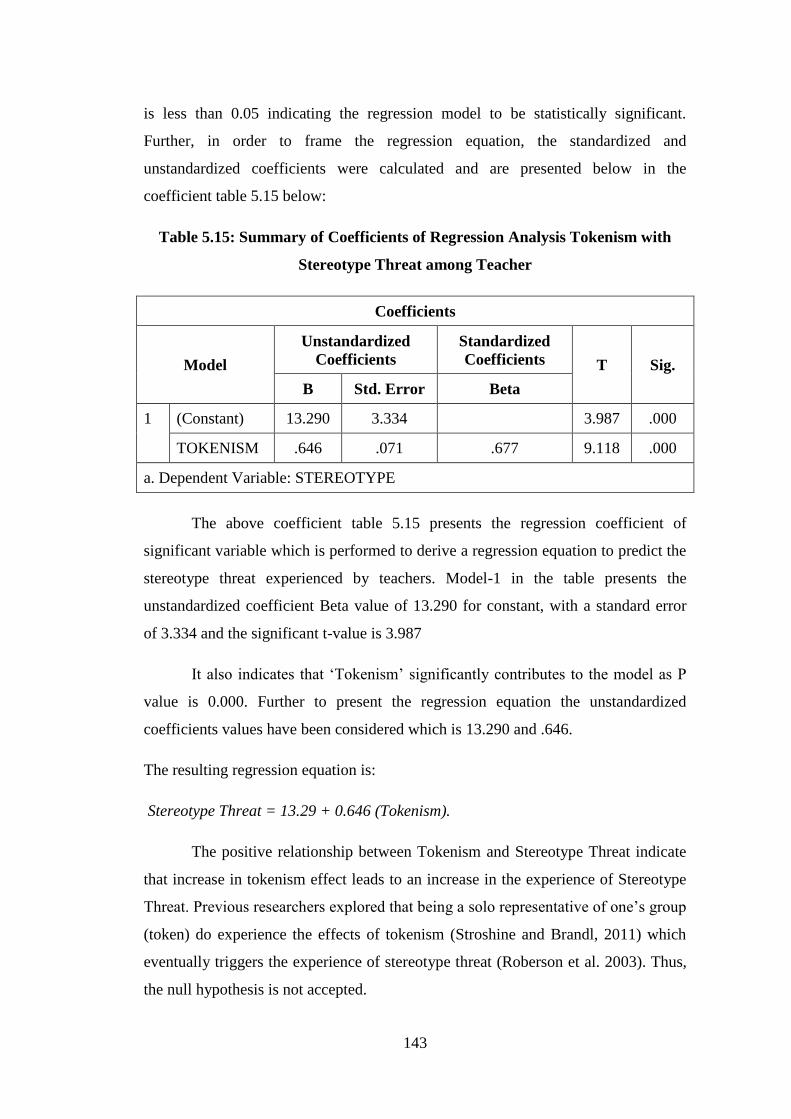
143
is less than 0.05 indicating the regression model to be statistically significant.
Further, in order to frame the regression equation, the standardized and
unstandardized coefficients were calculated and are presented below in the
coefficient table 5.15 below:
Table 5.15: Summary of Coefficients of Regression Analysis Tokenism with
Stereotype Threat among Teacher
Coefficients
Model
Unstandardized
Coefficients
Standardized
Coefficients T Sig.
B Std. Error Beta
1 (Constant) 13.290 3.334 3.987 .000
TOKENISM .646 .071 .677 9.118 .000
a. Dependent Variable: STEREOTYPE
The above coefficient table 5.15 presents the regression coefficient of
significant variable which is performed to derive a regression equation to predict the
stereotype threat experienced by teachers. Model-1 in the table presents the
unstandardized coefficient Beta value of 13.290 for constant, with a standard error
of 3.334 and the significant t-value is 3.987
It also indicates that ‘Tokenism’ significantly contributes to the model as P
value is 0.000. Further to present the regression equation the unstandardized
coefficients values have been considered which is 13.290 and .646.
The resulting regression equation is:
Stereotype Threat = 13.29 + 0.646 (Tokenism).
The positive relationship between Tokenism and Stereotype Threat indicate
that increase in tokenism effect leads to an increase in the experience of Stereotype
Threat. Previous researchers explored that being a solo representative of one’s group
(token) do experience the effects of tokenism (Stroshine and Brandl, 2011) which
eventually triggers the experience of stereotype threat (Roberson et al. 2003). Thus,
the null hypothesis is not accepted.
144
5.2.2 Objective-2: To establish the relationship between stereotype threat and
job performance.
To achieve the above objective following hypotheses was framed and tested.
Therefore, hypotheses were framed as:
H01 : There will be no significant relationship between stereotype threat (ST) and
task Performance (TP) dimension of job performance (JP).
H02 : There will be no significant relationship between Stereotype threat (ST) and
contextual performance (CP) dimension of job performance (JP).
H03 : There will be no significant relationship between Stereotype threat (ST) and
counterproductive Work behavior (CWB) dimension of the job
The objective was framed based on the proposed conceptual model in the
study. The conceptual model in the present study (as shown in Figure.3.3) is
grounded on Stereotype Threat (ST) and Job Performance (JP) relationship. The
hypothesized model endeavors to study the impact of Stereotype Threat (ST) on Job
Performance (JP).
Therefore, this section will discuss the testing procedure of the conceptual
model through AMOS. It was Fornell and Larcker (1981) and Hair et al. (2011) who
suggested that the measurement model should be assessed before structural model
which is applied to test a significant relationship between the constructs. Therefore,
testing of the conceptual model is classified in two stages. Firstly measurement
model of the construct is tested and then the structural model of the construct is
tested. The structural model is tested for the causal relationship between Stereotype
Threat (ST) and Job Performance (JP).
Further, the measurement and structural model of Stereotype Threat (ST) and
Task Performance (TP), Stereotype Threat (ST) and Contextual Performance (CP),
Stereotype Threat (ST) and Counterproductive Work Behavior (CWB) dimension of
Job Performance (JP) is also tested.

145
5.2.2.1 Measurement Model (ST JP)
The first phase includes the measurement model of Stereotype Threat (ST)
and Job Performance (JP). The measurement model was built-in to examine
convergent and discriminant validity. The model was also fitted to confirm the
strength of dimension so that inter constructs estimates are not confounded.
To examine the robustness of dimensions between the statements and other
associated constructs measurement models were built. It is also recommended that in
the model, items that exhibit poor reliability or cross loads can be dropped so as to
re-estimate the model (Hair et al. 2011 and Farooq, 2016). By doing this strength of
measurement is ensured. The below-represented measurement model examines the
relationships among measures of a different construct like stereotype threat (ST) and
Job Performance (JP). The two-headed arrow in the model represents the covariance
between the variables.
Fig. 5.3: Measurement Model of Stereotype Threat (ST) and Job Performance
(JP)
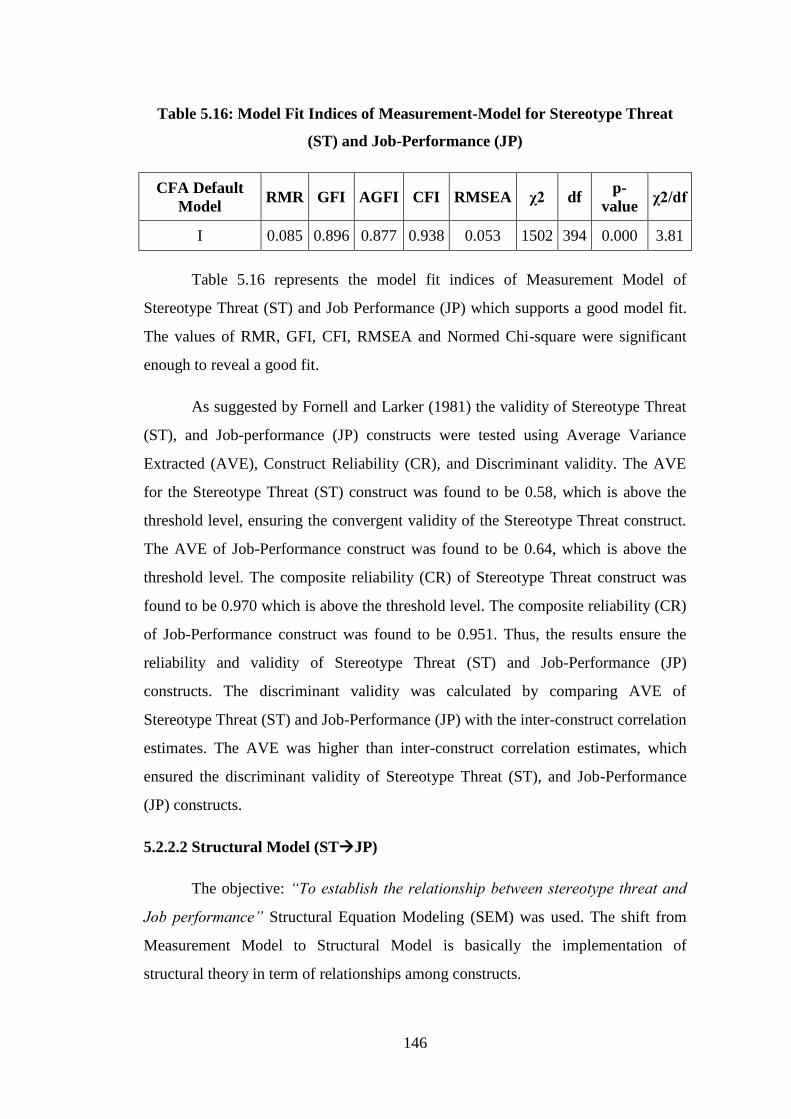
146
Table 5.16: Model Fit Indices of Measurement-Model for Stereotype Threat
(ST) and Job-Performance (JP)
CFA Default
Model RMR GFI AGFI CFI RMSEA χ2 df
p-
value χ2/df
I 0.085 0.896 0.877 0.938 0.053 1502 394 0.000 3.81
Table 5.16 represents the model fit indices of Measurement Model of
Stereotype Threat (ST) and Job Performance (JP) which supports a good model fit.
The values of RMR, GFI, CFI, RMSEA and Normed Chi-square were significant
enough to reveal a good fit.
As suggested by Fornell and Larker (1981) the validity of Stereotype Threat
(ST), and Job-performance (JP) constructs were tested using Average Variance
Extracted (AVE), Construct Reliability (CR), and Discriminant validity. The AVE
for the Stereotype Threat (ST) construct was found to be 0.58, which is above the
threshold level, ensuring the convergent validity of the Stereotype Threat construct.
The AVE of Job-Performance construct was found to be 0.64, which is above the
threshold level. The composite reliability (CR) of Stereotype Threat construct was
found to be 0.970 which is above the threshold level. The composite reliability (CR)
of Job-Performance construct was found to be 0.951. Thus, the results ensure the
reliability and validity of Stereotype Threat (ST) and Job-Performance (JP)
constructs. The discriminant validity was calculated by comparing AVE of
Stereotype Threat (ST) and Job-Performance (JP) with the inter-construct correlation
estimates. The AVE was higher than inter-construct correlation estimates, which
ensured the discriminant validity of Stereotype Threat (ST), and Job-Performance
(JP) constructs.
5.2.2.2 Structural Model (STJP)
The objective: “To establish the relationship between stereotype threat and
Job performance” Structural Equation Modeling (SEM) was used. The shift from
Measurement Model to Structural Model is basically the implementation of
structural theory in term of relationships among constructs.

147
A two-headed arrow indicates non-causal relationships between variables in
the Measurement Model whereas in Structural Model a single-headed arrow
indicates a dependence relationship. The structural model is based on a structural
theory which postulates the relationship between constructs as well as the nature of
relationships they share (Hair et al., 2010).
The Table (5.17) represents the model fit indices for Structural Equation
Modeling (SEM) which advocated good model-fit. While moving from the
measurement model to the structural model there was no adjustment observed in the
model-fit-indices, which demonstrates that the basic model did not decrease the
model-fit because of its predetermined relationship. The standardized estimates for
path Stereotype Threat (ST) →Job Performance (JP) were -0.33 significant at 1%
level (Fig. 5.4).
Fig. 5.4: Validated Structural Model of Stereotype Threat (ST) and Job
Performance (JP)
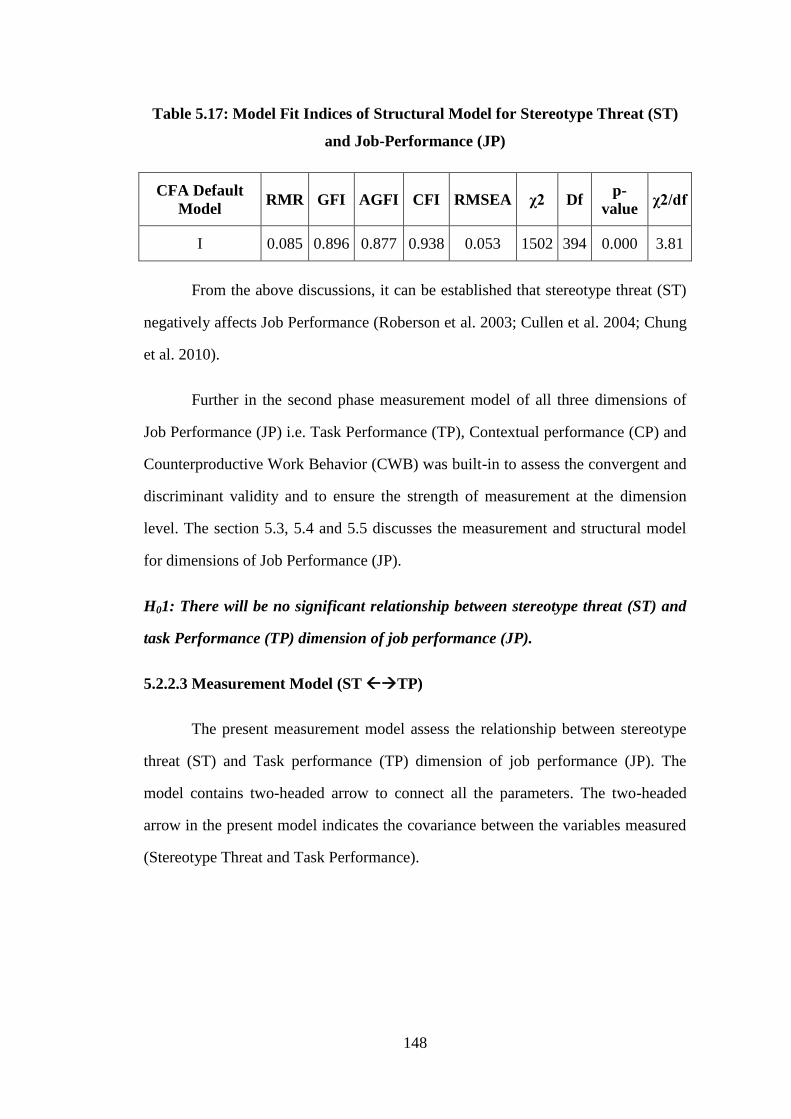
148
Table 5.17: Model Fit Indices of Structural Model for Stereotype Threat (ST)
and Job-Performance (JP)
CFA Default
Model RMR GFI AGFI CFI RMSEA χ2 Df
p-
value χ2/df
I 0.085 0.896 0.877 0.938 0.053 1502 394 0.000 3.81
From the above discussions, it can be established that stereotype threat (ST)
negatively affects Job Performance (Roberson et al. 2003; Cullen et al. 2004; Chung
et al. 2010).
Further in the second phase measurement model of all three dimensions of
Job Performance (JP) i.e. Task Performance (TP), Contextual performance (CP) and
Counterproductive Work Behavior (CWB) was built-in to assess the convergent and
discriminant validity and to ensure the strength of measurement at the dimension
level. The section 5.3, 5.4 and 5.5 discusses the measurement and structural model
for dimensions of Job Performance (JP).
H01: There will be no significant relationship between stereotype threat (ST) and
task Performance (TP) dimension of job performance (JP).
5.2.2.3 Measurement Model (ST TP)
The present measurement model assess the relationship between stereotype
threat (ST) and Task performance (TP) dimension of job performance (JP). The
model contains two-headed arrow to connect all the parameters. The two-headed
arrow in the present model indicates the covariance between the variables measured
(Stereotype Threat and Task Performance).

149
Fig. 5.5: Measurement Model of Stereotype Threat (ST) and Task
Performance (TP)
Table 5.18: Model Fit Indices of Measurement Model for Stereotype Threat
(ST) and Task-Performance (TP)
CFA Default
Model RMR GFI AGFI CFI RMSEA χ2 df
p-
value χ2/df
I 0.061 0.877 0.849 0.916 0.067 1049 287 0.000 3.656
The above table 5.18 shows the summary of the model fit indices supports a
good-fit. The values of RMR, GFI, CFI, RMSEA and Normed Chi-square were
significant enough to reveal a good fit. The validity of Stereotype Threat and Task
Performance (TP) was tested through Average Variance Extracted (AVE), Construct
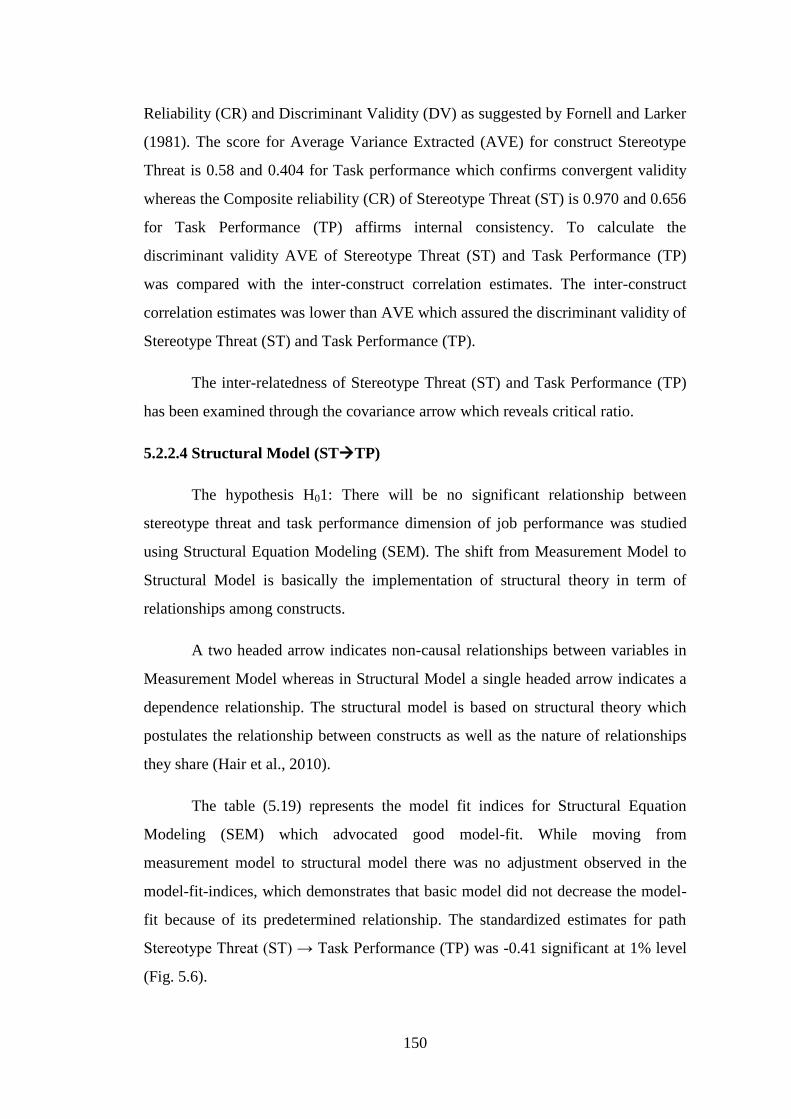
150
Reliability (CR) and Discriminant Validity (DV) as suggested by Fornell and Larker
(1981). The score for Average Variance Extracted (AVE) for construct Stereotype
Threat is 0.58 and 0.404 for Task performance which confirms convergent validity
whereas the Composite reliability (CR) of Stereotype Threat (ST) is 0.970 and 0.656
for Task Performance (TP) affirms internal consistency. To calculate the
discriminant validity AVE of Stereotype Threat (ST) and Task Performance (TP)
was compared with the inter-construct correlation estimates. The inter-construct
correlation estimates was lower than AVE which assured the discriminant validity of
Stereotype Threat (ST) and Task Performance (TP).
The inter-relatedness of Stereotype Threat (ST) and Task Performance (TP)
has been examined through the covariance arrow which reveals critical ratio.
5.2.2.4 Structural Model (STTP)
The hypothesis H01: There will be no significant relationship between
stereotype threat and task performance dimension of job performance was studied
using Structural Equation Modeling (SEM). The shift from Measurement Model to
Structural Model is basically the implementation of structural theory in term of
relationships among constructs.
A two headed arrow indicates non-causal relationships between variables in
Measurement Model whereas in Structural Model a single headed arrow indicates a
dependence relationship. The structural model is based on structural theory which
postulates the relationship between constructs as well as the nature of relationships
they share (Hair et al., 2010).
The table (5.19) represents the model fit indices for Structural Equation
Modeling (SEM) which advocated good model-fit. While moving from
measurement model to structural model there was no adjustment observed in the
model-fit-indices, which demonstrates that basic model did not decrease the model-
fit because of its predetermined relationship. The standardized estimates for path
Stereotype Threat (ST) → Task Performance (TP) was -0.41 significant at 1% level
(Fig. 5.6).
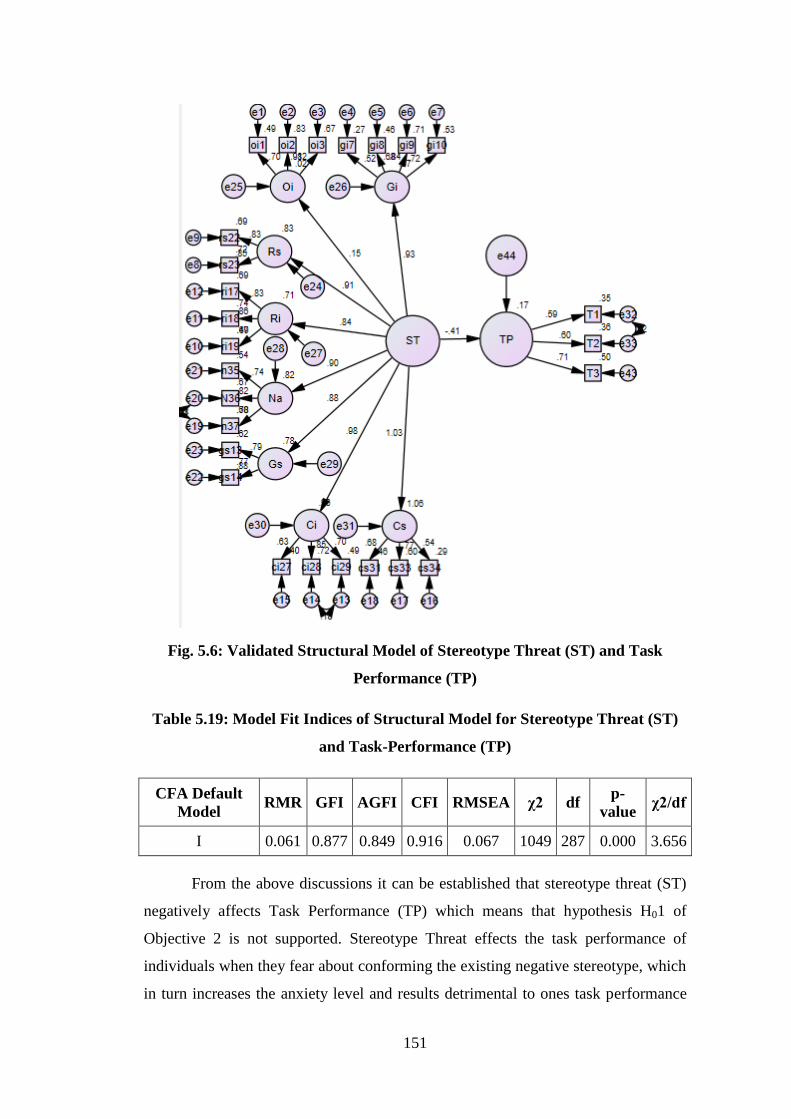
151
Fig. 5.6: Validated Structural Model of Stereotype Threat (ST) and Task
Performance (TP)
Table 5.19: Model Fit Indices of Structural Model for Stereotype Threat (ST)
and Task-Performance (TP)
CFA Default
Model RMR GFI AGFI CFI RMSEA χ2 df
p-
value χ2/df
I 0.061 0.877 0.849 0.916 0.067 1049 287 0.000 3.656
From the above discussions it can be established that stereotype threat (ST)
negatively affects Task Performance (TP) which means that hypothesis H01 of
Objective 2 is not supported. Stereotype Threat effects the task performance of
individuals when they fear about conforming the existing negative stereotype, which
in turn increases the anxiety level and results detrimental to ones task performance

152
(Hill and Wigfield, 1984, Stangor et al. 1998; Cadinu et al. 2003; Frantz, Cuddy,
Burnett, Ray, and Hart, 2004; Schmader et al. 2008).
H02: There will be no significant relationship between Stereotype threat (ST) and
contextual performance (CP) dimension of job performance (JP).
5.2.2.5 Measurement Model (ST CP)
The present measurement model assesses the relationship between stereotype
threat (ST) and Contextual performance (CP) dimension of job performance (JP).
The model contains two-headed arrow to connect all the parameters. The two-
headed arrow in the present model indicates the covariance between the variables
measured (Stereotype Threat and Contextual Performance).
Fig. 5.7: Measurement Model of Stereotype Threat (ST) and Contextual
Performance (CP)
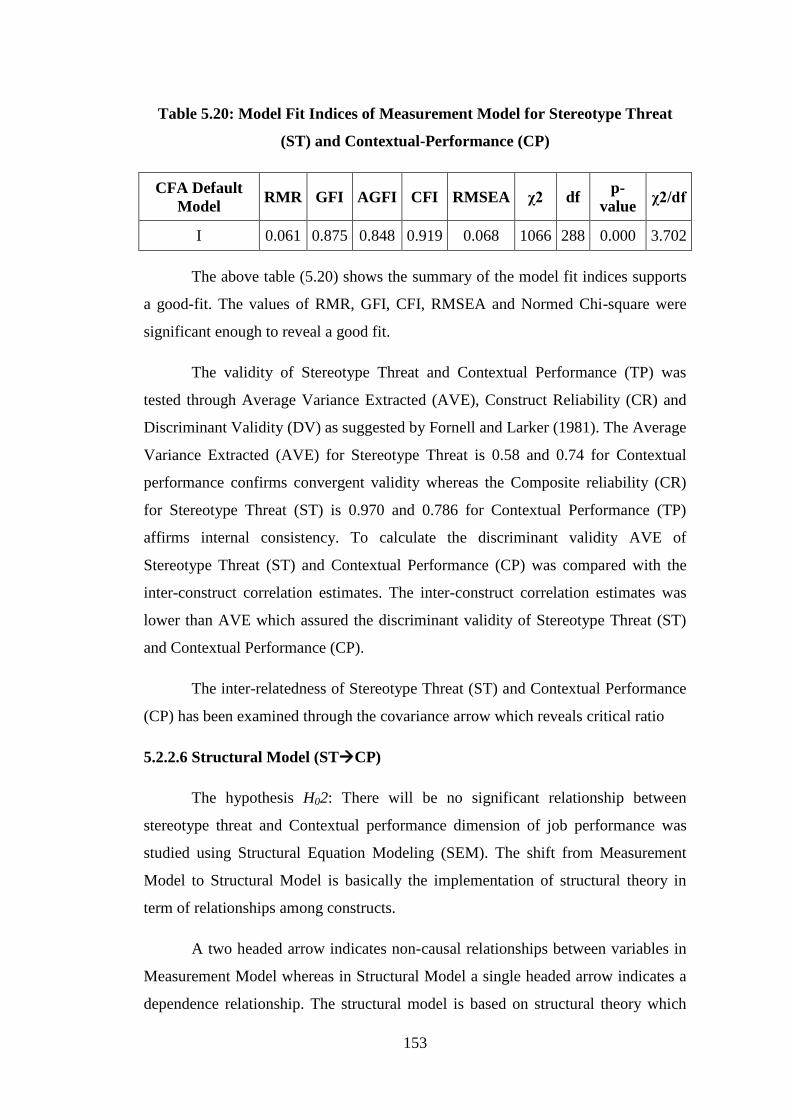
153
Table 5.20: Model Fit Indices of Measurement Model for Stereotype Threat
(ST) and Contextual-Performance (CP)
CFA Default
Model RMR GFI AGFI CFI RMSEA χ2 df
p-
value χ2/df
I 0.061 0.875 0.848 0.919 0.068 1066 288 0.000 3.702
The above table (5.20) shows the summary of the model fit indices supports
a good-fit. The values of RMR, GFI, CFI, RMSEA and Normed Chi-square were
significant enough to reveal a good fit.
The validity of Stereotype Threat and Contextual Performance (TP) was
tested through Average Variance Extracted (AVE), Construct Reliability (CR) and
Discriminant Validity (DV) as suggested by Fornell and Larker (1981). The Average
Variance Extracted (AVE) for Stereotype Threat is 0.58 and 0.74 for Contextual
performance confirms convergent validity whereas the Composite reliability (CR)
for Stereotype Threat (ST) is 0.970 and 0.786 for Contextual Performance (TP)
affirms internal consistency. To calculate the discriminant validity AVE of
Stereotype Threat (ST) and Contextual Performance (CP) was compared with the
inter-construct correlation estimates. The inter-construct correlation estimates was
lower than AVE which assured the discriminant validity of Stereotype Threat (ST)
and Contextual Performance (CP).
The inter-relatedness of Stereotype Threat (ST) and Contextual Performance
(CP) has been examined through the covariance arrow which reveals critical ratio
5.2.2.6 Structural Model (STCP)
The hypothesis H02: There will be no significant relationship between
stereotype threat and Contextual performance dimension of job performance was
studied using Structural Equation Modeling (SEM). The shift from Measurement
Model to Structural Model is basically the implementation of structural theory in
term of relationships among constructs.
A two headed arrow indicates non-causal relationships between variables in
Measurement Model whereas in Structural Model a single headed arrow indicates a
dependence relationship. The structural model is based on structural theory which
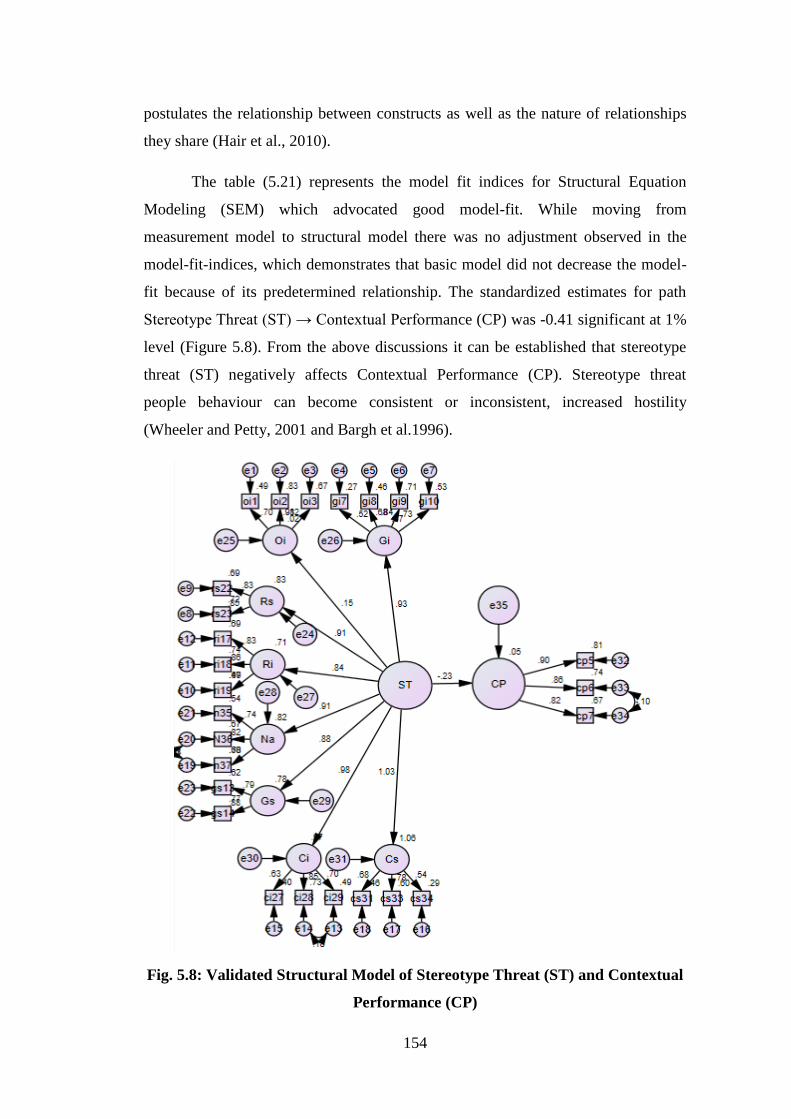
154
postulates the relationship between constructs as well as the nature of relationships
they share (Hair et al., 2010).
The table (5.21) represents the model fit indices for Structural Equation
Modeling (SEM) which advocated good model-fit. While moving from
measurement model to structural model there was no adjustment observed in the
model-fit-indices, which demonstrates that basic model did not decrease the model-
fit because of its predetermined relationship. The standardized estimates for path
Stereotype Threat (ST) → Contextual Performance (CP) was -0.41 significant at 1%
level (Figure 5.8). From the above discussions it can be established that stereotype
threat (ST) negatively affects Contextual Performance (CP). Stereotype threat
people behaviour can become consistent or inconsistent, increased hostility
(Wheeler and Petty, 2001 and Bargh et al.1996).
Fig. 5.8: Validated Structural Model of Stereotype Threat (ST) and Contextual
Performance (CP)
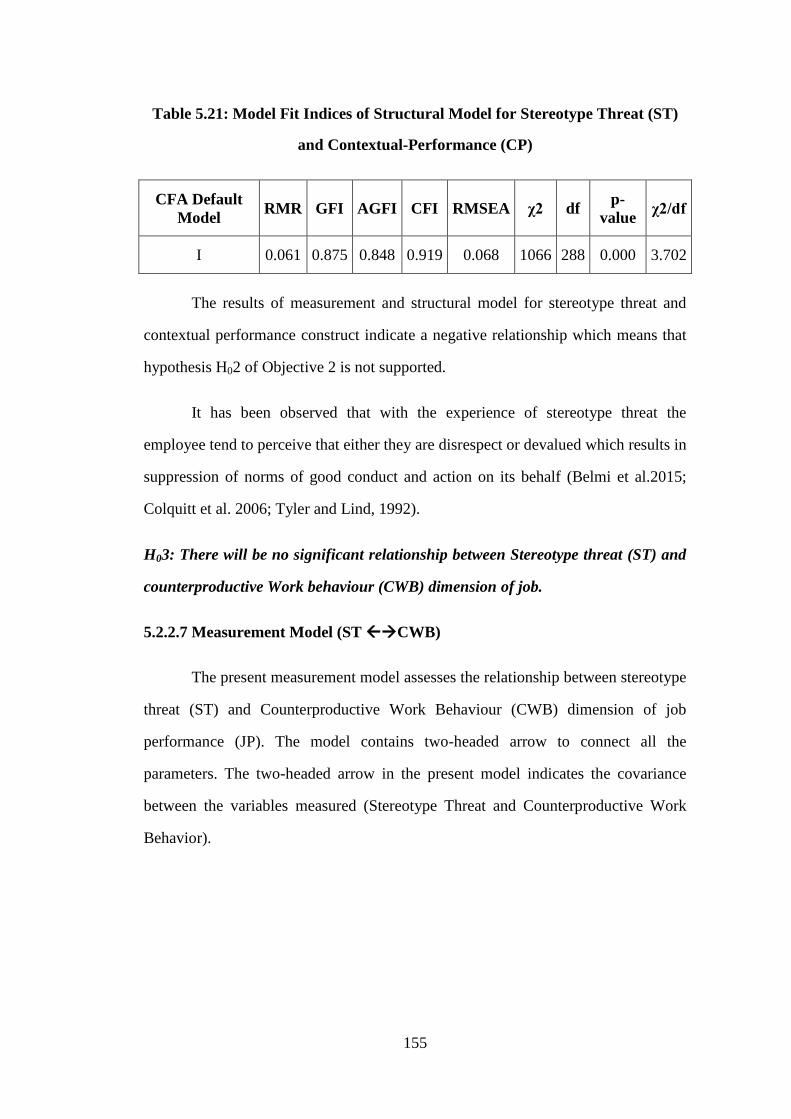
155
Table 5.21: Model Fit Indices of Structural Model for Stereotype Threat (ST)
and Contextual-Performance (CP)
CFA Default
Model RMR GFI AGFI CFI RMSEA χ2 df
p-
value χ2/df
I 0.061 0.875 0.848 0.919 0.068 1066 288 0.000 3.702
The results of measurement and structural model for stereotype threat and
contextual performance construct indicate a negative relationship which means that
hypothesis H02 of Objective 2 is not supported.
It has been observed that with the experience of stereotype threat the
employee tend to perceive that either they are disrespect or devalued which results in
suppression of norms of good conduct and action on its behalf (Belmi et al.2015;
Colquitt et al. 2006; Tyler and Lind, 1992).
H03: There will be no significant relationship between Stereotype threat (ST) and
counterproductive Work behaviour (CWB) dimension of job.
5.2.2.7 Measurement Model (ST CWB)
The present measurement model assesses the relationship between stereotype
threat (ST) and Counterproductive Work Behaviour (CWB) dimension of job
performance (JP). The model contains two-headed arrow to connect all the
parameters. The two-headed arrow in the present model indicates the covariance
between the variables measured (Stereotype Threat and Counterproductive Work
Behavior).
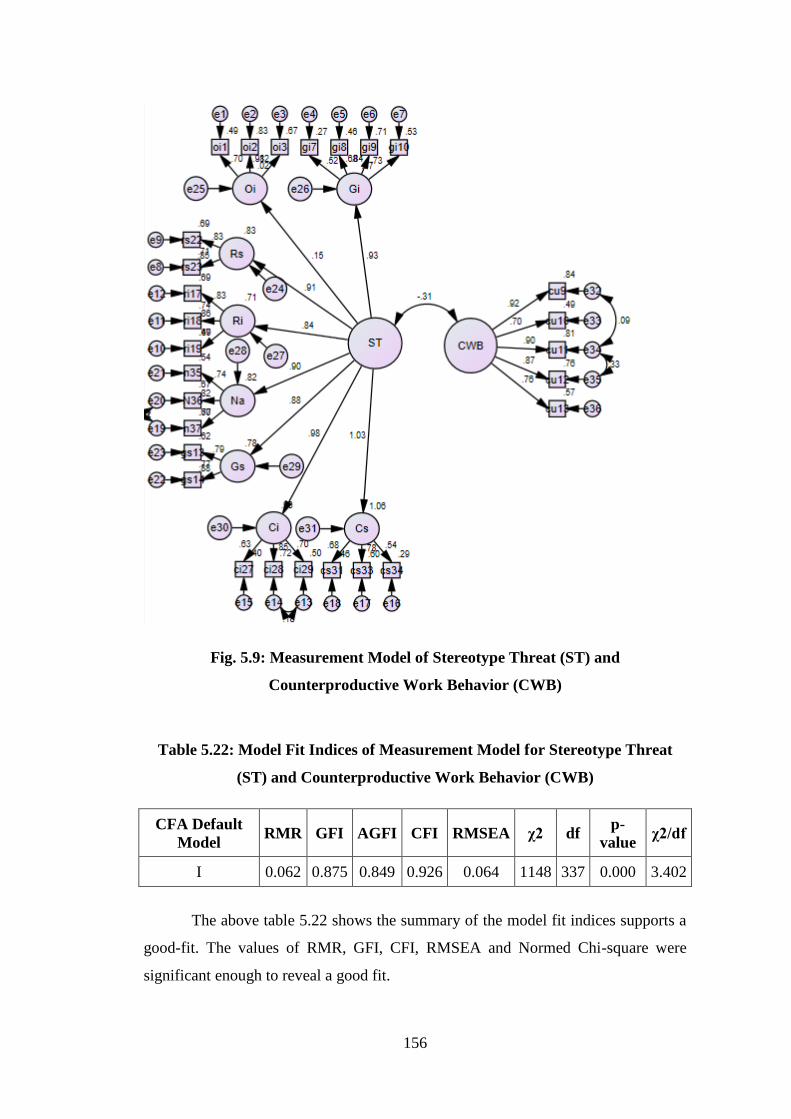
156
Fig. 5.9: Measurement Model of Stereotype Threat (ST) and
Counterproductive Work Behavior (CWB)
Table 5.22: Model Fit Indices of Measurement Model for Stereotype Threat
(ST) and Counterproductive Work Behavior (CWB)
CFA Default
Model RMR GFI AGFI CFI RMSEA χ2 df
p-
value χ2/df
I 0.062 0.875 0.849 0.926 0.064 1148 337 0.000 3.402
The above table 5.22 shows the summary of the model fit indices supports a
good-fit. The values of RMR, GFI, CFI, RMSEA and Normed Chi-square were
significant enough to reveal a good fit.
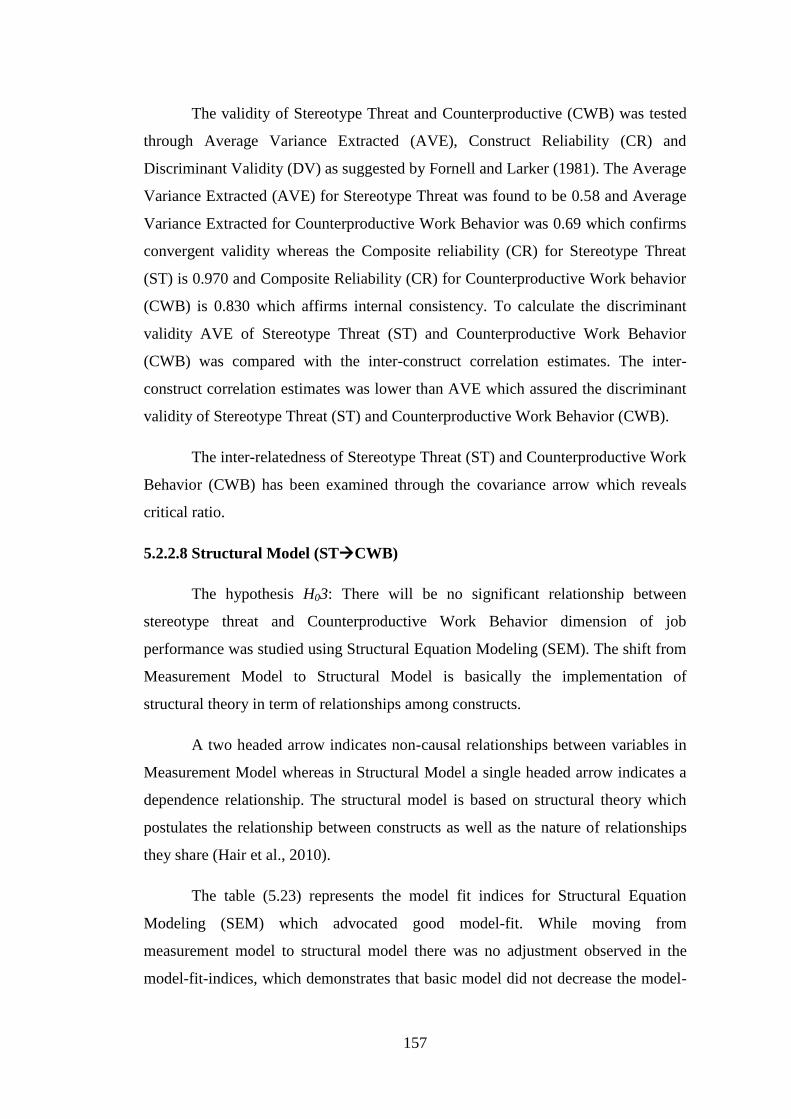
157
The validity of Stereotype Threat and Counterproductive (CWB) was tested
through Average Variance Extracted (AVE), Construct Reliability (CR) and
Discriminant Validity (DV) as suggested by Fornell and Larker (1981). The Average
Variance Extracted (AVE) for Stereotype Threat was found to be 0.58 and Average
Variance Extracted for Counterproductive Work Behavior was 0.69 which confirms
convergent validity whereas the Composite reliability (CR) for Stereotype Threat
(ST) is 0.970 and Composite Reliability (CR) for Counterproductive Work behavior
(CWB) is 0.830 which affirms internal consistency. To calculate the discriminant
validity AVE of Stereotype Threat (ST) and Counterproductive Work Behavior
(CWB) was compared with the inter-construct correlation estimates. The inter-
construct correlation estimates was lower than AVE which assured the discriminant
validity of Stereotype Threat (ST) and Counterproductive Work Behavior (CWB).
The inter-relatedness of Stereotype Threat (ST) and Counterproductive Work
Behavior (CWB) has been examined through the covariance arrow which reveals
critical ratio.
5.2.2.8 Structural Model (STCWB)
The hypothesis H03: There will be no significant relationship between
stereotype threat and Counterproductive Work Behavior dimension of job
performance was studied using Structural Equation Modeling (SEM). The shift from
Measurement Model to Structural Model is basically the implementation of
structural theory in term of relationships among constructs.
A two headed arrow indicates non-causal relationships between variables in
Measurement Model whereas in Structural Model a single headed arrow indicates a
dependence relationship. The structural model is based on structural theory which
postulates the relationship between constructs as well as the nature of relationships
they share (Hair et al., 2010).
The table (5.23) represents the model fit indices for Structural Equation
Modeling (SEM) which advocated good model-fit. While moving from
measurement model to structural model there was no adjustment observed in the
model-fit-indices, which demonstrates that basic model did not decrease the model-
158
fit because of its predetermined relationship. The standardized estimates for path
Stereotype Threat (ST) → Counterproductive Work behavior (CWB) was -0.41
significant at 1% level (Figure 5.10). From the above discussions it can be
established that stereotype threat (ST) negatively affects Counterproductive Work
Behavior (CWB).
Fig. 5.10: Validated Structural Model of Stereotype Threat (ST) and
Counterproductive Work Behavior (CWB)
Table 5.23: Model Fit Indices of Structural Model for Stereotype Threat (ST)
and Counterproductive Work Behaviour (CWB)
CFA Default
Model RMR GFI AGFI CFI RMSEA χ2 df
p-
value χ2/df
I 0.062 0.875 0.849 0.926 0.064 1148 337 0.000 3.402
159
From the above discussions it can be established that stereotype threat (ST)
negatively affects counterproductive work behavior (CWB) which means that
hypothesis H03 of Objective 2 is not supported.
The results of the measurement and structural model indicate a negative
relationship between stereotype threat and counterproductive work behavior. It
means that under the experience of stereotype threat an individual does not allow
oneself to indulge in counterproductive behavior. It might be due to the fact that the
experience of stereotype threat generally induces coping strategy which are
intrapersonal in nature and one of such method is ‘Stereotype Denial’ which is
adopted to re-establish the perceived integrity of oneself (Von Hippel et al 2005).
Generally, stereotype threat strongly endorses counterproductive work attitudes
because they perceive disrespect from employees and organization which directly or
indirectly engage the employees in deviant actions like stealing, cheating, lying etc.
(Belmi et al 2015; Mendoza et al., 2002; Twenge et al. 2001).
5.2.3 Objective-3: To study the relationship between (a) Hedonic well-being
and coping strategies; (b) Hedonic well-being and Workplace
Ostracism; (c) Relationship between Coping Strategies and Workplace
Ostracism.
To achieve the above objective following hypothesis were framed and tested.
Therefore, hypotheses were framed as:
H01 : There will be no significant relationship between Hedonic wellbeing (HWB)
and coping strategies (COPE)
H02 : There will be no significant relationship between Hedonic wellbeing (HWB)
and workplace ostracism (WOS)
H03 : There will be no significant relationship between Coping Strategies (COPE)
and Workplace Ostracism (WOS)
The above objective was framed based on the proposed conceptual model in
the study. The conceptual model contained three intervening variables i.e. hedonic
wellbeing (HWB), Coping Strategy (COPE) and Workplace Ostracism (WOS)
which are considered as mediators between stereotype threat and job performance

160
link. The hypothesized model endeavors to study the effect of mediators between the
Stereotype Threat (ST) on Job Performance (JP) link.
Therefore, this section will discuss the testing procedure of the conceptual
model through AMOS. It was Fornell and Larcker (1981) and Hair et al. (2011) who
suggested that the measurement model should be assessed before structural model
which is applied to test a significant relationship between the constructs. Therefore,
testing of the conceptual model is classified in two stages. Firstly measurement
model of the construct is tested and then the structural model of the construct is
tested. The structural model is tested for the causal relationship between Stereotype
Threat (ST) and Job Performance (JP).
Further the measurement and structural model of Stereotype Threat (ST) and
Task Performance (TP), Stereotype Threat (ST) and Contextual Performance (CP),
Stereotype Threat (ST) and Counterproductive Work Behavior (CWB) dimension of
Job Performance (JP) is also tested.
H01: There will be no significant relationship between Hedonic wellbeing (HWB)
and coping strategies (COPE)
5.2.3.1 Measurement Model (HWB COPE)
First phase includes the measurement model of Hedonic wellbeing (HWB)
and Coping Strategy (COPE). The measurement model was built-in to examine the
convergent and discriminant validity. The model was also fitted to confirm the
strength of dimension so that inter constructs estimates are not confounded.
To examine the robustness of dimensions between the statements and other
associated constructs measurement models were built. It is also recommended that in
the model, items that exhibit poor reliability or cross loads can be dropped so as to
re-estimate the model (Hair et al. 2011 and Farooq, 2016). By doing this strength of
measurement is ensured. The below represented measurement model examines the
relationships among measures of different construct like Hedonic wellbeing (HWB)
and Coping Strategy (COPE). The two headed arrow in the model represents the
covariance between the variables.

161
Fig. 5.11: Measurement Model of Hedonic Wellbeing (HWB) and Coping
Strategy (COPE)
Table 5.24: Model Fit Indices of Measurement-Model for Hedonic Wellbeing
(HWB) and Coping Strategy (COPE)
CFA Default
Model RMR GFI AGFI CFI RMSEA χ2 df
p-
value χ2/df
I 0.065 0.938 0.917 0.957 0.056 325.06 114 0.000 2.851
Table 5.24 represents the model fit indices of Measurement Model of
Hedonic wellbeing (HWB) and Coping Strategy (COPE) which supports a good
model fit. The values of RMR, GFI, CFI, RMSEA and Normed Chi-square were
significant enough to reveal a good fit.
As suggested by Fornell and Larker (1981) the validity of Hedonic wellbeing
(HWB) and Coping Strategy (COPE) constructs was tested using Average Variance
Extracted (AVE), Construct Reliability (CR), and Discriminant validity. The AVE
for the Hedonic wellbeing (HWB) construct was found to be 0.694 which is above
162
the threshold level, ensuring the convergent validity of the Hedonic wellbeing
(HWB) construct. The AVE of coping strategy (COPE) construct was found to be
0.52, which is above the threshold level. The composite reliability (CR) of Hedonic
wellbeing (HWB) construct was found to be 0.90 which is above the threshold level.
The composite reliability (CR) of Coping Strategy (COPE) construct was found to
be 0.92. Thus, the results ensure the reliability and validity of Hedonic Wellbeing
(HWB) and Coping Strategy (COPE) constructs. The discriminant validity was
calculated by comparing AVE of Hedonic Wellbeing (HWB) and Coping Strategy
(COPE) with the inter-construct correlation estimates. The AVE was higher than
inter-construct correlation estimates, which ensured the discriminant validity of
Hedonic Wellbeing (HWB), and Coping Strategy (COPE) constructs.
5.2.3.2 Structural Model (HWBCOPE)
The sub hypothesis: “There will be no significant relationship between
Hedonic Wellbeing (HWB) and Coping Strategies (COPE)” was studied using
Structural Equation Modeling (SEM). The shift from Measurement Model to
Structural Model is basically the implementation of structural theory in term of
relationships among constructs.
A two headed arrow indicates non-causal relationships between variables in
Measurement Model whereas in Structural Model a single headed arrow indicates a
dependence relationship. The structural model is based on structural theory which
postulates the relationship between constructs as well as the nature of relationships
they share (Hair et al., 2010).
The Table (5.25) represents the model fit indices for Structural Equation
Modeling (SEM) which advocated good model-fit. While moving from
measurement model to structural model there was no adjustment observed in the
model-fit-indices, which demonstrates that basic model did not decrease the model-
fit because of its predetermined relationship. The standardized estimates for path
Hedonic Wellbeing (HWB) →Coping Strategy (COPE) was 0.76 significant at 1%
level (Figure5.12).
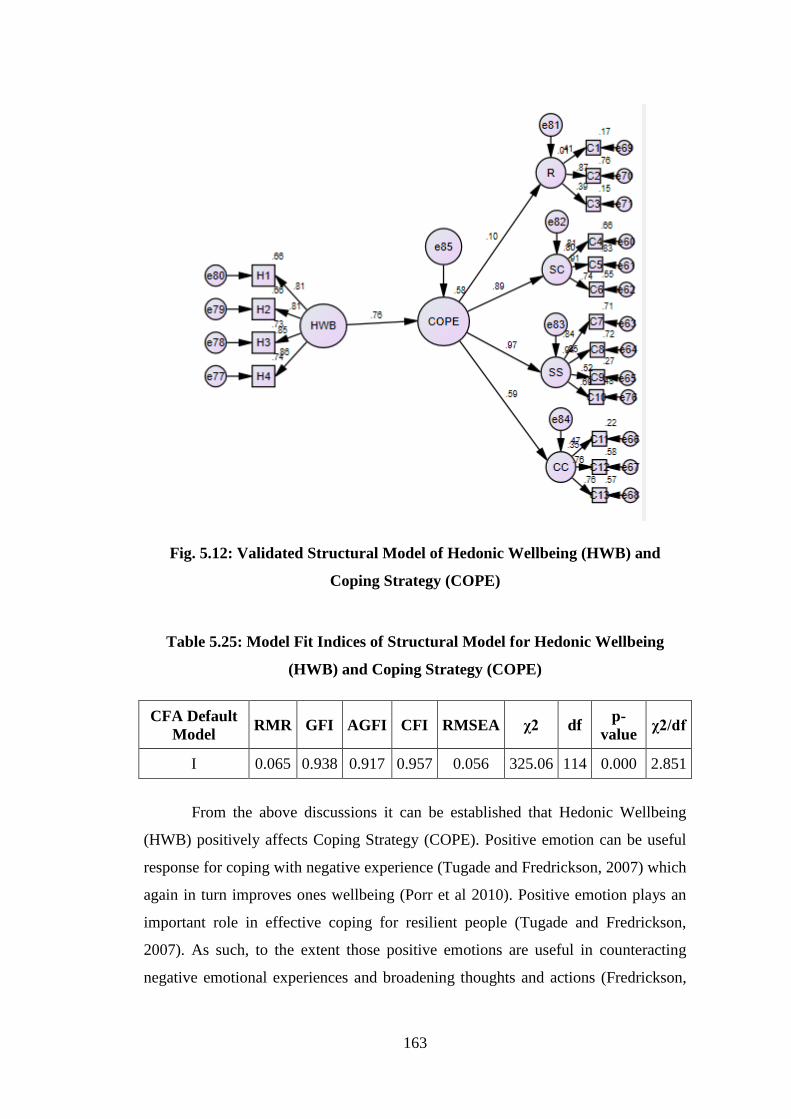
163
Fig. 5.12: Validated Structural Model of Hedonic Wellbeing (HWB) and
Coping Strategy (COPE)
Table 5.25: Model Fit Indices of Structural Model for Hedonic Wellbeing
(HWB) and Coping Strategy (COPE)
CFA Default
Model RMR GFI AGFI CFI RMSEA χ2 df
p-
value χ2/df
I 0.065 0.938 0.917 0.957 0.056 325.06 114 0.000 2.851
From the above discussions it can be established that Hedonic Wellbeing
(HWB) positively affects Coping Strategy (COPE). Positive emotion can be useful
response for coping with negative experience (Tugade and Fredrickson, 2007) which
again in turn improves ones wellbeing (Porr et al 2010). Positive emotion plays an
important role in effective coping for resilient people (Tugade and Fredrickson,
2007). As such, to the extent those positive emotions are useful in counteracting
negative emotional experiences and broadening thoughts and actions (Fredrickson,

164
1998, 2001). It was Luthans and Youssef (2007) stated that employee’s wellbeing is
quite important when employees coping with distress.
H02: There will be no significant relationship between Hedonic wellbeing (HWB)
and workplace ostracism (WOS).
5.2.3.3 Measurement Model (HWB WOS)
First phase includes the measurement model of Hedonic Wellbeing (HWB)
and Workplace Ostracism (WOS). The measurement model was built-in to examine
the convergent and discriminant validity. The model was also fitted to confirm the
strength of dimension so that inter constructs estimates are not confounded.
To examine the robustness of dimensions between the statements and other
associated constructs measurement models were built. It is also recommended that in
the model, items that exhibit poor reliability or cross loads can be dropped so as to
re-estimate the model (Hair et al. 2011 and Farooq, 2016). By doing this strength of
measurement is ensured. The below represented measurement model examines the
relationships among measures of different construct like Hedonic Wellbeing (HWB)
and Workplace Ostracism (WOS). The two headed arrow in the model represents the
covariance between the variables.
Fig. 5.13: Measurement Model of Hedonic Wellbeing (HWB) and Workplace
Ostracism (WOS)
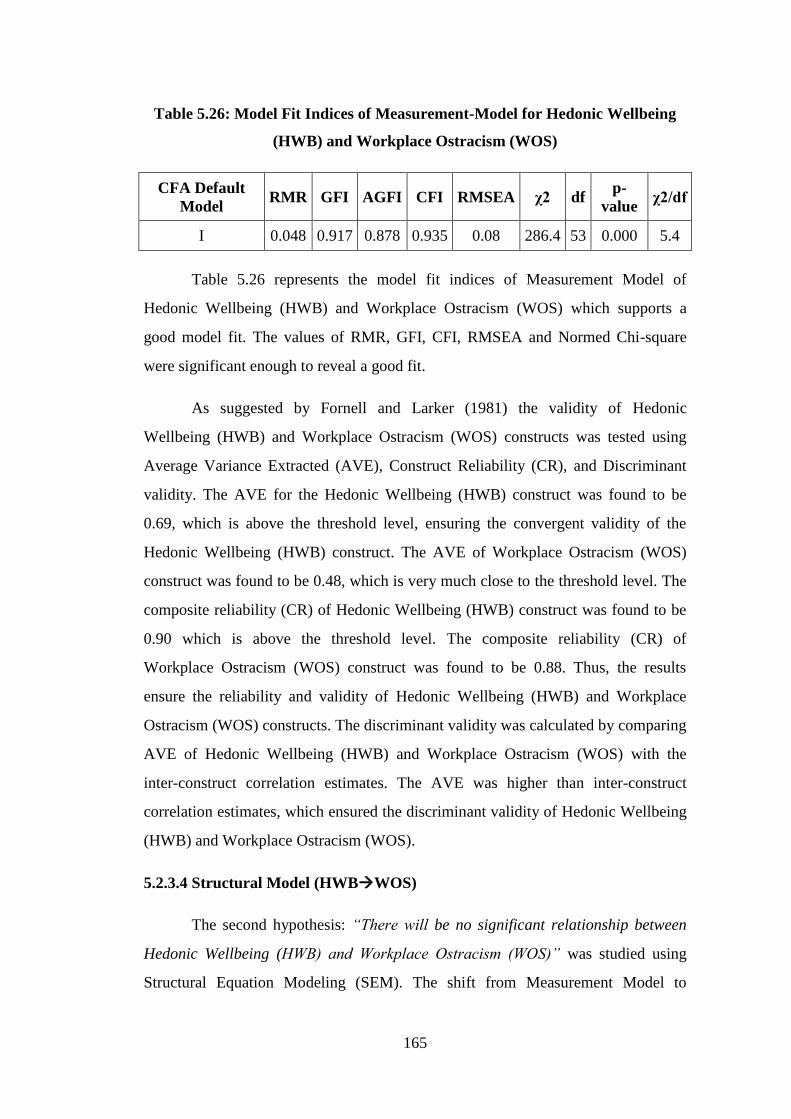
165
Table 5.26: Model Fit Indices of Measurement-Model for Hedonic Wellbeing
(HWB) and Workplace Ostracism (WOS)
CFA Default
Model RMR GFI AGFI CFI RMSEA χ2 df
p-
value χ2/df
I 0.048 0.917 0.878 0.935 0.08 286.4 53 0.000 5.4
Table 5.26 represents the model fit indices of Measurement Model of
Hedonic Wellbeing (HWB) and Workplace Ostracism (WOS) which supports a
good model fit. The values of RMR, GFI, CFI, RMSEA and Normed Chi-square
were significant enough to reveal a good fit.
As suggested by Fornell and Larker (1981) the validity of Hedonic
Wellbeing (HWB) and Workplace Ostracism (WOS) constructs was tested using
Average Variance Extracted (AVE), Construct Reliability (CR), and Discriminant
validity. The AVE for the Hedonic Wellbeing (HWB) construct was found to be
0.69, which is above the threshold level, ensuring the convergent validity of the
Hedonic Wellbeing (HWB) construct. The AVE of Workplace Ostracism (WOS)
construct was found to be 0.48, which is very much close to the threshold level. The
composite reliability (CR) of Hedonic Wellbeing (HWB) construct was found to be
0.90 which is above the threshold level. The composite reliability (CR) of
Workplace Ostracism (WOS) construct was found to be 0.88. Thus, the results
ensure the reliability and validity of Hedonic Wellbeing (HWB) and Workplace
Ostracism (WOS) constructs. The discriminant validity was calculated by comparing
AVE of Hedonic Wellbeing (HWB) and Workplace Ostracism (WOS) with the
inter-construct correlation estimates. The AVE was higher than inter-construct
correlation estimates, which ensured the discriminant validity of Hedonic Wellbeing
(HWB) and Workplace Ostracism (WOS).
5.2.3.4 Structural Model (HWBWOS)
The second hypothesis: “There will be no significant relationship between
Hedonic Wellbeing (HWB) and Workplace Ostracism (WOS)” was studied using
Structural Equation Modeling (SEM). The shift from Measurement Model to
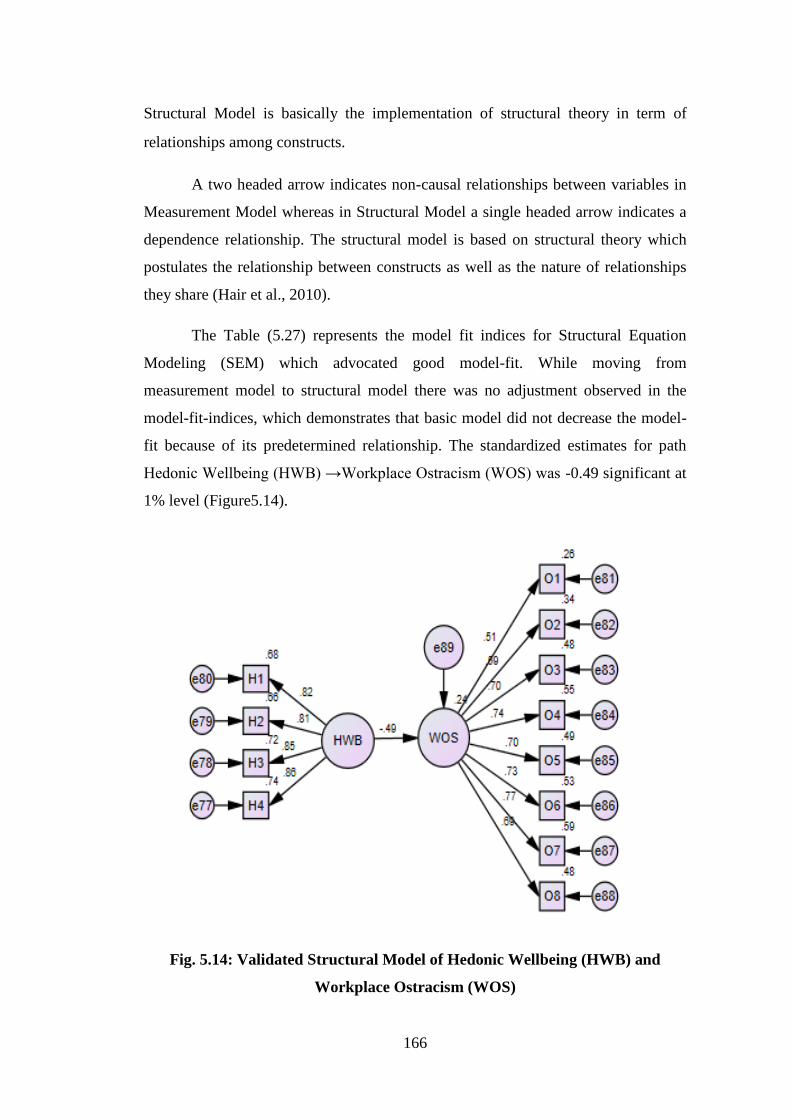
166
Structural Model is basically the implementation of structural theory in term of
relationships among constructs.
A two headed arrow indicates non-causal relationships between variables in
Measurement Model whereas in Structural Model a single headed arrow indicates a
dependence relationship. The structural model is based on structural theory which
postulates the relationship between constructs as well as the nature of relationships
they share (Hair et al., 2010).
The Table (5.27) represents the model fit indices for Structural Equation
Modeling (SEM) which advocated good model-fit. While moving from
measurement model to structural model there was no adjustment observed in the
model-fit-indices, which demonstrates that basic model did not decrease the model-
fit because of its predetermined relationship. The standardized estimates for path
Hedonic Wellbeing (HWB) →Workplace Ostracism (WOS) was -0.49 significant at
1% level (Figure5.14).
Fig. 5.14: Validated Structural Model of Hedonic Wellbeing (HWB) and
Workplace Ostracism (WOS)
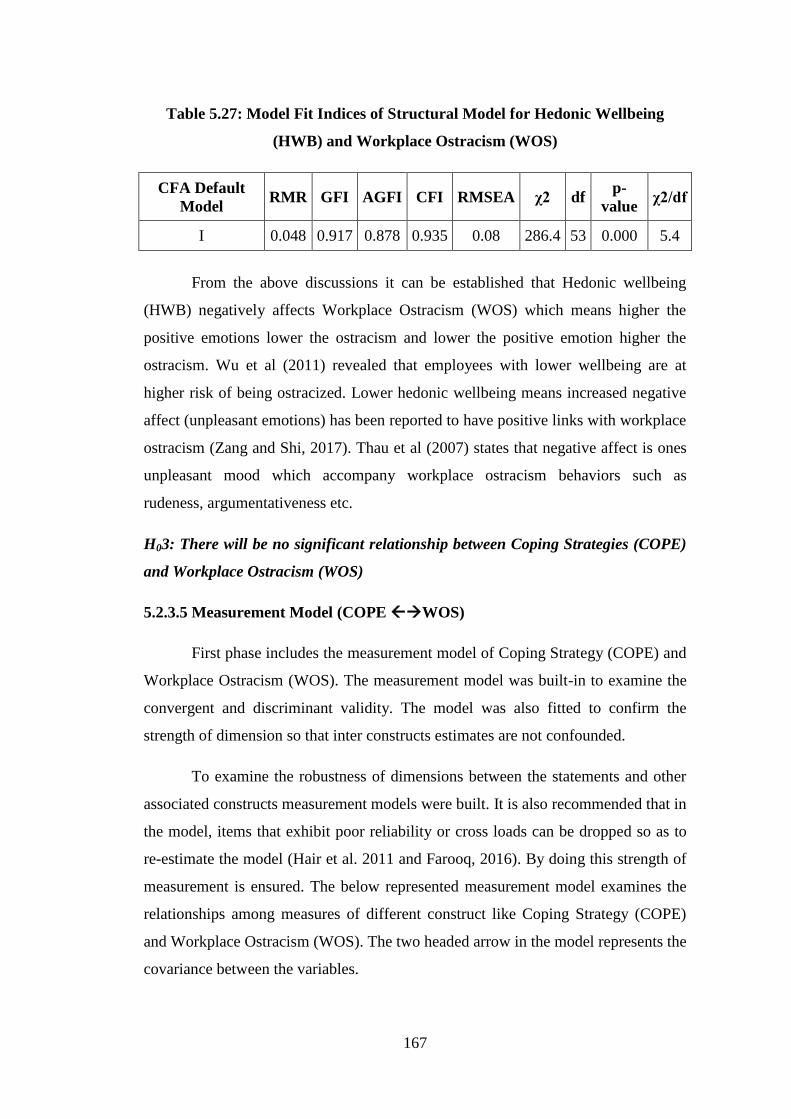
167
Table 5.27: Model Fit Indices of Structural Model for Hedonic Wellbeing
(HWB) and Workplace Ostracism (WOS)
CFA Default
Model RMR GFI AGFI CFI RMSEA χ2 df
p-
value χ2/df
I 0.048 0.917 0.878 0.935 0.08 286.4 53 0.000 5.4
From the above discussions it can be established that Hedonic wellbeing
(HWB) negatively affects Workplace Ostracism (WOS) which means higher the
positive emotions lower the ostracism and lower the positive emotion higher the
ostracism. Wu et al (2011) revealed that employees with lower wellbeing are at
higher risk of being ostracized. Lower hedonic wellbeing means increased negative
affect (unpleasant emotions) has been reported to have positive links with workplace
ostracism (Zang and Shi, 2017). Thau et al (2007) states that negative affect is ones
unpleasant mood which accompany workplace ostracism behaviors such as
rudeness, argumentativeness etc.
H03: There will be no significant relationship between Coping Strategies (COPE)
and Workplace Ostracism (WOS)
5.2.3.5 Measurement Model (COPE WOS)
First phase includes the measurement model of Coping Strategy (COPE) and
Workplace Ostracism (WOS). The measurement model was built-in to examine the
convergent and discriminant validity. The model was also fitted to confirm the
strength of dimension so that inter constructs estimates are not confounded.
To examine the robustness of dimensions between the statements and other
associated constructs measurement models were built. It is also recommended that in
the model, items that exhibit poor reliability or cross loads can be dropped so as to
re-estimate the model (Hair et al. 2011 and Farooq, 2016). By doing this strength of
measurement is ensured. The below represented measurement model examines the
relationships among measures of different construct like Coping Strategy (COPE)
and Workplace Ostracism (WOS). The two headed arrow in the model represents the
covariance between the variables.

168
Fig. 5.15: Measurement Model of Coping Strategy (COPE) and Workplace
Ostracism (WOS)
Table 5.28: Model Fit Indices of Measurement-Model for Coping Strategy
(COPE) and Workplace Ostracism (WOS)
CFA Default
Model RMR GFI AGFI CFI RMSEA χ2 df
p-
value χ2/df
I 0.071 0.89 0.87 0.90 0.067 671.5 184 .000 3.650
Table 5.28 represents the model fit indices of Measurement Model of Coping
Strategy (COPE) and Workplace Ostracism (WOS) which supports a good model fit.
The values of RMR, GFI, CFI, RMSEA and Normed Chi-square were significant
enough to reveal a good fit.
As suggested by Fornell and Larker (1981) the validity of Coping Strategy
(COPE) and Workplace Ostracism (WOS) constructs was tested using Average
Variance Extracted (AVE), Construct Reliability (CR), and Discriminant validity.
The AVE for the Coping Strategy (COPE) construct was found to be 0.52, which is
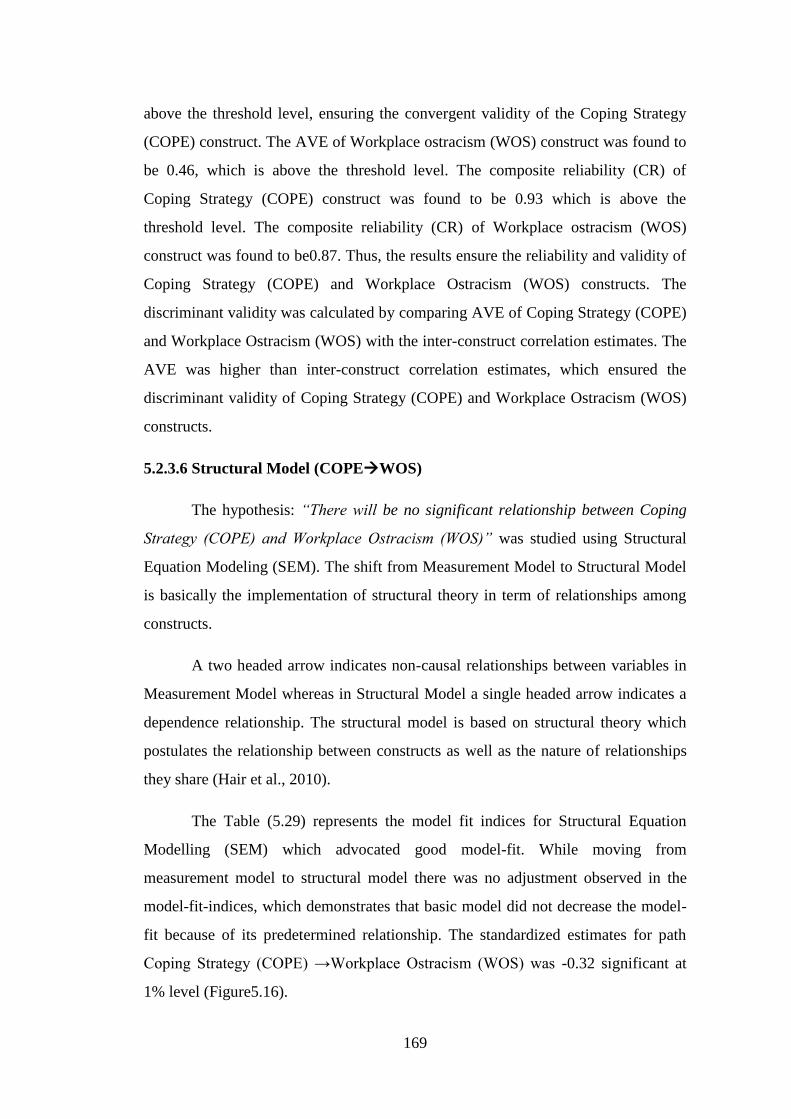
169
above the threshold level, ensuring the convergent validity of the Coping Strategy
(COPE) construct. The AVE of Workplace ostracism (WOS) construct was found to
be 0.46, which is above the threshold level. The composite reliability (CR) of
Coping Strategy (COPE) construct was found to be 0.93 which is above the
threshold level. The composite reliability (CR) of Workplace ostracism (WOS)
construct was found to be0.87. Thus, the results ensure the reliability and validity of
Coping Strategy (COPE) and Workplace Ostracism (WOS) constructs. The
discriminant validity was calculated by comparing AVE of Coping Strategy (COPE)
and Workplace Ostracism (WOS) with the inter-construct correlation estimates. The
AVE was higher than inter-construct correlation estimates, which ensured the
discriminant validity of Coping Strategy (COPE) and Workplace Ostracism (WOS)
constructs.
5.2.3.6 Structural Model (COPEWOS)
The hypothesis: “There will be no significant relationship between Coping
Strategy (COPE) and Workplace Ostracism (WOS)” was studied using Structural
Equation Modeling (SEM). The shift from Measurement Model to Structural Model
is basically the implementation of structural theory in term of relationships among
constructs.
A two headed arrow indicates non-causal relationships between variables in
Measurement Model whereas in Structural Model a single headed arrow indicates a
dependence relationship. The structural model is based on structural theory which
postulates the relationship between constructs as well as the nature of relationships
they share (Hair et al., 2010).
The Table (5.29) represents the model fit indices for Structural Equation
Modelling (SEM) which advocated good model-fit. While moving from
measurement model to structural model there was no adjustment observed in the
model-fit-indices, which demonstrates that basic model did not decrease the model-
fit because of its predetermined relationship. The standardized estimates for path
Coping Strategy (COPE) →Workplace Ostracism (WOS) was -0.32 significant at
1% level (Figure5.16).
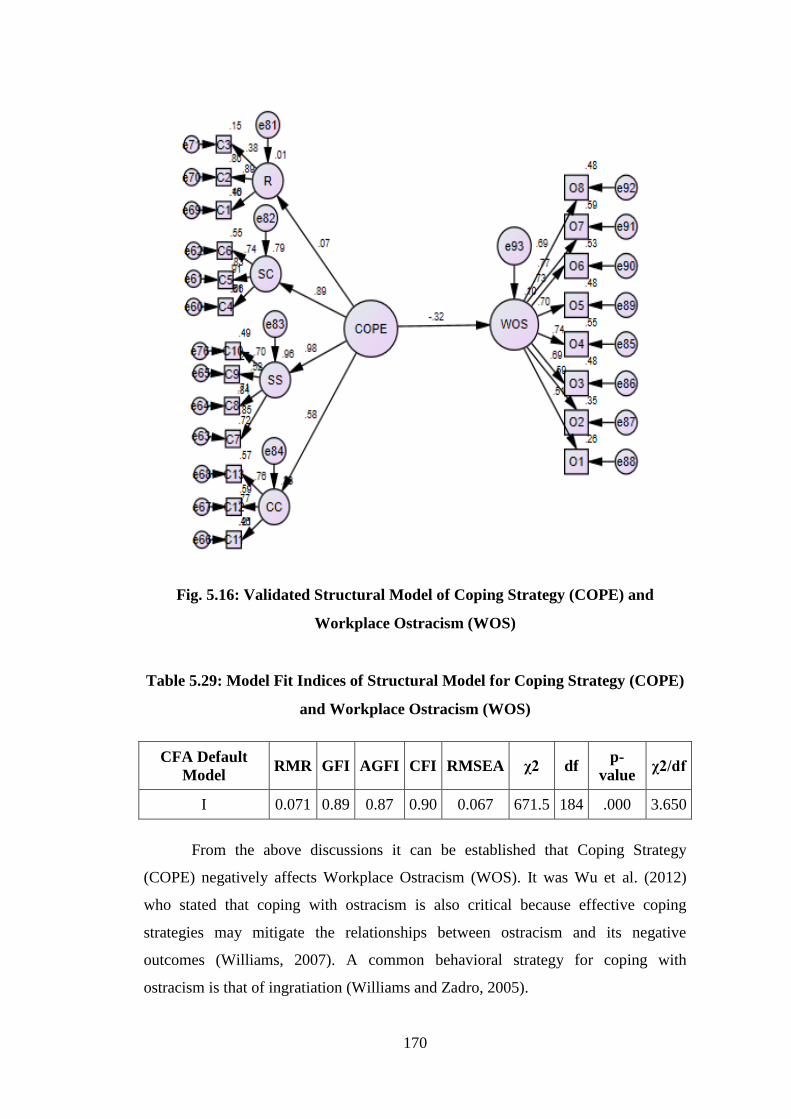
170
Fig. 5.16: Validated Structural Model of Coping Strategy (COPE) and
Workplace Ostracism (WOS)
Table 5.29: Model Fit Indices of Structural Model for Coping Strategy (COPE)
and Workplace Ostracism (WOS)
CFA Default
Model RMR GFI AGFI CFI RMSEA χ2 df
p-
value χ2/df
I 0.071 0.89 0.87 0.90 0.067 671.5 184 .000 3.650
From the above discussions it can be established that Coping Strategy
(COPE) negatively affects Workplace Ostracism (WOS). It was Wu et al. (2012)
who stated that coping with ostracism is also critical because effective coping
strategies may mitigate the relationships between ostracism and its negative
outcomes (Williams, 2007). A common behavioral strategy for coping with
ostracism is that of ingratiation (Williams and Zadro, 2005).

171
5.2.4 Objective-4: To study the role of hedonic wellbeing, workplace
ostracism and coping strategies on the relationship between stereotype
threat and job performance.
To achieve the above objective following research questions were framed
and tested which are as follow:
H01 : Is the causal relationship between stereotype threat and job performance
mediated by Hedonic Wellbeing?
H02 : Is the causal relationship between stereotype threat and job performance
mediated by Workplace Ostracism?
H03 : Is the causal relationship between stereotype threat and job performance
mediated by Coping Strategies (COPE)?
The present section discusses the mediating effect of Hedonic wellbeing
(HWB), Coping Strategy (CP) and Workplace Ostracism (WOS). The first section
discusses the mediating role Hedonic Wellbeing (HWB), the next section presents
the mediating role of coping strategy (CP) and the last section describes the
mediating role of workplace-ostracism (WOS).
A prominent research aims to understand the processes that underlie
empirical phenomena, because to gain real impact, it is necessary to describe the
relationship between independent variable and dependent variable as well as their
relation in terms of mediating processes. Therefore mediation analysis is an
important research tool (Baron and Kenny, 1986; Judd and Kenny,1981; Mackinnon
et al., 2002).
According to Lockwood and Mackinnon (1998) when a third factor is
believed to be in middle of the road in the connection between two factors, it is
known as ‘Mediator’. The term mediator is assigned to an intermediate variable
which falls between an independent (IDV) and dependent variable (DV). It explains
how and why independent variable influences an outcome variable (DV) and this
effect is known as mediation effect. Preacher et al. (2007) indicated "many new
mediation theories are proposed and tried and has been tested in previous researches.
In light of appeal for suitable techniques, an extensive writing currently exists that
172
highlights detailed methodology through which mediations can be measured for
models of ever increasing complexity.
To study mediation, some of the popular methods are Sobels test (1982),
Baron and Kenny (1986) and Bootstrapping. Mediation through Baron and Kenny
(1986) suggests certain assumptions to be fulfilled like independent variable (IDV)
should be related to dependent variable (DV). The second assumption is mediator
should be related to dependent variable (DV). Last and the most important
assumption is that the relation between independent and dependent variable should
significantly reduce when a mediator is added in between. Similarly ‘Sobels-Test’
also has an assumption of a normal sampling distribution with non-zero skewness
and kurtosis (Hayes, 2009). Researchers have now shifted their approach from
traditional methods of mediation to modern method which includes bootstrapping.
Bootstrapping favors those studies in which sample are not normally distributed for
specific characteristics. It allows the researcher to study mediation effect even
without the assumption of normality and large sampling (Hayes, 2009).
To test the mediation in the present study a systematic procedure suggested
by Baron and Kenny (1986) was considered. Therefore, first the independent
variable (Stereotype Threat) must be related to the mediator (Hedonic wellbeing,
Coping Strategy and Workplace Ostracism). Secondly mediators should be related to
dependent variable (Job Performance). Lastly, relationship between stereotype threat
and job performance should significantly reduce when mediators i.e, Hedonic
wellbeing, Coping strategy and workplace ostracism is added to their relationship.
First direct effect has been checked between stereotype threat and job
performance. After that Hedonic wellbeing, coping strategy and workplace
ostracism which was taken as mediators in the present study were introduced to test
the path significance between stereotype threat and job performance. The motive
was to assess whether the earlier significant relationship of stereotype threat and job
performance is or not reduced in-significant when mediators (Hedonic wellbeing,
Coping Strategy and Workplace ostracism) are added one-by-one into the path.
In the subsequent section first mediating role of hedonic wellbeing (HWB)
will be described, secondly mediating role of coping strategy will be presented and
173
then mediating role of workplace ostracism has been discussed. To statistically
assess the mediating effect of hedonic wellbeing, coping strategy and workplace
ostracism on the relationship between stereotype threat and job performance
bootstrapping method has been considered (Preacher and Hayes. 2007).
The mediation approach suggested by Baron and Kenny (1986)
In a nutshell, mediation analysis (MA) is a statistical procedure to test
whether the effect of an independent variable A on a dependent variable B (i.e.,
A→B) is at least partly explained by a chain of effects of the independent variable
on an intervening mediator variable M and of the intervening variable on the
dependent variable (i.e., A→M→B).
R1: Is the causal relationship between stereotype threat and job performance
mediated by Hedonic Wellbeing?
5.2.4.1 Mediating Role of Hedonic Wellbeing (HWB)
Mediating role of Hedonic wellbeing (HWB) on the relationship between
stereotype threat (ST) and Job Performance (JP) is shown in Figure (5.17). The
procedure suggested by Baron and Kenny (1986) was taken into consideration to
assess the mediating effect of Hedonic wellbeing (HWB) on Stereotype Threat and
Job Performance relationship.
First direct effect between Stereotype Threat (ST) and Job Performance (JP)
was studied controlling for Hedonic wellbeing (HWB) (β= -0.35 P<0.001). The
direct effect between stereotype threat (ST) and Job Performance (JP) was
significant which fulfilled the first condition of mediation analysis. Again, direct
effect was calculated between stereotype threat (ST) and job performance (JP) (β= -
.19 p<0.001) after adding hedonic wellbeing (HWB) as mediator, as shown in Table
5.30 below. However direct effect between stereotype threat (ST) and job
performance (JP) was reduced and was also significant. The indirect effect from
stereotype threat (ST) to hedonic wellbeing (HWB) and hedonic wellbeing (HWB)
to job performance (JP) was significant (β= -.142 P<0.001). Therefore it can be
concluded that hedonic wellbeing (HWB) partially mediates the relationship
between stereotype threat (ST) and job performance (JP).
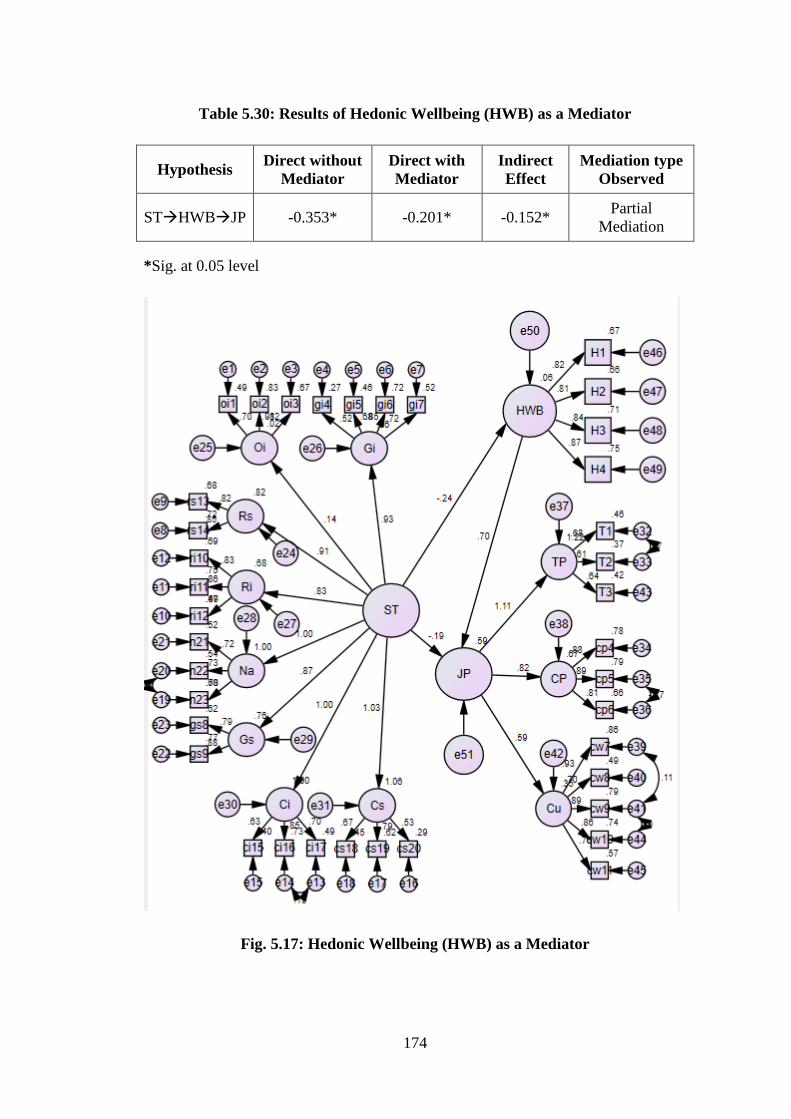
174
Table 5.30: Results of Hedonic Wellbeing (HWB) as a Mediator
Hypothesis Direct without
Mediator
Direct with
Mediator
Indirect
Effect
Mediation type
Observed
STHWBJP -0.353* -0.201* -0.152* Partial
Mediation
*Sig. at 0.05 level
Fig. 5.17: Hedonic Wellbeing (HWB) as a Mediator
175
Therefore, hypothesis R1 of objective 4 is supported which mean that
hedonic wellbeing partially mediates the relationship between stereotype threat and
job performance. It has also been explored by the previous researchers that positive
and negative emotions were entered as mediators of stereotype threat (ST) and its
detrimental behavioural consequences (Schmander, 2008; Bedyńska and Zreda
2015) and decrease in an individual’s job performance is one of the detrimental
behavioural consequence of stereotype threat (Steele and Aronson, 1995).
R2: Is the causal relationship between stereotype threat and job performance
mediated by Coping Strategies (COPE)?
5.2.4.2 Mediating Role of Coping Strategy (COPE)
The second research question deals with the role of coping strategy (COPE)
as a mediator between the relationship shared by stereotype threat (ST) and Job
Performance (JP), whch was tested using mediation analysis.
The mediating effect of coping strategy (COPE) on the relationship between
stereotype threat (ST) and job performance (JP) was tested based on the procedure
suggested by Baron and Kenny (1986), as shown in figure 5.18. First direct effect
between Stereotype Threat (ST) and Job Performance (JP) was studied controlling
for Coping Strategy (COPE) (β= -.35, P<0.001). The direct effect between
Stereotype Threat (ST) and Job Performance (JP) was significant which fulfilled the
first condition of mediation analysis. Again, direct effect was calculated between
stereotype threat (ST) and job performance (JP) (β=-.11 p<0.001) after adding
Coping Strategy (COPE) as mediator, as shown in Table 5.31. However direct effect
between Stereotype Threat (ST) and Job Performance (JP) was reduced and was also
significant. The indirect effect from Stereotype Threat (ST) to Coping Strategy
(COPE) and Coping Strategy (COPE) to job performance (JP) was also significant
(β=-.216 P<0.001). Therefore it can be concluded that Coping Strategy (COPE)
partially mediates the relationship between Stereotype Threat (ST) and Job
Performance (JP).
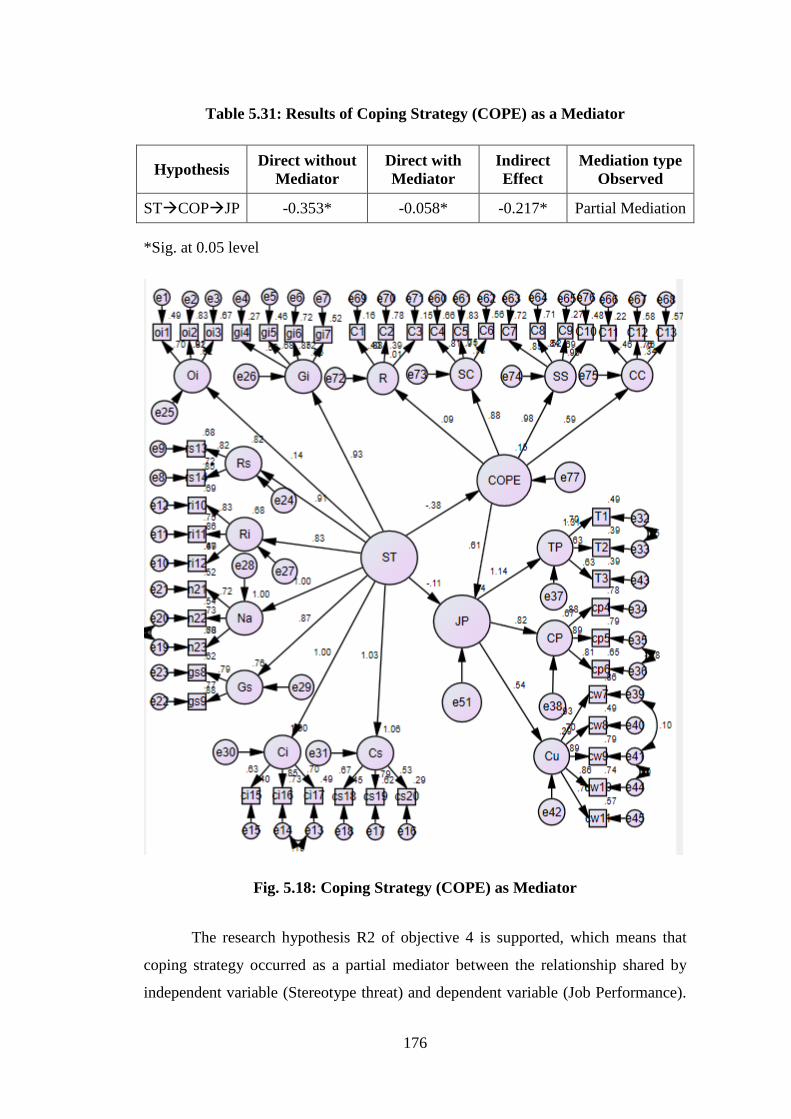
176
Table 5.31: Results of Coping Strategy (COPE) as a Mediator
Hypothesis Direct without
Mediator
Direct with
Mediator
Indirect
Effect
Mediation type
Observed
STCOPJP -0.353* -0.058* -0.217* Partial Mediation
*Sig. at 0.05 level
Fig. 5.18: Coping Strategy (COPE) as Mediator
The research hypothesis R2 of objective 4 is supported, which means that
coping strategy occurred as a partial mediator between the relationship shared by
independent variable (Stereotype threat) and dependent variable (Job Performance).
177
It is found that the experience of stereotype threat probably induces coping strategy
in an individual (Hippel et al.2005). Major et al (2000) stated that to cope with the
experience of stereotype threat different coping strategies can be adopted by the
target of stereotype threat. Individuals high in coping strategy does not show deficit
in performance after the experience of stereotype threat (Kuiper et al., 1993; Ford et
al., 2004). Successful implementation of coping strategy enhance the job
performances (Tang and Chiu, 2003; Srivastava and Tang, 2015). However, some
previous researches also claim that coping strategy mediates the relationship
between stereotype threat and job performance (Ford et al. 2004). It was Schmader
et al. 2008 who also supported the same by claiming that a psychological process
underlies the experience of stereotype threat and some situational cues and personal
characteristics combine all together to trigger that experience.
Other researches also suggest that individual’s engage in coping strategy
(COPE) to offset the performance implication of negative stereotype (Lazarus, 1984,
Bedynska and Dororta, 2015).
R3: Is the causal relationship between stereotype threat and job performance
mediated by Workplace Ostracism?
5.2.4.3 Mediating Role of Workplace Ostracism (WOS)
The third part of the research question is about the role of “Workplace
Ostracism” (WOS) as a mediator on the relationship between stereotype threat (ST)
and Job Performance (JP) which was tested using mediation analysis.
The mediating effect of Workplace Ostracism (WOS) on the relationship
between Stereotype Threat (ST) and Job Performance (JP) was tested based on the
procedure suggested by Baron and Kenny (1986), as shown in figure 5.19 below.
First direct effect between Stereotype Threat (ST) and Job Performance (JP) was
studied controlling for Workplace Ostracism (WOS) (β= -.35 P<0.001). The direct
effect between Stereotype Threat (ST) and Job Performance (JP) was significant
which fulfilled the first condition of mediation analysis. Again, direct effect was
calculated between stereotype threat (ST) and Job Performance (JP) (β= -.25,
p<0.001) after adding Workplace Ostracism (WOS) as mediator, as shown in Table

178
5.32 below. However direct effect between Stereotype Threat (ST) and Job
Performance (JP) was reduced and was also significant. The indirect effect from
Stereotype Threat (ST) to Workplace Ostracism (WOS) and Workplace Ostracism
(WOS) to job performance (JP) was also significant (β= -.072 P<0.001). Therefore it
can be concluded that Workplace Ostracism (WOS) partially mediates the
relationship between Stereotype Threat (ST) and Job Performance (JP)
Table 5.32: Results of Workplace Ostracism (WOS) as a Mediator
Hypothesis Direct without
Mediator
Direct with
Mediator
Indirect
Effect
Mediation type
Observed
STWOSJP -0.353* -0.117* -0.080* Partial
Mediation
*Sig. at 0.05 level
Fig. 5.19: Workplace Ostracism (WOS) as a Mediator

179
The research hypothesis R3 of objective 4 is supported, which means that
workplace ostracism occurred as a partial mediator between the relationship shared
by independent variable (Stereotype threat) and dependent variable (Job
Performance).
Stereotype threat (ST) is the result of negative stereotyping and negative
stereotypes regularly causes negative reaction or response’s (Singletary, 2009).
Buckley et al. (2004) stated that a negative reaction from others affects an
individual’s quality of their interpersonal relationships. The above stated lines
further can be interpreted as, when the target receive negative reaction feeling of
stereotype threat is awaken to as response of this interpersonal relationships is affect
and target might feel excluded from the rest (Ostracism). Ostracism at workplace
refers to the extent to which an individual perceive that they are ignored or excluded
by other employees in the workplace (Ferris et al., 2008). A strong negative
relationship between workplace ostracism and job performance has been observed
(Haq, 2014).

180
CHAPTER – VI
FINDINGS, CONCLUSION, IMPLICATIONS AND
SUGGESTIONS
The present chapter deals with the findings, conclusion, implication and
suggestions. The section 6.1 deals with the key findings of the study based on the
quantitative analysis of the data, section 6.2 discusses the conclusion based on the
research findings, section 6.3 deliberates the implication of the study for researchers
and practitioners and section 6.4 highlights the suggestions for the researches to be
held in future.
6.1 FINDING AND DISCUSSION
1) The present study revealed task performance, contextual performance and
counterproductive work behavior as an integral dimensions of job
performance. Thus supporting the literatures which favors that job
performance is a multi-dimensional construct. Therefore study supports that
among teachers also job performance is considered as a multidimensional
construct and is composed of task performance, contextual performance and
counterproductive work behavior.
2) The present study also established the dimensions for the stereotype threat
construct consisting of occupational identification, gender identification,
gender stigma consciousness, religion identification, religion stigma
consciousness, caste category identification, caste category stigma
consciousness and negative affect as its integral dimensions. In teaching job
profiles stereotype threat has a role to play and different dimensions of
stereotype threat are found similar as in other profession like banking,
nursing etc.
3) The study also revealed that gender, caste category and religion are the
triggering factors for the occurrence of phenomenon of stereotype threat
among teachers in government schools. The study describes stereotype threat
(ST) as an unpleasant psychological experience of confronting negative
181
stereotypes about one’s race, gender, gender, sexual orientation or social
status.
4) The findings of the present study suggest that caste category, religion, gender
and tokenism are the factors which trigger the phenomenon of stereotype
threat (ST). According to Schamder et. al. (2008) social identity of
individuals (ethnicity, gender, religious affiliation etc.) enhances the
experience of stereotype threat.
5) The study revealed tokenism as a strong predictor of stereotype threat.
Tokenism has been found to contribute in the experience of stereotype threat.
It is a practice to recruit persons belonging to minority groups. Token
teachers often feel their performance will be scrutinized and are polarized
due to which interaction is discouraged which promote negative stereotyping
(Stroshine et.al 2011). The process in turn leads an individual towards the
experience of stereotype threat (Nieman, 1999). Tokenism might be
considered as one of the triggers of stereotype threat in organizations. The
finding is in line with Sekaquaptewa and Thompson (2003). Thereby
tokenism is considered as one of the situational factors which trigger’s threat
and decrease ones performance.
6) The analysis of the study revealed that stereotype threat is negatively related
to job performance of teachers of government schools. Previous researchers
also stated negative relationship of stereotype threat with performance in
various jobs (Davies et.al., 2002; Herrera et.al.2005; Roberson and Kulik,
2007; Schmader et.al.,2008; Block et.al,2011) Therefore, the presents study
concludes that prevalence of negative stereotypes in schools supports the
phenomenon of stereotype threat (ST) with poor performance of teachers
when compared with schools of good or conducive environment.
7) The analysis was further conducted individually on dimensions of job
performance which revealed that stereotype threat is also negatively related
to task performance and contextual performance and counterproductive work
behavior, which means that their teaching task of teachers and such activities

182
which contribute to the wellbeing of the school gets negatively affected by
the experience of stereotype threat.
8) The study found that Stereotype threat causes decrements in teacher’s job
performance and claims that the link is mediated by some psychological and
physiological mechanisms. Therefore the study explored hedonic wellbeing
(HBW), Coping Strategy (COPE) and Workplace Ostracism (WOS) as the
psychological variables which mediate stereotype threat (ST) and Job
Performance link.
9) The study explored positive relationship between hedonic wellbeing and
coping strategy among teachers which means that teachers who use coping
strategy experience more positive emotions and vice versa.
10) The analysis further revealed that there is a negative relationship between
hedonic wellbeing and workplace ostracism which means that with decrease
in hedonic wellbeing of teacher the experience of ostracism is more occurred
and vice versa.
11) The analysis also revealed negative relationship between Coping Strategy
and Workplace ostracism in teaching fraternity which means that one who
lack in effective use of coping strategy might feel more ostracized in a
diverse group, because it has been observed that use of coping strategy
moderate the relationship between workplace ostracism and its negative
outcomes.
12) The mediating effect of constructs like hedonic wellbeing, coping strategy
and workplace ostracism on stereotype threat and job performance was
studied. The results suggested that hedonic wellbeing, coping strategy and
workplace ostracism mediate the relationship between stereotype threat and
job performance. The findings of the present study are in line with the
findings of Schmader et.al, (2008) Schmader and Johns (2003) Spencer et
al., (1999).
13) Hedonic wellbeing (HWB) mediates the relationship between stereotype
threat (ST) and job performance (JP). The results of the present study suggest
183
that there exist a negative relationship between Stereotype threat (ST) and
Hedonic wellbeing (HWB) and a positive relationship between Hedonic
wellbeing and Job Performance (JP). Previous studies on stereotype threat
proves that Stereotype Threat (ST) deteriorates the performance of
individuals by inducing negative emotions or thoughts about being
stigmatized (Aronson, 2013).Thereby, concluding that hedonic wellbeing
might enhance job performance (JP) of teachers if targets can cope
efficiently with the unpleasant feelings emerged due to stereotype threat.
Stereotype threat impairs the performance of teachers by arousing negative
emotions or negative thoughts of being judged as inferior (Schmader et al.,
2008; Aronson et.al., 2013).
14) Coping strategy (COPE) mediates the relationship between stereotype threat
(ST) and job performance (JP). The link between stereotype threat and job
performance suggest that employees better in coping strategy are less
effected by the negative effects of stereotype threat and are more productive
in terms of their performance (Schmader et.al.2008). Another mediator
considered in the model was Coping Strategy (COPE). The results of the
present study suggest that there exist a negative relationship between
Stereotype threat (ST) and Coping Strategy (COPE) and a positive relation
shared between Coping Strategy (COPE) and Job Performance (JP).
Individuals who experience the unpleasant feeling of being negatively
stereotyped needs effective coping strategies so as to shield themselves from
threatening environment of stereotype threat (Major and Schmader, 1998;
Schmader et.al, 2008; Aronson et.al.2013). Previous studies recommend that
use of coping strategy contributes in better performance of employees
(Tummers, 2017; Li et.al.2017). Thereby, concluding that Coping Strategy
(COPE) can enhance job performance (JP) of Individuals if individuals use
effective defense strategy against stereotype threat.
15) Workplace ostracism (WOS) mediates the relation shared between stereotype
threat (ST) and job performance (JP). Lastly Workplace ostracism (WOS)
was also considered as one of the mediator in the proposed model. The
results of the present study suggest that t a positive relation is shared between
184
Stereotype threat (ST) and Workplace Ostracism (WOS) and a negative
relationship between Workplace Ostracism (WOS) and Job Performance
(JP). Due to stereotype threat high stress environment is created which
further support ostracism at workplace (Robinson et.al.,2012) and ostracism
at work also deteriorates an employee’s job performance (Ferris et.al,2008).
Thereby, concluding that Workplace ostracism (WOS) can enhance job
performance (JP) of employees at workplace if effective strategies or
technique is approached.
6.2 CONCLUSION OF THE STUDY
Stereotype threat (ST) is a phenomenon which received a lot of consideration
from past psychologist. The effect of stereotype threat on performance of individuals
has received a lot of attention in previous researches. However the previous
researches lacked such studies which holistically investigate the effect of stereotype
threat on all the three dimensions of job performance individually from the
educational organizational perspective. The present study is the first to empirically
validate different Stereotype threat dimensions viz. Occupational Identification (Oi),
Gender Identification (Gi), Gender Stigma Consciousness (Gs), Religion
Identification (Ri), Religion Stigma Consciousness (Rs), Caste category
Identification (Ci), Caste category Stigma Consciousness (Cs) and Negative Affect
(Na). It also measured and explored the indirect effects of Hedonic Wellbeing
(HWB), Coping Strategy (COPE) and Workplace Ostracism (WOS). The study
presented job performance as a higher order construct with task performance (TP),
Contextual Performance (CP) and Counterproductive Work Behavior (CWB) as its
dimensions.
Hedonic wellbeing (HWB) construct was operationalized in Indian context.
Confirmatory Factor Analysis (CFA) was applied to re-establish the scale. Similarly,
Coping Strategy (COPE), Tokenism (TOK) and workplace ostracism scale was also
validated. Coping strategy scale resulted into four factors including Recreation (R),
Self-Care (SC), Social-Support (SS) and Cognitive Coping (Cc) thereby validating
coping strategy scale developed by Osipow and Spokane (1998) in Indian Context.
Tokenism scale was also validated resulted into two factors Visibility and

185
polarization thereby validating tokenism scale developed by Stroshine and Brandl
(2011). The ostracism scale was also validated developed by Ferris et.al (2008) as a
Uni-dimensional construct in Indian Context.
The awareness about the negative effect of stereotype threat on Job
Performance enables the academicians to develop the strategies to overcome its
negative effects. The academic setting of educational institutions in India is quite
diverse which include individuals from various backgrounds (Caste category,
Religion and Gender). The educational institution should develop strong
organizational culture which respects the diversity so as to avoid the negative effects
of stereotype threat on individual’s performances. Coping strategy can be another
best technique to manage stress (Wu and Chan, 2013) which emerged due to the
occurrence of stereotype threat and ostracism at workplace. The experience of
increased pleasure and decreased pain measures hedonic wellbeing of individual
thereby indicating emotional stability of an employee. Emotional Stability of a
person also plays a major role in handling the phenomenon of stereotype threat.
It can be concluded that exploring the factors which triggers the experience
of stereotype threat in organization is not enough rather effective strategies should
be explored to tackle and manage the experience of stereotype threat and its
aftereffects. The top managements, policy makers and educational institutions head
should emphasize on awareness and use of effective coping strategy (COPE) and
Hedonic wellbeing (HWB). The study provides awareness about the triggers of
stereotype threat so as to better understand its negative effects on the performance of
teachers in educational institutions. More precisely, the mediators like hedonic
wellbeing, coping strategy and workplace ostracism plays a vital role in Stereotype
threat and Job Performance link.
It is a great challenge to tackle or manage the experience of stereotype threat
in organization. To manage the experience of stereotype threat in organization first
step is to capture the phenomenon of stereotype threat. Therefor the present study
empirically validated Stereotype threat framework which can help the policy makers
and educational heads in exploring the negative effects of stereotype threat on the
performances of the educators. Targeting the phenomenon of stereotype threat in

186
educational institutions is very important because the eradication of its negative
effects will help the institutions to achieve sustainable development of our education
system in this competitive era. Therefore the higher educational bodies and policy
makers should encourage and motivate teaching staffs to use various techniques to
overcome the experience of stereotype threat in educational institutions. The
educational heads should boost up the idea of respecting diversity in their
organizations. Teaching staffs should be encouraged to maintain good organizational
climate by respecting each other’s irrespective of their caste, gender or religion. The
employees should be rewarded for maintaining good organizational culture in the
institution. It is incumbent upon educational institutions to make high level of
awareness about negative effects of stereotype threat so as to enhance organization
performance. Organizations should not hesitate in encouraging strategies to
overcome stereotype threat. Some of the proven strategies like reducing prejudice
(Logel et al.,2009), removing physical cues which may seem like school setting is
defined by a particular group (Cheryan et al.,2009), Should avoid reporting negative
stereotypes based on one’s group identity (Danaher and Crandall, 2008), Should
practice multicultural ideology by openly valuing diversity (Purdie-Vaughns et
al.2008)
6.3 IMPLICATION OF THE STUDY
There are numerous implications of the present study for policy makers,
academicians and organization heads. The present study does not only presents
useful and productive insights about the relationship between stereotype threat and
job performance but also delivers very much required empirical as well as
theoretical exactitude in the stereotype threat literature by developing an empirical
framework in teaching context.
The present study contributes to the existing literature on stereotype threat
and job performance relationship by operationalizing the constructs and validating
scales for stereotype threat (ST), Job performance (JP), Coping Strategy (COPE),
Tokenism (TOK) and Hedonic wellbeing (HWB). The results of the present study
revealed that the developed scales exhibits admirable validity and reliability which
can be used by researchers for further investigation into the stereotype threat and
187
performance link. The present study fills the void gap by providing validated
measures for assessing the phenomenon of stereotype threat and its effect on
performance. The study also explored mediators which effect the stereotype threat
and performance link.
The study developed and validated supervisory rating scale to measure job
performance of teachers. The job performance (JP) measure consisted of three
dimensions viz. task performance (TP), Contextual Performance (CP) and
Counterproductive work behavior (CWB). In situation where policy makers,
institutional heads and researchers find tough in accessing actual job performance of
teachers because of the reluctance of the teachers to share their opinion or data about
their performance in schools, they may count on this scale to measure their
performance.
The study also validated the Hedonic wellbeing, Coping Strategy, workplace
Ostracism and Tokenism scales in Indian context. The present study contributes by
checking dimensionality of Tokenism in Indian Context. The results suggest that
tokenism is two dimensional construct viz visibility and Polarization. The
dimensions of Coping Strategy have been confirmed in Indian context in the present
study. Therefore policy makers, academicians and researchers have a lot to take
from the present investigation. The scales utilized in the present investigation are
accessible for academician and other researchers to gauge the effects of stereotype
threat on performance of teachers in different types of educational institutions. The
study implies that educational heads should provide conducive environment to the
teachers of their organizations. They can provide necessary help and encouragement
to the teachers who experience stereotype threat. A stimulating institutional
environment should be generated where discussion and openness related to the
negative stereotypes about social identity should be encouraged so as to remove
misconceptions.
The present study also shed some light on the mechanism of stereotype threat
influence on job performance. Specifically the results revealed that Hedonic
wellbeing, Workplace ostracism and Coping Strategy partially mediate the
relationship between stereotype threat and performance among teachers, suggesting
188
vital role which these variables play in the educational setting. The findings in the
present study provide an insight to the organizational heads so as to attempt some
techniques to attenuate the deleterious effect of stereotype threat on job
performances of teachers.
6.4 LIMITATIONS AND SUGGESTIONS FOR FUTURE RESEARCH
Despite the overall contribution of the present study still like any other
research this study too have some limitations. Therefore, the limitation of the present
study is discussed with some suggestions for future research.
The present study focuses only on the relationship between stereotype threat
(ST) and Job performance (JP) and on psychological mechanism which mediate the
relationship. The future research may also be conducted to explore the moderating
effect of the variables like Hedonic wellbeing (HWB), Coping Strategy (COPE),
Tokenism (TOK) and Workplace Ostracism (WOS). Future researchers can also
include other psychological as well as physiological variables to study their
mediating and moderating effect on stereotype threat and job performance link.
The present study considered only government schools at state level and
ignored private schools considering descriptive research design. Therefore, findings
of the present investigation may further be re-validated by using other research
designs like experimental research design. A comparative study can also be
conducted between teachers of private and public schools of India. Similarly a
comparison of university teachers and school teachers may also be conducted to gain
additional insight about stereotype threat and job performance link in academic
settings. Stereotype threat and job performance model can be re-validated or re-
established by considering different samples from different states of India, since the
outcomes of the present study might be subjected to social contrasts between
northern part of India and different areas; which will give an increasingly powerful
testing of the model.
There is a great need to examine how to lessen the negative effects caused by
the phenomenon of stereotype threat because present study examined only the issue
and its underlying mechanism.
189
The future researchers can also check cross-cultural validity of Stereotype
Threat (ST) by comparing its dimensionality in different context. The revalidation of
the validated scales on Stereotype threat, Job performance, Hedonic wellbeing,
Coping Strategy and Workplace Ostracism can be done in different context. Future
research might also include interviews of the victims of stereotype threat and its
effect on their lives, it can also include interviews of head of the organization to
know their opinion about the prevalence of stereotype threat so as to gain new
insight about the phenomenon of stereotype threat (ST) in educational institutions.

190
REFERENCES
A Grandey, A., L Cordeiro, B., & C Crouter, A. (2005). A longitudinal and multi‐
source test of the work–family conflict and job satisfaction relationship.
Journal of occupational and Organizational Psychology, 78(3), 305-323.
Adeyemi, T. O. (2008). Organisational Climate and Teachers’ Job Performance in
Primary Schools in Ondo State, Nigeria: An Analytical Survey. Asian
Journal of Information Technology, 7(4), 138-145.
Adeyemi, T.O. (2004). Educational Administration: An Introduction. Greenline
Publishers. Ado Ekiti.
Ahmed, I. (2013). Evading Ostracism: A Look at Critical Role of Organizational and
Supervisory Support. Research Journal of Applied Sciences, Engineering
and Technology 6(14): 2535-2537.
Ahmed, R. (2014). Relationship between Selected Factors of Job Satisfaction and
Job Performance Among Workers at Palm Oil Industries. International
Review of Management and Business Research, 3(3), 1751.
Akinyemi, A. (1993). Job satisfaction among teachers in Ondo state secondary
schools’, J. Educ, Leadership, 29, 10-22.
Aktag, I. (2015). Computer self-efficacy, computer anxiety, performance and
personal outcomes of Turkish physical education teachers. Academic
Journal, 10(3), 328-337.
Allison, K. W. (1998). Stress and oppressed social category membership. In J. K.
Swim & C. Stangor (Eds.), Prejuidice: The target’s perspective (pp. 145-
170). San Diego, CA: Academic Press.
Ambady, N., Shih, M., Kim, A., & Pittinsky, T. L. (2001). Stereotype susceptibility
in children: Effects of identity activation on quantitative performance.
Psychological Science, 12, 385–390.

191
Amjad, Z., Sabri, P. S. U., Ilyas, M., & Hameed, A. (2015). Informal relationships at
workplace and employee performance: A study of employees private higher
education sector. Pakistan Journal of Commerce and Social Sciences, 9(1),
303-321.
Andrews, F. M., & Withey, S. B. (1976). Social indicators of well-being: The
development and measurement of perceptual indicators. New York: Plenum.
Archbold, C. A., & Schulz, D. M. (2008). Making rank: The lingering effects of
tokenism on female police officers' promotion aspirations. Police
Quarterly, 11(1), 50-73.
Armstrong‐Stassen, M. (1994). Coping with transition: A study of layoff
survivors. Journal of Organizational Behavior, 15(7), 597-621.
Arnold, R., & Fletcher, D. (2012). Organisational Stressors, Coping, and Outcomes
in Competitive Sport. Dissertation. Loughborough University, United
Kingdom.
Aronson, J., Burgess, D., Phelan, S. M., & Juarez, L. (2013). Unhealthy interactions:
The role of stereotype threat in health disparities. American journal of public
health, 103(1), 50-56.
Aronson, J., Lustina, M. J., Good, C., Keough, K., Steele, C.M., & Brown, J. (1999).
When white men can’t do math: Necessary and sufficient factors in
stereotype threat. Journal of Experimental Social Psychology, 35, 29-46.
Aronson, J., Quinn, D., & Spencer, S. (1998). Stereotype threat and the academic
underperformance of women and minorities. In J. Swim & C. Stangor (Eds.),
Stigma: The target’s perspective. New York: Academic Press.
Austin, V., Shah, S., & Muncer, S. (2005). Teacher stress and coping strategies used
to reduce stress. Occupational therapy international, 12(2), 63-80.
Avey, J. B., Luthans, F. & Youssef, C. M. (2010). The additive value of
psychological capital in predicting workplace attitudes and behaviours.
Journal of Management, 36, 430- 452.

192
Bakker, A. B., Van Emmerik, H., & Van Riet, P. (2008). How job demands,
resources, and burnout predict objective performance: A constructive
replication. Anxiety, Stress, & Coping, 21(3), 309-324.
Bal. K. (2015). From flexibility human resource management to employee
engagement and perceived job performance across the lifespan: A
multisample study. Journal of Occupational and Organizational Psychology,
88, 126–154.
Balliet, D., & Ferris, D. L. (2013). Ostracism and prosocial behavior: A social
dilemma perspective. Organizational Behavior and Human Decision
Processes, 120(2), 298-308.
Bamber, E. M., & Iyer, V. M. (2002). Big 5 auditors' professional and organizational
identification: Consistency or conflict?. Auditing: A Journal of Practice &
Theory, 21(2), 21-38.
Ban, R., & Rao, V. (2008). Tokenism or agency? The impact of women’s
reservations on village democracies in south India. Economic Development
and Cultural Change, 56(3), 501-530.
Bargh, J. A., Chen, M., & Burrows, L.(1996). Automaticity of social Behaviour:
Direct effects of trait construct and stereotype activation on action. Journal
of Personality and Social Psychology, 71(2), 230-244.
Barrick, M. R., & Mount, M. K. (1991). The big five personality dimensions and job
performance: a meta‐analysis. Personnel psychology, 44(1), 1-26.
Bartels, K. P. (2013). Public encounters: The history and future of face-to-face
contact between public professionals and citizen. Public Administration,
91(2), 469-483.
Baumeister, R. F., & Leary, M. R. (1995). The need to belong: desire for
interpersonal attachments as a fundamental human motivation. Psychological
bulletin, 117(3), 497-529

193
Baumeister, R. F., Heatherton, T. F., & Tice, D. M. (1994). Losing control: How
and why people fail at self-regulation. Academic press.
Bedyńska, S., & Żołnierczyk-Zreda, D. (2015). Stereotype threat as a determinant of
burnout or work engagement. Mediating role of positive and negative
emotions. International Journal of Occupational Safety and Ergonomics,
21(1), 1-8.
Befort, N., & Hattrup, K. (2003). Valuing task and contextual performance:
Experience, job roles, and ratings of the importance of job behaviors.
Applied HRM Research, 8(1), 17-32.
Beilock, S. L., Rydell, R. J., McConnell, A. R. (2007). Stereotype threat and
working memory: mechanisms, alleviation, and spillover. Journal of
Experimental Psychology: General, 136(2), 256–76.
Belmi, P., Barragan, R. C., Neale, M. A., & Cohen, G. L. (2015). Threats to social
identity can trigger social deviance. Personality and social psychology
bulletin, 41(4), 467-484.
Benditt, T. M. (1974). Happiness. Philosophical Studies, 25, 1-20.
Benditt, T. M. (1978). Happiness and satisfaction – A rejoinder to Carson. The
Personalist, 59, 108-109.
Bennett, R. J., & Robinson, S. L. (2000). Development of a measure of workplace
deviance. Journal of applied psychology, 85(3), 349.
Ben-Zeev, T., Fein, S., & Inzlicht, M. (2005). Arousal and stereotype threat. Journal
of Experimental Social Psychology, 41(2), 174-181.
Bergeron, D. M., Block, C. J., & Echtenkamp, A. (2006). Disabling the able:
Stereotype threat and women's work performance. Human performance,
19(2), 133-158.
Berjot, S., Roland-Levy, C., & Girault-Lidvan, N. (2011). Cognitive appraisals of
stereotype threat. Psychological reports, 108(2), 585-598.
194
Betoret, F. D. (2006). Stressors, self‐efficacy, coping resources, and burnout among
secondary school teachers in Spain. Educational psychology, 26(4), 519-539.
Bindhu, C. M., & Sudheeshkumar, P. K. (2006). Job satisfaction and stress coping
skills of primary school teachers retrived from http://eric.ed.gov/?
id=ED492585 (Eric Document Reproduction Service No. ED 492 585).
Bindhu, C. M., & Sudheeshkumar, P. K. (2006). Job Satisfaction and Stress Coping
Skills of Primary School Teachers. Online Submission.
Blascovich, J., Spencer, S. J., Quinn, D., & Steele, C. (2001). African Americans
and high blood pressure: The role of stereotype threat. Psychological
science, 12(3), 225-229.
Blasé, J. (1982). A social-psychological grounded theory of teacher stress and
burnout. Educational Administration Quarterly, 18(4), 93-113.
Block, C. J., Koch, S. M., Liberman, B. E., Merriweather, T. J., & Roberson, L.
(2011). Contending with stereotype threat at work: A model of long-term
responses 1Ψ7. The Counseling Psychologist, 39(4), 570-600.
Borg, M. G., & Riding, R. J. (1991). Occupational stress and satisfaction in
teaching. British Educational Research Journal, 17(3), 263-281.
Borman, W. C. and Motowidlo, S. J.(1997). Task performance and contextual
performance: The meaning for personnel selection research. Human
Performance, 10(2), 99-109.
Borman, W. C., & Motowidlo, S. M. (1993). Expanding the criterion domain to
include elements of contextual performance. Personnel Selection in
Organizations; San Francisco: Jossey-Bass, 71.
Bourgeois, K. S., & Leary, M. R. (2001). Coping with rejection: Derogating those
who choose us last. Motivation and Emotion, 25(2), 101-111.
Branscombe, N. R., Schmitt, M. T., & Harvey, R. D. (1999). Perceiving pervasive
discrimination among African Americans: implications for group
identification and well-being. Journal of personality and social psychology,
77(1), 135-149.
195
Breuer, Josef, and Sigmund Freud. (1955). Studies on hysteria (Standard Edition),
vol. 2, First German edition, 1895. London: Hogarth Press.
Brown, R. P., & Josephs, R. A. (1999). A burden of proof: Stereotype relevance and
gender differences in math performance. Journal of personality and social
psychology, 76(2), 246-257
Brown, R. P., & Pinel, E. C. (2003). Stigma on my mind: Individual differences in
the experience of stereotype threat. Journal of experimental social
psychology, 39(6), 626-633.
Brown, S. (2005). Good Cope, Bad Cope: Adaptive and Maladaptive Coping
Strategies Following a Critical Negative Work Event. Journal of Applied
Psychology, 90(4), 792–798.
Burke, R. J., & Greenglass, E. (1995). A longitudinal study of psychological burnout
in teachers. Human relations, 48(2), 187-202.
Burnette, J. L., Pollack, J. M., & Hoyt, C. L. (2010). Individual differences in
implicit theories of leadership ability and self‐efficacy: Predicting responses
to stereotype threat. Journal of Leadership Studies, 3(4), 46-56.
Cadinu, M., Maass, A., Frigerio, S., Impagliazzo, L., & Latinotti, S. (2003).
Stereotype threat: The effect of expectancy on performance. European
Journal of Social Psychology, 33(2), 267-285.
Cadinu, M., Maass, A., Rosabianca, A., & Kiesner, J. (2005). Why do women
underperform under stereotype threat? Evidence for the role of negative
thinking. Psychological science, 16(7), 572-578.
Campbell, J. P. (1990). Modeling the performance prediction problem in industrial
and organizational psychology. In: Dunnette MD, Hough LM, eds.
Handbook of Industrial and Organizational Psychology. Palo Alto, CA:
Consulting Psychologists Press; 687–732.
Campbell, A., Converse, P. E., & Rodgers, W. L. (1976). The quality of American
life: Perceptions, evaluations, and satisfactions. Russell Sage Foundation.
196
Campbell, J. P. (1990). Modeling the performance prediction problem in industrial
and organizational psychology.
Carmeli, A., Gilat, G., & Waldman, D. A. (2007). The role of perceived
organizational performance in organizational identification, adjustment and
job performance. Journal of Management Studies, 44(6), 972-992.
Caron, T. (1978a). Happiness and contentment: A reply to Benditt. The Personalist,
59(1), 101-107.
Carruthers, C, & Hood, C. (2004). The power of the positive: Leisure and wellbeing.
Therapeutic Recreation Journal, 38(2), 225-245.
Carson, T. (1978b). Happiness and the good life. The Southwestern Journal of
Philosophy, 9(3), 73-88.
Carson, T. (1981). Happiness, contentment, and the good life. Pacific Philosophical
Quarterly,62(4), 378-392.
Carson, T. L. (1979). Happiness and the good life: A rejoinder to
Mele. Southwestern Journal of Philosophy, 10(2), 189-192.
Chan, D. W. (2008). Emotional intelligence, self‐efficacy, and coping among
Chinese prospective and in‐service teachers in Hong Kong. Educational
Psychology, 28(4), 397-408.
Chandrasekar, K. (2011). Workplace environment and its impact on organisational
performance in public sector organisations. International Journal of
Enterprise Computing and Business Systems, 1(1), 1-19.
Chang, E., & Strunk, D. R. (1999). Dsyphoria: Relations to appraisals, coping and
adjustment. Journal of Counseling Psychology, 46(1), 99-108.
Chang. E. W & Li. H. (2007). Job Performance Dimensions for Improving Final
Project Outcomes. Journal of construction engineering and management,
133(8), 592-599.
197
Cheng, J. N. (2013). The effect of kindergarten principals' leadership behaviors on
teacher work performance. Social Behavior and Personality: an
international journal, 41(2), 251-262.
Cheryan, S., Plaut, V. C., Davies, P. G., & Steele, C. M. (2009). Ambient belonging:
how stereotypical cues impact gender participation in computer science.
Journal of personality and social psychology, 97(6), 1045-1060.
Child, D. (2006). The essentials of factor analysis. A&C Black.
Christopher, J. C. (1999). Situating psychological well-being: Exploring the cultural
roots of its theory and research. Journal of Counseling and Development, 77,
141–152.
Chuan, L. (2012). Exploring the Impact of Flow Experience on Job performance.
The Journal of Global Business Management, 8(2),150-189.
Chung, B. G., Ehrhart, M. G., Holcombe Ehrhart, K., Hattrup, K., & Solamon, J.
(2010). Stereotype threat, state anxiety, and specific self-efficacy as
predictors of promotion exam performance. Group & organization
management, 35(1), 77-107.
Chung, Y. W. (2015). The mediating effects of organizational conflict on the
relationships between workplace ostracism with in-role behavior and
organizational citizenship behavior. International Journal of Conflict
Management, 26(4), 366-385.
Chung, Y. W. (2018). Workplace ostracism and workplace behaviors: A moderated
mediation model of perceived stress and psychological empowerment.
Anxiety, Stress, & Coping, 31(3), 304-317.
Chung‐Herrera, B. G., & Lankau, M. J. (2005). Are we there yet? An assessment of
fit between stereotypes of minority managers and the successful‐manager
prototype. Journal of Applied Social Psychology, 35(10), 2029-2056.
198
Chung-Herrera, B. G., Ehrhart, M. G., Ehrhart, K. H., Hattrup, K., & Solamon, J.
(2005, August). A NEW VISION OF STEREOTYPE THREAT: TESTING
ITS EFFECTS IN A FIELD SETTING. In Academy of Management
Proceedings(Vol. 2005, No. 1, pp. I1-I6). Briarcliff Manor, NY 10510:
Academy of Management.
Churchill Jr, G. A. (1979). A paradigm for developing better measures of marketing
constructs. Journal of marketing research, 16(1), 64-73.
Clark, R., Anderson, N. B., Clark, V. R., & Williams, D. R. (1999). Racism as a
stressor for African Americans: A biopsychosocial model. American
psychologist, 54(10), 805-816.
Colquitt, J. A., Scott, B. A., Judge, T. A., & Shaw, J. C. (2006). Justice and
personality: Using integrative theories to derive moderators of justice effects.
Organizational behavior and human decision processes, 100(1), 110-127.
Comish R, Swindle B(1994). Managing stress in the workplace. National Public
Accountant, 39(9), 24-28.
Compas, B. E., Connor-Smith, J. K., Saltzman, H., Thomsen, A. H., & Wadsworth,
M. E. (2001). Coping with stress during childhood and adolescence:
problems, progress, and potential in theory and research. Psychological
bulletin, 127(1), 87-127
Croizet J. C., Després, G., Gauzins, M. E., Huguet, P., Leyens, J.P., Méot, A.
(2004). Stereotype threat undermines intellectual performance by triggering a
disruptive mental load. Personality and social psychology Bulletin, 30(6),
721-31.
Croizet, J. C., & Claire, T. (1998). Extending the concept of stereotype threat to
social class: The intellectual underperformance of students from low
socioeconomic backgrounds. Personality and Social Psychology Bulletin,
24(6), 588-594.
199
Cropanzano, R., Rupp, D. E., & Byrne, Z. S. (2003). The relationship of emotional
exhaustion to work attitudes, job performance, and organizational citizenship
behaviors. Journal of Applied psychology, 88(1), 160-169
Cullen, M. J., Hardison, C. M., & Sackett, P. R. (2004). Using SAT-grade and
ability-job performance relationships to test predictions derived from
stereotype threat theory. Journal of Applied Psychology, 89(2), 220.
Danaher, K., & Crandall, C. S. (2008). Stereotype threat in applied settings re‐
examined. Journal of Applied Social Psychology, 38(6), 1639-1655.
David, P. (2006). Quality of life “concept, policy and practice. London, Published by
Rutledge, 5.
Davies, P. G., Spencer, S. J., & Steele, C. M. (2005). Clearing the air: identity safety
moderates the effects of stereotype threat on women's leadership
aspirations. Journal of personality and social psychology, 88(2), 276-287
Davies, P. G., Spencer, S. J., Quinn, D. M., & Gerhardstein, R. (2002). Consuming
images: How television commercials that elicit stereotype threat can restrain
women academically and professionally. Personality and Social Psychology
Bulletin, 28(12), 1615-1628.
Davis, W. (1981a). Pleasure and happiness. Philosophical Studies, 39, 305-318.
Davis, W. (1981b). A theory of happiness. American Philosophical Quarterly, 18,
111-120.
De Vellis RF (1991). Scale development: theory and applications. Newbury Park,
CA:Sage.
Deci, E. L., & Ryan, R. M. (2008). Hedonia, eudaimonia, and well-being: An
introduction. Journal of happiness studies, 9(1), 1-11.
Diener, E. (1984). Subjective well-being. Psychological bulletin, 95(3), 542-575
Diener, E., & Larsen, R.J. (1993). The experience of emotional well-being. In M.
Lewis & J.M.
200
Diener, E., Oishi, S., & Lucas, R. E. (2003). Personality, culture, and subjective
well-being: Emotional and cognitive evaluations of life. Annual Review of
Psychology, 54, 403 – 425.
Diener, E., Oishi, S., & Lucas, R. E. (2009). Subjective wellbeing: The science of
happiness and life satisfaction. In C. R. Snyder & S. J. Lopez (Eds.), Oxford
handbook of positive psychology (pp. 187-194). Oxford, UK: Oxford
University Press.
Duffy, M. K., Ganster, D. C., & Pagon, M. (2002). Social undermining in the
workplace. Academy of management Journal, 45(2), 331-351.
Durrah, O. (2016). The Impact of the Psychological Capital on Job Performance: A
Case Study on Faculty Members at Philadelphia University. International
Review of Management and Marketing, 6(2), 183-191.
Eisenberg, N., Fabes, R. A., & Guthrie, I. K. (1997). Coping with stress.
In Handbook of children’s coping (pp. 41-70). Springer, Boston, MA.
Eisenberger, N. I., Lieberman, M. D., & Williams, K. D. (2003). Does rejection
hurt? An fMRI study of social exclusion. Science, 302(5643), 290-292.
Ellemers, N., Doosje, B., & Spears, R. (2004). Sources of respect: The effects of
being liked by ingroups and outgroups. European Journal of Social
Psychology, 34(2), 155-172.
Ely, R. J. (1995). The power in demography: Women's social constructions of
gender identity at work. Academy of Management journal, 38(3), 589-634.
Endler, N. S., & Parker, J. D. (1990). Multidimensional assessment of coping: A
critical evaluation. Journal of personality and social psychology, 58(5), 844-
854
Eysenck, M. W., & Calvo, M. G. (1992). Anxiety and performance: The processing
efficiency theory. Cognition & Emotion, 6(6), 409-434.
Ferris, D. L., Brown, D. J., Berry, J. W., & Lian, H. (2008). The development and
validation of the workplace ostracism scale. Journal of Applied Psychology,
93(6), 1348-1366.
201
Field, A. (2009). Discovering statistics using SPSS. Sage publications.
Finney, S. J., & DiStefano, C. (2006). Non-normal and categorical data in structural
equation modeling. Structural equation modeling: A second course, 10(6),
269-314.
Folkman, S., & R. S. (1980). An analysis of coping in a middle-aged community
sample. Journal of Health and Social Behaviour, 21(4), 219-239.
Forbes, C. E., Schmader, T., Allen, J. J. (2008). The role of devaluing and
discounting in performance monitoring: a neurophysiological study of
minorities under threat. Social Cognitive and Affective Neuroscience, 3(3),
253–61.
Ford, T. E., Ferguson, M. A., Brooks, J. L., & Hagadone, K. M. (2004). Coping
sense of humor reduces effects of stereotype threat on women’s math
performance. Personality and Social Psychology Bulletin, 30(5), 643-653.
Fredrickson, B. L. (1998). What good are positive emotions?. Review of general
psychology, 2(3), 300-319.
Fredrickson, B. L. (2001). The role of positive emotions in positive psychology: The
broaden-and-build theory of positive emotions. American psychologist,
56(3), 218.
Fredrickson, B. L., & Joiner, T. (2002). Positive emotions trigger upward spirals
toward emotional well-being. Psychological science, 13(2), 172-175.
Fu, W., & Deshpande, S. P. (2014). The impact of caring climate, job satisfaction,
and organizational commitment on job performance of employees in a
China’s insurance company. Journal of Business Ethics, 124(2), 339-349.
Fulvio, G. (2016) The Mediating Roles of Strain Facets and Coping Strategies in
Translating Techno-Stressors into Adverse Job Outcomes. Journal of Risk
and Uncertainty, 5(4), 297-323.
G., & Leary, M. R. (2005). Why does social exclusion hurt? The relationship
between social and physical pain. Psychological bulletin, 131(2), 202-223.
202
Gakhar, K., & Kour, H. (2012). Scenario of Present Education System: A
Comparative Study of Haryana and its Neighbouring States. International
Journal of Social Science & Interdisciplinary Research, 1(8), 95–110.
Galdi, S., Cadinu, M., & Tomasetto, C. (2014). The roots of stereotype threat: When
automatic associations disrupt girls' math performance. Child development,
85(1), 250-263.
Gardner, W. L., Pickett, C. L., & Brewer, M. B. (2000). Social exclusion and
selective memory: How the need to belong influences memory for social
events. Personality and Social Psychology Bulletin, 26(4), 486-496.
Gautheir, D. P. (1967). Progress and happiness: A utilitarian consideration. Ethics,
78, 77-82.
George, D., & Mallery, M. (2010). SPSS for Windows Step by Step: A Simple Guide
and Reference, 17.0, Boston: Pearson.
Geving, A. M. (2007). Identifying the types of student and teacher behaviours
associated with teacher stress. Teaching and Teacher Education, 23(5), 624-
640.
Goleman, D. (2006). Emotional intelligence. Bantam.
Gonzales, P. M., Blanton, H., & Williams, K. J. (2002). The effects of stereotype
threat and double-minority status on the test performance of Latino
women. Personality and social psychology bulletin, 28(5), 659-670.
Good, C., Aronson, J., & Harder, J. A. (2008). Problems in the pipeline: Stereotype
threat and women's achievement in high-level math courses. Journal of
applied developmental psychology, 29(1), 17-28.
Graf, E. R. (1993). Relationship of external-rated job performance to nurse self-
perceived performance and self-competence.
Grand, J. A., Ryan, A. M., Schmitt, N., & Hmurovic, J. (2010). How far does
stereotype threat reach? The potential detriment of face validity in cognitive
ability testing. Human Performance, 24(1), 1-28.
203
Greenglass, E. R., Burke, R. J., & Konarski, R. (1997). The impact of social support
on the development of burnout in teachers: Examination of a model. Work &
Stress, 11(3), 267-278.
Griffin, B., & Hesketh, B. (2003). Adaptable behaviours for successful work and
career adjustment. Australian Journal of psychology, 55(2), 65-73.
Griffin, J. (1986). Well-being: Its meaning, measurement, and moral importance.
Oxford, UK: Clarendon Press.
Griffin, R. W. (2012). Management. Mason, USA: South-Western College Pub.
Griffith, J., Steptoe, A., & Cropley, M. (1999). An investigation of coping strategies
associated with job stress in teachers. British Journal of Educational
Psychology, 69(4), 517-531.
Gruman, J. A., Schneider, F. W., & Coutts, L. M. (Eds.). (2016). Applied Social
Psychology: Understanding and Addressing Social and Practical Problems.
SAGE Publications.
Gulwadi, G. B. (2006). Seeking restorative experiences: Elementary school teachers'
choices for places that enable coping with stress. Environment and
Behavior, 38(4), 503-520.
Gupta, V. K., & Bhawe, N. M. (2007). The influence of proactive personality and
stereotype threat on women's entrepreneurial intentions. Journal of
Leadership & Organizational Studies, 13(4), 73-85.
Hall, J. (2014) Job-Preference and Job-Matching Assessment Results and Their
Association with Job Performance and Satisfaction among Young Adults
with Developmental Disabilities. Education and Training in Autism and
Developmental Disabilities,49(2), 301–312.
Hall, W. M., Schmader, T., & Croft, E. (2015). Engineering exchanges: Daily social
identity threat predicts burnout among female engineers. Social
Psychological and Personality Science, 6(5), 528-534.

204
Halsey, A. H., Heath, A. F., & Ridge, J. M. (1980). Origins and destination. Oxford:
Clarendon Press
Hanzaee, K., & Mirvaisi, M. (2013). A survey on impact of emotional intelligence,
organizational citizenship behaviors and job satisfaction on employees’
performance in Iranian hotel industry. Management Science Letters, 3(5),
1395-1402.
Haq, I. U. (2014, June). Workplace ostracism and job outcomes: Moderating effects
of psychological capital. In Human capital without borders: Knowledge and
learning for quality of life: Proceedings of the management, knowledge and
learning international conference 2014 (pp. 1309-1323).
Haviland (Eds.), Handbook of emotions (pp. 405-415). New York: Guilford.
Haybron, D. M. (2000). “Two Philosophical Problems in the Study of Happiness”.
The Journal of Happiness Studies, 1(2), 207–225.
Heaphy, E. D., & Dutton, J. E. (2008). Positive social interactions and the human
body at work: Linking organizations and physiology. Academy of
Management Review, 33(1), 137-162.
Heilman, M. E., Block, C. J., Martell, R. F., & Simon, M. C. (1989). Has anything
changed? Current characterizations of men, women, and managers. Journal
of applied psychology, 74(6), 935-942
Hemmings, B., & Hockley, T. (2002). Student teacher stress and coping
mechanisms. Education in Rural Australia, 12(2), 25-35.
Hepbum, A., and Brown, S. (2001). Teacher stress and management of
accountability. Human Relations, 54(6), 691-715.
Hersen, M., Haynes, S. N., Goldstein, G., Heiby, E. M., Hilsenroth, M. J., Beers, S.
R., ... & Thomas, J. C. (Eds.). (2004). Comprehensive Handbook of
Psychological Assessment, Volume 3: Behavioral Assessment (Vol. 3). John
Wiley & Sons.

205
Hershcovis, M. S., & Barling, J. (2007). 16 Towards a relational model of
workplace aggression. Research companion to the dysfunctional workplace:
Management challenges and symptoms, 268.
Hewett, R., Liefooghe, A., Visockaite, G., & Roongrerngsuke, S. (2018). Bullying at
work: Cognitive appraisal of negative acts, coping, wellbeing, and
performance. Journal of occupational health psychology, 23(1), 71.
Hill, K. T., & Wigfield, A. (1984). Test anxiety: A major educational problem and
what can be done about it. The Elementary School Journal, 85(1), 105-126.
Hiltan, R.H & Cliffton, R. J.(2006). Perceived Exclusion in the Workplace: The
Moderating Effects of Gender on Work- Related Attitudes and Psychological
Health. North American Journal of Psychology, 8(2), 217-236.
Hitlan, R. T., Kelly, K. M., Schepman, S., Schneider, K. T., & Zárate, M. A. (2006).
Language exclusion and the consequences of perceived ostracism in the
workplace. Group Dynamics: Theory, Research, and Practice, 10(1), 56-70
Hoff, K. & Pandey, P. (2004). Beliefs systems and durable inequalities: An
experimental investigation of Indian caste. World Bank Policy Research
Working Paper #3351. Reterived http://community.eldis.org/webx?50@
Hoff, K., & Pandey, P. (2004). Belief systems and durable inequalities: An
experimental investigation of Indian caste. The World Bank.
Holahan, C. J., & Moos, R. H. (1987). Risk, resistance, and psychological distress: a
longitudinal analysis with adults and children. Journal of abnormal
psychology, 96(1), 3-13
Hoyt, C. L., & Murphy, S. E. (2016). Managing to clear the air: Stereotype threat,
women, and leadership. The Leadership Quarterly, 27(3), 387-399.
Hu, Z., Jiang, Y., & Li, Q. (2015). The Confirmatory Factor Analysis of Secondary
School Teachers’ Contextual Performance Structure in Mainland China.
Psychology, 6(9), 1077-1085.
206
Huta, V. (2016). An overview of hedonic and eudaimonic well-being
concepts. Handbook of media use and well-being: International perspectives
on theory and research on positive media effects, 14-33.
Impelman, K. (2007). How does personality relate to contextual performance,
turnover, and customer service?. University of North Texas.
In Monat, A., & Lazarus, R. S. (1977). Stress and Coping,· New York.
Inzlicht, M., & Ben-Zeev, T. (2000). A threatening intellectual environment: Why
females are susceptible to experiencing problem-solving deficits in the
presence of males. Psychological Science, 11(5), 365-371.
Inzlicht, M., Aronson, J., Good, C., & McKay, L. (2006). A particular resiliency to
threatening environments. Journal of Experimental Social Psychology, 42(3),
323-336.
Inzlicht, M., McKay, L., & Aronson, J. (2006). Stigma as ego depletion: How being
the target of prejudice affects self-control. Psychological Science, 17(3),
262-269.
Irwandy (2014) Assessing the Role of Motivation on Teacher Performance: Case
Study in Indonesia. International Journal of Education & Literacy Studies,
2(2), 2202-9478.
Jamal, M., & Baba, V. V. (2001). Type-A behavior, job performance, and well-
being in college teachers. International journal of stress management, 8(3),
231-240.
Jamieson, J. P., & Harkins, S. G. (2007). Mere effort and stereotype threat
performance effects. Journal of personality and social psychology, 93(4),
544-564
Jankingthong (2001). Factors Affecting Job Performance: A Review of Literature.
Journal of Social Sciences, Humanities, and Arts, 12 (2), 115-127.
Janseen,O. (2004). Employees’ goal orientations, the quality of Leader-member
exchange, and the outcomes of job Performance and job satisfaction.
Academy of Management Journal, 47(3) 368–384.

207
Jantine L. Spilt, Helma M.Y. Koomen, Jochem T. Thijis (2011). Teachers
wellbeing: The importance of teacher student relationships. Educational
Psycholgy Review, 20(1),
Jennings, J. (2007). Work-family interface experiences and coping strategies:
implications for entrepreneurship research and practice. Academy of
Management Review, 32(3), 747-760
Jex, S. M. (2002).Organizational Psychology: A Scientist- Practioner Approach.
John Wiley & Sons, New York.
Jing, L. (2008). Faculty’s job stress and performance in the undergraduate education
assessment in China: A mixed-methods study. Educational Research and
Review,3 (9), 294-300.
Johns, M., Inzlicht, M., Schmader, T. (2008). Stereotype threat and executive
resource depletion:examining the influence of emotion regulation. Journal of
Experimental Psychology: General, 137(4), 691–705.
Jordan, A. H., & Lovett, B. J. (2007). Stereotype threat and test performance: A
primer for school psychologists. Journal of School Psychology, 45(1), 45-59.
Joshanloo, M. (2011). Investigation of the contribution of spirituality and
religiousness to hedonic and eudaimonic well-being in Iranian young adults.
Journal of Happiness Studies, 12(6), 915-930.
Joshanloo, M., Capone, V., Petrillo, G., & Caso, D. (2017). Discriminant validity of
hedonic, social, and psychological well-being in two Italian samples.
Personality and Individual Differences, 109, 23-27.
Kahneman, D., and Deaton, A. (2010). High income improves evaluation of life but
not emotional well-being. Psychology and cognitive Sciences, 107(38),
16489-16493.
Kapuscinski, A. N., & Masters, K. S. (2010). The current status of measures of
spirituality: a critical review of scale development. Psychology of Religion
and Spirituality, 2(4), 191–205.
208
Kashdan, T. B., Uswatte, G., & Julian, T. (2006). Gratitude and hedonic and
eudaimonic well-being in Vietnam war veterans. Behaviour Research and
Therapy, 44(2), 177-199.
Katz, D., & Braly, K. (1933). Racial stereotypes of one hundred college
students. The Journal of Abnormal and Social Psychology, 28(3), 280-290
Katz, I., & Greenbaum, C. (1963). Effects of anxiety, threat, and racial environment
on task performance of Negro college students. The Journal of Abnormal
and Social Psychology, 66(6), 562.
Keller, J. (2002). Blatant stereotype threat and women's math performance: Self-
handicapping as a strategic means to cope with obtrusive negative
performance expectations. Sex Roles, 47(3-4), 193-198.
Keller, J., & Dauenheimer, D. (2003). Stereotype threat in the classroom: Dejection
mediates the disrupting threat effect on women’s math performance.
Personality and Social Psychology Bulletin, 29(3), 371-381.
Kellow, J. T., & Jones, B. D. (2008). The effects of stereotypes on the achievement
gap: Reexamining the academic performance of African American high
school students. Journal of Black Psychology, 34(1), 94-120.
Keyes, C. L., Shmotkin, D., & Ryff, C. D. (2002). Optimizing well-being: the
empirical encounter of two traditions. Journal of personality and social
psychology, 82(6), 1007.
Khan, A. (2016). A Study on Dynamic Links between Resources, Work Engagement
and Job Performance in Academia of Pakistan. International Review of
Management and Marketing, 6(3), 544-550.
King, E. B., Hebl, M. R., George, J. M., & Matusik, S. F. (2010). Understanding
tokenism: Antecedents and consequences of a psychological climate of
gender inequity. Journal of Management, 36(2), 482-510.
Kokkinos, C. M. (2007). Job stressors, personality and burnout in primary school
teachers. British journal of educational psychology, 77(1), 229-243.
209
Koopmans, L., Bernaards, C. M., Hildebrandt, V. H., Van Buuren, S., Van der Beek,
A. J., & De Vet, H. C. (2014). Improving the individual work performance
questionnaire using rasch analysis. Journal of applied measurement, 15(2),
160-175.
Krendl, A.C., Richeson, J.A., Kelley, W.M., Heatherton, T.F. (2008). The negative
consequences of threat: a functional magnetic resonance imaging
investigation of the neural mechanisms underlying women’s under
performance in math. Psychological Science, 19(2), 168–75.
Kuiper, N. A., Martin, R. A., & Olinger, L. J. (1993). Coping humor, stress, and
cognitive appraisals. Canadian Journal of Behavioural Science, 25 (1), 81–
96
Kyriacou, C., & Chien, P. Y. (2009). Teacher stress in Taiwanese primary
schools. The Journal of Educational Enquiry, 5(2), 86-104
Laar, C. V., Levin, S., & Sinclair, S. (2008). Social identity and personal identity
stereotype threat: The case of affirmative action. Basic and Applied Social
Psychology, 30(4), 295-310.
Lazarus, R.S. (1984). Folkman S. Stress, appraisal, and coping. New York: Springer.
Lazarus, R. S. (1966). Psychological stress and the coping process. New York:
McGraw-Hill.
Lazarus, R. S., & Folkman, S. (1987). Transactional theory and research on
emotions and coping. European Journal of personality, 1(3), 141-169.
Leary, M. R. (Ed.). (2001). Interpersonal rejection. Oxford University Press.
Leary, M. R., Koch, E. J., & Hechenbleikner, N. R. (2001). Emotional responses to
interpersonal rejection. In M.R. Leary (Ed.), Interpersonal Rejection. New
York: Oxford University Press.
Lee, K., & Allen, N. J. (2002). Organizational citizenship behavior and workplace
deviance: The role of affect and cognitions. Journal of applied
psychology, 87(1), 131-142
210
Lee, Y. T., & Ottati, V. (1995). Perceived in-group homogeneity as a function of
group membership salience and stereotype threat. Personality and Social
Psychology Bulletin, 21(6), 610-619.
Levy, B. (1996). Improving memory in old age through implicit self-
stereotyping. Journal of personality and social psychology, 71(6), 1092.
Li, L., Ai, H., Gao, L., Zhou, H., Liu, X., Zhang, Z., ... & Fan, L. (2017).
Moderating effects of coping on work stress and job performance for nurses
in tertiary hospitals: a cross-sectional survey in China. BMC health services
research, 17(1), 401.
Lin, C. W., Chen, S. L., & Wang, R. Y. (2011). Savouring and perceived job
performance in positive psychology: Moderating role of positive
affectivity. Asian Journal of Social Psychology, 14(3), 165-175.
Lindsay, B. C., 1995. Educational Management. New York: McGraw Hill Books
Co.
Lipmann, W. (1922). Public Opinion. Harcourt, Brace, Jovanovich, New York.
Lockwood, C. M., & MacKinnon, D. P. (1998, March). Bootstrapping the standard
error of the mediated effect. In Proceedings of the 23rd annual meeting of
SAS Users Group International (pp. 997-1002).
Logel, C., Walton, G. M., Spencer, S. J., Iserman, E. C., von Hippel, W., & Bell, A.
E. (2009). Interacting with sexist men triggers social identity threat among
female engineers. Journal of personality and social psychology, 96(6), 1089-
1103
Lord, C. G., & Saenz, D. S. (1985). Memory deficits and memory surfeits:
differential cognitive consequences of tokenism for tokens and observers.
Journal of Personality and Social Psychology, 49(4), 918-26.
Lu, L., Kao, S. F., Siu, O. L., & Lu, C. Q. (2010). Work stressors, Chinese coping
strategies, and job performance in Greater China. International Journal of
Psychology, 45(4), 294-302.

211
Lui, S. S., Ngo, H. Y., & Tsang, A. W. N. (2003). Socialized to be a Professional: A
Study of the Professionalism of Accountants in Hong Kong. International
Journal of Human Resource Management, 14(7), 1192-1205.
Lundy, L. (2018). In defence of tokenism? Implementing children’s right to
participate in collective decision-making. Childhood, 25(3), 340-354.
Luthan, F., Youssef, C.M., Avolio, B.J. (2007). Psychological capital. New York:
Oxford University Press.
Luthans, F. (2002). The need for and meaning of positive organizational
behavior. Journal of Organizational Behavior: The International Journal of
Industrial, Occupational and Organizational Psychology and Behavior,
23(6), 695-706.
Luthans, F., & Stajkovic, A. D. (1999). Reinforce for performance: The need to go
beyond pay and even rewards. Academy of Management Perspectives, 13(2),
49-57.
Luthans, F., & Youssef, C. M. (2007). Emerging positive organizational behavior.
Journal of management, 33(3), 321-349.
Luthans, F., Avolio, B. J., Avey, J. B., & Norman, S. M. (2007). Positive
psychological capital: Measurement and relationship with performance and
satisfaction. Personnel psychology, 60(3), 541-572.
Luthans, F., Youssef, C. M., & Avolio, B. J. (2007). Psychological capital:
Developing the human competitive edge.
Lyubomirsky, S., & Lepper, H. S. (1999). A measure of subjective happiness:
Preliminary reliability and construct validation. Social indicators research,
46(2), 137-155.
MacGregor, D. (1960). The human side of enterprise (Vol. 21, No. 166-171).
McGraw‐Hill: New York.
MacKinnon, D. P., Lockwood, C. M., Hoffman, J. M., West, S. G., & Sheets, V.
(2002). A comparison of methods to test mediation and other intervening
variable effects. Psychological methods, 7(1), 83.

212
Major, B., & O’ Brien, L. T. (2005). The social psychology of stigma. Annual
Review of Psychology, 56, 393-421.
Major, B., Gramzow, R. H., McCoy, S. K., Levin, S., Schmader, T., & Sidanius, J.
(2002). Perceiving personal discrimination: the role of group status and
legitimizing ideology. Journal of personality and social psychology, 82(3),
269.
Major, B., Quinton, W. J., McCoy, S. K., & Schmader, T. (2000). 10 Reducing
Prejudice: The Target's Perspective. Reducing prejudice and discrimination,
16, 211.
Major, B., Quinton, W. J., McCoy, S. K., & Schmader, T. (2000). Reducing
prejudice: The target’s perspective. In S. Oskamp (Ed.), Reducing prejudice
and discrimination (pp. 211–238). Mahwah, NJ: Erlbaum
Mangels, J. A., Good, C., Whiteman, R. C., Maniscalco, B., & Dweck, C. S. (2011).
Emotion blocks the path to learning under stereotype threat. Social Cognitive
and Affective Neuroscience, 7(2), 230-241.
Manjula, C. (2012). A study on personality factors causing stress among school
teachers. Language in India, 12(2), 1-79.
Martínez-Mesa, J., González-Chica, D. A., Duquia, R. P., Bonamigo, R. R., &
Bastos, J. L. (2016). Sampling: how to select participants in my research
study?. Anais brasileiros de dermatologia, 91(3), 326-330.
Marx, D. M., & Roman, J. S. (2002). Female role models: Protecting women’s math
test performance. Personality and Social Psychology Bulletin, 28(9), 1183-
1193.
Mayerfeld, J. (1996). The moral asymmetry of happiness and suffering. The
Southern journal of philosophy, 34(3), 317-338.
Mayerfeld, J. (1999). Suffering and moral responsibility. Oxford University Press on
Demand.
213
Mc Gregor, D. (2006). “The Human Side of Enterprise”, McGraw-Hill, 1960;
annotated edn, McGrawHill.
McGregor, D. (1966). Leadership and motivation.
Mckay, E. (2008). For refreshment and preservinge health-the definition and
function of recreation in early modern England. Historical Research,
81(211), 52–74.
McKown, C., & Weinstein, R. S. (2003). The development and consequences of
stereotype consciousness in middle childhood. Child development, 74(2),
498-515.
Meindl, J. R., 1995. The romance of leadership as follower - centric – theory: a
social constructionist approach. Leadership Quart. 6(3), 330-331.
Milkovich, G. T., & Wigdor, A. K. (1991). Pay for performance: Evaluating
performance appraisal and merit pay. National Academy Press.
Miller, C. T., & Kaiser, C. R. (2001). A theoretical perspective on coping with
stigma. Journal of social issues, 57(1), 73-92.
Montgomery, C., & Rupp, A. A. (2005). A meta-analysis for exploring the diverse
causes and effects of stress in teachers. Canadian Journal of Education/
Revue canadienne de l'éducation, 458-486.
Muindi, F. (2015) quality of work life, personality, job Satisfaction, competence,
and job Performance: a critical review of Literature. European Scientific
Journal,11(26),1857 – 7881.
Murphy, K. R. (1990). Job performance and productivity. In: Murphy KR, Saal FE,
eds.
Murphy, K. R. (1989). Dimensions of job performance. In: Dillon RF, Pellegrino
JW, eds. Testing: Theoritical and Applied Perspective. New York: Praeger;
218-247.

214
Nelson, S. K., Fuller, J. A., Choi, I., & Lyubomirsky, S. (2014). Beyond self-
protection: Self-affirmation benefits hedonic and eudaimonic well-
being. Personality and Social Psychology Bulletin, 40(8), 998-1011.
Neuman, J. H., & Baron, R. A. (1998). Workplace violence and workplace
aggression: Evidence concerning specific forms, potential causes, and
preferred targets. Journal of management, 24(3), 391-419.
Neuville, E., & Croizet, J. C. (2007). Can salience of gender identity impair math
performance among 7–8 years old girls? The moderating role of task
difficulty. European Journal of Psychology of Education, 22(3), 307.
Nguyen, H. H. D., & Ryan, A. M. (2008). Does stereotype threat affect test
performance of minorities and women? A meta-analysis of experimental
evidence. Journal of applied psychology, 93(6), 1314.
Niemann, Y. F. (1999). The making of a token: A case study of stereotype threat,
stigma, racism, and tokenism in academe. Frontiers: A Journal of Women
Studies, 20(1), 111-134.
Nonis, S. A., & Sager, J. K. (2003). Coping strategy profiles used by salespeople:
Their relationships with personal characteristics and work outcomes. Journal
of Personal Selling & Sales Management, 23(2), 139-150.
Nozick, R. (1989). The Examined Life (New York, Touchstone).
Obilade, S. O. (1999). Leadership qualities and styles as they relate to instructional
productivity. The Manager Ibadan: Department of Educational
Management, University of Ibadan, 25-32.
O'Brien, L. T., & Crandall, C. S. (2003). Stereotype threat and arousal: Effects on
women's math performance. Personality and Social Psychology Bulletin,
29(6), 782-789.
Ocloo, J., & Matthews, R. (2016). From tokenism to empowerment: progressing
patient and public involvement in healthcare improvement. BMJ Qual
Saf, 25(8), 626-632.

215
Okeniyi, C. M. (1995). Relationship between leadership problems and school
performance in Oyo State secondary schools. Unpublished. M. ed. Thesis
University of Ibadan, 57-82.
Okunola, F. A. (1990). Motivation: The worker force in a depressed economy: A
chief executives perspective. Nigerian Journal of Personnel Studies, 4(1),
54-65.
Olaniyan, A. O. (1999). Principal Preparation, Selection and Leadership Roles”
Teachers and Teaching in Nigeria. Benin: Festa Press Ltd.
Olumade, A. (2015). The relationship between gender, Stress and job performance
among Academic staff in tertiary Institutions in anambra state, Nigeria.
European Scientific Journal 11(34),1857 – 7881.
O'REILLY, J. A. N. E., & ROBINSON, S. L. (2009, August). The negative impact
of ostracism on thwarted belongingness and workplace contributions. In
Academy of management proceedings (Vol. 2009, No. 1, pp. 1-7). Briarcliff
Manor, NY 10510: Academy of Management.
Osborne, J. W. (2006). Gender, stereotype threat and anxiety: Psychophysiological
and cognitive evidence. Journal of Research in Educational Psychology,
4(1), 109-138.
Osborne, J. W. (2007). Linking stereotype threat and anxiety. Educational
psychology, 27(1), 135-154.
Osipow, S. H., & Spokane, A. R. (1998). Occupational stress inventory-
revised. Odessa, FL: Psychological, 1-15.
Pascoe, E. A., & Smart Richman, L. (2009). Perceived discrimination and health: a
meta-analytic review. Psychological bulletin, 135(4), 531-554
Pennington, C. R., Heim, D., Levy, A. R., & Larkin, D. T. (2016). Twenty years of
stereotype threat research: A review of psychological mediators. PLOS
one, 11(1), e0146487.

216
Peretemode, V. F. (1996). Education Administrations Applied Concepts and
Theoretical Perspective. Lagos, Joja. Edu. Res., pp. 36-50.
Por, J., Barriball, L., Fitzpatrick, J., & Roberts, J. (2011). Emotional intelligence: Its
relationship to stress, coping, well-being and professional performance in
nursing students. Nurse education today, 31(8), 855-860.
Prasad, A. (2011). Stereotype threat in India: Gender and leadership choices.
Journal of Psychological Issues in Organizational Culture, 2(3), 6-21.
Purdie-Vaughns, V., Steele, C. M., Davies, P. G., Ditlmann, R., & Crosby, J. R.
(2008). Social identity contingencies: how diversity cues signal threat or
safety for African Americans in mainstream institutions. Journal of
personality and social psychology, 94(4), 615-630
Pyszczynski, T., Greenberg, J., Solomon, S., Arndt, J., & Schimel, J. (2004). Why
do people need self-esteem? A theoretical and empirical review.
Psychological bulletin, 130(3), 435-468
Quinn, D. M., & Spencer, S. J. (2001). The interference of stereotype threat with
women's generation of mathematical problem‐solving strategies. Journal of
social issues, 57(1), 55-71.
Rabenu, E., Yaniv, E., & Elizur, D. (2017). The relationship between psychological
capital, coping with stress, well-being, and performance. Current
Psychology, 36(4), 875-887.
Raman, P., Sambasivan, M., & Kumar, N. (2016). Counterproductive work behavior
among frontline government employees: Role of personality, emotional
intelligence, affectivity, emotional labor, and emotional exhaustion. Revista
de Psicología del Trabajo y de las Organizaciones, 32(1), 25-37.
Rebecca, H. (2014). Bullying at Work: Cognitive Appraisal of Negative Acts,
Coping, Wellbeing and Performance. Journal of Occupational Health
Psychology, 19, 477-521
217
Rescher, N. (1972). Welfare: The social issues in philosophical perspective.
University of Pittsburgh Pre.
Roberson, L., & Kulik, C. T. (2007). Stereotype threat at work. Academy of
Management Perspectives, 21(2), 24-40.
Roberson, L., Deitch, E. A., Brief, A. P., & Block, C. J. (2003). Stereotype threat
and feedback seeking in the workplace. Journal of Vocational Behavior,
62(1), 176-188.
Robinson, S. L., O’Reilly, J., & Wang, W. (2013). Invisible at work: An integrated
model of workplace ostracism. Journal of Management, 39(1), 203-231.
Romero-Canyas, R., Downey, G., Reddy, K. S., Rodriguez, S., Cavanaugh, T. J., &
Pelayo, R. (2010). Paying to belong: When does rejection trigger
ingratiation?. Journal of personality and social psychology, 99(5), 802-23
Roth, L. M. (2004). The social psychology of tokenism: Status and homophily
processes on Wall Street. Sociological Perspectives, 47(2), 189-214.
Rothmann, S. (2003). The big five personality dimensions and job performance.
Journal of Industrial Psychology, 29 (1), 68-74.
Rotundo, M. & Sackett, P. R. (2002). The relative importance of Task, Citizenship,
and Counterproductive Performance to Global Ratings of Job Performance:
A Policy capturing Approach. Journal of Applied Psychology, 87(1), 66-80.
Rubin, K. H., Chen, X., & Hymel, S. (1993). Socioemotional characteristics of
withdrawn and aggressive children. Merrill-Palmer Quarterly (1982-), 518-
534.
Rummel, R.J. (1970). Applied factor analysis. Evanston, IL: Northwestern
University Press.
Ruth, G. (1992). Relationship of external-rated job performance to nurse self-
perceived performance and self-competence. A dissertation submitted in
partial fulfillment of the requirements for the degree of Doctor of Philosophy
at Virginia Commonwealth University.
218
Ryan, R. M., & Deci, E. L. (2001). On happiness and human potentials: A review of
research on hedonic and eudaimonic well-being. Annual review of
psychology, 52(1), 141-166.
S., & Stallworth, L. E. (2005). Racial/ethnic bullying: Exploring links between
bullying and racism in the US workplace. Journal of Vocational Behavior,
66(3), 438-456.
Saetang, J. (2010). Factors Affecting Perceived Job Performance among Staff: A
Case Study of Ban Karuna Juvenile Vocational Training Centre for Boys.
The Journal of Behavioral Science, 5(1), 33-45.
Saka, K. (2014). An Assessment of the Levels of Job Motivation and Satisfaction as
Predictors of Job Performance of Library Personnel in Nigerian Universities.
Journal of Balkan Libraries Union 2(2), 26-33.
Salvy, S. J., Bowker, J. C., Nitecki, L. A., Kluczynski, M. A., Germeroth, L. J., &
Roemmich, J. N. (2011). Effects of ostracism and social connection-related
activities on adolescents' motivation to eat and energy intake. Journal of
pediatric psychology, 37(1), 23-32.
Schaufeli, W. B., Bakker, A. B., Van der Heijden, Frank MMA, & Prins, J. T.
(2009). Workaholism, burnout and well-being among junior doctors: The
mediating role of role conflict. Work & Stress, 23(2), 155-172.
Schmader, T. (2002). Gender identification moderates stereotype threat effects on
women's math performance. Journal of Experimental Social Psychology,
38(2), 194-201.
Schmader, T., & Johns, M. (2003). Converging evidence that stereotype threat
reduces working memory capacity. Journal of personality and social
psychology, 85(3), 440-452
Schmader, T., Johns, M., & Forbes, C. (2008). An integrated process model of
stereotype threat effects on performance. Psychological review, 115(2), 336-
356
219
Schmader, T., Johns, M., & Forbes, C. (2008). An integrated process model of
stereotype threat effects on performance. Psychological review, 115(2), 336-
356
Schmitt & W. C. Borman, eds), pp. 71-98. San Francisco: Jossey-Bass.
Schmitt, M. T., & Branscombe, N. R. (2002b). The internal and external causal loci
of attributions to prejudice. Personality and Social Psychology Bulletin,
28(5), 620-628.
Schmitt, M. T., Branscombe, N. R., Kobrynowicz, D., & Owen, S. (2002).
Perceiving discrimination against one’s gender group has different
implications for well-being in women and men. Personality and Social
Psychology Bulletin, 28(2), 197-210.
Schneider, F. W., Gruman, J. A., & Coutts, L. M. (2012). Applied Social Psycholgy:
Understanding and Addressing Social and Practical Problems (2nd ed.).
California: Sage Publicationss.
Schwab, D. P. (1980). Construct validity in organizational behavior. Research in
Organizational Behaviour, 2, 3-43.
Scott, E. K. (2005). Beyond tokenism: The making of racially diverse feminist
organizations. Social problems, 52(2), 232-254.
Seibt, B., & Förster, J. (2004). Stereotype threat and performance: How self-
stereotypes influence processing by inducing regulatory foci. Journal of
personality and social psychology, 87(1), 38-56
Sekaquaptewa, D., & Thompson, M. (2002). The differential effects of solo status
on members of high-and low-status groups. Personality and Social
Psychology Bulletin, 28(5), 694-707.
Sekaquaptewa, D., & Thompson, M. (2003). Solo status, stereotype threat, and
performance expectancies: Their effects on women’s performance. Journal
of Experimental Social Psychology, 39(1), 68-74

220
Selamat, et al. (2013). The impact of organizational climate on teachers
job performance. Educational Research, 2(1). Retrieved from:
http://www.erej.ua.es/rdd/article/view/51/39.
Seligman, M. E. P. (2002). Authentic happiness: Using the new positive psychology
to realize your potential for lasting fulfilment. New York: The Free Press.
Sen, A. (1987). Commodities and Capabilities. New York: Oxford University Press.
Shapiro, J. R., & Neuberg, S. L. (2007). From stereotype threat to stereotype threats:
Implications of a multi-threat framework for causes, moderators, mediators,
consequences, and interventions. Personality and Social Psychology Review,
11(2), 107-130.
Shih, M., Pittinsky, T. L., & Ambady, N. (1999). Stereotype susceptibility: Identity
salience and shifts in quantitative performance. Psychological science, 10(1),
80-83.
Shimazu, A., Schaufeli, W. B., & Taris, T. W. (2010). How does workaholism affect
worker health and performance? The mediating role of coping. International
journal of behavioral medicine, 17(2), 154-160.
Sirgy, M. J. (2012). The psychology of quality of life: Hedonic well-being, life
satisfaction, and eudaimonia (Vol. 50). Springer Science & Business Media.
Sirgy, M. J., & Wu, J. (2009). The pleasant life, the engaged life, and the meaningful
life: What about the balanced life?. Journal of Happiness Studies, 10(2),
183-196.
Skinner, E. A. (1999). Action regulation, coping, and development. In J. B.
Brandtstädter & R. M. Lerner (Eds.). Action and self-development (pp. 465–
503). Thousand Oaks, CA: Sage.
Skinner, E. A., & Zimmer-Gembeck, M. J. (2007). The development of coping.
Annual Review of Psychology, 58, 119–144
Skinner, E. A., & Zimmer‐Gembeck, M. J. (2009). Challenges to the developmental
study of coping. New directions for child and adolescent development,
2009(124), 5-17.
221
Skinner, E. A., & Zimmer-Gembeck, M. J. (Eds.). (2009). Coping and the
development of regulation (No. 124). Jossey-Bass Inc Pub.
Smith, A., & Williams, K. D. (2004). RU there? Ostracism by cell phone text
messages. Group dynamics: Theory, research, and practice, 8(4), 291-301
Smith, M., & Bourke, S. (1992). Teacher stress: Examining a model based on
context, workload, and satisfaction. Teaching and Teacher Education, 8(1),
31-46.
Sommer, K. L., Williams, K. D., Ciarocco, N. J., & Baumeister, R. F. (2001). When
silence speaks louder than words: Explorations into the intrapsychic and
interpersonal consequences of social ostracism. Basic and Applied Social
Psychology, 23(4), 225-243.
Song, J. H., Chai, D. S., Kim, J., & Bae, S. H. (2018). Job Performance in the
Learning Organization: The Mediating Impacts of Self‐Efficacy and Work
Engagement. Performance Improvement Quarterly, 30(4), 249-271.
Sonnentag, S., & Jelden, S. (2009). Job Stressors and the pursuit of sport activities:
A day-level perspective. Journal of Occupational Health Psychology, 14(2),
165-181.
Spencer, S. J., Steele, C. M., & Quinn, D. M. (1999). Stereotype threat and women's
math performance. Journal of experimental social psychology, 35(1), 4-28.
Spilt, J. L., Koomen, H. M., & Thijs, J. T. (2011). Teacher wellbeing: The
importance of teacher–student relationships. Educational psychology review,
23(4), 457-477.
Sprenger, J. 2011. Stress and Coping Behaviours among Primary School Teachers.
Master of Arts, East Carolina University.
Srivastava, R., & Tang, T. L. P. (2015). Coping intelligence: Coping strategies and
organizational commitment among boundary spanning employees. Journal
of Business Ethics, 130(3), 525-542.
222
Stangor, C., Carr, C., & Kiang, L. (1998). Activating stereotypes undermines task
performance expectations. Journal of Personality and Social Psychology,
75(5), 1191-1197
Steele, C. M. (1997). A threat in the air: How stereotypes shape intellectual identity
and performance. American psychologist, 52(6), 613-629
Steele, C. M. (1999, August). Thin ice: Stereotype threat and black college students.
The Atlantic Monthly, 284(2), 44-54
Steele, C. M., & Aronson, J. (1995). Stereotype threat and the intellectual test
performance of African Americans. Journal of personality and social
psychology, 69(5), 797-811
Steele, C. M., & Davies, P. G. (2003). Stereotype threat and employment testing: A
commentary. Human Performance, 16(3), 311-326.
Steele, C. M., Spencer, S. J., & Aronson, J. (2002). Contending with group image:
The psychology of stereotype and social identity threat. In Advances in
experimental social psychology (Vol. 34, pp. 379-440). Academic Press.
Steele, C., Kidd, D. C., & Castano, E. (2015). On social death: Ostracism and the
accessibility of death thoughts. Death studies, 39(1), 19-23.
Stone, A. A., & Mackie, C. (2013). Subjective well-being. Measuring happiness,
suffering and other dimensions of experience. National Research Council of
the National Academies.
Stone, J., & McWhinnie, C. (2008). Evidence that blatant versus subtle stereotype
threat cues impact performance through dual processes. Journal of
Experimental Social Psychology, 44(2), 445-452.
Stone, J., Lynch, C. I., Sjomeling, M., & Darley, J. M. (1999). Stereotype threat
effects on black and white athletic performance. Journal of personality and
social psychology, 77(6), 1213-1227
Stroshine, M. S., & Brandl, S. G. (2011). Race, gender, and tokenism in policing:
An empirical elaboration. Police Quarterly, 14(4), 344-365.
223
Stroud, L. R., Tanofsky-Kraff, M., Wilfley, D. E., & Salovey, P. (2000). The Yale
Interpersonal Stressor (YIPS): affective, physiological, and behavioural
responses to a novel interpersonal rejection paradigm. Annals of Behavioural
Medicine, 22(3), 204-213.
Sumner, L. W. (1996). Welfare, happiness, and ethics. New York: Oxford
University Press.
Sundstrom, E., McIntyre, M., Halfhill, T., & Richards, H. (2000). Work groups:
From the Hawthorne studies to work teams of the 1990s and beyond. Group
Dynamics: Theory, Research, and Practice, 4(1), 44-67
Sutton, R. (1984). Job stress among primary and secondary schoolteachers: Its
relationship to illbeing. Work and Occupations, 11(1), 7-28.
Tagler, M. J. (2012). Choking under the pressure of a positive stereotype: Gender
identification and self-consciousness moderate men's math test performance.
The Journal of social psychology, 152(4), 401-416.
Tajfel, H., Turner, J. C., Austin, W. G., & Worchel, S. (1979). An integrative theory
of intergroup conflict. Organizational identity: A reader, 56-65.
Tavakol, M., & Dennick, R. (2011). Making sense of Cronbach's alpha.
International journal of medical education, 2, 53.
Taylor, S. E., & Brown, J. D. (1988). Illusion and well-being: a social psychological
perspective on mental health. Psychological bulletin, 103(2), 193-210
Tesser, A. (2000). On the confluence of self-esteem maintenance mechanisms.
Personality and Social Psychology Review, 4(4), 290-299.
Thau, S., Aquino, K., & Poortvliet, P. M. (2007). Self-defeating behaviors in
organizations: The relationship between thwarted belonging and
interpersonal work behaviors. Journal of Applied Psychology, 92(3), 840.
Tice, D. M., Twenge, J. M., & Schmeichel, B. J. (2002). Threatened selves: the
effects of social exclusion on prosocial and antisocial behavior. The social
self: Cognitive, interpersonal, and intergroup perspectives, 175-87.
224
Tkach, C., & Lyubomirsky, S. (2006). How do people pursue happiness?: Relating
personality, happiness-increasing strategies, and well-being. Journal of
happiness studies, 7(2), 183-225.
Tomkiewicz, J., Brenner, O. C., & Adeyemi-Bello, T. (1998). The impact of
perceptions and stereotypes on the managerial mobility of African
Americans. The Journal of social psychology, 138(1), 88-92.
Trott, S.(2014). Impact of Negativity and Stereotype Threat on Female Managers-
An Indian Perspective. Journal of IMS group, 11(1).
Tugade, M. M., & Fredrickson, B. L. (2007). Regulation of positive emotions:
Emotion regulation strategies that promote resilience. Journal of happiness
studies, 8(3), 311-333.
Tummers, L.G. (2015). The effect of coping on job performance. Retrieved from
http://hdl.handle.net/1765/77882.
Turco, C. J. (2010). Cultural foundations of tokenism: Evidence from the leveraged
buyout industry. American sociological review, 75(6), 894-913.
Twenge, J. M., Baumeister, R. F., DeWall, C. N., Ciarocco, N. J., & Bartels, J. M.
(2007). Social exclusion decreases prosocial behavior. Journal of personality
and social psychology, 92(1), 56-66
Twenge, J. M., Baumeister, R. F., Tice, D. M., & Stucke, T. S. (2001). If you can't
join them, beat them: Effects of social exclusion on aggressive behavior.
Journal of personality and social psychology, 81(6), 1058-1069
Tyler, T. R., & Lind, E. A. (1992). A relational model of authority in groups. In
Advances in experimental social psychology (Vol. 25, pp. 115-191).
Academic Press.
Uchendu, C. (2011). Correlates of managerial variables and Secondary school
teachers’ job performance. Global journal of educational research, 10(1),77-
82.
225
Ushop, A. (2013). Work Performance and Job Satisfaction among Teachers.
International Journal of Humanities and Social Science, 3(5),90-198.
Viswesvaran, C., Ones, D. S., & Schmidt, F. L. (1996). Comparative analysis of the
reliability of job performance ratings. Journal of applied psychology, 81(5),
557-574
Von Hippel, W., Von Hippel, C., Conway, L., Preacher, K. J., Schooler, J. W., &
Radvansky, G. A. (2005). Coping with stereotype threat: Denial as an
impression management strategy. Journal of personality and social
psychology, 89(1), 22.
Von Wright, G. H. (1963). The Varieties of Goodness, London: Routledge & Kegan
Paul.
Wallace, J. E., & Kay, F. M. (2012). Tokenism, organizational segregation, and
coworker relations in law firms. Social Problems, 59(3), 389-410.
Warburton, W. A., Williams, K. D., & Cairns, D. R. (2006). When ostracism leads
to aggression: The moderating effects of control deprivation. Journal of
Experimental Social Psychology, 42(2), 213-220.
Waterman, A. S., Schwartz, S. J., & Conti, R. (2008). The implications of two
conceptions of happiness (hedonic enjoyment and eudaimonia) for the
understanding of intrinsic motivation. Journal of Happiness Studies, 9(1),
41-79.
Weber, S., Kronberger, N., & Appel, M. (2018). Immigrant students’ educational
trajectories: The influence of cultural identity and stereotype threat. Self and
Identity, 17(2), 211-235.
Weiten, W., Dunn, D. S., & Hammer, E. Y. (2014). Psychology applied to modern
life: Adjustment in the 21st century. Cengage Learning.
Werner, J. M. (2000) Implications of OCB and contextual performance for human
resource management. Human Resource ManagementReview, 10(1), 245-
261.
226
Wheeler, S. C., & Petty, R. E. (2001). The effects of stereotype activation on
behavior: a review of possible mechanisms. Psychological bulletin, 127(6),
797.
William, K.D. (2007). Ostracism. Annual Review of Psychology, 58, 425-452.
Williams, K. D. (1997). Social ostracism. In Kowalski (Ed.). Aversive interpersonal
behaviors. New York: Plentum.
Williams, K. D. (2001). Ostracism in and by organizations. Ostracism: The power of
silence, 189-216.
Williams, K. D., & Sommer, K. L. (1997). Social ostracism by coworkers: Does
rejection lead to loafing or compensation?. Personality and Social
Psychology Bulletin, 23(7), 693-706.
Wilson, J. (1968). Happiness. Analysis, 29(1), 13-21.
Wraga, M., Helt, M., Jacobs, E., Sullivan, K. (2007). Neural basis of stereotype-
induced shifts in women’s mental rotation performance. Social Cognitive
and Affective Neuroscience, 2(1), 12–9.
Wu, J., & Chan, R. M. (2013). Chinese teachers’ use of humour in coping with
stress. International Journal of Psychology, 48(6), 1050-1056.
Wu, L. Z. (2011). Antecedents and consequences of supervisor and co-worker
ostracism: An empirical investigation. Unpublished doctoral dissertation
Wu, L. Z., Yim, F. H. K., Kwan, H. K., & Zhang, X. (2012). Coping with workplace
ostracism: The roles of ingratiation and political skill in employee
psychological distress. Journal of Management Studies, 49(1), 178-199.
Wu, L. Z., Yim, F. H. K., Kwan, H. K., & Zhang, X. (2012). Coping with workplace
ostracism: The roles of ingratiation and political skill in employee
psychological distress. Journal of Management Studies, 49(1), 178-199.
Wu, L., & Wei, L. (2010). Dispositional antecedents and consequences of workplace
ostracism.
227
Wu, L., Wei, L., & Hui, C. (2011). Dispositional antecedents and consequences of
workplace ostracism: An empirical examination. Frontiers of Business
Research in China, 5(1), 23-44.
Yang, X, Ge C, Hu B, Chi T, Wang L(2009). Relationship between quality of life
and occupational stress among teachers. Public Health, 123(11), 750-755.
Yoder, J. D. (1991). Rethinking tokenism: Looking beyond numbers. Gender &
Society, 5(2), 178-192.
Yong, A. G., & Pearce, S. (2013). A beginner’s guide to factor analysis: Focusing
on exploratory factor analysis. Tutorials in quantitative methods for
psychology, 9(2), 79-94.
Yosoff, R. & Khan, A. (2014). Assessing Reliability and Validity of Job
Performance Scale among University Teachers. Journal of Basic and
Applied Scientific Research, 4(1), 35-41
Yusoff, R. & Azam, K. (2013). Job Stress, Performance and Emotional Intelligence
in Academia. Journal of Basic and Applied Scientific Research, 3(6), 1-8.
Zadro, L., Williams, K. D., & Richardson, R. (2004). How low can you go?
Ostracism by a computer is sufficient to lower self-reported levels of
belonging, control, self-esteem, and meaningful existence. Journal of
Experimental Social Psychology, 40(4), 560-567.
Zhang, S., & Shi, Q. (2017). The relationship between subjective well-being and
workplace ostracism: The moderating role of emotional intelligence. Journal
of Organizational Change Management, 30(6), 978-988.
Zhang, X., & Dai, L. (2015). The relationship between neuroticism and experience
of workplace ostracism in new employees. Open Journal of Social Sciences,
3(02), 80-87
Zou, C., Schimmack, U., & Gere, J. (2013). The validity of well-being measures: A
multiple-indicator–multiple-rater model. Psychological Assessment, 25(4),
1247.

i
ANNEXURE – I
QUESTIONNAIRE FOR PRINCIPAL
Respected Sir/Madam
I am Almaas Sultana pursuing Ph.D (Education) from Lovely Professional
University. I am conducting a research on “Hedonic wellbeing, Coping Strategies
and Workplace Ostracism among teacher: Influence on Job performance and
Stereotype Threat” as my Ph.D work.
In connection with this, I am in the phase of data collection from government
school teachers regarding their hedonic wellbeing, coping strategies and experience
of ostracism. Also I would like to know your opinion on the job performance of the
teachers. I request you to please permit me to collect data from teachers of your
school. I will be highly obliged to your good self if you will rate the performance of
the respective teachers in the attached performance questionnaire.
Your detail will be kept confidential as this is purely for research purpose. I
will be highly obliged for giving your valuable time and suggestions.
Yours Sincerely
Almaas Sultana
Research Scholar
Lovely Professional University
Phagwara, Punjab
Mob: 9056141533
Email: [email protected].
ii
Details of the Supervisor (Principal)
Name: _______________________________________________________
Gender: Male Female
Caste: SC ST OBC General
Religion: Hindu Muslim Christian Sikh
Experience: 0-5 Yrs. 6-10 Yrs.
11 to 20 Yrs. 21 to 25 Yrs.
More than 25 Yrs.
Association with school: …………………………(Yrs.)
Type of School: Rural Urban
School Name: _______________________________________________________
Email: _____________________ Contact. No: ____________________
Details of Supervisee (Teacher)
Name: ________________________________________________________
Experience: ________________________________________________________
Association with school: ______________________________________________

iii
Please read the following statements and tick the option which most appropriately
explains your teacher.
Sr.
No Statements
Strongly
Disagree Disagree Neutral Agree
Strongly
Agree
T1 Enough proficient in his/her
teaching skills while delivering a
lecture.
T2 Uses effective teaching
methodology for the facilitation
of student’s experience
T3 Communicates intelligibly with
others during school hours.
C1 Praises and congratulates
colleagues when they are
awarded honors
C2 Discusses and communicate with
colleagues about teaching and
classroom management.
C3 Devote extra time for the overall
development of students.
CW1 Purposely waste schools
materials/supplies.
CW2 Comes to school late without
permission
CW3 Tries to look busy while doing
nothing
CW4 Blame other employees for
his/her error at work.
CW5 Takes schools supplies and tools
home without permission.

iv
QUESTIONNAIRE FOR TEACHERS
Respected Sir/Maam,
I am Almaas Sultana pursuing Ph.D (Education) from Lovely Professional
University. I am conducting a research on “Hedonic wellbeing, Coping Strategies
and Workplace Ostracism among teacher: Influence on Job performance and
Stereotype Threat” as my Ph.D work.
In connection with this, I am in the phase of data collection from government
school teachers regarding experience of stereotype threat, hedonic wellbeing, coping
strategies and experience of ostracism. I request you to please fill the attached
questionnaire.
Your detail will be kept confidential as this is purely for research purpose. I
will be highly obliged for giving your valuable time and suggestions.
Yours Sincerely
Almaas Sultana
Research Scholar
Lovely Professional University
Phagwara, Punjab
Mob: 9056141533
Email: [email protected].
v
Instructions:
Please read the following statements and respond by ticking on any one of
the option against each statement to indicate how you generally feel. There is no
right or wrong answer. Attempt it without consulting others. Your responses will be
kept confidential and will be used only for research purpose. Please do not leave any
statement unanswered.
Please fill in the following information:
Name: ……………………………………………………………………………
Age: ……………………………………………………………………………
Gender: Male / Female
Caste: ……………………………………………………………………………
Religion: ……………………………………………………………………………
Job-Title: ……………………………………………………………………………
Experience: ……………………………………………………………………………
School Name: ……………………………………………………………………………
Location of School: Rural/Urban

vi
STEREOTYPE THREAT SCALE
Following statements are about your perception towards teaching in
government schools. Tick the option which exactly describes your feeling.
Sr.
No. Statements
Strongly
Disagree Disagree Neutral Agree
Strongly
Agree
Oi1 When someone criticizes teaching
profession in government schools, it
feels like a personal insult.
Oi2 I am very (quite) much interested in
what others think about teaching in
government school.
Oi3 My occupation’s success is my success.
Gi1 When opposite gender teachers
criticizes job performance of teachers
of my gender, it feels like a personal
insult
Gi2 I am very much (Quite) interested in
what others think about taking teaching
as a profession by people of my gender.
Gi3 When someone praises job performance
of teachers of my gender, it feels like a
personal compliment.
Gi4 If a story in the newspaper or on
television criticized teachers of my
gender, I would feel embarrassed.
Gs1 Most teachers of opposite gender have a
lot more negative thoughts about the
performance of other teachers of my
gender than they actually express.
Gs2 Most of the teachers judge job
performance on the basis of gender.
Ri1 When someone criticizes job
performance of a teacher of my
religion, it feels like a personal insult
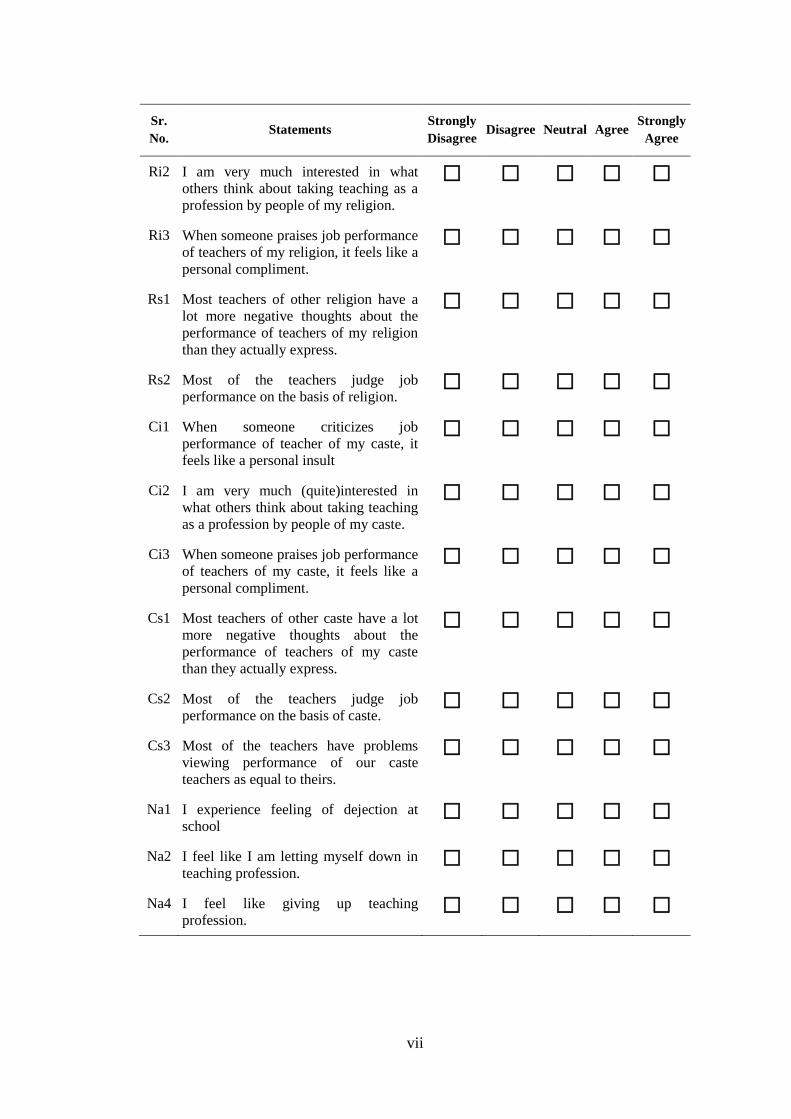
vii
Sr.
No. Statements
Strongly
Disagree Disagree Neutral Agree
Strongly
Agree
Ri2 I am very much interested in what
others think about taking teaching as a
profession by people of my religion.
Ri3 When someone praises job performance
of teachers of my religion, it feels like a
personal compliment.
Rs1 Most teachers of other religion have a
lot more negative thoughts about the
performance of teachers of my religion
than they actually express.
Rs2 Most of the teachers judge job
performance on the basis of religion.
Ci1 When someone criticizes job
performance of teacher of my caste, it
feels like a personal insult
Ci2 I am very much (quite)interested in
what others think about taking teaching
as a profession by people of my caste.
Ci3 When someone praises job performance
of teachers of my caste, it feels like a
personal compliment.
Cs1 Most teachers of other caste have a lot
more negative thoughts about the
performance of teachers of my caste
than they actually express.
Cs2 Most of the teachers judge job
performance on the basis of caste.
Cs3 Most of the teachers have problems
viewing performance of our caste
teachers as equal to theirs.
Na1 I experience feeling of dejection at
school
Na2 I feel like I am letting myself down in
teaching profession.
Na4 I feel like giving up teaching
profession.
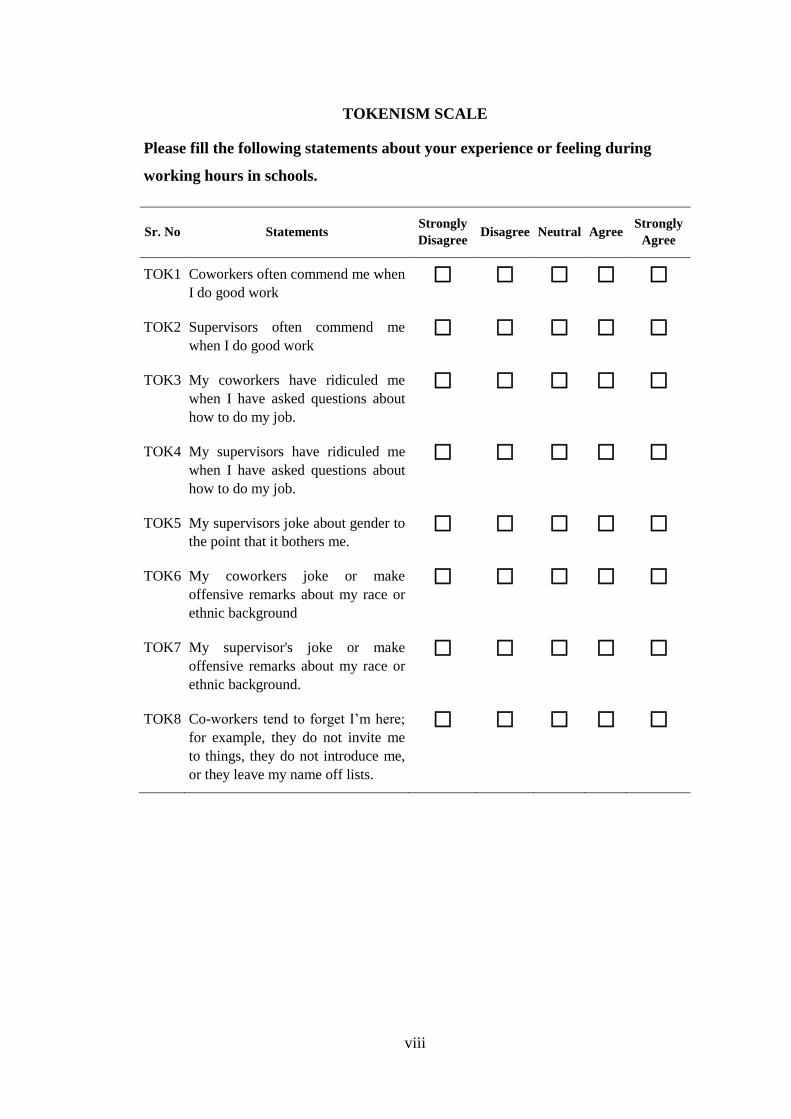
viii
TOKENISM SCALE
Please fill the following statements about your experience or feeling during
working hours in schools.
Sr. No Statements Strongly
Disagree Disagree Neutral Agree
Strongly
Agree
TOK1 Coworkers often commend me when
I do good work
TOK2 Supervisors often commend me
when I do good work
TOK3 My coworkers have ridiculed me
when I have asked questions about
how to do my job.
TOK4 My supervisors have ridiculed me
when I have asked questions about
how to do my job.
TOK5 My supervisors joke about gender to
the point that it bothers me.
TOK6 My coworkers joke or make
offensive remarks about my race or
ethnic background
TOK7 My supervisor's joke or make
offensive remarks about my race or
ethnic background.
TOK8 Co-workers tend to forget I’m here;
for example, they do not invite me
to things, they do not introduce me,
or they leave my name off lists.
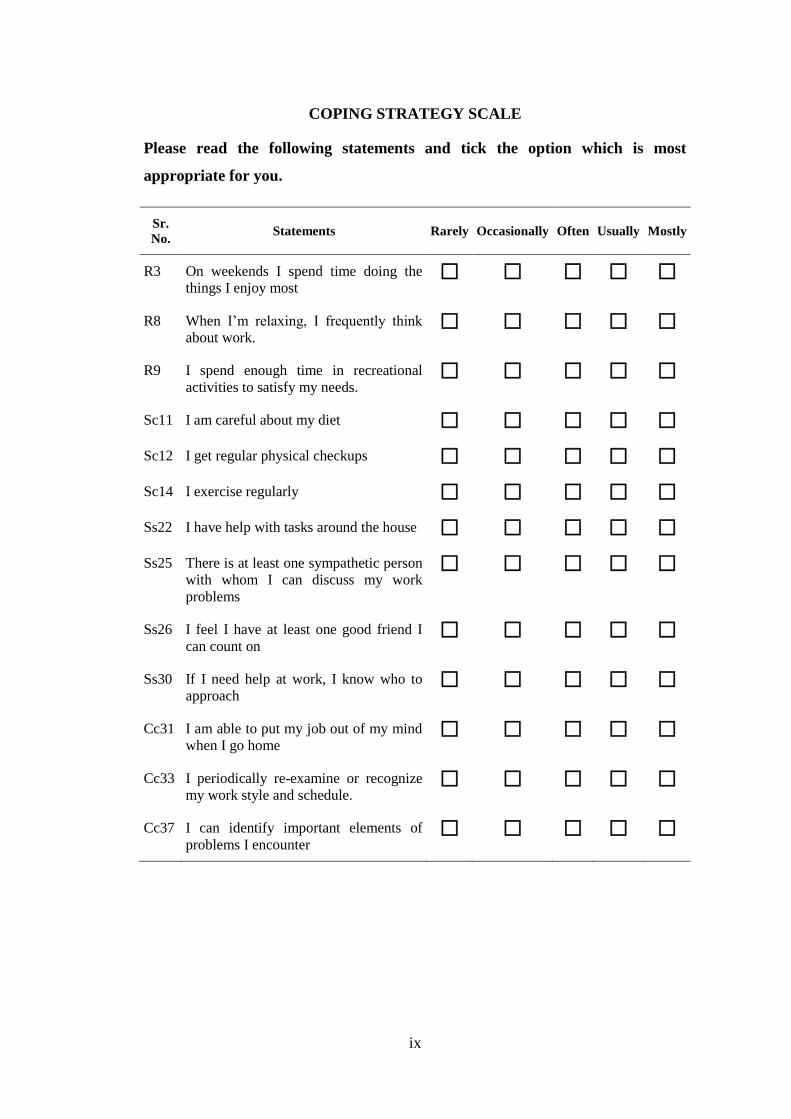
ix
COPING STRATEGY SCALE
Please read the following statements and tick the option which is most
appropriate for you.
Sr.
No. Statements Rarely Occasionally Often Usually Mostly
R3 On weekends I spend time doing the
things I enjoy most
R8 When I’m relaxing, I frequently think
about work.
R9 I spend enough time in recreational
activities to satisfy my needs.
Sc11 I am careful about my diet
Sc12 I get regular physical checkups
Sc14 I exercise regularly
Ss22 I have help with tasks around the house
Ss25 There is at least one sympathetic person
with whom I can discuss my work
problems
Ss26 I feel I have at least one good friend I
can count on
Ss30 If I need help at work, I know who to
approach
Cc31 I am able to put my job out of my mind
when I go home
Cc33 I periodically re-examine or recognize
my work style and schedule.
Cc37 I can identify important elements of
problems I encounter

x
WORKPLACE OSTRACISM SCALE
Please fill the following statements about your experience or feeling during
working hours in schools.
Sr.
No. Statements Never
Once
in a
while
Sometimes Fairly
often Often Constantly Always
W1 Others ignored you at
work
W2 Others left the area when
you entered
W3 Your greetings have gone
unanswered at work
W4 Others avoided you at
work.
W5 You noticed others would
not look at you at work.
W6 Others at work shut you
out of the conversation.
W7 Others refused to talk to
you at work.
W8 Others at work treated you
as if you weren’t there.

xi
HEDONIC WELLBEING SCALE
For each of the following statements and/or questions, please circle the point on
the scale that you feel is most appropriate in describing you.
1. In general, I consider myself:
1 2 3 4 5 6 7
Not a very
happy
Person
A very
Happy
Person
2. Compared with most of my peers, I consider myself:
1 2 3 4 5 6 7
Less
Happy
More
Happy
3. Some people are generally very happy. They enjoy life regardless of what is
going on, getting the most out of everything. To what extent does this
characterization describe you?
1 2 3 4 5 6 7
Not at
all
A great
deal
4. Some people are generally not very happy. Although they are not depressed,
they never seem as happy as they might be. To what extent does this
characterization describe you?
1 2 3 4 5 6 7
Not at
all
A great
deal

xii
ANNEXURE-II
LIST OF ABBREVIATIONS
S. No. Description Abbreviation
1 Adjusted Goodness of Fit Index AGFI
2 Adaptive Performance AP
3 Average Variance Extracted AVE
4 Coping Strategy COPE
5 Cognitive Coping CC
6 Caste Identification Ci
7 Caste Stigma Consciousness Cs
8 Comparative Fit Index CFI
9 Composite Reliability CR
10 Confirmatory Factor Analysis CFA
11 Contextual Performance CP
12 Counterproductive Work Behavior CWB
13 Exploratory Factor Analysis EFA
14 Hedonic Wellbeing HWB
15 Gender Identification Gi
16 Gender Stigma Consciousness Gs
17 Goodness of Fit GFI
18 Goodness of Fit Index GFI
19 Occupational Identification Oi
20 Recreation R
xiii
S. No. Description Abbreviation
21 Religion Identification Ri
22 Religion Stigma Consciousness Rs
23 Root Mean Square Error of Approximation RMSEA
24 Root Mean Square Residual RMR
25 Self-Care SC
26 Social Support SS
27 Stereotype Threat ST
28 Task Performance TP
29 Tokenism TOK
30 Structure Equation Modelling SEM
31 Workplace Ostracism WOS