the contribution of student's motivation
26
THE CONTRIBUTION OF STUDENT’S MOTIVATION, TEACHING METHOD, AND STUDENT’S LEARNING STYLE TOWARDS STUDENT’S ENGLISH GRAMMAR ACHIEVEMENT IN SMK MUHAMMADIYAH 1 SUKOHARJO Submitted as a Partial Fulfillment of the Requirements for Getting Master Degree Language in Education By ARDIKA RIZKI PRIHANTORO S200160013 DEPARTMENT OF LANGUAGE STUDIES GRADUATE SCHOOL UNIVERSITAS MUHAMMADIYAH SURAKARTA 2017
-
Upload
khangminh22 -
Category
Documents
-
view
0 -
download
0
Transcript of the contribution of student's motivation

THE CONTRIBUTION OF STUDENT’S MOTIVATION,
TEACHING METHOD, AND STUDENT’S LEARNING
STYLE TOWARDS STUDENT’S ENGLISH GRAMMAR
ACHIEVEMENT IN SMK MUHAMMADIYAH 1
SUKOHARJO
Submitted as a Partial Fulfillment of the Requirements for
Getting Master Degree Language in Education
By
ARDIKA RIZKI PRIHANTORO
S200160013
DEPARTMENT OF LANGUAGE STUDIES
GRADUATE SCHOOL
UNIVERSITAS MUHAMMADIYAH SURAKARTA
2017

1
The Contribution of Student’s Motivation, Teaching Method, and Student’s
Learning Style towards Student’s English Grammar Achievement in SMK
Muhammadiyah 1 Sukoharjo
ABSTRAK
Penelitian ini bertujuan untuk mengetahui kontribusi motivasi siswa, metode
pengajaran, dan gaya belajar siswa terhadap prestasi belajar bahasa inggris siswa di
grammar dalam program RPL (Rekayasa Perangkat Lunak) pada kelas 10 di SMK
Muhammadiyah 1 Sukoharjo.
Jenis penelitian ini adalah penelitian kuantitatif. Populasi penelitian ini adalah
siswa dalam program RPL 2 (Rekayasa Perangkat Lunak) pada kelas 10 di SMK
Muhammadiyah 1 Sukoharjo. Penelitian ini metode random sampling untuk
mendapatkan sampel penelitian. Instrumennya adalah kuisoner dan tes. Terdapat tiga
variabel independen yaitu motivasi siswa, metode pengajaran, dan gaya belajar, serta
satu variabel dependen yaitu prestasi belajar bahasa inggris siswa di grammar.
Peneliti menggunakan analisis data (statistik deskriptif, uji asumsi klasik (normalitas,
linieritas, multikolinearitas, heteroskedastisitas), regresi berganda)) dan pengujian
hipotesis (uji-t (partial), uji-f (simulasi), koefisien determinasi, kontribusi prediktor)
untuk teknik menganalisis data.
Hasil penelitian ini menunjukkan bahwa ada kontribusi motivasi siswa, metode
pengajaran dan gaya belajar siswa terhadap prestasi belajar bahasa inggris siswa di
grammar dalam program RPL 2 (Rekayasa Perangkat Lunak) pada kelas 10 di SMK
Muhammadiyah 1 Sukoharjo. Persentase dari semua variabel bebas adalah motivasi
belajar siswa sebesar 63,0%, metode pengajaran 68,5%, dan gaya belajar siswa
63,7%.
Kata Kunci : Motivasi Siswa, Metode Pengajaran, Gaya Belajar Siswa, dan
Prestasi Belajar Bahasa Inggris Siswa di Grammar
ABSTRACT
This research is aimed knowing the contribution of student’s motivation,
teaching method, and student’s learning style towards student’s English grammar
achievement in RPL (Rekayasa Perangkat Lunak) program at tenth grade of SMK
Muhammadiyah 1 Sukoharjo.
The type of this research is quantitative research. The population of this research
were 30 students in RPL 2 (Rekayasa Peranngkat Lunak) program at tenth grade of
SMK Muhammadiyah 1 Sukoharjo. The researcher used random sampling in getting
the samples. The instrument is questionnaire and test. There are three independent
variables namely, student’s motivation, teaching method, and student’s learning style,
and one dependent variable is student’s English grammar achievement. The
2
researcher used data analysis (descriptive statistic, classic assumption test (normality,
linearity, multicolinearity, heteroscedasticity), multiple regressions)) and hypothesis
testing (t-test (partial), f-test (simulation), coefficient of determination, predictor
contributions) to techinque of data analysis.
The result of this research shows that there is a postive and significant
contribution of student’s motivation, teaching method, and student’s learning style
toward student’s English grammar achievement in RPL 2 (Rekayasa Perangkat
Lunak) program at tenth grade of SMK Muhammadiyah 1 Sukoharjo. The percentage
of all independent variables are student’s motivation is 63,0%, teaching method is
68,5%, and student’s learning style is 63,7%.
Keywords : Student’s Motivation, Teaching Method, Student’s Learning Style,
and Student’s English Grammar Achievement
1. Introduction
This research discusses about the contribution of student’s motivation,
teaching method, and student’s learning style towards student’s English grammar
achievement in SMK Muhammadiyah 1 Sukoharjo.
Language is an important tool to all people in the world because it helps them
to communicate other. This shows how important the function of the language as
communication in daily life. Language can bring people into relationship with their
environment. According to Boey (1975: 3) “language is, therefore, socially learned
behavior that is a skill that is acquired as we grow up in society”. Remembering
that the importance of language serves as a means of communication and everyone
in the world learns language.
In Indonesian education, English is one of the subject matters in school.
English is one of the foreign languages for Indonesian students since Kindergarten
level until Unviersity level. They do not only learn how to speak English, but the
students also learn other English skills. There are four skills that students must
master, namely listening, speaking, reading, and writing. For many Indonesian
students, English is considered as a difficult subject because English is completely
different from Indonesian language. English is not their mother tongue.
3
2. Background
2.1. English material
Teaching-learning English in senior high school or vocational school
contains high level of language skills. With regards to materials, Allwright in
(Fauziati, 2010: 207) argues that materials should teach students to learn, that
they should be resource books for ideas and activities for instruction/ learning,
and that they should give teachers rationales for what they do.
2.2. Student’s motivation
Motivation is important for students. Motivation is defined as the extent
ones strive to acquire the language beacuse of the desire to do so and the
satisfaction derived from it (Gardner, 1985). We know that, every student has
a different personality and so is the students spirit to learn. When the students
must learn difficult subject in the school, there are many students that feel
angry, confused, irritated and any others bad feelings. Automatically, they are
not interested in learning English. So, the students need encouragement.
Motivation plays as considered significant role for students to learn English.
So, motivation is very important for the students. Zoltan (2002) states that the
learner’s enthusiasm, commitments and persistence are the key determinants
of success or failure.
2.3. Teaching method
As we know that teachers also need something to help them to teach the
students, namely method. With the method, the teacher can be easy to teach the
English lesson for the students. Method in learning process makes a teacher
more ready and know what to do in the learning process. According to Anthony
(1963: 95) method as “an overall plan for the orderly presentation of language
4
material, no part of which contradicts, and all of which is based upon the
selected approach. An approach is axiomatic whereas a method is procedural”.
Method also helps the teacher to enjoy in teaching English matter and the
students automatically will feel enjoy and easier to understand what the teacher
explained. It is very important in learning process to make the classroom
situation more interesting. Because method is treated at the level of design in
which the roles of teachers, learners and instructional materials are specified.
Thus, method is theoretically related to an approach and is organizationally
determined by a design (Fauziati, 2014: 12).
2.4. Student’s learning style
To support the teacher in learning process there is one teaching element
used by teacher to help the students easy to understand the English matter,
namely learning styles. The teacher can give information to the students about
appropriate learning styles based on each English matter. The students must
develop the learning style to make their learning easier, faster, enjoyable and
effective. A learning style is an individual’s preferred way of learning
(Fauziati, 2010: 147).
2.5. Student’s English grammar achievement
When the students success to master subject matters from the teacher, the
teacher will give the students achievement. Achievement is a proof for students
whether the students are success or not in the mastery and implemented the
subject matters. So, achievement also is the measured competence from the
students. Achievement also is a measurement of the quality or quantity from
students’ success in the mastery of knowledge, skills, or understandings. As we
know that, in English learning there are four skills the students should master,
such as listening, speaking, reading and writing. It is very important from the
students because one of the students’ purpose in learning is to get the best
5
achievement. Automatically, the teacher feel proud to the students. According
to Hornby (2005) achievement is a thing done successfully, especially with an
effort and skill. And then, achievement is what a pupil has learned (Norman,
1991: 331). In other word, achievement is the students result from the students
learning.
3. Method
3.1. Population and place
Population as the totality of all subjects that conform to a set of
specifications, comprising the entire group of persons that is of interest to the
researcher and to whom the research results can be generalised (Polit and
Hungler, 1999: 43 and 232). The population of this research is the first semester
students at the tenth grade of RPL (Rekayasa Perangkat Lunak) program in
SMK Muhammadiyah 1 Sukoharjo academic year 2017/ 2018. The population
of the research is 30 students in RPL (Rekayasa Perangkat Lunak) program.
This research is conducted in SMK Muhammadiyah 1 Sukoharjo. It is
located on Jl. Anggrek No. 2 Sukoharjo 57511 Jawa Tengah Telp. (0271)
593187. This school is one of Senior High School on Sukoharjo. There are
some reasons why the researcher chooses this school, namely: this is one of
favorite schools in Sukoharjo, there are many classes and students, and the
researcher knows this school because he ever did a previous English research
in this school.
3.2. Technique of data collection
In collecting the data in this research, the researcher use questionnaire
and test. Questionnaire is one of the techniques of data collection which being
answered by the respondents about their life condition, belief, and attitudes
6
(Sutama, 2012: 94). Test is measuring method used to measure individual’s
ability, knowledge or performance in some domain (Brown, 2004: 3).
The questionnaires are given to the first semester students at the tenth
grade of RPL (Rekayasa Perangkat Lunak) class in SMK Muhammadiyah
Sukoharjo. The questionnaires uses closed-questionnaires as we can see in the
description of the Linkert scale in the instruments below, the answers of each
question or statement are given, and the respondents choose the answers. The
researcher make student’s motivation questionnaires based on the Harter‘s
theory (1981), teaching method questionnaires based on the method in 2013
curriculum, and student’s learning style questionnaires based on the Oxford’s
theory (1995).
Then, the test uses to get the student’s English grammar achievement
data. The test uses Guttman scale as the scoring rubric. The researcher make
grammar test based on the material in handbook.
3.3. Data analysis
3.3.1. Desscriptive statistic
Descriptive statistic is a statistic which function is to describe the
object of the research through sample or population without doing
analysis and it draw conclusion in general (Sugiyono, 2014: 29). In this
part includes about the discussion of the collection, summary, and data
display. The function of this part is the summarized data in the table to
make it easy for making decision because the data result of the research
is the raw data.
7
3.3.2. Classic assumption test
3.3.2.1. Normality
Normality test is used to test whether the regression
model, the residuals have a normal distribution (Ghozali,
2011: 160). The researcher use graphic analysis and
Kolmogorov-Smirnov test with SPSS version 16.0 to know
that the sample is normal distribution.
Graph analysis uses histograms graph using chats and
P-P plot graphs. On the histogram graph, the data that follows
or approaches the normal distribution is the distribution of
data with a bell shape (Ghozali, 2011: 163). On P-P Plot
graph, the data defines as normal data if the data points
spread around the normal line (Ghozali, 2011: 163).
Kolmogorov-Smirnov test is included as a complement to the
graphical analysis. If the probability or sig. (2-tailed) > 0.05,
the data distribution is normal. If the probability or sig. (2-
tailed) < 0.05 the data distribution is not normal (Ghozali,
2011: 163).
3.3.2.2. Linearity
Linearity test is used to determine whether the regression
line between the variables X and Y forms a linear line or not.
If it is not linier then the regression analysis can not be
continued (Sugioyo, 2014: 265). The linearity of data is tested
by F-test with SPSS version 16.0. If the probability is > 0.05
the research data is linear and if the probability is <0.05 the
research data is not linear.
8
3.3.2.3. Multicolinearity
Multicolinearity test is used to test whether the
regression model found a correlation between the independent
variables (Ghozali, 2011: 105). Multicolinearity can be seen
from tolerance value and variance inflation factor (VIF) using
SPSS version 16.0. If the tolerance value > 0,10 and VIF < 10,
the independent variables do not have serious multicolinearity
problem with the others independent variables. On the other
hand, If the tolerance value < 0,10 and VIF > 10, the
independent variables have serious multicolinearity problem
with the others independent variables.
3.3.2.4. Heteroscedasticity
Heteroscedasticity test aims to test whether the
regression model occurred inequality variance from the one
residuals observations to other ones (Ghozali, 2011: 139). If
the variance from the one residuals to the other ones is remain,
so it calls homoscedasticity and if it is different it calls
heteroscedasticity. To know whether there is
heteroscedasticity. or not, it can be seen from the result of
statistic analysis. Statistic analysis done uses Glejser –Test
with SPSS version 16.0. If the sig. 2-tailed < α = 0,05 so there
is heteroscedasticity, but if the sig. 2 tailed > α == 0,05 so there
is no heteroscedasticity.
3.3.3. Multiple regressions
Multiple regression analysis used if the researcher predicts how
the condition of the dependent variable if there are two or more
9
independent variable as the factors of manipulated variable. The
formulation of multiple regressions is as follow:
Y = a + b1 X1 + b2 X2 + b3 X3
In which:
X1 = Student’s Motivation
X2 = Teaching Method
X3 = Student’s Learning Style
Y = Student’s English Grammar Achievements
a = Constanta
b = Coefficient of regression, this is the change of
dependent variables the result of the independent
variable changes.
3.4. Hypothesis testing
3.4.1. t-test (partial)
The use of t-test is to show how deep the influence of an
independent variable individually to explain the dependent variable
(Ghozali, 2011: 98). The formula of t-test or the statistic of t as follows:
𝑡 = 𝑟√𝑛−2
𝑟√1−𝑟2
In which:
t = tresult
r = coefficient of correlation
𝑟2 = coefficient of determine
K = the total of independent variables
n = degree of deliberation (dk)
(Sugiyono, 2014: 230)
10
3.4.2. f-test (simulation)
The function of f-test is to know either all independent variables
in the study simultaneously give the influence toward the dependent
variable (Ghozali, 2011: 98). The formula to use this type as follows:
F = 𝑅2
𝑘⁄
(1−𝑅2)/(𝑛−𝑘−1)
In which:
F = 𝐹𝑟𝑒𝑠𝑢𝑙𝑡
𝑅2 = coefficient of correlation found
K = the total of independent variables
n = total of the sample
(Sugiyono, 2014: 235)
3.4.3. Coefficient of determination
Next step is search the coefficient of determination (𝑅2). Here,
the variance happen in dependent variable can be explained toward the
variance happen in dependent variable (Sugiyono, 2014: 231).
3.4.4. Predictor contributions
This part can be used to know how much the contribution of each
X variables toward Y variable and there are two types of predictor
contributions are effective contribution (EC) and relative contribution
(RC). Based on Budiono (2004: 293) sum of the effective contribution
and relative contribution is coefficient of determination, while sum of
all relative contribution of all variables is 1 or 100%. The formula of t-
test or the statistic of t as follows:
11
Effective Contribution (EC)
𝐸𝐶% =𝑏𝑥 . 𝐶𝑃 . 𝑅2
𝑅𝑒𝑔𝑟𝑒𝑠𝑠𝑖𝑜𝑛
In which:
EC% = effective contribution from variable X
𝑏𝑥 = coefficient b of variable X
𝐶𝑃 = crossproduct variable X
Regression = regression value
𝑅2 = coefficient of determination
Relative Contribution (RC)
𝑅𝐶% =𝑆𝐸%
𝑅2 𝑥 100%
In which:
EC% = effective contribution from variable X
RC% = relative contribution from variable X
𝑅2 = coefficient of determination
4. Results
4.1. Classic assumption testing
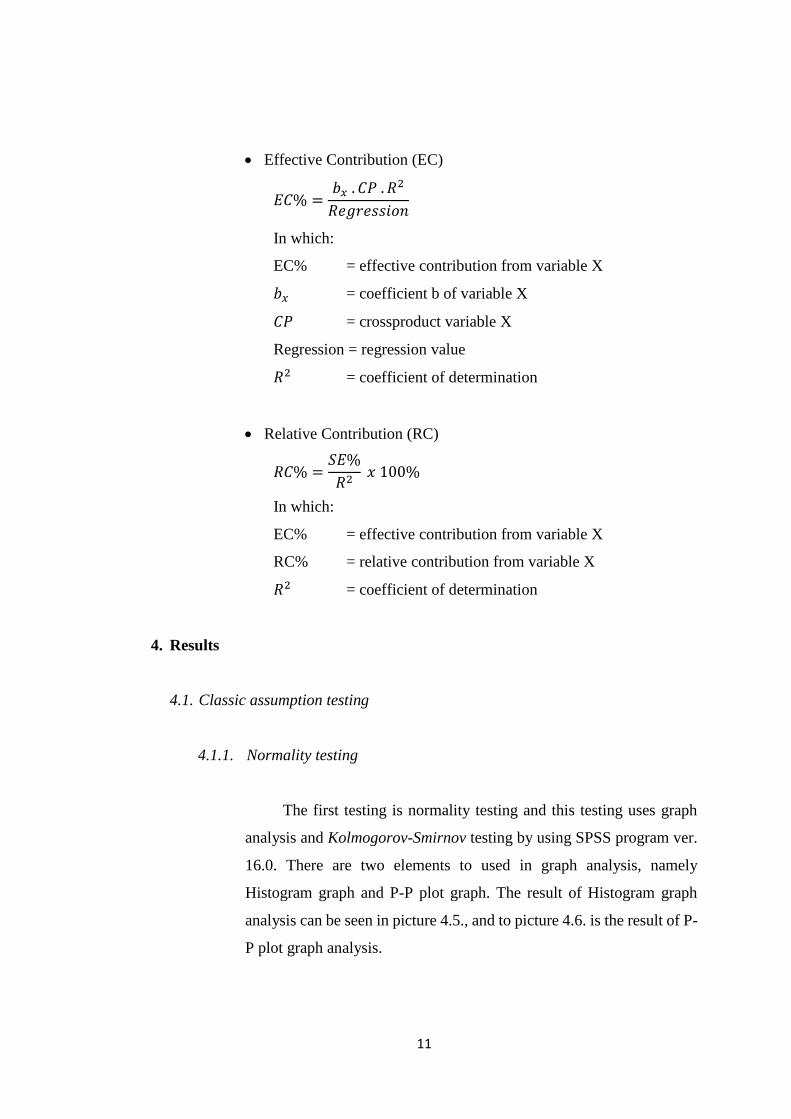
4.1.1. Normality testing
The first testing is normality testing and this testing uses graph
analysis and Kolmogorov-Smirnov testing by using SPSS program ver.
16.0. There are two elements to used in graph analysis, namely
Histogram graph and P-P plot graph. The result of Histogram graph
analysis can be seen in picture 4.5., and to picture 4.6. is the result of P-
P plot graph analysis.
12
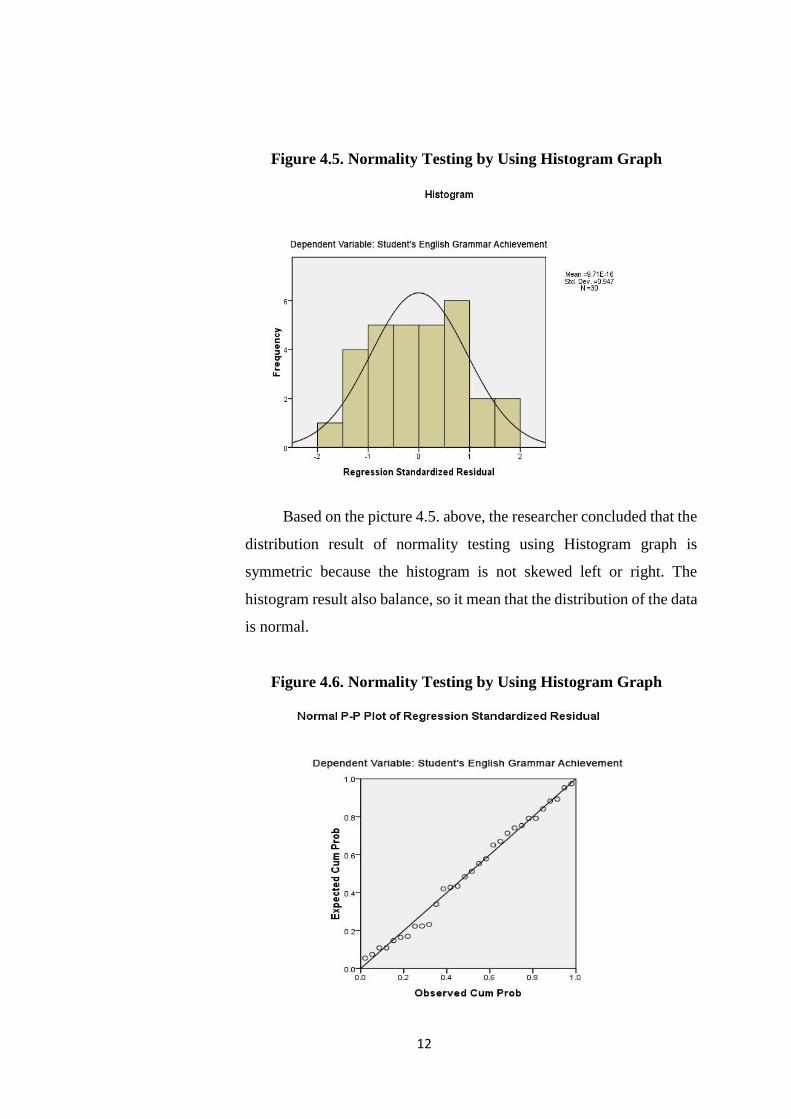
Figure 4.5. Normality Testing by Using Histogram Graph
Based on the picture 4.5. above, the researcher concluded that the
distribution result of normality testing using Histogram graph is
symmetric because the histogram is not skewed left or right. The
histogram result also balance, so it mean that the distribution of the data
is normal.
Figure 4.6. Normality Testing by Using Histogram Graph
13
Based on the picture 4.6. above, the researcher concluded that the
dots in the picture are not skewed left or right but the dots can spread
around the diagonal line. So, the distribution result of the data is normal.
4.1.2. Linearity testing
The point of probability value in line Deviation from Linearity
and column Sig. The result of probability value of each variable as
follow: Student’s Motivation (X1) is 0,240; Teaching Method (X2) is
0,245; Student’s Learning Style (X3) is 0,978. It means that all
probability values of variables are more than 0,05 (>0,05). So, the
researcher concluded that this research data is linear.
4.1.3. Multicolinearity testing
The point value result of multicolinearity from tolerance value
and variance inflation factor (VIF). The result of tolerance value of each
variable as follow: Student’s Motivation (X1) is 0,615; Teaching
Method (X2) is 0,586; Student’s Learning Style (X3) is 0,417, all result
which is >0,10. Then, the result of variance inflation factor (VIF) value
of each variable as follow: Student’s Motivation (X1) is 1,625; Teaching
Method (X2) is 1,708; Student’s Learning Style (X3) is 2,397, all result
which is <10. The researcher concluded that the independents variables
do not have serious multicolinearity problem with the others
independent variables.
4.1.4. Heteroscedasticity testing
The point value result of heteroscedasticity in column Sig. The result of
heteroscedasticity value of each variable as follow: Student’s
Motivation (X1) is 0,399; Teaching Method (X2) is 0,077; Student’s
14
Learning Style (X3) is 0,823. It means that all probability values of
variables are more than 0,05 (>0,05). So, the researcher concluded that
in regression model there is no heteroscedasticity.
4.2. Multiple regressions
the researcher gets the result of regression coefficient for independent
variables are: Student’s Motivation is 0, 375; Teaching Method is 0,269; and
Student’s Learning Style is 0,231. From the all independent variables, the
constant value of regression is 2,273. And then, about the formulation of
multiple regression is Y=2,273 + 0,375X1 + 0,269X2 + 0,231X3. The
explanations that:
1) If the Student’s Motivation variable, Teaching Method variable, and
Student’s Learning Style variable are 0, Student’s English Grammar
Achievement variable will become 2,273.
2) If the Student’s Motivation variable increases one point while the Teaching
Method variable and Student’s Learning Style variable are assumed
constant, the increment of Student’s English Grammar Achievement will
become 0,375.
3) If the Teaching Method variable increases one point while the Student’s
Motivation variable and Student’s Learning Style variable are assumed
constant, the increment of Student’s English Grammar Achievement will
become 0,269.
4) If the Student’s Learning Style variable increases one point while the
Student’s Motivation variable and Teaching Method variable are assumed
constant, the increment of Student’s English Grammar Achievement will
become 0,231.
15
4.3. Hypothesis testing
4.3.1. t-test (partial)
The first testing in hypothesis testing is t-test (partial). This test
use to show how deep the individually contribution of each independent
variable namely Student’s Motivation (X1), Teaching Method (X2), and
Student’s Learning Style (X3) towards Student’s English Grammar
Achievement (Y) as a dependent variable. Based on the table 4.15.
above, the researcher concluded about the result of hypothesis testing
of all independent variables towards dependet variable as follow:
a) The regression coefficient for Student’s Motivation (X1) variable is
0,375. The result of tresult is 4,623 which is more than ttable (>2,048).
The significance result of this variable is 0,000 which is less than
0,05. From the result above, the researcher concluded Ho is denied
and Ha is accepted. So, it means that the hypothesis (H1) of “there is
positive and significant contribution of student’s motivation toward
student’s English grammar achievement” is accepted.
b) The regression coefficient for Teaching Method (X2) variable is
0,269. The result of tresult is 2,616 which is more than ttable (>2,048).
The significance result of this variable is 0,015 which is less than
0,05. From the result above, the researcher concluded Ho is denied
and Ha is accepted. So, it means that the hypothesis (H2) of “there is
positive and significant contribution of teaching method toward
student’s English grammar achievement” is accepted.
c) The regression coefficient for Student’s Learning Style (X3) variable
is 0,231. The result of tresult is 2,932 which is more than ttable (>2,048).
The significance result of this variable is 0,007 which is less than
0,05. From the result above, the researcher concluded Ho is denied
and Ha is accepted. So, it means that the hypothesis (H3) of “there is
16
positive and significant contribution of student’s learning style
toward student’e English grammar achievement” is accepted.
4.3.2. f-test (simulation)
The result of Fresult is 44.937 which more Ftable (>2,95). The
significance is 0,000 which is less than 0,05. From the result above, the
researcher concluded Ho is denied and Ha is accepted. So, it means that
the hypothesis (H4) of “student’s motivation, teaching method, and
student’s learning style are partially contributed towards student’s
English grammar achievement” is accepted.
4.3.3. Coefficient of determination
The result of R2 is 0,838. So, it means that the contribution value
of all independent variables namely Student’s Motivation (X1),
Teaching Method (X2), and Student’s Learning Style (X3) towards
Student’s English Grammar Achievement (Y) as a dependent variable
in the RPL 2 (Rekayasa Perangkat Lunak) program at tenth grade of
SMK Muhammadiyah 1 Sukoharjo is 83,8% and the other 16,2% are
influenced by other factors which are not discussed in this research.
4.3.4. Predictor contribution
The last testing in hypothesis testing is predictor contributions.
This test use to know how much the contribution of each independent
variables namely Student’s Motivation (X1), Teaching Method (X2),
and Student’s Learning Style (X3) towards Student’s English Grammar
Achievement (Y) as a dependent variable. The table 4.18. below is the
calculation result of effective contributions (EC) and relative
contributions (RC).
17
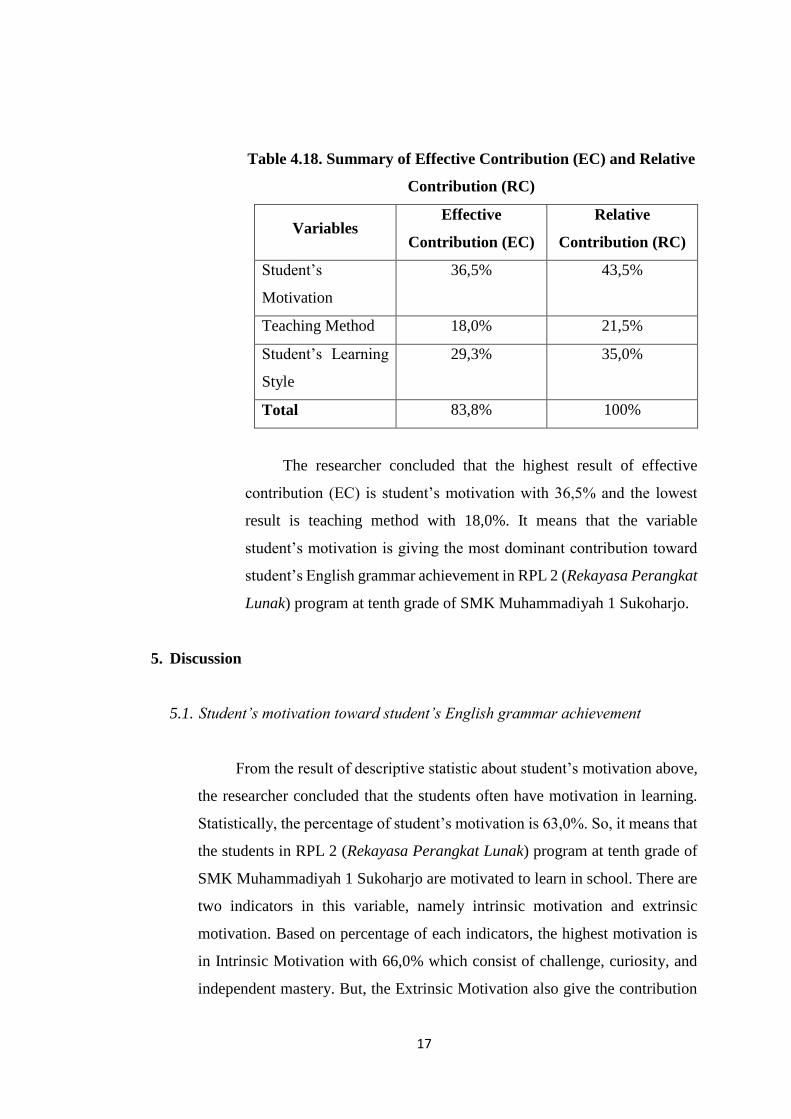
Table 4.18. Summary of Effective Contribution (EC) and Relative
Contribution (RC)
Variables Effective
Contribution (EC)
Relative
Contribution (RC)
Student’s
Motivation
36,5% 43,5%
Teaching Method 18,0% 21,5%
Student’s Learning
Style
29,3% 35,0%
Total 83,8% 100%
The researcher concluded that the highest result of effective
contribution (EC) is student’s motivation with 36,5% and the lowest
result is teaching method with 18,0%. It means that the variable
student’s motivation is giving the most dominant contribution toward
student’s English grammar achievement in RPL 2 (Rekayasa Perangkat
Lunak) program at tenth grade of SMK Muhammadiyah 1 Sukoharjo.
5. Discussion
5.1. Student’s motivation toward student’s English grammar achievement
From the result of descriptive statistic about student’s motivation above,
the researcher concluded that the students often have motivation in learning.
Statistically, the percentage of student’s motivation is 63,0%. So, it means that
the students in RPL 2 (Rekayasa Perangkat Lunak) program at tenth grade of
SMK Muhammadiyah 1 Sukoharjo are motivated to learn in school. There are
two indicators in this variable, namely intrinsic motivation and extrinsic
motivation. Based on percentage of each indicators, the highest motivation is
in Intrinsic Motivation with 66,0% which consist of challenge, curiosity, and
independent mastery. But, the Extrinsic Motivation also give the contribution
18
for the students to learn the materials in school. The percentage of extrinsic
motivation in often and always category is 60,0% which consist of easy work,
pleasing teacher, and dependence on teacher.
5.2. Teaching method toward student’s English grammar achievement
From the result of descriptive statistic about teaching method above, the
researcher concluded that the students often easy understand the lesson with
teaching method in learning. Statistically, the percentage of teaching method is
68,5%. So, it means that the students in RPL 2 (Rekayasa Perangkat Lunak)
program at tenth grade of SMK Muhammadiyah 1 Sukoharjo easy understand
the lesson with teaching method in learning. There are six indicators in this
variable, namely scientific approach, inquiry-based language learning (IBLL),
project-based language learning (Proj. BLL), problem-based language learning
(Prop. BLL), discovery language learning (DLL), and task-based language
learning (TBLL). Based on percentage of each indicators, the highest teaching
method is in task-based language learning (TBLL) with 100%. But, the other
indicators also give the contribution. In scientific approach with 51%, inquiry-
based language learning (IBLL) with 86,6%, project-based language learning
(Proj. BLL) with 26,6%, problem-based language learning (Prop. BLL) with
26,6%, discovery language learning (DLL) with 56,6%, and task-based
language learning (TBLL) with 90,0%.
5.3. Student’s learning style toward student’s English achievement
From the result of descriptive statistic about student’s learning style
above, the researcher concluded that the students often use their learning style
to master the materials. Statistically, the percentage of student’s learning style
is 63,7%. So, it means that the students in RPL 2 (Rekayasa Perangkat Lunak)
program at tenth grade of SMK Muhammadiyah 1 Sukoharjo use their learning
style to learn in school. There are three indicators in this variable, namely
19
sensory, personality, and cognitive. Based on percentage of each indicators, the
highest learning style is in personality with 73,4% which consist of extroverted,
intuitive-random, and sensing-sequential. But, the other indicators also give the
contribution. In sensory with 62,2% which consist of visual and auditory. Then,
in cognitive with 55,8% consist of global, analytic, field dependent, and field
independent.
5.4. Student’s motivation, teaching method, and student’s learning style towards
student’s English achievement
The last discussion is about the contribution of all independent variables
(student’s motivation (X1), teaching method (X2), and student’s learning style
(X3)) towards the dependent variable (student’s English grammar achievement
(Y)).
Meanwhile, the calculation result shows that there is positive and
significant contribution of student’s motivation, teaching method, and
student’s learning style towards student’s English grammar achievement in
RPL 2 (Rekayasa Perangkat Lunak) program at tenth grade of SMK
Muhammadiyah 1 Sukoharjo. The first is result of the fresult is 44.937 which is
more than ftable (>2,95). The second is result of the significance is 0,000 which
is less than 0,05. The last is result of the variables can be known from
coefficient determination (R2), and based on table 4.17., the result of (R2) is
0,838. So, it means that the contribution value of all independent variables
namely Student’s Motivation (X1), Teaching Method (X2), and Student’s
Learning Style (X3) towards Student’s English Grammar Achievement (Y) as
a dependent variable in the RPL 2 (Rekayasa Perangkat Lunak) program at
tenth grade of SMK Muhammadiyah 1 Sukoharjo is 83,8% and the other 16,2%
are influenced by other factors which are not discussed in this research.
20
6. Conclusion
In this point, the researcher concludes the ressearch. This conclusion is
dealing with the answer of the research question.
1. There is positive and significant contribution of student’s motivation toward
student’s English grammar achievement in RPL 2 (Rekayasa Perangkat Lunak)
program at tenth grade of SMK Muhammadiyah 1 Sukoharjo value is 36,5%. It
means that student’s motivation in learning English will make them get higher
achievement in English grammar. Otherwise, if the students do not have enough
have motivation to learn English, their achievement in English grammar will not
be higher.
2. There is positive and significant contribution of teaching method toward
student’s English grammar achievement in RPL 2 (Rekayasa Perangkat Lunak)
program at tenth grade of SMK Muhammadiyah 1 Sukoharjo value is 18,0%. It
means that the maximum teaching method in learning also gives the higher
contribution in learning English to make students get higher achievement in
English grammar. Otherwise, the teaching method is not maximum in learning
process, the effect is that the student’s English grammar achievement is not
higher or maximum.
3. There is positive and significant contribution of student’s learning style toward
student’s English grammar achievemnet in RPL 2 (Rekayasa Perangkat Lunak)
program at tenth grade of SMK Muhammadiyah 1 Sukoharjo value is 29,3%. It
means that students suitable learning style used in learning process will make
them get higher achievement in English grammar. Otherwise, when the students
do used not suitable learning style in learning English grammar. Their English
grammar achievement do not higher or maximum.
4. There is positive and significant contribution of student’s motivation, teaching
method, and student’s learning style towards student’s English grammar
achievemnet in RPL 2 (Rekayasa Perangkat Lunak) program at tenth grade of
SMK Muhammadiyah 1 Sukoharjo value is 83,8%. It means that the students

21
will get higher achievement in English grammar if the increase their motivation,
consistently get teaching method, and suitable use of learning style in learning.
Acknowledgements
This paper is based on result of Ardika’s research (2017). Thank you very much
for all those who participated in the making of this article, especially through gives
comments and suggestions to makes this journal is very perfect.
Bibliography
Anthony, Edward M. 1963. Approach, Method, and Technique. English Learning 17:
63-67. Ann Arbor: University of Michigan Press.
Anthony, M. Edward. 1965. Approach Method and Techniques Teaching English As
A Seconda Language Teaching. Oxford: Oxford Up.
Boey, Lim Kiat. 1975. An Introduction to Linguistics for the Language Teacher.
Singapore: Singapore University Press.
Brown, H. Douglas. 2004. Language Assessment Principles and Classroom Practices.
San Fransisco: Person Education, Inc.
Budiono. 2004. Statistika untuk Penelitian. Surakarta: Sebelas Maret University Press.
Dornyei, Z. 2002. Motivational Strategies in the Language Classroom. Cambridge:
University Press.
Fauziati, Endang. 2010. Teaching English as a Foreign Language. Surakarta: Era
Pustaka Utama.
22
Fauziati, Endang. 2014. Methods of Teaching English as a Foreign Language (TEFL).
Surakarta: Era Pustaka Utama.
Gardner, R.C. 1985. Social Psychology and Second Language Learning: The Role of
Attitudes and Motivation. London: Edward Arnold Publishers.
Ghozali, L. 2011. Aplikasi Analisis Multivariate Dengan Program IBM SPSS 19.0.
Semarang: BP-Univesitas Diponegoro.
Gronlund, Norman E. 1991. Measurement and Evaluation in Teaching. New York:
Macmillan Publishing Co, Inc.,).
Hornby, A. S. 2005. Oxford Advanced Learner’s Dictionary of Current English.
Oxford: University Press.
Polit & Hungler. 1999. Nursing Research Principles and Methods. Philadhelpia: WB
Saunders Lippinacoot.
Sugiyono. 2014. Statistika untuk Peneltian. Banding: ALFABETA.
Sutama. 2012. Metode Penelitian Pendidikan Kwantitatif, Kualitatif, PTK, R dan D.
Surakarta: Fairuz Media.