Equatorial transport as diagnosed from nitrous oxide variability
Upload
khangminh22Category
view
3download
0
1
Management matters: Testing a mitigation strategy for nitrous oxide emissions using legumes on intensively managed grassland Kathrin Fuchs1, Lukas Hörtnagl1, Nina Buchmann1, Werner Eugster1, Valerie Snow2 and Lutz Merbold1,3 1 Department of Environmental Systems Science, Institute of Agricultural Sciences, ETH Zurich, Universitätstrasse 2, CH-8092 Zurich, Switzerland 5 2 AgResearch - Lincoln Research Centre, Private Bag 4749, Christchurch 8140, New Zealand 3 Mazingira Centre, International Livestock Research Institute (ILRI), P.O. Box 30709, KE-00100 Nairobi, Kenya
Correspondence to: Kathrin Fuchs ([email protected])
Abstract. Replacing fertilizer nitrogen with biologically fixed nitrogen (BFN) through legumes has been suggested as a
strategy for nitrous oxide (N2O) mitigation from intensively managed grasslands. While current literature provides evidence 10
for an N2O emission reduction effect due to reduced fertilizer input, little is known about the effect of increased legume
proportions potentially offsetting these reductions, i.e. by increased N2O emissions from plant residues and root exudates. In
order to assess the overall effect of this mitigation strategy on permanent grassland, we performed an in-situ experiment and
quantified net N2O fluxes and biomass yields in two differently managed grass-clover mixtures. We measured N2O fluxes in
an unfertilized parcel with high clover proportions vs. an organically fertilized control parcel with low clover proportions using 15
the eddy–covariance (EC) technique over two years. Furthermore, we related the measured N2O fluxes to management and
environmental drivers. To assess the effect of the mitigation strategy, we measured biomass yields and quantified biologically
fixed nitrogen using the 15N natural abundance method.
The amount of BFN was similar in both parcels in 2015, (control: 55 ± 5 kg N ha-1 yr-1 and clover parcel: 72 ± 5 kg N ha-1 yr-
1) due to similar clover proportions (control: 15% and clover parcel: 21%), whereas in 2016 BFN was substantially higher in 20
the clover parcel compared to the much lower control (control: 14 ± 2 kg N ha-1 yr-1 with 4% clover in DM and clover parcel:
130 ± 8 kg N ha-1 yr-1 and 44% clover). The mitigation management effectively reduced N2O emissions by 54% and 39% in
2015 and 2016, respectively, corresponding to 1.0 and 1.6 t ha-1 yr-1 CO2-equivalents. These reductions in N2O emissions can
be attributed to the absence of fertilization on the clover parcel. Differences in clover proportions during periods with no recent
management showed no measurable effect on N2O emissions, indicating that decomposition of plant residues and 25
rhizodeposition did not compensate the effect of fertilizer reduction on N2O emissions. Annual biomass yields were similar
under mitigation management, resulting in a reduction of N2O emission intensities from 0.42 g N2O-N kg-1 DM (control) to
0.28 g N2O-N kg-1 DM (clover parcel) over the two years observation period. We conclude that N2O emissions from fertilized
grasslands can be effectively reduced without losses in yield by increasing the clover proportion and reducing fertilization.
30
2
1 Introduction
Agricultural practices contribute 5.4 Gt CO2-eq. yr-1 (range 11–12%) to global greenhouse gas (GHG) emissions (IPCC, 2014;
Tubiello et al., 2015). The technical potential to mitigate GHG emissions from agriculture ranges between 5.5 and 6.0 Gt CO2-
eq. yr-1 by 2030 (Smith et al., 2008), exceeding current agricultural GHG emissions. The three major anthropogenic GHGs
comprise carbon dioxide (CO2), methane (CH4) and nitrous oxide (N2O). The agricultural sector is responsible for 84% of 5
global anthropogenic N2O emissions (Smith et al., 2008). N2O emissions are primarily attributed to mineral and organic
fertilizer applied to soils, manure left on pastures, biomass burning, crop residues and increased mineralization of soil organic
matter (SOM) caused by the cultivation of soils (IPCC, 2014; Tubiello et al., 2015). Due to the high global warming potentials
of CH4 and N2O (GWP, factor 34 and 298, respectively, on a per mass basis compared to CO2 based on a 100-year time
horizon) (IPCC, 2013b), these gases are more important than the CO2 fluxes from the agricultural sector. However, they remain 10
far less understood than CO2 fluxes because of interactions between multiple underlying processes that are largely unexplored.
In particular, data resolving the dynamics of N2O fluxes from soils are still scarce, as advances in instruments capable of high-
frequency continuous N2O concentration measurements and steadily deployable in the field have only become available in
recent years (Eugster and Merbold, 2015).
Here we test a potential mitigation strategy for nitrous oxide emissions, namely the substitution of fertilizer with biologically 15
fixed nitrogen (BFN) via clover on intensively managed grassland. Processes producing and consuming N2O are numerous
and their complex interactions and dependencies on biotic and abiotic factors are generally known but not yet fully understood
(Butterbach-Bahl et al., 2013). Nevertheless, it is known that N2O emissions in grasslands strongly depend on management
practices (Hörtnagl et al., 2018; Li et al., 2013; Snyder et al., 2009) and reducing N2O emissions while maintaining yields can
thus contribute to climate smart agriculture (CSA) (Lipper et al., 2014). For mitigating N2O emissions from soils, a range of 20
options (e.g. nitrification inhibitors, liming of acid soils, precision fertilizer use, legumes) are available (Bell et al., 2015;
Flessa, 2012; de Klein and Eckard, 2008; Li et al., 2013; Luo et al., 2010; Paustian et al., 2016; Smith et al., 2008). The most
important strategies focus on increasing the nitrogen use efficiency (NUE) of plants by adjusting the rate, type, timing and
placement of organic and inorganic nitrogen fertilizers. With such approaches, the surplus of nitrogen (N) as the substrate for
microbial communities producing N2O, can be reduced or avoided (Flessa, 2012; Galloway et al., 2003; Snyder et al., 2009). 25
Reducing N surplus comes along with other environmental benefits such as reduced ammonia emissions (NH3) and nitrate
(NO3-) leaching, both potential sources of indirect (off-site) N2O emissions. Similar to these mitigation strategies, forage
legume species of the Fabaceae family (e.g. white clover, red clover, lucerne, also called alfalfa) grown in grass-legume
mixtures have the potential to reduce N2O emissions as a cost-effective mitigation strategy (Jensen et al., 2012). In legume-
rich systems, large parts of the plants’ nitrogen (N) demand can be provided from the atmosphere via biological nitrogen 30
fixation (BNF) instead of using fertilizer amendments (Ledgard et al., 2001; Suter et al., 2015). Hence, N input via BNF instead
of fertilizers has the potential to avoid large N surpluses by provisioning N in a manner synchronous to plant needs following
their growth pattern (Crews and Peoples, 2005). Furthermore, BNF is down-regulated by the plant when demand is low and

3
fixed N is located in the nodules and thus not freely available to microbiota in the soil (Lüscher et al., 2014; Nyfeler et al.,
2011).
Our mitigation approach investigated the potential for reductions in slurry application accompanied with increased clover
proportion in the pasture to reduce N2O emissions at the field-scale. Farmers currently use a combination of home-produced
slurries and acquired mineral fertilizer. Our suggestion is to apply the slurry in fields which are currently amended with mineral 5
fertilizers, as the home-produced slurry clearly should be used. This would have an additional benefit of reducing the indirect
greenhouse gas emissions i.e. those during the manufacture of mineral fertilizers. The quantity of these manufacturing
reductions in GHG emissions, which are beyond the field-scale, as well as the full farm nitrogen and GHG budget are well
beyond the focus of this study would need further investigation.
Besides the obvious advantage of lower fertilizer amendments, grass–legume mixtures typically achieve higher yields than 10
average grass and legume monocultures (“overyielding effect”) and often also higher yields than the best performing
monoculture (“transgressive overyielding”), with legume proportions of 40–70% resulting in highest yields (Finn et al., 2013;
Lüscher et al., 2014; Nyfeler et al., 2009). In addition, growing selected legumes in mixtures with non-legumes could improve
resistance and resilience of forage swards against climatic extremes such as severe drought events (Hofer et al., 2017).
Moreover, grass-legume mixtures are beneficial to fodder composition as they are characterized by higher protein contents 15
than grass swards, and show well-balanced feeding values (Phelan et al., 2015). Legume-rich fodder has high crude protein
(CP) contents and was shown to increase voluntary intake by 10–20% (Dewhurst et al., 2003), and to increase milk production
(Dewhurst et al., 2003; Huhtanen et al., 2007).
Despite the known advantages, introducing legumes causes some challenges for farmers. For instance, maintaining a persistent
optimal legume proportion of 30–60% (30–50%, Lüscher et al., 2014; 40–60%, Nyfeler et al., 2011) is not trivial (Guckert and 20
Hay, 2001). Conservation of legumes as hay or silage can be more difficult than for grasses due to lower contents of water-
soluble carbohydrates (WSC) and higher pH buffering capacities (Phelan et al., 2015). When protein-rich forage is fed without
sufficient WSC, N cannot be used efficiently by livestock and N excretion from the animals increases (Phelan et al., 2015).
However, the balance between CP and WSC can be provided by carbohydrates from other plant species in mixtures (Lüscher
et al., 2014). Furthermore, exceptionally high legume proportions (> 80%) and legume monocultures can lead to similar N 25
surplus due to high levels of BFN as found in fertilized fields, and consequently to high soil nitrate concentrations (Weisser et
al., 2017) which can subsequently lead to enhanced N2O emissions (Jensen et al., 2012). So far, relatively few in situ
measurements at plot scale have been carried out to investigate the effect of legumes and grass-legume mixtures on N2O
emissions (e.g. studies by Klumpp et al., 2011; Virkajärvi et al., 2010; Schmeer et al., 2014; Niklaus et al., 2016; Li et al.,
2011). The contribution of legumes to total field-scale N2O emissions was attributed to decomposition of N-rich plant residues 30
and N from root exudates (Millar et al., 2004; Rochette and Janzen, 2005). Although it was shown that some Rhizobium
species are able to produce N2O via rhizobial denitrification (O’Hara and Daniel, 1985; Rosen and Ljunggren, 1996), direct
N2O emissions from BNF are negligible compared to N2O from denitrification rates for most investigated species and hence
result in no significant effect on field-scale N2O emissions (Garcia-Plazaola et al., 1993; Rochette and Janzen, 2005).
4
To date, experimental studies investigating year-round N2O exchange in grassland systems are scarce (Skinner et al., 2014),
and measurements of high temporal resolution in grassland relying on fertilizer input versus grassland based on BFN are
missing. Thus, the aim of this study was to test the N2O mitigation strategy of substituting N fertilizer with BFN by increasing
the clover proportion in grassland. Therefore, we measured N2O exchange and productivity in two adjacent grassland parcels,
one with an intensive “business as usual” management compared to a parcel where fertilizer amendments were substituted by 5
over-sowing clover. Our specific objectives were (1) to quantify N2O emissions from both parcels, (2) to identify the
meteorological and soil chemical drivers of N2O emissions, (3) to assess if substituting N fertilizer with BFN was an effective
N2O mitigation strategy. We hypothesized considerably lower N2O emissions in the clover parcel, lower soil nutrient
availability in the clover parcel and thus no effect of legume proportions on N2O emissions, and hypothesized fertilization to
play the dominant role in driving N2O emissions in the control parcel. We further expected minor differences in grassland 10
yield between the two parcels, and as a consequence, reduced N2O emission intensities in the clover parcel.
2 Material and methods
2.1 Site description
The experiment was set up at the Swiss FluxNet site Chamau (CH-Cha), located in the valley of the Reuss river on the Swiss
plateau, approximately 30 km southwest of Zurich (47°12′36.8″ N 8°24′37.6″ E, 393 m a.s.l.). The site has been well 15
investigated in terms of CO2 exchange (Burri et al., 2014 using static chambers (SC); Zeeman et al., 2010 using EC), as well
as for N2O and CH4 exchange under management that is typical for Swiss grasslands located on the Swiss Plateau (Imer et al.,
2013 using SC for N2O and CH4 and EC for CO2; Merbold et al., 2014 using EC for all three gases; Wolf et al., 2015 using EC
and SC for N2O). Two grassland parcels of 2.2 and 2.7 ha, are located adjacent to each other and have a similar management
history, i.e. permanent grassland since at least 2002 with a restoration year in 2012 (Merbold et al., 2014). The most abundant 20
species are English ryegrass (Lolium perenne) (a mixture of early and late varieties), common meadow-grass (Poa pratensis),
red fescue (Festuca rubra), timothy (Phleum pratense), white clover (Trifolium repens; small leaf varieties PEPSI, HEBE and
big leaf varieties FIONA, BOMBUS), red clover (Trifolium pratense; variety BONUS) sown in 2012, complemented by the
volunteer species dandelion (Taraxacum officinale) and rough meadow-grass (Poa trivialis). Each parcel is usually mown four
to six times per year for silage or hay production (Table 1). Each harvest is commonly followed by a fertilizer amendment, 25
predominantly in the form of liquid slurry (average ± SD over 11 years (2003–2014) 266 ± 75 kg N ha-1 yr-1).
The meteorological conditions at the site are characterized by an average annual temperature of 9.1 °C and an average annual
precipitation sum of 1151 mm (Sieber et al., 2011). The soil is a gleysol/cambisol, with bulk densities in 0-0.2 m depth ranging
between 0.9 and 1.3 g cm-3 (Roth, 2006) and a soil pH of about 6.5 (Labor Ins AG, Kerzers, Switzerland, in 2014).
5
2.2 Experimental setup and management activities
The field experiment comprised a control and a clover treatment parcel (Fig. 1). The control parcel was managed similarly to
previous years, including the common management activities described above (harvest, fertilizer application and occasional
grazing, Table 1). The eddy covariance tower, including meteorological sensors, was located at the border between the two
parcels (Fig. 1). We used the two years 2013 and 2014 as reference years (no treatment). In order to test the N2O mitigation 5
option, the treatment parcel was over-sown in March 2015 and April 2016 with clover (Trifolium pratense L. and two varieties
of Trifolium repens L.) to increase the clover proportion of the sward in the clover parcel. In contrast to the control parcel on
which 296 and 181 kg N ha-1were added in 2015 and 2016, respectively (Table 1), no fertilizer was applied on the clover parcel
during the experiment. To assist clover establishment and increase the clover proportion in the clover parcel, the parcel was
grazed with sheep after over-sowing in mid-June and beginning of July 2015 to keep the grass species short and thus reduce 10
competition during the clover establishment phase. The control parcel was mown once instead of being grazed during this time
(beginning of July). All other harvests took place at the same day on both parcels (see Table 1 for specific management data
including dates, slurry composition and sowing rate).
Management activities comprised the regular harvest activities (mowing, swathering, and subsequent biomass removal) on
both parcels, with subsequent slurry applications in the control parcel, besides occasional grazing, plus the over-sowing of the 15
clover parcel. During our reference years 2013 and 2014, management was identical in both parcels in 2013, while in 2014
instead of mowing, cattle were grazing in the control parcel whereas the clover parcel was mown, resulting in similar reference
fluxes from both parcels. Yields and exports of C and N were quantified by analysing biomass, sampled destructively during
each harvest event (see Sect. 2.7 on vegetation samples), for C and N contents in the years 2015–2016. The fraction of N
originating from BNF in the harvested biomass (2015–2016) was quantified via the 15N natural abundance method (Unkovich, 20
2008). Combined with the legume biomass obtained by destructive biomass sampling at all harvest dates, we were able to
calculate total amounts of BFN in the harvested biomass. Beyond our own observations, detailed management information for
the years 2001–2016 were recorded by the farm staff in a field book. The overall amount of organic and mineral fertilizer
applied to the field was documented, subsamples of the applied slurry were taken on the day of application (since 2007) and
analysed in an external laboratory (LBU, Eric Schweizer AG, Thun, Switzerland). Slurry applied to the control parcel was 25
digested cattle and pig slurry obtained from a local biogas plant (for chemical composition, see Table 1). Records in the field
book also included information on herbicide application, harrowing, rolling and over-sowing (for details, see Table 1).
2.3 Greenhouse gas flux measurements
Greenhouse gas exchange (CO2, N2O, CH4, H2O) was continuously measured at the site using the eddy covariance (EC)
technique, using a mast located at the boundary between the two parcels (Fig. 1). The choice of the EC tower location resulted 30
in the fetch being located most of the time either in one or the other parcel, taking advantage of the two prevailing wind
directions. The flux measurement setup consisted of a 3-D sonic anemometer (Solent R3, Gill Instruments, Lymington, UK),
6
an open-path infrared gas analyser for CO2 and H2O concentrations (LI-7500, LiCor Biosciences, Lincoln, NE, USA) and a
quantum cascade laser absorption spectrometer (QCLAS) capable to measure N2O, CH4 and H2O concentrations (mini-
QCLAS, Aerodyne Research Inc., Billerica, MA, USA) (Merbold et al., 2014) at 10 Hz resolution. The air inlet for the laser
absorption spectrometer was located at a height of 2.1 m, just below the sonic anemometer head. The air was pulled through a
6 m long tube to the QCLAS located in a temperature-controlled weather proof box. Data acquisition and data storage were 5
conducted according to the setup described in (Eugster and Plüss, 2010). From the high frequency measurements of these
sensors, 10 and 30 min flux averages of the respective trace gases were calculated. The basic EC system, measuring CO2 and
H2O exchange, has been running since 2005 (Eugster and Zeeman, 2006; Zeeman et al., 2010) and was complemented with
the field-suitable QCLAS for high frequency (10 Hz) N2O concentration measurements in 2012 (Merbold et al., 2014). Thus,
more than two years of reference fluxes from both parcels under similar management regimes were collected before the 10
beginning of the study presented here.
2.4 Meteorological and soil microclimate measurements
Meteorological variables measured at the Chamau site included air temperature and relative humidity (2 m height; Hydroclip
S3 sensor, Rotronic AG, Switzerland), all components of the radiation balance (2 m height; CNR1, Kipp & Zonen B.V., Delft,
The Netherlands), incoming and reflected photosynthetic active radiation (2 m height; PARlite sensor, Kipp and Zonen, Delft, 15
the Netherlands) and precipitation (1 m height; tipping bucket rain gauge model 10116, Toss GmbH, Potsdam, Germany)
(Table S1, Fig.1). Less than two meters from the tower, basic soil microclimate measurements were carried out. These
measurements included volumetric soil water content (at 0.04 and 0.15 m depth; ML2x sensors, Delta-T Devices Ltd.,
Cambridge, UK) and soil temperature (at 0.01, 0.02, 0.05, 0.10, and 0.15 m depth; TL107 sensors, Markasub AG, Olten,
Switzerland). In addition to the sensors close to the tower, each parcel was equipped with a similar set of soil sensors in 2015 20
(see soil plots, Fig.1) to compare potential differences in soil microclimatic conditions and subsequent effects on GHG fluxes.
Soil pH (at 0.1 m depth) and soil oxygen (O2) concentration (at 0.1, 0.2 m depth) were automatically measured using in-house
custom-made sensors (based on ISFET pH-sensor kit, Sentron, Roden, Netherlands and EC410 Oxygen sensors, SGX
Sensortech, Chelmsford, UK). In addition, soil water content (at 0.05, 0.1, 0.2, 0.5, 0.8 m soil depth; EC-5, Decagon, Pullman,
WA, USA), soil temperature (at 0.05, 0.1, 0.2, 0.5, 0.8 m soil depth; T109, Campbell Scientific Inc., Logan, UT, USA), matrix 25
potential (at 0.1, 0.2 m soil depth; Tensiometer T8, UMS GmbH, Munich, Germany) and soil heat flux (at 0.02 m soil depth;
HFP01, Hukseflux B.V., Delft, Netherlands) were recorded. Some of the soil water content sensors stopped functioning on
18th June 2015 (at 0.05, 0.1, 0.2 m) and were thus replaced on 6th August 2015 (Decagon 5TM, Pullman, WA, USA). Signals
of these sensors were sampled at 10 s intervals and stored as 10 min averages on a data logger (CR1000; Campbell Scientific
Inc., Logan, USA). Sensors at the tower and in its vicinity were previously connected to a CR10X model (Campbell Scientific 30
Inc., Logan, USA), and since March 2016 to a newer data logger (CR1000; Campbell Scientific Inc., Logan, USA).
7
2.5 Soil nutrient availability
For determining ammonium (NH4+), nitrate (NO3-) and dissolved organic carbon (DOC) concentrations in the soil, topsoil
samples were taken down to 0.2 m depth. The nominally-biweekly sampling was intensified to daily intervals for seven
consecutive days following slurry application (see also Wolf et al., 2015). Five samples per parcel were taken along a transect
within the average footprint of the EC measurements. Extraction of NH4+, NO3- and DOC was achieved by shaking 15 g of 5
fresh soil with 50 mL 0.5 M K2SO4 for 1 h and subsequent filtering (Whatman no. 42 ashless filter paper, 150 mm diameter,
GE Healthcare AG, Glattbrugg, Switzerland) into centrifuge tubes (50 mL tubes, PP, Greiner Bio-One GmbH, St. Gallen,
Switzerland). From the extract, a subsample was acidified for the measurement of DOC by combustion in a total organic C
and N analyser (multi N/C TOC analyser 2100S, Analytik Jena AG, Jena, Germany). NH4+ and NO3- were analysed
colorimetrically (Vis v-1200, VWR International, Radnor, PA, USA). Thereafter, the remaining soil samples were dried for 10
one week at 105 °C and weighed before and after drying in order to determine the gravimetric soil water content.
2.6 Vegetation sampling and determination of biological nitrogen fixation
Vegetation samples were taken from each parcel at each harvest date by destructive sampling using harvest frames (0.1 m2; n
= 10 for each parcel per date randomly sampled within the EC footprint, clipped at mowing height of 0.05 m, Table S1).
Vegetation was separated into legumes and non-legumes (grasses and forbs) to assess the legume proportion in the dry biomass. 15
The only legume species found on site were the sown clover species Trifolium pratense L. and Trifolium repens L.. Vegetation
samples were dried at 70 °C for one week and weighed before and after drying to estimate the water content. Milling of dry
biomass samples was done separately for legumes and non-legumes, and a subsample of 5 mg was weighed into tin capsules
for further analyses of total C and N, δ13C and δ15N (n = 5 for each parcel per date). C and N concentrations, as well as δ13C
and δ15N values were analysed with a Flash EA 1112 Series elemental analyser (Thermo Italy, former CE Instruments, 20
Rhodano, Italy) coupled to an isotope ratio mass spectrometer (DeltaplusXP, Finnigan MAT, Bremen, Germany). Estimates
of BFN were based on the δ15N measurement. The percentage of shoot N derived from BNF (%Ndfa, nitrogen derived from
atmosphere) in legume biomass was calculated with the 15N natural abundance method, (Boddey et al., 2000; Unkovich, 2008),
following Eq (1):
%!"#$ =&'()*+,-/'
()*0,123,4
&'()*+,-–64× 100, (1) 25
where %Ndfa is the percentage of legume shoot N derived from atmosphere, δ15Nref is the δ15N value of a non-fixing reference
plant (i.e. grass species) growing in the proximity of the legume and δ15Nlegume is the δ15N value of the legume shoot. The B
value is the δ15N signature of the legume species growing without N available from soil. B was estimated as the weighted mean
of B values of Trifolium repens L. reported in the literature (–1.48 × ⅔) and Trifolium pratense L. (–0.94 × ⅓) (B values from
Unkovich, 2008, Appendix 4). Weights were chosen according to the sown legume species composition of ⅔ white clover 30
and ⅓ red clover. The %Ndfa in legume shoots was calculated for each legume biomass sample taken. The non-legumes cut
8
within the same harvest frame as the legumes were used as reference delivering the δ15Nref value (Carlsson and Huss-Danell,
2014). For annual values, harvests and their components, uncertainty estimates were calculated with the Gauss uncertainty
propagation (Table 2). Vegetation development was tracked via leaf area index (LAI) measurements (LAI-2000, LiCor
Biosciences, Lincoln, NE, USA) carried out on both parcels biweekly as well as before and after mowing or grazing activities.
Vegetation height and plant development as well as grazing activities within the footprint were further monitored via standard 5
webcams (IN-5907HD, INSTAR Deutschland GmbH, Huenstetten, Germany).
2.7 Eddy covariance flux post-processing
Net ecosystem fluxes of CO2, N2O and CH4 were quantified by the eddy covariance (EC) method as the covariance between
turbulent fluctuations calculated by Reynolds averaging of 10-min blocks of data of vertical wind speeds and trace gas molar
densities (CO2) or mixing ratios (N2O, CH4). Molar densities of CO2 were corrected for water vapour transfer effects (Webb 10
et al., 1980). Frequency response corrections applied to raw fluxes accounted for high-pass (Moncrieff et al., 2004) and low-
pass filtering (CO2: (Horst, 1997); N2O and CH4: (Fratini et al., 2012). N2O and CH4 fluxes were additionally corrected for
spectral losses due to instrument separation (Horst and Lenschow, 2009). All fluxes were calculated using the EddyPro
software (v6.1.0, LI-COR Inc., Lincoln, NE, USA).
Before flux calculations, the statistical quality of the raw time series was checked (Vickers and Mahrt, 1997). Raw high-15
frequency data used in flux calculations were rejected (1) if raw measurements were outside a physically plausible range
(vertical wind speed: ± 5 m s-1; CO2: 200 to 900 ppm, N2O: below 250 ppb, CH4: below 1700 ppb), (2) if spikes, defined as
data points outside pre-defined sigma (σ) plausibility ranges (vertical wind speed: ± 5σ, CO2: ± 3.5σ, N2O and CH4: ± 8σ),
accounted for more than 1% of the respective raw time series, or (3) if more than 10% of available raw data were statistically
different from the overall trend in a specific 10-min period. Raw CO2 measurements were only used for flux calculations if the 20
window dirtiness signal from the open-path infrared gas analyser did not exceed 80% on average per 10-min data block. Half-
hourly fluxes were rejected, (1) if fluxes were outside pre-defined ranges (CO2: ± 50 umol m-2 s-1; N2O: between –50 and 100
nmol m-2 s-1; CH4: between –400 and 800 nmol m-2 s-1), (2) if the steady state test (Foken and Wichura, 1996) was outside ±
30%, or (3) if the test on developed turbulent conditions was outside ± 30% (Foken et al., 2004; Foken and Wichura, 1996).
The analytical flux footprint model by Kljun et al. (2015) was used for footprint calculations. 25
The boundary between the two parcels is oriented approximately in East-West direction (75° degrees from north, Fig. 1). Each
10-min flux average was attributed to a parcel only if a minimum of 80% of the flux footprint was in the direction of the
respective parcel (i.e. footprint weights from the direction of the respective parcel divided by the total of all flux footprint
weights > 80%). Similar methods with EC fluxes from one setup being attributed to certain land use categories according to
the respective footprint area were successfully used before (e.g. Biermann et al., 2014; Gourlez de la Motte et al., 2018; Neftel 30
et al., 2008; Rogiers et al., 2005; Sintermann et al., 2011). After quality control, data coverage for N2O exchange for both years
was 62% of the entire period (details in Table 3). We observed moderate diurnal variations in flux origin from the two parcels
(Fig. S2). Nevertheless, a similar share of quality-controlled N2O fluxes was obtained from the control (48%) and the clover

9
parcel (52%) during the observation period. The net effect in N2O emission differences represents a conservative estimate, as
N2O emissions from the clover parcel are more likely to be overestimated and fluxes from the control parcel are more likely
to be slightly underestimated (Fig. S2). Our aim was to analyse flux data originating from either one or the other parcel and
avoid mixed GHG fluxes due to wind direction changes during the flux-averaging interval. As the standard 30-min averaging
interval often resulted in mixed flux signals, we reduced the averaging period to 10 min, which resulted in a clearer 5
representation of the temporal dynamics of GHG fluxes from each individual parcel. On grassland systems in flat terrain (as
the Chamau site), eddies with a time scale of 1–5 minutes are dominating, and thus fluxes based on a 10-min averaging interval
adequately represent the atmospheric exchange of GHGs (Lenschow et al., 1994). Our comparison of flux data (full time
series) based on 10 and 30 minutes averaging intervals showed that the average of 10-min N2O fluxes was only 2.3% lower
than the 30-min N2O fluxes. Daily averages were calculated based on all data points per parcel that fulfilled quality criteria 0 10
(best quality fluxes) or 1 (fluxes suitable for general analysis such as annual budgets) (Mauder and Foken, 2004).
2.8 Comparison of N2O fluxes between parcels
We applied non-parametric bootstrapping in order to estimate the mean annual N2O fluxes from both parcels and their
respective confidence intervals. From all available 10-min fluxes, we took 1000 bootstrapping samples of each day per parcel.
Averaging over time results in the bootstrapping estimate of the average annual flux, while the 0.025 and 0.975 percentiles of 15
the bootstrapping distribution reveal the 95% confidence intervals for the mean flux per parcel.
Relative flux differences between parcels were defined as the difference of daily averages between clover and control parcels
with respect to the average flux from the control, calculated based on all days for which data from both parcels were available.
This was done to minimize potential biases associated with periods of unequal coverage of both parcels. Calculations were
done following Eq. (2): 20
∆> >⁄ =@A0BC,+–@ABDE+B0
@ABDE+B0 (2)
>FGHIJK and >FHLMKHG are daily average fluxes from the clover and the control parcels, respectively. Before being able to identify
differences in N2O exchange during the experimental periods, two years of flux data (2013 and 2014) were used to quantify
how much the fluxes and the productivity from the two parcels deviated under exactly the same (2013) and similar (2014)
management practice. For the calculation of CO2 equivalents (CO2-eq) we used factor 298, which is the current IPCC global 25
warming potential including climate-carbon feedbacks on a 100 year basis (IPCC, 2013a).
2.9 Management and rain event specific N2O exchange
Three management event types and one natural event type were analysed in more detail. These included organic fertilizer
application, harvesting (mowing), sheep grazing, and rain events following dry weeks. When fertilization took place less than
seven days after harvest, days after fertilization were classified as fertilization and thus not associated with the harvest event. 30
If days after harvest overlapped with days before fertilization, these days were excluded from the fertilization class. In this

10
case, the data displayed and analysed only refer to days after harvest but not to days before fertilization in order to avoid
misleading references. A rain event was defined with > 4 mm precipitation following a dry period with < 1.5 mm collected
during the 7 days preceding the rain event. When a fertilization event took place at the same time as the rain event (9th August
2015 and 16th July 2016), the event was classified as fertilization event but not as rain event. Grazing overlapped with a rain
event on 15th June 2015 and 1st July 2015, thus these days were excluded from the rain event analysis. A pre-analysis was 5
conducted for all these events, comparing N2O emissions during seven days before the event to seven days after the start of
the event (incl. starting date). Grazing showed no significant differences between emissions before and during grazing, nor did
rain events. These categories were therefore not considered in the generalized additive model (GAM, see Sect. 2.11).
2.10 Statistical analysis
In order to assess the influence of management and environmental drivers of N2O fluxes, we used semi-parametric generalized 10
additive modelling (Wood, 2006). We expected non-linear effects of some predictor variables on N2O emissions, such as soil
water content and oxygen concentration. The GAM model is adequate for including these non-linear effects because it
prescribes no parametric relationship between predictors and response variable. Instead, the model fits smoothing splines
(piecewise defined polynomials) to the relationship between each predictor and the response variable, allowing highly flexible
curves if needed (i.e. if improving the goodness of fit), but resulting in the smoothest possible relationship (i.e. linear 15
relationship) if suitable. The response variable was predicted by the sum of all these smooth functions (“additive”). The degree
of smoothing for each additive function was determined using generalized cross-validation (GCV).
The response variable was the log-transformed N2O flux in order to better meet the assumptions of normally distributed
residuals. The additive model with a log-transformed response corresponds to a model with multiplicative effects in the
original scale. Thus, the predictors’ effects influence N2O fluxes multiplicatively. The influence of management (i.e. 20
fertilization and harvest) and environmental driver variables (e.g. soil meteorological variables, soil chemical variables) on
N2O emissions was investigated based on daily averages of measured 10-min flux data and corresponding environmental
variables. For introducing management influence in the regression analysis, dates were labelled according to three a priori
selected management categories only: post-fertilization (F), post-harvest (H) and no management (here defined as no
management during the previous week) (0) in combination with the treatment clover (Clo) or control (Ctr). Thus, five 25
management categories existed (Ctr-F, Ctr-H, Ctr-0, Clo-H, Clo-0). The control parcel without recent management activity
(Ctr-0) served as the reference level in comparison to all other management categories. As grazing intensity is low at the site,
and grazing did not show any influence on N2O exchange, we did not include grazing in the GAM analysis. The full set of
predictors included soil temperature, soil water content, oxygen concentration, NH4-, NO3+ and DOC concentration for
substrate availability, net ecosystem exchange (NEE) of CO2 as a proxy for plant activity, and the categorical variable for 30
management activity.
All predictors were included as non-linear terms in the first step, and the basic GAM was fitted using generalized cross-
validation as the criterion for the parameter choice resulting in the best fit. This method resulted in several terms being included
11
in the GAM as linear predictors (empirical degrees of freedom, edf = 1). These were finally treated as linear terms in order to
obtain their effect sizes. For linear predictors such as soil temperatures, effect sizes can be interpreted as in linear regression
models. Soil water content and oxygen concentration showed a non-linear influence on log-N2O emissions (reverse U-shape),
as estimated by the GAM to require more degrees of freedom (edf > 1). These were kept as (nonlinear) smooth terms in the
GAM. Stepwise backward elimination was applied for model selection, whereby the number of predictors was reduced until 5
the local minimum value of the Akaike Information Criterion (AIC) was found. Residual analysis showed that the final model
residuals were in line with the assumptions of a Gaussian distributed, homoscedastic error term with a mean of zero.
Due to focusing the analysis on in situ measured data only, models that included the soil sampling variables are limited to the
observational days on which manually sampled data were available (full model and optimized model). To check consistency
of these results (i.e. effect sizes) with results from a wider range of observations (year-round continuous measurements) we 10
built a model (“simple model”) based on only the major driver variables soil temperatures, SWC and management as predictors,
with the advantage of including more observations due to the wide coverage of these variables. Negative N2O fluxes were
analysed separately, but no significant effects of the same set of predictors on N2O uptake were found. For auto-correlated
time series (i.e. soil microclimatic variables) the t-test on the differences was corrected for autocorrelation by calculating the
effective sample sizes according to (Wilks, 2011:147) and using the effective sample sizes in the tests, resulting in adjusted 15
standard errors and p values (seadj; padj). All statistical analyses were performed with the open source software R (R Core Team,
2016), using the “mgcv” package (Wood, 2011) for generalized additive modelling.
3 Results
3.1 General environmental conditions
Mean annual temperatures in 2015 and 2016 were 10.3 °C and 9.7 °C, respectively (Fig. 2a). Thereby 2015 was 0.2 °C warmer 20
and 2016 was 0.4 °C colder than the previous five years which averaged 10.1 °C. Daily photosynthetically active radiation
(PAR) followed the typical seasonal pattern (Fig. 2b). Annual precipitation was 1029 mm in 2015 and 1202 mm in 2016,
which is 7% lower and 9% higher, respectively (Fig. 2c), than the 5-year mean annual precipitation (1101 mm). While both
years were characterized by a typical wet beginning of the growing season (MAM with 376 mm in 2015 and 379 mm in 2016),
similar to the five years prior to our period of analysis, the peak growing season (JJA) in 2015 was considerably drier (260 25
mm precipitation) than in 2016 (396 mm, Fig. 2c). Growing season, defined by Tair exceeding 5 °C for at least five subsequent
days, started on 17th March 2015 and 30th January 2016. Starting dates of net CO2 uptake for at least ten subsequent days, an
alternative indicator for start of the growing season, were 27th February 2015 and 8th March 2016, similar to previous years.
3.2 Soil microclimate
An important precondition for the N2O mitigation experiment is to check for approximately equal soil microclimatic conditions 30
in both parcels, i.e. to exclude the possibility that soil microclimatic variables did act as confounders in the experiment. Soil
12
temperatures were similar in the control (mean 14.5 °C) and the clover parcel (13.6 °C) with measured differences being
smaller than the sensor accuracy of ± 1°C. While air temperature fell below 0 °C, soil temperature at 0.1 m depth never fell
below 0 °C during the course of the experiment (Fig. 3a). This was also the case for the two reference years 2013 and 2014.
Volumetric soil water content (at 0.1 m depth) were similar in the control (33 ± 4%) and the clover parcel (31 ± 5%). The
difference between treatments was within the sensor accuracy of ± 3% (Fig. 3b). Oxygen concentration (at 0.1 m depth) ranged 5
between 15 and 21% during three quarters of the measurement period and decreased consistently to 0% during spring in both
years (Fig. 3c). Moreover, temporal patterns seen in O2 concentration were not significantly different in both parcels (measured
difference 0.3 ± 0.2% se.adj; p.adj = 0.075). Oxygen concentration during summer (JJA) 2015 was higher compared to 2016
(t= 2.64; p.adj = 0.03), as a consequence of less rainfall compared to summer 2016 (Fig. 2c). Soil oxygen concentration was
inversely related to soil water content. 10
3.3 Soil mineral N and DOC concentration
Ammonium (NH4+) concentration in the soil peaked on each day of slurry application in the control parcel and declined during
the following few days (Fig. 4a). NH4+-N concentration measured in the topsoil ranged between 0.4 and 19.2 mg NH4+-N kg-
1 dry soil in the control parcel during the two years of observations. Significantly lower NH4+-N concentration was measured
in the clover parcel (0.6–11.1 mg NH4+-N kg-1 dry soil; paired Wilcoxon-test, p < 0.01). While NH4+-N concentration peaked 15
after fertilization events in the control parcel, no consistent patterns were observed in the clover parcel where no fertilizer was
applied. Soil nitrate (NO3-) concentration ranged between 1.7 and 27.7 mg NO3--N kg-1 dry soil in the control parcel (Fig. 4b).
Similar to the observations found for NH4+-N, significantly lower soil nitrate levels (0.6–18.9 mg NO3--N kg-1 dry soil) were
found in the clover parcel (paired Wilcoxon-test, p < 0.01). NO3--N concentration significantly increased over the course of
the season in the control parcel (Mann-Kendall-test, 2015 tau = 0.50, p < 0.001; 2016 tau = 0.40, p < 0.001). Such trend was 20
not observed in the clover parcel in 2015, while it was significant in 2016 (Mann-Kendall-test, 2015: tau = 0.15, p > 0.05;
2016: tau = 0.35, p < 0.01) (Fig. 4b). Dissolved organic carbon (DOC) measured regularly from soil samples resulted in a
range of 42–234 mg C kg-1 dry soil in the control parcel (Fig. 4c). Again, significantly lower values were measured for DOC
in the clover parcel (0.6–160 mg C kg-1 dry soil) (paired Wilcoxon-test, p < 0.01) compared to the control. As observed for
NO3--N, DOC concentration significantly increased with the growing season in the control parcel in both years and in the 25
clover parcel in 2016 (Mann-Kendall-test, control parcel 2015: tau = 0.25, p < 0.01, 2016: tau = 0.23, p < 0.05; clover parcel
2015: tau = 0.14, p > 0.5, 2016: tau = 0.26, p < 0.05) (Fig. 4bc). Overall, soil mineral N and DOC concentrations were lower
in the clover parcel.
3.4 Sward productivity and vegetation composition
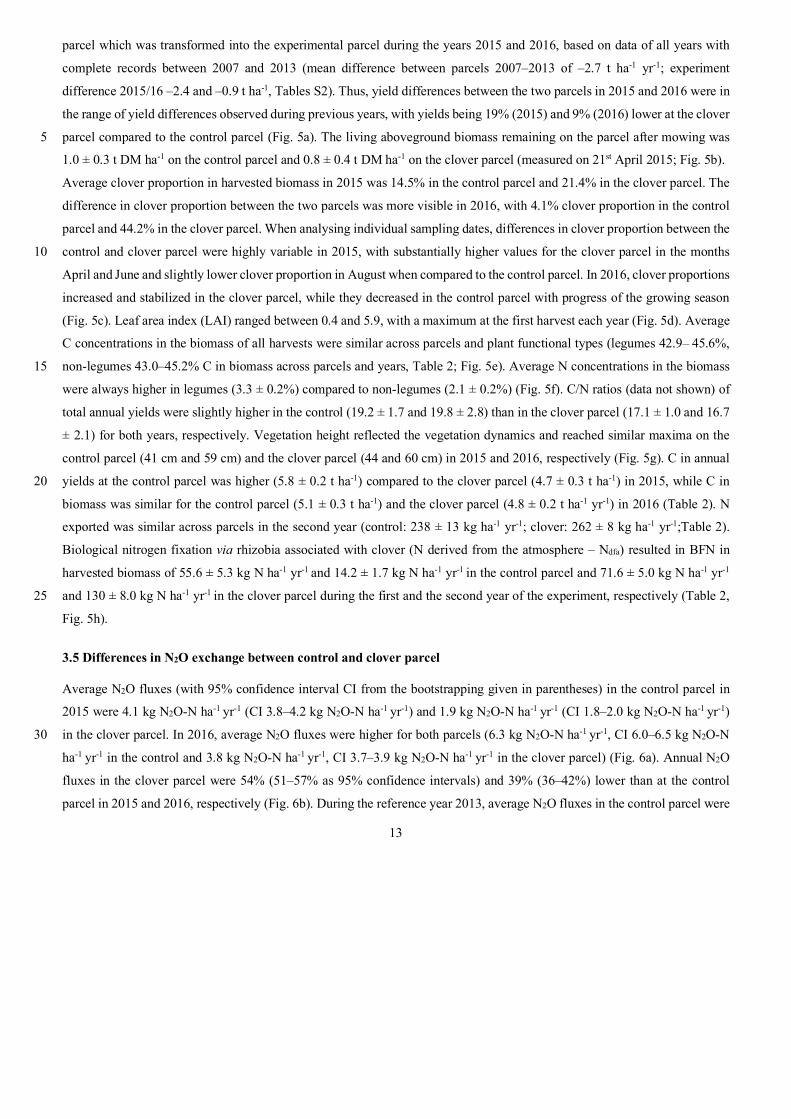
Total annual yields (mean ± SE) of the control parcel were 12.8 ± 0.5 t dry matter (DM) ha-1 in 2015 and 11.9 ± 0.4 t DM ha-30 1 in 2016, while yields of the clover parcel were 10.4 ± 0.7 t DM ha-1 and 11.0 ± 0.5 t DM ha-1 in 2015 and 2016, respectively
(Table 2). Previous years’ yields of both parcels were 9.3 ± 3.2 t DM ha-1 yr-1 in the control and 6.6 ± 2.3 t ha-1 yr-1 in the
13
parcel which was transformed into the experimental parcel during the years 2015 and 2016, based on data of all years with
complete records between 2007 and 2013 (mean difference between parcels 2007–2013 of –2.7 t ha-1 yr-1; experiment
difference 2015/16 –2.4 and –0.9 t ha-1, Tables S2). Thus, yield differences between the two parcels in 2015 and 2016 were in
the range of yield differences observed during previous years, with yields being 19% (2015) and 9% (2016) lower at the clover
parcel compared to the control parcel (Fig. 5a). The living aboveground biomass remaining on the parcel after mowing was 5
1.0 ± 0.3 t DM ha-1 on the control parcel and 0.8 ± 0.4 t DM ha-1 on the clover parcel (measured on 21st April 2015; Fig. 5b).
Average clover proportion in harvested biomass in 2015 was 14.5% in the control parcel and 21.4% in the clover parcel. The
difference in clover proportion between the two parcels was more visible in 2016, with 4.1% clover proportion in the control
parcel and 44.2% in the clover parcel. When analysing individual sampling dates, differences in clover proportion between the
control and clover parcel were highly variable in 2015, with substantially higher values for the clover parcel in the months 10
April and June and slightly lower clover proportion in August when compared to the control parcel. In 2016, clover proportions
increased and stabilized in the clover parcel, while they decreased in the control parcel with progress of the growing season
(Fig. 5c). Leaf area index (LAI) ranged between 0.4 and 5.9, with a maximum at the first harvest each year (Fig. 5d). Average
C concentrations in the biomass of all harvests were similar across parcels and plant functional types (legumes 42.9– 45.6%,
non-legumes 43.0–45.2% C in biomass across parcels and years, Table 2; Fig. 5e). Average N concentrations in the biomass 15
were always higher in legumes (3.3 ± 0.2%) compared to non-legumes (2.1 ± 0.2%) (Fig. 5f). C/N ratios (data not shown) of
total annual yields were slightly higher in the control (19.2 ± 1.7 and 19.8 ± 2.8) than in the clover parcel (17.1 ± 1.0 and 16.7
± 2.1) for both years, respectively. Vegetation height reflected the vegetation dynamics and reached similar maxima on the
control parcel (41 cm and 59 cm) and the clover parcel (44 and 60 cm) in 2015 and 2016, respectively (Fig. 5g). C in annual
yields at the control parcel was higher (5.8 ± 0.2 t ha-1) compared to the clover parcel (4.7 ± 0.3 t ha-1) in 2015, while C in 20
biomass was similar for the control parcel (5.1 ± 0.3 t ha-1) and the clover parcel (4.8 ± 0.2 t ha-1 yr-1) in 2016 (Table 2). N
exported was similar across parcels in the second year (control: 238 ± 13 kg ha-1 yr-1; clover: 262 ± 8 kg ha-1 yr-1;Table 2).
Biological nitrogen fixation via rhizobia associated with clover (N derived from the atmosphere – Ndfa) resulted in BFN in
harvested biomass of 55.6 ± 5.3 kg N ha-1 yr-1 and 14.2 ± 1.7 kg N ha-1 yr-1 in the control parcel and 71.6 ± 5.0 kg N ha-1 yr-1
and 130 ± 8.0 kg N ha-1 yr-1 in the clover parcel during the first and the second year of the experiment, respectively (Table 2, 25
Fig. 5h).
3.5 Differences in N2O exchange between control and clover parcel
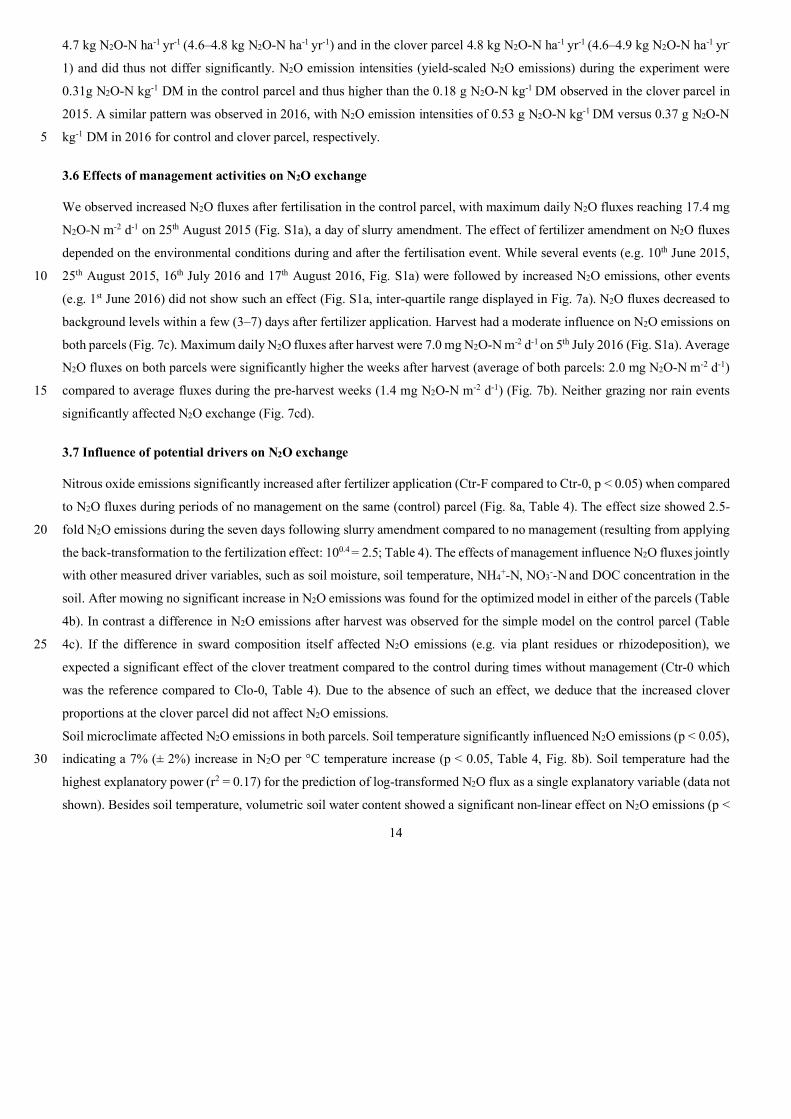
Average N2O fluxes (with 95% confidence interval CI from the bootstrapping given in parentheses) in the control parcel in
2015 were 4.1 kg N2O-N ha-1 yr-1 (CI 3.8–4.2 kg N2O-N ha-1 yr-1) and 1.9 kg N2O-N ha-1 yr-1 (CI 1.8–2.0 kg N2O-N ha-1 yr-1)
in the clover parcel. In 2016, average N2O fluxes were higher for both parcels (6.3 kg N2O-N ha-1 yr-1, CI 6.0–6.5 kg N2O-N 30
ha-1 yr-1 in the control and 3.8 kg N2O-N ha-1 yr-1, CI 3.7–3.9 kg N2O-N ha-1 yr-1 in the clover parcel) (Fig. 6a). Annual N2O
fluxes in the clover parcel were 54% (51–57% as 95% confidence intervals) and 39% (36–42%) lower than at the control
parcel in 2015 and 2016, respectively (Fig. 6b). During the reference year 2013, average N2O fluxes in the control parcel were
14
4.7 kg N2O-N ha-1 yr-1 (4.6–4.8 kg N2O-N ha-1 yr-1) and in the clover parcel 4.8 kg N2O-N ha-1 yr-1 (4.6–4.9 kg N2O-N ha-1 yr-
1) and did thus not differ significantly. N2O emission intensities (yield-scaled N2O emissions) during the experiment were
0.31g N2O-N kg-1 DM in the control parcel and thus higher than the 0.18 g N2O-N kg-1 DM observed in the clover parcel in
2015. A similar pattern was observed in 2016, with N2O emission intensities of 0.53 g N2O-N kg-1 DM versus 0.37 g N2O-N
kg-1 DM in 2016 for control and clover parcel, respectively. 5
3.6 Effects of management activities on N2O exchange
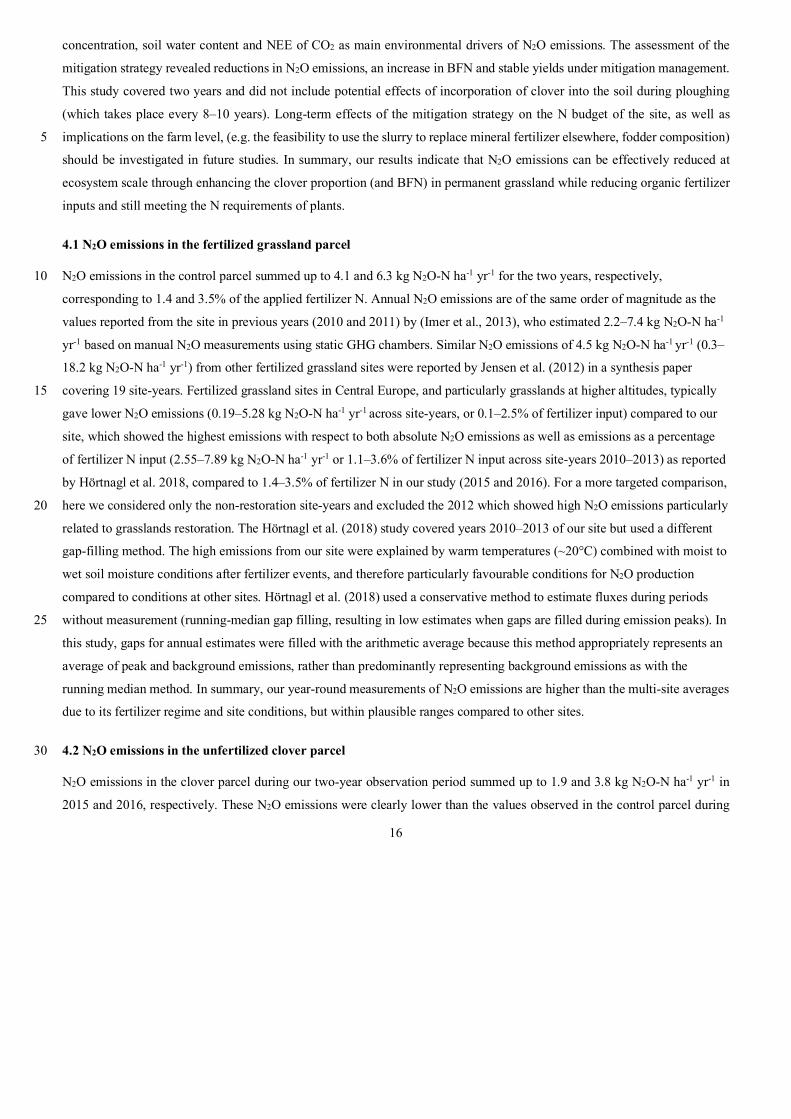
We observed increased N2O fluxes after fertilisation in the control parcel, with maximum daily N2O fluxes reaching 17.4 mg
N2O-N m-2 d-1 on 25th August 2015 (Fig. S1a), a day of slurry amendment. The effect of fertilizer amendment on N2O fluxes
depended on the environmental conditions during and after the fertilisation event. While several events (e.g. 10th June 2015,
25th August 2015, 16th July 2016 and 17th August 2016, Fig. S1a) were followed by increased N2O emissions, other events 10
(e.g. 1st June 2016) did not show such an effect (Fig. S1a, inter-quartile range displayed in Fig. 7a). N2O fluxes decreased to
background levels within a few (3–7) days after fertilizer application. Harvest had a moderate influence on N2O emissions on
both parcels (Fig. 7c). Maximum daily N2O fluxes after harvest were 7.0 mg N2O-N m-2 d-1 on 5th July 2016 (Fig. S1a). Average
N2O fluxes on both parcels were significantly higher the weeks after harvest (average of both parcels: 2.0 mg N2O-N m-2 d-1)
compared to average fluxes during the pre-harvest weeks (1.4 mg N2O-N m-2 d-1) (Fig. 7b). Neither grazing nor rain events 15
significantly affected N2O exchange (Fig. 7cd).
3.7 Influence of potential drivers on N2O exchange
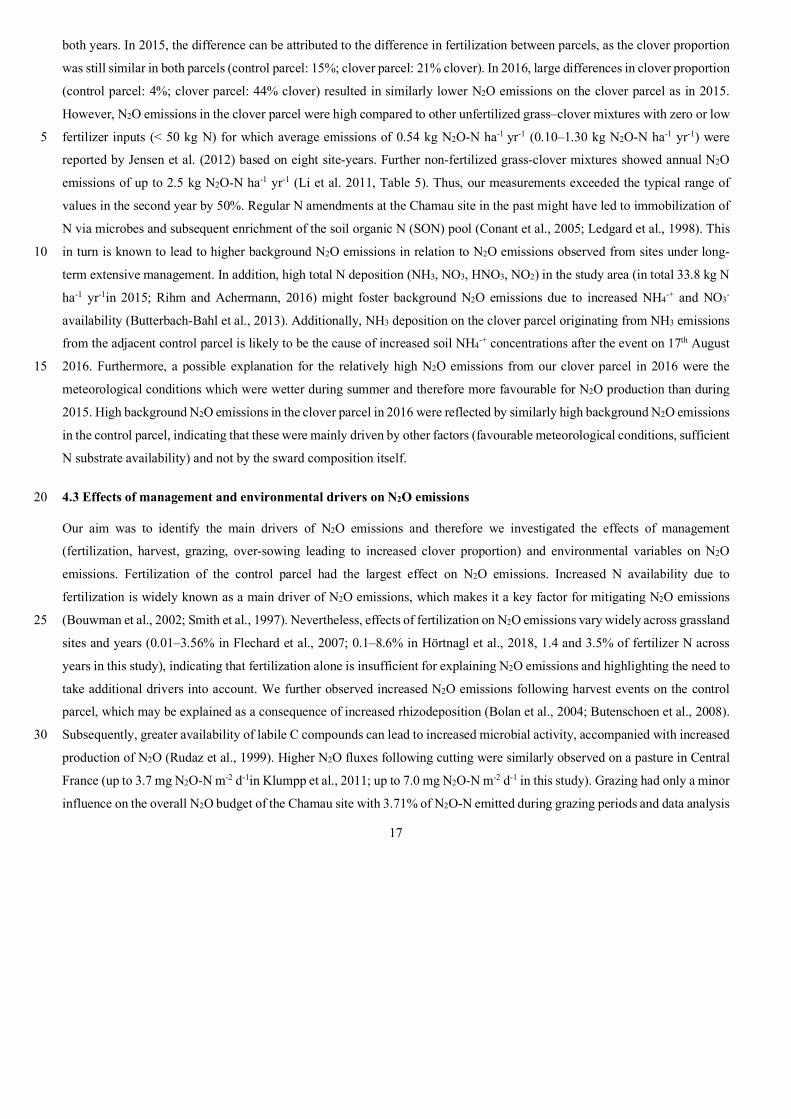
Nitrous oxide emissions significantly increased after fertilizer application (Ctr-F compared to Ctr-0, p < 0.05) when compared
to N2O fluxes during periods of no management on the same (control) parcel (Fig. 8a, Table 4). The effect size showed 2.5-
fold N2O emissions during the seven days following slurry amendment compared to no management (resulting from applying 20
the back-transformation to the fertilization effect: 100.4 = 2.5; Table 4). The effects of management influence N2O fluxes jointly
with other measured driver variables, such as soil moisture, soil temperature, NH4+-N, NO3--N and DOC concentration in the
soil. After mowing no significant increase in N2O emissions was found for the optimized model in either of the parcels (Table
4b). In contrast a difference in N2O emissions after harvest was observed for the simple model on the control parcel (Table
4c). If the difference in sward composition itself affected N2O emissions (e.g. via plant residues or rhizodeposition), we 25
expected a significant effect of the clover treatment compared to the control during times without management (Ctr-0 which
was the reference compared to Clo-0, Table 4). Due to the absence of such an effect, we deduce that the increased clover
proportions at the clover parcel did not affect N2O emissions.
Soil microclimate affected N2O emissions in both parcels. Soil temperature significantly influenced N2O emissions (p < 0.05),
indicating a 7% (± 2%) increase in N2O per °C temperature increase (p < 0.05, Table 4, Fig. 8b). Soil temperature had the 30
highest explanatory power (r2 = 0.17) for the prediction of log-transformed N2O flux as a single explanatory variable (data not
shown). Besides soil temperature, volumetric soil water content showed a significant non-linear effect on N2O emissions (p <

15
0.05, Fig. 8c). The humpback-shaped functional relationship between volumetric soil water content and log-transformed N2O
emissions (Fig. 8c) shows an increase until 34% and a decrease above 36% volumetric soil water content. Similarly, oxygen
concentration significantly affected N2O emissions (p < 0.05, Fig. 8d). Oxygen concentration was non-linearly related to N2O
emissions, showing lowest N2O emissions (10-4 µmol m-2 s-1) at 0% oxygen concentration. N2O emissions increased until a
maximum was reached at 17–19% oxygen concentration, and then decreased with further increasing oxygen concentration to 5
atmospheric concentrations of 20.9% (Fig. 8d). Net ecosystem exchange of CO2, which was used here as a proxy for plant
activity, affected N2O emissions (p < 0.05, Fig. 8e) with a 4% (± 2%) decrease of N2O emissions per µmol m-2 s-1 net carbon
dioxide uptake. Inclusion of NH4+-N concentration improved the prediction of N2O emissions (Table 4, Fig. 8f), leading to an
emission increase of 5% (± 3%) per µmol m-2 s-1. Note that large NH4+-N concentrations only occurred after fertilization, thus
the NH4+-N effect was mainly influenced by these dates, while it did not play a role for the other management categories. In 10
contrast, NO3--N concentration did not improve the prediction of N2O emissions (Table 4, Fig. 8g). Also, DOC concentrations
showed no effect on N2O emissions (Table 4, Fig. 8h). The slopes of the relationship between drivers and predicted N2O
emission are flatter than expected from visual inspection of the observed values (Fig. 8), as the predictions here depict the
dependency of N2O emissions on the respective driver alone (based on averages of all other drivers), in contrast to observations,
which depict combinations of effects of several drivers. The effects of soil temperature, soil water content and management in 15
the full and the optimized model (Tables 4a and 4b) were consistent with the simple model (Table 4c) that included only these
three variables and therefore more observations (n = 891 versus n = 93). Including additional variables (O2, NH4+-N, NEE of
CO2) besides soil temperature and soil water content increased the explained variance in N2O emissions from 26.3% in the
simple model (Table 4c) to 54.5% in the optimized model (Table 4b).
4 Discussion 20
We quantified ecosystem N2O exchange at a fertilized control parcel (“business as usual”) and an unfertilized clover parcel
where we increased the clover proportion (“mitigation management”). The mitigation management was composed of two
major changes compared to the “business as usual” practice; (1) omitted fertilization and (2) over-sowing clover, leading to an
increased clover proportion in the experimental sward (i.e. 21% versus 15 % in 2015, 44% versus 4% in 2016). Our analysis
showed that the difference in N2O emissions between both parcels can be attributed to the absence of fertilization on the clover 25
parcel. Increased clover proportion could still have increased N2O emissions in the clover parcel due to N-rich clover residues
and N from root exudates (Rochette and Janzen, 2005), and thereby offset the effect of reduced fertilization. However, we
measured similar N2O fluxes originating from the two parcels of different clover proportion during periods without
management, indicating that differences in clover proportion alone (i.e. excluding recent management effects) resulted in
unchanged N2O emissions (i.e. plant residues and root exudates affected N2O emissions similarly on the clover and the control 30
parcel). We quantified the effects of environmental drivers on N2O emissions and identified soil temperature, soil oxygen
16
concentration, soil water content and NEE of CO2 as main environmental drivers of N2O emissions. The assessment of the
mitigation strategy revealed reductions in N2O emissions, an increase in BFN and stable yields under mitigation management.
This study covered two years and did not include potential effects of incorporation of clover into the soil during ploughing
(which takes place every 8–10 years). Long-term effects of the mitigation strategy on the N budget of the site, as well as
implications on the farm level, (e.g. the feasibility to use the slurry to replace mineral fertilizer elsewhere, fodder composition) 5
should be investigated in future studies. In summary, our results indicate that N2O emissions can be effectively reduced at
ecosystem scale through enhancing the clover proportion (and BFN) in permanent grassland while reducing organic fertilizer
inputs and still meeting the N requirements of plants.
4.1 N2O emissions in the fertilized grassland parcel
N2O emissions in the control parcel summed up to 4.1 and 6.3 kg N2O-N ha-1 yr-1 for the two years, respectively, 10
corresponding to 1.4 and 3.5% of the applied fertilizer N. Annual N2O emissions are of the same order of magnitude as the
values reported from the site in previous years (2010 and 2011) by (Imer et al., 2013), who estimated 2.2–7.4 kg N2O-N ha-1
yr-1 based on manual N2O measurements using static GHG chambers. Similar N2O emissions of 4.5 kg N2O-N ha-1 yr-1 (0.3–
18.2 kg N2O-N ha-1 yr-1) from other fertilized grassland sites were reported by Jensen et al. (2012) in a synthesis paper
covering 19 site-years. Fertilized grassland sites in Central Europe, and particularly grasslands at higher altitudes, typically 15
gave lower N2O emissions (0.19–5.28 kg N2O-N ha-1 yr-1 across site-years, or 0.1–2.5% of fertilizer input) compared to our
site, which showed the highest emissions with respect to both absolute N2O emissions as well as emissions as a percentage
of fertilizer N input (2.55–7.89 kg N2O-N ha-1 yr-1 or 1.1–3.6% of fertilizer N input across site-years 2010–2013) as reported
by Hörtnagl et al. 2018, compared to 1.4–3.5% of fertilizer N in our study (2015 and 2016). For a more targeted comparison,
here we considered only the non-restoration site-years and excluded the 2012 which showed high N2O emissions particularly 20
related to grasslands restoration. The Hörtnagl et al. (2018) study covered years 2010–2013 of our site but used a different
gap-filling method. The high emissions from our site were explained by warm temperatures (~20°C) combined with moist to
wet soil moisture conditions after fertilizer events, and therefore particularly favourable conditions for N2O production
compared to conditions at other sites. Hörtnagl et al. (2018) used a conservative method to estimate fluxes during periods
without measurement (running-median gap filling, resulting in low estimates when gaps are filled during emission peaks). In 25
this study, gaps for annual estimates were filled with the arithmetic average because this method appropriately represents an
average of peak and background emissions, rather than predominantly representing background emissions as with the
running median method. In summary, our year-round measurements of N2O emissions are higher than the multi-site averages
due to its fertilizer regime and site conditions, but within plausible ranges compared to other sites.
4.2 N2O emissions in the unfertilized clover parcel 30
N2O emissions in the clover parcel during our two-year observation period summed up to 1.9 and 3.8 kg N2O-N ha-1 yr-1 in
2015 and 2016, respectively. These N2O emissions were clearly lower than the values observed in the control parcel during
17
both years. In 2015, the difference can be attributed to the difference in fertilization between parcels, as the clover proportion
was still similar in both parcels (control parcel: 15%; clover parcel: 21% clover). In 2016, large differences in clover proportion
(control parcel: 4%; clover parcel: 44% clover) resulted in similarly lower N2O emissions on the clover parcel as in 2015.
However, N2O emissions in the clover parcel were high compared to other unfertilized grass–clover mixtures with zero or low
fertilizer inputs (< 50 kg N) for which average emissions of 0.54 kg N2O-N ha-1 yr-1 (0.10–1.30 kg N2O-N ha-1 yr-1) were 5
reported by Jensen et al. (2012) based on eight site-years. Further non-fertilized grass-clover mixtures showed annual N2O
emissions of up to 2.5 kg N2O-N ha-1 yr-1 (Li et al. 2011, Table 5). Thus, our measurements exceeded the typical range of
values in the second year by 50%. Regular N amendments at the Chamau site in the past might have led to immobilization of
N via microbes and subsequent enrichment of the soil organic N (SON) pool (Conant et al., 2005; Ledgard et al., 1998). This
in turn is known to lead to higher background N2O emissions in relation to N2O emissions observed from sites under long-10
term extensive management. In addition, high total N deposition (NH3, NO3, HNO3, NO2) in the study area (in total 33.8 kg N
ha-1 yr-1in 2015; Rihm and Achermann, 2016) might foster background N2O emissions due to increased NH4-+ and NO3-
availability (Butterbach-Bahl et al., 2013). Additionally, NH3 deposition on the clover parcel originating from NH3 emissions
from the adjacent control parcel is likely to be the cause of increased soil NH4-+ concentrations after the event on 17th August
2016. Furthermore, a possible explanation for the relatively high N2O emissions from our clover parcel in 2016 were the 15
meteorological conditions which were wetter during summer and therefore more favourable for N2O production than during
2015. High background N2O emissions in the clover parcel in 2016 were reflected by similarly high background N2O emissions
in the control parcel, indicating that these were mainly driven by other factors (favourable meteorological conditions, sufficient
N substrate availability) and not by the sward composition itself.
4.3 Effects of management and environmental drivers on N2O emissions 20
Our aim was to identify the main drivers of N2O emissions and therefore we investigated the effects of management
(fertilization, harvest, grazing, over-sowing leading to increased clover proportion) and environmental variables on N2O
emissions. Fertilization of the control parcel had the largest effect on N2O emissions. Increased N availability due to
fertilization is widely known as a main driver of N2O emissions, which makes it a key factor for mitigating N2O emissions
(Bouwman et al., 2002; Smith et al., 1997). Nevertheless, effects of fertilization on N2O emissions vary widely across grassland 25
sites and years (0.01–3.56% in Flechard et al., 2007; 0.1–8.6% in Hörtnagl et al., 2018, 1.4 and 3.5% of fertilizer N across
years in this study), indicating that fertilization alone is insufficient for explaining N2O emissions and highlighting the need to
take additional drivers into account. We further observed increased N2O emissions following harvest events on the control
parcel, which may be explained as a consequence of increased rhizodeposition (Bolan et al., 2004; Butenschoen et al., 2008).
Subsequently, greater availability of labile C compounds can lead to increased microbial activity, accompanied with increased 30
production of N2O (Rudaz et al., 1999). Higher N2O fluxes following cutting were similarly observed on a pasture in Central
France (up to 3.7 mg N2O-N m-2 d-1in Klumpp et al., 2011; up to 7.0 mg N2O-N m-2 d-1 in this study). Grazing had only a minor
influence on the overall N2O budget of the Chamau site with 3.71% of N2O-N emitted during grazing periods and data analysis

18
showed that N2O fluxes did not significantly respond to the presence of animals (Fig. 7c). We attribute this observation to low
stocking densities and short duration of grazing (Table 1). Other studies with higher stocking densities have shown that more
intensive grazing led to increased N2O emissions (van Groenigen et al., 2005; Oenema et al., 1997). These were attributed to
C and N from animal excreta and to soil compaction by treading and trampling animals, creating anaerobic soil conditions
(Flechard et al., 2007; Lampe et al., 2006; Oenema et al., 1997). 5
An important finding from this study is that increased clover proportion, and subsequently increased BFN, did not increase
N2O emissions, as shown by comparing N2O emissions between both parcels during periods without management (Table 5c,
Clo-0). In other words, substrate from decomposition of plant residues and from root exudates may affect N2O emissions, but
this effect was similar on both parcels, independent of the higher clover proportion and BFN in the clover parcel. This is in
contrast to a study on a boreal grass-clover mixture in which significant N2O emissions were observed in spring, largely 10
exceeding the fertilized grassland control (Virkajärvi et al., 2010). These higher emissions were explained by increased
substrate available to microbial communities producing N2O in the surface layer after spring thaw (Wagner-Riddle et al.,
2008). Nitrous oxide emissions from BNF itself (rhizobial denitrification) have been shown to be possible (O’Hara and Daniel,
1985). Nevertheless, due to its small magnitude the contribution to field-scale N2O emissions is negligible (Rochette and
Janzen, 2005). Previous results from a laboratory incubation by Carter and Ambus (2006), who investigated N2O emissions 15
from unfertilized soils for up to 36 weeks, showed that recently fixed N2 in a white clover-ryegrass mixture contributed as
little as 2.1 ± 0.5% to total N2O emissions. In agreement with our result, measurements from permanent grasslands in Ireland,
where winter freeze-thaw cycles are very rare, showed that annual N2O emissions in unfertilized ryegrass (2.38 ± 0.12 kg N2O-
N ha-1 yr-1) were not significantly different from an unfertilized grass–clover sward (2.45 ± 0.85 kg N2O-N ha-1 yr-1) with
clover proportions of 20–25%, hence providing evidence that N2O emission due to BNF itself and clover residual 20
decomposition were negligible (Li et al., 2011). Our findings are in line with these observations and add the insight that clover
proportions of up to 44%, as found in our study, will not result in increased N2O emissions.
The effects of temperature and soil water content on N2O emissions as found in our study are in line with established knowledge
(Butterbach-Bahl et al., 2013; Flechard et al., 2007). Furthermore, directly measured soil oxygen concentrations, which have
hardly been used in field-scale studies before, improved the prediction of N2O emissions (Table 4). Our data showed that larger 25
plant C uptake (negative NEE) of CO2 as proxy for plant activity was associated with reduced N2O emissions, which supports
the hypothesis that plant roots are in competition for available N with microbes and often reduce the N availability to microbes
(Merbold et al., 2014). Thus, we observed lower N2O emissions at higher levels of photosynthesis. Our analysis showed that
inclusion of NH4+-N concentration in the statistical analysis improved the prediction of N2O emissions, while NO3--N and
DOC were of less importance for the prediction of N2O emissions. Comparable results for the influence of NH4+ and NO3- 30
were found at an Irish grassland (Rafique et al., 2012). In summary, fertilization was the dominant predictor of N2O emissions,
while soil temperature, soil water content, soil oxygen concentration and NEE of CO2 were significant environmental drivers.
Concluding from all management effects, the decrease in annual N2O emissions under the mitigation strategy was primarily
19
caused by the absence of fertilization, while a potential effect of the increase in clover proportion and increased BFN offsetting
these emission reductions was absent.
4.4 Effect of the mitigation strategy on productivity and biological nitrogen fixation
An important precondition for the acceptance of any climate change mitigation strategy is that yields need to be maintained at
similar levels as under conventional management. Differences in biomass yields between the control and clover parcels were 5
only minor (19% and 9% lower in the clover parcel in 2015 and 2016, respectively), and comparable to the observed differences
between the two parcels prior to the mitigation experiment (Table S2). Maintaining high yields without fertilization can be
explained by the increased BFN in the clover parcel and positive interactions between clover and grass (“overyielding effect”)
(Lüscher et al., 2014; Nyfeler et al., 2009). Additionally, high SON content due to previous year’s fertilizer amendments are
expected to contribute to the persistently high production levels (Table 2). Similar productivity levels of an unfertilized grass-10
clover mixture (three cuts, 9% less DM) compared to an adjacent intensive grass-clover mixture (230 kg N fertilizer, 4–5 cuts)
were also found at a site 50 km from the Chamau field site in the past (Ammann et al., 2009). Furthermore, our findings are
consistent with findings from the more comprehensive study by Nyfeler et al. (2009), who found large overyielding effects in
comparable Swiss grassland systems, i.e. grass-clover yields at 50 kg N ha-1 yr-1 and 50 to 70% clover were as productive as
grass monocultures fertilized with 450 kg N ha-1 yr-1. The overyielding effect has been reported across a wide range of climates 15
and soil types (Finn et al., 2013; Kirwan et al., 2007), indicating that our result of maintained productivity levels under the
mitigation strategy is likely to be reproducible across a wider range of site conditions.
Biologically fixed nitrogen found in shoot biomass was slightly higher in the clover parcel (72 kg N ha-1 yr-1) compared to the
control parcel (55 kg N ha-1 yr-1) in 2015 due to only small differences in clover proportion between both parcels. During the
second year, the over-sowing was more effective and BFN found in shoot biomass in the clover parcel summed up to 130 kg 20
N ha-1 yr-1 while only 14 kg N ha-1 yr-1 were measured in the control parcel. Previous studies reported similar amounts of BFN
for mown and grazed pasture systems (Ledgard and Steele, 1992; Nyfeler et al., 2011), with maxima being as high as 323 kg
N ha-1 yr-1 as observed in a comparable grass-clover mixture (Nyfeler et al., 2011). This indicates that biologically fixed
nitrogen at the Chamau could reach higher amounts than observed during our experiment. Clover proportions at our site varied
seasonally, with a minimum in spring and maximum in summer in both parcels. Such seasonal cycles in clover proportions 25
occur due to species’ developmental cycles, but also competitive advantages/disadvantages of the respective species. Drier
conditions, observed for instance in summer (JJA), result in competitive advantages of the clover compared to grasses, as N2
fixation is less sensitive to dry conditions than uptake of mineral N (Hofer et al., 2017; Lüscher et al., 2005). Furthermore,
inter-annual variability of clover proportions can be an additional management challenge for farmers whose aim is to keep a
persistent sward composition (Lüscher et al., 2014). 30
Lower SON content (3490 kg N ha-1) in a grass-clover mixture compared to a 200 kg ha-1 yr-1 fertilized grassland (4350 kg N
ha-1) was observed after 13 years of management comparable to our experiment (Ledgard et al., 1998). It is well-known that
N exports exceeding inputs lead to a decreasing SON pool. Potential losses in SON were shown to be closely linked to losses
20
in soil organic C (SOC) (Ammann et al., 2009; Conant et al., 2005) and can therefore compromise the soil’s CO2 sink strength.
Thus, detailed investigations on the effect of the clover treatment on SON, SOC content and CO2 exchange are recommended
to comprehensively evaluate the mitigation strategy in the long term.
4.5 Effect of the mitigation strategy on N2O emissions and emission intensities
We found that the mitigation strategy effectively reduced both N2O emissions by 54% (51–57%) and 39% (36–42%) in 2015 5
and 2016 as well as N2O emission intensities by 41% and 30% in 2015 and 2016, respectively. Past studies carried out in
temperate grasslands consistently found reductions in N2O emissions when reducing fertilizer and increasing BFN through
legumes (Table 5). The magnitude of relative N2O emission reductions ranged from 34% (Šimek et al., 2004) to 100%
(Ammann et al., 2009), with absolute N2O emission reductions of 0.8 kg N ha-1 yr-1 (Šimek et al., 2004) to 11.1 kg N ha-1 yr-1
(Schmeer et al., 2014). The variability across studies can be attributed to differences in meteorological and soil conditions as 10
well as variations in the experimental setup (i.e. fertilizer rates applied, realized legume proportions, grass and legume species,
Table 5). Much higher N2O emissions from an unfertilized grass-clover mixture (92% increase) compared to N2O emissions
from a grass sward fertilized with 220 kg N ha-1 yr-1 were observed under boreal climate conditions in eastern Finland, due to
large springtime emissions associated with freeze-thaw cycles (Virkajärvi et al., 2010). Such an effect could not be found at
our site, although soils also freeze occasionally during the cold season, but at most in the top few centimetres. Although our 15
tested mitigation strategy seems to be beneficial for permanent grasslands, Basche et al. (2014) and Lugato et al. (2018) have
shown that incorporation of clover into the soil may lead to increased N2O fluxes and thus may not be the best mitigation
strategy for croplands and temporary grasslands, where ploughing is done much more frequently.
In summary, the implementation of the mitigation option tested here was found to be effective at permanent grassland in the
temperate zone, and is cheap and simple as it requires few management activities, which would favour farmers willingness for 20
implementation (Vellinga et al., 2011).
Acknowledgements
This study was carried out within the framework of FACCE-JPI, in the Models4Pastures project with the Swiss contribution
funded by the Swiss National Science Foundation (SNSF, contract number: 40FA40_154245) and the New Zealand
contribution funded by the New Zealand Government to support the objectives of the Livestock Research Group of the Global 25
Research Alliance for Agricultural Greenhouse Gases – Integrative Research Group
(http://globalresearchalliance.org/research/integrative). We gratefully acknowledge the Models4Pastures project team for
enriching discussions on the measured data. We greatly thank for the support provided by the head of the former ETH research
station Chamau Hans-Rudolf Wettstein, and the staff on site: Ivo Widmer, Tina Stiefel and Meinrad Stalder. We are particularly
grateful to Britta Jahn-Humphrey for conducting the DOC analysis and to Annika Ackermann and Roland A. Werner for the 30
C, N and 15N isotope analyses. We are very thankful to Florian Käslin and Patrick Koller for technical assistance in the
21
experimental work and oxygen sensor development. Further thanks go to our colleagues Charlotte Decock and Elisabeth
Verhoeven from the Sustainable Agroecosystems research group at ETH for laboratory introductions and valuable advice at
the beginning of the experiment. We thank Natascha Kljun for useful discussions on the footprint parameterization and Beat
Rihm for providing N deposition estimates for the study site. Valuable practical support in biomass and soil sampling as well
as processing during the experiment was given by the interns Astrid Riemer and Manjunatha Chandregowda and the student 5
assistant Reto Zihlmann.
References
Ammann, C., Spirig, C., Leifeld, J. and Neftel, A.: Assessment of the nitrogen and carbon budget of two managed temperate grassland fields, Agr. Ecosyst. Environ., 133(3–4), 150–162, doi:10.1016/j.agee.2009.05.006, 2009.
Basche, A. D., Miguez, F. E., Kaspar, T. C. and Castellano, M. J.: Do cover crops increase or decrease nitrous oxide 10 emissions? A meta-analysis, Journal of Soil and Water Conservation, 69(6), 471–482, doi:10.2489/jswc.69.6.471, 2014.
Bell, M. J., Hinton, N., Cloy, J. M., Topp, C. F. E., Rees, R. M., Cardenas, L., Scott, T., Webster, C., Ashton, R. W., Whitmore, A. P., Williams, J. R., Balshaw, H., Paine, F., Goulding, K. W. T. and Chadwick, D. R.: Nitrous oxide emissions from fertilised UK arable soils: Fluxes, emission factors and mitigation, Agr. Ecosyst. Environ., 212, 134–147, doi:10.1016/j.agee.2015.07.003, 2015. 15
Biermann, T., Babel, W., Ma, W., Chen, X., Thiem, E., Ma, Y. and Foken, T.: Turbulent flux observations and modelling over a shallow lake and a wet grassland in the Nam Co basin, Tibetan Plateau, Theor. Appl. Climatol., 116(1–2), 301–316, doi:10.1007/s00704-013-0953-6, 2014.
Boddey, R. M., Peoples, M. B., Palmer, B. and Dart, P. J.: Use of the 15N natural abundance technique to quantify biological nitrogen fixation by woody perennials, Nutr. Cycl. Agroecosys., 57(3), 235–270, doi:10.1023/A:1009890514844, 2000. 20
Bolan, N. S., Saggar, S., Luo, J., Bhandral, R. and Singh, J.: Gaseous emissions of nitrogen from grazed pastures: Processes, measurements and modelling, environmental implications, and mitigation, vol. 84, edited by Advances in Agronomy, pp. 37–120, Academic Press., 2004.
Bouwman, A. F., Boumans, L. J. M. and Batjes, N. H.: Emissions of N 2 O and NO from fertilized fields: Summary of available measurement data, Global Biogeochem. Cy., 16(4), 6-1-6–13, doi:10.1029/2001GB001811, 2002. 25
Burri, S., Sturm, P., Prechsl, U. E., Knohl, A. and Buchmann, N.: The impact of extreme summer drought on the short-term carbon coupling of photosynthesis to soil CO2 efflux in a temperate grassland, Biogeosciences, 11(4), 961–975, doi:10.5194/bg-11-961-2014, 2014.
Butenschoen, O., Marhan, S. and Scheu, S.: Response of soil microorganisms and endogeic earthworms to cutting of grassland plants in a laboratory experiment, Appl. Soil Ecol., 38(2), 152–160, doi:10.1016/j.apsoil.2007.10.004, 2008. 30
Butterbach-Bahl, K., Baggs, E. M., Dannenmann, M., Kiese, R. and Zechmeister-Boltenstern, S.: Nitrous oxide emissions from soils: how well do we understand the processes and their controls?, Philos. T. Roy. Soc. B, 368(1621), 20130122, doi:10.1098/rstb.2013.0122, 2013.
22
Carlsson, G. and Huss-Danell, K.: Does nitrogen transfer between plants confound 15N-based quantifications of N2 fixation?, Plant Soil, 374(1–2), 345–358, doi:10.1007/s11104-013-1802-1, 2014.
Carter, M. S. and Ambus, P.: Biologically fixed N2 as a source for N2O production in a grass–clover mixture, measured by 15N2, Nutr. Cycl. Agroecosys., 74(1), 13–26, doi:10.1007/s10705-005-4111-0, 2006.
Conant, R. T., Paustian, K., Grosso, S. J. D. and Parton, W. J.: Nitrogen pools and fluxes in grassland soils sequestering 5 carbon, Nutr. Cycl. Agroecosys., 71(3), 239–248, doi:10.1007/s10705-004-5085-z, 2005.
Crews, T. E. and Peoples, M. B.: Can the synchrony of nitrogen supply and crop demand be improved in legume and fertilizer-based agroecosystems? A review, Nutr. Cycl. Agroecosys., 72(2), 101–120, doi:10.1007/s10705-004-6480-1, 2005.
Dewhurst, R. J., Fisher, W. J., Tweed, J. K. S. and Wilkins, R. J.: Comparison of grass and legume silages for milk production. 1. Production responses with different levels of concentrate, J. Dairy Sci., 86(8), 2598–2611, 10 doi:10.3168/jds.S0022-0302(03)73855-7, 2003.
Eugster, W. and Merbold, L.: Eddy covariance for quantifying trace gas fluxes from soils, SOIL, 1(1), 187–205, doi:https://doi.org/10.5194/soil-1-187-2015, 2015.
Eugster, W. and Plüss, P.: A fault-tolerant eddy covariance system for measuring CH4 fluxes, Agr. Forest Meteorol., 150(6), 841–851, doi:10.1016/j.agrformet.2009.12.008, 2010. 15
Eugster, W. and Zeeman, M. J.: Micrometeorological techniques to measure ecosystem-scale greenhouse gas fluxes for model validation and improvement, International Congress Series, 1293, 66–75, doi:10.1016/j.ics.2006.05.001, 2006.
Finn, J. A., Kirwan, L., Connolly, J., Sebastià, M. T., Helgadottir, A., Baadshaug, O. H., Bélanger, G., Black, A., Brophy, C., Collins, R. P., Čop, J., Dalmannsdóttir, S., Delgado, I., Elgersma, A., Fothergill, M., Frankow-Lindberg, B. E., Ghesquiere, A., Golinska, B., Golinski, P., Grieu, P., Gustavsson, A.-M., Höglind, M., Huguenin-Elie, O., Jørgensen, M., Kadziuliene, 20 Z., Kurki, P., Llurba, R., Lunnan, T., Porqueddu, C., Suter, M., Thumm, U. and Lüscher, A.: Ecosystem function enhanced by combining four functional types of plant species in intensively managed grassland mixtures: a 3-year continental-scale field experiment, edited by B. Wilsey, J. Appl. Ecol., 50(2), 365–375, doi:10.1111/1365-2664.12041, 2013.
Flechard, C. R., Ambus, P., Skiba, U., Rees, R. M., Hensen, A., van Amstel, A., van den Pol-van Dasselaar, A., Soussana, J.-F., Jones, M., Clifton-Brown, J., Raschi, A., Horvath, L., Neftel, A., Jocher, M., Ammann, C., Leifeld, J., Fuhrer, J., 25 Calanca, P., Thalman, E., Pilegaard, K., Di Marco, C., Campbell, C., Nemitz, E., Hargreaves, K. J., Levy, P. E., Ball, B. C., Jones, S. K., van de Bulk, W. C. M., Groot, T., Blom, M., Domingues, R., Kasper, G., Allard, V., Ceschia, E., Cellier, P., Laville, P., Henault, C., Bizouard, F., Abdalla, M., Williams, M., Baronti, S., Berretti, F. and Grosz, B.: Effects of climate and management intensity on nitrous oxide emissions in grassland systems across Europe, Agr. Ecosyst. Environ., 121(1–2), 135–152, doi:10.1016/j.agee.2006.12.024, 2007. 30
Flessa, H.: Studie zur Vorbereitung einer effizienten und gut abgestimmten Klimaschutzpolitik für den Agrarsektor, Johann Heinrich von Thünen-Institut, Braunschweig. [online] Available from: https://literatur.thuenen.de/digbib_extern/dn050716.pdf, 2012.
Foken, T. and Wichura, B.: Tools for quality assessment of surface-based flux measurements, Agr. Forest Meteorol., 78(1), 83–105, doi:10.1016/0168-1923(95)02248-1, 1996. 35
Foken, T., Gockede, M., Mauder, M., Mahrt, L., Amiro, B. and Munger, J.: Post field data quality control, in Handbook of Micrometeorology: A guide tfor surface flux measurements and analysis, edited by X. Lee, W. Massmann, and B. Law, pp. 181–208, Kluwer, Dordrecht., 2004.
23
Fratini, G., Ibrom, A., Arriga, N., Burba, G. and Papale, D.: Relative humidity effects on water vapour fluxes measured with closed-path eddy-covariance systems with short sampling lines, Agr. Forest Meteorol., 165, 53–63, doi:10.1016/j.agrformet.2012.05.018, 2012.
Galloway, J. N., Aber, J. D., Erisman, J. W., Seitzinger, S. P., Howarth, R. W., Cowling, E. B. and Cosby, B. J.: The Nitrogen Cascade, BioScience, 53(4), 341–356, doi:10.1641/0006-3568(2003)053[0341:TNC]2.0.CO;2, 2003. 5
Garcia-Plazaola, J. I., Becerril, J. M., Arrese-Igor, C., Gonzalez-Murua, C. and Aparicio-Tejo, P. M.: The contribution of Rhizobium meliloti to soil denitrification, Plant Soil, 157(2), 207–213, doi:10.1007/BF00011049, 1993.
Gourlez de la Motte, L., Mamadou, O., Beckers, Y., Bodson, B., Heinesch, B. and Aubinet, M.: Rotational and continuous grazing does not affect the total net ecosystem exchange of a pasture grazed by cattle but modifies CO2 exchange dynamics, Agr. Ecosyst. Environ., 253(Supplement C), 157–165, doi:10.1016/j.agee.2017.11.011, 2018. 10
van Groenigen, J. W. van, Velthof, G. L., Bolt, F. J. E. van der, Vos, A. and Kuikman, P. J.: Seasonal variation in N2O emissions from urine patches: Effects of urine concentration, soil compaction and dung, Plant Soil, 273(1–2), 15–27, doi:10.1007/s11104-004-6261-2, 2005.
Guckert, A. and Hay, R. K. M.: The overwintering, spring growth, and yield in mixed species swards of white clover in Europe, Ann Bot, 88(suppl_1), 667–668, doi:10.1006/anbo.2001.1508, 2001. 15
Hofer, D., Suter, M., Buchmann, N. and Lüscher, A.: Nitrogen status of functionally different forage species explains resistance to severe drought and post-drought overcompensation, Agr. Ecosyst. Environ., 236, 312–322, doi:10.1016/j.agee.2016.11.022, 2017.
Horst, T. W.: A simple formula for attenuation of eddy fluxes measured with first-order-response scalar sensors, Bound.-Lay. Meteorol., 82(2), 219–233, doi:10.1023/A:1000229130034, 1997. 20
Horst, T. W. and Lenschow, D. H.: Attenuation of scalar fluxes measured with spatially-displaced sensors, Bound.-Lay. Meteorol., 130(2), 275–300, doi:10.1007/s10546-008-9348-0, 2009.
Hörtnagl, L., Barthel, M., Buchmann, N., Eugster, W., Butterbach-Bahl, K., Díaz-Pinés, E., Zeeman, M., Klumpp, K., Kiese, R., Bahn, M., Hammerle, A., Lu, H., Ladreiter-Knauss, T., Burri, S. and Merbold, L.: Greenhouse gas fluxes over managed grasslands in Central Europe, Global Change Biology, doi:10.1111/gcb.14079, 2018. 25
Huhtanen, P., Rinne, M. and Nousiainen, J.: Evaluation of the factors affecting silage intake of dairy cows: a revision of the relative silage dry-matter intake index, Animal, 1(5), 758–770, doi:10.1017/S175173110773673X, 2007.
Imer, D., Merbold, L., Eugster, W. and Buchmann, N.: Temporal and spatial variations of soil CO2, CH4 and N2O fluxes at three differently managed grasslands, Biogeosciences, 10(9), 5931–5945, doi:10.5194/bg-10-5931-2013, 2013.
IPCC: Ciais, P., C. Sabine, G. Bala, L. Bopp, V. Brovkin, J. Canadell, A. Chhabra, R. DeFries, J. Galloway, M. Heimann, C. 30 Jones, C. Le Quéré, R.B. Myneni, S. Piao and P. Thornton, 2013: Carbon and Other Biogeochemical Cycles. In: Climate Change 2013: The Physical Science Basis. Contribution of Working Group I to the Fifth Assessment Report of the Intergovernmental Panel on Climate Change [Stocker, T.F., D. Qin, G.-K. Plattner, M. Tignor, S.K. Allen, J. Boschung, A. Nauels, Y. Xia, V. Bex and P.M. Midgley (eds.)]. Cambridge University Press, Cambridge, United Kingdom and New York, NY, USA., 2013a. 35
IPCC: Myhre, G., D. Shindell, F.-M. Bréon, W. Collins, J. Fuglestvedt, J. Huang, D. Koch, J.-F. Lamarque, D. Lee, B. Mendoza, T. Nakajima, A. Robock, G. Stephens, T. Takemura and H. Zhang, 2013: Anthropogenic and Natural Radiative

24
Forcing. In: Climate Change 2013: The Physical Science Basis. Contribution of Working Group I to the Fifth Assessment Report of the Intergovernmental Panel on Climate Change [Stocker, T.F., D. Qin, G.-K. Plattner, M. Tignor, S.K. Allen, J. Boschung, A. Nauels, Y. Xia, V. Bex and P.M. Midgley (eds.)]. Cambridge University Press, Cambridge, United Kingdom and New York, NY, USA., 2013b.
IPCC: Smith P., M. Bustamante, H. Ahammad, H. Clark, H. Dong, E. A. Elsiddig, H. Haberl, R. Harper, J. House, M. Jafari, 5 O. Masera, C. Mbow, N. H. Ravindranath, C. W. Rice, C. Robledo Abad, A. Romanovskaya, F. Sperling, and F. Tubiello, 2014: Agriculture, Forestry and Other Land Use (AFOLU). In: Climate Change 2014: Mitigation of Climate Change. Contribution of Working Group III to the Fifth Assessment Report of the Intergovernmental Panel on Climate Change [Edenhofer, O., R. Pichs-Madruga, Y. Sokona, E. Farahani, S. Kadner, K. Seyboth, A. Adler, I. Baum, S. Brunner, P. Eickemeier, B. Kriemann, J. Savolainen, S. Schlömer, C. von Stechow, T. Zwickel and J.C. Minx (eds.)]. Cambridge 10 University Press, Cambridge, United Kingdom and New York, NY, USA., 2014.
Jensen, E. S., Peoples, M. B., Boddey, R. M., Gresshoff, P. M., Hauggaard-Nielsen, H., Alves, B. J. R. and Morrison, M. J.: Legumes for mitigation of climate change and the provision of feedstock for biofuels and biorefineries. A review, Agron. Sustain. Dev., 32(2), 329–364, doi:10.1007/s13593-011-0056-7, 2012.
Kirwan, L., Luescher, A., Sebastia, M. T., Finn, J. A., Collins, R. P., Porqueddu, C., Helgadottir, A., Baadshaug, O. H., 15 Brophy, C., Coran, C., Dalmannsdottir, S., Delgado, I., Elgersma, A., Fothergill, M., Frankow-Lindberg, B. E., Golinski, P., Grieu, P., Gustavsson, A. M., Hoglind, M., Huguenin-Elie, O., Iliadis, C., Jorgensen, M., Kadziuliene, Z., Karyotis, T., Lunnan, T., Malengier, M., Maltoni, S., Meyer, V., Nyfeler, D., Nykanen-Kurki, P., Parente, J., Smit, H. J., Thumm, U. and Connolly, J.: Evenness drives consistent diversity effects in intensive grassland systems across 28 European sites, J. Ecol., 95(3), 530–539, doi:10.1111/j.1365-2745.2007.01225.x, 2007. 20
de Klein, C. a. M. and Eckard, R. J.: Targeted technologies for nitrous oxide abatement from animal agriculture, Aust. J. Exp. Agric., 48(1–2), 14–20, doi:10.1071/EA07217, 2008.
Kljun, N., Calanca, P., Rotach, M. W. and Schmid, H. P.: A simple two-dimensional parameterisation for Flux Footprint Prediction (FFP), Geosci. Model Dev., 8(11), 3695–3713, doi:10.5194/gmd-8-3695-2015, 2015.
Klumpp, K., Bloor, J. M. G., Ambus, P. and Soussana, J.-F.: Effects of clover density on N2O emissions and plant-soil N 25 transfers in a fertilised upland pasture, Plant Soil, 343(1–2), 97–107, doi:10.1007/s11104-010-0526-8, 2011.
Lampe, C., Dittert, K., Sattelmacher, B., Wachendorf, M., Loges, R. and Taube, F.: Sources and rates of nitrous oxide emissions from grazed grassland after application of 15N-labelled mineral fertilizer and slurry, Soil Biol. Biochem., 38(9), 2602–2613, doi:10.1016/j.soilbio.2006.03.016, 2006.
Ledgard, S. F. and Steele, K. W.: Biological nitrogen fixation in mixed legume/grass pastures, Plant Soil, 141(1–2), 137–30 153, doi:10.1007/BF00011314, 1992.
Ledgard, S. F., Jarvis, S. C. and Hatch, D. J.: Short-term nitrogen fluxes in grassland soils under different long-term nitrogen management regimes, Soil Biol. Biochem., 30(10), 1233–1241, doi:10.1016/S0038-0717(98)00022-4, 1998.
Ledgard, S. F., Sprosen, M. S., Penno, J. W. and Rajendram, G. S.: Nitrogen fixation by white clover in pastures grazed by dairy cows: Temporal variation and effects of nitrogen fertilization, Plant Soil, 229(2), 177–187, 35 doi:10.1023/A:1004833804002, 2001.
Lenschow, D. H., Mann, J. and Kristensen, L.: How long is long enough when measuring fluxes and other turbulence statistics?, J. Atmos. Ocean. Tech., 11(3), 661–673, doi:https://doi.org/10.1175/1520-0426(1994)011<0661:HLILEW>2.0.CO;2, 1994.

25
Li, D., Lanigan, G. and Humphreys, J.: Measured and simulated nitrous oxide emissions from ryegrass- and ryegrass/white clover-based grasslands in a moist temperate climate, PLoS ONE, 6(10), e26176, doi:10.1371/journal.pone.0026176, 2011.
Li, D., Watson, C. J., Yan, M. J., Lalor, S., Rafique, R., Hyde, B., Lanigan, G., Richards, K. G., Holden, N. M. and Humphreys, J.: A review of nitrous oxide mitigation by farm nitrogen management in temperate grassland-based agriculture, J. Environ. Manage., 128, 893–903, doi:10.1016/j.jenvman.2013.06.026, 2013. 5
Lipper, L., Thornton, P., Campbell, B. M., Baedeker, T., Braimoh, A., Bwalya, M., Caron, P., Cattaneo, A., Garrity, D., Henry, K., Hottle, R., Jackson, L., Jarvis, A., Kossam, F., Mann, W., McCarthy, N., Meybeck, A., Neufeldt, H., Remington, T., Sen, P. T., Sessa, R., Shula, R., Tibu, A. and Torquebiau, E. F.: Climate-smart agriculture for food security, Nature Climate Change, 4(12), 1068–1072, doi:10.1038/nclimate2437, 2014.
Lugato, E., Leip, A. and Jones, A.: Mitigation potential of soil carbon management overestimated by neglecting N2O 10 emissions, Nature Climate Change, 8(3), 219–223, doi:10.1038/s41558-018-0087-z, 2018.
Luo, J., de Klein, C. A. M., Ledgard, S. F. and Saggar, S.: Management options to reduce nitrous oxide emissions from intensively grazed pastures: A review, Agriculture, Ecosystems & Environment, 136(3–4), 282–291, doi:10.1016/j.agee.2009.12.003, 2010.
Lüscher, A., Fuhrer, J. and Newton, P. C. D.: Global atmospheric change and its effect on managed grassland systems, 15 edited by D. A. McGilloway, Wageningen Academic Publishers, Wageningen., 2005.
Lüscher, A., Mueller-Harvey, I., Soussana, J. F., Rees, R. M. and Peyraud, J. L.: Potential of legume-based grassland–livestock systems in Europe: a review, Grass Forage Sci., 69(2), 206–228, doi:10.1111/gfs.12124, 2014.
Mauder, M. and Foken, T.: Documentation and instruction manual of the eddy covariance software package TK2, Work Report, University of Bayreuth, Bayreuth. [online] Available from: ISSN 1614-8916, 2004. 20
Merbold, L., Eugster, W., Stieger, J., Zahniser, M., Nelson, D. and Buchmann, N.: Greenhouse gas budget (CO2, CH4 and N2O) of intensively managed grassland following restoration, Glob. Change Biol., 20(6), 1913–1928, doi:10.1111/gcb.12518, 2014.
Millar, N., Ndufa, J. K., Cadisch, G. and Baggs, E. M.: Nitrous oxide emissions following incorporation of improved-fallow residues in the humid tropics, Global Biogeochem. Cy., 18(1), GB1032, doi:10.1029/2003GB002114, 2004. 25
Neftel, A., Spirig, C. and Ammann, C.: Application and test of a simple tool for operational footprint evaluations, Environ. Pollut., 152(3), 644–652, doi:10.1016/j.envpol.2007.06.062, 2008.
Niklaus, P. A., Le Roux, X., Poly, F., Buchmann, N., Scherer-Lorenzen, M., Weigelt, A. and Barnard, R. L.: Plant species diversity affects soil-atmosphere fluxes of methane and nitrous oxide, Oecologia, 181(3), 919–930, doi:10.1007/s00442-016-3611-8, 2016. 30
Nyfeler, D., Huguenin-Elie, O., Suter, M., Frossard, E., Connolly, J. and Lüscher, A.: Strong mixture effects among four species in fertilized agricultural grassland led to persistent and consistent transgressive overyielding, J. Appl. Ecol., 46(3), 683–691, doi:10.1111/j.1365-2664.2009.01653.x, 2009.
Nyfeler, D., Huguenin-Elie, O., Suter, M., Frossard, E. and Lüscher, A.: Grass–legume mixtures can yield more nitrogen than legume pure stands due to mutual stimulation of nitrogen uptake from symbiotic and non-symbiotic sources, Agr. 35 Ecosyst. Environ., 140(1–2), 155–163, doi:10.1016/j.agee.2010.11.022, 2011.

26
Oenema, O., Velthof, G. L., Yamulki, S. and Jarvis, S. C.: Nitrous oxide emissions from grazed grassland, Soi Use Manage., 13, 288–295, doi:10.1111/j.1475-2743.1997.tb00600.x, 1997.
O’Hara, G. W. and Daniel, R. M.: Rhizobial denitrification: A review, Soil Biol. Biochem., 17(1), 1–9, doi:10.1016/0038-0717(85)90082-3, 1985.
Paustian, K., Lehmann, J., Ogle, S., Reay, D., Robertson, G. P. and Smith, P.: Climate-smart soils, Nature, 532(7597), 49–5 57, doi:10.1038/nature17174, 2016.
Phelan, P., Moloney, A. P., McGeough, E. J., Humphreys, J., Bertilsson, J., O’Riordan, E. G. and O’Kiely, P.: Forage legumes for grazing and conserving in ruminant production systems, Crit. Rev. Plant Sci., 34(1–3), 281–326, doi:10.1080/07352689.2014.898455, 2015.
R Core Team: R: A language and environment for statistical computing. R Foundation for Statistical Computing, Vienna, 10 Austria. ISBN 3-900051-07-0. [online] Available from: http://www.R-project.org/, 2016.
Rafique, R., Anex, R., Hennessy, D. and Kiely, G.: What are the impacts of grazing and cutting events on the N2O dynamics in humid temperate grassland?, Geoderma, 181–182, 36–44, doi:10.1016/j.geoderma.2012.03.006, 2012.
Rihm, B. and Achermann, B.: Critical Loads of Nitrogen and their Exceedances. Swiss contribution to the effects-oriented work under the Convention on Long-range Transboundary Air Pollution (UNECE), Environmental studies, Federal Office 15 for the Environment, Bern., 2016.
Rochette, P. and Janzen, H. H.: Towards a revised coefficient for estimating N2O emissions from legumes, Nutr. Cycl. Agroecosys., 73(2–3), 171–179, doi:10.1007/s10705-005-0357-9, 2005.
Rogiers, N., Eugster, W., Furger, M. and Siegwolf, R.: Effect of land management on ecosystem carbon fluxes at a subalpine grassland site in the Swiss Alps, Theor. Appl. Climatol., 80(2–4), 187–203, doi:10.1007/s00704-004-0099-7, 2005. 20
Rosen, A. and Ljunggren, H.: Denitrification by Rhizobium meliloti. Field and laboratory studies with soil, Swed. J. Agric. Res., 26(4), 153–160, 1996.
Roth, K.: Bodenkartierung und GIS-basierte Kohlenstoffinventur von Graslandböden, Diploma Thesis, University of Zurich., 2006.
Rudaz, A. O., Wälti, E., Kyburz, G., Lehmann, P. and Fuhrer, J.: Temporal variation in N2O and N2 fluxes from a permanent 25 pasture in Switzerland in relation to management, soil water content and soil temperature, Agr. Ecosyst. Environ., 73(1), 83–91, doi:10.1016/S0167-8809(99)00005-5, 1999.
Schmeer, M., Loges, R., Dittert, K., Senbayram, M., Horn, R. and Taube, F.: Legume-based forage production systems reduce nitrous oxide emissions, Soil Till. Res., 143, 17–25, doi:10.1016/j.still.2014.05.001, 2014.
Sieber, R., Hollenstein, L., Odden, B. and Hurni, L.: From classic atlas design to collaborative platforms – The 30 SwissAtlasPlatform Project, in From classic atlas design to collaborative platforms, Paris., 2011.
Šimek, M., Elhottová, D., Klimeš, F. and Hopkins, D. W.: Emissions of N2O and CO2, denitrification measurements and soil properties in red clover and ryegrass stands, Soil Biol. Biochem., 36(1), 9–21, doi:10.1016/j.soilbio.2003.08.010, 2004.
27
Sintermann, J., Ammann, C., Kuhn, U., Spirig, C., Hirschberger, R., Gärtner, A. and Neftel, A.: Determination of field scale ammonia emissions for common slurry spreading practice with two independent methods, Atmos. Meas. Tech., 4(9), 1821–1840, doi:10.5194/amt-4-1821-2011, 2011.
Skinner, C., Gattinger, A., Muller, A., Mäder, P., Fliebach, A., Stolze, M., Ruser, R. and Niggli, U.: Greenhouse gas fluxes from agricultural soils under organic and non-organic management - A global meta-analysis, Sci. Total Environ., 468–469, 5 553–563, doi:10.1016/j.scitotenv.2013.08.098, 2014.
Smith, K. A., McTaggart, I. P. and Tsuruta, H.: Emissions of N2O and NO associated with nitrogen fertilization in intensive agriculture, and the potential for mitigation, Soil Use Manage., 13(s4), 296–304, doi:10.1111/j.1475-2743.1997.tb00601.x, 1997.
Smith, P., Martino, D., Cai, Z., Gwary, D., Janzen, H., Kumar, P., McCarl, B., Ogle, S., O’Mara, F., Rice, C., Scholes, B., 10 Sirotenko, O., Howden, M., McAllister, T., Pan, G., Romanenkov, V., Schneider, U., Towprayoon, S., Wattenbach, M. and Smith, J.: Greenhouse gas mitigation in agriculture, Philos. T. Roy. Soc. B, 363(1492), 789–813, doi:10.1098/rstb.2007.2184, 2008.
Snyder, C. S., Bruulsema, T. W., Jensen, T. L. and Fixen, P. E.: Review of greenhouse gas emissions from crop production systems and fertilizer management effects, Agr. Ecosyst. Environ., 133(3–4), 247–266, doi:10.1016/j.agee.2009.04.021, 15 2009.
Suter, M., Connolly, J., Finn, J. A., Loges, R., Kirwan, L., Sebastià, M.-T. and Lüscher, A.: Nitrogen yield advantage from grass–legume mixtures is robust over a wide range of legume proportions and environmental conditions, Glob. Change Biol., 21(6), 2424–2438, doi:10.1111/gcb.12880, 2015.
Tubiello, F. N., Salvatore, M., Ferrara, A. F., House, J., Federici, S., Rossi, S., Biancalani, R., Condor Golec, R. D., Jacobs, 20 H., Flammini, A., Prosperi, P., Cardenas-Galindo, P., Schmidhuber, J., Sanz Sanchez, M. J., Srivastava, N. and Smith, P.: The contribution of agriculture, forestry and other land use activities to global warming, 1990–2012, Glob. Change Biol., 21(7), 2655–2660, doi:10.1111/gcb.12865, 2015.
Unkovich, M.: Measuring plant-associated nitrogen fixation in agricultural systems, Australian Centre for International Agricultural Research (ACIAR), Canberra., 2008. 25
Vellinga, T. V., de Haan, M. H. A., Schils, R. L. M., Evers, A. and van den Pol–van Dasselaar, A.: Implementation of GHG mitigation on intensive dairy farms: Farmers’ preferences and variation in cost effectiveness, Livest. Sci., 137(1), 185–195, doi:10.1016/j.livsci.2010.11.005, 2011.
Vickers, D. and Mahrt, L.: Quality control and flux sampling problems for tower and aircraft data, J. Atmos. Ocean. Tech., 14(3), 512–526, 1997. 30
Virkajärvi, P., Maljanen, M., Saarijärvi, K., Haapala, J. and Martikainen, P. J.: N2O emissions from boreal grass and grass - clover pasture soils, Agr. Ecosyst. Environ., 137(1–2), 59–67, doi:10.1016/j.agee.2009.12.015, 2010.
Wagner-Riddle, C., Hu, Q. C., van Bochove, E. and Jayasundara, S.: Linking nitrous oxide flux during spring thaw to nitrate denitrification in the soil profile, Soil Sci. Soc. Am. J., 72(4), 908–916, doi:10.2136/sssaj2007.0353, 2008.
Webb, E. K., Pearman, G. I. and Leuning, R.: Correction of flux measurements for density effects due to heat and water 35 vapour transfer, Q. J. R. Meteorol. Soc., 106(447), 85–100, doi:10.1002/qj.49710644707, 1980.
28
Weisser, W. W., Roscher, C., Meyer, S. T., Ebeling, A., Luo, G., Allan, E., Beßler, H., Barnard, R. L., Buchmann, N., Buscot, F., Engels, C., Fischer, C., Fischer, M., Gessler, A., Gleixner, G., Halle, S., Hildebrandt, A., Hillebrand, H., de Kroon, H., Lange, M., Leimer, S., Le Roux, X., Milcu, A., Mommer, L., Niklaus, P. A., Oelmann, Y., Proulx, R., Roy, J., Scherber, C., Scherer-Lorenzen, M., Scheu, S., Tscharntke, T., Wachendorf, M., Wagg, C., Weigelt, A., Wilcke, W., Wirth, C., Schulze, E.-D., Schmid, B. and Eisenhauer, N.: Biodiversity effects on ecosystem functioning in a 15-year grassland 5 experiment: Patterns, mechanisms, and open questions, Basic Appl. Ecol., 23, 1–73, doi:10.1016/j.baae.2017.06.002, 2017.
Wilks, D. S.: Statistical Methods in the Atmospheric Sciences, Volume 100, Third Edition, 3 edition., Academic Press, Amsterdam, 2011.
Wolf, B., Merbold, L., Decock, C., Tuzson, B., Harris, E., Six, J., Emmenegger, L. and Mohn, J.: First on-line isotopic characterization of N2O above intensively managed grassland, Biogeosciences, 12(8), 2517–2531, doi:10.5194/bg-12-2517-10 2015, 2015.
Wood, S.: Fast stable restricted maximum likelihood and marginal likelihood estimation of semiparametric generalized linear models, Journal of the Royal Statistical Society (B), 2011.
Wood, S. N.: On confidence intervals for generalized additive models based on penalized regression splines, Aust. N. Z. J. Stat., 48(4), 445–464, doi:10.1111/j.1467-842X.2006.00450.x, 2006. 15
Zeeman, M. J., Hiller, R., Gilgen, A. K., Michna, P., Plüss, P., Buchmann, N. and Eugster, W.: Management and climate impacts on net CO2 fluxes and carbon budgets of three grasslands along an elevational gradient in Switzerland, Agr. Forest Meteorol., 150(4), 519–530, doi:10.1016/j.agrformet.2010.01.011, 2010.
20

29
Figure 1. (a) Experimental setup and measured variables at the experimental research site Chamau (CH-Cha). The clover parcel (north) is managed to increase nitrogen inputs from the atmosphere via increased biologically fixed nitrogen (BFN). This was achieved by over-sowing with clover in March 2015 and April 2016. In contrast, the control parcel under conventional management (south) obtains most N in form of organic fertilizer (i.e. slurry) and only small N inputs via BNF. Blue dots represent soil sampling locations. (b) Footprint climatology of 5 the years 2013–2016 with footprint contour lines of 10% to 90% in 10% steps using the Kljun et al. (2015) footprint model (source for background picture: Swisstopo (https://map.geo.admin.ch/). The prevailing wind direction was from the north.
FertilizerN
BFN
Soil plotsSoil water contentSoil temperature
Oxygen concentrationVegetation height
Random samplingNitrate, Ammonium
DOC Biomass
Leaf area index
Control Parcel
EC flux towerSonic anemometer
Open-path IRGA QCLAS
Meteorological sensorsTemperature
Relative humidityPrecipitation
Radiation balance components
PAR, PARreflected
BFN
(a) Experimental setup
CloverParcel
(b) Footprint climatology
N
S

30
Figure 2. Meteorological conditions during 2015 and 2016. (a) Average daily air temperature (2 m), (b) average daily photosynthetically
active radiation (2 m). The grey bars indicate the sub-daily variability (quartiles based on 10 min values). (c) Daily precipitation sums
during 2015 and 2016 (1 m).
5

31
Figure 3. Soil meteorological conditions during 2015 and 2016. (a) Average daily soil temperature (0.1 m depth), (b) average daily soil water content (0.1 m depth), (c) average daily soil oxygen concentration (0.1 m depth) at the control (left, red) and clover parcel (right, blue). The bars indicate the sub-daily variability (ranges of 10 min values).
5
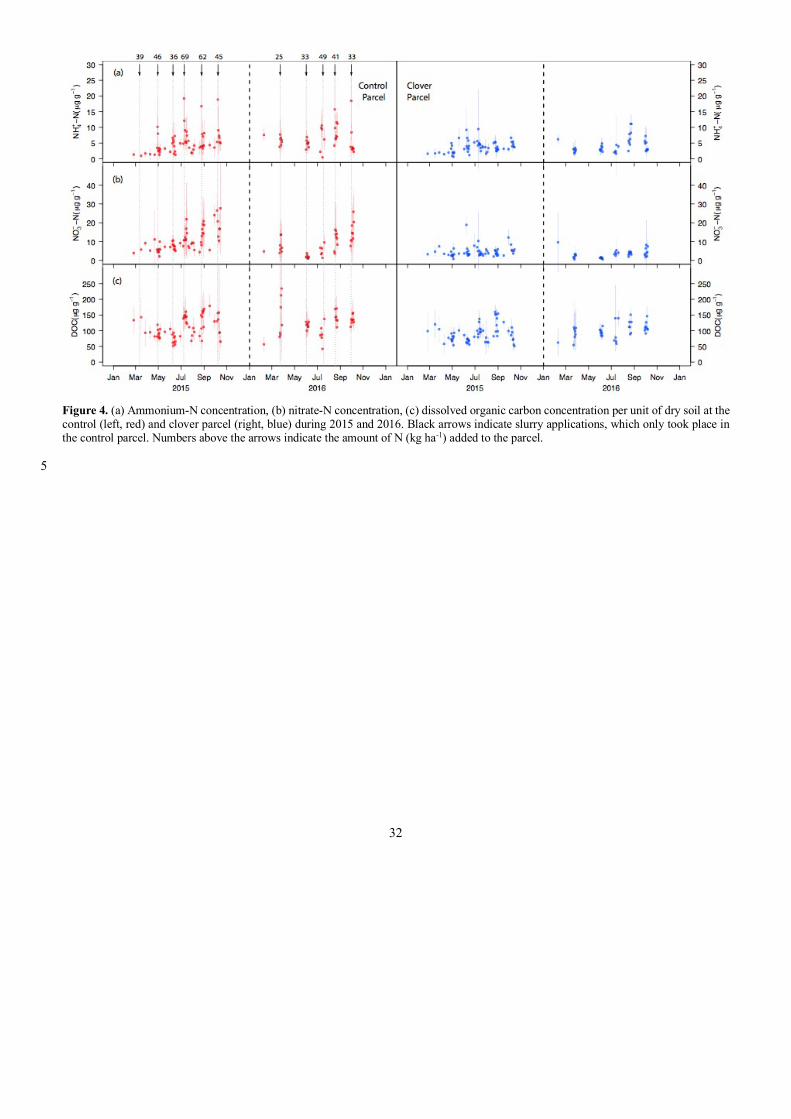
32
Figure 4. (a) Ammonium-N concentration, (b) nitrate-N concentration, (c) dissolved organic carbon concentration per unit of dry soil at the control (left, red) and clover parcel (right, blue) during 2015 and 2016. Black arrows indicate slurry applications, which only took place in the control parcel. Numbers above the arrows indicate the amount of N (kg ha-1) added to the parcel.
5
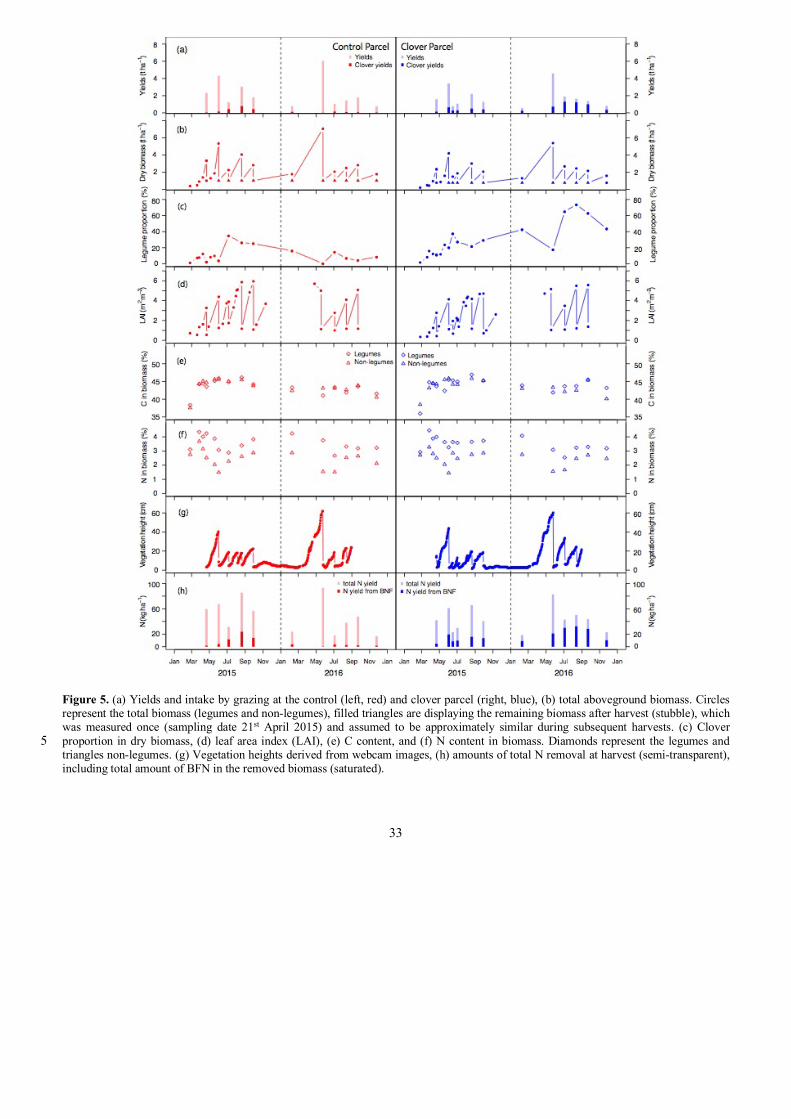
33
Figure 5. (a) Yields and intake by grazing at the control (left, red) and clover parcel (right, blue), (b) total aboveground biomass. Circles represent the total biomass (legumes and non-legumes), filled triangles are displaying the remaining biomass after harvest (stubble), which was measured once (sampling date 21st April 2015) and assumed to be approximately similar during subsequent harvests. (c) Clover proportion in dry biomass, (d) leaf area index (LAI), (e) C content, and (f) N content in biomass. Diamonds represent the legumes and 5 triangles non-legumes. (g) Vegetation heights derived from webcam images, (h) amounts of total N removal at harvest (semi-transparent), including total amount of BFN in the removed biomass (saturated).
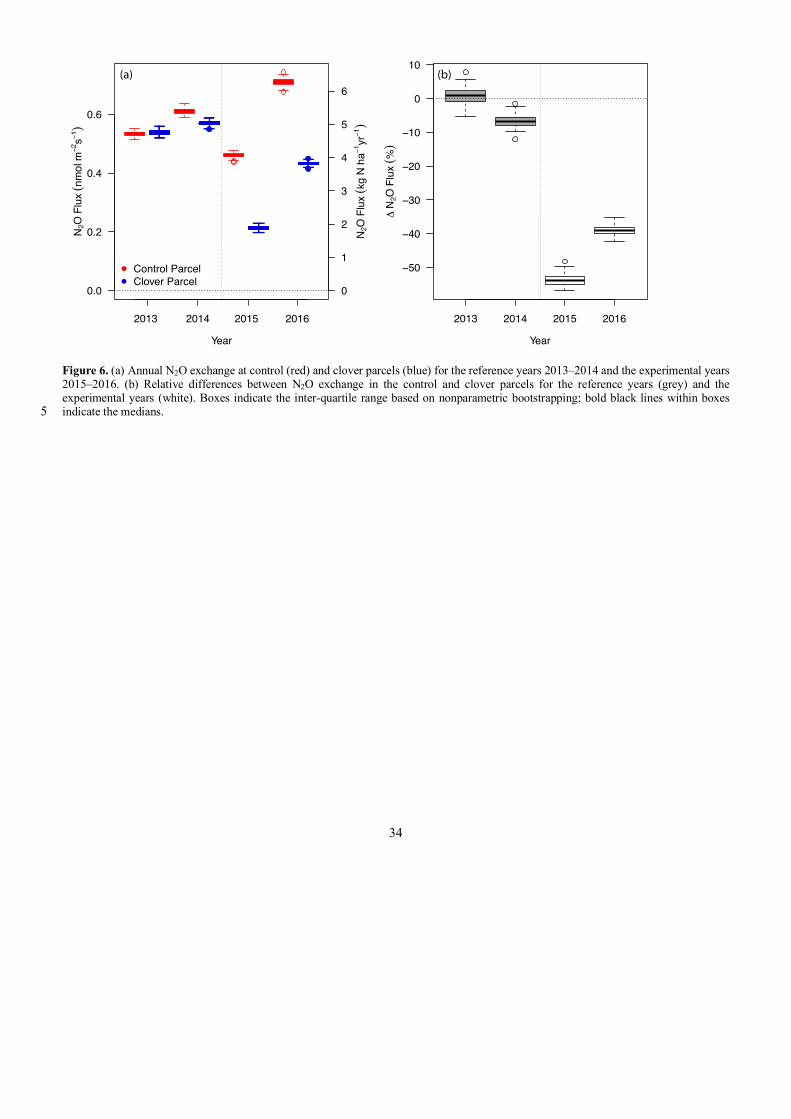
34
Figure 6. (a) Annual N2O exchange at control (red) and clover parcels (blue) for the reference years 2013–2014 and the experimental years 2015–2016. (b) Relative differences between N2O exchange in the control and clover parcels for the reference years (grey) and the experimental years (white). Boxes indicate the inter-quartile range based on nonparametric bootstrapping; bold black lines within boxes indicate the medians. 5
●
●
●
2013 2014 2016
0.0
0.2
0.4
0.6
Year
N 2O
Flu
x (n
mol
m−2
s−1)
0
1
2
3
4
5
6
N 2O
Flu
x ( k
g N
ha−1
yr−1
)
●
●
Control ParcelClover Parcel
2013 2014 2015 2016
−50
−40
−30
−20
−10
0
10
Year
Δ N
2O F
lux
(%)
(a) (b)
2015

35
Figure 7. N2O fluxes (bold lines: average; color bands: inter-quartile range of daily means across all events in 2015 and 2016) in the control and the clover parcels from one week before to two weeks after management events: after (a) organic fertilizer application, (b) harvests, (c) grazing events, and (d) rain events. The black dashed line indicates the start of an event.
5

36
Figure 8. Influence of management and environmental variables on N2O emissions as predicted by the generalized additive model (GAM). Significant effects were found for (a) management, (b) soil temperature (TS, 0.1 m depth), (c) soil water content (SWC, 0.1 m depth), (d) oxygen concentration (O2, 0.1 m depth), (e) carbon dioxide (CO2) flux and, while not significant (f) ammonium-N concentration (NH4-N, 0–0.2 m depth) still improved the model (lowered the AIC). No significant influence was found for (g) nitrate-N concentration (NO3-N, 0–5 0.2 m depth) and (h) dissolved organic carbon concentration (DOC, 0–0.2 m depth). Measurements are displayed as squares for “no management”, upward triangles for harvests at the control (red) and clover (blue) parcels, and downward triangles (red) for fertilization (control). Predictions are displayed if lowering AIC as solid lines for the category “no management”, as dashed lines for harvests, and as dot-dashed line for fertilization based on average values for all other drivers, respectively.
10
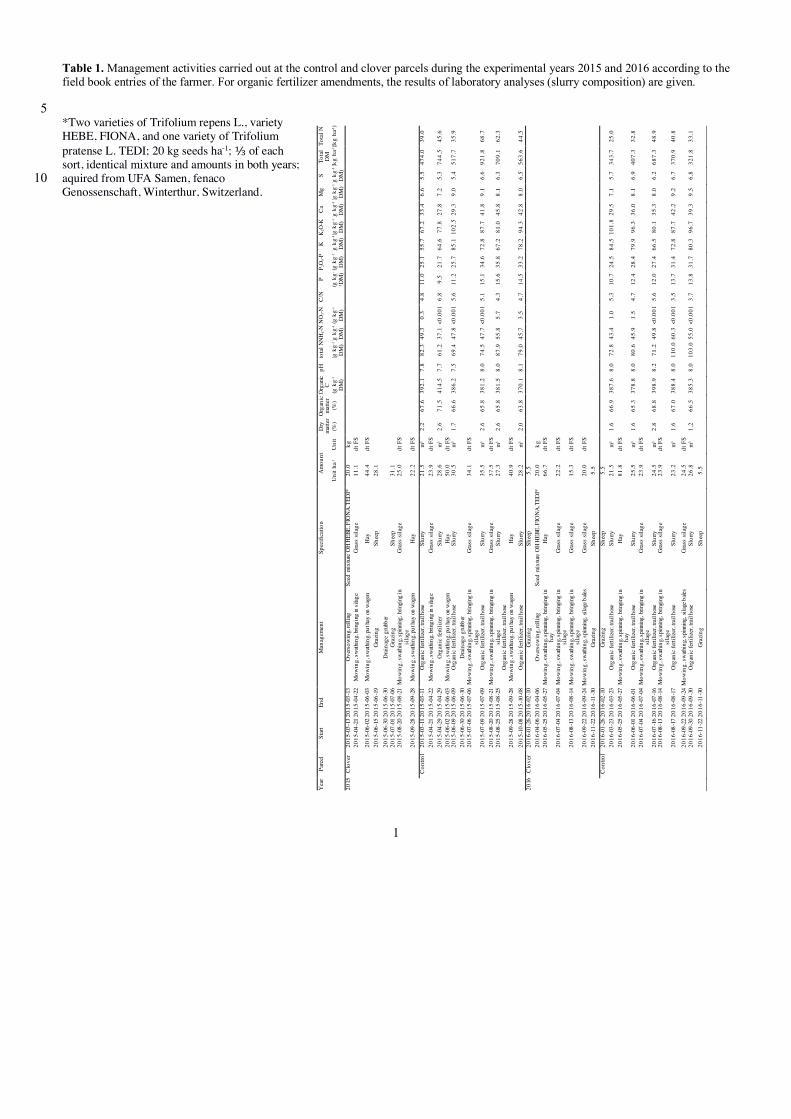
1
Table 1. Management activities carried out at the control and clover parcels during the experimental years 2015 and 2016 according to the field book entries of the farmer. For organic fertilizer amendments, the results of laboratory analyses (slurry composition) are given.
5 *Two varieties of Trifolium repens L., variety HEBE, FIONA, and one variety of Trifolium pratense L. TEDI; 20 kg seeds ha-1; ⅓ of each sort, identical mixture and amounts in both years; aquired from UFA Samen, fenaco 10 Genossenschaft, Winterthur, Switzerland.
Yea
r Pa
rcel
St
art
End
Man
agem
ent
Spec
ifica
tion
Am
ount
D
ry
mat
ter
Org
anic
m
atte
r O
rgan
ic C
pH
to
tal N
NH
4-N N
O3-N
C
/N
P P 2
O5-P
K
K
2O-K
C
a M
g S
Tota
l D
M
Tota
l N
Uni
t ha-1
U
nit
(%)
(%)
(g k
g-1
DM
)
(g k
g-1
DM
) (g
kg-1
D
M)
(g k
g-1
DM
)
(g k
g-
1 DM
) (g
kg-1
D
M)
(g k
g-1
DM
) (g
kg-1
D
M)
(g k
g-1
DM
) (g
kg-1
D
M)
(g k
g-1
DM
) (k
g ha
-1) (k
g ha
-1)
2015
C
love
r 20
15-0
3-13
201
5-03
-13
Ove
rsow
ing,
rolli
ng
Seed
mix
ture
OH
HEB
E, F
ION
A, T
EDI*
20
.0
kg
20
15-0
4-21
201
5-04
-22
Mow
ing,
swath
ing,
brin
ging
in si
lage
Gra
ss s
ilage
11
.1
dt F
S
2015
-06-
02 2
015-
06-0
3 M
owin
g, sw
athin
g, pu
t hay
on
wag
on
Hay
44
.4
dt F
S
2015
-06-
15 2
015-
06-1
9 G
razi
ng
Shee
p 28
.1
20
15-0
6-30
20
15-0
7-01
2015
-06-
30
2015
-07-
06
Dra
inag
e gr
ubbe
r G
razi
ng
Shee
p 31
.1
2015
-08-
20 2
015-
08-2
1 M
owin
g, sw
athin
g, sp
inni
ng, b
ringi
ng in
si
lage
G
rass
sila
ge
25.0
dt
FS
2015
-09-
28 2
015-
09-2
8 M
owin
g, sw
athin
g, pu
t hay
on
wag
on
Hay
22
.2
dt F
S
C
ontro
l 20
15-0
3-11
201
5-03
-11
Org
anic
ferti
lizer
, tra
il ho
se
Slur
ry
21.5
m
3 2.
2 67
.6
392.
1 7.
8 82
.3
49.3
0.
3 4.
8 11
.0
25.1
55
.7
67.2
33
.4
6.6
5.5
474.
0 39
.0
2015
-04-
21 2
015-
04-2
2 M
owin
g, sw
athin
g, br
ingi
ng in
silag
e G
rass
sila
ge
23.9
dt
FS
20
15-0
4-29
201
5-04
-29
Org
anic
ferti
lizer
Sl
urry
28
.6
m3
2.6
71.5
41
4.5
7.7
61.2
37
.1 <
0.00
1 6.
8 9.
5 21
.7
64.6
77
.8
27.8
7.
2 5.
3 74
4.5
45.6
2015
-06-
02
2015
-06-
09 20
15-0
6-03
20
15-0
6-09
M
owin
g, sw
athin
g, pu
t hay
on
wag
on
Org
anic
ferti
lizer
, tra
il ho
se
Hay
Sl
urry
50
.0
30.5
dt
FS
m3
1.
7
66.6
386.
2
7.5
69
.4
47
.8
<0
.001
5.6
11
.2
25
.7
85
.1
10
2.5
29
.3
9.
0
5.4
51
7.7
35
.9
2015
-06-
30 2
015-
06-3
0 D
rain
age
grub
ber
2015
-07-
06 2
015-
07-0
6 M
owin
g, sw
athin
g, sp
inni
ng, b
ringi
ng in
si
lage
G
rass
sila
ge
34.1
dt
FS
2015
-07-
09 2
015-
07-0
9 O
rgan
ic fe
rtiliz
er, t
rail
hose
Sl
urry
35
.5
m3
2.6
65.8
38
1.2
8.0
74.5
47
.7 <
0.00
1 5.
1 15
.1
34.6
72
.8
87.7
41
.8
9.1
6.6
921.
8 68
.7
20
15-0
8-20
20
15-0
8-25
2015
-08-
21
2015
-08-
25 M
owin
g, sw
athin
g, sp
inni
ng, b
ringi
ng in
si
lage
O
rgan
ic fe
rtiliz
er, t
rail
hose
Gra
ss s
ilage
Sl
urry
37
.5
27.3
dt
FS
m3
2.
6 65
.8
381.
5 8.
0 87
.9
55.8
5.
7 4.
3 15
.6
35.8
67
.2
81.0
45
.8
8.1
6.3
709.
1 62
.3
2015
-09-
28 2
015-
09-2
8 M
owin
g, sw
athin
g, pu
t hay
on
wag
on
Hay
40
.9
dt F
S
2015
-10-
08 2
015-
10-0
8 O
rgan
ic fe
rtiliz
er, t
rail
hose
Sl
urry
28
.2
m3
2.0
63.8
37
0.1
8.1
79.0
45
.7
3.5
4.7
14.5
33
.2
78.2
94
.3
42.8
8.
0 6.
5 56
3.6
44.5
20
16
Clo
ver
2016
-01-
26 2
016-
02-1
0 G
razi
ng
Shee
p 5.
5
20
16-0
4-06
201
6-04
-06
Ove
rsow
ing,
rolli
ng
Seed
mix
ture
OH
HEB
E, F
ION
A, T
EDI*
20
.0
kg
20
16-0
5-25
201
6-05
-27
Mow
ing,
swath
ing,
spin
ning
, brin
ging
in
hay
Hay
66
.7
dt F
S
2016
-07-
04 2
016-
07-0
4 M
owin
g, sw
athin
g, sp
inni
ng, b
ringi
ng in
si
lage
G
rass
sila
ge
22.2
dt
FS
2016
-08-
13 2
016-
08-1
4 M
owin
g, sw
athin
g, sp
inni
ng, b
ringi
ng in
si
lage
G
rass
sila
ge
15.3
dt
FS
2016
-09-
22 2
016-
09-2
4 M
owin
g, sw
athin
g, sp
inni
ng, s
ilage
bale
s G
rass
sila
ge
20.0
dt
FS
20
16-1
1-22
201
6-11
-30
Gra
zing
Sh
eep
5.5
C
ontro
l 20
16-0
1-26
201
6-02
-10
Gra
zing
Sh
eep
5.5
2016
-03-
23 2
016-
03-2
3 O
rgan
ic fe
rtiliz
er, t
rail
hose
Sl
urry
21
.5
m3
1.6
66.9
38
7.6
8.0
72.8
43
.4
1.0
5.3
10.7
24
.5
84.5
101
.8 2
9.5
7.1
5.7
343.
7 25
.0
2016
-05-
25 2
016-
05-2
7 M
owin
g, sw
athin
g, sp
inni
ng, b
ringi
ng in
ha
y H
ay
81.8
dt
FS
2016
-06-
01 2
016-
06-0
1 O
rgan
ic fe
rtiliz
er, t
rail
hose
Sl
urry
25
.5
m3
1.6
65.3
37
8.8
8.0
80.6
45
.9
1.5
4.7
12.4
28
.4
79.9
96
.3
36.0
8.
1 6.
9 40
7.3
32.8
20
16-0
7-04
201
6-07
-04
Mow
ing,
swath
ing,
spin
ning
, brin
ging
in
sila
ge
Gra
ss s
ilage
23
.9
dt F
S
20
16-0
7-16
20
16-0
8-13
2016
-07-
16
2016
-08-
14
Org
anic
ferti
lizer
, tra
il ho
se
Mow
ing,
swath
ing,
spin
ning
, brin
ging
in
sila
ge
Slur
ry
Gra
ss s
ilage
24
.5
23.9
m
3 dt
FS
2.8
68.8
39
8.9
8.2
71.2
49
.8 <
0.00
1 5.
6 12
.0
27.4
66
.5
80.1
35
.3
8.0
6.2
687.
3 48
.9
2016
-08-
17 2
016-
08-1
7 O
rgan
ic fe
rtiliz
er, t
rail
hose
Sl
urry
23
.2
m3
1.6
67.0
38
8.4
8.0
110.
0 60
.3 <
0.00
1 3.
5 13
.7
31.4
72
.8
87.7
42
.2
9.2
6.7
370.
9 40
.8
2016
-09-
22 2
016-
09-2
4 M
owin
g, sw
athin
g, sp
inni
ng, s
ilage
bale
s G
rass
sila
ge
24.5
dt
FS
20
16-0
9-30
201
6-09
-30
Org
anic
ferti
lizer
, tra
il ho
se
Slur
ry
26.8
m
3 1.
2 66
.5
385.
3 8.
0 10
3.0
55.0
<0.
001
3.7
13.8
31
.7
80.3
96
.7
39.3
9.
5 6.
8 32
1.8
33.1
20
16-1
1-22
201
6-11
-30
Gra
zing
Sh
eep
5.5
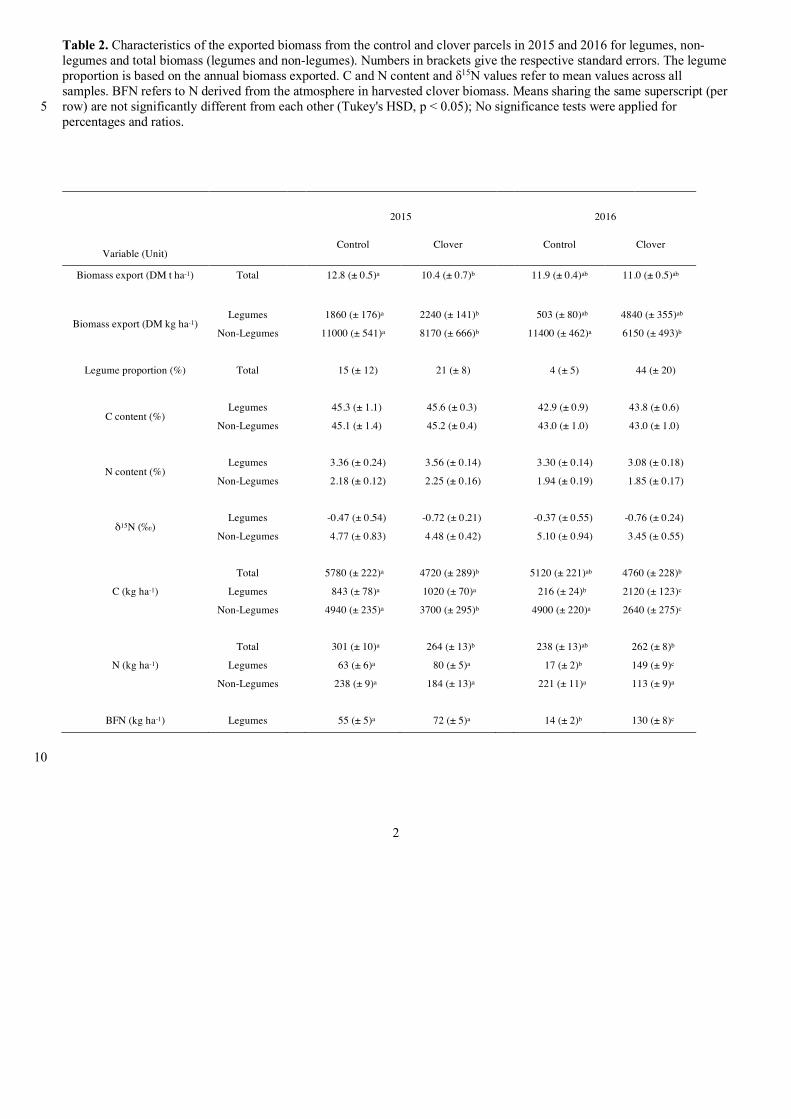
2
Table 2. Characteristics of the exported biomass from the control and clover parcels in 2015 and 2016 for legumes, non-legumes and total biomass (legumes and non-legumes). Numbers in brackets give the respective standard errors. The legume proportion is based on the annual biomass exported. C and N content and δ15N values refer to mean values across all samples. BFN refers to N derived from the atmosphere in harvested clover biomass. Means sharing the same superscript (per row) are not significantly different from each other (Tukey's HSD, p < 0.05); No significance tests were applied for 5 percentages and ratios.
10
2015 2016
Variable (Unit) Control Clover Control Clover
Biomass export (DM t ha-1) Total 12.8 (± 0.5)a 10.4 (± 0.7)b 11.9 (± 0.4)ab 11.0 (± 0.5)ab
Biomass export (DM kg ha-1) Legumes 1860 (± 176)a 2240 (± 141)b 503 (± 80)ab 4840 (± 355)ab
Non-Legumes 11000 (± 541)a 8170 (± 666)b 11400 (± 462)a 6150 (± 493)b
Legume proportion (%) Total 15 (± 12) 21 (± 8) 4 (± 5) 44 (± 20)
C content (%) Legumes 45.3 (± 1.1) 45.6 (± 0.3) 42.9 (± 0.9) 43.8 (± 0.6)
Non-Legumes 45.1 (± 1.4) 45.2 (± 0.4) 43.0 (± 1.0) 43.0 (± 1.0)
N content (%) Legumes 3.36 (± 0.24) 3.56 (± 0.14) 3.30 (± 0.14) 3.08 (± 0.18)
Non-Legumes 2.18 (± 0.12) 2.25 (± 0.16) 1.94 (± 0.19) 1.85 (± 0.17)
δ15N (‰) Legumes -0.47 (± 0.54) -0.72 (± 0.21) -0.37 (± 0.55) -0.76 (± 0.24)
Non-Legumes 4.77 (± 0.83) 4.48 (± 0.42) 5.10 (± 0.94) 3.45 (± 0.55)
C (kg ha-1)
Total 5780 (± 222)a 4720 (± 289)b 5120 (± 221)ab 4760 (± 228)b
Legumes 843 (± 78)a 1020 (± 70)a 216 (± 24)b 2120 (± 123)c
Non-Legumes 4940 (± 235)a 3700 (± 295)b 4900 (± 220)a 2640 (± 275)c
N (kg ha-1)
Total 301 (± 10)a 264 (± 13)b 238 (± 13)ab 262 (± 8)b
Legumes 63 (± 6)a 80 (± 5)a 17 (± 2)b 149 (± 9)c
Non-Legumes 238 (± 9)a 184 (± 13)a 221 (± 11)a 113 (± 9)a
BFN (kg ha-1) Legumes 55 (± 5)a 72 (± 5)a 14 (± 2)b 130 (± 8)c
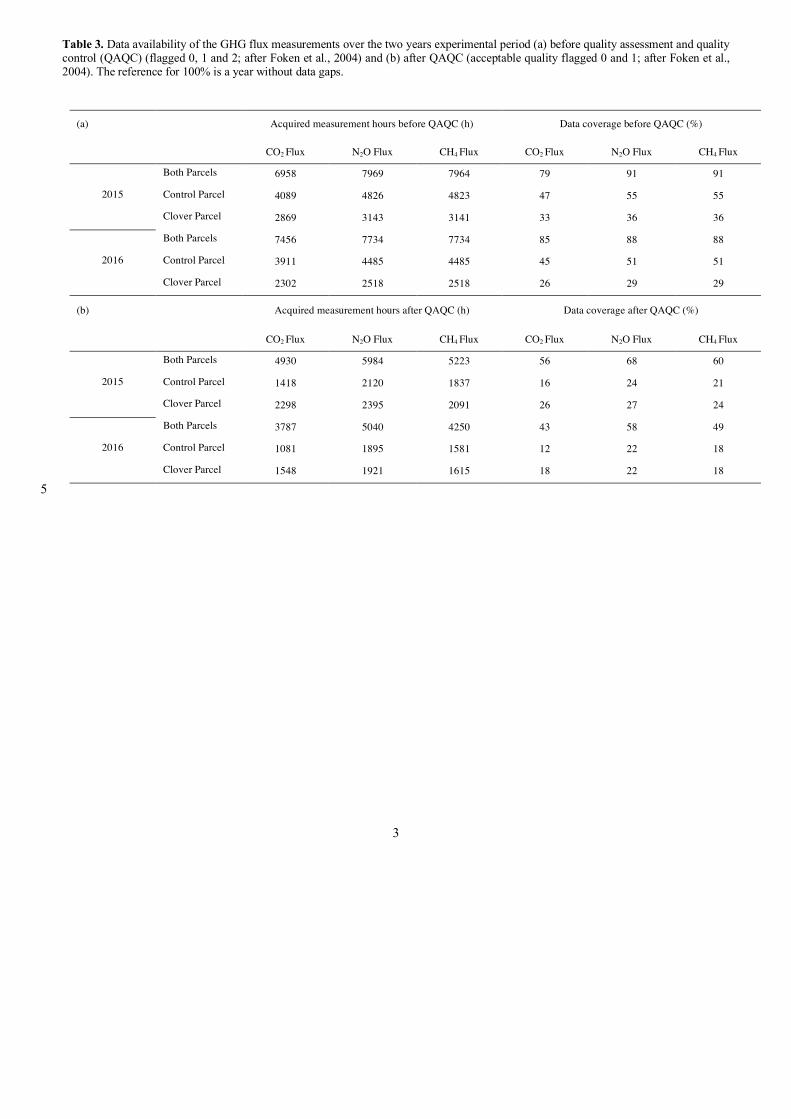
3
Table 3. Data availability of the GHG flux measurements over the two years experimental period (a) before quality assessment and quality control (QAQC) (flagged 0, 1 and 2; after Foken et al., 2004) and (b) after QAQC (acceptable quality flagged 0 and 1; after Foken et al., 2004). The reference for 100% is a year without data gaps.
(a) Acquired measurement hours before QAQC (h) Data coverage before QAQC (%)
CO2 Flux N2O Flux CH4 Flux CO2 Flux N2O Flux CH4 Flux
2015
Both Parcels 6958 7969 7964 79 91 91
Control Parcel 4089 4826 4823 47 55 55
Clover Parcel 2869 3143 3141 33 36 36
2016
Both Parcels 7456 7734 7734 85 88 88
Control Parcel 3911 4485 4485 45 51 51
Clover Parcel 2302 2518 2518 26 29 29
(b) Acquired measurement hours after QAQC (h) Data coverage after QAQC (%)
CO2 Flux N2O Flux CH4 Flux CO2 Flux N2O Flux CH4 Flux
2015
Both Parcels 4930 5984 5223 56 68 60
Control Parcel 1418 2120 1837 16 24 21
Clover Parcel 2298 2395 2091 26 27 24
2016
Both Parcels 3787 5040 4250 43 58 49
Control Parcel 1081 1895 1581 12 22 18
Clover Parcel 1548 1921 1615 18 22 18
5

4
Table 4. Results of generalized additive models (GAM) (a) including all variables (full model), (b) reduced after stepwise backward elimination, dismissing DOC and nitrate (optimized model); (c) simplified including only management, soil temperature (TS) and volumetric soil water content (SWC). The control parcel without recent management (Ctr-0) was used as the reference level for the categorical variable management, thus the constant represents predictions for Ctr-0 and the effect sizes of all other management categories depict differences 5 compared to Ctr-0. The effect sizes are displayed with their standard errors and p values for all linear terms. For the non-linear terms soil water content and oxygen concentration, the respective empirical degrees of freedom (edf) and p values are shown. The effect sizes are direct model outputs, while the values used in the text were back-transformed to increase comprehensibility.
Dependent variable: log N2O Flux
(a) full model (b) optimized model (c) simple model
Covariates effect size (± se) p-value effect size (± se) p-value effect size (± se) p-value
Parametric coefficients:
Control after harvest (Ctr-H) 0.30 (± 0.24) 0.223 0.13 (± 0.22) 0.567 0.17 (± 0.07) 0.012* Control after fertilization (Ctr-F) 0.46 (± 0.19) 0.016* 0.40 (± 0.17) 0.025* 0.31 (± 0.06) <0.0001*** Clover no management (Clo-0) 0.14 (± 0.18) 0.432 0.11 (± 0.18) 0.529 -0.02 (± 0.03) 0.567 Clover after harvest (Clo-H) 0.24 (± 0.22) 0.269 0.20 (± 0.22) 0.359 0.10 (± 0.07) 0.129 TS (°C) 0.03 (± 0.01) 0.023* 0.03 (± 0.01) 0.004** 0.03 (± 0.002) <0.0001*** CO2 Flux (µmol m-2 s-1) 0.02 (± 0.01) 0.018* 0.02 (± 0.01) 0.025*
NH4-N (µg g-1) 0.02 (± 0.01) 0.167 0.02 (± 0.01) 0.074
NO3-N (µg g-1) -0.01 (± 0.01) 0.231
DOC (µg g-1) 0.002 (± 0.001) 0.303
Constant -4.22 (± 0.25) <0.0001*** -4.17 (± 0.23) <0.0001*** -3.97 (± 0.04) <0.0001*** Approximate significance of smooth terms: edf p-value edf p-value edf p-value SWC 2.33 0.119 1.87 0.048* 1.98 <0.0001 *** O2 concentration 2.81 0.0001*** 2.72 0.0003***
Observations 90 93 891 Adjusted r2 53.5% 54.5% 26.3%
Explained deviance 60.9% 60.2% 26.9% GCV score 0.1183 0.1152 0.1761
*p<0.05 **p<0.01 ***p<0.001
10
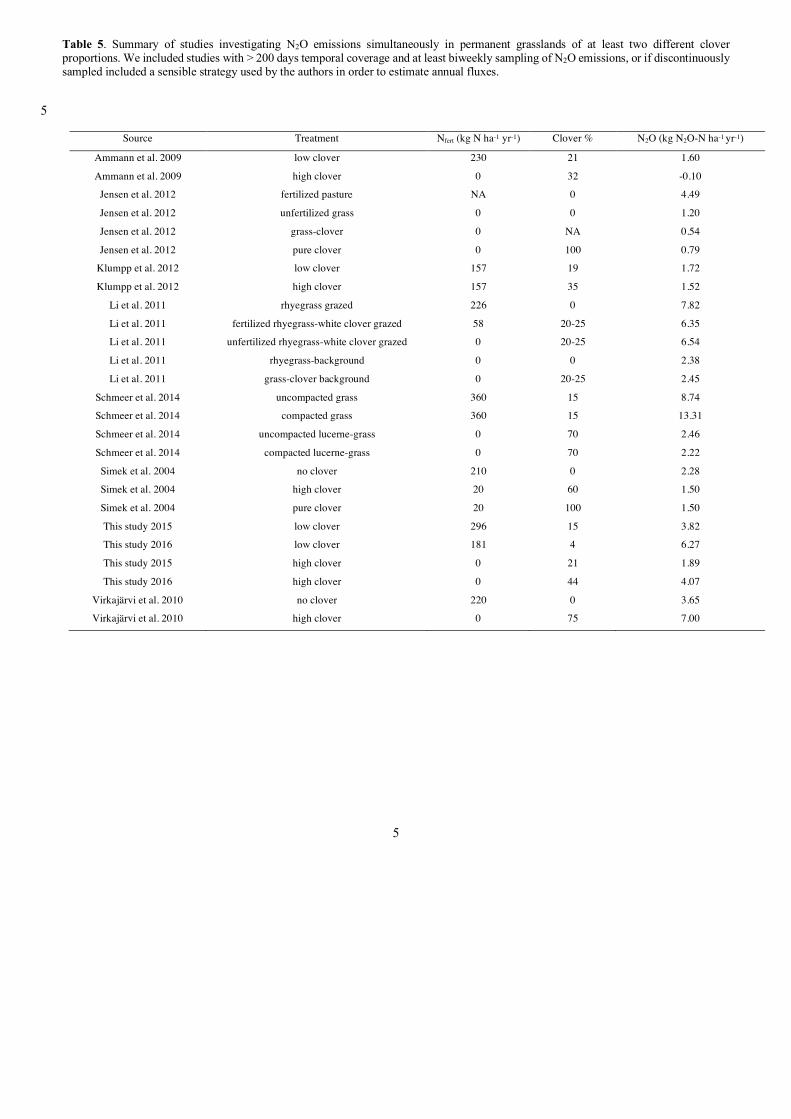
5
Table 5. Summary of studies investigating N2O emissions simultaneously in permanent grasslands of at least two different clover proportions. We included studies with > 200 days temporal coverage and at least biweekly sampling of N2O emissions, or if discontinuously sampled included a sensible strategy used by the authors in order to estimate annual fluxes.
5
Source Treatment Nfert (kg N ha-1 yr-1) Clover % N2O (kg N2O-N ha-1 yr-1)
Ammann et al. 2009 low clover 230 21 1.60
Ammann et al. 2009 high clover 0 32 -0.10
Jensen et al. 2012 fertilized pasture NA 0 4.49
Jensen et al. 2012 unfertilized grass 0 0 1.20
Jensen et al. 2012 grass-clover 0 NA 0.54
Jensen et al. 2012 pure clover 0 100 0.79
Klumpp et al. 2012 low clover 157 19 1.72
Klumpp et al. 2012 high clover 157 35 1.52
Li et al. 2011 rhyegrass grazed 226 0 7.82
Li et al. 2011 fertilized rhyegrass-white clover grazed 58 20-25 6.35
Li et al. 2011 unfertilized rhyegrass-white clover grazed 0 20-25 6.54
Li et al. 2011 rhyegrass-background 0 0 2.38
Li et al. 2011 grass-clover background 0 20-25 2.45
Schmeer et al. 2014 uncompacted grass 360 15 8.74
Schmeer et al. 2014 compacted grass 360 15 13.31
Schmeer et al. 2014 uncompacted lucerne-grass 0 70 2.46
Schmeer et al. 2014 compacted lucerne-grass 0 70 2.22
Simek et al. 2004 no clover 210 0 2.28
Simek et al. 2004 high clover 20 60 1.50
Simek et al. 2004 pure clover 20 100 1.50
This study 2015 low clover 296 15 3.82
This study 2016 low clover 181 4 6.27
This study 2015 high clover 0 21 1.89
This study 2016 high clover 0 44 4.07
Virkajärvi et al. 2010 no clover 220 0 3.65
Virkajärvi et al. 2010 high clover 0 75 7.00
Copyright © 2022 FDOKUMEN