Modulation of Functional EEG Networks by the NMDA Antagonist Nitrous Oxide
APPLIED AND ENVIRONMENTAL MICROBIOLOGY, Mar. 2010, p. 1555–1562 Vol. 76, No. 50099-2240/10/$12.00 doi:10.1128/AEM.01394-09Copyright © 2010, American Society for Microbiology. All Rights Reserved.
Source of Nitrous Oxide Emissions during the Cow ManureComposting Process as Revealed by Isotopomer Analysis
of and amoA Abundance in BetaproteobacterialAmmonia-Oxidizing Bacteria�†
Koki Maeda,1,2* Sakae Toyoda,3 Ryosuke Shimojima,2 Takashi Osada,4 Dai Hanajima,1Riki Morioka,1 and Naohiro Yoshida2
Hokkaido Research Subteam for Waste Recycling System, National Agricultural Research Center for Hokkaido Region,National Agricultural and Food Research Organization, 1 Hitsujigaoka, Sapporo 062-8555, Japan1; Department of
Environmental Science and Technology, Tokyo Institute of Technology, 4259 Nagatsuta, Midori-ku, Yokohama 226-8502,Japan2; Department of Environmental Chemistry and Engineering, Tokyo Institute of Technology,
4259 Nagatsuta, Midori-ku, Yokohama 226-8502, Japan3; and Livestock Research Team onGlobal Warming, National Institute of Livestock and Grassland Science,
National Agricultural and Food Research Organization,2 Ikenodai, Tsukuba 305-0901, Japan4
Received 15 June 2009/Accepted 27 December 2009
A molecular analysis of betaproteobacterial ammonia oxidizers and a N2O isotopomer analysis were con-ducted to study the sources of N2O emissions during the cow manure composting process. Much NO2
�-N andNO3
�-N and the Nitrosomonas europaea-like amoA gene were detected at the surface, especially at the top ofthe composting pile, suggesting that these ammonia-oxidizing bacteria (AOB) significantly contribute to thenitrification which occurs at the surface layer of compost piles. However, the 15N site preference withinthe asymmetric N2O molecule (SP � �15N� � �15N�, where 15N� and 15N� represent the 15N/14N ratios at thecenter and end sites of the nitrogen atoms, respectively) indicated that the source of N2O emissions just afterthe compost was turned originated mainly from the denitrification process. Based on these results, thereduction of accumulated NO2
�-N or NO3�-N after turning was identified as the main source of N2O
emissions. The site preference and bulk �15N results also indicate that the rate of N2O reduction was relativelylow, and an increased value for the site preference indicates that the nitrification which occurred mainly in thesurface layer of the pile partially contributed to N2O emissions between the turnings.
The very sensitive greenhouse gas nitrous oxide (N2O) has a296 times higher impact than CO2 (39) and is also responsiblefor ozone depletion (10). Agricultural activities such as the useof nitrate fertilizers, livestock production, and manure man-agement, including composting, are known to be importantsources of N2O emissions (18). To devise a strategy to mitigateN2O emissions, it is essential to understand its sources indetail. However, the sources of N2O emissions during the com-posting process are still largely unclear.
In the composting process, a part of NH4�-N is known to be
processed through nitrification-denitrification and emitted asN2 and N2O. Nitrous oxide is known to be generated throughboth the nitrification and denitrification processes as interme-diate products or by-products. Nitrous oxide emission is a verycomplex process because denitrifying bacteria are phylogeneti-cally diverse (60), and nitrifiers are also known to utilize thedenitrification process even under aerobic conditions (42). It is
thus very difficult to estimate the relative contributions of ni-trification and denitrification in actual N2O emissions from theenvironment. Until now, there has been insufficient knowledgeabout the relative contributions of these processes to N2Oemissions during the animal manure composting process. Mea-surement of the actual contributions of N2O emissions fromcompost piles in the field is therefore critical to establishing astrategy of mitigating N2O emissions.
Recently, a high-precision analytical technique for determin-ing intramolecular 15N site preference in asymmetric mole-cules of N2O was developed (47). Since N2O has two N atomswithin the molecule (central and outer N), distribution of astable isotope, 15N, results in the distribution of three isotopo-mers, such as 15N15NO, 15N14NO, and 14N15NO. By using thisnewly developed innovative technique, the latter two types ofmolecules, which exist abundantly in the environment, can beindividually measured. The difference in �15N between �15N�
and �15N� is the so-called site preference (SP � �15N� ��15N�, where 15N� and 15N� represent the 15N/14N ratios at thecenter and end sites of the nitrogen atoms, respectively). Thesite preference enabled us to identify the source and sinks ofN2O in the environment (48, 49, 50, 56). Using this technique,Sutka et al. (44) found that the site preference for N2O fromhydroxylamine oxidation (�33‰) and nitrite reduction(�0‰) differs in a pure culture study and noted that this
* Corresponding author. Mailing address: Hokkaido Research Sub-team for Waste Recycling System, National Agricultural ResearchCenter for Hokkaido Region, National Agricultural and Food Re-search Organization, 1 Hitsujigaoka, Sapporo 062-8555, Japan. Phone:81-11-857-9237. Fax: 81-11-859-2178. E-mail: [email protected].
† Supplemental material for this article may be found at http://aem.asm.org/.
� Published ahead of print on 4 January 2010.
1555
difference can be used to distinguish the relative contributionsof nitrification and denitrification sources to N2O emissions.There have still been only several reported studies which ap-plied this measurement technique to field N2O samples (48,53) or referred to the relative contributions of nitrification anddenitrification. To our knowledge, the present study is the firstto apply this isotopomer analysis technique to the determina-tion of N2O sources in the composting process. We specificallyused this technique to understand the actual contributions ofnitrification and denitrification to N2O emissions during thecow manure composting process.
Ammonia oxidation, the conversion of ammonium to nitritevia hydroxylamine, is an initial step of the nitrification-denitri-fication process and is critical to the nitrogen cycle in theterrestrial environment (4, 24). In the nitrification process,N2O is generated as a by-product when ammonia oxidizersconvert hydroxylamine to nitrite (35). Since NO2
�-N andNO3
�-N accumulate in the latter stages of the compostingprocess (29, 30), it is obvious that nitrifiers are active in com-post piles. Therefore, it is important to clarify the role andsignificance of ammonia oxidizers in N2O emissions during thecomposting process. However, since the pure culture isolationmethod is so difficult and time-consuming, little is known aboutthese ammonia oxidizers. A molecular approach based on PCRhas been recently developed and has to date been used totarget the ammonia monooxygenase gene (amoA) or 16SrRNA gene of betaproteobacterial ammonia oxidizers in soil,wetlands, and marine sediments (2, 3, 6, 7, 13, 32, 52). Usingthese techniques, substantial information about unculturedammonia-oxidizing bacteria (AOB) that are partially or whollyresponsible for nitrification in the environment will becomeavailable. Since the microbial community drastically changesthrough the composting process (19, 29), and a high accumu-lation of nitrite or nitrate will occur, especially in the latter halfof the process (30), we continuously sampled and analyzed thediversity and abundance of AOB throughout the process. Ourobjectives in this study were to elucidate the sources of N2Oemissions during the cow manure composting process by com-bining the isotopomer analysis and molecular analysis of beta-proteobacterial AOB.
MATERIALS AND METHODS
Composting experiment. The composting experiments were performed twiceat the National Agriculture Research Center for the Hokkaido Region (SapporoCity, Hokkaido, Japan) from 29 May through 11 August 2008 (pile 1) and 2September through 14 October 2008 (pile 2). The cows were fed orchard grasssilage, corn silage, oat hay, alfalfa hay, beet pulp, and two types of concentratemixtures to meet their digestible energy requirements, as recommended by theJapanese feeding standard for dairy cattle (1). Lactating Holstein cow excrementand dried grass (Orchard grass; Dactylis glomerata) were used in this study.
About 2.5 metric tons of dairy cow excrement [total solids (TS), 18.9% � 0.4%(pile 1) and 20.2% � 0.6% (pile 2); volatile solids (VS), 80.6% � 1.0% TS (pile1) and 82.4% � 0.8% (pile 2)] and 250 kg of dried grass [TS, 83.0% � 0.2% (pile1) and 87.6% � 0.1% (pile 2); VS, 84.5% � 0.1% TS (pile 1) and 93.6% � 0.1%(pile 2)] were mixed. TS and VS were measured using a gravimetric method (see“Chemical analysis of the compost” below). About 2.5 metric tons of the mixturewas piled up on a waterproof concrete floor. Each pile had a volume of 3 m3, adiameter of 2.8 m, and a height of 1.4 m at the start of the experiment. Thecompost piles were turned with a front loader and a manure spreader once every2 weeks. The temperatures of the compost piles and ambient air were measuredhourly using a Thermo Recorder RTW-30S (Espec, Japan).
N2O emission measurement. Nitrous oxide emissions were measured using adynamic chamber system and an IPD (infrared photoacoustic detector; IN-
NOVA, Denmark), as described previously (29). The chamber system was de-signed to estimate the total gas emissions from compost piles, with a PVC(polyvinyl chloride) chamber equipped with blower ventilation and a gas sam-pling port on the ventilation exhaust. The chamber used in this study was 4 m inwidth, 6 m in depth, and 4 m in height. Four vent holes 10 cm in diameter wereinstalled in the upper part of the chamber and connected to the ventilationblower, installed outside, with PVC pipe. The airflow was controlled using theinverter and was at 271 m3/h constantly throughout the experimental period.Fresh air was introduced under the skirt of the chamber. The air was subsampledusing a Teflon tube (4 mm in diameter) inserted just before the in-line fan. TheN2O concentrations of exhaust air were measured every 30 min, with two repli-cations. According to the technical data of the IPD, the detection limit of N2Ois 0.03 ppm at a pressure of 1 atm and a temperature of 25°C, and this can betranslated to 0.06 mg/m3.
Analysis of N2O isotopomer ratios. Gas samples for N2O isotopomer analysiswere collected at 2- to 7-day intervals at the sampling port of the IPD, using asampling system which consisted of an ammonium trap (300 ml of 2 mM H2SO4
solution in a scrubbing bottle), water- and CO2-absorbing columns (7 mm insidediameter [i.d.]), 25-cm glass tubes packed with Mg(ClO4)2 (8/24 and 20/40 mesh;Wako Pure Chemical Industries, Osaka, Japan) and with Ascarite (NaOH onsupport, 8/20 and 20/30 mesh; Thomas Scientific, Swedesboro, NJ), a 1-liter glassbottle equipped with two stopcocks, a bellows pump (MB-21; Senior AerospaceMetal Bellows, Sharon, MA), and a flow monitor. During the sampling, concen-tration monitoring by the IPD was interrupted, and the Teflon tube was replacedwith a Tygon tube (3/8-in. i.d., 3 m). The chamber air was allowed to flow throughthe bottle at 0.5 liters min�1 for 15 min. Ambient air was also sampled at 2 mabove ground in an evacuated 1- to 2-liter stainless steel canister.
The N2O isotopomer ratios were measured using a gas chromatography-isotope ratio mass spectrometry (GC-IRMS) (MAT 252; Thermo Fisher Scien-tific K.K., Yokohama, Japan) system described elsewhere (46). Site-specific ni-trogen isotope analysis in N2O was conducted using ion detectors that had beenmodified for mass analysis of fragment ions of N2O (NO�) containing N atomsin the center positions of N2O molecules, whereas the bulk (average) nitrogenand oxygen isotope ratios were determined from molecular ions (47). Pure N2O(purity, 99.999%; Showa Denko K.K., Japan) was calibrated with internationalstandards and used as a working standard for the isotopomer ratios. The notationof the isotopomer ratios is shown below. The measurement precision was typi-cally better than 0.1‰ for �15Nbulk (where 15Nbulk represents the average15N/14N isotope ratio) and �18O and better than 0.5‰ for �15N� and �15N�.
�15Ni � 15Risample/15Rstd � 1� i � �, �, or bulk�
�18O � 18Rsample/18Rstd � 1�
Here, 15R� and 15R� represent the 15N/14N ratios at the center and end sites ofthe nitrogen atoms, respectively; 15Rbulk and 18R show average isotope ratios for15N/14N and 18O/16O, respectively. Subscripts “sample” and “std” indicate iso-tope ratios for the sample and the standard, respectively, N for atmospheric N2,and O for Vienna Standard Mean Ocean Water (V-SMOW). We also define the15N site preference (SP) as an illustrative parameter of the intramolecular dis-tribution of 15N, as follows.
15N site preference (SP) � �15N� � �15N�
The N2O concentration was measured simultaneously with isotopomer ratios bycomparing the peak area of the major ion (mass of 44 and 30 in molecular ionanalysis and fragment ion analysis, respectively) obtained with sample gas andwith a reference gas (349 ppb N2O in air; Japan Fine Products Co., Ltd.) (46).
Isotopomer ratios for compost-derived N2O (�compost) were calculated fromthose for chamber gas samples (�chamber) and ambient air samples (�air) using thefollowing mass balance equation:
�chamber � Cchamber � �air � Cair � �compost � Ccompost
where C is the N2O concentration and Ccompost equals Cchamber minus Cair.Chemical analysis of the compost. A fresh sample of about 1 kg from each
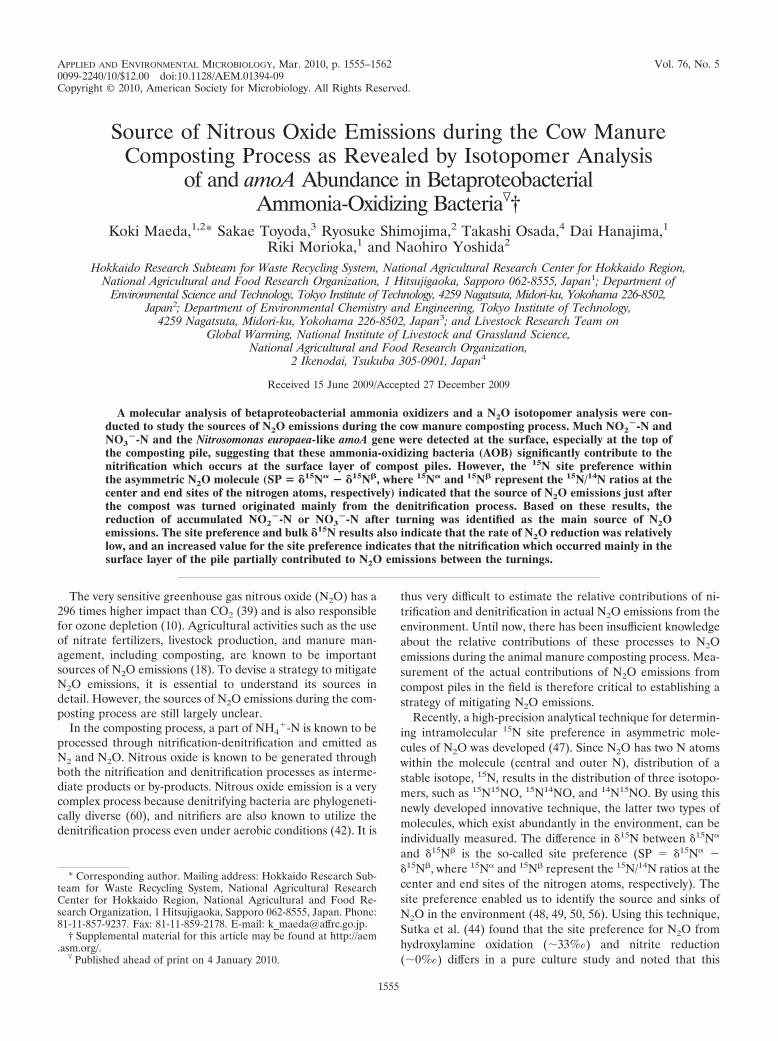
zone (Fig. 1) was collected just before each turning and at the start and end ofthe experiment. The level of total solids was measured after the samples driedovernight at 105°C. The dried samples were processed at 600°C for 1 h, and thelevel of volatile solids was calculated using the following equation (9):
volatile solids (percent of TS) � A � B�/A � 100
where A is the weight of the dried residue and B is the weight of the residue.Total nitrogen (T-N) was measured using the Kjeldahl method (5). The C/N
ratio was measured using vario Max CNS (Elementar, Germany).
1556 MAEDA ET AL. APPL. ENVIRON. MICROBIOL.
To measure inorganic N, pH, and electrical conductivity (EC), 7.5 g of freshcompost was placed into a 50-ml polypropylene tube with 30 ml of deionizedwater, shaken (200 rpm, 30 min), and then centrifuged (1,500 � g, 20 min). Thesupernatant was collected, and NH4-N, NO2-N, and NO3-N were measured usingion chromatography (DX-AQ 2211; Dionex); pH and EC were determined withcalibrated electrodes (Horiba, Japan).
DNA extraction. DNA extraction from the compost samples was performedusing the commercially available DNA extraction kit Isofecal (Nippon Gene,Japan). The extraction was done according to the manufacturer’s instructions,and the concentrations of DNA samples were measured by NanoDrop (ThermoScientific). The purified DNA samples were stored at �20°C until further anal-ysis.
AOB community structure analysis. Among the ammonia oxidizers in theenvironment, we analyzed only the betaproteobacterial AOB community usingthe PCR-denaturing gradient gel electrophoresis (DGGE) method targeting theamoA and 16S rRNA genes. The nested PCR procedure was used to obtain ahighly specific PCR product. Thermal cycler TP400 (Takara, Japan) and DNApolymerase PrimeStar (Takara, Japan) were used in this study. To amplify theamoA fragment, the primer set of amoA-1F and amoA-2R was used as describedpreviously (40). To amplify the betaproteobacterium-specific 16S rRNA gene,the CTO189f-GC and CTO654r primer pair was used as described previously(13). The reaction mixture was prepared with template DNA (ca. 20 ng), 5 Mof each primer, 5� PCR buffer for PrimeStar (included in the kit), 0.2 mM ofeach deoxynucleoside triphosphate (dNTP), and 0.5 U of PrimeStar DNA poly-merase, at a final volume of 20 l. The thermal profile for the amoA gene was asfollows: initial denaturation at 98°C for 5 min; 30 cycles of denaturation at 95°Cfor 10 s, annealing at 55°C for 5 s, and extension at 72°C for 1 min; final extensionat 72°C for 7 min; and cooling at 4°C. The thermal profile for the 16S rRNA genewas as follows: initial denaturation at 98°C for 5 min; 30 cycles of denaturationat 95°C for 10 s, annealing at 57°C for 5 s, and extension at 72°C for 1 min; finalextension at 72°C for 7 min; and cooling at 4°C. The PCR product was purifiedusing the commercial kit MonoFas (GL Science, Japan) and used for the secondPCR, using the same primer pairs. A GC clamp (5�-CGC CCG CCG CGC CCCGCG CCC GGC CCG CCG CCC CCG CCC C-3�) was attached to the 5� endof the forward primer to improve the separation of the PCR fragments. DGGEanalysis of the amplified bacterial amoA gene was performed on the DCodeuniversal mutation detection system (Bio-Rad), according to the manufacturer’sinstructions. Polyacrylamide gels (7%, wt/vol) containing a linear formamide/urea gradient ranging from 25% to 65% denaturant were used. The gels were runfor 15 h at 100 V and 60°C and stained with SYBR green for 30 min. The bandswere visualized with a transilluminator (AE-6911FXFD; ATTO, Japan).
Real-time PCR. Real-time PCR was performed using the commercially avail-able kit SYBR Premix Ex Taq II (Takara, Japan), with a 20- l reaction mix thatconsisted of 40 ng of template DNA. The primer pair used to amplify the amoAgene is described above. The primer pair used to amplify the 16S rRNA gene was341F and 517R, as described previously (23). The PCR protocol for amoAquantification was as follows: 10 s at 95°C and 40 cycles consisting of 10 s at 95°C,10 s at 55°C, and 34 s at 72°C. The PCR protocol for bacterial 16S rRNA genequantification was as follows: 10 s at 95°C and 40 cycles consisting of 10 s at 95°Cand 34 s at 60°C. Reactions were carried out in an ABI 7500 real-time PCRsystem (ABI). An external standard curve was prepared using serial dilutions ofa known copy number of the plasmid pGEM-T Easy vector (Promega) contain-ing the amoA gene of Nitrosomonas europaea (NBRC 14298). The standard curvefor the bacterial 16S rRNA gene was prepared using the 16S rRNA gene ofParacoccus denitrificans (NCIMB 16712), and the same vector was used for theamoA gene.
Cloning and sequencing. The excised DGGE bands were reamplified with ExTaq (Takara, Japan) with the primer set without a GC clamp. The PCR productwas purified using a commercial kit, as mentioned above, and cloned usingpGEM-T Easy vector systems, according to the instruction manual (Promega).Cells from randomly picked colonies (3 colonies per sample) were resuspendedin 20 l of prepared PCR mixtures, and the inserts were amplified as mentionedabove. The clones with the correct inserts were chosen for sequencing. Theplasmid DNA was purified using the Wizard Plus minipreps DNA purificationsystem (Promega), according to the instruction manual, and sequenced with theBigDye Terminator version 3.1 cycle sequencing kit (Applied Biosystems) andthe ABI Prism 3100 genetic analyzer.
Statistical analysis. The chemical analysis and gaseous concentration datawere analyzed by analysis of variance (ANOVA), using the general linear modelprocedure described by the SAS Institute (41). Tukey’s multiple range compar-ison tests were used to separate the means. A P value of �0.05 was consideredstatistically significant.
Nucleotide sequence accession numbers. The amoA and 16S rRNA genesequences reported in this study have been deposited in the DNA Data Bank ofJapan (DDBJ) under accession numbers AB495025 to AB495032 and AB496413to AB496419.
RESULTS
Composting, N2O emissions, and isotopomer analysis. Inboth piles 1 and 2, a significant reduction of weight, moisturecontent, and volatile solids occurred, indicating the active deg-radation of organic contents (Table 1). The maximum temper-atures of the center zones of the piles were 74.9°C (pile 1) and73.8°C (pile 2). These maximum temperatures indicate thehigh rate of degradation and microbial activity in both piles.However, the NO2
�-N and NO3�-N content tended to be
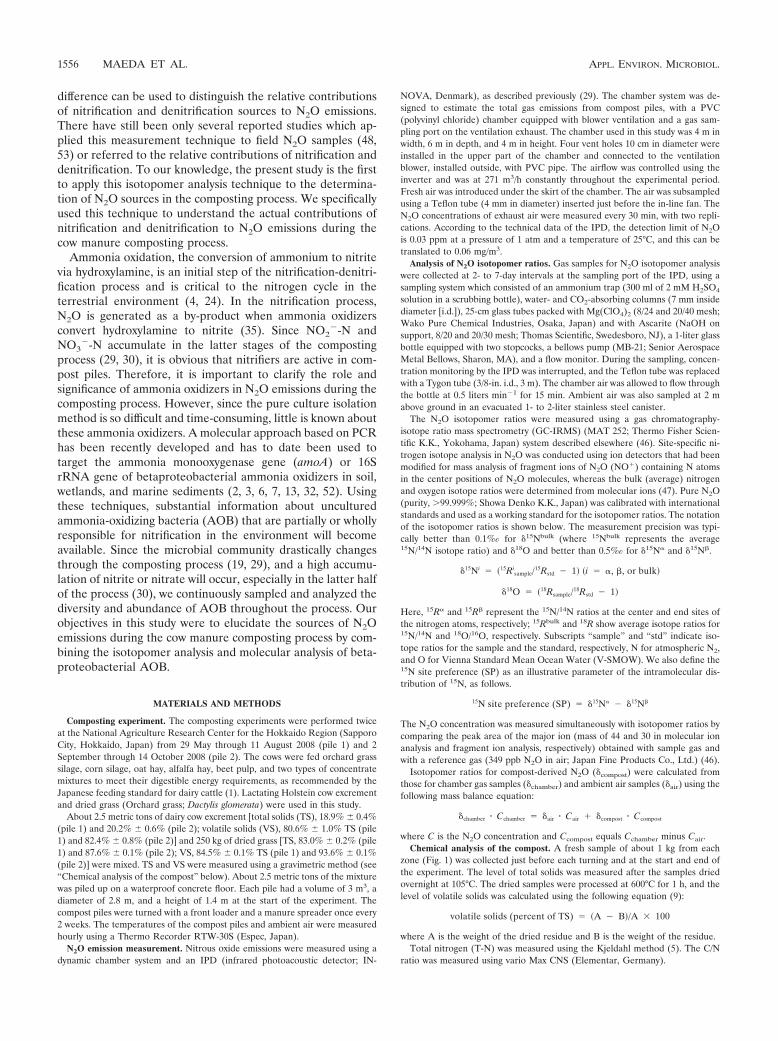
higher in pile 2 than in pile 1.The peak N2O emissions from pile 1 occurred just after the
turning, as we reported previously (Fig. 2a) (28). Figure 2bshows the variation of site preference, �15N, and �18O duringthe composting period of pile 1. The site preference of N2Owas low and ranged from 0.0‰ to 12.0‰ throughout thecomposting period, indicating that the relative contribution ofdenitrification in N2O emissions is high during the cow manure
FIG. 1. Sampling points of the piles. Samples were taken just be-fore each turning.
TABLE 1. Chemical component profiles of compost piles
Compostpile Wt (kg)
Chemical component profilea
TS (%) VS (% TS) NO2� (mg/kg TS) NO3
� (mg/kg TS) NH4� (mg/kg TS) TKN (g/kg TS) C/N ratio pH EC (mS/cm)
1, initial 2,790 27.0 (0.7)c 82.7 (0.2)a 17.8 (0.7)c 8.3 (10.3)c 512.2 (107.3)b 28.9 (1.0)b 18.8 (0.9)a 9.3 (0.1)b 2.2 (0.0)d
1, final 840 50.4 (0.9)b 68.8 (0.1)c 38.6 (7.4)b 1,783.8 (41.7)a 47.4 (7.8)c 34.2 (0.6)a 10.9 (0.1)b 8.9 (0.1)c 5.3 (0.1)b
2, initial 2,770 24.7 (0.3)d 74.8 (0.6)b 2.3 (2.2)c 7.9 (5.6)c 843.1 (48.9)a 26.9 (0.3)b 19.6 (0.3)a 8.6 (0.1)d 2.7 (0.3)c
2, final 970 53.9 (0.7)a 62.1 (1.4)d 138.4 (11.6)a 243.8 (5.7)b 121.6 (15.4)c 33.5 (0.7)a 12.3 (0.0)b 9.6 (0.0)a 5.9 (0.2)a
a TS, total solids (n � 3); VS, volatile solids (n � 3); TKN, total Kjeldahl nitrogen (n � 3); EC, electrical conductivity (n � 3). Values followed by different lettersindicate significant difference (P � 0.05). The values in parentheses indicate standard errors.
VOL. 76, 2010 N2O ISOTOPOMER AND AOB ANALYSIS OF COMPOST 1557
composting process. In particular, the average site preferenceof N2O just after the turning (2.0‰ � 2.3‰, n � 4) wassignificantly (P � 0.01) lower than that of the N2O samplesbetween the turnings (8.7‰ � 2.4‰, n � 7). Both the bulk�15N and �18O values did not show significant variation, exceptfor the last sample on day 56, and ranged between approxi-mately �34.2 and �9.1‰ in �15N and approximately 13.7 and
28.7‰ in �18O, respectively (see Table S1 in the supplementalmaterial). These values were distinct from the values reportedfor other field samples such as seawater (�15N, 1.7 to 22.7‰;�18O, 46 to 105‰ [55]) or soil (�15N, approximately �46 to�5‰; �18O, approximately �3 to 9‰ [36]).
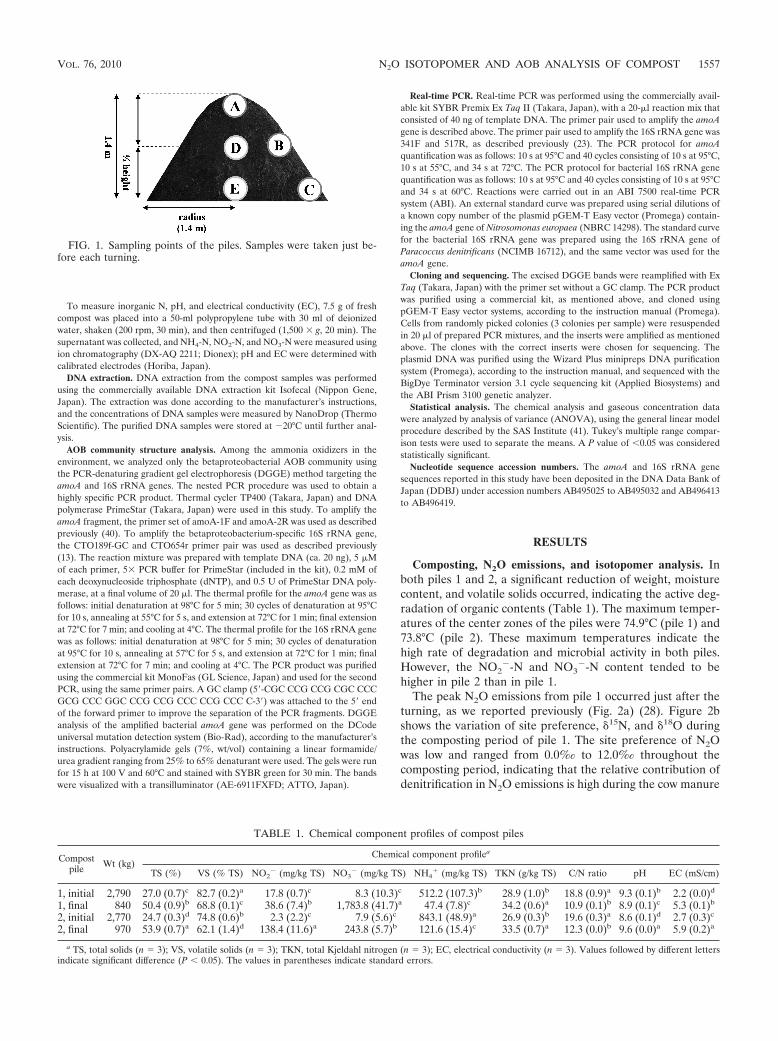
The distribution of inorganic nitrogen (NH4�-N, NO2
�-N,and NO3
�-N) in each part of the compost pile is shown in Fig.3. Interestingly, remarkable NO2
�-N and NH4�-N accumula-
tions were detected in sample A at the top of the pile. Inaddition, the average total solid value obtained for sample Afrom pile 1 throughout the composting period was 27.7%a �5.3%, significantly lower (P � 0.05) than those obtained for thesurface samples B (42.8%b � 6.8%) and C (41.7%b � 8.4%).This tendency was similar for samples from pile 2 (sample A,29.7%ab � 6.7%; sample B, 48.9%ab � 13.4%; and sample C,60.1%b � 11.7%). (Values followed by different letters indi-cate significant difference [P � 0.05].) Although NO3
�-Nwas detected in the surface samples (B and C) from pile 1, littlewas detected in those from pile 2. However, only NH4
�-N wasdetected in the center and bottom samples (D and E) fromboth piles. These phenomena were observed at each turning,which was done every 2 weeks. From these results, activenitrification appeared to occur at the surfaces of the piles,especially at the top. The accumulated NO2
�-N and NO3�-N
which was transferred to the center or bottom zone by turningwas not detected in the samples taken at the next turning.
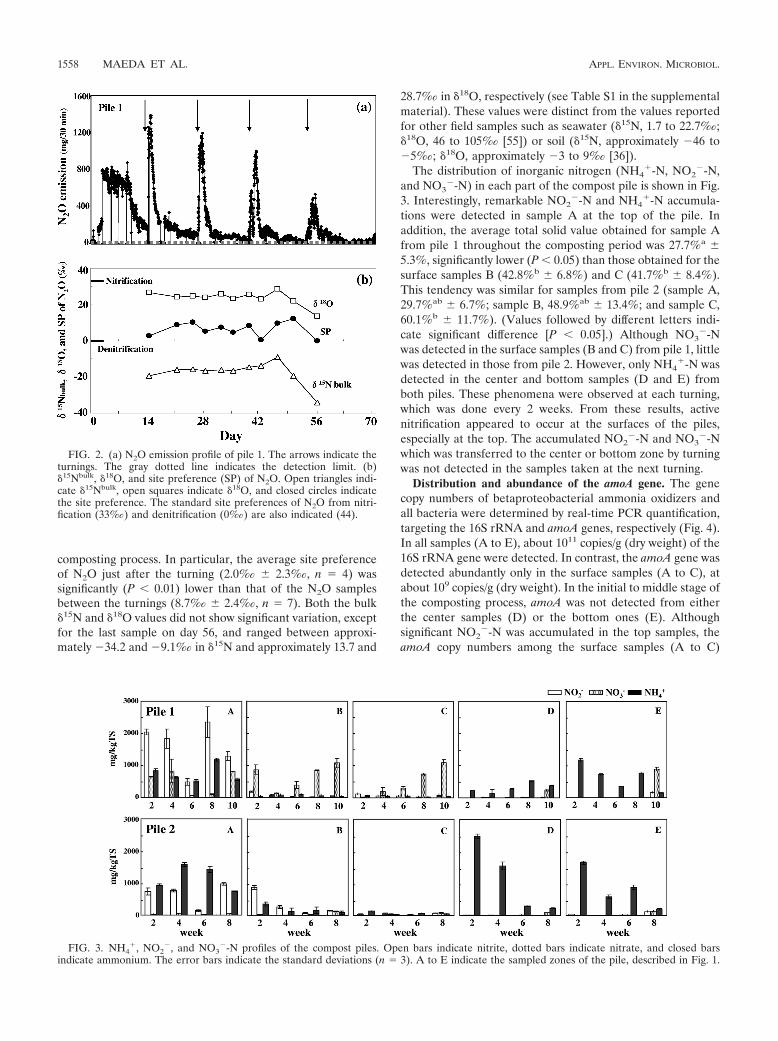
Distribution and abundance of the amoA gene. The genecopy numbers of betaproteobacterial ammonia oxidizers andall bacteria were determined by real-time PCR quantification,targeting the 16S rRNA and amoA genes, respectively (Fig. 4).In all samples (A to E), about 1011 copies/g (dry weight) of the16S rRNA gene were detected. In contrast, the amoA gene wasdetected abundantly only in the surface samples (A to C), atabout 109 copies/g (dry weight). In the initial to middle stage ofthe composting process, amoA was not detected from eitherthe center samples (D) or the bottom ones (E). Althoughsignificant NO2
�-N was accumulated in the top samples, theamoA copy numbers among the surface samples (A to C)
FIG. 2. (a) N2O emission profile of pile 1. The arrows indicate theturnings. The gray dotted line indicates the detection limit. (b)�15Nbulk, �18O, and site preference (SP) of N2O. Open triangles indi-cate �15Nbulk, open squares indicate �18O, and closed circles indicatethe site preference. The standard site preferences of N2O from nitri-fication (33‰) and denitrification (0‰) are also indicated (44).
FIG. 3. NH4�, NO2
�, and NO3�-N profiles of the compost piles. Open bars indicate nitrite, dotted bars indicate nitrate, and closed bars
indicate ammonium. The error bars indicate the standard deviations (n � 3). A to E indicate the sampled zones of the pile, described in Fig. 1.
1558 MAEDA ET AL. APPL. ENVIRON. MICROBIOL.
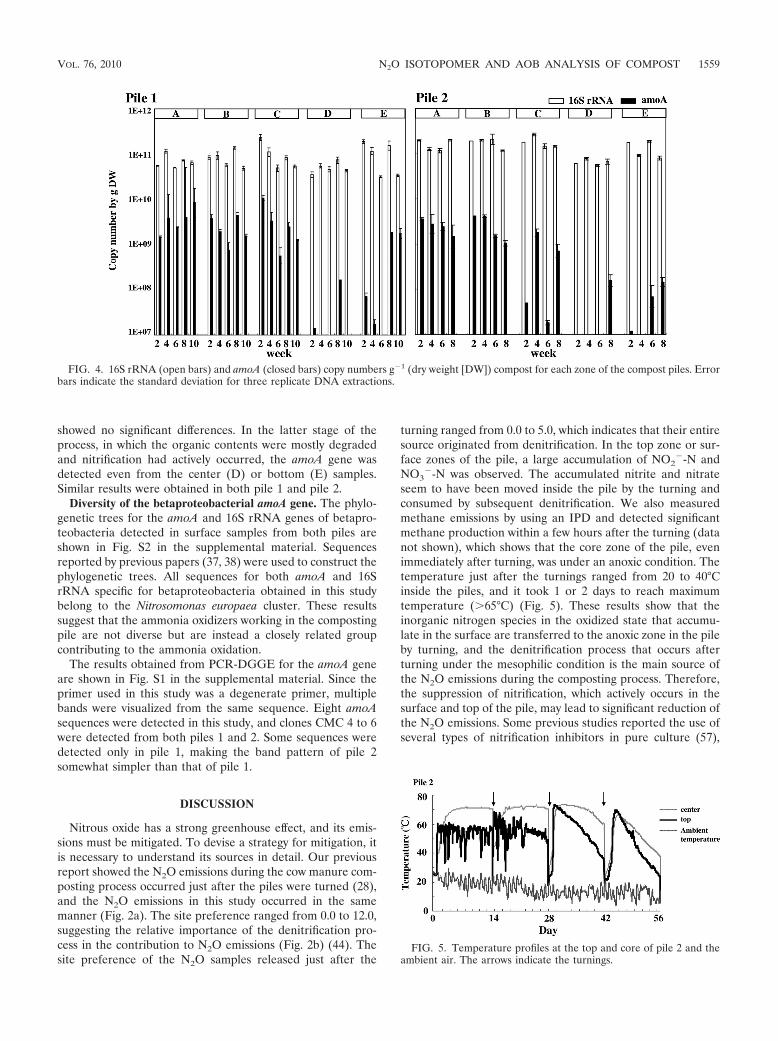
showed no significant differences. In the latter stage of theprocess, in which the organic contents were mostly degradedand nitrification had actively occurred, the amoA gene wasdetected even from the center (D) or bottom (E) samples.Similar results were obtained in both pile 1 and pile 2.
Diversity of the betaproteobacterial amoA gene. The phylo-genetic trees for the amoA and 16S rRNA genes of betapro-teobacteria detected in surface samples from both piles areshown in Fig. S2 in the supplemental material. Sequencesreported by previous papers (37, 38) were used to construct thephylogenetic trees. All sequences for both amoA and 16SrRNA specific for betaproteobacteria obtained in this studybelong to the Nitrosomonas europaea cluster. These resultssuggest that the ammonia oxidizers working in the compostingpile are not diverse but are instead a closely related groupcontributing to the ammonia oxidation.
The results obtained from PCR-DGGE for the amoA geneare shown in Fig. S1 in the supplemental material. Since theprimer used in this study was a degenerate primer, multiplebands were visualized from the same sequence. Eight amoAsequences were detected in this study, and clones CMC 4 to 6were detected from both piles 1 and 2. Some sequences weredetected only in pile 1, making the band pattern of pile 2somewhat simpler than that of pile 1.
DISCUSSION
Nitrous oxide has a strong greenhouse effect, and its emis-sions must be mitigated. To devise a strategy for mitigation, itis necessary to understand its sources in detail. Our previousreport showed the N2O emissions during the cow manure com-posting process occurred just after the piles were turned (28),and the N2O emissions in this study occurred in the samemanner (Fig. 2a). The site preference ranged from 0.0 to 12.0,suggesting the relative importance of the denitrification pro-cess in the contribution to N2O emissions (Fig. 2b) (44). Thesite preference of the N2O samples released just after the
turning ranged from 0.0 to 5.0, which indicates that their entiresource originated from denitrification. In the top zone or sur-face zones of the pile, a large accumulation of NO2
�-N andNO3
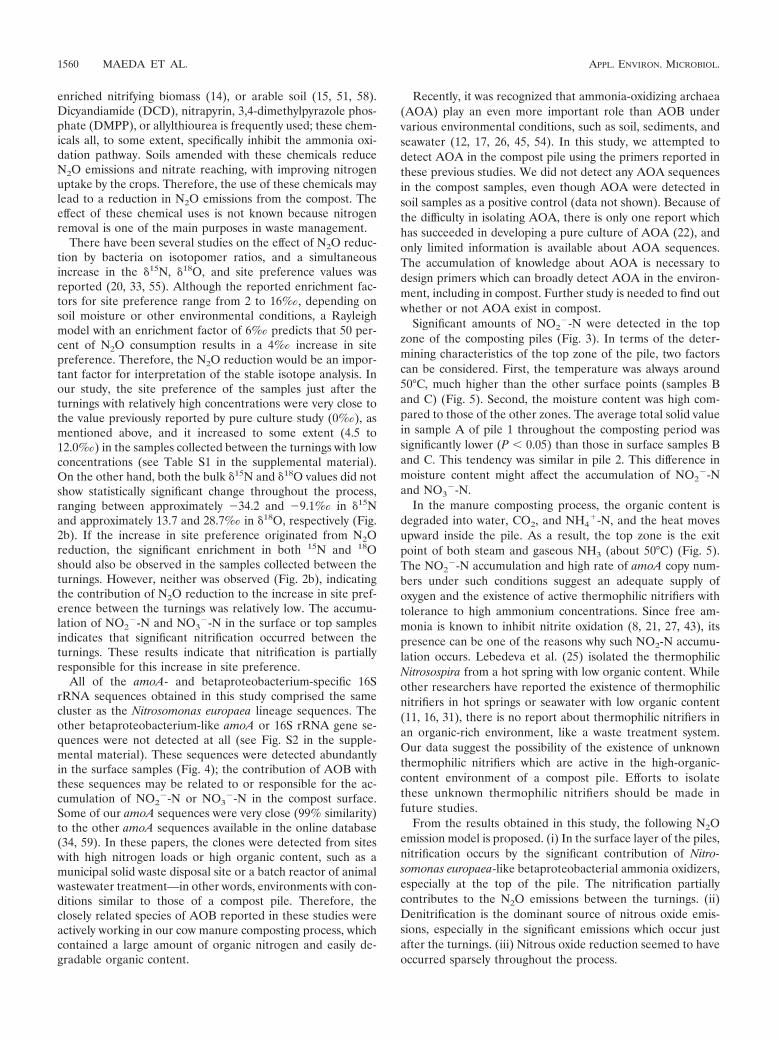
�-N was observed. The accumulated nitrite and nitrateseem to have been moved inside the pile by the turning andconsumed by subsequent denitrification. We also measuredmethane emissions by using an IPD and detected significantmethane production within a few hours after the turning (datanot shown), which shows that the core zone of the pile, evenimmediately after turning, was under an anoxic condition. Thetemperature just after the turnings ranged from 20 to 40°Cinside the piles, and it took 1 or 2 days to reach maximumtemperature (65°C) (Fig. 5). These results show that theinorganic nitrogen species in the oxidized state that accumu-late in the surface are transferred to the anoxic zone in the pileby turning, and the denitrification process that occurs afterturning under the mesophilic condition is the main source ofthe N2O emissions during the composting process. Therefore,the suppression of nitrification, which actively occurs in thesurface and top of the pile, may lead to significant reduction ofthe N2O emissions. Some previous studies reported the use ofseveral types of nitrification inhibitors in pure culture (57),
FIG. 4. 16S rRNA (open bars) and amoA (closed bars) copy numbers g�1 (dry weight [DW]) compost for each zone of the compost piles. Errorbars indicate the standard deviation for three replicate DNA extractions.
FIG. 5. Temperature profiles at the top and core of pile 2 and theambient air. The arrows indicate the turnings.
VOL. 76, 2010 N2O ISOTOPOMER AND AOB ANALYSIS OF COMPOST 1559
enriched nitrifying biomass (14), or arable soil (15, 51, 58).Dicyandiamide (DCD), nitrapyrin, 3,4-dimethylpyrazole phos-phate (DMPP), or allylthiourea is frequently used; these chem-icals all, to some extent, specifically inhibit the ammonia oxi-dation pathway. Soils amended with these chemicals reduceN2O emissions and nitrate reaching, with improving nitrogenuptake by the crops. Therefore, the use of these chemicals maylead to a reduction in N2O emissions from the compost. Theeffect of these chemical uses is not known because nitrogenremoval is one of the main purposes in waste management.
There have been several studies on the effect of N2O reduc-tion by bacteria on isotopomer ratios, and a simultaneousincrease in the �15N, �18O, and site preference values wasreported (20, 33, 55). Although the reported enrichment fac-tors for site preference range from 2 to 16‰, depending onsoil moisture or other environmental conditions, a Rayleighmodel with an enrichment factor of 6‰ predicts that 50 per-cent of N2O consumption results in a 4‰ increase in sitepreference. Therefore, the N2O reduction would be an impor-tant factor for interpretation of the stable isotope analysis. Inour study, the site preference of the samples just after theturnings with relatively high concentrations were very close tothe value previously reported by pure culture study (0‰), asmentioned above, and it increased to some extent (4.5 to12.0‰) in the samples collected between the turnings with lowconcentrations (see Table S1 in the supplemental material).On the other hand, both the bulk �15N and �18O values did notshow statistically significant change throughout the process,ranging between approximately �34.2 and �9.1‰ in �15Nand approximately 13.7 and 28.7‰ in �18O, respectively (Fig.2b). If the increase in site preference originated from N2Oreduction, the significant enrichment in both 15N and 18Oshould also be observed in the samples collected between theturnings. However, neither was observed (Fig. 2b), indicatingthe contribution of N2O reduction to the increase in site pref-erence between the turnings was relatively low. The accumu-lation of NO2
�-N and NO3�-N in the surface or top samples
indicates that significant nitrification occurred between theturnings. These results indicate that nitrification is partiallyresponsible for this increase in site preference.
All of the amoA- and betaproteobacterium-specific 16SrRNA sequences obtained in this study comprised the samecluster as the Nitrosomonas europaea lineage sequences. Theother betaproteobacterium-like amoA or 16S rRNA gene se-quences were not detected at all (see Fig. S2 in the supple-mental material). These sequences were detected abundantlyin the surface samples (Fig. 4); the contribution of AOB withthese sequences may be related to or responsible for the ac-cumulation of NO2
�-N or NO3�-N in the compost surface.
Some of our amoA sequences were very close (99% similarity)to the other amoA sequences available in the online database(34, 59). In these papers, the clones were detected from siteswith high nitrogen loads or high organic content, such as amunicipal solid waste disposal site or a batch reactor of animalwastewater treatment—in other words, environments with con-ditions similar to those of a compost pile. Therefore, theclosely related species of AOB reported in these studies wereactively working in our cow manure composting process, whichcontained a large amount of organic nitrogen and easily de-gradable organic content.
Recently, it was recognized that ammonia-oxidizing archaea(AOA) play an even more important role than AOB undervarious environmental conditions, such as soil, sediments, andseawater (12, 17, 26, 45, 54). In this study, we attempted todetect AOA in the compost pile using the primers reported inthese previous studies. We did not detect any AOA sequencesin the compost samples, even though AOA were detected insoil samples as a positive control (data not shown). Because ofthe difficulty in isolating AOA, there is only one report whichhas succeeded in developing a pure culture of AOA (22), andonly limited information is available about AOA sequences.The accumulation of knowledge about AOA is necessary todesign primers which can broadly detect AOA in the environ-ment, including in compost. Further study is needed to find outwhether or not AOA exist in compost.
Significant amounts of NO2�-N were detected in the top
zone of the composting piles (Fig. 3). In terms of the deter-mining characteristics of the top zone of the pile, two factorscan be considered. First, the temperature was always around50°C, much higher than the other surface points (samples Band C) (Fig. 5). Second, the moisture content was high com-pared to those of the other zones. The average total solid valuein sample A of pile 1 throughout the composting period wassignificantly lower (P � 0.05) than those in surface samples Band C. This tendency was similar in pile 2. This difference inmoisture content might affect the accumulation of NO2
�-Nand NO3
�-N.In the manure composting process, the organic content is
degraded into water, CO2, and NH4�-N, and the heat moves
upward inside the pile. As a result, the top zone is the exitpoint of both steam and gaseous NH3 (about 50°C) (Fig. 5).The NO2
�-N accumulation and high rate of amoA copy num-bers under such conditions suggest an adequate supply ofoxygen and the existence of active thermophilic nitrifiers withtolerance to high ammonium concentrations. Since free am-monia is known to inhibit nitrite oxidation (8, 21, 27, 43), itspresence can be one of the reasons why such NO2-N accumu-lation occurs. Lebedeva et al. (25) isolated the thermophilicNitrosospira from a hot spring with low organic content. Whileother researchers have reported the existence of thermophilicnitrifiers in hot springs or seawater with low organic content(11, 16, 31), there is no report about thermophilic nitrifiers inan organic-rich environment, like a waste treatment system.Our data suggest the possibility of the existence of unknownthermophilic nitrifiers which are active in the high-organic-content environment of a compost pile. Efforts to isolatethese unknown thermophilic nitrifiers should be made infuture studies.
From the results obtained in this study, the following N2Oemission model is proposed. (i) In the surface layer of the piles,nitrification occurs by the significant contribution of Nitro-somonas europaea-like betaproteobacterial ammonia oxidizers,especially at the top of the pile. The nitrification partiallycontributes to the N2O emissions between the turnings. (ii)Denitrification is the dominant source of nitrous oxide emis-sions, especially in the significant emissions which occur justafter the turnings. (iii) Nitrous oxide reduction seemed to haveoccurred sparsely throughout the process.
1560 MAEDA ET AL. APPL. ENVIRON. MICROBIOL.
ACKNOWLEDGMENTS
We thank Atsuko Kobayashi and Kazuha Azumaya for providinglaboratory-based technical assistance.
This work was supported by a grant from the National Agricultureand Food Research Organization (NARO), Japan, to K.M. and partlysupported by a grant-in-aid for Scientific Research A (grant 19201004)from the Ministry of Education, Culture, Sports, Science and Tech-nology (MEXT), Japan, to N.Y. and S.T.
REFERENCES
1. Agriculture, Forestry and Fisheries Research Council Secretariat. 1999.Japanese feeding standard for dairy cattle. Central Association of LivestockIndustry, Tokyo, Japan.
2. Avrahami, S., R. Conrad, and G. Braker. 2002. Effect of soil ammoniumconcentration on N2O release and on the community structure of ammoniaoxidizers and denitrifiers. Appl. Environ. Microbiol. 68:5685–5692.
3. Avrahami, S., W. Liesack, and R. Conrad. 2003. Effects of temperature andfertilizer on activity and community structure of soil ammonia oxidizers.Environ. Microbiol. 5:691–705.
4. Bothe, H., G. Jost, M. Schloter, B. B. Ward, and K. Witzel. 2000. Molecularanalysis of ammonia oxidation and denitrification in natural environments.FEMS Microbiol. Rev. 24:673–690.
5. Bremner, J. M. 1965. Total nitrogen; inorganic forms of nitrogen, p. 1149–1255. In C. A. Black (ed.), Methods of soil analysis, part 2. Soil ScienceSociety of America, Madison, WI.
6. Cebron, A., M. Coci, J. Garnier, and H. J. Laanbroek. 2004. Denaturinggradient gel electrophoretic analysis of ammonia-oxidizing bacterial commu-nity structure in the lower seine river: impact of Paris wastewater effluents.Appl. Environ. Microbiol. 70:6726–6737.
7. Chu, H., T. Fujii, S. Morimoto, X. Lin, K. Yagi, J. Hu, and J. Zhang. 2007.Community structure of ammonia-oxidizing bacteria under long-term appli-cation of mineral fertilizer and organic manure in a sandy loam soil. Appl.Environ. Microbiol. 73:485–491.
8. Chung, J., H. Shim, S. Park, S. Kim, and W. Bae. 2006. Optimization of freeammonia concentration for nitrite accumulation in shortcut biological nitro-gen removal process. Bioprocess Biosyst. Eng. 28:275–282.
9. Clesceri, L. S., A. E. Greenberg, and A. D. Eaton (ed.). 1998. Standardmethods for the examination of water and wastewater, 20th ed. AmericanPublic Health Association, Washington DC.
10. Crutzen, P. 1981. Atmospheric chemical processes of the oxides of nitrogen,including nitrous oxide, p. 17–44. In C. C. Delwiche (ed.), Denitrification,nitrification and atmospheric nitrous oxide. John Wiley & Sons, Inc., NewYork, NY.
11. de la Torre, J., C. Walker, A. Ingalls, M. Konneke, and D. Stahl. 2008.Cultivation of a thermophilic ammonia oxidizing archaeon synthesizingcrenarchaeol. Environ. Microbiol. 10:810–818.
12. Francis, C., K. Roberts, J. Beman, A. Santoro, and B. Oakley. 2005. Ubiquityand diversity of ammonia-oxidizing archaea in water columns and sedimentsof the ocean. Proc. Natl. Acad. Sci. U. S. A. 102:14683–14688.
13. Freitag, T. E., and J. I. Prosser. 2003. Community structure of ammonia-oxidizing bacteria within anoxic marine sediments. Appl. Environ. Microbiol.69:1359–1371.
14. Ginestet, P., J. Audic, V. Urbain, and J. Block. 1998. Estimation of nitrifyingbacterial activities by measuring oxygen uptake in the presence of the met-abolic inhibitors allylthiourea and azide. Appl. Environ. Microbiol. 64:2266–2268.
15. Hatch, D., H. Trindade, L. Cardenas, J. Carneiro, J. Hawkins, D. Schole-field, and D. Chadwick. 2005. Laboratory study of the effects of two nitrifi-cation inhibitors on greenhouse gas emissions from a slurry-treated arablesoil: impact of diurnal temperature cycle. Biol. Fertil. Soils 41:225–232.
16. Hatzenpichler, R., E. Lebedeva, E. Spieck, K. Stoecker, A. Richter, H.Daims, and M. Wagner. 2008. A moderately thermophilic ammonia-oxidiz-ing crenarchaeote from a hot spring. Proc. Natl. Acad. Sci. U. S. A. 105:2134–2139.
17. He, J., J. Shen, L. Zhang, Y. Zhu, Y. Zheng, M. Xu, and H. Di. 2007.Quantitative analyses of the abundance and composition of ammonia-oxi-dizing bacteria and ammonia-oxidizing archaea of a Chinese upland red soilunder long-term fertilization practices. Environ. Microbiol. 9:2364–2374.
18. Intergovernmental Panel on Climate Change. 2001. Climate change 2001,radiative forcing of climate change, the scientific basis. Cambridge UniversityPress, Cambridge, United Kingdom.
19. Ishii, K., M. Fukui, and S. Takii. 2000. Microbial succession during a com-posting process as evaluated by denaturing gradient gel electrophoresis anal-ysis. J. Appl. Microbiol. 89:768–777.
20. Jinuntuya-Nortman, M., R. Sutka, P. Ostrom, H. Gandhi, and N. Ostrom.2008. Isotopologue fractionation during microbial reduction of N2O withinsoil mesocosms as a function of water-filled pore space. Soil Biol. Biochem.40:2273–2280.
21. Kim, D., D. Lee, and J. Keller. 2006. Effect of temperature and free ammonia
on nitrification and nitrite accumulation in landfill leachate and analysis of itsnitrifying bacterial community by FISH. Bioresour. Technol. 97:459–468.
22. Konneke, M., A. Bernhard, R. Jose, C. Walker, J. Waterbury, and D. Stahl.2005. Isolation of an autotrophic ammonia-oxidizing marine archaeon. Na-ture 437:543–546.
23. Kowalchuk, G., Z. Naoumenko, P. Derikx, A. Felske, J. Stephen, and I.Arkhipchenko. 1999. Molecular analysis of ammonia-oxidizing bacteria ofthe � subdivision of the class Proteobacteria in compost and compostedmaterials. Appl. Environ. Microbiol. 65:396–403.
24. Kowalchuk, G., and J. Stephen. 2001. Ammonia-oxidizing bacteria: a modelfor molecular microbial ecology. Annu. Rev. Microbiol. 55:485–529.
25. Lebedeva, E., M. Alawi, C. Fiencke, B. Namsaraev, E. Bock, and E. Spieck.2005. Moderately thermophilic nitrifying bacteria from a hot spring of theBaikal rift zone. FEMS Microbiol. Ecol. 54:297–306.
26. Leininger, S., T. Urich, M. Schloter, L. Schwark, J. Qi, G. Nicol, J. Prosser,S. Schuster, and C. Schleper. 2006. Archaea predominate among ammonia-oxidizing prokaryotes in soils. Nature 442:806–809.
27. Liu, Y., and B. Capdeville. 1994. Some observations on free ammonia inhi-bition to Nitrobacter in nitrifying biofilm reactor. Biotechnol. Lett. 16:309–314.
28. Maeda, K., R. Morioka, D. Hanajima, and T. Osada. 2010. The impact ofusing mature compost on nitrous oxide emission and the denitrifier commu-nity in the cattle manure composting process. Microb. Ecol. 59:25–36.
29. Maeda, K., R. Morioka, and T. Osada. 2009. Effect of covering compostingpiles with mature compost on ammonia emission and microbial communitystructure of composting process. J. Environ. Qual. 38:598–606.
30. Mahimairaja, S., N. S. Bolan, and M. J. Hedley. 1995. Denitrification lossesof N from fresh and composted manures. Soil Biol. Biochem. 27:1223–1225.
31. Mevel, G., and D. Prieur. 1998. Thermophilic heterotrophic nitrifiers iso-lated from Mid-Atlantic Ridge deep-sea hydrothermal vents. Can. J. Micro-biol. 44:723–733.
32. Nicolaisen, M. H., and N. B. Ramsing. 2002. Denaturing gradient gel elec-trophoresis (DGGE) approaches to study the diversity of ammonia-oxidizingbacteria. J. Microbiol. Methods 50:189–203.
33. Ostrom, N., A. Pitt, R. Sutka, P. Ostrom, A. Grandy, K. Huizinga, and G.Robertson. 2007. Isotopologue effects during N2O reduction in soils and inpure cultures of denitrifiers. J. Geophys. Res. 112:G02005.
34. Otawa, K., R. Asano, Y. Ohba, T. Sasaki, E. Kawamura, F. Koyama, S.Nakamura, and Y. Nakai. 2006. Molecular analysis of ammonia-oxidizingbacteria community in intermittent aeration sequencing batch reactors usedfor animal wastewater treatment. Environ. Microbiol. 8:1985–1996.
35. Otte, S., J. Schalk, J. Kuenen, and M. Jetten. 1999. Hydroxylamine oxidationand subsequent nitrous oxide production by the heterotrophic ammoniaoxidizer Alcaligenes faecalis. Appl. Microbiol. Biotechnol. 51:255–261.
36. Perez, T., S. Trumbore, S. Tyler, P. Matson, I. Ortiz-Monasterio, T. Rahn,and D. Griffith. 2001. Identifying the agricultural imprint on the global N2Obudget using stable isotopes. J. Geophys. Res. 106:9869–9878.
37. Purkhold, U., A. Pommerening-Roser, S. Juretschko, M. Schmid, H. Koops,and M. Wagner. 2000. Phylogeny of all recognized species of ammoniaoxidizers based on comparative 16S rRNA and amoA sequence analysis:implications for molecular diversity surveys. Appl. Environ. Microbiol. 66:5368–5382.
38. Purkhold, U., M. Wagner, G. Timmermann, A. Pommerening-Roser, and H.Koops. 2003. 16S rRNA and amoA-based phylogeny of 12 novel beta-proteobacterial ammonia-oxidizing isolates: extension of the dataset andproposal of a new lineage within the nitrosomonads. Int. J. Syst. Evol.Microbiol. 53:1485–1494.
39. Rahn, T., and M. Wahlen. 1997. Stable isotope enrichment in stratosphericnitrous oxide. Science 278:1776–1778.
40. Rotthauwe, J., K. Witzel, and W. Liesack. 1997. The ammonia monooxygen-ase structural gene amoA as a functional marker: molecular fine-scale anal-ysis of natural ammonia-oxidizing populations. Appl. Environ. Microbiol.63:4704–4712.
41. SAS Institute. 2001. SAS/STAT user’s guide. SAS Institute, Cary, NC.42. Shaw, L., G. Nicol, Z. Smith, J. Fear, J. Prosser, and E. Baggs. 2006.
Nitrosospira spp. can produce nitrous oxide via a nitrifier denitrificationpathway. Environ. Microbiol. 8:214–222.
43. Smith, R., L. Burns, R. Doyle, S. Lennox, B. Kelso, R. Foy, and R. Stevens.1997. Free ammonia inhibition of nitrification in river sediments leading tonitrite accumulation. J. Environ. Qual. 26:1049–1055.
44. Sutka, R. L., N. E. Ostrom, P. H. Ostrom, J. A. Breznak, H. Gandhi, A. J.Pitt, and F. Li. 2006. Distinguishing nitrous oxide production from nitrifica-tion and denitrification on the basis of isotopomer abundances. Appl. Envi-ron. Microbiol. 72:638–644.
45. Tourna, M., T. Freitag, G. Nicol, and J. Prosser. 2008. Growth, activity andtemperature responses of ammonia-oxidizing archaea and bacteria in soilmicrocosms. Environ. Microbiol. 10:1357–1364.
46. Toyoda, S., H. Mutobe, H. Yamagishi, N. Yoshida, and Y. Tanji. 2005.Fractionation of N2O isotopomers during production by denitrifier. Soil Biol.Biochem. 37:1535–1545.
47. Toyoda, S., and N. Yoshida. 1999. Determination of nitrogen isotopomers of
VOL. 76, 2010 N2O ISOTOPOMER AND AOB ANALYSIS OF COMPOST 1561
nitrous oxide on a modified isotope ratio mass spectrometer. Anal. Chem.71:4711–4718.
48. Toyoda, S., N. Yoshida, T. Miwa, Y. Matsui, H. Yamagishi, U. Tsunogai, Y.Nojiri, and N. Tsurushima. 2002. Production mechanism and global budgetof N2O inferred from its isotopomers in the western North Pacific. Geophys.Res. Lett. 29:7–11.
49. Toyoda, S., N. Yoshida, T. Urabe, S. Aoki, T. Nakazawa, S. Sugawara, and H.Honda. 2001. Fractionation of N2O isotopomers in the stratosphere. J. Geo-phys. Res. Atmos. 106:7515–7522.
50. Toyoda, S., N. Yoshida, T. Urabe, Y. Nakayama, T. Suzuki, K. Tsuji, K.Shibuya, S. Aoki, T. Nakazawa, S. Ishidoya, K. Ishijima, S. Sugawara, T.Machida, G. Hashida, S. Morimoto, and H. Honda. 2004. Temporal andlatitudinal distributions of stratospheric N2O isotopomers. J. Geophys. Res.Atmos. 109:D08308.
51. Watanabe, T. 2006. Influence of 2-chloro-6 (trichloromethyl) pyridine anddicyandiamide on nitrous oxide emission under different soil conditions. SoilSci. Plant Nutr. 52:226–232.
52. Webster, G., T. M. Embley, and J. I. Prosser. 2002. Grassland managementregimens reduce small-scale heterogeneity and species diversity of �-pro-teobacterial ammonia oxidizer populations. Appl. Environ. Microbiol. 68:20–30.
53. Westley, M., H. Yamagishi, B. Popp, and N. Yoshida. 2006. Nitrous oxidecycling in the Black Sea inferred from stable isotope and isotopomer distri-butions. Deep Sea Res. II 53:1802–1816.
54. Wuchter, C., B. Abbas, M. Coolen, L. Herfort, J. van Bleijswijk, P. Timmers,M. Strous, E. Teira, G. Herndl, and J. Middelburg. 2006. Archaeal nitrifi-cation in the ocean. Proc. Natl. Acad. Sci. U. S. A. 103:12317–12322.
55. Yamagishi, H., M. B. Westley, B. N. Popp, S. Toyoda, N. Yoshida, S. Wa-tanabe, K. Koba, and Y. Yamanaka. 2007. Role of nitrification and denitri-fication on the nitrous oxide cycle in the eastern tropical North Pacific andGulf of California. J. Geophys. Res. Biogeosci. 112:15.
56. Yoshida, N., and S. Toyoda. 2000. Constraining the atmospheric N2O budgetfrom intramolecular site preference in N2O isotopomers. Nature 405:330–334.
57. Zacherl, B., and A. Amberger. 1990. Effect of the nitrification inhibitorsdicyandiamide, nitrapyrin and thiourea on Nitrosomonas europaea. Nutr.Cycl. Agroecosys. 22:37–44.
58. Zerulla, W., T. Barth, J. Dressel, K. Erhardt, K. Horchler von Loc-quenghien, G. Pasda, M. Radle, and A. Wissemeier. 2001. 3,4-Dimethylpyra-zole phosphate (DMPP)—a new nitrification inhibitor for agriculture andhorticulture. Biol. Fertil. Soils 34:79–84.
59. Zhu, S., G. Chan, K. Cai, L. Qu, and L. Huang. 2007. Leachates frommunicipal solid waste disposal sites harbor similar, novel nitrogen-cyclingbacterial communities. FEMS Microbiol. Lett. 267:236–242.
60. Zumft, W. 1992. The denitrifying prokaryotes, p. 554–582. In A. Balows(ed.), The prokaryotes: a handbook of the biology of bacteria: ecophysiology,isolation, identification, applications. Springer-Verlag, New York, NY.
1562 MAEDA ET AL. APPL. ENVIRON. MICROBIOL.
Copyright © 2022 FDOKUMEN