Peripheral interaction of opioid and NMDA receptors in inflammatory pain in rats

Modulation of Functional EEG Networks by the NMDAAntagonist Nitrous Oxide
Levin Kuhlmann1, Brett L. Foster2, David T. J. Liley1*
1 Brain and Psychological Sciences Research Centre, Swinburne University of Technology, Hawthorn, Victoria, Australia, 2Department of Neurology and Neurological
Sciences, School of Medicine, Stanford University, Stanford, California , United States of America
Abstract
Parietal networks are hypothesised to play a central role in the cortical information synthesis that supports consciousexperience and behavior. Significant reductions in parietal level functional connectivity have been shown to occur duringgeneral anesthesia with propofol and a range of other GABAergic general anesthetic agents. Using two analysis approaches(1) a graph theoretic analysis based on surrogate-corrected zero-lag correlations of scalp EEG, and (2) a global coherenceanalysis based on the EEG cross-spectrum, we reveal that sedation with the NMDA receptor antagonist nitrous oxide (N2O),an agent that has quite different electroencephalographic effects compared to the inductive general anesthetics, alsocauses significant alterations in parietal level functional networks, as well as changes in full brain and frontal level networks.A total of 20 subjects underwent N2O inhalation at either 20%, 40% or 60% peak N2O/O2 gas concentration levels. N2O-induced reductions in parietal network level functional connectivity (on the order of 50%) were exclusively detected byutilising a surface Laplacian derivation, suggesting that superficial, smaller spatial scale, cortical networks were mostaffected. In contrast reductions in frontal network functional connectivity were optimally discriminated using a common-reference derivation (reductions on the order of 10%), indicating that the NMDA antagonist N2O induces spatially coherentand widespread perturbations in frontal activity. Our findings not only give important weight to the idea of agent invariantfinal network changes underlying drug-induced reductions in consciousness, but also provide significant impetus for theapplication and development of multiscale functional analyses to systematically characterise the network level corticaleffects of NMDA receptor related hypofunction. Future work at the source space level will be needed to verify theconsistency between cortical network changes seen at the source level and those presented here at the EEG sensor spacelevel.
Citation: Kuhlmann L, Foster BL, Liley DTJ (2013) Modulation of Functional EEG Networks by the NMDA Antagonist Nitrous Oxide. PLoS ONE 8(2): e56434.doi:10.1371/journal.pone.0056434
Editor: Angela Sirigu, French National Centre for Scientific Research, France
Received September 19, 2012; Accepted January 11, 2013; Published February 14, 2013
Copyright: ! 2013 Kuhlmann et al. This is an open-access article distributed under the terms of the Creative Commons Attribution License, which permitsunrestricted use, distribution, and reproduction in any medium, provided the original author and source are credited.
Funding: This work was supported by Swinburne University of Technology intramural funds. The funders had no role in study design, data collection andanalysis, decision to publish, or preparation of the manuscript.
Competing Interests: The authors have declared that no competing interests exist.
* E-mail: [email protected]
Introduction
It has been hypothesised that disruption of information
integration within posterior parietal cortex is the agent invariant
‘final common pathway’ to drug-induced unconsciousness [1–3].
Although different drugs can have different modes of action at
specific microscopic sites (i.e. facilitatory or suppressive) there may
be common final network changes seen at a macroscopic level that
underly drug-induced reductions in consciousness, whether they
be in the form of a coma-like state as induced by general
anesthetics or be it in the milder inattentive form of a dissociative
and unresponsive state as induced by high doses of sedative drugs.
To date the empirical evidence underpinning this hypothesis has
exclusively involved inductive agents that: act principally through
central c{ aminobutytic acid (GABA) agonism [1–5], manifest
cerebral hypo-metabolism [6,7] and are associated with the
anteriorisation of slow wave EEG activity [8–10]. A vital test of
this hypothesis would therefore involve the evaluation of the
functional alterations in fronto-parietal networks induced by
agents that do not fulfill these criteria. The dissociative anesthetic
gas nitrous oxide (N2O, ‘laughing gas’) is an example of such an
agent. N2O is believed to achieve its analgesic, sedative and
hypnotic effects through the antagonism of N-methyl- D-aspartate
(NMDA) receptor mediated activity [11–13], electroencephalo-
graphically it reduces frontal slow wave activity [14,15], and
metabolically brain activity either increases or remains unchanged
during its administration [16,17]. N2O and the other important
NMDA receptor antagonist anesthetic, ketamine, are associated
with psychoactivation, perceptual distortion, detachment from
reality, and are therefore referred to as ‘dissociative’ agents
[12,13,18]. Altered NMDA receptor function has been implicated
in pharmacological models and treatments of a range of mental
disorders such as schizophrenia [19,20] and depression [21]
respectively, thus elucidating the neurocognitive effects of keta-
mine and N2O may help better understand the neuropharmaco-
logical basis of these disorders.
We therefore sought to quantify changes in frontal, parietal and
full brain networks obtained from high-density EEG during N2O
inhalation using measures and methods that are capable of
robustly assessing alterations in network topology and connection
strength and, for the purposes of comparison, have been applied to
GABAergic agents such as propofol. Such measures include global
efficiency (GE) [3] and global coherence (GC) [22] calculated from
multi-channel EEG recordings. GE is a time-domain graph
PLOS ONE | www.plosone.org 1 February 2013 | Volume 8 | Issue 2 | e56434

theoretic approach and is essentially the average surrogate-
corrected zero-lag cross-correlation over the EEG network. In
contrast GC is a frequency domain measure and is defined here as
the ratio of the largest eigenvalue over the sum of the eigenvalues
of the complex EEG cross-spectral matrix. Increases and decreases
in GE indicate increases and decreases, respectively, in global
functional connectivity of the network considered. Similar
properties for GC hold although one needs to take into account
the eigenvector corresponding to the largest eigenvalue of the
cross-spectral matrix (as outlined in the methods).
Analysing the GE and GC measures during N2O inhalation not
only provides insight into the functional organisation of cortical
networks, but if the measures change with the level of gas
concentration and consciousness, then these measures could
provide a means to monitor brain state and consciousness. It is
also important to note that GE and GC have been applied by [3]
and [22], respectively, to scalp EEG recordings of individuals
undergoing anesthesia with the GABAergic antagonist propofol.
For GE, propofol caused a breakdown in parietal network
functional connectivity, whereas functional connectivity in the
frontal network was relatively unchanged [3]. For GC, propofol
caused full brain network decreases in GC at 11 Hz only during
the transition to unconsciousness but not during unconsciousness.
Moreover, globally coherent activity at 11 Hz shifted from a
posterior predominance at rest to an anterior predominance
during drug-induced unconsciousness [22]. Here we present the
same methods applied to individuals undergoing sedation with the
putative NMDA antagonist N2O in order to investigate the
possibility of agent invariant final network changes that underly
drug-induced reductions in consciousness.
To assess the spatial scales at which functional connectivity
changes take place, GE and GC, were calculated using a simple
multi-spatial scale analysis involving comparison of surface
Laplacian (nearest neighbour; which passes high spatial frequen-
cies) and common-reference (linked mastoids; which passes all
spatial frequencies) derivations. For the case of propofol induction,
Lee et al. [3] applied GE to a common-reference derivation,
whereas Cimenser et al. [22] focused primarily on applying GC to
a Laplacian-reference derivation. Here we consider both refer-
encing schemes in the interests of a more complete understanding
and comparison.
We show that increasing end-tidal N2O concentrations are
associated with progressive alterations in full brain, parietal and
frontal networks. In particular the Laplacian re-referenced GE
method better detected full brain network changes and was
required to observe any parietal network decreases in functional
connectivity. On the other hand frontal decreases in functional
connectivity were best detected with GE and GC using a common-
reference derivation. Thus N2O, like the GABAergic agents
propofol and desflurane, produces parietal level decreases in
functional connectivity, which, based on our analysis, are
dominated by local areal changes in superficial parietal networks.
Materials and Methods
Ethics StatementThis study was approved by the Swinburne University of
Technology Human Research Ethics Committee.
Experiment: Drug Administration, EEG and behaviouralrecordingsAn analysis of a subset of the data described in the current
manuscript, focusing on signal power changes, has been previously
published [14,23]. In the previous work, data corresponding to
20% and 40% inspired N2O were statistically analysed in detail,
whereas only qualitative power changes for the 60% inspired N2O
data were reported on [14]. The current analysis extends
substantially the scope of this prior analysis by including the
60% N2O treatment group and developing an extensive functional
connectivity analysis. As the experimental paradigm has been
previously published [14], we recapitulate the key details here for
clarity.
Recordings of 62-channel EEG were obtained from twenty
human subjects during the inhalation of N2O to fixed steady-state
end-tidal concentrations. During EEG recording, responsiveness
was also monitored using an auditory continuous performance task
(aCPT). Figure 1 provides an outline of the experiment and
analysis.
Healthy males (general medical examination passed, no
neurological or psychiatric history) were recruited through written
informed voluntary consent and females were excluded due to
greater risk of nausea and emesis with N2O. Before the recording
session, each participant was randomly allocated to 1 of 3
conditions: 20%, 40%, or 60% inspired N2O/O2, respectively.
For conditions 1 to 3 there were 8, 8 and 4 participants,
respectively. Fewer participants were recruited for the 60% gas
condition due to problems with nausea and emesis. Participants
fasted for 8 hours before the recording which commenced at 9am.
Baseline involved a 5-minute eyes-closed recording of spontaneous
EEG during the aCPT. Recordings of EEG during N2O
inhalation were 20 minutes in duration which also involved the
aCPT. This period comprised a 5-minute equilibration phase, a
10-minute period of continuous equilibrated gas flow at the end of
which N2O was discontinued with 100% O2 administered for a
further 5 minutes during a washout phase. N2O and O2 were
administered through a closed 1.5-m Bain coaxial non-rebreathing
circuit. Using a standard clinical pulse oximeter finger clip, O2
saturation and heart rate were obtained. End-tidal concentrations
of N2O, O2 and CO2 were determined online using a Normocap
(Datex-Ohmeda, GE Healthcare, Madison, WI) infrared gas
analyzer. Every minute the outputs from both the pulse oximeter
and gas analyzer were manually logged. EEG recordings were
performed in a noise-minimized laboratory using a 62-channel
Syn-Amps EEG system (NeuroScan; Compumedics Ltd., Mel-
bourne, Australia). The EEG montage was positioned according to
the extended international 10:20 system, with a linked mastoids
reference. The sampling rate was 500 Hz and digital hardware
bandpass filtered the signal between 0.1–70 Hz. The aCPT used
to monitor behavioural state required the participants to respond
(left or right button) to 2 auditory tones of differing frequency (1 or
2 kHz, respectively), but of fixed stereo amplitude (70 dB)
occurring every 2.5 seconds with a slight jitter during baseline
and gas recordings. Targets and responses (accuracy and latency)
were automatically logged for each trial.
EEG AnalysisArtifact-rejected raw 62-channel EEG was further bandpass
filtered between 1 and 40 Hz. Any remaining artifact such as eye
blinks and electromyograph were successfully removed using
independent-component analysis (ICA) as implemented in the
EEGLAB toolbox [24]. Additional artifacts that could not be
removed with ICA were clipped from the data with continuity
assumed across segments separated by clipped data. Analysis
involved common referenced or Laplacian re-referenced data in
order to characterise brain network dynamics at essentially two
different spatial scales. By using a surface Laplacian referencing
scheme, in which each electrode is re-referenced with respect to an
average computed from nearby electrodes, activity can be
Functional Networks under Nitrous Oxide
PLOS ONE | www.plosone.org 2 February 2013 | Volume 8 | Issue 2 | e56434
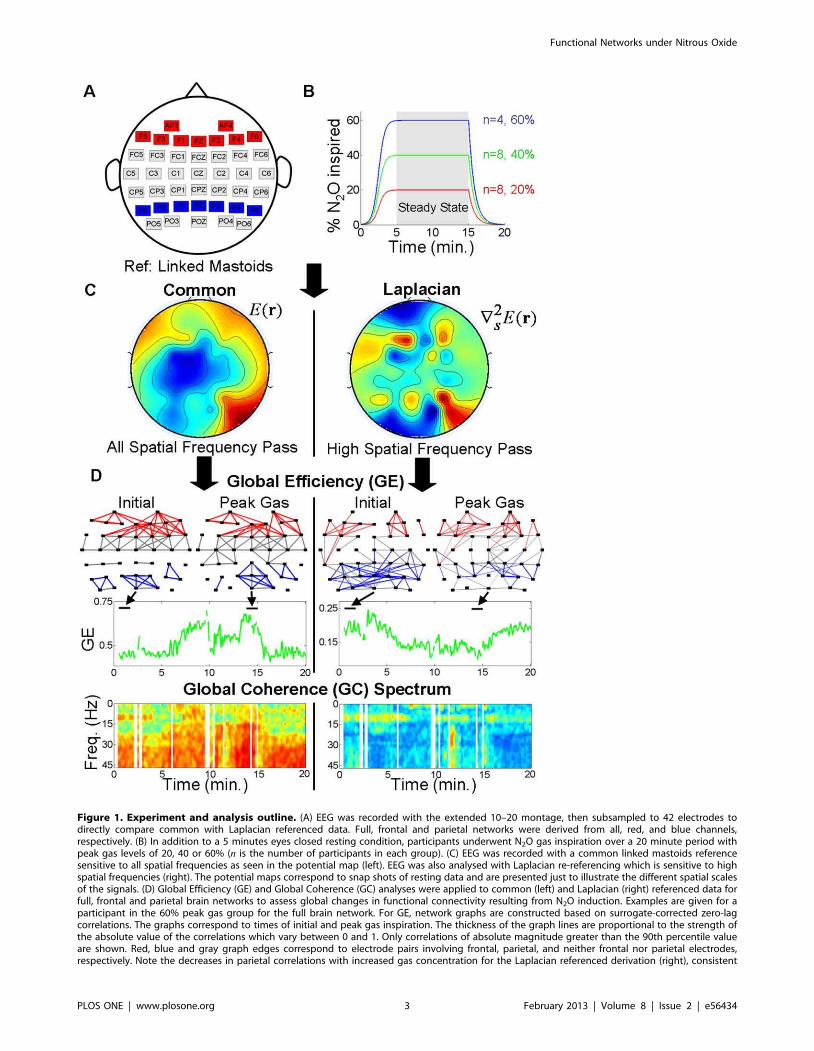
Figure 1. Experiment and analysis outline. (A) EEG was recorded with the extended 10–20 montage, then subsampled to 42 electrodes todirectly compare common with Laplacian referenced data. Full, frontal and parietal networks were derived from all, red, and blue channels,respectively. (B) In addition to a 5 minutes eyes closed resting condition, participants underwent N2O gas inspiration over a 20 minute period withpeak gas levels of 20, 40 or 60% (n is the number of participants in each group). (C) EEG was recorded with a common linked mastoids referencesensitive to all spatial frequencies as seen in the potential map (left). EEG was also analysed with Laplacian re-referencing which is sensitive to highspatial frequencies (right). The potential maps correspond to snap shots of resting data and are presented just to illustrate the different spatial scalesof the signals. (D) Global Efficiency (GE) and Global Coherence (GC) analyses were applied to common (left) and Laplacian (right) referenced data forfull, frontal and parietal brain networks to assess global changes in functional connectivity resulting from N2O induction. Examples are given for aparticipant in the 60% peak gas group for the full brain network. For GE, network graphs are constructed based on surrogate-corrected zero-lagcorrelations. The graphs correspond to times of initial and peak gas inspiration. The thickness of the graph lines are proportional to the strength ofthe absolute value of the correlations which vary between 0 and 1. Only correlations of absolute magnitude greater than the 90th percentile valueare shown. Red, blue and gray graph edges correspond to electrode pairs involving frontal, parietal, and neither frontal nor parietal electrodes,respectively. Note the decreases in parietal correlations with increased gas concentration for the Laplacian referenced derivation (right), consistent
Functional Networks under Nitrous Oxide
PLOS ONE | www.plosone.org 3 February 2013 | Volume 8 | Issue 2 | e56434

weighted towards local, radially oriented, cortical (superficial)
sources [25]. The surface Laplacian of the raw signals Vi(t) is
computed as:
Ji(t)~Vi(t){1
M
X
M
m~1
Vmi (t) ð1Þ
where Vmi (t) indicates the voltage recorded at one of the mth
closest electrodes to electrode i. The choice ofM~4{6 depended
on the electrode location and the symmetry of nearby electrodes
and follows a previously described high-density Laplacian
derivation [22]. Applying the Laplacian re-referencing reduced
the number of channels to 42, with marginal channels being
excluded due to an insufficient number of neighbouring electrodes.
The same 42 channels were analysed for common-reference and
Laplacian-reference derivations. Two global network analyses
were considered: (1) GE, (2) GC. Full brain, frontal and parietal
networks were studied with each method. The full brain network
involved all 42 channels. The frontal network involved 9 channels:
AF3, AF4, FZ, F1-F6. The parietal network involved 7 channels:
PZ, P1-P6. GE provides a graph theoretic approach to quantifying
the transfer of information between nodes of a network by multiple
parallel paths [26]. This approach relies on the creation of
networks represented by undirected weighted graphs where, in the
case of EEG, weights are defined as the surrogate-corrected
genuine zero-lag cross-correlations [3]. GE is then calculated as
the average of the inverse shortest path length over all pairs of
nodes in the network, i.e. the average surrogate-corrected zero-lag
cross-correlation over the network. GE can also be calculated on
unweighted and fully-connected networks in order to dissociate the
contributions of network topology and connection strength to
observed alterations in GE. In contrast to the time-domain
approach used for the calculation of GE, GC quantifies network
dynamics based on computing the cross-spectrum over a range of
spectral frequencies as a function of time [22]. GC summarises
information in this cross-spectral matrix and is typically defined as
either the ratio of the largest eigenvalue of the matrix to the sum of
the eigenvalues [27], or as the average of all pairwise coherences
[28]. Here we use the former approach as it was used by Cimenser
et al. [22] in application to the study of propofol. Despite the
differences in their calculation, which we describe in detail below,
GE and GC provide complementary perspectives on a more
general correlation structure, the cross-correlation function. The
cross-correlation function which describes correlations with
different time lags can be obtained by the inverse Fourier
transform of the cross-spectrum. GE views only zero-lag correla-
tions from the cross-correlation function, whereas GC at a specific
frequency (i.e. 11 Hz) is dependent on the power of the
corresponding frequency component of the cross-correlation
function.
In our analysis we consider GE and GC measures as functions
of N2O gas concentration, aCPT accuracy and reaction time in
order to assess the changes induced by N2O inhalation. This is
done by generating GE- and GC-based time series using specific
sliding windows. The empirically obtained time-series of N2O gas
concentration, aCPT accuracy and reaction time are interpolated
to the start times of GE and GC windows in order to histogram
data and generate the desired functions presented in the results.
Specifically, gas concentration and aCPT reaction time were
linearly interpolated, whereas aCPT accuracy was interpolated
using the nearest neighbours.
Statistical Assessment. To statistically assess the differences
in the measures across rest and different gas concentration
histogram bins, one-way analysis of variance (ANOVA) was
applied to each measure data set. Multi-comparison tests were also
applied to statistically assess the difference between the mean
measure for the rest data and the mean measure for any given
data-bin of interest. Significance levels of a~0:01 and a~0:001with Bonferroni correction for multiple comparisons were
considered. Moreover, because one-way ANOVAs gave very high
significance (%0.001) in a large number of cases, a non-parametric
receiver operator characteristic (ROC) analysis [29] was applied to
quantify the separability of the different gas concentration bin
distributions from the rest distribution. A ROC analysis is useful
for the purposes of devising accurate monitoring methods where
one wants to know how separate the data distributions are rather
than just how different the data means are. If one can separate the
distributions well, then high classification accuracy of the
monitoring methods can be achieved. The area under the ROC
curve (AUROC) provides a measure of the separability of two
distributions that depends on both sensitivity and specificity, with
areas close to 1 meaning high separability and an area of ƒ0.5
indicating chance, or worse, performance. A rough guide to
classifying such separability using the AUROC is: 0.9–1.0 = ex-
cellent classification, 0.8–0.9 = good classification, 0.7–0.8 = fair
classification, 0.6–0.7 = poor classification and 0.5–0.6= failure
[30]. Appendix S1 for an explanation of the ROC analysis
employed here). One-way ANOVAs, multi-comparison tests and
ROC analysis were also applied to statistically assess the
differences in the measures across rest and different aCPT
accuracy bins, and also across rest and different aCPT reaction
time bins. In order to visualise the ROC analyses, bar charts of the
AUROC scores are presented, where AUROC score bars point up
or down if the difference in the corresponding median measure
value relative to rest reflects an increase or decrease, respectively.
If the difference is zero then the AUROC is multiplied by 0 and
this is reflected in the bar chart. In the cases where the difference is
zero AUROC scores are likely to be below chance. This was true
for all such cases where the the difference was zero in the results.
In cases where a given bin had less than 10 samples AUROC
values were not computed because a small number of samples is
inadequate to characterise the data distribution. This is also
reflected in the AUROC bar chart by the absence of bars.
Global Efficiency (GE) AnalysisOur GE implementation follows the approach of Lee et al. [3]
and is reiterated here for clarity. The data were broken into
12 second segments with an 8 second overlap. Each segment was
then split into 4 second sub-segments with 3.6 seconds of overlap
giving a total of 21 sub-segments. These 21 segments represent the
original data ensemble. For each sub-segment 50 Fourier-phase
randomised surrogates were generated [31], producing a 50621
surrogate data ensemble for a 12 second window. For each
segment, the Pearson’s equal-time cross correlation coefficient was
calculated across channels for each sub-segment of the original
with the hypothesis of a ‘final common pathway’ to drug-induced reductions in consciousness. GE (green time series) for these weighted networks isthe average of the absolute correlations. GC is the ratio of the largest eigenvalue over the sum of the eigenvalues of the complex cross-spectralmatrix at each temporal frequency, this is reflected in the GC spectra (bottom). Vertical white spaces indicate time intervals in which data containedartefact. Additional measures were also derived from the GE and GC analyses to assess changes in functional connectivity.doi:10.1371/journal.pone.0056434.g001
Functional Networks under Nitrous Oxide
PLOS ONE | www.plosone.org 4 February 2013 | Volume 8 | Issue 2 | e56434
data ensemble and the surrogate data ensemble, using the
following definition:
Cij~1
T
X
T
t~1
Qi(t){vQiw
si:Qj(t){vQjw
sj, ð2Þ
where Qi(t) corresponds to either the raw common-referenced
data, Vi(t), or the Laplacian-referenced data, Ji(t). A genuine
correlation matrix, MGij , which corrects the total correlations by
taking into account the random correlations of the surrogate data
[32,33] was calculated as:
MGij~sign(vij):
mij{msurrij
1{msurrij
:s if i=j ð3Þ
where mij~medfDCij Dg, msurrij ~medfDCsurrij Dg and vij~medfCijg
(‘med’ indicates median over the sub-segments of the ensemble).
Note that self connections (i.e. i~j) were ignored. The factor s in
equation (3) evaluates the significance of the difference mij{msurrij .
Since a Gaussian distribution of DCij D and DCsurrij D cannot be
guaranteed, the Mann-Whitney-Wilcoxon U-test was used with
the null hypothesis of equal medians. If it was rejected, then s~1;
otherwise, s~0. The p-value was set as a~0:05 and the
Bonferroni correction for multiple U-tests for M-dimensional
matrix elements was applied: a’~2a=½m(m{1)$ where m is the
number of channels. For each full brain, frontal and parietal
network, weighted, unweighted and all-to-all networks were
constructed. Within a given 12 second segment, the genuine
correlation matrix, MGij , was used to create ‘genuine’ weighted
networks and un-weighted networks. In a weighted network,
labelled W , the weight between electrodes i and j is defined by
dWij ~1=DMG
ij D, which is treated as the shortest path length between
the two electrodes, and as mentioned above, self connections are
ignored. In an un-weighted network, labelled U , the shortest path
lengths between nodes are dUij ~1 for non-zero valued MG
ij and
dUij ?? for zero valued MG
ij . In an all-to-all network, labelled A,
all connections are weighted by dAij~1. By comparing the
weighted and the un-weighted networks one can gain a sense of
the effects of connection strengths on the network measures to be
analysed. Measures of global efficiency were calculated for
weighted, un-weighted and all-to-all networks. Global efficiency
quantifies the efficiency of information transmission of a network
based on the average weight of edges that must be traversed to go
from one node to another [26]. The global efficiency of a network
was determined by:
EX~1
N(N{1)
X
N,N
i~1,j~1,i=j
1
dXij
: ð4Þ
where X corresponds to networkW , U or A, and N is the number
of channels. EW and EU take on values between 0 and 1, while EA
is 1. If EX is small then the information transmission is inefficient
and correlations are low, whereas if EX is close to 1 then
information transmission is efficient and many channels are
correlated. The contribution of connection strength to global
efficiency was defined as the ratio between the global efficiencies of
the weighted network and the un-weighted network:
estr~EW
EU
: ð5Þ
The contribution of network structure to global efficiency was
defined as the ratio between the global efficiencies of the un-
weighted network and the all-to-all network:
etop~EU
EA
: ð6Þ
It can be noted that estr and etop are between 0 and 1.
Global Coherence (GC) AnalysisOur GC implementation follows the approach of Cimenser et
al. [22] and is reiterated here for clarity. The data was broken into
0.5 second non-overlapping sub-segments. Adjacent sub-segments
were clustered into segments of 40 sub-segments per segment
(20 seconds) and segments had 50% overlap. Each sub-segment
was detrended by removing the best straight line fit (using
CHRONUX [34] software):
zki (t)~Qki (t){(aki tzbki ) ð7Þ
where k indexes each sub-segment and Qki (t) corresponds to the
kth sub-segment of either the raw common-referenced data, Vi(t),
or the Laplacian-referenced data, Ji(t). For each sub-segment the
tapered 512-point FFT of all channels was windowed with the first
Slepian sequence [35], u(t), which is normalised such thatPN{1
t~0 u(t)2~1. The FFT is given by:
Zki (f )~
X
N{1
t~0
zki (t)u(t) exp(2pfffiffiffiffiffiffiffiffi
{1p
t): ð8Þ
Within a segment, the corresponding sub-segment FFTs were
mean corrected:
X ki (f )~Zk
i (f ){1
K
X
K
j~1
Zji (f ): ð9Þ
The average power spectrum for all channels was then calculated:
SXi (f )~
1
K
X
K
k~1
Xki (f )X
ki (f )
% ð10Þ
where % indicates the complex conjugate. From this the average
cross spectrum for all channel pairs was calculated:
CXij (f )~
1
K
X
K
k~1
Xki (f )X
kj (f )
%: ð11Þ
The eigenvalues lp(f ) and eigenvectors ~eep(f ) of the cross
spectrum, CXij (f ), for each frequency were then computed [36].
Eigenvalues were sorted in increasing order, eigenvectors were
sorted accordingly. It can be noted that the eigenvectors are
normalised according toPN
j~1 D~eejp(f )D2~1. The variables D~eejp(f )D
2,
which are termed the row weights, represent the contribution of
the jth electrode to the pth eigenvector and therefore provide a
Functional Networks under Nitrous Oxide
PLOS ONE | www.plosone.org 5 February 2013 | Volume 8 | Issue 2 | e56434
description of which electrodes contribute to significant and
coherent activity when the pth eigenvalue is large.
Within a trial, the global coherence for each frequency was
computed as
CG(f )~l1(f )
PNp~1 lp(f )
ð12Þ
where l1(f ) is the largest eigenvalue and N is the number of
eigenvalues (i.e. number of channels). For a given frequency, if
CG(f ) is small then the cross-spectral power is likely to be weak
and uncorrelated across channels, whereas if CG(f ) is close to 1
and the magnitude is high across many ‘channel’ elements in the
eigenvector/row weights corresponding to the largest eigenvalue,
then these channels with high magnitude are considered
coordinated. In the current manuscript we focus on the CG(f )
values, however, some consideration is given to the eigenvectors in
Appendix S1.
The GC spectra were computed for frequencies up to 47 Hz,
however, the majority of the analysis presented here focuses on
GC in the a band around 11 Hz. This is because strong resting a
band power was a common feature across all participants, and
there were intermittent decreases in a band power, especially for
high gas concentrations (Example time-frequency power spectra
are given in Figures 2 and 3 in Appendix S1). This frequency of
11 Hz was also the frequency focused on in a similar study
involving propofol [22] due to its strong GC.
Results
As expected the changes in brain state under the influence of
N2O were best observed for high gas concentrations. First we
broadly summarise our results in terms of the spatial scales and the
networks at which the significant changes take place. Then we
expand on specifics in the following sections.
For GE-based functional connectivity, it was found that GE
measures (EW , estr, etop) generally decreased for the parietal
network with a Laplacian-reference derivation when N2O gas
concentration increased to 60% and responsiveness decreased.
This indicates that decreases in parietal network functional
connectivity occur on a smaller scale as consciousness is reduced.
Moreover, the GE measures generally decreased for the frontal
network with either reference derivation indicating frontal
decreases in functional connectivity may occur on all scales as
consciousness is reduced. The GE measures increased and
decreased for the full network with the common-reference and
Laplacian-reference derivations, respectively, although changes
were most significant for the Laplacian-reference derivation. This
indicates that full brain decreases in functional connectivity are
most likely to occur at smaller scales when consciousness is
reduced.
Increases in gas concentration and reductions in responsiveness
were also linked to decreases in GC-based functional connectivity
at 11 Hz for the frontal network with a common-reference
derivation; and decreases for the full network with the Laplacian-
reference derivation. These decreases in GC-based functional
connectivity were largely consistent with the GE-based changes for
the same network and scale conditions. Considering the GE- and
GC-based frontal network changes together, decreases in func-
tional connectivity may predominantly occur on on larger scale as
consciousness is reduced.
In the following sections we address specific details of spatial
scale and network dependent changes in functional connectivity.
First we present the most signficant finding of the study, the
individual results for the 60% peak gas group showing decreases in
GE-based functional connectivity for the parietal network with the
Laplacian-reference derivation. This is consistent with GE-based
functional connectivity changes seen for propofol [3], and can
therefore be considered as evidence to support the hypothesis that
breakdown in functional connectivity in parietal networks reflects
an agent invariant final network change underlying drug-induced
reductions in consciousness. Then, we give examples of the GE-
and GC-based changes for an individual from the 60% peak gas
group. We note the results of an analysis of the dependence of the
measures on gas concentration, aCPT accuracy and reaction time
for of all of the subjects from the 20, 40 and 60% peak gas groups
combined. Given that the measures considered were largely
independent of subject responsiveness for the subjects in the 20
and 40% peak gas groups, additional analysis of the 60% peak gas
group alone is presented and the dependence of the measures on
gas concentration and responsiveness is illustrated.
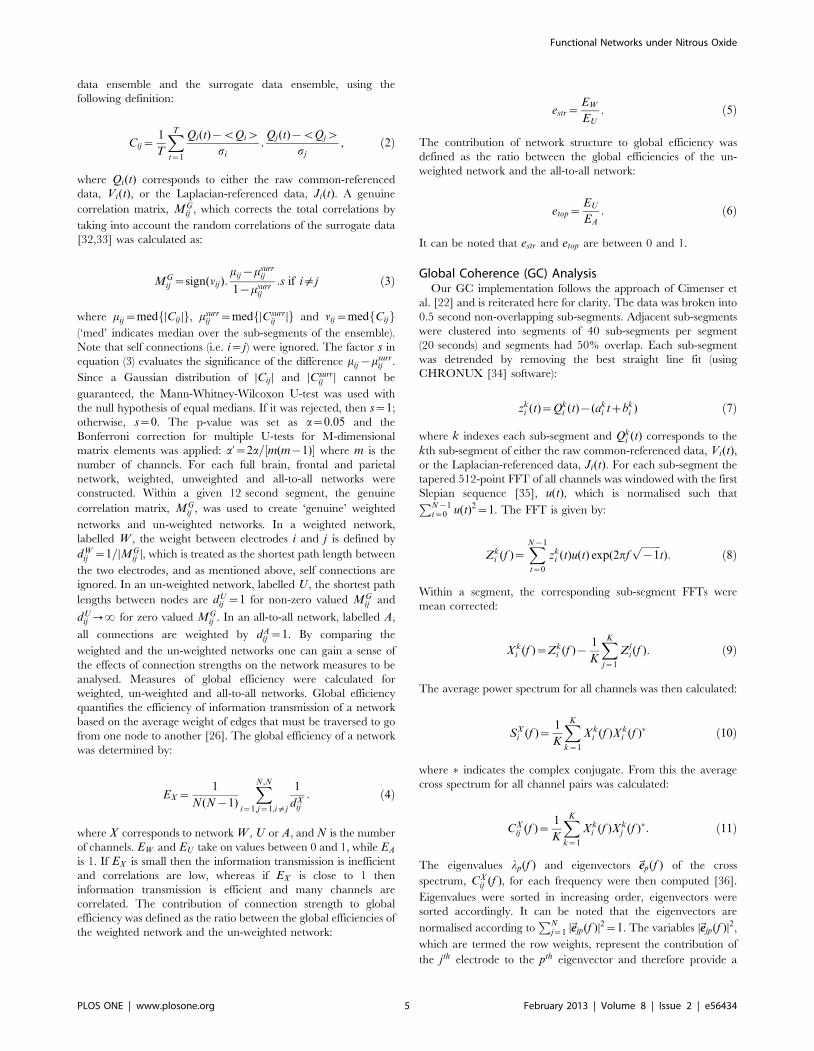
Individual GE-based parietal network changesFigure 2 presents the GE (EW , estr and etop) time series for the
parietal network with a Laplacian-reference derivation for the
individuals of the 60% group (end-tidal gas equilibration between
5 and 15 minutes). This figure demonstrates that for each subject
for the parietal network with a Laplacian-reference derivation,
decreases in GE-based functional connectivity were observed
during high gas levels and loss of responsiveness (zero-level
performance in the auditory task). This provides strong support for
the parietal network being consistently involved in agent invariant
final network changes underlying drug-induced reductions in
consciousness. For the individuals’ data presented in Figure 2A, B,
C and D, the AUROC scores for the difference between rest and
‘incorrect’ data are 0.87, 0.36, 0.95, and 0.86, respectively. Where
‘incorrect’ implies the subject either gave an incorrect response,
which was extremely rare during rest, or they did not respond at
all during a given time window of the auditory task. These scores
are highly significant and show parietal GE decreases occur during
loss of responsiveness, except for the subject in Figure 2B.
Although one can see a slight decrease in the GE measures
towards the end of the recording for the subject in Figure 2B, this
subject’s recording did not reach the peak gas equilibration period
due to emesis and therefore significant GE changes were not
observed. The subject in Figure 2C also experienced emesis and
their recording lasted less than 10 minutes, however, this was long
enough for equilibrated gas levels to be reached after 5 minutes
and for significant parietal network changes to be observed.
Spatial scale and network dependence: IndividualexampleFor the same subject in Figures 1D and 2A from the 60% case,
Figure 3 shows the time series of the GE measures for the full brain
(top row), frontal (middle row) and parietal (bottom row) networks
obtained either with common-reference (left column) or Laplacian
re-referencing (right column). For this subject for the full brain
network during the equilibrated 60% gas period, the GE measures
either showed increases or decreases depending on the respective
use of a common-reference or Laplacian-reference derivation. For
this subject these changes were strongly correlated with the loss of
responsiveness. These GE time series indicate that the efficiency of
information transmission is spatial scale dependent. For the data
presented in Figure 3 the significant AUROC scores for the
difference between rest and ‘incorrect’ data for the EW measure
were 0.91, 0.92, 0.88 and 0.87, for the full network with common-
reference, full network with Laplacian-reference, frontal network
with Laplacian-reference, and parietal network with Laplacian-
Functional Networks under Nitrous Oxide
PLOS ONE | www.plosone.org 6 February 2013 | Volume 8 | Issue 2 | e56434
reference, respectively. This indicates clearly indicates that these
EW changes are linked to unresponsiveness for this individual.
For Laplacian re-referencing the smaller (and more superficial)
spatial scales are associated with reduced transmission/correla-
tions for all networks, whereas the common-reference derivation,
which conflates all spatial scales, is associated with increases in
transmission/correlations in the full brain network. In the
common-reference derivation, correlations would be in part due
to volume conduction effects. Baseline differences in the GE
measures seen just prior to N2O inhalation (t~0) for common-
reference and Laplacian derivations should therefore give an
indication of the likely influence of volume conduction effects.
From Figure 3 it can be further noted that for this subject strong
frontal network changes were not observed and that large parietal
changes are only seen with Laplacian re-referencing indicating
that parietal network changes linked to conscious state may
operate on a local scale in posterior parietal cortex when there is a
significant loss of response.
As was shown in Figure 2 these parietal level changes in GE
were a common feature in all 60% peak gas subjects, however,
frontal changes were also observed across the 60% peak gas group.
Similar, though less pronounced, changes were seen with GC.
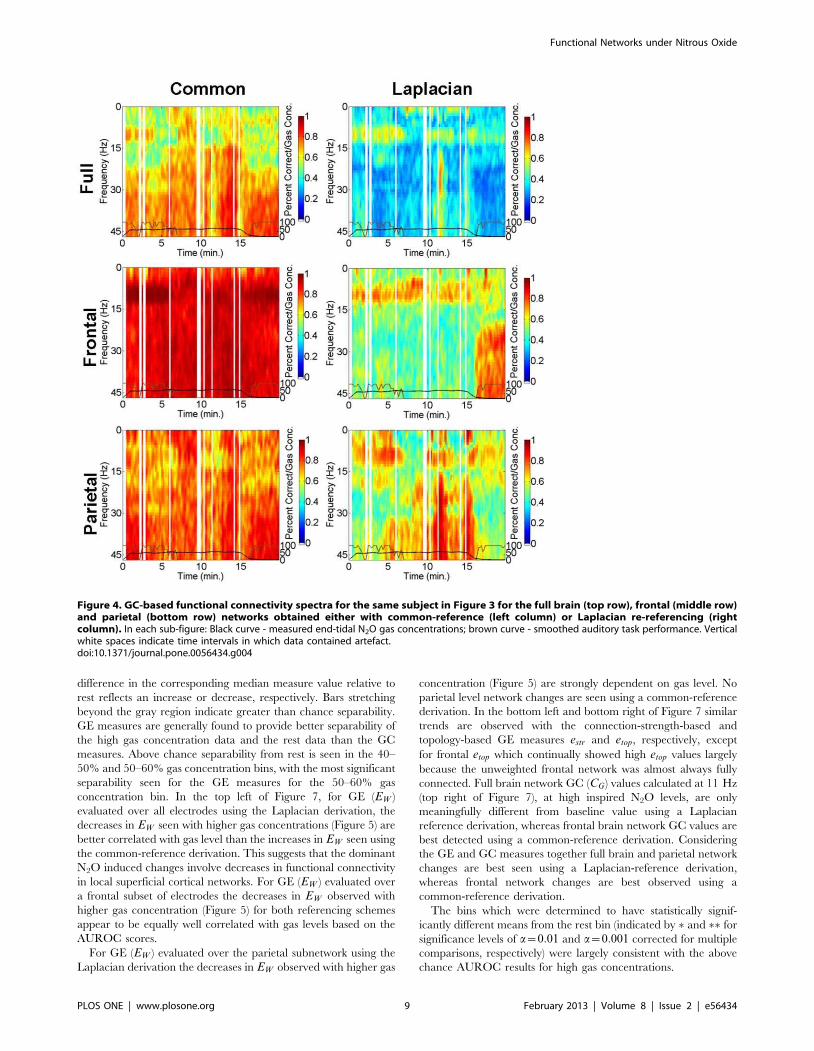
Example data from the GC analysis is presented in Figure 4. For
the same 60% peak gas subject as in Figure 3, Figure 4 illustrates
GC spectra (CG(f )) for the full brain (top row), frontal (middle
row) and parietal (bottom row) networks obtained either with
common-reference (left column) or Laplacian re-referencing (right
column). GC is seen strong across all frequencies for the common-
reference derivation, highlighting volume conduction and com-
mon-reference effects, whereas Laplacian re-referencing gives
prominence to GC in the a band around 11 Hz. Moreover,
Figure 4 shows that applying the Laplacian derivation to full brain
and parietal level networks reveals that a band (around 11 Hz)
GC-based functional connectivity is intermittently weakened
during peak gas effect, however such changes were not as
prominent as the changes seen for the GE measures. Nevertheless,
changes in GC when going from rest to gas inhalation appear to
be related to a slight anterior shift in coherent activity in the full
brain network as is observed for the same subject by considering
snap shots of the row weights corresponding to the largest
eigenvalue at 11 Hz (see Figures 4 and 5 in Appendix S1), as well
as a cumulative row weight analysis (see Figures 20 and 21 and
Tables 1–3 in Appendix S1). For the data presented in Figure 4
the significant AUROC scores for the difference between rest and
‘incorrect’ data for the CG at 11 Hz measure were 0.69, 0.80,
0.73, 0.66, and 0.70 for the full network with common-reference,
frontal network with common-reference, parietal network with
common-reference, full network with Laplacian-reference and
frontal network with Laplacian-reference, respectively. This
clearly indicates that these CG at 11 Hz changes are linked to
unresponsiveness for this individual, but less strongly than the
corresponding GE measures.
Spatial scale and network dependence: Group analysisTo assess the sensitivity of all the measures to N2O gas
concentration, aCPT accuracy or reaction time, data were pooled
across subjects. Pooling, as opposed to an individualised analysis,
seemed most appropriate because not all subjects received the
same N2O gas dosage so we could not compare peak gas cases
within individuals. Before pooling, each measure was defined as
relative to the median value of the measure during the rest
recording simply by dividing by the median rest value. This was
done to correct for the intersubject variability in the resting state
measure values and in some sense it de-individualises the data.
Moreover, while all rest data were considered in the analysis, only
the first 15 minutes of the gas recordings for each subject were
Figure 2. Time series of the GE-based functional connectivity measures for the four different subjects (A–D) from the 60% peak gasgroup for the parietal networks obtained with Laplacian re-referencing. In each sub-figure: GE (EW ; green), the contribution of connectionstrength to GE (estr; blue), and the contribution of network topology to GE (etop ; red). Black curve: measured end-tidal N2O gas concentrations.Magenta curve: smoothed auditory task performance. Missing data indicates artefact.doi:10.1371/journal.pone.0056434.g002
Functional Networks under Nitrous Oxide
PLOS ONE | www.plosone.org 7 February 2013 | Volume 8 | Issue 2 | e56434

included, as there are strong power rebound effects that occur
upon N2O withdrawal [14].
Combined group data dependence on gas concentration
and responsiveness. Although the combined 20%, 40% and
60% group data showed a strong dependence of the measures on
gas concentration (Figures 7–9 in Appendix S1), the combined
group data showed little dependence of the measures on
responsiveness (Figures 10–12 in Appendix S1 for aCPT accuracy
and Figures 13–15 in Appendix S1 for aCPT responsiveness).
Therefore here we focus on the 60% peak gas group data below.
The combined group data dependence of the measures on high
gas concentrations, was quite similar to that seen for the 60% peak
gas group.
60% peak gas group data dependence on gas
concentration. Figure 5 shows box-whisker plots for GE-based
functional connectivity (EW ) defined relative to the median during
rest for the full brain (top row), frontal (middle row) and parietal
(bottom row) networks obtained either with common-reference
(left column) or Laplacian re-referencing (right column). It can be
seen that across the 60% peak gas group, full brain GE increases
using a common-reference with increasing gas concentration, but
decreases when using Laplacian re-referencing. For frontal
networks both referencing schemes show a reduction in GE with
increasing gas concentrations, whereas for the parietal networks a
decrease in GE for high gas concentrations is only seen when a
Laplacian-reference derivation is used.
For comparison, Figure 6 shows box-whisker plots for GC-based
functional connectivity (CG ) at 11 Hz defined relative to the
median during rest for the full brain (top row), frontal (middle row)
and parietal (bottom row) networks obtained either with common-
reference (left column) or Laplacian re-referencing (right column).
It can be seen that there are clear full brain decreases in GC, for
both derivations and high gas concentrations. Frontal network GC
decreases are restricted to common-reference derivations. Given
the strong overlap in the GC distributions for the different bins it is
clear that GE is more sensitive to changes in brain networks than
GC at 11 Hz.
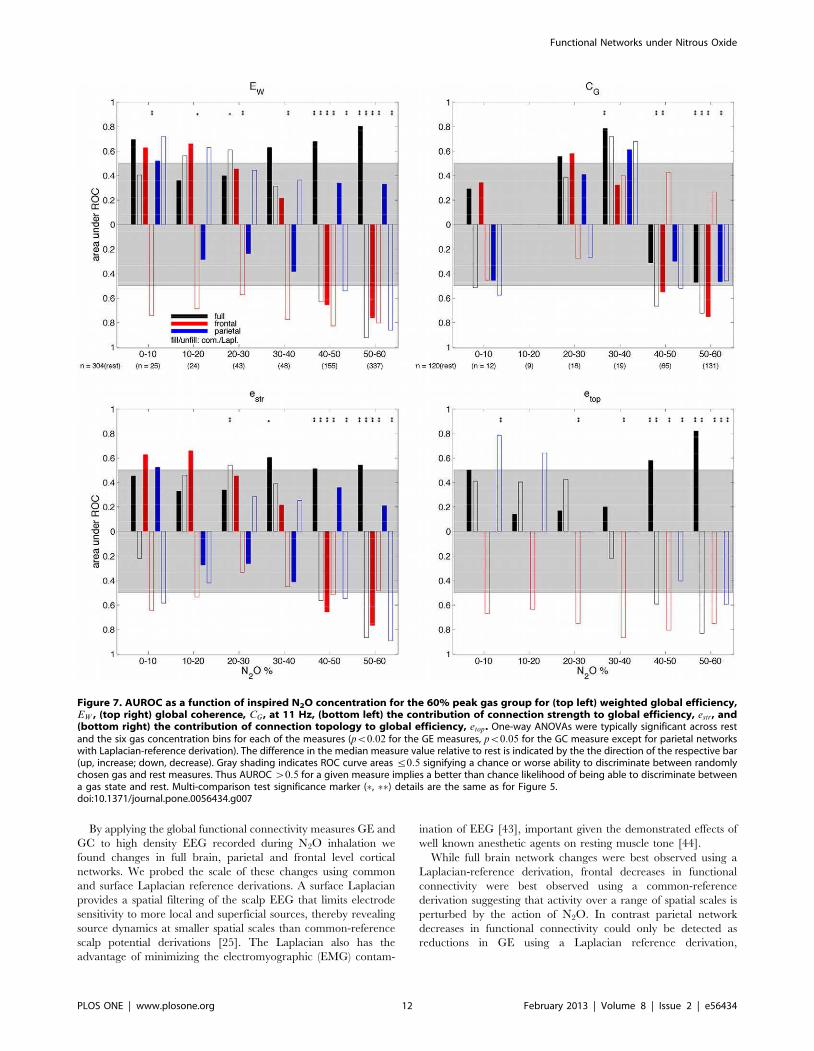
Figure 7 summarises the results of the ROC analysis for all GE
and GC measures as a function of gas concentration for the 60%
peak gas group, where AUROC score bars point up or down if the
Figure 3. Time series of the GE-based functional connectivity measures for the same subject in Figure 1D from the 60% peak gasgroup for the full brain (top row), frontal (middle row) and parietal (bottom row) networks obtained either with common-reference(left column) or Laplacian re-referencing (right column). In each sub-figure: GE (EW ; green), the contribution of connection strength to GE(estr; blue), and the contribution of network topology to GE (etop ; red). Black curve: measured end-tidal N2O gas concentrations. Magenta curve:smoothed auditory task performance. The bottom right sub-figure corresponds to Figure 2A. Missing data indicates artefact.doi:10.1371/journal.pone.0056434.g003
Functional Networks under Nitrous Oxide
PLOS ONE | www.plosone.org 8 February 2013 | Volume 8 | Issue 2 | e56434
difference in the corresponding median measure value relative to
rest reflects an increase or decrease, respectively. Bars stretching
beyond the gray region indicate greater than chance separability.
GE measures are generally found to provide better separability of
the high gas concentration data and the rest data than the GC
measures. Above chance separability from rest is seen in the 40–
50% and 50–60% gas concentration bins, with the most significant
separability seen for the GE measures for the 50–60% gas
concentration bin. In the top left of Figure 7, for GE (EW )
evaluated over all electrodes using the Laplacian derivation, the
decreases in EW seen with higher gas concentrations (Figure 5) are
better correlated with gas level than the increases in EW seen using
the common-reference derivation. This suggests that the dominant
N2O induced changes involve decreases in functional connectivity
in local superficial cortical networks. For GE (EW ) evaluated over
a frontal subset of electrodes the decreases in EW observed with
higher gas concentration (Figure 5) for both referencing schemes
appear to be equally well correlated with gas levels based on the
AUROC scores.
For GE (EW ) evaluated over the parietal subnetwork using the
Laplacian derivation the decreases in EW observed with higher gas
concentration (Figure 5) are strongly dependent on gas level. No
parietal level network changes are seen using a common-reference
derivation. In the bottom left and bottom right of Figure 7 similar
trends are observed with the connection-strength-based and
topology-based GE measures estr and etop, respectively, except
for frontal etop which continually showed high etop values largely
because the unweighted frontal network was almost always fully
connected. Full brain network GC (CG ) values calculated at 11 Hz
(top right of Figure 7), at high inspired N2O levels, are only
meaningfully different from baseline value using a Laplacian
reference derivation, whereas frontal brain network GC values are
best detected using a common-reference derivation. Considering
the GE and GC measures together full brain and parietal network
changes are best seen using a Laplacian-reference derivation,
whereas frontal network changes are best observed using a
common-reference derivation.
The bins which were determined to have statistically signif-
icantly different means from the rest bin (indicated by % and %% for
significance levels of a~0:01 and a~0:001 corrected for multiple
comparisons, respectively) were largely consistent with the above
chance AUROC results for high gas concentrations.
Figure 4. GC-based functional connectivity spectra for the same subject in Figure 3 for the full brain (top row), frontal (middle row)and parietal (bottom row) networks obtained either with common-reference (left column) or Laplacian re-referencing (rightcolumn). In each sub-figure: Black curve - measured end-tidal N2O gas concentrations; brown curve - smoothed auditory task performance. Verticalwhite spaces indicate time intervals in which data contained artefact.doi:10.1371/journal.pone.0056434.g004
Functional Networks under Nitrous Oxide
PLOS ONE | www.plosone.org 9 February 2013 | Volume 8 | Issue 2 | e56434

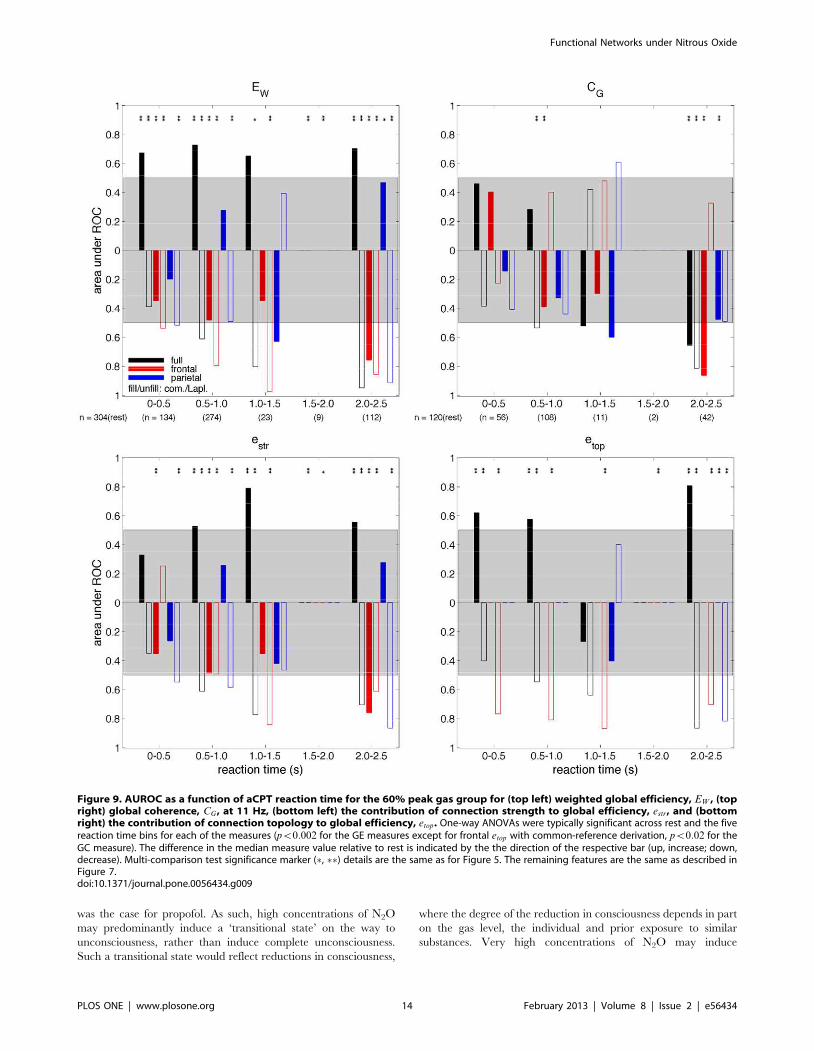
60% peak gas group data dependence on
responsiveness. The ROC-based dependence of the measures
on auditory task responsiveness for the 60% peak gas group are
presented in Figures 8 and 9 as a function of aCPT accuracy, and
aCPT reaction time, respectively. In Figure 8, the ‘correct’ and
‘incorrect’ bins correspond to data collected from the gas
recording. Moreover, ‘correct’ implies the subject answered
correctly, whereas ‘incorrect’ implies the subject either gave an
incorrect response (which was extremely rare during rest) or they
did not respond at all. The significant changes are similar to those
observed for the gas concentration analysis, namely reductions in
responsiveness (i.e. reductions in task accuracy reflected in the
‘incorrect’ bin in Figure 8 and increases in task reaction times
reflected in the ‘2–2.5 s’ bin in Figure 9) were linked to EW
decreases for the parietal network with a Laplacian-reference
derivation; EW decreases for the frontal network with either
reference derivation; and EW increases and decreases for the full
network with the common-reference and Laplacian-reference
derivations, respectively. Reductions in responsiveness were also
linked to CG decreases for the frontal network with a common-
reference derivation; and CG decreases for the full network with
either reference derivation. The box-whisker plots showing the
dependence of GE (EW ) and GC (CG ) on aCPT accuracy for the
60% peak gas group are presented in Figures 16 and 17 in
Appendix S1, respectively. While the box-whisker plots showing
the dependence of GE (EW ) and GC (CG ) on aCPT reaction time
for the 60% peak gas group are presented in Figures 18 and 19 in
Appendix S1, respectively.
Although here we have analysed measure dependence on gas
concentration, aCPT accuracy and aCPT reaction time indepen-
dently, increases with gas concentration were found to be
correlated with decreases in responsiveness (i.e. decreases in aCPT
accuracy and increases in aCPT reaction time), as is shown in
Figure 6 in Appendix S1.
Figure 5. Dependence, for the 60% peak gas group, of GE-based functional connectivity (EW ) defined relative to the median duringrest on N2O gas concentration for full brain (top row), frontal (middle row) and parietal (bottom row) networks, obtained eitherwith common-reference (left column) or Laplacian re-referencing (right column). Box-whisker details: Red horizontal lines indicate bindistribution median; Upper and lower blue box edges correspond to 75th and 25th percentiles, respectively; Black dashed whiskers span 99.3% of thedistribution assuming a normal distribution; The red crosses indicate outliers. The bins labelled above by % and %% indicate the mean is statisticallysignificant from rest for significance levels of a~0:01 and a~0:001 corrected for multiple comparisons, respectively.doi:10.1371/journal.pone.0056434.g005
Functional Networks under Nitrous Oxide
PLOS ONE | www.plosone.org 10 February 2013 | Volume 8 | Issue 2 | e56434

GE analysis with sub-sampled 10–20 montageThe results for the GE study with propofol were obtained using
21 channels in a 10–20 montage [3]. We found that if we re-
performed our analysis by subsampling our electrodes to create a
10–20 montage, similar results to those we observed with 42
channels were obtained, as presented in Figures 22 and 23 in
Appendix S1.
Discussion
Because a range of structurally unrelated compounds were able
to induce anesthesia it was initially speculated that they all acted
through a common mechanism. The Meyer-Overton hypothesis
gave form to such speculations by asserting that the empirically
observed relationship between anesthetic potency and lipid
solubility was a reflection of a progressive non-specific disruption
of neuronal membrane function [37]. However because such a
unitary hypothesis of action failed to account for a number of well
established empirical phenomena [38] it was ultimately aban-
doned. Anesthetics are now known to exert their differential effects
by interacting with a diverse range of microscopic level cellular
and molecular targets [12]. Nevertheless, as our results show,
sedative levels of the dissociative agent N2O produces GE-related
decreases in parietal network functional connectivity that are also
reported for the structurally unrelated inductive anesthetic agents
propofol [3] and sevoflurane [39], thus giving weight to the view
that macroscopically anesthetics may be altering the state of
consciousness through unitary network level mechanisms. Other
network level analyses, utilising resting state functional MRI (rs-
fMRI) [4,40] and EEG [3,8,41] with a range of anesthetic agents,
are consistent with these selective alterations in parietal activity.
Most significantly rs-fMRI studies involving midazolam [40],
sevoflurane [39] and propofol [4,5] reveal reductions in default
mode network activity that are typically accompanied by changes
in fronto-parietal functional connectivity. The relationship be-
tween the above changes and increases in frequency-specific
effective connectivity between anterior and posterior cingulate
cortex during propofol induction [42] still needs to be understood
in greater detail and the consistency of changes across studies
needs to be thoroughly evaluated.
Figure 6. Dependence, for the 60% peak gas group, of GC-based functional connectivity (CG) at 11 Hz defined relative to themedian during rest on N2O gas concentration for full brain (top row), frontal (middle row) and parietal (bottom row) networks,obtained either with common-reference (left column) or Laplacian re-referencing (right column). Box-whisker and multi-comparison testsignificance marker (%, %%) details are the same as for Figure 5.doi:10.1371/journal.pone.0056434.g006
Functional Networks under Nitrous Oxide
PLOS ONE | www.plosone.org 11 February 2013 | Volume 8 | Issue 2 | e56434
By applying the global functional connectivity measures GE and
GC to high density EEG recorded during N2O inhalation we
found changes in full brain, parietal and frontal level cortical
networks. We probed the scale of these changes using common
and surface Laplacian reference derivations. A surface Laplacian
provides a spatial filtering of the scalp EEG that limits electrode
sensitivity to more local and superficial sources, thereby revealing
source dynamics at smaller spatial scales than common-reference
scalp potential derivations [25]. The Laplacian also has the
advantage of minimizing the electromyographic (EMG) contam-
ination of EEG [43], important given the demonstrated effects of
well known anesthetic agents on resting muscle tone [44].
While full brain network changes were best observed using a
Laplacian-reference derivation, frontal decreases in functional
connectivity were best observed using a common-reference
derivation suggesting that activity over a range of spatial scales is
perturbed by the action of N2O. In contrast parietal network
decreases in functional connectivity could only be detected as
reductions in GE using a Laplacian reference derivation,
Figure 7. AUROC as a function of inspired N2O concentration for the 60% peak gas group for (top left) weighted global efficiency,EW , (top right) global coherence, CG , at 11 Hz, (bottom left) the contribution of connection strength to global efficiency, estr, and(bottom right) the contribution of connection topology to global efficiency, etop. One-way ANOVAs were typically significant across restand the six gas concentration bins for each of the measures (pv0:02 for the GE measures, pv0:05 for the GC measure except for parietal networkswith Laplacian-reference derivation). The difference in the median measure value relative to rest is indicated by the the direction of the respective bar(up, increase; down, decrease). Gray shading indicates ROC curve areasƒ0:5 signifying a chance or worse ability to discriminate between randomlychosen gas and rest measures. Thus AUROCw0:5 for a given measure implies a better than chance likelihood of being able to discriminate betweena gas state and rest. Multi-comparison test significance marker (%, %%) details are the same as for Figure 5.doi:10.1371/journal.pone.0056434.g007
Functional Networks under Nitrous Oxide
PLOS ONE | www.plosone.org 12 February 2013 | Volume 8 | Issue 2 | e56434

indicating that only the finer spatial structure of superficial parietal
networks is likely affected by N2O.
Differences in dependence on responsivenessTo understand the behavioural results it is worthwhile to note
several points. On a first inspection it was thought that behavioural
changes were not very significant when the 20, 40 and 60% peak
gas groups were combined because there were incomplete gas
recordings for 2 of the 4 subjects of the 60% peak gas group.
However, as is shown in Figures 8 and 9 significant behavioural
changes are seen in the 60% peak gas group. Instead, the main
reason for the discrepancy seems to be that for some of the subjects
in the 20 and 40% peak gas groups there were several drops in task
accuracy involving up to a few minutes of unresponsiveness. For
reasons not yet fully understood, these changes in responsiveness
were generally not found to coincide with significant changes in
our measures for subjects who experienced equilibrated gas
concentrations below 40%. We can note from Figure 7 (and also
Figure 9 in Appendix S1) that most significant measure changes
relative to rest occurred at gas concentrations above 40%
(although based on visual inspection in some individual cases
there are clear changes in the measures when responsiveness
drops). Therefore there are likely to be brain changes occurring at
concentrations below 40% that cause brief unresponsiveness with
the measures we have considered here not generally sensitive to
these changes. This may be because the unresponsiveness
occurring at different gas concentrations and/or different rates
of inhalation is linked to different kinds of network dynamics.
Alternatively, and in addition, it is possible that the distracting
dissociative effects at low gas concentrations were sufficient to
interrupt task performance. Further consideration of changes in
responsiveness for equilibrated gas concentrations below 40% is
beyond the scope of this study and will be a subject of future
investigation.
Comparison to GE and GC studies of propofolStrong decreases in GE have also been reported in parietal
networks during propofol anesthesia [3]. However these authors
evaluated GE using only 21 channels and a common reference,
and thus our results are not directly comparable. Because they
found changes with a common-reference, it may be that propofol
and N2O affect parietal level activity at different spatial scales,
however a re-analysis with GE of the existing propofol data using a
Laplacian-reference derivation will need to be performed to fairly
evaluate the basis for such a speculation. Given that Lee et al. [3]
evaluated GE using only 21 channels, we recalculated GE and GC
during N2O inhalation for the standard 10:20 montage by
subsampling and found that this did not qualitatively alter our
results, regardless of whether a common-reference or Laplacian-
reference was used (see Figures 22 and 23 in Appendix S1).
The ability of GE to discern parietal network changes reflects
the general ability of a network theoretic approach to better detect
N2O induced changes compared to the frequency domain
correlational approach of GC. Nevertheless our GC analysis did
have one important advantage in that a direct comparison to
propofol with a Laplacian-reference derivation could be made.
During propofol anesthesia it is found that global coherence in the
a band does not disappear during loss of consciousness, but
intermittently disappears during transitions from consciousness to
unconsciousness [22]. We observed similar effects with N2O
(Figure 4) for the GC spectrum of the full brain network with the
Laplacian. As end-tidal N2O gas concentration increased to 60%
the alpha rhythm intermittently disappears which may be a
reflection of the brain transitioning towards unconsciousness as
Figure 8. AUROC as a function of aCPT accuracy for the 60%peak gas group for (top left) weighted global efficiency, EW ,(top right) global coherence, CG , at 11 Hz, (bottom left) thecontribution of connection strength to global efficiency, estr,and (bottom right) the contribution of connection topology toglobal efficiency, etop. One-way ANOVAs were typically significantacross rest and the two accuracy bins for each of the measures (pv0:06for the GE measures except for parietal Ew and estr with common-reference derivation, pv0:06 for the GC measure except for the parietalnetwork with Laplacian-reference derivation). The difference in themedian measure value relative to rest is indicated by the the directionof the respective bar (up, increase; down, decrease). Multi-comparisontest significance marker (%, %%) details are the same as for Figure 5. Theremaining features are the same as described in Figure 7.doi:10.1371/journal.pone.0056434.g008
Functional Networks under Nitrous Oxide
PLOS ONE | www.plosone.org 13 February 2013 | Volume 8 | Issue 2 | e56434
was the case for propofol. As such, high concentrations of N2O
may predominantly induce a ‘transitional state’ on the way to
unconsciousness, rather than induce complete unconsciousness.
Such a transitional state would reflect reductions in consciousness,
where the degree of the reduction in consciousness depends in part
on the gas level, the individual and prior exposure to similar
substances. Very high concentrations of N2O may induce
Figure 9. AUROC as a function of aCPT reaction time for the 60% peak gas group for (top left) weighted global efficiency, EW , (topright) global coherence, CG , at 11 Hz, (bottom left) the contribution of connection strength to global efficiency, estr, and (bottomright) the contribution of connection topology to global efficiency, etop. One-way ANOVAs were typically significant across rest and the fivereaction time bins for each of the measures (pv0:002 for the GE measures except for frontal etop with common-reference derivation, pv0:02 for theGC measure). The difference in the median measure value relative to rest is indicated by the the direction of the respective bar (up, increase; down,decrease). Multi-comparison test significance marker (%, %%) details are the same as for Figure 5. The remaining features are the same as described inFigure 7.doi:10.1371/journal.pone.0056434.g009
Functional Networks under Nitrous Oxide
PLOS ONE | www.plosone.org 14 February 2013 | Volume 8 | Issue 2 | e56434
complete unconsciousness, however, this is difficult to study given
the attendent problems of nausea, emesis and hypoxia.
Propofol also induces an anteriorisation of global coherence at
11 Hz during loss of consciousness as shown with a cumulative
row weight analysis [22]. We observed a similar, though smaller,
anterior shift during high N2O gas concentrations (see Appendix
S1, Tables 1–3 and Figures 4, 5, 20 and 21 in Appendix S1 for
details) and this weaker shift may be indicative of a ‘transitional
state’. In addition, it was found that cumulative univariate power,
as an alternative to cumulative row weight, plots (see Figure 20 in
Appendix S1) can capture the same shifts and thus brings into
question the additional utility of the more complicated cumulative
row weight analysis for the purposes of monitoring brain state
during anesthesia [22]. Although the row weight approach is
related directly to correlations and is therefore a network
approach, on a first inspection with N2O-based data it appears
it could be strongly biased by univariate power measures. A more
thorough comparison would be required to make a final
judgement.
EEG spectral content during N2O inhalationIn the current paper our GC analysis focused primarily on a
frequency of 11 Hz as we saw large power and GC changes in this
band, especially at 60% N2O gas concentrations. In prior studies,
Rampil et al. [45] found that compared to rest there were frontal
increases in power in the theta, beta, 40–50 Hz and 70–110 Hz
bands at 50% N2O gas concentrations, whereas Yamamura et al.
[15] found an increase in power around 34 Hz and a decrease in
power in the 8–13 Hz bands at 50–70% N2O gas concentrations.
More recently for a subset of the data presented here, Foster and
Liley [14] found that there were frontal decreases in power in the
1–4 Hz and the 4–8 Hz bands while the 8–15 Hz alpha band saw
minimal change in relative power, although absolute power
decreases did occur, at 40% N2O gas concentrations. If one
considers the 60% peak gas group as we do here, consistent with
the results of Yamamura et al. [15] one finds there are strong
intermittent drops in the alpha band power as can be seen for a
given subject in the GC spectra in Figure 4 and the time-frequency
power spectra (see Figures 2 and 3 in Appendix S1). These
changes were consistent across subjects in the 60% peak gas group
(not shown here). It is important to note the data analysed here
and in Foster and Liley [14] was collected in a noise-minimized
non-clinical environment, 1–40 Hz band-pass filtering was applied
and independent components analysis was used to remove
artefact. These are the likely reasons we do not see increases in
theta and high frequency power under N2O inhalation as observed
by Rampil [45]. Rampil used a single frontal bipolar montage and
thus the strategies available for artefact rejection were much
restricted.
True correlations and reductions in consciousnessThe present study suffered from an important limitation that
future studies will need to address. Unlike previous studies
evaluating network level changes that attend anesthesia, most
participants in our study did not completely lose consciousness in
the sense observed for standard general anesthetics. Operationally,
loss of consciousness is assessed by loss of response to noxious
stimuli. The subjects in the 60% peak gas group did lose
responsiveness, in terms of task performance, for significant
periods of time, therefore from an operational perspective these
subjects experienced some reduction of consciousness. Although
more standard probes for responsivness would have better
characterized patient state, such techniques can interfere with
EEG signals, and are not completely commensurate with
unconsciousness [46].
The reason the majority of the subjects in the study did not lose
consciousness is because N2O is an anesthetic gas of relatively
weak potency. It is estimated that only fifty percent of people will
lose responsiveness at an endtidal N2O concentration of 63%
(MAC awake) [47]. In contrast the potent halogenated agent
sevoflurane has a MAC awake of 0.4–0.6% [48]. As mentioned
above, at N2O concentrations near 63% the incidence of nausea
and vomiting is high thus precluding easy empirical scrutiny of the
effects of N2O on brain activity. Nevertheless we found that in the
participants who did lose responsiveness that parietal network
functional connectivity decreases preceeded or attended unre-
sponsiveness.
It is also worthwhile noting that our surface Laplacian was
evaluated using a simple nearest-neighbour method which may
have poorly estimated radial current densities due to not
adequately taking into account the geometry and electrical
properties of the skull and scalp. More accurate estimates could
be determined by analytically calculating the surface Laplacian
from spherical spline interpolations of densely sampled (64 or 128
channel) EEG data [25,49] or by using realistic, MRI derived,
head models [50]. However such extra effort may go unrewarded
as nearest-neighbour and spherical spline Laplacians have been
found empirically found to give essentially equivalent topographic
and chronometric information [51]. Moreover, although working
in source space, as opposed to sensor space as we have done here,
may put one ‘closer’ to the true cortical networks and help alleviate
potential confounding correlations resulting from field effects, the
results one obtains in the sensor space are still dependent on the
source reconstruction approach applied [52]. Therefore we choose
to take the iterative approach of seeing what one obtains at the
sensor level and comparing this to other studies done with other
drugs, such as propofol, at the sensor level using the exact same
methods [3,22], before considering future studies at the source
level. Moreover, the application of techniques at the sensor level,
bypasses the extra computational complexity of source recon-
struction, allowing for the potential application of the measures
considered to real-time monitoring of individuals undergoing
drug-induced sedation or anesthesia.
Given we have chosen to work first at the sensor level it is
important to point out possible confounds. One is that compu-
tation of cross-spectral/coherency (or correlation) measures using
a common-reference derivation is confounded by power and phase
changes in the common-reference signal [53]. Under certain
assumptions this can be avoided by considering the imaginary part
of the coherency [54], however, here we wished to reuse the
methods of GE [3] and GC [22] used for propofol. Since Lee et al.
[3] focused on a common-reference and Cimenser et al. [22]
focused on a Laplacian-reference we decided to perform our
analysis on both reference derivations. When working in sensor
space, the confounds due to the common-recording reference can
be reduced in part by Laplacian re-referencing, but true reference-
free recordings cannot be obtained from the EEG, and can only be
obtained from magnetoencephalography (MEG). To assess if the
GE and GC changes observed here at the sensor level are truly
observed in cortical networks, future studies with EEG and MEG
will need to be done at the source level. Nevertheless, given that a
Laplacian-reference derivation is less confounded by a common-
recording reference and that here for the 60% peak gas group we
have observed parietal decreases in GE for the Laplacian-
reference derivation during N2O inhalation, we can be quite
confident that these changes are occurring at the level of cortical
networks.
Functional Networks under Nitrous Oxide
PLOS ONE | www.plosone.org 15 February 2013 | Volume 8 | Issue 2 | e56434

It is also important to emphasise that although a common-
reference can confound correlations, making it more difficult to be
certain if the correlations we observe are true cortical correlations
or just sensor level correlations, the confounds are consistent. This
means that if the measures are shown to be dependent on gas
concentration and responsiveness at the sensor level, as is done
here, then these measures can still potentially be used in
monitoring devices for sedation and anesthesia.
Another possible confound is random correlations due to noise
or the finite size data effect [33]. Here the GE measure is
surrogate-corrected (as mentioned in the methods) in order to
remove such confounds, as was the case in Lee et al. [3] in their
GE analysis of propofol. Surrogate-correction was not applied
here to the GC analysis as this was not performed by Cimenser et
al. [22] in their GC analysis of propofol, and we sought to provide
a direct comparison with N2O. The lack of surrogate-correction
for GC may be one potential explanation for why the GC measure
was generally less sensitive to changes in N2O gas concentration
when compared to the GE measures.
Conclusions
Similar to propofol, the dissociative and weak anesthetic agent
N2O reduces functional connectivity in the scalp EEG most
strongly in the parietal area. This effect seems to specifically occur
as the subjects experience reductions in consciousness; and
provides strong evidence that completely different families of
anesthetic drugs reduce consciousness via a common mechanism
of parietal network disruption. Moreover, our results demonstrate
that N2O perturbs functional connectivity over a number of spatial
scales, thus opening up the possibility that this may be a key
feature of anesthetic action. Future studies will therefore need to
employ a variety of other imaging modalities, such as rs-fMRI and
MEG, to characterise what scale dependent effects are shared by
anesthetic agents having differing pharmacological modes of
action.
Supporting Information
Appendix S1 Additional Methods and Results. Summa-
rises ROC analysis and additional GC methods. Provides
additional power spectral, GC results as well as GE and GC
results for the combined group, the 60% peak gas group and for a
10–20 montage. The relationship observed between gas concen-
tration and responsiveness is also provided.
(PDF)
Acknowledgments
We thank UnCheol Lee for helpful conversations and suggestions.
Author Contributions
Conceived and designed the experiments: BLF DTJL. Performed the
experiments: BLF DTJL. Analyzed the data: LK DTJL. Contributed
reagents/materials/analysis tools: LK. Wrote the paper: LK DTJL BLF.
References
1. Hudetz A (2010) Cortical disintegration mechanism of anesthetic-induced
unconsciousness. In: Hudetz A, Pearce R, editors, Suppressing the Mind,
Humana Press, New York. pp. 178–189.
2. Alkire M, Hudetz A, Tononi G (2008) Consciousness and anesthesia. Science
322: 876–880.
3. Lee U, Muller M, Noh G, Choi B, Mashour G (2011) Dissociable network
properties of anesthetic state transitions. Anesthesiology 114: 872–881.
4. Boveroux P, Vanhaudenhuyse A, Bruno M, Noirhomme Q, Lauwick S, et al.
(2010) Breakdown of within- and between-network resting state functional
magnetic resonance imaging connectivity during propofol-induced loss of
consciousness. Anesthesiology 113: 1038–1053.
5. Schroter M, Spoormaker V, Schorer A, Wohlschlager A, Czisch M, et al. (2012)
Spatiotemporal reconfiguration of large-scale brain functional networks during
propofol-induced loss of consciousness. J Neurosci 32: 1283212840.
6. Alkire M, Haier R, Barker S, Shah N, Wu J, et al. (1995) Cerebral metabolism
during propofol anesthesia in humans studied with positron emission
tomography. Anesthesiology 82: 393–403.
7. Langso J, Alkire M, Kaskinoro K, Hayama H, Maksimow A, et al. (2012)
Returning from oblivion: imaging the neural core of consciousness. J Neurosci
32: 4935–4943.
8. John E, Prichep L, Kox W, Valdes-Sosa P, Bosch-Bayard J, et al. (2001)
Invariant reversible QEEG effects of anesthetics. Conscious Cogn 10: 165–183.
9. Murphy M, Bruno M, Riedner B, Boveroux P, Noirhomme Q, et al. (2011)
Propofol anesthesia and sleep: A high-density EEG study. Sleep 34: 283–291.
10. Tinker J, Sharbrough F, Michenfelder J (1977) Anterior shift of the dominant
EEG rhytham during anesthesia in the java monkey: Correlation with anesthetic
potency. Anesthesiology 46: 252–259.
11. Jevtovic-Todorovi V, Todorovic S, Mennerick S, Powell S, Dikranian K, et al.
(1998) Nitrous oxide (laughing gas) is an NMDA antagonist, neuroprotectant
and neurotoxin. Nat Med 4: 460–463.
12. Rudolph U, Antkowiak B (2004) Molecular and neuronal substrates for general
anaesthetics. Nat Rev Neuro 5: 709–720.
13. Perouansky M, Pearce R, Hemmings Jr H (2010) Inhaled anesthetics:
mechanisms of action. In: Miller R, editor, Miller’s Anesthesia 7th ed. Vol. 1,
Churchill Livingstone Elsevier, Philadelphia. pp. 515–538.
14. Foster B, Liley D (2011) Nitrous oxide paradoxically modulates slow
electroencephalogram oscillations: Implications for anesthesia monitoring.
Anesth Analg 113: 758–765.
15. Yamamura T, Fukuda M, Takeya H, Goto Y, Furukawa K (1981) Fast
oscillatory EEG activity induced by analgesic concentrations of nitrous oxide.
Anesth Analg 60: 283–288.
16. Field L, Dorrance D, Krzeminska E, Barsoum L (1993) Effect of nitrous oxide on
cerebral blood ow in normal humans. Br J Anaesth 70: 154–159.
17. Reinstrup P, Ryding E, Ohlsson T, Sandell A, Erlandsson K, et al. (2008)
Regional cerebral metabolic rate (positron emission tomography) during
inhalation of nitrous oxide 50% in humans. Br J Anaesth 100: 66–71.
18. Brown E, Purdon P, Van Dort C (2011) General anesthesia and altered states of
arousal: a systems neuroscience analysis. Annu Rev Neurosci 34: 601–628.
19. Hahn C, Wang H, Cho D, Talbot K, Gur R, et al. (2006) Altered neuregulin
1erbB4 signaling contributes to NMDA receptor hypofunction in schizophrenia.
Nat Medicine 12: 824–828.
20. Stephan K, Baldeweg T, Friston K (2006) Synaptic plasticity and dysconnection
in schizophrenia. Biol Psychiatry 59: 929–939.
21. Murrough J, Charney D (2010) Lifting the mood with ketamine. Nat Medicine
16: 1384–5.
22. Cimenser A, Purdon P, Pierce E, Walsh J, Salazar-Gomez A, et al. (2011)
Tracking brain states under general anesthesia by using global coherence
analysis. Proc Natl Acad Sci USA 108: 8832–8837.
23. Foster BL, Liley DT (2012) Effects of nitrous oxide sedation on resting
electroencephalogram topography. Clin Neurophysiol : doi:10.1016/
j.clinph.2012.08.007.
24. Delorme A, Makeig S (2004) EEGlab: an open source toolbox for analysis of
single-trial EEG dynamics including independent component analysis. J Neurosci
Methods 134: 9–21.
25. Nunez P, Srinivasan R (2006) Electric Fields of the Brain: The Neurophysics of
EEG. New York: Oxford Univ Press.
26. Bullmore E, Sporns O (2009) Complex brain networks: graph theoretical
analysis of structural and functional systems. Nat Rev Neuro 10: 186–198.
27. Mitra P, Bokil H (2008) Observed Brain Dynamics. New York: Oxford Univ
Press.
28. Jelles B, Scheltens P, van der Flier W, Jonkman E, da Silva F, et al. (2008) Global
dynamical analysis of the EEG in alzheimer’s disease: frequency-specific changes
of functional interactions. Clin Neurophysiol 119: 837–841.
29. Zhou XH, Obuchowski N, McClish D (2002) Statistical Methods in Diagnostic
Medicine. New York: Wiley & Sons.
30. Gorunescu F (2011) Data Mining: Concepts, Models and Techniques. New
York: Springer.
31. Schreiber T, Schmitz A (2000) Surrogate time series. Physica D 142: 346–82.
32. Muller M, Baier G, Rummel C, Schindler K (2008) Estimating the strength of
genuine and random correlations in non-stationary multivariate time series. Eur
Phys Lett 84: 10009.
33. Rummel C, Muller M, Baierd G, Amora F, Schindler K (2010) Analyzing
spatio-temporal patterns of genuine cross-correlations. J Neurosci Methods 191:
94–100.
34. Bokil H, Andrews P, Kulkarni J, Mehta S, Mitra P (2010) Chronux: A platform
for analyzing neural signals. J Neurosci Methods 192: 146151.
Functional Networks under Nitrous Oxide
PLOS ONE | www.plosone.org 16 February 2013 | Volume 8 | Issue 2 | e56434
35. Percival D, Walden A (1993) Spectral Analysis for Physical Applications:Multitaper and Conventional Univariate Techniques. New York: CambridgeUniv Press.
36. Jain A (1989) Fundamentals of Digital Image Processing. Englewood Cliffs:Prentice Hall.
37. Campagna J, Miller K, Forman S (2003) Mechanisms of actions of inhaledanesthetics. N Engl J Med 348: 2110–2124.
38. Franks N, Lieb W (1994) Molecular and cellular mechanisms of generalanaesthesia. Nature 367: 607–614.
39. Deshpandea G, Kerssens C, Sebel P, Hu X (2010) Altered local coherence in thedefault mode network due to sevourane anesthesia. Brain Res 1318: 110–121.
40. Greicius M, Kiviniemi V, Tervonen O, Vainionpaa V, Alahuhta S, et al. (2008)Persistent defaultmode network connectivity during light sedation. Hum BrainMapp 29: 839–847.
41. Ku SW, Lee U, Noh GJ, Jun IG, Mashour G (2011) Preferential inhibition offrontal-to-parietal feedback connectivity is a neurophysiologic correlate ofgeneral anesthesia in surgical patients. PLoS ONE 6: e25155. doi:10.1371/journal.pone.0025155.
42. Barrett A, Murphy M, Bruno M, Noirhomme Q, Boly M, et al. (2012) Grangercausality analysis of steady-state electroencephalographic signals duringpropofol- induced anaesthesia. PLoS ONE 7: e29072.doi:10.1371/journal.-pone.0029072.
43. Fitzgibbon S, Lewis T, Powers D, Whitham E, Willoughby J, et al. (2012)Surface laplacian of central scalp electrical signals is insensitive to musclecontamination. IEEE Trans Biomed Eng Apr 20: Epub ahead of print.
44. Messner M, Beese U, Romstock J, Dinkel M, Tschaikowsky K (2003) Thebispectral index declines during neuromuscular block in fully awake persons.Anesth Analg 97: 488–491.
45. Rampil I, Jin-Soo K, Lenhardt R, Negishi C, Sessler D (1998) Bispectral eeg
index during nitrous oxide administration. Anesthesiology 89: 671–7.
46. Sanders R, Tononi G, Laureys S, Sleigh J (2012) Unresponsiveness [not equal
to] unconsciousness. Anesthesiology 116: 946–959.
47. Hornbein T, Eger E, Winter P, Smith G, Wetstone D, et al. (1982) The
minimum alveolar concentration of nitrous oxide in man. Anesth Analg 61:
553–556.
48. Katoh T, Suguro Y, Kimura T, Ikeda K (1993) Cerebral awakening
concentration of sevourane and isourane predicted during slow and fast alveolar
washout. Anesth Analg 77: 1012–1017.
49. Lagerlund T, Worrell G (2005) EEG source localisation (model dependent and
model independent methods). In: Niedermyer E, Lopes da Silva F, editors,
Electroencephalography: Basic Principles, Clinical Applications and Related
Fields 5th ed, Williams & Wilkins, Philadelphia. pp. 829–844.
50. Deng S, Winter W, Thorpe S, Srinivasan R (2012) Improved surface laplacian
estimates of cortical potential using realistic models of head geometry. IEEE
Trans Biomed Eng Jan 11: Epub ahead of print.
51. Tandonnet C, Burle B, Hasbroucq T, Vidal F (2005) Spatial enhancement of
EEG traces by surface laplacian estimation: comparison between local and
global methods. Clin Neurophysiol 116: 18–24.
52. Schoffelen J, Gross J (2009) Source connectivity analysis with meg and eeg. Hum
Brain Map 30: 1857–1865.
53. Fein G, Raz J, Brown F, Merrin E (1988) Common reference coherence data are
confounded by power and phase effects. Electro Clin Neurophysiol 69: 581–584.
54. Nolte G, Bai O, Wheaton L, Mari Z, Vorbach S, et al. (2004) Identifying true
brain interaction from eeg data using the imaginary part of coherency. Clin
Neurophysiol 115: 22922307.
Functional Networks under Nitrous Oxide
PLOS ONE | www.plosone.org 17 February 2013 | Volume 8 | Issue 2 | e56434
Copyright © 2022 FDOKUMEN