Nitrogen enrichment and the emission of nitrous oxide from streams
15
Nitrogen enrichment and the emission of nitrous oxide from streams Helen M. Baulch, 1,2 Sherry L. Schiff, 3 Roxane Maranger, 4 and Peter J. Dillon 5 Received 1 February 2011; revised 9 August 2011; accepted 12 September 2011; published 15 December 2011. [1] Nitrous oxide (N 2 O) is a potent greenhouse gas produced during nitrogen cycling. Global nitrogen enrichment has resulted in increased atmospheric N 2 O concentrations due in large part to increased soil emissions. There is also a potentially important flux from streams, rivers and estuaries; although measurements of these emissions are sparse, and role of aquatic ecosystems in global N 2 O budgets remains highly uncertain. Using the longest-term measurements of N 2 O fluxes from streams to date, we found annual fluxes from 14 sites in five streams of south-central Ontario, Canada varied widely–from net uptake of 3.2 ± 0.2 (standard deviation) mmol N 2 Om −2 d −1 to net release of 776 ± 61 mmol N 2 Om −2 d −1 .N 2 O consumption was associated with very low nitrate concentrations (<2.7 mM). Mean annual (log-transformed) N 2 O emissions from our study streams (across sites and years) were positively related to nitrate concentrations (r 2 = 0.59).This nitrate-N 2 O relationship can be generalized across all 20 streams (in Canada, Japan, Mexico, and the midwestern United States) for which published data now exist and could provide a new basis for the IPCC to calculate agricultural emissions from streams. In addition to predicting annual emissions, we present the first measurements of N 2 O concentrations under ice in streams. Nitrate was a strong predictor of N 2 O % saturation during periods of ice cover (r 2 = 0.89), when gas exchange is negligible. Given the small surface area of streams within a catchment and the fact our measured areal fluxes are comparable to reported fluxes from agricultural soils, this suggests streams are a small regional N 2 O source. Citation: Baulch, H. M., S. L. Schiff, R. Maranger, and P. J. Dillon (2011), Nitrogen enrichment and the emission of nitrous oxide from streams, Global Biogeochem. Cycles, 25, GB4013, doi:10.1029/2011GB004047. 1. Introduction [2] Human alterations of the nitrogen (N) cycle have led to increased atmospheric concentrations of nitrous oxide (N 2 O), an important greenhouse gas, and contributor to stratospheric ozone depletion [Ravishankara et al., 2009]. Much work has been dedicated to quantifying N 2 O fluxes from soils, but fluxes from aquatic sources are still poorly characterized. This poor knowledge of aquatic fluxes continues despite the twofold to twentyfold increase in riverine N concentrations in numerous regions [Vitousek et al., 1997], the prediction that N-loading will continue to increase [Tilman et al., 2001], observed relationships between N concentrations and N 2 O production [Firestone and Davidson, 1989], and models of the global N 2 O budget that suggest rivers, streams and estu- aries are large emissions sources [Intergovernmental Panel on Climate Change (IPCC), 2006; Beaulieu et al., 2010a] particularly in the northern hemisphere [Seitzinger and Kroeze, 1998]. [3]N 2 O is produced as a result of nitrification and deni- trification. Denitrification is the sequential reduction of N oxides to N gases (NO 3 − → NO 2 − → NO → N 2 O → N 2 ). N 2 O is a free intermediate in the denitrification pathway, and can be both produced and consumed in the process [Zumft, 1997]. N 2 O is also produced via nitrification as a conse- quence of the oxidation of the intermediate hydroxylamine, or, in the pathway termed nitrifier-denitrification, where organisms that oxidize ammonium to nitrate may also carry out the reduction of nitrite to N 2 O or N 2 [Stein and Yung, 2003; Wrage et al., 2001]. N 2 O emissions are a function both of rates of nitrification and denitrification, and the N 2 O yields of these processes (N 2 O:NO 3 − and N 2 O:N 2 respec- tively) [Firestone and Davidson, 1989]. [4] Simple relationships between rates of N cycling and rates of N 2 O emissions may not exist [Beaulieu et al., 2008] due to variable N 2 O yields and variable contributions of nitrification and denitrification to emissions. However, 1 Environmental and Life Sciences Graduate Program, Trent University, Peterborough, Ontario, Canada. 2 Now at School of Environment and Sustainability and Global Institute for Water Security, University of Saskatchewan, Saskatoon, Saskatchewan, Canada. 3 Department of Earth and Environmental Sciences, University of Waterloo, Waterloo, Ontario, Canada. 4 Département de Sciences Biologiques, Université de Montréal, Montreal, Quebec, Canada. 5 Department of Environmental and Resource Studies, Trent University, Peterborough, Ontario, Canada. Copyright 2011 by the American Geophysical Union. 0886-6236/11/2011GB004047 GLOBAL BIOGEOCHEMICAL CYCLES, VOL. 25, GB4013, doi:10.1029/2011GB004047, 2011 GB4013 1 of 15
Transcript of Nitrogen enrichment and the emission of nitrous oxide from streams

Nitrogen enrichment and the emission of nitrous oxidefrom streams
Helen M. Baulch,1,2 Sherry L. Schiff,3 Roxane Maranger,4 and Peter J. Dillon5
Received 1 February 2011; revised 9 August 2011; accepted 12 September 2011; published 15 December 2011.
[1] Nitrous oxide (N2O) is a potent greenhouse gas produced during nitrogen cycling.Global nitrogen enrichment has resulted in increased atmospheric N2O concentrations duein large part to increased soil emissions. There is also a potentially important flux fromstreams, rivers and estuaries; although measurements of these emissions are sparse, androle of aquatic ecosystems in global N2O budgets remains highly uncertain. Using thelongest-term measurements of N2O fluxes from streams to date, we found annual fluxesfrom 14 sites in five streams of south-central Ontario, Canada varied widely–from netuptake of 3.2 ± 0.2 (standard deviation) mmol N2O m−2 d−1 to net release of 776 ± 61 mmolN2O m−2 d−1. N2O consumption was associated with very low nitrate concentrations(<2.7 mM). Mean annual (log-transformed) N2O emissions from our study streams (acrosssites and years) were positively related to nitrate concentrations (r2 = 0.59).This nitrate-N2Orelationship can be generalized across all 20 streams (in Canada, Japan, Mexico, and themidwestern United States) for which published data now exist and could provide a newbasis for the IPCC to calculate agricultural emissions from streams. In addition to predictingannual emissions, we present the first measurements of N2O concentrations under ice instreams. Nitrate was a strong predictor of N2O % saturation during periods of ice cover(r2 = 0.89), when gas exchange is negligible. Given the small surface area of streams withina catchment and the fact our measured areal fluxes are comparable to reported fluxes fromagricultural soils, this suggests streams are a small regional N2O source.
Citation: Baulch, H. M., S. L. Schiff, R. Maranger, and P. J. Dillon (2011), Nitrogen enrichment and the emission of nitrousoxide from streams, Global Biogeochem. Cycles, 25, GB4013, doi:10.1029/2011GB004047.
1. Introduction
[2] Human alterations of the nitrogen (N) cycle have led toincreased atmospheric concentrations of nitrous oxide (N2O),an important greenhouse gas, and contributor to stratosphericozone depletion [Ravishankara et al., 2009]. Much work hasbeen dedicated to quantifying N2O fluxes from soils, butfluxes from aquatic sources are still poorly characterized.This poor knowledge of aquatic fluxes continues despite thetwofold to twentyfold increase in riverine N concentrations innumerous regions [Vitousek et al., 1997], the prediction thatN-loading will continue to increase [Tilman et al., 2001],
observed relationships between N concentrations and N2Oproduction [Firestone and Davidson, 1989], and models ofthe global N2O budget that suggest rivers, streams and estu-aries are large emissions sources [Intergovernmental Panelon Climate Change (IPCC), 2006; Beaulieu et al., 2010a]particularly in the northern hemisphere [Seitzinger andKroeze, 1998].[3] N2O is produced as a result of nitrification and deni-
trification. Denitrification is the sequential reduction of Noxides to N gases (NO3
− → NO2− → NO → N2O → N2).
N2O is a free intermediate in the denitrification pathway, andcan be both produced and consumed in the process [Zumft,1997]. N2O is also produced via nitrification as a conse-quence of the oxidation of the intermediate hydroxylamine,or, in the pathway termed nitrifier-denitrification, whereorganisms that oxidize ammonium to nitrate may also carryout the reduction of nitrite to N2O or N2 [Stein and Yung,2003; Wrage et al., 2001]. N2O emissions are a functionboth of rates of nitrification and denitrification, and the N2Oyields of these processes (N2O:NO3
− and N2O:N2 respec-tively) [Firestone and Davidson, 1989].[4] Simple relationships between rates of N cycling and
rates of N2O emissions may not exist [Beaulieu et al., 2008]due to variable N2O yields and variable contributions ofnitrification and denitrification to emissions. However,
1Environmental and Life Sciences Graduate Program, Trent University,Peterborough, Ontario, Canada.
2Now at School of Environment and Sustainability and Global Institutefor Water Security, University of Saskatchewan, Saskatoon, Saskatchewan,Canada.
3Department of Earth and Environmental Sciences, University ofWaterloo, Waterloo, Ontario, Canada.
4Département de Sciences Biologiques, Université de Montréal,Montreal, Quebec, Canada.
5Department of Environmental and Resource Studies, Trent University,Peterborough, Ontario, Canada.
Copyright 2011 by the American Geophysical Union.0886-6236/11/2011GB004047
GLOBAL BIOGEOCHEMICAL CYCLES, VOL. 25, GB4013, doi:10.1029/2011GB004047, 2011
GB4013 1 of 15

current methods to estimate global emissions are based uponsuch assumptions [IPCC, 2006; Seitzinger and Kroeze,1998]. While controls on rates of nitrification and denitrifi-cation are well characterized in aquatic ecosystems (Table 1),factors affecting the N2O yields of these processes are notwell known, and much of our knowledge of these yieldscomes from terrestrial ecosystems. In streams, denitrificationis typically limited by nitrate (NO3
−) concentrations [Garcia-Ruiz et al., 1998a]. Increased concentrations of NO3
− maycontribute to higher N2O:N2, although recent evidence suggeststhis ratio is smaller in aquatic ecosystems than in terrestrialecosystems (Table 1) [Beaulieu et al., 2010a]. Nitrification ratesare often stimulated by the addition of ammonium [Strausset al., 2002], although N2O yields may not be affected [Jiangand Bakken, 1999]. A suite of other factors can also affectrates of N2O production via effects on N cycling, N2O yields,or both (Table 1). Importantly, many of these factors varyover annual periods. As a result, the assessment of theimportance of streams in N2O emissions requires study overrelatively long (annual or multiannual) timescales.[5] In this study, we report rates of N2O emissions from
five small streams. Small streams are thought to be hot spotsof nitrogen cycling [Alexander et al., 2000] and can remove alarge proportion of nutrient inputs [Wollheim et al., 2006],hence may be important sites of N2O emissions. We assesspredictors of daily and annual N2O fluxes, and then broadenour analysis using annual flux estimates from published data.We used data from periods of ice cover to assess N2Odynamics during periods of negligible gas exchange anddetermine whether predictors of N2O concentration underice differ from predictors of flux in the open water season.Finally, although streams are typically thought to be sourcesof N2O, we identify conditions under which net N2O con-sumption occurs.
2. Materials and Methods
2.1. Study Sites
[6] We studied five streams in southern Ontario, Canada(Figure 1). We sampled 2–4 sites per stream to help accountfor high spatial variability that has been reported in paststudies [e.g., Reay et al., 2003]. Our sampling started inJune 2006, and spans a 29-month period, but with reducedsampling in winter and at some sites. All samples wereobtained during daylight. The shortest sampling period(June 2006 to November 2007) was in Stouffville Creek.This is a third order stream (Strahler) in a mixed urban-agricultural catchment. A flood control reservoir is locatedupstream of our sampling sites. The remaining four streamswere sampled from June 2006 through the winter of 2007–2008. In a subset of sites, we extended our sampling untilOctober 2008. The 2008 data, while not reflecting our fullsuite of sites, allow us to contrast between conditions inunusually dry years (2006, 2007) and a year of recordprecipitation (2008).[7] In addition to the urban-agricultural stream which has
a mixture of sand and rocky substrates and a mean depth of0.2 m, our study sites include Layton Creek (stream-wetlandcomplex with a highly organic substrate, second to thirdorder at our sampling sites, depth = 0.4 m), the Black River(sandy substrate, fourth to fifth order, depth = 0.3 m),Mariposa Brook (silt-rocky substrate fourth order, depth =
0.4 m) and Jackson Creek (sandy substrate upstream, rockymid and downstream, third to fourth order, depth = 0.4 m).The Jackson Creek sites include one site upstream of a majorwetland complex, and two that are located at different dis-tances downstream of the wetland.
2.2. Physicochemical Parameters
[8] We measured a variety of chemical parameters includ-ing ammonium (NH4
+), organic N, dissolved organic carbon(DOC) and sulphate (SO4
2−) concentrations (Table 2). In allcases, we have a measurement of NO3
− + nitrite (NO2−)
which we abbreviate as NO2+3−. Starting in May 2007 we
also measured NO2− separately. N2O samples were obtained
in serum bottles sealed with a butyl-rubber stopper, andpreserved with mercuric chloride (Table 2). Concentrationswere determined using GC-ECD on a Varian CP-3800 gaschromatograph following headspace equilibration. Headspaceconcentrations were standardized using a series of certifiedstandards (100, 500, 1000 and 10,000 ppbv; Matheson Tri-gas,Praxair), then concentrations in water and percent saturationwere determined using solubility equations [Weiss and Price,1980]. During the ice-free season, discharge was measuredusing the velocity-area method and a Swoffer 2100 velocitymeter. Periods of ice cover were based on direct observation,and are estimated to be accurate within one week.
2.3. Dissolved Gas Fluxes
[9] We estimated gas fluxes using the two-layer modelof diffusive gas exchange [Liss and Slater, 1974]. Posi-tive numbers indicate a net flux from the stream to theatmosphere:
N2Oflux ¼ k CL − CSð Þ ð1Þ
where k is the gas exchange velocity. This is equal to the gastransfer coefficient (K, in units of d−1) times stream depth. CS
is saturation concentration of N2O, and CL is the measuredN2O concentration.[10] Saturation N2O concentrations were calculated using
the solubility equations ofWeiss and Price [1980], assumingconstant atmospheric mixing ratios of 320 ppbv. N2O is wellmixed in the atmosphere due to its long lifetime [Stein andYung, 2003]. The use of a single CL is dependent upon theassumption that the streams are well mixed, and variation inN2O concentrations across the stream channel is negligible.At low flow, variation in N2O concentrations across ourstudy channels (6%) was approximately equal to analyticalerror (5%).[11] We measured rates of gas transfer via the addition of a
gas tracer (sulphur hexafluoride; analysis by GC-ECD as forN2O) and conservative tracer [Kilpatrick et al., 1987], as wellas diel oxygen (O2) curves [Venkiteswaran et al., 2007,2008]. Briefly the O2 method uses an O2 mass balancemodel, and iteratively fits the data (in Matlab©) using adefined range of possible rates of photosynthesis, respiration(both 0–5000 mg O2 m
−2 h−1) and gas exchange velocities(0.01–0.50 m h−1) to obtain the lowest sums of squaresbetween measured and modeled data. The model was re-run15 times with different randomly selected starting points foreach diel time series. Model results where r2 between mod-eled and observed data was >0.80 were averaged to obtain
BAULCH ET AL.: NITROUS OXIDE EMISSIONS FROM STREAMS GB4013GB4013
2 of 15

Tab
le1.
PossibleEffectsof
Chang
esin
Env
iron
mentalCon
ditio
nson
Rates
ofN
Cyclin
g,N2O
Yields,andN2O
Produ
ctiona
Env
iron
mentalChang
eRateAffected
Chang
ein
Rate
Effectson
N2O
Yield
bResultin
gEffects
onN2O
Produ
ction
Increasednitrate
Denitrification
Increase
[Beaulieuet
al.,20
10a;
Garcia-Ruizet
al.,
1998
b;Inwoo
detal.,20
05;K
empan
dDod
ds,2
002;
Martin
etal.,20
01;Richa
rdsonet
al.,20
04;
Silvenno
inen
etal.,20
08b]
Increase
[Silvenno
inen
etal.,20
08b]
Increase
Noeffect
[Beaulieuet
al.,20
10a]
Increasedam
mon
ium
Nitrification
Increase
[Kem
pan
dDod
ds,20
02;Straussan
dLam
berti,20
00;Strausset
al.,20
02]
Decrease,or
noeffect
[Jiang
andBakken,
1999
]cPossibleincrease
Noeffect
[Strau
sset
al.,20
04]
Increaseddissolvedorganiccarbon
Denitrification
Increase
[Richa
rdsonet
al.,20
04]
Decrease[W
eier
etal.,19
93]c
Unk
nown
Nitrification
Decrease[Bernh
ardt
andLikens,20
02;Straussan
dLam
berti,20
00;Strausset
al.,20
02]
Unk
nown/
noeffectd
Unk
nown
Noeffect
[Strau
sset
al.,20
02;Strausset
al.,20
04]
Increasedtemperature
Denitrification
Increase
tomaxim
um[Silvenno
inen
etal.,20
08a]
Decrease[Silvenno
inen
etal.,20
08a]
Unk
nown
Increase
[Garcia-Ruizet
al.,19
98b;
Martin
etal.,
2001
]Noeffect
[Martin
etal.,20
01]
Nitrification
Increase
[Starryet
al.,20
05]
Decrease[M
aagan
dVinther,19
96]c
Unk
nown
Noeffect
[Kem
pan
dDod
ds,20
02]
Increasedox
ygen
Denitrification
Decrease[Kem
pan
dDod
ds,20
02;
Silvenno
inen
etal.,20
08a]
Depends
ontemperature,rang
eof
O2
[Silvenno
inen
etal.,20
08a]
Unk
nown
Increase
[Cavigellian
dRob
ertson
,20
00]c,
[Betlach
andTiedje,19
81]c,[W
eier
etal.,19
93]c
Nitrification
Increase
[Kem
pan
dDod
ds,20
02]
Decrease[G
oreauet
al.,19
80]c;
[Kha
lilet
al.,20
04]c
Unk
nown
IncreasedpH
Denitrification
Increase
[Mülleret
al.,19
80]c
Decrease[Cavigellian
dRob
ertson
,20
00]c,
[Martikainen,
1985
]cUnk
nown
Max
atpH
6.5[Stevens
etal.,19
98]c
Nitrification
Max
atpH
7.5[Strau
sset
al.,20
02]
Decrease[Jiang
andBakken,
1999
]cUnk
nown
Max
atpH
8.5([Warwick,19
86]–
note
review
c )
a Where
indicated,
weciteresults
from
stud
iesperformed
inecosystemsotherthan
riversor
stream
s.bNitrification:
N2O:NO3− ,denitrificationN2O:N
2.
c Ind
icates
anecosystem
otherthan
ariveror
stream
.dIftheDOCaffectsnitrificationratesby
increasing
competitionforNH4+[Strau
ssetal.,20
02],no
effectson
N2O:NO3−may
beexpected.
BAULCH ET AL.: NITROUS OXIDE EMISSIONS FROM STREAMS GB4013GB4013
3 of 15

the k value. These multiple results varied by an average of0.006% (coefficient of variation (CV); maximum CV was0.02%). Model results constrained by O2 isotopes, and wherethe model was run without these data varied by <1% to ∼4%.Rates of gas transfer were normalized to stream temperature[Thomann and Mueller, 1987] and N2O using Schmidtnumber scaling [Wanninkhof, 1992] assuming an exponentof 2/3 which reflects smooth surfaces.[12] We have at least one measurement of gas transfer
velocity per site, with the exception of the downstream siteon the Black River, which we assume (based on similarsubstrate, depth and velocity relationships) to parallel theupstream site. The downstream site on Jackson Creek hasdifferent substrate and is shallower than either of the otherstudy sites, so lacking a reliable estimate of gas transfervelocity we exclude this site from flux estimates.[13] Seasonal changes in stream depth and velocity can
contribute to variability in gas exchange. Numerous approa-ches to address this issue have been used. Beaulieu et al.[2008] developed a gas transfer model in one stream, andapplied this model across several streams with similar slopeand substrate. In a group of Mexican streams, a measurement
of gas transfer velocity in one stream was applied across sev-eral streams, and comparisons were made with chambermethods [Harrison and Matson, 2003]. In this study wecalibrate gas transfer models to our study streams using anapproach based on the ratio of measured to model-predictedgas transfer coefficients [Moog and Jirka, 1998]. The cal-culation is presented in its original form (equation (2)) usingthe gas transfer coefficient (K, which is equal to gasexchange velocity divided by depth) [Moog and Jirka, 1998]:
KPC ¼ ∑ Km=Kp
� �n
� �Kp ð2Þ
where KPC is the calibrated prediction, Km is the measuredgas transfer coefficient, Kp is the predicted gas transfercoefficient under measurement conditions and n reflectsthe number of measurements. We selected the models ofO’Connor and Dobbins [1958], Owens et al. [1964], andBennett and Rathburn [1972], which were developed forconditions similar to those of our study streams [Cox,2003]. Our flux estimates are based on equation (1), using
Figure 1. Study catchments in Ontario, Canada (area of detailed map is shown as inset). Clockwise frombottom catchments are Stouffville Creek, Black River, Layton Creek (smaller adjacent to Mariposa),Mariposa Brook (larger adjacent to Layton), and Jackson Creek. Sampling sites are shown as white dotswith the most upstream site as 1, and increasing numbers downstream. The approximate overall directionof flow is indicated with an arrow.
BAULCH ET AL.: NITROUS OXIDE EMISSIONS FROM STREAMS GB4013GB4013
4 of 15

the three estimated KPC values based on these three models,and 1–4 measurements of gas transfer velocity per stream(Figure 2).[14] We assessed whether tile drains present in the catch-
ments of three of our study streams (Layton Creek, BlackRiver, and Mariposa Brook) were likely to affect gas con-centrations using a first-order gas loss equation [Chapra anddi Toro, 1991] to define the length of reach over which 95%of the gases input by a tile drain will be dissipated:
Dist5% ¼ 3v
KPCð3Þ
where v is stream velocity, KPC is the calibrated gas transfercoefficient, Dist5% is the distance at which 5% of the gaseswill remain in solution.[15] Based on this relationship, tile drains in Layton Creek
and the Black River are sufficiently far from our samplingsites that they will not affect gas dynamics. Mariposa Brookhas numerous tile drains which affect our measured fluxes atall sites. Gas dynamics at the most upstream sampling site ofStouffville Creek are affected by an upstream flood controlreservoir. Impacts are also consistently evident at the secondsite downstream, but not at the two sites located furtherdownstream.[16] Distance between sampling sites varied, but on aver-
age sites were separated by 5 km. Based on criteria describedin equation (3), the distance between sites was sufficientlylong that the vast majority (>95%) of gases were emittedprior to passage to adjacent downstream sites. However,in Stouffville Creek, gas concentrations at the second sitewere periodically influenced by the adjacent upstream site.[17] We estimated time-weighted yearly fluxes for each
site and each year. Time-weighted fluxes were calculatedby averaging the instantaneous flux at the start and end of
a sampling interval, multiplying this measurement by theduration of the sampling interval, then summing results for a365 day period. 13–22 flux measurements were used in eachannual flux estimate. We assumed no emissions occurredduring periods of complete ice cover [Macdonald et al., 1991].[18] We then calculated the mean flux for a stream across
years and sites. Annual fluxes were calculated as describedfor 365 day periods ranging from June 2006–2007, June2007–2008 and October 2006–2007 and October 2007–2008for all sites where we had data. Recognizing the overlap insome annual estimates, we took the mean of any overlappingannual periods, and then the mean within a site (across years),then finally, the mean of sites within a stream.[19] We excluded the third site on Mariposa Brook from
our mean stream flux estimates because of concern that highfluxes of N2O are not indicative of the study reach. Due toaccess limitations at this site we measured gas transfervelocity downstream of our sampling site. While this reflectsa real flux, it appears to reflect N2O accumulated in a deeper,slow-flowing upstream section, then degassed as it passesthrough this more turbulent downstream riffle.
2.4. Statistical Analyses
[20] We used best-subset multiple linear regression(SYSTAT 13.0) to develop models of annual N2O flux basedon stream chemistry (NO2+3
−, NH4+, total phosphorus [TP],
DOC), accepting models where DAIC was ≤2 (from theminimum AIC).[21] Next, we compiled N2O flux and NO3
− concentrationdata from all published studies of streams where annualvalues were reported. Although discharge, depth, velocityand stream order were not reported, all of the streams asses-sed were small streams. Discharge in these systems (wherereported) was typically <2 m3 s−1 [Baulch, 2009]. Where
Table 2. Analytical Methods
Summary of Method Sample Bottles, Treatment
NO2+3− (Nitrate + nitrite) Reduction to nitrite (using heated hydrazine in an
alkaline solution catalyzed by Cu2+) and subsequentanalysis using the red azo dye method [Ministry ofthe Environment, 2001b]
Filtered (pre-ashed, B-pure leached GFFs)500 mL PET bottles
Nitrite (NO2−) As for NO2+3
−, but without prior reduction. As aboveNitrate (NO3
−) NO2+3− minus NO2
− As aboveAmmonium (NH4
+) Indophenol blue method (in buffered alkaline solution,[Ministry of the Environment, 2001b]
As above
Organic nitrogen Analysis as total Kjeldahl nitrogen (TKN) minusammonium nitrogen. TKN involves high temperaturedigestion with sulphuric acid, hydrochloric acid andpotassium sulphate followed by neutralization andanalysis using the phenate-hypochlorite method[Ministry of the Environment, 2001a]
As above
Dissolved organic carbon (DOC) Oxidative combustion-infrared analysis (ShimadzuTOC-V analyzer)
As above
N2O Triplicate equilibrations of subsamples in air-filledExetainer vials (Labco Ltd., BuckinghamshireEngland) with known volumes. Samples were shakenfor 90 min at 120 rpm (VWR orbital shaker),weighed, and the headspace was analyzed using GC(Varian CP-3800)-ECD following separation on aHayesep D column.
125 mL serum bottles sealed with pre-baked butylrubber stoppers, preserved with 0.4mL saturatedmercuric chloride solution
Sulphate (SO42−) Ion chromatography (Dionex) Unfiltered, 500 mL PET bottles
Chloride (Cl−) Ion chromatography (Dionex) Unfiltered, 500 mL PET bottlesTotal phosphorus (TP) Ammonium-molybdate-stannous chloride method
[Ministry of the Environment, 1994]Glass vials
BAULCH ET AL.: NITROUS OXIDE EMISSIONS FROM STREAMS GB4013GB4013
5 of 15

Figure 2. Solute concentrations, flow and KPC. Sites are shown from (left) the most upstream site to(right) the most downstream site in a stream. Box shows median ice-free season data bounded by 25thand 75th percentiles. Whiskers show the 10th and 90th percentiles. Dots indicate outliers. White trianglesshow concentrations from periods of complete or partial ice cover. Data plotted are (a) N2O % saturation(the horizontal dashed line indicates 100% saturation), (b) discharge, (c) N2O concentration, (d) KPC (meanof 3 models, values for N2O at stream temperature); white circles on KPC plot show measured KN2O values(at 20°C), (e–k) nutrients and other solutes. The Mariposa Brook data are truncated in the plot of % satu-ration. Outliers at the most upstream site (1700% saturation) and most downstream site (1630% saturation)are not shown.
BAULCH ET AL.: NITROUS OXIDE EMISSIONS FROM STREAMS GB4013GB4013
6 of 15
necessary, N2O flux and NO3− concentration data were dig-
itized from figures (using Engauge Digitizer 3.0). Literaturedata were combined with the results of this study and simplelinear regression was used to determine whether N2O fluxeswere related to concentrations of NO3
−. Data were log-transformed if necessary to meet the assumptions of statisti-cal analyses.[22] In addition to assessing predictors on an annual scale,
we report simple correlations between daily fluxes and eachvariable across study period within our five study streams. Aswell, to identify predictors of under-ice N2O concentrations,we used best subset multiple linear regression, (Systat 13.0;using NO2+3
−, NH4+, TP, organic N, SO4
2− and DOC data)and thresholds noted previously (DAIC ≤ 2). Data were
restricted to periods where upstream ice coverage was 90–100% complete (average cover was 99%) to restrict the datato periods where gas exchange was zero, or extremely low.[23] To further explore the issue of N2O consumption
in Jackson Creek, we used a regression tree to analyze pre-dictors of N2O % saturation among sites and over time. Aregression tree is similar to stepwise regression procedures,but is a nonparametric method that does not assume linearrelationships and is well-suited to analyses where interactioneffects are anticipated, or relationships may vary throughsample space. Data are repeatedly partitioned into twogroups, with each split based on the explanatory variablewhich makes the resulting groups as homogenous as possible[De’ath and Fabricius, 2000]. The analysis results in a graphwhich can be interpreted in a similar fashion to a dichoto-mous key. We applied k-fold cross validation (k = 10), andbased the selection of tree size on minimum cost criteria(lowest cross-validated relative error), regardless of tree size.We report two metrics of model fit, the cross validated rela-tive error, where 0 indicates perfect fit, and 1 is equivalent torandom guessing, and, the re-substitution relative error,which is akin to the coefficient of non-determination (i.e.,1 − r2). The predictive variables available for entry into themodel were: NO2+3
−, NH4+, organic N, DOC, SO4
2−, andtemperature. Statistical analyses were performed using JMP7.0.2, CART Pro V6.0, Systat 8.0 or Systat 13.0. A level ofsignificance of a = 0.10 was applied.
3. Results
3.1. Daily and Annual N2O Fluxes and WaterChemistry
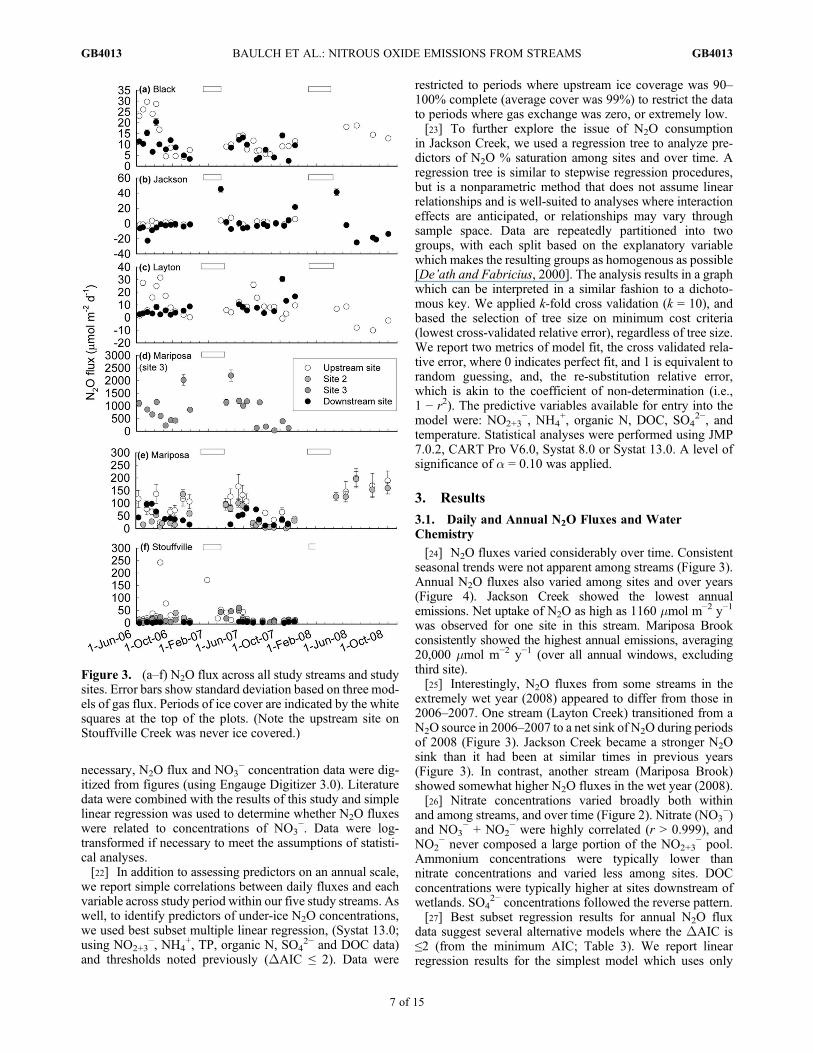
[24] N2O fluxes varied considerably over time. Consistentseasonal trends were not apparent among streams (Figure 3).Annual N2O fluxes also varied among sites and over years(Figure 4). Jackson Creek showed the lowest annualemissions. Net uptake of N2O as high as 1160 mmol m−2 y−1
was observed for one site in this stream. Mariposa Brookconsistently showed the highest annual emissions, averaging20,000 mmol m−2 y−1 (over all annual windows, excludingthird site).[25] Interestingly, N2O fluxes from some streams in the
extremely wet year (2008) appeared to differ from those in2006–2007. One stream (Layton Creek) transitioned from aN2O source in 2006–2007 to a net sink of N2O during periodsof 2008 (Figure 3). Jackson Creek became a stronger N2Osink than it had been at similar times in previous years(Figure 3). In contrast, another stream (Mariposa Brook)showed somewhat higher N2O fluxes in the wet year (2008).[26] Nitrate concentrations varied broadly both within
and among streams, and over time (Figure 2). Nitrate (NO3−)
and NO3− + NO2
− were highly correlated (r > 0.999), andNO2
− never composed a large portion of the NO2+3− pool.
Ammonium concentrations were typically lower thannitrate concentrations and varied less among sites. DOCconcentrations were typically higher at sites downstream ofwetlands. SO4
2− concentrations followed the reverse pattern.[27] Best subset regression results for annual N2O flux
data suggest several alternative models where the DAIC is≤2 (from the minimum AIC; Table 3). We report linearregression results for the simplest model which uses only
Figure 3. (a–f) N2O flux across all study streams and studysites. Error bars show standard deviation based on three mod-els of gas flux. Periods of ice cover are indicated by the whitesquares at the top of the plots. (Note the upstream site onStouffville Creek was never ice covered.)
BAULCH ET AL.: NITROUS OXIDE EMISSIONS FROM STREAMS GB4013GB4013
7 of 15

NO2+3− as a predictor (Table 4), to allow comparison to global
data, where available data do not include all parametersacross all supported models. The predictive capability of thismodel (r2adjusted = 0.59) is equal to the lowest AIC modelwhich is more complex (incorporating NO2+3
−, TP andDOC; r2adjusted = 0.59), and similar to another alternativemodel which incorporates NH4
+ and NO2+3− (r2adjusted =
0.58; Table 3). The relationship between NO2+3− and (log-
transformed) N2O flux is also supported if we include thesite from Mariposa Brook where we believe fluxes exceedtrue values at the reach scale (r2adjusted = 0.80 for 5streams), and exclude Stouffville Creek sites where gasconcentrations are influenced by the reservoir (r2adjusted =0.87 for 5 streams). If we extend our analysis to include allstreams for which there are published annual data, we find asignificant positive relationship between log-transformedNO3
− concentrations and log-transformed N2O flux (Figure 5,Table 4, r2adjusted = 0.39). Exclusion of an outlier noted byBeaulieu et al. [2008] yields a much stronger relationship(Table 4, r2adjusted = 0.61).
Figure 4. Mean flux (tabulated over annual windows) as a function of nitrate concentration during differ-ent annual periods. Error bars represent standard deviation based on predictions of three calibrated gastransfer models. In some cases error bars are smaller than symbols, hence are not visible. Data from the thirdsite on Mariposa Brook are not plotted. These data would lie at 136 mM NO2+3
−, 776 mmol N2O m−2d−1
(spring 06–07) and 122 mM NO2+3−, 679 mmol N2O m−2d−1 (fall 06–07).
Table 3. Results of Best Subset Regression for Variable Selectionto Predict Under-Ice N2O % Saturation and Annual N2O Fluxes
Variables AIC r2adjusted
Annual Flux DataTP, DOC, NO2+3
− 10.2 0.59NO2+3
− 11.7 0.59NH4
+, NO2+3− 11.8 0.58
DOC, NO2+3− 12.2 0.54
TP, NH4+, NO2+3
− 12.2 0.38
Under-Ice DataDOC, NO2+3
− 159.3 0.91DOC, SO4
2−, NO2+3− 159.8 0.91
TP, DOC, SO42−, NO2+3
− 160.2 0.91SO4
2−, NO2+3− 160.5 0.90
Organic N, SO42−, NO2+3
− 160.8 0.90NO2+3
− 161.2 0.89
BAULCH ET AL.: NITROUS OXIDE EMISSIONS FROM STREAMS GB4013GB4013
8 of 15

[28] None of the variables we tested showed consistentcorrelations with daily N2O flux. NO2+3
− (or NO3−) was the
strongest correlate of daily N2O flux across most streamswhile NO2
−, NH4+, DOC and organic N showed significant
correlations in some cases (Table 5).
3.2. Under Ice
[29] The highest N2O % saturation was frequentlyobserved during periods of partial or complete ice cover, andthe highest NO3
− concentrations were almost uniformlyobserved under ice (Figures 2 and 6). Winter NH4
+
concentrations were also in excess of median values.Patterns of other solutes were less distinct, with theexception of SO4
2−, which was frequently near its maximumduring periods of ice cover (Figure 2). Organic N and SO4
2−
showed significant positive correlations with under-ice N2O% saturation (Table 5). Similar to the annual flux data, bestsubset regression results for the under-ice data also showedseveral alternative models were supported (DAIC ≤ 2), all ofwhich included NO2+3
− (Table 3). We present the simplestmodel, which has an r2adjusted of 0.89 (Tables 3 and 4) anduses NO2+3
− as the sole predictor (Table 4).
3.3. Conditions Favoring N2O Consumption
[30] Results of our regression tree analysis suggest thatJackson Creek functions as a N2O sink at NO2+3
− concentra-tions of less than 2.7 mM (Figure 7).While temperatures above3.1°C are also indicated, low temperatures and low NO2+3
−
concentrations never co-occurred. The regression tree alsoindicates that the degree of under-saturation is greatest athigh concentrations of DOC. NO2+3
− enters into the regres-sion tree a second time, predicting lower saturation at NO2+3
−
concentrations of less than or equal to 1 mM, with the modelshowing good fit (Figure 7).[31] Assessing the whole suite of data from all streams,
we find a few exceptions to the proposed 2.7 mM cut-off. Ifwe assess all 29 cases where NO3
− concentrations werebelow 2.7 mM, N2O supersaturation was observed in threecases (112–181% saturation), all of which were at thedownstream site of Jackson Creek. If we instead assess all 23cases where saturation was <85% (this threshold is set to helprestrict the effect of diel temperature variability), we find fourcases with low saturation at NO2+3
− concentrations above2.7 mM. This occurs once in Stouffville Creek (upstream site;NO2+3
− = 35 mM, 79% saturation), once in Layton Creek(NO2+3
− = 8.2 mM, 60% saturation), and twice in JacksonCreek (NO2+3
− = 2.9 mM, 80% saturation; NO2+3− = 35 mM;
80% saturation). In addition to variables identified in the
regression tree analysis, we note the highest degree of under-saturation was also associated with high temperature, lowSO4
2− and low NH4+ (Figure 8).
4. Discussion
4.1. Annual N2O Fluxes
[32] With the addition of these five study streams, annualN2O flux estimates now exist for twenty low order streams anddrainage canals worldwide [Beaulieu et al., 2008; Harrison2002; Harrison and Matson, 2003; Hasegawa et al., 2000].Shorter-term or seasonal studies exist for a much broaderrange of streams and rivers systems. While our data setrepresents the longest-term study, others have focused moreupon spatial gradients [Stow et al., 2005], or among-streamvariation [Harrison and Matson, 2003; Beaulieu et al., 2008].Emissions from our study streams were considerably lowerthan those observed from eutrophic subtropical streams
Figure 5. Relationship between annual average nitrate con-centration and N2O flux from all low order streams andcanals for which there are long-term estimates. Note log-logscale. Some data reflect NO2+3
− rather than NO3− alone. Data
exclude periods of ice cover. Data from Hasegawa et al.[2000], Harrison [2002], Harrison and Matson [2003],Beaulieu et al. [2008], and this study.
Table 4. Results of Regression Analyses Assessing Predictors of Annual N2O Flux Among Streams, and Under-Ice N2O Concentrationsa
Analysis Resulting Equation Model F-Ratio r2adjusted N p
This StudyAnnual N2O fluxes, all streams (this study) Log (N2O flux) = 2.40 + 0.02[NO2+3
−] 6.7 0.59 5 0.08Under-ice N2O % saturation N2O % saturation = 136 + 1.43[NO2+3
−] 112 0.89 15 <0.0001
20 Low Order Streams With Annual Flux EstimatesAll streams Log (N2O flux) = 2.34 + 0.948 ⋅ log [NO2+3
−] 13.0 0.39 20 0.002All streams excluding outlier noted by Beaulieu et al. [2008] Log (N2O flux) = 1.38 + 1.42 ⋅ log [NO2+3
−] 28.8 0.61 19 <0.0001
aResults of a simple regression analysis for all small streams for which there are published annual flux data are also presented. NO2+3− is in mM, flux is
mmol N2O m−2 y−1. Data are shown in Figures 5 and 6.
BAULCH ET AL.: NITROUS OXIDE EMISSIONS FROM STREAMS GB4013GB4013
9 of 15

[Harrison and Matson, 2003]; but were similar to emissionsfrom streams in the midwestern United States [Beaulieu et al.,2008].[33] We saw relatively strong relationships between mean
annual NO2+3− concentrations and stream N2O fluxes, and
these relationships were supported by inclusion of annualflux estimates from the broader literature. The relationshipbetween NO2+3
− and N2O can be explained by either higherrates of denitrification at higher NO3
− concentrations[Beaulieu et al., 2010a], higher N2O yields of denitrifica-tion at increased NO3
− concentrations, or both factors actingin concert [Silvennoinen et al., 2008b]. Although elevatednitrification rates could also contribute to higher concentra-tions of NO3
− and increased N2O production, we performedisotopic analyses of N2O in four of these streams, and resultswere indicative of N2O produced via denitrification [Baulch,2009].[34] If we compare N2O fluxes to fluxes from agricultural
lands growing the dominant crops in our study catchments(corn, soy, wheat and alfalfa) (http://www.statcan.gc.ca/pub/95-629-x/2007000/4123856-eng.htm) we find that arealemissions from agricultural lands are similar in magnitude, orgreater than emissions from our study streams [Drury et al.,2008; Wagner-Riddle et al., 1997]. When the small areacovered by streams and much larger area in crops is consid-ered, N2O fluxes from our study streams are a small com-ponent of catchment N2O budgets [Baulch, 2009], as hasbeen shown for streams and rivers in New Zealand and theUnited States [Cole and Caraco, 2001; Wilcock and Sorrell,2008].[35] Nations that are signatories to the UN Framework
Convention on Climate Change are responsible for estimat-ing their greenhouse gas emissions, including the emissionsof N2O from streams resulting from agricultural activity[IPCC, 2006]. The method to tabulate emissions developedby the IPCC estimates emissions from rivers based on simpleassumptions regarding nitrogen cycling and N2O yields[IPCC, 1996; Seitzinger and Kroeze, 1998]. However, theseassumptions may not hold across all rivers, which varymarkedly in important factors such as length [Clough et al.,2006]. Emissions from surface drainages (i.e., aquatic sour-ces influenced by groundwater inputs) are estimated based onan empirical relationship between N2O-N and NO3
−-N[IPCC, 1996, 2006]. This method also has significant lim-itations. Perhaps most critically, it does not account for gas
exchange (therefore can vary over very short distances [Reayet al., 2003]) and it does not correct for saturation N2O[Beaulieu et al., 2008]. We suggest the relationship betweenmean annual NO3
− concentrations and N2O emissions pre-sented here (Table 4; based on streams in Mexico, themidwestern United States, southern Canada and Japan) mayprovide the foundation for development of an alternativeIPCC method. The observed N2O-NO3
− relationship couldbe incorporated into riverine nutrient models [e.g.,Whitehead et al., 1998], allowing large-scale estimates ofN2O fluxes. These fluxes could then be attributed todifferent nations based on their contributions to riverinenitrogen loading. More research is necessary to fill in gapsamong different stream orders and stream chemicalconditions, and expand the geographical range used intabulating this relationship. Perhaps most importantly, moredata are needed from streams which function as hot spots ofemissions. Although the log-log relationship we report hassignificant uncertainty and would require an estimate ofstream and river surface area, it may ultimately be animprovement upon the IPCC method. The current IPCCmethod for aquatic ecosystems has a 50-fold range ofuncertainty (based on N2O emissions per kg leached N)
Table 5. Correlation Coefficient, r, Between Water Chemistry, Temperature and N2Oa
NO2+3− NO2
− NO3− NH4
+ Organic N DOC TP SO42− Temperature
Flux Data (Ice-Free Season)N2O areal flux all streams +0.52 L +0.57 LN2O areal flux Black River +0.49N2O areal flux Jackson Creek −0.50N2O areal flux Layton Creek +0.38L +0.49 LN2O areal flux Mariposa Brook +0.44 L +0.68 L +0.38 +0.45N2O areal flux Stouffville Creek +0.57 L +0.41 L
Percent Saturation DataN2O % saturation all streams during ice cover +0.95 NM +0.95 +0.75 +0.61 NMN2O % saturation Jackson Creek ice-free season +0.73 L +0.83 L +0.45 L −0.33 −0.42 +0.46L −0.61
aThe direction of the relationship is indicated first. Flux data are log or log + 25 transformed. Where correlates are transformed this is indicated by aL. Blank cells indicate r2 < 0.10. This is higher than the threshold for statistical significance (at p = 0.05), but indicative of very weak associations. NMmeans this relationship was not measured. (Under ice NO2
− was consistently unmeasurable and temperature was 0°C.)
Figure 6. Relationship between N2O % saturation andnitrate concentrations under ice (upstream ice coverage of90% or greater). Error bars show ±1 standard deviation.
BAULCH ET AL.: NITROUS OXIDE EMISSIONS FROM STREAMS GB4013GB4013
10 of 15

[IPCC, 2006], combined with conceptual problems [Reayet al., 2003; Clough et al., 2006; Beaulieu et al., 2008].
4.2. Spatial and Temporal Variation in Stream N2OFluxes
[36] N2O fluxes were highly variable in space and time, asreported in previous studies [Harrison and Matson, 2003;Reay et al., 2003; Beaulieu et al., 2008]. Even in streamswhere environmental conditions were quite similar between
the sites, fluxes differed markedly (e.g., Layton Creek).Mariposa Brook showed the greatest degree of spatial vari-ability in fluxes, possibly due to the influence of tile drains.[37] Fluxes from Stouffville Creek were much lower at
sites where gas dynamics were not influenced by theupstream reservoir. The degree of temporal variability isgreatest in Stouffville Creek, with high fluxes associatedeither with high flow following heavy rainfall or occurringduring winter (at the site that was not ice covered). In each of
Figure 8. Environmental conditions associated with low N2O % saturation. NO2+3− concentrations
are shown on two plots: (a) all data with N2O < 120% saturation and (b) all data where NO2+3− < 10 mM.
(c–f ) Plots for other parameters show all data where saturation was less than 120%. No Mariposa Brookdata fall on the plots. The dashed line represents equilibrium N2O (100% saturation).
Figure 7. Regression tree describing predictors of N2O % saturation within Jackson Creek (cross-validated relative error [CVRE] 0.46 ± 0.12; re-substitution relative error [RRE] 0.18). The leaves or termi-nal nodes indicate mean % saturation ± standard deviation followed by the number of data points in thenode. Nitrate and DOC are reported as mM, temperature as °C.
BAULCH ET AL.: NITROUS OXIDE EMISSIONS FROM STREAMS GB4013GB4013
11 of 15

these streams, a bias toward summer sampling would haveyielded quite different flux estimates. For example, samplingduring June–September would have overestimated annualfluxes from Layton Creek by 38–77% (based on differentannual time windows), by 18–75% from Black River, and by6–83% from Mariposa Brook. These findings highlight theimportance of long-term sampling, and the potential for biasassociated with summer-only flux estimation. In StouffvilleCreek, the direction of bias resulting from summer samplingvaried and could yield either overestimates or underestimatesof annual flux. In Jackson Creek, N2O uptake was consis-tently highest in summertime.[38] While on an annual scale NO3
− is a reasonable pre-dictor of N2O dynamics, shorter-term patterns are clearlymore complicated. Although NO2+3
− was frequently corre-lated with daily N2O fluxes, it was not a significant correlatein all cases, and in many cases explained only a small pro-portion of variability in daily N2O fluxes. This contrasts withpast results from two river systems, where NO3
− explained52–68% of variation in N2O emissions over time [McMahonand Dennehy, 1999; Stow et al., 2005]. However, the poorerrelationships we report are commonly observed, particularlyin areas affected by groundwater N2O inputs [Clough et al.,2006]. Other variables including ammonium and nitriteshow significant correlations in some of our systems.Although nitrite is only ever present in low concentrations, itexplains a significant amount of the variation in dailyN2O fluxes in Stouffville Creek (Table 5). Nitrite additionexperiments have been shown to yield higher N2Oproduction ratios than the addition of NO3
−, and strongcorrelations between N2O fluxes and nitrite concentrationshave been shown within estuaries [Dong et al., 2002].Ammonium was also a significant correlate in one of ourstudy streams, but was the best single predictor of N2Ofluxes in a group of small eutrophic Mexican streams[Harrison and Matson, 2003]. In our study, the range ofammonium concentrations is relatively small. As a result,if ammonium is an important predictor in streams, thismight not be evident in our data. The reason that annualfluxes are more predictable than daily fluxes in these datais not clear, but is likely explained, at least in part, by theaggregation of large amounts of data in annual fluxestimates which may minimize the influence of error indaily flux measurements and the effect of factors such asdiel variation and spatial variation in N2O and N chemistry.
4.3. Under Ice N2O
[39] Periods of ice cover allowed us to assess gas dynamicsin the absence of significant atmospheric gas exchange. Asin the annual data, NO2+3
− emerged as an important pre-dictor of N2O under ice. While to our knowledge under-ice N2O concentrations have not been measured in streams,these findings are consistent with studies showing strongrelationships between N2O and NO3
− in groundwater [e.g.,LaMontagne et al., 2003], which is thought to be the majorsource of streamflow under-ice during mid-winter [Cunjaket al., 1998]. In addition to groundwater N2O inputs, N2Oproduction may still occur within streams during periods ofice cover. Although rates of microbial N processing areexpected to be low, N2O yields may increase at low tem-peratures (Table 1).
4.4. N2O Consumption
[40] Transient periods of N2O undersaturation and uptakehave been observed [Hemond and Duran, 1989; Stow et al.,2005; Beaulieu et al., 2008], even in streams and rivers withhigh annual loads of dissolved inorganic N [McMahon andDennehy, 1999; Rajkumar et al., 2008]. However, JacksonCreek is the first system to be shown function as a net N2Osink on an annual basis.[41] N2O undersaturation in streams often reflects the
ability of denitrifiers to use free N2O as an electron acceptor.Periods of net N2O consumption have been associated withlow ambient NO3
− concentrations, low O2 concentrations,low flow, or some combination of these factors [Richey et al.,1988; Hemond and Duran, 1989; LaMontagne et al., 2003;Stow et al., 2005; Rajkumar et al., 2008]. In soils, where N2Oconsumption is more widely documented, factors includingtemperatures greater than 5°C and low O2 (or saturation andporosity that drive low O2) have been associated with netN2O consumption [Blackmer et al., 1980; Chapuis-Lardyet al., 2007]. In reservoirs, low O2, low NO3
− and highorganic carbon availability have been cited as factors asso-ciated with net N2O consumption [Hendzel et al., 2005]. Thisis consistent with the fact that N2O-reductase activity can beinhibited by the presence of O2 [Cavigelli and Robertson,2001]. However, the clearest link to N2O consumption, asin our study, is low concentrations of inorganic N [Chapuis-Lardy et al., 2007].[42] Our data are indicative of a threshold NO2+3
− con-centration of approximately 2.7 mM, below which net N2Oconsumption is often observed. We suggest that anthropo-genic N enrichment may have reduced the frequency withwhich streams act as N2O sinks. Background nitrate con-centrations in headwaters streams of nearby regions areestimated to be <11 mM [Smith et al., 2003]. If natural NO3
−
concentrations were at the low range of historic [Livingstone,1962] and background NO3
− estimates [Meybeck, 1982;Smith et al., 2003], our results suggest N enrichment ofstreams may have changed some streams in this region fromnet N2O sinks to net N2O sources. Although there are fewestimates of N2O flux from low NO3
− streams, N2O under-saturation was observed in another low NO2+3
− (<0.5 mM)stream [Baulch, 2009]. However, surprisingly high annualemissions of N2O were reported for a low NO3
− stream in themidwestern United States (2.1 mM) [Beaulieu et al., 2008],suggesting the threshold we report may not be applicableacross all landscapes.[43] The importance of soil N2O uptake is the focus of
considerable attention, with recent research suggesting alarge area of the earth’s surface is covered by soils that arehighly prone to net N2O uptake [Kroeze et al., 2007]. Even ifstream N2O uptake is a common occurrence, the importanceof this phenomenon to global budgets is likely to be small.Observed areal N2O uptake rates from our study streams arelow in comparison to soil uptake rates [Chapuis-Lardy et al.,2007], and streams cover a much smaller area of the land-scape than soils. Stream N2O uptake rates are also lower thanmean emissions from other study streams.
4.5. Sources of Error
[44] There are several sources of uncertainty in our analy-ses. Daytime sampling underestimates time-integrated daily
BAULCH ET AL.: NITROUS OXIDE EMISSIONS FROM STREAMS GB4013GB4013
12 of 15
fluxes in these streams by approximately 9% [Baulch, 2009].Error in measurement and modeling of gas transfer is alsosignificant. Gas tracer experiments are typically estimated tobe accurate within 6–10% [Hibbs et al., 1998; Moog andJirka, 1998]. Our results suggest a mean error of ∼6%, butas high as 28%. Error associated with O2-based estimates ofgas transfer is similar to tracer-based measurements, orhigher [Rosamond et al., 2011]. Where we had multiplemeasurements of gas transfer at different stream discharges,we found relatively good agreement between measured andmodeled gas transfer coefficient in the Black River (1–3%difference between measured and modeled) and StouffvilleCreek (1–22%), but poorer results in Jackson Creek (13–44%), Mariposa Brook (30–41%), and Layton Creek (38–42%). However, the overall accuracy of this model-basedextrapolation remains uncertain [Moog and Jirka, 1998]because it depends upon the accuracy of the underlyingmodel structure which can be tested only using a largenumber of measurements of gas transfer velocity. In additionto error associated with estimation of gas transfer velocity,and the diel sampling bias we note, spatial variability inemissions is also large (Figures 3 and 4). As a result, thereis a relatively high degree of uncertainty in these and otherN2O flux measurements. More frequent, and more spatiallyintensive sampling could help improve accuracy of fluxestimates, as would work to better parameterize gas transfervelocity.
5. Conclusions
[45] Our findings indicate there is a strong link betweenmean annual NO3
− concentrations and N2O fluxes. Althoughmore research is required, this relationship could serve as afoundation for a revised IPCC method to estimate streamN2O emissions, given the relationship is supported across thefour geographic regions and 20 streams studied thus far.[46] Reducing N2O emissions is important to help miti-
gate climate change, and to help lessen the role of N2O instratospheric ozone depletion [Ravishankara et al., 2009].Although reduced NO3
− loading to streams would lead toimproved water quality, our results indicate that the benefits interms of reducing stream N2O emissions may be relativelysmall, due to low emissions from these systems. Instead,efforts to improve N management are likely to lead to thegreatest emissions reductions directly from agricultural soils –which at the scale of our study catchments have much largeremissions. Important mitigation gains might also be attainedby remediating systems that constitute emissions hot spots,such as those influenced by sewage or tile drains [Reay et al.,2003; Beaulieu et al., 2010b].
[47] Acknowledgments. Wewould like to thank Jason Venkiteswaran,Richard Elgood, Heather Broadbent, and others for assistance with model-ing, field work, and lab analyses. Funding support was provided by anNSERC Discovery grant to P.J.D. and scholarship support of H.M.B.
ReferencesAlexander, R. B., R. A. Smith, and G. E. Schwarz (2000), Effect of streamchannel size on the delivery of nitrogen to the Gulf of Mexico, Nature,403, 758–761, doi:10.1038/35001562.
Baulch, H. M. (2009), Nitrous oxide emissions from streams, Ph.D. thesis,293 pp., Trent Univ., Peterborough, Ont., Canada.
Beaulieu, J. J., C. P. Arango, S. K. Hamilton, and J. L. Tank (2008), Theproduction and emission of nitrous oxide from headwater streams inthe midwestern United States, Global Change Biol., 14(4), 878–894,doi:10.1111/j.1365-2486.2007.01485.x.
Beaulieu, J. J., et al. (2010a), Nitrous oxide emission from denitrification instream and river networks, Proc. Natl. Acad. Sci. U. S. A., 108, 214–219,doi:10.1073/pnas.1011464108.
Beaulieu, J. J., W. D. Shuster, and J. A. Rebholz (2010b), Nitrous oxideemissions from a large, impounded river: The Ohio River, Environ. Sci.Technol., 44(19), 7527–7533, doi:10.1021/es1016735.
Bennett, J. P., and R. E. Rathburn (1972), Reaeration in open-channel flow,U.S. Geol. Surv. Prof. Pap., 737, 75 pp.
Bernhardt, E. S., and G. E. Likens (2002), Dissolved organic carbonenrichment alters nitrogen dynamics in a forest stream, Ecology, 83(6),1689–1700, doi:10.1890/0012-9658(2002)083[1689:DOCEAN]2.0.CO;2.
Betlach, M. R., and J. M. Tiedje (1981), Kinetic explanation for accumula-tion of nitrite, nitric-oxide, and nitrous-oxide during bacterial denitrifica-tion, Appl. Environ. Microbiol., 42(6), 1074–1084.
Blackmer, A. M., J. M. Bremner, and E. L. Schmidt (1980), Production ofnitrous oxide by ammonia-oxidizing chemoautotrophic microorganismsin soil, Appl. Environ. Microbiol., 40, 1060–1066.
Cavigelli, M. A., and G. P. Robertson (2000), The functional significanceof denitrifier community composition in a terrestrial ecosystem,Ecology, 81(5), 1402–1414, doi:10.1890/0012-9658(2000)081[1402:TFSODC]2.0.CO;2.
Cavigelli, M. A., and G. P. Robertson (2001), Role of denitrifier diversity inrates of nitrous oxide consumption in a terrestrial ecosystem, Soil Biol.Biochem., 33(3), 297–310, doi:10.1016/S0038-0717(00)00141-3.
Chapra, S. C., and D. M. di Toro (1991), Delta method for estimating pri-mary production respiration and reaeration in streams, J. Environ. Eng.Sci., 117, 640–655, doi:10.1061/(ASCE)0733-9372(1991)117:5(640).
Chapuis-Lardy, L., N. Wrage, A. Metay, J. L. Chotte, and M. Bernoux(2007), Soils, a sink for N2O? A review, Global Change Biol., 13(1),1–17, doi:10.1111/j.1365-2486.2006.01280.x.
Clough, T. J., J. E. Bertram, R. R. Sherlock, R. L. Leonard, and B. L.Nowicki (2006), Comparison of measured and EF5-r-derived N2Ofluxes from a spring-fed river, Global Change Biol., 12(2), 352–363,doi:10.1111/j.1365-2486.2005.01089.x.
Cole, J. J., and N. F. Caraco (2001), Emissions of nitrous oxide (N2O) froma tidal, freshwater river, the Hudson River, New York, Environ. Sci.Technol., 35(6), 991–996, doi:10.1021/es0015848.
Cox, B. A. (2003), A review of dissolved oxygen modelling techniques forlowland rivers, Sci. Total Environ., 314–316, 303–334, doi:10.1016/S0048-9697(03)00062-7.
Cunjak, R. A., T. D. Prowse, and D. L. Parrish (1998), Atlantic salmon(Salmo salar) in winter: “The season of parr discontent”?, Can. J. Fish.Aquat. Sci., 55, 161–180, doi:10.1139/d98-008.
De’ath, G., and K. E. Fabricius (2000), Classification and regression trees:A powerful yet simple technique for ecological data analysis, Ecology,81(11), 3178–3192, doi:10.1890/0012-9658(2000)081[3178:CARTAP]2.0.CO;2.
Dong, L. F., D. B. Nedwell, G. J. C. Underwood, D. C. O. Thornton, and I.Rusmana (2002), Nitrous oxide formation in the Colne estuary, England:The central role of nitrite, Appl. Environ. Microbiol., 68(3), 1240–1249,doi:10.1128/AEM.68.3.1240-1249.2002.
Drury, C. F., X. M. Yang, W. D. Reynolds, and N. B. McLaughlin (2008),Nitrous oxide and carbon dioxide emissions from monoculture and rota-tional cropping of corn, soybean and winter wheat, Can. J. Soil Sci.,88(2), 163–174, doi:10.4141/CJSS06015.
Firestone, M. K., and E. A. Davidson (1989), Microbiological basis ofNO and N2O production and consumption in soil, in Exchange of TraceGases Between Terrestrial Ecosystems and the Atmosphere, edited byM. O. Andreae and D. S. Schimel, pp. 7–21, John Wiley, New York.
Garcia-Ruiz, R., S. N. Pattinson, and B. A. Whitton (1998a), Denitrificationin river sediments: Relationship between process rate and properties ofwater and sediment, Freshwater Biol., 39(3), 467–476, doi:10.1046/j.1365-2427.1998.00295.x.
Garcia-Ruiz, R., S. N. Pattinson, and B. A. Whitton (1998b), Denitrificationand nitrous oxide production in sediments of the Wiske, a lowland eutro-phic river, Sci. Total Environ., 210(1–6), 307–320.
Goreau, T. J., W. A. Kaplan, S. C. Wofsy, M. B. McElroy, F. W. Valois,and S. W. Watson (1980), Production of nitrite and nitrous oxide bynitrifying bacteria at reduced concentrations of oxygen, Appl. Environ.Microbiol., 40, 526–532.
Harrison, J. A. (2002), Nitrogen dynamics and greenhouse gas productionin Yaqui Valley surface drainage waters, Ph.D. thesis, 102 pp., StanfordUniv., Stanford, Calif.
BAULCH ET AL.: NITROUS OXIDE EMISSIONS FROM STREAMS GB4013GB4013
13 of 15

Harrison, J., and P. Matson (2003), Patterns and controls of nitrous oxideemissions from waters draining a subtropical agricultural valley, GlobalBiogeochem. Cycles, 17(3), 1080, doi:10.1029/2002GB001991.
Hasegawa, K., K. Hanaki, T. Matsuo, and S. Hidaka (2000), Nitrous oxidefrom the agricultural water system contaminated with high nitrogen,Chemosphere, 2, 335–345.
Hemond, H. F., and A. P. Duran (1989), Fluxes of N2O at the sediment-water and water-atmosphere boundaries of a nitrogen-rich river, WaterResour. Res., 25(5), 839–846, doi:10.1029/WR025i005p00839.
Hendzel, L. L., C. J. D. Matthews, J. J. Venkiteswaran, V. L. S. Louis,D., Burton, E. M. Joyce, and R. A. Bodaly (2005), Nitrous oxide fluxesin three experimental boreal forest reservoirs, Environ. Sci. Technol.,39(12), 4353–4360, doi:10.1021/es049443j.
Hibbs, D. E., K. L. Parkhill, and J. S. Gulliver (1998), Sulfur hexafluoridegas tracer studies in streams, J. Environ. Eng., 124(8), 752–760,doi:10.1061/(ASCE)0733-9372(1998)124:8(752).
Intergovernmental Panel on Climate Change (IPCC) (1996), Revised 1996IPCC Guidelines for National Greenhouse Gas Inventories, Paris.
Intergovernmental Panel on Climate Change (IPCC) (2006), N2O emissionsfrom managed soils, and CO2 emissions from lime and urea application,in Agriculture, Forestry and Other Land Use, IPCC Guidelines for Natl.Greenhouse Gas Invent., vol. 4, pp.1–54, Geneva.
Inwood, S. E., J. L. Tank, and M. J. Bernot (2005), Patterns of denitrifica-tion associated with land use in 9 midwestern headwater streams, J. N.Am. Benthol. Soc., 24(2), 227–245, doi:10.1899/04-032.1.
Jiang, Q. Q., and L. R. Bakken (1999), Nitrous oxide production andmethane oxidation by different ammonia-oxidizing bacteria, Appl. Envi-ron. Microbiol., 65(6), 2679–2684.
Kemp, M. J., and W. K. Dodds (2002), The influence of ammonium,nitrate, and dissolved oxygen concentrations on uptake, nitrification,and denitrification rates associated with prairie stream substrata, Limnol.Oceanogr., 47(5), 1380–1393, doi:10.4319/lo.2002.47.5.1380.
Khalil, K., B. Mary, and P. Renault (2004), Nitrous oxide productionby nitrification and denitrification in soil aggregates as affected by O2concentration, Soil Biol. Biochem., 36(4), 687–699, doi:10.1016/j.soilbio.2004.01.004.
Kilpatrick, P. A., R. E. Rathbun, N. Yotsukura, G. W. Parker, and L. L.Delong (1987), Determination of stream reaeration coefficients by useof tracers, in Techniques of Water-Resources Investigations of the U.S.Geological Survey, Book 3, chap. A18, U.S. Geol. Surv., Washington,D. C.
Kroeze, C., L. Bouwman, and C. P. Slomp (2007), Sinks for nitrous oxide atthe Earth’s surface, in Greenhouse Gas Sinks, pp. 227–242, CAB Int.,Wallingford, U. K., doi:10.1079/9781845931896.0227.
LaMontagne, M. G., R. Duran, and I. Valiela (2003), Nitrous oxide sourcesand sinks in coastal aquifers and coupled estuarine receiving waters,Sci. Total Environ., 309(1–3), 139–149, doi:10.1016/S0048-9697(02)00614-9.
Liss, P. S., and P. G. Slater (1974), Flux of gases across the air-sea interface,Nature, 247, 181–184, doi:10.1038/247181a0.
Livingstone, D. A. (Ed.) (1962), Chemical Composition of Rivers andLakes, 6th ed., U.S. Geol. Surv. Prof. Pap., 440, 64 pp.
Maag, M., and F. P. Vinther (1996), Nitrous oxide emission by nitrificationand denitrification in different soil types and at different soil moisturecontents and temperatures, Appl. Soil Ecol., 4(1), 5–14, doi:10.1016/0929-1393(96)00106-0.
Macdonald, G., E. R. Holley, and J. S. Goudey (1991), Gas transfer mea-surements on an ice-covered river, in Gas Transfer at the Water Surface,edited by S. C. Wilhelms and J. S. Gulliver, pp. 347–361, Am. Soc. ofCiv. Eng., New York.
Martikainen, P. J. (1985), Nitrous-oxide emission associated with autotro-phic ammonium oxidation in acid coniferous forest soil, Appl. Environ.Microbiol., 50(6), 1519–1525.
Martin, L. A., P. J. Mulholland, J. R. Webster, and H. M. Valett (2001),Denitrification potential in sediments of headwater streams in the southernAppalachian Mountains, USA, J. N. Am. Benthol. Soc., 20(4), 505–519,doi:10.2307/1468084.
McMahon, P. B., and K. F. Dennehy (1999), N2O emissions from a nitrogen-enriched river, Environ. Sci. Technol., 33(1), 21–25, doi:10.1021/es980645n.
Meybeck, M. (1982), Carbon, nitrogen and phosphorus transport by worldrivers, Am. J. Sci., 282, 401–450, doi:10.2475/ajs.282.4.401.
Ministry of the Environment (1994), The determination of total phosphorus inwater by colourimetry, DOP-E3036A, Environ. Ont. Lab. Serv. BranchQuality Manage. Off., Dorset, Ont., Canada.
Ministry of the Environment (2001a), The determination of total Kjeldahlnitrogen in water and precipitation by colourimetry, DTKN-E324,Environ. Ont. Lab. Serv. Branch Quality Manage. Off., Dorset, Ont.,Canada.
Ministry of the Environment (2001b), The determination of ammoniumnitrogen and nitrate plus nitrite nitrogen in water and precipitation bycolourimetry, DONUT-E3374, Environ. Ont. Lab. Serv. Branch QualityManage. Off., Dorset, Ont., Canada.
Moog, D. B., and G. H. Jirka (1998), Analysis of reaeration equations usingmean multiplicative error, J. Environ. Eng., 124(2), 104–110,doi:10.1061/(ASCE)0733-9372(1998)124:2(104).
Müller, M. M., V. Sundman, and J. Skujinš (1980), Denitrification in lowpH spodosols and peats determined with the acetylene inhibition method,Appl. Environ. Microbiol., 40(2), 235–239.
O’Connor, D. J., and W. E. Dobbins (1958), Mechanism of reaeration innatural streams, Trans. Am. Soc. Civ. Eng., 123, 641–684.
Owens, M., R. W. Edwards, and J. W. Gibbs (1964), Some reaeration stud-ies in streams, Int. J. Air Water Pollut., 8, 469–486.
Rajkumar, A. N., J. Barnes, R. Ramesh, R. Purvaja, and R. C. Upstill-Goddard (2008), Methane and nitrous oxide fluxes in the polluted AdyarRiver and estuary, SE India, Mar. Pollut. Bull., 56(12), 2043–2051,doi:10.1016/j.marpolbul.2008.08.005.
Ravishankara, A. R., J. S. Daniel, and R. W. Portmann (2009), Nitrousoxide (N2O): The dominant ozone-depleting substance emitted inthe 21st century, Science, 326(5949), 123–125, doi:10.1126/science.1176985.
Reay, D. S., K. A. Smith, and A. C. Edwards (2003), Nitrous oxideemission from agricultural drainage waters, Global Change Biol., 9(2),195–203, doi:10.1046/j.1365-2486.2003.00584.x.
Richardson, W. B., E. A. Strauss, L. A. Bartsch, E. M. Monroe, J. C.Cavanaugh, L. Vingum, and D. M. Soballe (2004), Denitrification inthe Upper Mississippi River: Rates, controls, and contribution to nitrateflux, Can. J. Fish. Aquat. Sci., 61(7), 1102–1112, doi:10.1139/f04-062.
Richey, J. E., A. H. Devol, S. C. Wofsy, R. Victoria, and M. N. G. Riberio(1988), Biogenic gases and the oxidation and reduction of carbon inAmazon River and floodplain waters, Limnol. Oceanogr., 33(4), 551–561.
Rosamond, M. S., S. J. Thuss, S. L. Schiff, and R. J. Elgood (2011), Sea-sonal variability in coupled cycles of dissolved O2 and N2O in riversalong a trophic gradient, southern Ontario, Canada, J. Environ. Qual.,40, 256–270, doi:10.2134/jeq2010.0009.
Seitzinger, S. P., and C. Kroeze (1998), Global distribution of nitrous oxideproduction and N inputs in freshwater and coastal marine ecosystems,Global Biogeochem. Cycles, 12(1), 93–113, doi:10.1029/97GB03657.
Silvennoinen, H., A. Liikanen, J. Torssonen, C. F. Stange, and P. J.Martikainen (2008a), Denitrification and N2O effluxes in the BothnianBay (northern Baltic Sea) river sediments as affected by temperatureunder different oxygen concentrations, Biogeochemistry, 88(1), 63–72,doi:10.1007/s10533-008-9194-7.
Silvennoinen, H., A. Liikanen, J. Torssonen, C. F. Stange, and P. J.Martikainen (2008b), Denitrification and nitrous oxide effluxes in boreal,eutrophic river sediments under increasing nitrate load: A laboratorymicrocosm study, Biogeochemistry, 91(2–3), 105–116, doi:10.1007/s10533-008-9262-z.
Smith, R. A., R. B. Alexander, and G. E. Schwarz (2003), Natural back-ground concentrations of nutrients in streams and rivers of the conter-minous United States, Environ. Sci. Technol., 37(14), 3039–3047,doi:10.1021/es020663b.
Starry, O. S., H. M. Valett, and M. E. Schreiber (2005), Nitrification ratesin a headwater stream: Influences of seasonal variation in C and N supply,J. N. Am. Benthol. Soc., 24(4), 753–768, doi:10.1899/05-015.1.
Stein, L. Y., and Y. L. Yung (2003), Production, isotopic composition, andatmospheric fate of biologically produced nitrous oxide, Annu. Rev. EarthPlanet. Sci., 31, 329–356, doi:10.1146/annurev.earth.31.110502.080901.
Stevens, R. J., R. J. Laughlin, and J. P. Malone (1998), Soil pH affectsthe processes reducing nitrate to nitrous oxide and di-nitrogen, Soil Biol.Biochem., 30(8–9), 1119–1126, doi:10.1016/S0038-0717(97)00227-7.
Stow, C. A., J. T. Walker, L. Cardoch, and P. Spence (2005), N2O emis-sions from streams in the Neuse River watershed, North Carolina, Envi-ron. Sci. Technol., 39(18), 6999–7004, doi:10.1021/es0500355.
Strauss, E. A., and G. A. Lamberti (2000), Regulation of nitrificationin aquatic sediments by organic carbon, Limnol. Oceanogr., 45(8),1854–1859, doi:10.4319/lo.2000.45.8.1854.
Strauss, E. A., N. L. Mitchell, and G. A. Lamberti (2002), Factors regulat-ing nitrification in aquatic sediments: Effects of organic carbon, nitrogenavailability, and pH, Can. J. Fish. Aquat. Sci., 59(3), 554–563,doi:10.1139/f02-032.
Strauss, E. A., W. B. Richardson, L. A. Bartsch, J. C. Cavanaugh, D. A.Bruesewitz, H. Imker, J. A. Heinz, and D. M. Soballe (2004), Nitrifica-tion in the Upper Mississippi River: Patterns, controls, and contributionto the NO3
- budget, J. N. Am. Benthol. Soc., 23(1), 1–14, doi:10.1899/0887-3593(2004)023<0001:NITUMR>2.0.CO;2.
Thomann, R. V., and J. A. Mueller (1987), Principles of Surface WaterQuality Modeling and Control, 282 pp., Harper and Row, New York.
BAULCH ET AL.: NITROUS OXIDE EMISSIONS FROM STREAMS GB4013GB4013
14 of 15

Tilman, D., J. Fargione, B. Wolff, C. D’Antonio, A. Dobson, R., Howarth,D. Schindler, W. H. Schlesinger, D. Simberloff, and D., Swackhame(2001), Forecasting agriculturally driven global environmental change,Science, 292(5515), 281–284, doi:10.1126/science.1057544.
Venkiteswaran, J. J., L. I. Wassenaar, and S. L. Schiff (2007), Dynamics ofdissolved oxygen isotopic ratios: A transient model to quantify primaryproduction, community respiration, and air-water exchange in aquaticecosystems,Oecologia, 153(2), 385–398, doi:10.1007/s00442-007-0744-9.
Venkiteswaran, J. J., S. L. Schiff, and L. I. Wassenaar (2008), Aquaticmetabolism and ecosystem health assessment using dissolved O2 stableisotope diel curves, Ecol. Appl., 18(4), 965–982, doi:10.1890/07-0491.1.
Vitousek, P. M., J. D. Aber, R. W. Howarth, G. E. Likens, P. A. Matson,D. W. Schindler, W. H. Schlesinger, and D. G. Tilman (1997), Humanalteration of the global nitrogen cycle: Sources and consequences, Ecol.Appl., 7(3), 737–750.
Wagner-Riddle, C., G. W. Thurtell, G. K. Kidd, E. G. Beauchamp,and R. Sweetman (1997), Estimates of nitrous oxide emissions fromagricultural fields over 28 months, Can. J. Soil Sci., 77(2), 135–144,doi:10.4141/S96-103.
Wanninkhof, R. (1992), Relationship between wind-speed and gas-exchange over the ocean, J. Geophys. Res., 97(C5), 7373–7382,doi:10.1029/92JC00188.
Warwick, J. J. (1986), Diel variation of in-stream nitrification, WaterRes., 20, 1325–1332, doi:10.1016/0043-1354(86)90165-X.
Weier, K. L., J. W. Doran, J. F. Power, and D. T. Walters (1993),Denitrification and the dinitrogen nitrous-oxide ratio as affected by soil-water, available carbon, and nitrate, Soil Sci. Soc. Am. J., 57(1), 66–72,doi:10.2136/sssaj1993.03615995005700010013x.
Weiss, R. F., and B. A. Price (1980), Nitrous oxide solubility in water andseawater, Mar. Chem., 8, 347–359, doi:10.1016/0304-4203(80)90024-9.
Whitehead, P. G., E. J. Wilson, and D. Butterfield (1998), A semi-distributed integrated nitrogen model for multiple source assessment incatchments (INCA): Part I. Model structure and process equations, Sci.Total Environ., 210(1–6), 547–558.
Wilcock, R. J., and B. K. Sorrell (2008), Emissions of greenhouse gasesCH4 and N2O from low-gradient streams in agriculturally developedcatchments, Water Air Soil Pollut., 188(1–4), 155–170, doi:10.1007/s11270-007-9532-8.
Wollheim, W. M., C. J. Vorosmarty, B. J. Peterson, S. P. Seitzinger, andC. S. Hopkinson (2006), Relationship between river size and nutrientremoval, Geophys. Res. Lett., 33, L06410, doi:10.1029/2006GL025845.
Wrage, N., G. L. Velthof, M. L. van Beusichem, and O. Oenema (2001),Role of nitrifier denitrification in the production of nitrous oxide, SoilBiol. Biochem., 33(12–13), 1723–1732, doi:10.1016/S0038-0717(01)00096-7.
Zumft, W. G. (1997), Cell biology and molecular basis of denitrification,Microbiol. Mol. Biol. Rev., 61(4), 533–616.
H. M. Baulch, School of Environment and Sustainability and GlobalInstitute for Water Security, University of Saskatchewan, 11 InnovationBlvd., Saskatoon, SK S7N 3H5, Canada. ([email protected])P. J. Dillon, Department of Environmental and Resource Studies, Trent
University, 1600 W. Bank Dr., Peterborough, ON K9J 7B8, Canada.R.Maranger, Département de Sciences Biologiques, Université deMontréal,
C.P. 6128, succursale Centre-ville, Montréal, QC H3C 3J7, Canada.S. L. Schiff, Department of Earth and Environmental Sciences, University
of Waterloo, 200 University Ave. W., Waterloo, ON N2L 3G1, Canada.
BAULCH ET AL.: NITROUS OXIDE EMISSIONS FROM STREAMS GB4013GB4013
15 of 15