Denitrification and nitrous oxide to nitrous oxide plus dinitrogen ratios in the soil profile under...
9
Biol Fertil Soils (2003) 38:340–348 DOI 10.1007/s00374-003-0663-9 ORIGINAL PAPER Abdirashid A. Elmi · Chandra Madramootoo · Chantal Hamel · Aiguo Liu Denitrification and nitrous oxide to nitrous oxide plus dinitrogen ratios in the soil profile under three tillage systems Received: 9 December 2002 / Accepted: 7 July 2003 / Published online: 5 September 2003 # Springer-Verlag 2003 Abstract There is a growing interest in the adoption of conservation tillage systems [no-till (NT) and reduced tillage (RT)] as alternatives to conventional tillage (CT) systems. A 2-year study was conducted to investigate possible environmental consequences of three tillage systems on a 2.4-ha field located at Macdonald Research Farm, McGill University, Montreal. The soil was a sandy loam (0.5 m depth) underlain by a clay layer. Treatments consisted of a factorial combination of CT, RT, and NT with the presence or absence of crop residue. Soil NO 3 - -N concentrations tended to be lower in RT than NT and CT tillage treatments. Denitrification and N 2 O emissions were similar among tillage systems. Contrary to the popular assumption that denitrification is limited to the uppermost soil layer (0–0.15 m), large rates of N 2 O production were measured in the subsurface (0.15– 0.45 m) soil, suggesting that a significant portion of produced N 2 O may be missed if only soil surface gas flux measurements are made. The N 2 O mole fraction (N 2 O:N 2 O+N 2 ) was higher in the drier season of 1999 under CT than in 2000, with the ratio occasionally exceeding 1.0 in some soil layers. Dissolved organic C concentrations remained high in all soil depths sampled, but were not affected by tillage system. Keywords Denitrification · Nitrous oxide production · Mole fraction · Soil profile Introduction Traditional farming systems for the intensive production of agricultural lands can degrade the quality of soil and water resources. Continuous use of conventional tillage (CT) systems can accelerate the depletion of soil organic matter and lead to the deterioration of soil structure, resulting in severe soil erosion (Hussain et al. 1999; Martel and MacKenzie 1980). Furthermore, eroded soil particles associated with runoff water may carry plant nutrients such as P and N which contaminate water and contribute to the eutrophication of aquatic ecosystems. Water quality measurements at 300 locations in major USA rivers showed that suspended sediments associated with runoff from agroecosystems are the most damaging nonpoint source pollutants (Smith et al. 1987). As a result, the use of water for drinking, irrigation and recreation may be affected. There is a growing trend for the adoption of conser- vation tillage systems, including no-till (NT) and reduced tillage (RT), primarily because they have been shown to be significantly more water efficient (Lindwall and Anderson 1981), to improve soil and water quality (Hussain et al. 1999), and to reduce production costs due to lower fuel and labor inputs (Uri et al. 1999; Lindwall and Anderson 1981). The continuing increase in acreage under NT and RT, however, raises new water and air quality concerns. The formation of macropores coupled with reduced surface runoff in NT or RT fields can increase the downward movement of water containing NO 3 - -N and other agro- chemicals to subsurface tile drains or groundwater. While A. A. Elmi ( ) ) Department of Engineering, Nova Scotia Agricultural College, 219 Resource Stewardship Building, 20 Tower Road, P.O. Box 550, Truro, Nova Scotia, B2N 5E3, Canada e-mail: [email protected] Tel.: +1-902-893-6592 Fax: +1-902-893-0335 C. Madramootoo Brace Center for Water Resources Management, McGill University, Macdonald Campus, 21, 111 Lakeshore Road, Ste.-Anne-de-Bellevue, Quebec, H9X 3V9, Canada C. Hamel Semiarid Prairie Agricultural Research Center, Airport Road, Box 1030, Swift Current, SKS9H 3X2, Canada A. Liu Department of Natural Resource Sciences, McGill University, Macdonald Campus, 21, 111 Lakeshore Road, Ste-Anne-de-Bellevue, Quebec, H9X 3V9, Canada
-
Upload
independent -
Category
Documents
-
view
3 -
download
0
Transcript of Denitrification and nitrous oxide to nitrous oxide plus dinitrogen ratios in the soil profile under...

Biol Fertil Soils (2003) 38:340–348DOI 10.1007/s00374-003-0663-9
O R I G I N A L P A P E R
Abdirashid A. Elmi · Chandra Madramootoo ·Chantal Hamel · Aiguo Liu
Denitrification and nitrous oxide to nitrous oxide plus dinitrogen ratiosin the soil profile under three tillage systems
Received: 9 December 2002 / Accepted: 7 July 2003 / Published online: 5 September 2003� Springer-Verlag 2003
Abstract There is a growing interest in the adoption ofconservation tillage systems [no-till (NT) and reducedtillage (RT)] as alternatives to conventional tillage (CT)systems. A 2-year study was conducted to investigatepossible environmental consequences of three tillagesystems on a 2.4-ha field located at Macdonald ResearchFarm, McGill University, Montreal. The soil was a sandyloam (0.5 m depth) underlain by a clay layer. Treatmentsconsisted of a factorial combination of CT, RT, and NTwith the presence or absence of crop residue. Soil NO3
--Nconcentrations tended to be lower in RT than NT and CTtillage treatments. Denitrification and N2O emissionswere similar among tillage systems. Contrary to thepopular assumption that denitrification is limited to theuppermost soil layer (0–0.15 m), large rates of N2Oproduction were measured in the subsurface (0.15–0.45 m) soil, suggesting that a significant portion ofproduced N2O may be missed if only soil surface gas fluxmeasurements are made. The N2O mole fraction(N2O:N2O+N2) was higher in the drier season of 1999
under CT than in 2000, with the ratio occasionallyexceeding 1.0 in some soil layers. Dissolved organic Cconcentrations remained high in all soil depths sampled,but were not affected by tillage system.
Keywords Denitrification · Nitrous oxide production ·Mole fraction · Soil profile
Introduction
Traditional farming systems for the intensive productionof agricultural lands can degrade the quality of soil andwater resources. Continuous use of conventional tillage(CT) systems can accelerate the depletion of soil organicmatter and lead to the deterioration of soil structure,resulting in severe soil erosion (Hussain et al. 1999;Martel and MacKenzie 1980). Furthermore, eroded soilparticles associated with runoff water may carry plantnutrients such as P and N which contaminate water andcontribute to the eutrophication of aquatic ecosystems.Water quality measurements at 300 locations in majorUSA rivers showed that suspended sediments associatedwith runoff from agroecosystems are the most damagingnonpoint source pollutants (Smith et al. 1987). As a result,the use of water for drinking, irrigation and recreationmay be affected.
There is a growing trend for the adoption of conser-vation tillage systems, including no-till (NT) and reducedtillage (RT), primarily because they have been shown tobe significantly more water efficient (Lindwall andAnderson 1981), to improve soil and water quality(Hussain et al. 1999), and to reduce production costsdue to lower fuel and labor inputs (Uri et al. 1999;Lindwall and Anderson 1981).
The continuing increase in acreage under NT and RT,however, raises new water and air quality concerns. Theformation of macropores coupled with reduced surfacerunoff in NT or RT fields can increase the downwardmovement of water containing NO3
--N and other agro-chemicals to subsurface tile drains or groundwater. While
A. A. Elmi ())Department of Engineering,Nova Scotia Agricultural College,219 Resource Stewardship Building, 20 Tower Road,P.O. Box 550, Truro, Nova Scotia, B2N 5E3, Canadae-mail: [email protected].: +1-902-893-6592Fax: +1-902-893-0335
C. MadramootooBrace Center for Water Resources Management,McGill University,Macdonald Campus, 21, 111 Lakeshore Road,Ste.-Anne-de-Bellevue, Quebec, H9X 3V9, Canada
C. HamelSemiarid Prairie Agricultural Research Center,Airport Road, Box 1030, Swift Current, SKS9H 3X2, Canada
A. LiuDepartment of Natural Resource Sciences,McGill University,Macdonald Campus, 21, 111 Lakeshore Road,Ste-Anne-de-Bellevue, Quebec, H9X 3V9, Canada
the likelihood of NO3--N leaching is increased under NT
and RT systems, published studies of NO3--N losses from
NT and different forms of RT have given somewhatdivergent results (Kanwar et al. 1997; Randall andIragavarapu 1995). Grain-corn residues contain largeamounts of N, thus contributing to soil N pools. Further,soils under NT and/or RT retain greater soil moisture thanthose under CT, which may enhance denitrification.Denitrification is a major pathway by which N2O entersthe atmosphere. N2O emissions have been a topic ofincreasing concern because N2O has a well-documentedrole in stratospheric O3 depletion and contributes to theatmospheric greenhouse gas effect (MacKenzie et al.1998; Mummey et al. 1998; Burton et al. 1997; Rice andSmith 1982).
Subsoil denitrification has been suggested as animportant mechanism for the removal of excess NO3
--Nwhich has accumulated in the soil profile before leachingto groundwater or discharging to surface aquifers viasubsurface drainage (Sotomayor and Rice 1996). Al-though it is often assumed that denitrification in the topsoil layer (0.15 m) is truly representative of the overallrate of denitrification processes, we hypothesize thatdenitrification can occur in subsoils if soluble C is notlimited. An interesting feature of denitrification insubsurface soil is that it is unlikely to add to concernsover global atmospheric N2O concentrations due to thefurther reduction of N2O to N2 during diffusion up the soilprofile. Bergsma et al.(2002) recognized the scarcity ofinformation about denitrification in subsoil environments.Whether NO3
- removal by denitrification is beneficial tothe environment depends on the partitioning of denitrifi-cation into N2O and N2. To our knowledge, this is the firstfield study to consider N2O:N2O+N2 ratio production insurface and subsurface soil environments as impacted bydifferent tillage systems.
The main objectives of this study were to assess theeffects of long-term tillage practices on: (1) NO3
--N in thesoil profile, (2) denitrification and N2O emissions insubsurface (0–0.45 m) soils, and (3) to estimate the ratioof N2O:N2O+N2 produced during two growing seasons.
Materials and methods
Site description and management
This study, undertaken in 1999 and 2000, was conducted on a2.4-ha site at McGill University’s research farm on MacdonaldCampus, Ste-Anne-de-Bellevue, Quebec. The soil was mostly ofthe St Damase series (Typic Endoaquent; Humic Gleysol). Theupper soil layer (about 0.28 m) was a sandy loam, underlain by asand layer (mean thickness about 0.18 m), with clay beginning at amean depth of 0.46 m (Burgess 2000).
The study consisted of three tillage systems: NT, RT, and CT,factorially combined with two residue treatments: with and without.CT plots were moldboard-plowed to 0.20 m in the fall and spring,RT plots were offset-disked to 0.15 m in the fall and spring, and NTplots were not tilled at any time. The field has been under thismanagement practice since 1991. Treatments were laid out in arandomized complete block design. The study site consists of 18plots, half (nine plots) with residue and planted to corn harvested
for grain corn, and the other half without residue and planted tocorn harvested as silage. Plots were 18 m�80 m, and drained by asubsurface drainage system to a depth of 1.0 m below the soilsurface. In this study, only plots with residue were included. Thegrain-corn plots were harvested with a combine that removed onlygrain, leaving all residues on the plots. Some coarse chopping orcrushing of aboveground residue occurred during harvest.
Corn (Funk 4120 hybrid) was planted in rows spaced 0.76 mapart. All plots received: at seeding, diammonium phosphate (18-46-0), banded 50 mm below and 50 mm laterally from the seeds toprovide 40 kg N ha-1 and 102 kg P2O5 ha-1. The field was seeded on6 May in 1999 and on 8 May in 2000. NH4NO3 (34-0-0) andmuriate of potash (0-0-60) were top-dressed 2–3 weeks later toprovide an additional 140 kg N ha-1 and 148 kg K2O ha-1. Thesecond application occurred on 4 June in 1999 and on 9 June in2000.
Measurements of N2O and mineral N in soil
To assess the relative proportion of N2O and N2 emissions in thesurface and subsurface soil, three incremental depths (0–0.15, 0.15–0.30, 0.3–0.45 m) were sampled simultaneously in pairs. Due to theheavy labor commitment required by the core sampling and timeconstraints related to incubating cores, it was only feasible tocollect one pair of samples from each treatment plot for eachsampling date. Soil cores were sampled in non-wheel-tracked rows.Samples were never taken from the same location more than oncewithin a growing season. Care was taken to avoid cross-contam-ination between sampling depths with careful cleaning of eachdrilling depth site.
Denitrification and N2O production rates were measured usingthe core incubation method, in the presence and absence of C2H2,respectively. Undisturbed soil core samples (50 mm diame-ter�150 mm long) were incubated in 2-l Mason jars. Fordenitrification measurements, 100 ml headspace air was replacedby C2H2 (5% v/v) to inhibit N2O reduction. The second sample wasincubated without C2H2 to estimate N2O emissions. C2H2 concen-trations of 1–10% in air (v/v) are usually sufficient for theinhibition to occur, causing only N2O to be evolved (Granli andBøckman 1994). N2O:N2O+N2 ratios were estimated by dividingthe N2O fluxes measured with and without C2H2 present (Eq. 1).
N2O� N without C2H2
N2O� N with C2H2¼ N2O
N2Oþ N2ð1Þ
Soil samples (three samples per plot) for NO3–N analysis were
taken prior to planting in the spring (April) and shortly after harvestin fall (October) from 0–0.25 m, 0.25–0.50 m, and 0.50–0.75 mdepth increments using a hand-held auger sampling probe. Repli-cate samples were then thoroughly mixed and moist subsamples of10 g were shaken with 100 ml of 1 M KCl for 60 min. The soilsuspensions were filtered through Whatman no. 5 filter papers.NO3
--N was quantified using a Lachat flow injection autoanalyzer(Lachat Quickchem, Milwaukee, Wis.) according to Keeney andNelson (1982). The detection limit was 0.05 mg l-1.
Dissolved organic C
Three soil samples were collected from each plot from 0–0.15,0.15–0.30, and 0.30–0.45 m depth increments using a hand-heldsoil auger before planting and after harvest. Samples from withineach treatment plot were combined to make a composite samples.To extract water-soluble organic C (i.e., dissolved organic C;DOC), a 10-g field-moist subsample was shaken in 100 mldeionized distilled water for 1 h, centrifuged for 10 min at 1,638 g,and then filtered through Whatman no. 5 paper. Samples wereanalyzed for organic C using a Shimadzu TOC-5000A total organicC analyzer (Shimadzu Scientific Instruments, Columbia, Md.).
341
Soil parameters
Soil moisture content was determined by oven drying soil cores at105�C for 48 h. Soil bulk density (Mg m-3) was determined by thecore method and total porosity was calculated assuming a particledensity of 2.65 Mg m-3. Percent water-filled pore space (%WFPS)was calculated as:
WFPS ¼ %H2Oporosity
� 100 ð2Þ
where, %H2O is the percentage of volumetric soil water content.
Statistical analysis
ANOVA was performed for each sampling date and depth.Differences among means were evaluated using Sheffe’s multiplecomparison test. Data was analyzed as a randomized completeblock design. All statistical analyses were conducted using theGeneral Linear Model procedure of the Statistical Analysis System,(SAS Institute, Cary, N.C.).
Results and discussion
Climatic data
Total seasonal (May–October) rainfall in 1999 was nearthe 30-year norm (Table 1). May and August were thedriest months during the 1999 growing season, eachreceiving only slightly more than half the normal rainfall.Rainfall in the 2000 growing season was 40 mm (8%)greater than the norm, with May being the wettest monthfollowed by August, and October was the driest. It isinteresting to note that the two driest months in 1999(May and August) corresponded to the wettest months in2000 (Table 1). The average mean monthly temperaturewas 2�C and 0.7�C higher than the norm in 1999 and2000, respectively (Table 1).
Table 1 Mean monthly precip-itation and air temperature dur-ing the 1999 and 2000 growingseasons measured at MacdonaldCampus Research Weather Sta-tion, compared to the long-termmean (1961–1991) a
Month Air temperature (�C) Precipitation (mm)
1999 2000 1961–1991 1999 2000 1961–1991
May 15.3 13.0 12.9 40.8 133.3 68June 20.8 16.7 18 111 86.0 83July 21.6 19.2 20.8 100 81.2 86August 19.1 19 19.4 55 125.5 100September 17.1 13.7 14.5 100.1 84.0 87October 7.6 8.6 8.3 90.6 29 75Mean 17.0 15.0 15.7 – – –
Total – – – 497 539 499
a Long-term averages were not available for the Macdonald Weather Station. Values for the long-termaverages were obtained from Dorval International Airport, about 10 km east of the field site
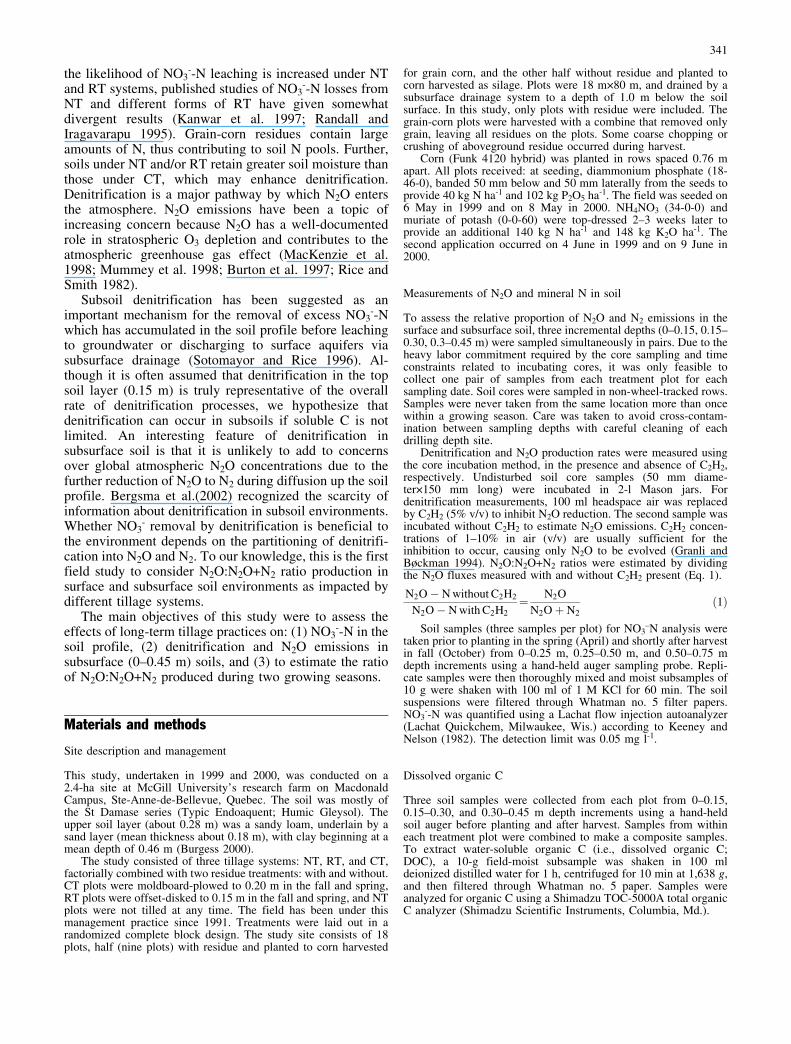
Fig. 1 NO3--N concentrations
(mg kg-1 soil) in the soil profileunder conventional tillage (CT),reduced tillage (RT) and no-tillage (NT) systems in a spring1999, b fall 1999, c spring2000, and d fall 2000. For eachdepth, bars with different lettersare significantly (P<0.05) dif-ferent. Vertical bars indicateSEM (n=9)
342

NO3--N concentrations in the soil profile
Residual NO3--N levels in the soil profile were not
affected by tillage (Fig. 1). The only exception was inspring 1999 in the 0.25- to 0.50-m soil layer when NO3
--Nlevels were significantly greater under RT than CT andNT (Fig. 1a). Although the effects of tillage on soil NO3
--N levels were not obvious, the general trend, except in thefall of 1999 (Fig. 1b), was for the NO3
--N concentration inthe soil profile to be lower in NT than RT or CT systems(Fig. 1a, c, d). Under continuous corn, Randall andIragavara (1995) measured higher subsurface drain flowunder NT than CT, but total NO3
--N losses were higherunder CT. This may suggest that greater infiltration andpreferential flow under NT may result in greater draindischarge, while enhanced denitrification under a NTsystem may decrease the amount of leachable NO3
--N inthe soil solution.
No clear trend of either an increase or decrease inNO3
--N with soil depth was obvious in 1999 (Fig. 1a, b).The opposite was true in 2000 where NO3
--N decreasedwith depth in all tillage systems (Fig. 1c, d). Perhaps themost striking finding with respect to NO3
--N concentra-tions in the soil profile is the sharp decline in NO3
--N infall 2000 (Fig. 1d), compared to fall 1999 (Fig. 1b). Thisis an important indication that NO3
--N was removed fromthe soil solution before it could be leached down to thegroundwater or drained to the surface waters via subsur-face drainage systems. Enhanced denitrification loss(discussed below) was likely to be the primary reasonfor this decrease in NO3
--N in the fall because ofexcessively wet conditions during the preceding growingseason.
Denitrification rates and N2O production
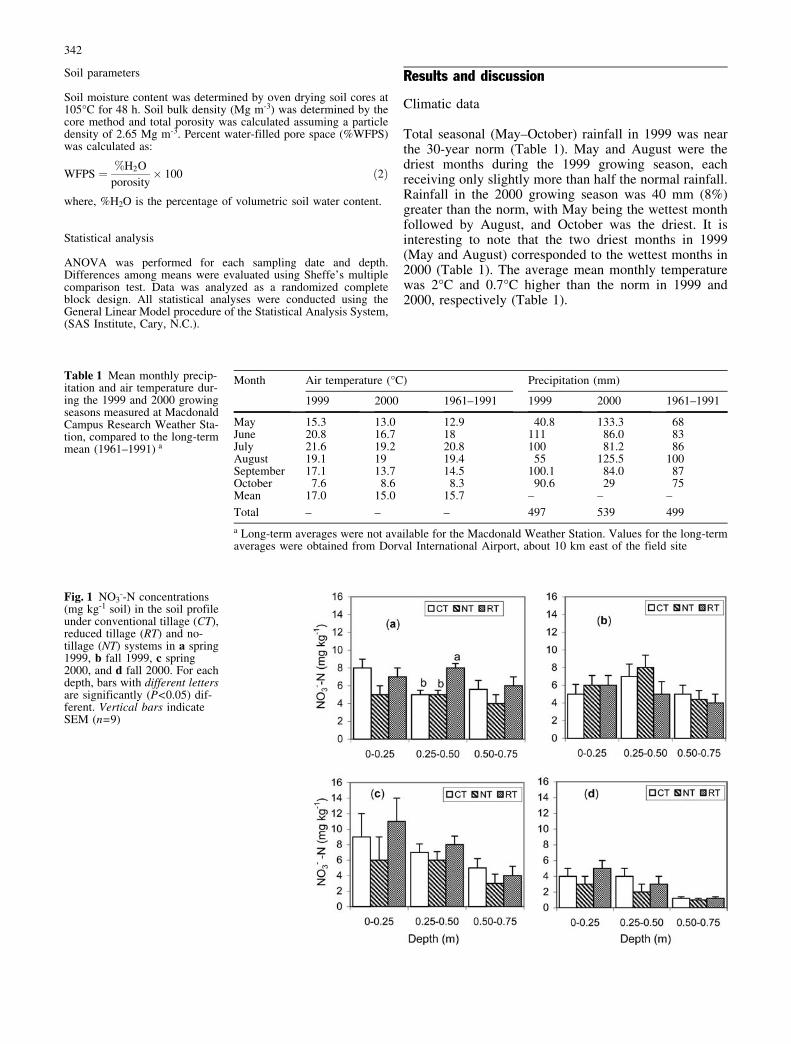
At the beginning of the 1999 growing season, denitrifi-cation rates were episodic at the soil surface (0–0.15 mdepth), but this high variability disappeared after August(Fig. 2). In the deeper soil layers, denitrification ratesremained low (<0 g day-1 ha-1) at all sampling dates andshowed no significant difference between tillage systems(Fig. 2). N2O production varied widely between treat-ments most notably on 14 September at the 0–0.15 mdepth (Fig. 3a) and on 10 June at the 0.15–0.30 m depth(Fig. 3b). On average, N2O production from these twosampling dates was greater than denitrification, suggest-ing nitrification might have contributed to N2O produc-tion. It is interesting to note that both of theseobservations were recorded under the CT system. Thegreater N2O production measured in CT plots may beattributed to conditions of greater oxidation created by thetillage operations.
The 2000 growing season differed from 1999 in twomain respects: (1) denitrification rates were five- totenfold greater than in 1999 regardless of the tillagetreatment, and (2) on a seasonal average, the greatestdenitrification rate was measured under CT at the 0.15–
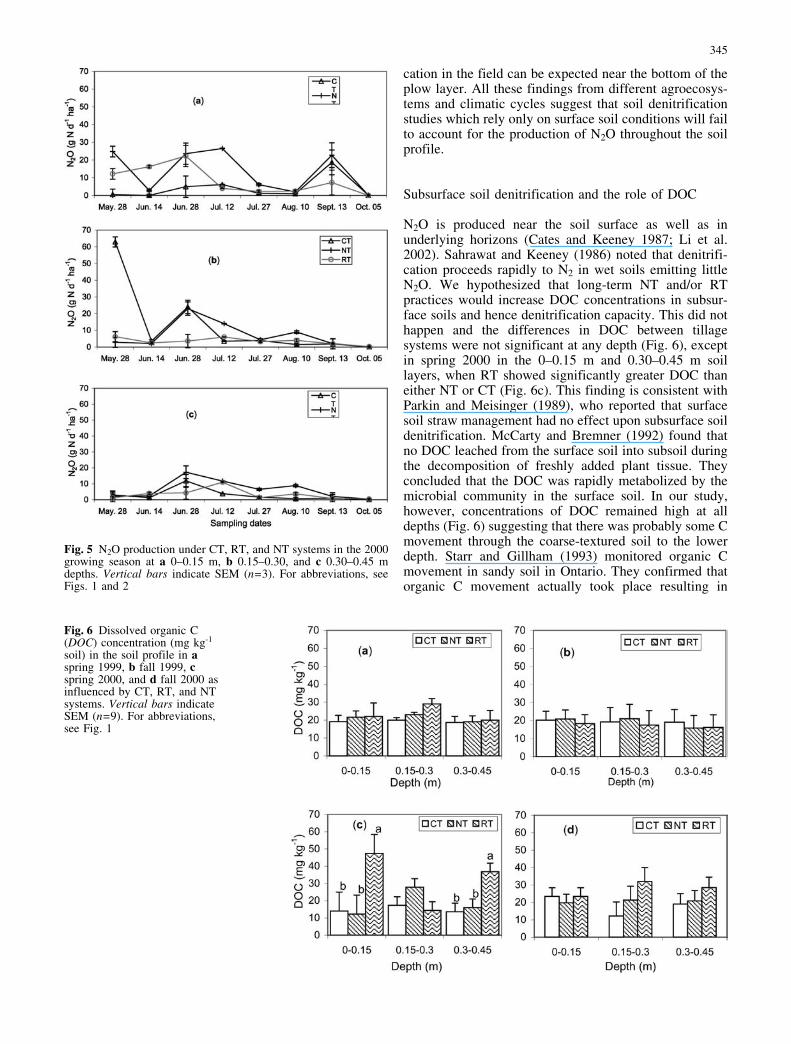
0.30 m depth. An extremely high denitrification rate wasmeasured on 14 June (Fig. 4b). Analysis of the datawithout this value resulted in no significant differencebetween tillage treatments at any depth. N2O productionrates were smaller than denitrification rates for allmeasurements and depths, suggesting that N2 formed alarge proportion of the denitrification gaseous end-products, irrespective of tillage system (Figs. 4, 5).
Mean daily N2O production over the sampling periodsand depths was 9 g day-1 N2O-N ha-1 for CT, 5 g day-1
N2O-N ha-1 for RT, and 6 g day-1 N2O-N ha-1 for NT in1999. In the 2000 season, the values were much greater;20 g day-1 N2O-N ha-1 for CT, 15 g day-1 N2O-N ha-1 forRT, and 27 g day-1 N2O-N ha-1 for NT. These ratescompare well to those measured by Cates and Keeney(1987), who reported mean daily N2O flux values rangingfrom 8 to 12 g day-1 N2O-N ha-1. Burton and Beauchamp(1994) estimated denitrification rates of 200 g day-1 N2O-
Fig. 2 Denitrification rates under CT, RT, and NT systems in the1999 cropping season at a 0–0.15 m, b 0.15–0.30, and c 0.30–0.45 m depths. Vertical bars indicate SEM (n=3). Jun. June, Jul.July, Aug. August Sept. September, Oct. October, d day; for otherabbreviations, see Fig. 1
343
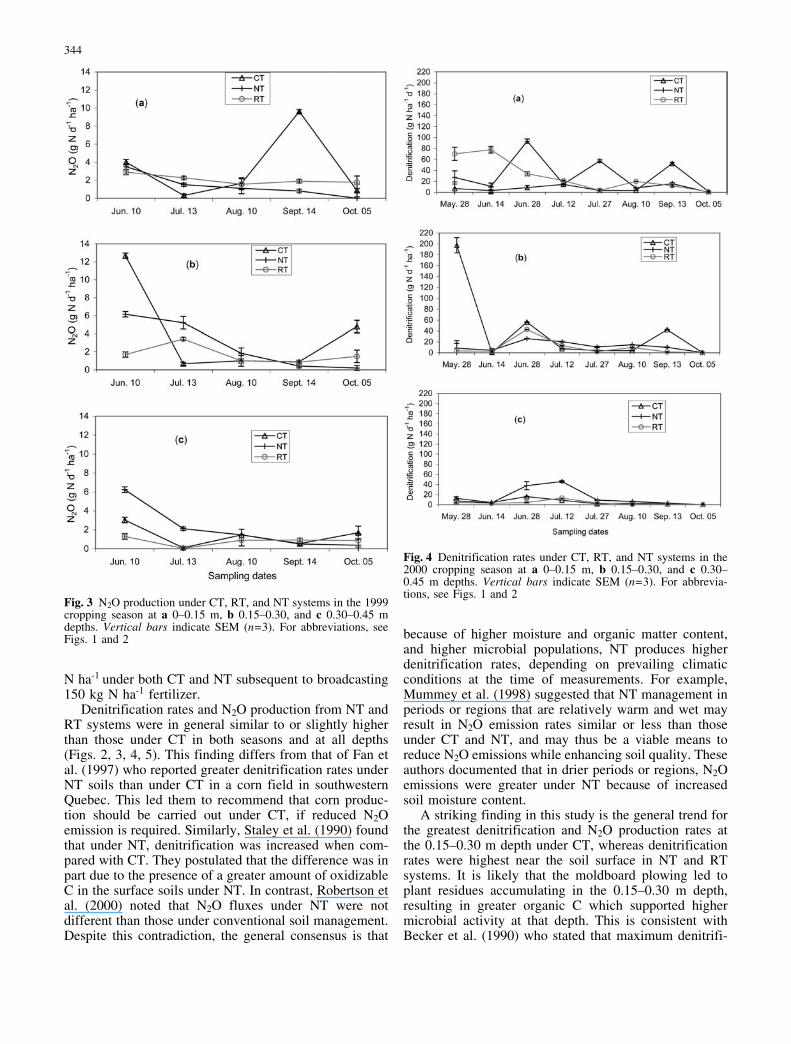
N ha-1 under both CT and NT subsequent to broadcasting150 kg N ha-1 fertilizer.
Denitrification rates and N2O production from NT andRT systems were in general similar to or slightly higherthan those under CT in both seasons and at all depths(Figs. 2, 3, 4, 5). This finding differs from that of Fan etal. (1997) who reported greater denitrification rates underNT soils than under CT in a corn field in southwesternQuebec. This led them to recommend that corn produc-tion should be carried out under CT, if reduced N2Oemission is required. Similarly, Staley et al. (1990) foundthat under NT, denitrification was increased when com-pared with CT. They postulated that the difference was inpart due to the presence of a greater amount of oxidizableC in the surface soils under NT. In contrast, Robertson etal. (2000) noted that N2O fluxes under NT were notdifferent than those under conventional soil management.Despite this contradiction, the general consensus is that
because of higher moisture and organic matter content,and higher microbial populations, NT produces higherdenitrification rates, depending on prevailing climaticconditions at the time of measurements. For example,Mummey et al. (1998) suggested that NT management inperiods or regions that are relatively warm and wet mayresult in N2O emission rates similar or less than thoseunder CT and NT, and may thus be a viable means toreduce N2O emissions while enhancing soil quality. Theseauthors documented that in drier periods or regions, N2Oemissions were greater under NT because of increasedsoil moisture content.
A striking finding in this study is the general trend forthe greatest denitrification and N2O production rates atthe 0.15–0.30 m depth under CT, whereas denitrificationrates were highest near the soil surface in NT and RTsystems. It is likely that the moldboard plowing led toplant residues accumulating in the 0.15–0.30 m depth,resulting in greater organic C which supported highermicrobial activity at that depth. This is consistent withBecker et al. (1990) who stated that maximum denitrifi-
Fig. 3 N2O production under CT, RT, and NT systems in the 1999cropping season at a 0–0.15 m, b 0.15–0.30, and c 0.30–0.45 mdepths. Vertical bars indicate SEM (n=3). For abbreviations, seeFigs. 1 and 2
Fig. 4 Denitrification rates under CT, RT, and NT systems in the2000 cropping season at a 0–0.15 m, b 0.15–0.30, and c 0.30–0.45 m depths. Vertical bars indicate SEM (n=3). For abbrevia-tions, see Figs. 1 and 2
344
cation in the field can be expected near the bottom of theplow layer. All these findings from different agroecosys-tems and climatic cycles suggest that soil denitrificationstudies which rely only on surface soil conditions will failto account for the production of N2O throughout the soilprofile.
Subsurface soil denitrification and the role of DOC
N2O is produced near the soil surface as well as inunderlying horizons (Cates and Keeney 1987; Li et al.2002). Sahrawat and Keeney (1986) noted that denitrifi-cation proceeds rapidly to N2 in wet soils emitting littleN2O. We hypothesized that long-term NT and/or RTpractices would increase DOC concentrations in subsur-face soils and hence denitrification capacity. This did nothappen and the differences in DOC between tillagesystems were not significant at any depth (Fig. 6), exceptin spring 2000 in the 0–0.15 m and 0.30–0.45 m soillayers, when RT showed significantly greater DOC thaneither NT or CT (Fig. 6c). This finding is consistent withParkin and Meisinger (1989), who reported that surfacesoil straw management had no effect upon subsurface soildenitrification. McCarty and Bremner (1992) found thatno DOC leached from the surface soil into subsoil duringthe decomposition of freshly added plant tissue. Theyconcluded that the DOC was rapidly metabolized by themicrobial community in the surface soil. In our study,however, concentrations of DOC remained high at alldepths (Fig. 6) suggesting that there was probably some Cmovement through the coarse-textured soil to the lowerdepth. Starr and Gillham (1993) monitored organic Cmovement in sandy soil in Ontario. They confirmed thatorganic C movement actually took place resulting in
Fig. 5 N2O production under CT, RT, and NT systems in the 2000growing season at a 0–0.15 m, b 0.15–0.30, and c 0.30–0.45 mdepths. Vertical bars indicate SEM (n=3). For abbreviations, seeFigs. 1 and 2
Fig. 6 Dissolved organic C(DOC) concentration (mg kg-1
soil) in the soil profile in aspring 1999, b fall 1999, cspring 2000, and d fall 2000 asinfluenced by CT, RT, and NTsystems. Vertical bars indicateSEM (n=9). For abbreviations,see Fig. 1
345
increased denitrification rates in aquifers where thegroundwater table was <2–3 m. In an Australian claysoil under pasture or an annual crop, Weier et al. (1993)showed that denitrification up to 1.0 m below the soilsurface was possible when available C was not limiting.However, this may only occur after periods of heavyrainfall, when soluble C could percolate with the soilsolution to lower depths in the soil profile. While thecritical role of DOC as a source of energy and nutrients tothe denitrifying community is widely recognized, thethreshold below which denitrification is limited is notclearly defined. In a lysimeter study, Brye et al. (2001)found DOC concentrations ranging from 45 to 82 mg l-1
under a chisel-plowed field. Gambrell et al. (1975)reported that in poorly drained subsoils, a soluble Cconcentration of 12–15 mg l-1 was sufficient to act as aneffective potential energy source for denitrification.Similarly, Obenhuber and Lowrance (1991) suggestedthat significant denitrification occurs at 10 mg DOC l-1,below which concentration little or no denitrification canbe expected. The DOC concentrations in our study rangedfrom 13 to 47 mg kg-1 dry soil.
Ratio of N2O:N2O+N2 in the soil profile
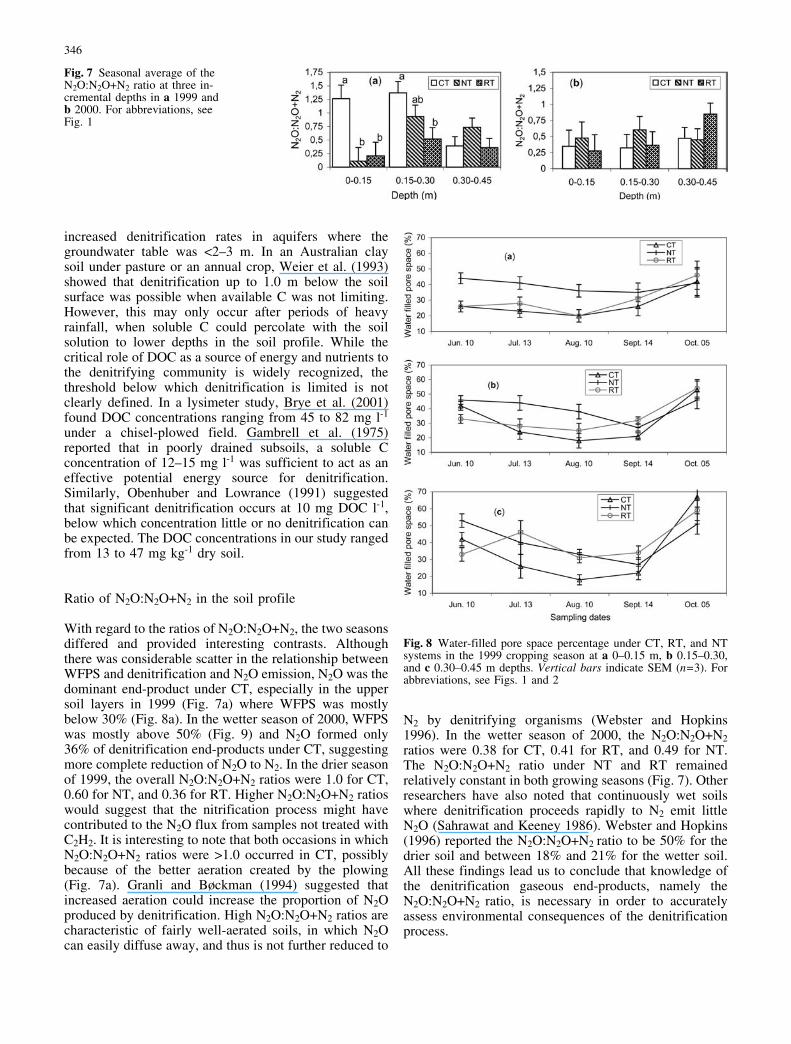
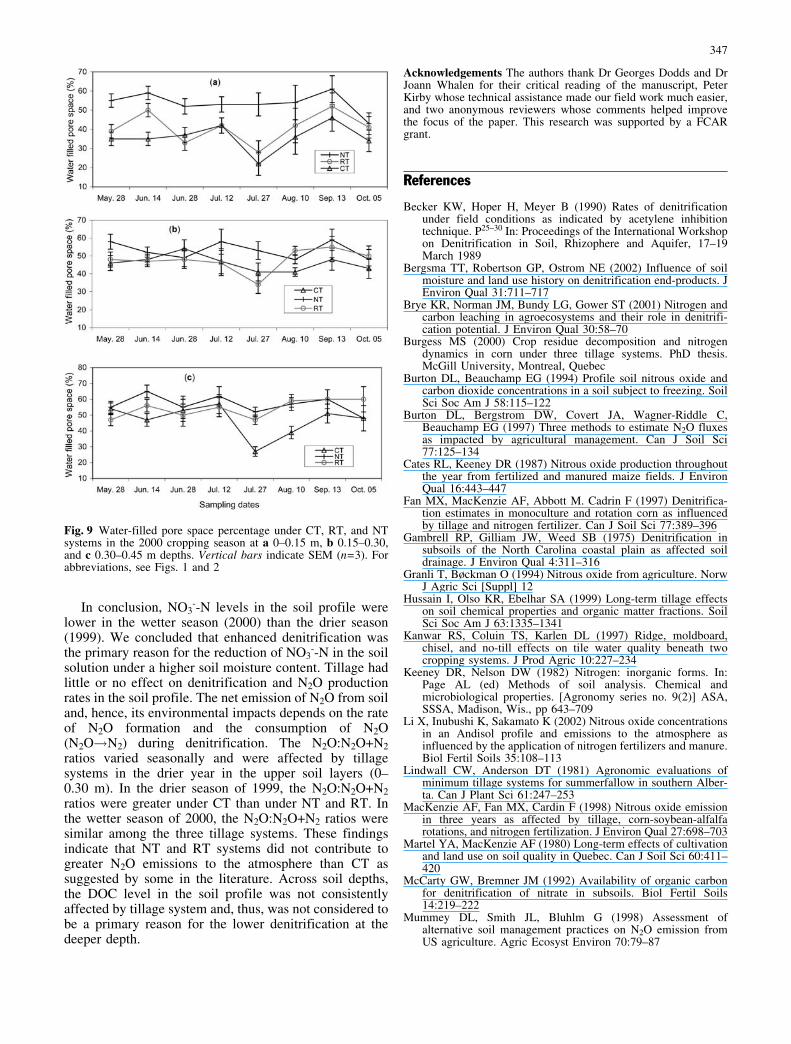
With regard to the ratios of N2O:N2O+N2, the two seasonsdiffered and provided interesting contrasts. Althoughthere was considerable scatter in the relationship betweenWFPS and denitrification and N2O emission, N2O was thedominant end-product under CT, especially in the uppersoil layers in 1999 (Fig. 7a) where WFPS was mostlybelow 30% (Fig. 8a). In the wetter season of 2000, WFPSwas mostly above 50% (Fig. 9) and N2O formed only36% of denitrification end-products under CT, suggestingmore complete reduction of N2O to N2. In the drier seasonof 1999, the overall N2O:N2O+N2 ratios were 1.0 for CT,0.60 for NT, and 0.36 for RT. Higher N2O:N2O+N2 ratioswould suggest that the nitrification process might havecontributed to the N2O flux from samples not treated withC2H2. It is interesting to note that both occasions in whichN2O:N2O+N2 ratios were >1.0 occurred in CT, possiblybecause of the better aeration created by the plowing(Fig. 7a). Granli and Bøckman (1994) suggested thatincreased aeration could increase the proportion of N2Oproduced by denitrification. High N2O:N2O+N2 ratios arecharacteristic of fairly well-aerated soils, in which N2Ocan easily diffuse away, and thus is not further reduced to
N2 by denitrifying organisms (Webster and Hopkins1996). In the wetter season of 2000, the N2O:N2O+N2ratios were 0.38 for CT, 0.41 for RT, and 0.49 for NT.The N2O:N2O+N2 ratio under NT and RT remainedrelatively constant in both growing seasons (Fig. 7). Otherresearchers have also noted that continuously wet soilswhere denitrification proceeds rapidly to N2 emit littleN2O (Sahrawat and Keeney 1986). Webster and Hopkins(1996) reported the N2O:N2O+N2 ratio to be 50% for thedrier soil and between 18% and 21% for the wetter soil.All these findings lead us to conclude that knowledge ofthe denitrification gaseous end-products, namely theN2O:N2O+N2 ratio, is necessary in order to accuratelyassess environmental consequences of the denitrificationprocess.
Fig. 7 Seasonal average of theN2O:N2O+N2 ratio at three in-cremental depths in a 1999 andb 2000. For abbreviations, seeFig. 1
Fig. 8 Water-filled pore space percentage under CT, RT, and NTsystems in the 1999 cropping season at a 0–0.15 m, b 0.15–0.30,and c 0.30–0.45 m depths. Vertical bars indicate SEM (n=3). Forabbreviations, see Figs. 1 and 2
346
In conclusion, NO3--N levels in the soil profile were
lower in the wetter season (2000) than the drier season(1999). We concluded that enhanced denitrification wasthe primary reason for the reduction of NO3
--N in the soilsolution under a higher soil moisture content. Tillage hadlittle or no effect on denitrification and N2O productionrates in the soil profile. The net emission of N2O from soiland, hence, its environmental impacts depends on the rateof N2O formation and the consumption of N2O(N2O!N2) during denitrification. The N2O:N2O+N2ratios varied seasonally and were affected by tillagesystems in the drier year in the upper soil layers (0–0.30 m). In the drier season of 1999, the N2O:N2O+N2ratios were greater under CT than under NT and RT. Inthe wetter season of 2000, the N2O:N2O+N2 ratios weresimilar among the three tillage systems. These findingsindicate that NT and RT systems did not contribute togreater N2O emissions to the atmosphere than CT assuggested by some in the literature. Across soil depths,the DOC level in the soil profile was not consistentlyaffected by tillage system and, thus, was not considered tobe a primary reason for the lower denitrification at thedeeper depth.
Acknowledgements The authors thank Dr Georges Dodds and DrJoann Whalen for their critical reading of the manuscript, PeterKirby whose technical assistance made our field work much easier,and two anonymous reviewers whose comments helped improvethe focus of the paper. This research was supported by a FCARgrant.
References
Becker KW, Hoper H, Meyer B (1990) Rates of denitrificationunder field conditions as indicated by acetylene inhibitiontechnique. P25–30 In: Proceedings of the International Workshopon Denitrification in Soil, Rhizophere and Aquifer, 17–19March 1989
Bergsma TT, Robertson GP, Ostrom NE (2002) Influence of soilmoisture and land use history on denitrification end-products. JEnviron Qual 31:711–717
Brye KR, Norman JM, Bundy LG, Gower ST (2001) Nitrogen andcarbon leaching in agroecosystems and their role in denitrifi-cation potential. J Environ Qual 30:58–70
Burgess MS (2000) Crop residue decomposition and nitrogendynamics in corn under three tillage systems. PhD thesis.McGill University, Montreal, Quebec
Burton DL, Beauchamp EG (1994) Profile soil nitrous oxide andcarbon dioxide concentrations in a soil subject to freezing. SoilSci Soc Am J 58:115–122
Burton DL, Bergstrom DW, Covert JA, Wagner-Riddle C,Beauchamp EG (1997) Three methods to estimate N2O fluxesas impacted by agricultural management. Can J Soil Sci77:125–134
Cates RL, Keeney DR (1987) Nitrous oxide production throughoutthe year from fertilized and manured maize fields. J EnvironQual 16:443–447
Fan MX, MacKenzie AF, Abbott M. Cadrin F (1997) Denitrifica-tion estimates in monoculture and rotation corn as influencedby tillage and nitrogen fertilizer. Can J Soil Sci 77:389–396
Gambrell RP, Gilliam JW, Weed SB (1975) Denitrification insubsoils of the North Carolina coastal plain as affected soildrainage. J Environ Qual 4:311–316
Granli T, Bøckman O (1994) Nitrous oxide from agriculture. NorwJ Agric Sci [Suppl] 12
Hussain I, Olso KR, Ebelhar SA (1999) Long-term tillage effectson soil chemical properties and organic matter fractions. SoilSci Soc Am J 63:1335–1341
Kanwar RS, Coluin TS, Karlen DL (1997) Ridge, moldboard,chisel, and no-till effects on tile water quality beneath twocropping systems. J Prod Agric 10:227–234
Keeney DR, Nelson DW (1982) Nitrogen: inorganic forms. In:Page AL (ed) Methods of soil analysis. Chemical andmicrobiological properties. [Agronomy series no. 9(2)] ASA,SSSA, Madison, Wis., pp 643–709
Li X, Inubushi K, Sakamato K (2002) Nitrous oxide concentrationsin an Andisol profile and emissions to the atmosphere asinfluenced by the application of nitrogen fertilizers and manure.Biol Fertil Soils 35:108–113
Lindwall CW, Anderson DT (1981) Agronomic evaluations ofminimum tillage systems for summerfallow in southern Alber-ta. Can J Plant Sci 61:247–253
MacKenzie AF, Fan MX, Cardin F (1998) Nitrous oxide emissionin three years as affected by tillage, corn-soybean-alfalfarotations, and nitrogen fertilization. J Environ Qual 27:698–703
Martel YA, MacKenzie AF (1980) Long-term effects of cultivationand land use on soil quality in Quebec. Can J Soil Sci 60:411–420
McCarty GW, Bremner JM (1992) Availability of organic carbonfor denitrification of nitrate in subsoils. Biol Fertil Soils14:219–222
Mummey DL, Smith JL, Bluhlm G (1998) Assessment ofalternative soil management practices on N2O emission fromUS agriculture. Agric Ecosyst Environ 70:79–87
Fig. 9 Water-filled pore space percentage under CT, RT, and NTsystems in the 2000 cropping season at a 0–0.15 m, b 0.15–0.30,and c 0.30–0.45 m depths. Vertical bars indicate SEM (n=3). Forabbreviations, see Figs. 1 and 2
347

Obenhuber DC, Lowrance R (1991) Reduction of nitrate in aquifermicrocosm by carbon additions. J Environ Qual 20:255–258
Parkin TB, Meisinger JJ (1989) Denitrification below the croprooting zone as influenced by surface tillage. J Environ Qual18:12–16
Randall GW, Iragavarapu TK (1995) Impact of long-term tillagesystems for continuous corn on nitrate leaching to tile drainage.J Environ Qual 24:360–366
Rice CW, Smith MS (1982) Denitrification in no-till and plowedsoil. Soil Sci Soc Am J 46:1168–1173
Robertson, GP, Paul EA, Harwood RR (2000) Greenhouse gases inintensive agriculture: contributions of individual gases to theradiative forcing of the atmosphere. Science 289:1922–1925
Sahrawat KL, Keeney DR (1986) Nitrous oxide emission from soilAdv Soil Sci 4:103–148
Smith RA, Alexander RB, Wolman MG (1987) Water qualitytrends in the nation’s rivers. Science 235:1607–1615
Sotomayor D, Rice CW (1996) Denitrification in soil profilesbeneath grassland and cultivated soils. Soil Sci Soc Am J60:1822–1828
Staley TE, Caskey WW, Boyer DG (1990) Soil denitrification andnitrification potentials during the growing season relative totillage. Soil Sci Soc Am J 54:1602–1608
Starr RC, Gillham RW (1993) Denitrification and carbon avail-ability in two aquifers. Groundwater 31:934–937
Uri N D (1999) Factors affecting the use of conservation tillage inthe United States. Water Air Soil Pollut 116:621–638
Webster EA, Hopkins DW (1996) Contributions from differentmicrobial process to N2O emission from soil under differentmoisture regimes. Biol Fertil Soils 22:331–335
Weier KL, Doran JW, Power JF, Walters DT (1993) Denitrificationand the dintrogen/nitrous oxide ratio as affected by soil water,available carbon, and nitrate. Soil Sci Soc Am J 57:66–72
348