Soil Nitrous Oxide Emissions in Corn following Three Decades of Tillage and Rotation Treatments
12
152 SSSAJ: Volume 75: Number 1 • January–February 2011 Soil Sci. Soc. Am. J. 75:152–163 Published online 6 Dec. 2010 doi:10.2136/sssaj2009.0147 Received 15 Apr. 2009. *Corresponding author ([email protected]). © Soil Science Society of America, 5585 Guilford Rd., Madison WI 53711 USA All rights reserved. No part of this periodical may be reproduced or transmitted in any form or by any means, electronic or mechanical, including photocopying, recording, or any information storage and retrieval system, without permission in writing from the publisher. Permission for printing and for reprinting the material contained herein has been obtained by the publisher. Soil Nitrous Oxide Emissions in Corn following Three Decades of Tillage and Rotation Treatments Soil Fertility & Plant Nutrition A lthough the atmospheric concentration of N 2 O is less than that of CO 2 , the global warming potential of N 2 O is about 310 times greater than CO 2 and accounts for about 5% of the total greenhouse effect (Smith et al., 2007; Mosier et al., 2004). On a global scale, agriculture contributed 10 to 12% of the 5.120 to 6.116 Pg CO 2 equivalent yr −1 global non-CO 2 anthropogenic emissions of green- house gases in 2005 (Intergovernmental Panel on Climate Change, 2007). Of this amount, N 2 O emissions from agriculture accounted for 58% of the total anthro- pogenic emissions, with emission from soils constituting about 38% of the total N 2 O emissions due to agricultural activities in 2005 (Smith et al., 2007; USEPA, 2010). Furthermore, global agricultural N 2 O emissions are projected to increase by 35 to 60% by 2030 due to increased N fertilizer use and animal manure produc- tion (FAO, 2003). In the United States, soil management activities, such as fertilizer application and other cropping practices, accounted for 67% of all N 2 O emissions, equiva- lent to 5.8% of total greenhouse gas emissions. On average, N 2 O emissions in the United States increased by 5% between 2000 and 2007 (USEPA, 2010; Franzluebbers and Follett, 2005). Corn and soybean production systems account for the highest N 2 O emissions among major cropping systems in the United States (Del Grosso et al., 2005). erefore, several soil management technologies includ- ing reduced tillage or no-till (NT) have been proposed as strategies to mitigate N 2 O emissions to the atmosphere even as the net effects are inconsistent and have Rex A. Omonode Agronomy Dep. Purdue Univ. West Lafayette, IN 47907 Doug R. Smith USDA-ARS National Soil Erosion Lab. Purdue Univ., West Lafayette, IN 47907 Anita Gál Dep. of Soil Science and Agrochemistry Szent István Univ. Páter Károly utca 1 2103 Gödöllö, Hungary Tony J. Vyn* Agronomy Dep. Purdue Univ. West Lafayette, IN 47907 Few experiments have directly compared the long-term effects of moldboard, chisel, and no-till tillage practices on N 2 O emissions from the predominant crop rotation systems in the midwestern United States. is study was conducted from 2004 to 2006 on a tillage and rotation experiment initiated in 1975 on a Chalmers silty clay loam (a Typic Endoaquoll) in west-central Indiana. Our objectives were to assess (i) long-term tillage (chisel [CP], moldboard plow [MP], and no-till [NT]), rotation (continuous corn [Zea mays L.] and corn–soybean [Glycine max (L.) Merr.]), and rotation ´ tillage interaction effects on soil N 2 O emission, and (ii) how soil N 2 O emission is related to environmental factors during corn production under identical N fertilizer management. Seasonal N 2 O emissions were measured at intervals ranging from a few days to biweekly for up to 14 sampling dates in each grow- ing season for corn. Nitrous oxide emissions during the growing season were significantly affected by tillage and rotation but not their interaction; however, 50% of total emissions occurred shortly aſter N application regardless of tillage or rotation practices. Seasonal cumulative emissions were significantly lower under NT but not statisti- cally different for CP and MP. Overall, emissions under NT were about 40% lower relative to MP and 57% lower relative to CP. Rotation corn lowered N 2 O emissions by 20% relative to continuous corn. Higher N 2 O emission under MP and CP appeared to be driven by soil organic C decomposition associated with higher levels of soil–resi- due mixing and higher soil temperatures. Abbreviations: CC, continuous corn; CP, chisel plow; MP, moldboard plow; NT, no-till; RC, rotation corn (corn following soybean); UAN, urea–ammonium nitrate.
-
Upload
independent -
Category
Documents
-
view
0 -
download
0
Transcript of Soil Nitrous Oxide Emissions in Corn following Three Decades of Tillage and Rotation Treatments

152 SSSAJ: Volume 75: Number 1 • January–February 2011
Soil Sci. Soc. Am. J. 75:152–163 Published online 6 Dec. 2010 doi:10.2136/sssaj2009.0147 Received 15 Apr. 2009. *Corresponding author ([email protected]). © Soil Science Society of America, 5585 Guilford Rd., Madison WI 53711 USA All rights reserved. No part of this periodical may be reproduced or transmitted in any form or by any means, electronic or mechanical, including photocopying, recording, or any information storage and retrieval system, without permission in writing from the publisher. Permission for printing and for reprinting the material contained herein has been obtained by the publisher.
Soil Nitrous Oxide Emissions in Corn following Three Decades of Tillage and Rotation Treatments
Soil Fertility & Plant Nutrition
Although the atmospheric concentration of N2O is less than that of CO2, the global warming potential of N2O is about 310 times greater than CO2 and
accounts for about 5% of the total greenhouse effect (Smith et al., 2007; Mosier et al., 2004). On a global scale, agriculture contributed 10 to 12% of the 5.120 to 6.116 Pg CO2 equivalent yr−1 global non-CO2 anthropogenic emissions of green-house gases in 2005 (Intergovernmental Panel on Climate Change, 2007). Of this amount, N2O emissions from agriculture accounted for 58% of the total anthro-pogenic emissions, with emission from soils constituting about 38% of the total N2O emissions due to agricultural activities in 2005 (Smith et al., 2007; USEPA, 2010). Furthermore, global agricultural N2O emissions are projected to increase by 35 to 60% by 2030 due to increased N fertilizer use and animal manure produc-tion (FAO, 2003).
In the United States, soil management activities, such as fertilizer application and other cropping practices, accounted for 67% of all N2O emissions, equiva-lent to 5.8% of total greenhouse gas emissions. On average, N2O emissions in the United States increased by 5% between 2000 and 2007 (USEPA, 2010; Franzluebbers and Follett, 2005). Corn and soybean production systems account for the highest N2O emissions among major cropping systems in the United States (Del Grosso et al., 2005). Therefore, several soil management technologies includ-ing reduced tillage or no-till (NT) have been proposed as strategies to mitigate N2O emissions to the atmosphere even as the net effects are inconsistent and have
Rex A. OmonodeAgronomy Dep.Purdue Univ.West Lafayette, IN 47907
Doug R. SmithUSDA-ARSNational Soil Erosion Lab.Purdue Univ., West Lafayette, IN 47907
Anita GálDep. of Soil Science and AgrochemistrySzent István Univ.Páter Károly utca 12103 Gödöllö, Hungary
Tony J. Vyn*Agronomy Dep.Purdue Univ.West Lafayette, IN 47907
Few experiments have directly compared the long-term effects of moldboard, chisel, and no-till tillage practices on N2O emissions from the predominant crop rotation systems in the midwestern United States. This study was conducted from 2004 to 2006 on a tillage and rotation experiment initiated in 1975 on a Chalmers silty clay loam (a Typic Endoaquoll) in west-central Indiana. Our objectives were to assess (i) long-term tillage (chisel [CP], moldboard plow [MP], and no-till [NT]), rotation (continuous corn [Zea mays L.] and corn–soybean [Glycine max (L.) Merr.]), and rotation ´ tillage interaction effects on soil N2O emission, and (ii) how soil N2O emission is related to environmental factors during corn production under identical N fertilizer management. Seasonal N2O emissions were measured at intervals ranging from a few days to biweekly for up to 14 sampling dates in each grow-ing season for corn. Nitrous oxide emissions during the growing season were significantly affected by tillage and rotation but not their interaction; however, 50% of total emissions occurred shortly after N application regardless of tillage or rotation practices. Seasonal cumulative emissions were significantly lower under NT but not statisti-cally different for CP and MP. Overall, emissions under NT were about 40% lower relative to MP and 57% lower relative to CP. Rotation corn lowered N2O emissions by 20% relative to continuous corn. Higher N2O emission under MP and CP appeared to be driven by soil organic C decomposition associated with higher levels of soil–resi-due mixing and higher soil temperatures.
Abbreviations: CC, continuous corn; CP, chisel plow; MP, moldboard plow; NT, no-till; RC, rotation corn (corn following soybean); UAN, urea–ammonium nitrate.
SSSAJ: Volume 75: Number 1 • January–February 2011 153
not been well quantified globally (Smith and Conen, 2004; Helgason et al., 2005; Li et al., 2005).
Results from research efforts to determine soil manage-ment practice effects on soil N2O emissions from around the world have been largely inconsistent, perhaps due to variability in weather and multiple soil conditions including differences in soil water content, rate and types of fertilizer application, and depth of fertilizer placement (Baggs et al., 2003; Grant et al., 2004; Venterea et al., 2005; Drury et al., 2006). Thus, while some researchers have reported greater N2O emissions with NT (MacKenzie et al., 1997; Ball et al., 1999), others found lower emissions with NT relative to reduced or conventional tillage (Civerolo and Dickerson, 1998; Grant et al., 2004; Drury et al., 2006). Still others observed no significant differences in N2O emission between tilled and untilled soils (Venterea et al., 2005; Lee et al., 2006). Similarly, several studies conducted to determine the influence of other soil management systems on N2O emission in the midwestern United States also reported conflicting results (Goodroad et al., 1984; Jacinthe and Dick, 1997; Robertson et al., 2000; Jacinthe and Lal, 2003; Parkin and Kaspar, 2006; Grandy et al., 2006; Parkin, 2008).
A critical, but less considered, factor that may determine the true effects on N2O emissions is the time interval during which tillage and rotation practices have been followed (Choudhary et al., 2001). Long-term tillage and rotation practices can result not only in changes to soil properties and C stocks, but also in chang-es in N dynamics (Rochette et al., 2008). Emerging research has suggested that increased C sequestration in arable soils may ac-tually increase N2O emissions due to the positive relationship between CO2 and N2O emissions; the latter could ultimately offset reductions in climate radiative forcing that may be gained from long-term NT applications (Li et al., 2005; Xu et al., 2008). These findings are supported by recent results from Rochette et al. (2008) in which annual N2O emissions more than doubled under NT relative to MP-managed soils due to nitrification sus-tained by the decomposition of soil organic matter rather than N fertilizer inputs.
In the midwestern United States, adoption of conservation tillage or NT systems has increased significantly during the past two decades; these systems are regarded as one of the most effec-tive agricultural practices to sequester atmospheric C in the soil (Conservation Tillage Information Center, 2006; Al-Kaisi and Yin, 2005). In Indiana, however, where a corn–soybean rotation predominates in arable soils, NT soybean is typically followed by intensive, full-width tillage systems (such as CP and MP) for corn. In the long term, the relative C sequestration advantage of NT has been observed to decline sharply with depth. For ex-ample, a significantly greater accumulation of C and N occurred in the 30- to 50-cm depth interval with the use of MP relative to NT (Gál et al., 2007). Therefore, it is unclear how these long-term changes to the soil profile distribution and redistribution of organic C resulting from tillage practices will affect N2O emis-sions in these soils.
Thus, although several experiments have been conducted to evaluate the effects of tillage and cropping systems on soil N2O emissions in the midwestern United States, to the best of our knowledge very few studies have been conducted to directly compare emissions from NT, CP, and MP in the dominant crop rotation systems in any one experiment (Grandy et al., 2006). Similarly, the interactive effects of crop rotation and tillage sys-tems on N2O emissions have not been determined to any reason-able extent for this crop production environment. Furthermore, relevant tillage studies are often based on sites with relatively short-term experimental plots (<10 yr, on average) despite some observations that significant changes in the N2O flux response to NT can occur within and following 20 yr of NT initiation (Six et al., 2004). Therefore, our broad objective in this study was to provide critically needed research data for N2O emissions fol-lowing 30 yr of consistent tillage and rotation practices to help improve long-term modeling and prediction accuracies of N2O emissions for typical corn production systems on Mollisols in the midwestern United States. Our specific objectives were to assess (i) the effects of long-term CP and MP on soil N2O emissions and their associated temporal variability relative to NT, (ii) the interactive effects of tillage and rotation on growing season N2O emis-sions, and (iii) how emissions are related to environmental variables during the growing season in continuous corn and corn–soybean rota-tions when the N fertilizer rate was uniform for all corn treatments.
MATERIALS AND METHODSSite Description and Experimental Design
This research was conducted in long-term tillage and crop rotation experimental plots located at the Purdue University Agronomy Center for Research and Education near West Lafayette, Indiana (86°56′ W, 40° 4′ N, elevation 215 m). The soils are classified as Chalmers silty clay loam (a fine-silty, mixed, superactive, mesic Typic Endoaquoll) with inherently poor drainage. The experiments were established in 1975 to determine the long-term yield potential of different tillage and crop ro-tation systems and associated changes in soil characteristics. Drain tiles had been systematically installed in the experimental area at 20-m inter-vals before 1975.
This study included NT, CP, and MP treatments in continuous corn (CC) and corn following soybean (rotation corn, RC). The experi-mental layout was a randomized complete block in a split-plot design, with rotations as the main treatments and tillage randomized in rotations (subunits) with three replications. Each replicate consisted of plots that were 9 m wide and 45 m long. Primary tillage treatments associated with CP and MP occurred in the fall, while secondary tillage operations were performed the following spring just before planting. The MP treatment was applied at the 0.20- to 0.25-m depth using a commercially available International Harvester five-furrow 0.46-m semimounted moldboard plow. Chisel plowing was performed to the 0.20-m depth using a DMI (Case New-Holland, Goodfield, IL) coulter-chisel plow equipped with 10-cm twisted-shovel points on 37-cm centers and a Danish-tine sweep leveling bar. Secondary tillage operations for the MP and CP plots in-volved one pass of a tandem disk with spring-tooth harrow followed by a field cultivator with C-shank sweeps and rear-mounted, double rolling

154 SSSAJ: Volume 75: Number 1 • January–February 2011
baskets; both operations disturbed soil to a depth of approximately 0.10 m. Following spring tillage operations, soil surface residue cover in these plots averaged 3% in MP, 31% in CP, and 93% in the NT system.
For these plots, corn (Pioneer 31N28; average grain yield = 12.2 Mg ha−1 at 15.5% moisture content for corn after corn and 13.1 Mg ha−1 for corn after soybean) was planted in 0.76-m rows with a Case-IH Model 955 row planter (Case New-Holland, Saskatoon, SK, Canada) on 29 Apr. 2004, 19 Apr. 2005, and 29 Apr. 2006. No-till CC was planted 0.15 m beside the previous corn rows using unit-mounted row cleaners to clear the row area of residue when planting into corn and soybean residue. Because the primary focus of this research was on long-term tillage and rotation effects on N2O emissions, and because the focus since 1975 was on corn or soybean yield response to tillage and rotation when all other management variables were held constant, N fertilizer was applied to ensure that N fertilizer effects were similar across tillage and rotation treatments. Therefore, all corn treatments re-ceived equal amounts of fertilizer application each year. Starter fertilizer N was applied during the corn planting operation at 36 kg N ha−1 as NH4NO3 in a typical band 5 cm from the corn rows. Side-dressed N was applied as 28% urea–NH4NO3 (UAN) at a rate of 222 kg N ha−1 on 30 May 2004 and 6 June 2005. On 15 June 2006, however, UAN was side-dress applied to all treatments at a rate of 260 kg N ha−1 to po-tentially help achieve higher corn yields following a 15% yield increase observed in the 2004 and 2005 growing seasons due to the use of higher yielding hybrids than those in the previous decade of this experiment. Sidedress UAN was consistently coulter injected between the corn rows to a depth of 5 to 8 cm. Phosphorus and K fertilizers were periodically broadcast applied (either alone or in combination) at similar rates to all treatments before fall primary tillage operations to maintain ad-equate to high soil-test levels. Periodic liming enabled the near-surface (0–0.10-m) soil pH to be maintained near 6.5. The selected soil chemi-cal characteristics of pH, available P, and exchangeable K (Table 1) in the surface 0.20 m were determined using the 1:1 soil/water, Bray-1, and Mehlich-3 (Mehlich, 1984) analytical procedures, respectively, in a commercial laboratory (A& L Great Lakes Laboratories, Fort Wayne, IN). Soil organic C and total N (Table 2) were determined for the 0- to 0.05-, 0.05- to 0.15-, and 0.15- to 0.30-m depth intervals using a LECO 2000 CHN analyzer (LECO Corp., St. Joseph, MI).
Nitrous Oxide Emission MeasurementsIn the 2004 and 2005 growing seasons, N2O emissions were
measured weekly or biweekly for up to 14 wk; emissions were sampled weekly for 7 wk beginning on 23 June (8 wk after secondary tillage and 6 wk after planting) through 4 September in 2004, and for 14 wk begin-ning on 8 April (1 wk before secondary tillage) through 13 September in 2005. Because of inclement weather conditions during July and re-source constraints, sampling was performed only once in July 2005. In the course of sampling in 2005, we observed that N2O emission spikes were short lived; most emissions occurred within 20 d after N fertilizer application. Therefore, in 2006 the interval between sampling dates was reduced to 2 to 4 d following fertilizer application, and a more intensive sampling was performed for 14 measurement periods beginning on 15 June (i.e., just before UAN application) through 7 September.
Soil surface N2O fluxes were measured by the vented flux cham-ber method (Mosier et al., 2006). In each plot, duplicate aluminum anchors measuring ?0.74 by 0.35 by 0.12 m were driven about 0.10 m into the soil. Within each plot, anchors were placed 10 m apart and a carpenter’s level was used to ensure that the anchors were level. To en-sure that our sampling captured emissions from row and interrow areas, anchors were placed across rows such that the 0.74-m width of the an-chor extended from approximately one quarter of one interrow to ap-proximately three quarters of the interrow on the opposite side of the same row. Kessavalou et al. (1998) reported a significantly higher gas emission from crop rows relative to interrows, but our anchors were po-sitioned to capture both areas in a representative fashion. Anchors were kept in the same positions following side-dress UAN application, and any corn plants present in the 0.35-m row length per anchor sampling position were cut off at the soil surface. Overall, corn plant density ex-ceeded 75,000 plants ha−1 in all plots.
Gas samples were collected by placing chambers (volume = 32.4 L) over anchors and collecting gas samples from the chamber headspace through a rubber septum at regular intervals of 0, 5, 10, and 15 min after deployment (Jury et al., 1982) using a 20-mL polypropylene syringe. Immediately following collection, gas samples were transferred to pre-evacuated 12-mL Exetainer vials (Labco, High Wycombe, UK). All gas sampling was performed in duplicate between 1200 and 1500 h on each sampling date, when biological activity and flux rates were expected to be greatest (Bajracharya et al., 2000; Jacinthe and Lal, 2004; Ginting and Eghball, 2005).
Table 1. Selected soil chemical characteristics at the 0- to 0.10- and 0.10- to 0.20-m depth intervals following 30 yr of rotation and tillage practices at the Purdue Agricultural Research Center, West Lafayette, IN.
Treatment pH Available P Exchangeable K
Rotation† Tillage‡ 0–0.10 m 0.10–0.20 m 0–0.10 m 0.10–0.20 m 0–0.10 m 0.10–0.20 m
————————— mg kg−1 ————————
CC
MP 6.8 ab§ 6.7 a 49 b 55 152 c 171
CP 7.0 a 6.2 b 94 a 54 236 b 150
NT 6.5 ab 5.4 c 117 a 74 328 a 175
RCMP 6.8 a 6.9 a 47 c 55 148 c 152
CP 7.1 b 6.6 a 84 b 54 202 bc 141NT 6.7 a 5.5 b 124 a 74 344 a 157
† CC, continuous corn; RC, rotation corn.‡ MP, moldboard plow; CP, chisel plow; NT, no-till.§ Within rotations, means in columns followed by the same letter are not significantly different according to a Student–Newman–Kuels test (P £ 0.05).
SSSAJ: Volume 75: Number 1 • January–February 2011 155
Concentrations of N2O in the gas samples were determined us-ing a gas chromatograph (Varian 3800 GC, Mississauga, ON, Canada) equipped with an automatic Combi-Pal injection system (Varian, Mississauga) described by Drury et al. (2004). Briefly, gas samples were automatically injected into the chromatograph using the Combi-Pal sampler. The N2O concentration in the gas samples was measured using a 3.05-m-long Porapak Q with Ar (95%) and CH4 (5%) carrier gas flowing at 30 mL min−1 and analyzed with an electron capture detector set at 350°C. Cumulative N2O-N losses during the measure-ment periods were estimated by linearly interpolating N2O emissions between sampling dates.
Soil and Weather VariablesDaily precipitation and temperature data were recorded from a
nearby automated Purdue weather station located about 1.5 km from our experimental plots. The soil temperature and volumetric moisture content were determined simultaneously at the time of gas measure-ments. The soil temperature was recorded with a thermometer to the 0.10-m soil depth, and volumetric soil water content was determined to a depth of 0 to 0.12 m using a time domain reflectometer (Field Scout TDR 300 Serial 346, Spectrum Technologies, Plainfield, IL).
Soil samples were collected periodically to determine soil inorgan-ic N concentrations. From each treatment plot, composite soil samples were collected by taking 10 to 15 soil cores (0.07-m diameter) from the surface 0.30-m depth interval around the gas chambers. Samples were stored in sealed plastic bags and placed in coolers at 4°C before being transported to the laboratory for analysis. Soil samples were collected on 3 June, 14 July, 28 July, and 4 Sept. 2004; 3 May, 17 May, and 1 June 2005; and 29 June, 19 July, and 15 Aug. 2006. The samples were homog-enized manually and NO3–N and NH4–N were extracted by shaking in a 2 mol L−1 KCl solution (10:1 extractant/soil ratio) for 1 h. The solu-tion was filtered through Whatman no. 42 filter papers (Whatman Ltd., Maidstone, UK) and then analyzed with a Technicon Autoanalyzer II (Technicon Industrial Systems, Tarrytown, NY) in a commercial labo-ratory (A& L Great Lakes Laboratories, Fort Wayne, IN).
Statistical AnalysisThe normality of distribution of all the data was assessed by the
kurtosis, skewness, and Shapiro–Wilk coefficients. The data were then
logarithmically transformed where necessary. Data transformation, however, did not signifi-cantly improve the normality of the N2O emis-sion data; therefore the original data were used for all statistical analyses. The data were separated by tillage and rotation systems and generalized linear model (GLM) statistical analyses were performed to determine the effects of rotation, tillage, and their interaction on N2O emissions. Because gas emission rates were measured repeat-edly over time from the same spot, analysis of variance for a split-plot design over time was com-puted using the analysis of repeated measurement in the PROC MIXED procedure of SAS (SAS Institute, 2002) where rotation, tillage, measure-
ment dates, and their interactions were considered fixed effects, while replicates (blocks) and rotation ´ tillage interaction were considered random effects. Thereafter, emission data for all 3 yr were pooled and analyzed, with the year of measurement as an additional random effect.
The effects of the tillage and rotation systems on soil variables (NO3–N, NH4–N, moisture, and temperature) and how soil and weather characteristics (precipitation and air temperature) affected N2O emissions were evaluated using stepwise linear multiple regression models in the PROC GLM procedure. Due to the small sample size (n = 10), however, NO3–N and NH4–N data were not included in the multiple regression analysis but analyzed separately by combining data across years in a simple correlation and regression analysis. Treatment means were separated using LSD, and the effects of rotation, tillage, and their interaction on gas emissions and soil variables were declared significant at the 5% level of probability (a = 0.05). All analyses were performed using the version 9.1 SAS package (SAS Institute, 2002).
RESULTS AND DISCUSSIONSoil and Weather Variables
Air temperature and precipitation are shown in Fig. 1, and soil temperature and volumetric moisture contents measured across the growing season (April–September) are shown in Fig. 2. Mean daily air temperatures (Fig. 1) ranged between 7.4 and 26.6 in 2004, 5.8 and 29.5 in 2005, and 10.3 and 25.5°C in 2006, and season-long average values were 18.5, 19.6, and 18.7.0°C re-spectively, in 2004, 2005, and 2006. Cumulative precipitation was 693 mm in 2004, 429 mm in 2005, and 691 mm in 2006. The 30-yr average air temperature and precipitation for the same time period were 19°C and 558 mm, respectively (data not shown). Therefore, growing season mean air temperature and cumulative precipitation values for the study period were generally similar to the 30-yr average, except in 2005 when cumulative precipitation was less than the 30-yr average.
Soil temperature and moisture conditions varied widely within and between growing seasons (Fig. 2). In 2004 (Fig. 2a), however, there was less variation in soil temperature and volu-metric moisture conditions because of the relatively short period of measurement; neither tillage nor rotation had significant (P = 0.05) effects on these seasonal average soil temperature and
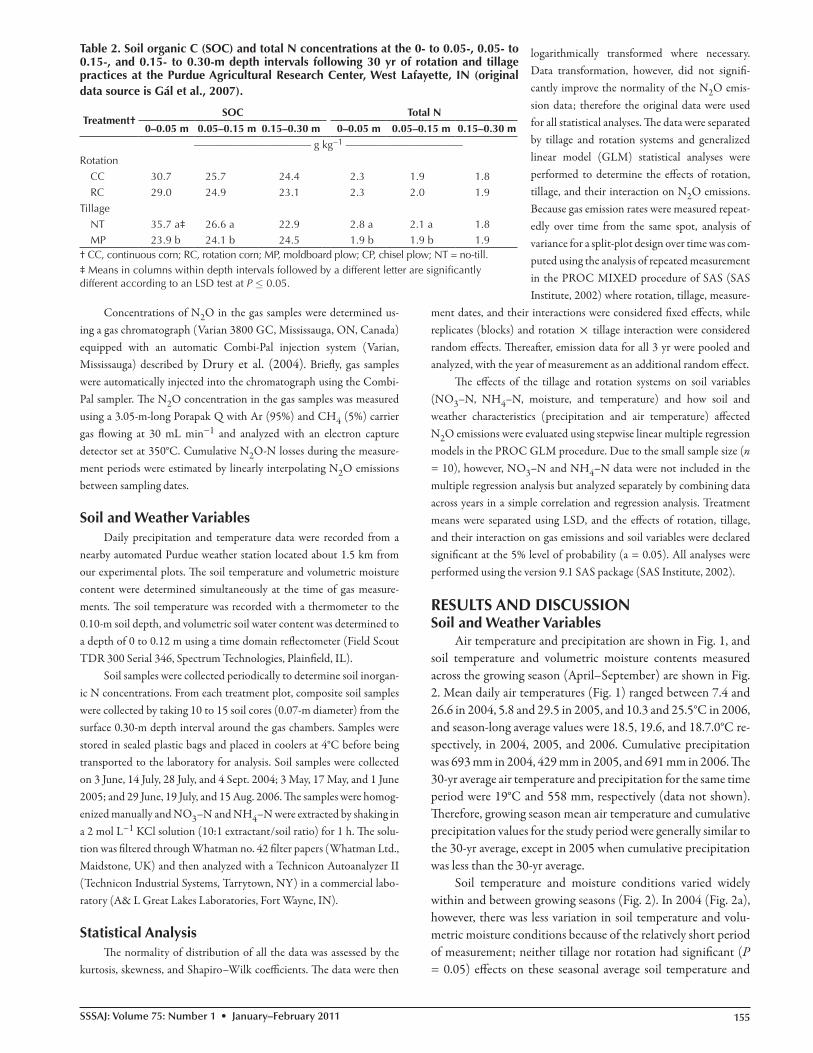
Table 2. Soil organic C (SOC) and total N concentrations at the 0- to 0.05-, 0.05- to 0.15-, and 0.15- to 0.30-m depth intervals following 30 yr of rotation and tillage practices at the Purdue Agricultural Research Center, West Lafayette, IN (original data source is Gál et al., 2007).
Treatment†SOC Total N
0–0.05 m 0.05–0.15 m 0.15–0.30 m 0–0.05 m 0.05–0.15 m 0.15–0.30 m
——————————— g kg−1 ———————————Rotation
CC 30.7 25.7 24.4 2.3 1.9 1.8
RC 29.0 24.9 23.1 2.3 2.0 1.9
Tillage
NT 35.7 a‡ 26.6 a 22.9 2.8 a 2.1 a 1.8 MP 23.9 b 24.1 b 24.5 1.9 b 1.9 b 1.9† CC, continuous corn; RC, rotation corn; MP, moldboard plow; CP, chisel plow; NT = no-till.‡ Means in columns within depth intervals followed by a different letter are significantly different according to an LSD test at P £ 0.05.

156 SSSAJ: Volume 75: Number 1 • January–February 2011
moisture conditions. In 2005, soil temperatures rose dramati-cally from 5.6°C on 9 May to 30°C on 31 May, and then de-creased to become steady at 20 to 25°C for the rest of the study period. In contrast, the volumetric soil water content was rela-tively high and steady at about 25 to 30% from May to early June and then declined rapidly to about 10% for the rest of the study period (Fig. 2b). In 2006, wide fluctuations in soil temperature (25–35°C) and volumetric water content (15–33 m3 m−3) were observed between May and early July.
For 2005 and 2006, seasonal average soil temperatures were not significantly different between rotations (Table 3) but were significantly affected by tillage (P < 0.002) and rotation ´ tillage interaction (P < 0.002). For both years, soil tempera-ture was significantly lower for NT relative to CP and MP. In contrast, the seasonal average volumetric soil water content was significantly affected by rotation (P < 0.005) in 2005 and rota-tion ´ tillage interaction in 2006; volumetric soil water content was greater under RC (mean = 20.0 m3 m−3) relative to CC (mean = 18.6 m3 m−3). Neither tillage nor rotation significantly affected soil temperature and volumetric water content in 2006 (Table 3). Soil temperatures tended to be significantly lower under NT relative to CP and MP from early spring to late summer, however, with the greatest difference being observed in late May. Conversely, volumetric soil water content tended to be significantly higher under NT up to late spring, only to become lower in the summer.
A one-way analysis of variance indicated that soil NO3–N and NH4–N concentrations were not signif-
icantly different for either rotation or tillage system, which was probably due to the limited size of the database (n = 10); howev-er, NO3–N and NH4–N concentrations were numerically great-er under NT relative to CP and MP (Fig. 3a) and for CC com-pared with RC (Fig. 3b). An apparently higher level of NO3–N for NT was probably due to the nearly 30% higher total soil N in the upper 30 cm for NT than for MP systems at this site (Gál et al., 2007), or possibly because of greater leaching of NO3–N un-der MP relative to NT and CP after the sidedress N fertilizer ap-plication. On average, the NO3–N concentration was 23.8, 23.0, and 17.3 mg kg−1 for NT, CP, and MP, respectively, and was 21.6 and 21.1 mg kg−1 for CC and RC, respectively. Similarly, the av-erage NH4–N concentration was greater under NT than MP and CP (6.1, 5.8, and 4.9 mg kg−1, respectively) and was 6.0 and 5.2 mg kg−1 for CC and RC, respectively.
Seasonal Nitrous Oxide EmissionsSeasonal variability of N2O fluxes under tillage and rota-
tion systems for each year are presented in Fig. 4. In general, the pattern of N2O emission was temporally similar among tillage and rotation systems but varied significantly in magnitude with year. In 2004, N2O values ranged from 7 to 40 g N ha−1 d−1, with emissions being greatest on 23 June, followed by near-zero emissions for the remaining periods of measurement (Fig. 4a). The emission pattern observed for 2004 was due to late sampling (which started 6 wk after N fertilizer application) and to the distribution and timing of rainfall, which led to early saturated
Fig. 1. Daily air temperature and precipitation from 1 April to 30 September of the 2004, 2005, and 2006 cropping seasons recorded at the Purdue Agricultural Research Center, West Lafayette, IN.

SSSAJ: Volume 75: Number 1 • January–February 2011 157
soil conditions. In 2004, high-intensity precipitation events occurred between April and mid-June (150–270 mm of rainfall on individual days that resulted in flooding) before sampling, while relatively drier than normal weather conditions prevailed during the gas sampling period. Consequently, substantial N2O
emissions that may have occurred under saturated soil conditions were not recorded in 2004.
In 2005, seasonal N2O-N emissions were very low and al-most undetectable before fertilizer application due to low soil temperature and moisture conditions. Nine days following UAN
Fig. 2. Soil temperature and volumetric soil water content averaged across rotations for chisel plow, moldboard plow, and no-till systems in the (a) 2004, (b) 2005, and (c) 2006 growing seasons. Error bars indicate standard error (n = 3). There were no significant differences in soil temperature or volumetric soil water content due to rotation.

158 SSSAJ: Volume 75: Number 1 • January–February 2011
application, however, N2O emissions increased significant-ly from near zero to, on average, about 109 g N ha−1 d−1 for rotations and 135 g N ha−1 d−1 under tillage treat-ments; thereafter, N2O emission declined rapidly for the rest of the sampling period (Fig. 4b). The greatest spike in N2O emission occurred on 15 June; however, other less but distinct spikes in emission were also observed on 25 April (1 d after corn planting) and 23 May, events that were at-tributed to a combination of spring temperature fluctua-tions and starter N application. Collectively, these episodic spikes represented >50.2% of the total growing season emissions in 2005.
Compared with previous years, N2O fluxes were rela-tively greater in 2006 due in part to higher rates of N fertil-izer application and favorable soil moisture and tempera-ture conditions. Averaged across treatments, N2O emis-sions ranged from 38 to 533 g N ha−1 d−1, with the great-est emissions occurring in mid-June. In the 2006 growing season, three large but nearly equal spikes of emission were observed on 19 June, 6 July, and 14 July (Fig. 4c). The spike on 19 June was probably due to side-dressed UAN application to relatively moist soil the previous day, while the latter spikes were attributed to sustained high precipitation and temperatures that followed 2 to 3 wk of relatively low temperatures before gas measure-ments. Together, the three events accounted for nearly 50% of total emissions during the growing season.
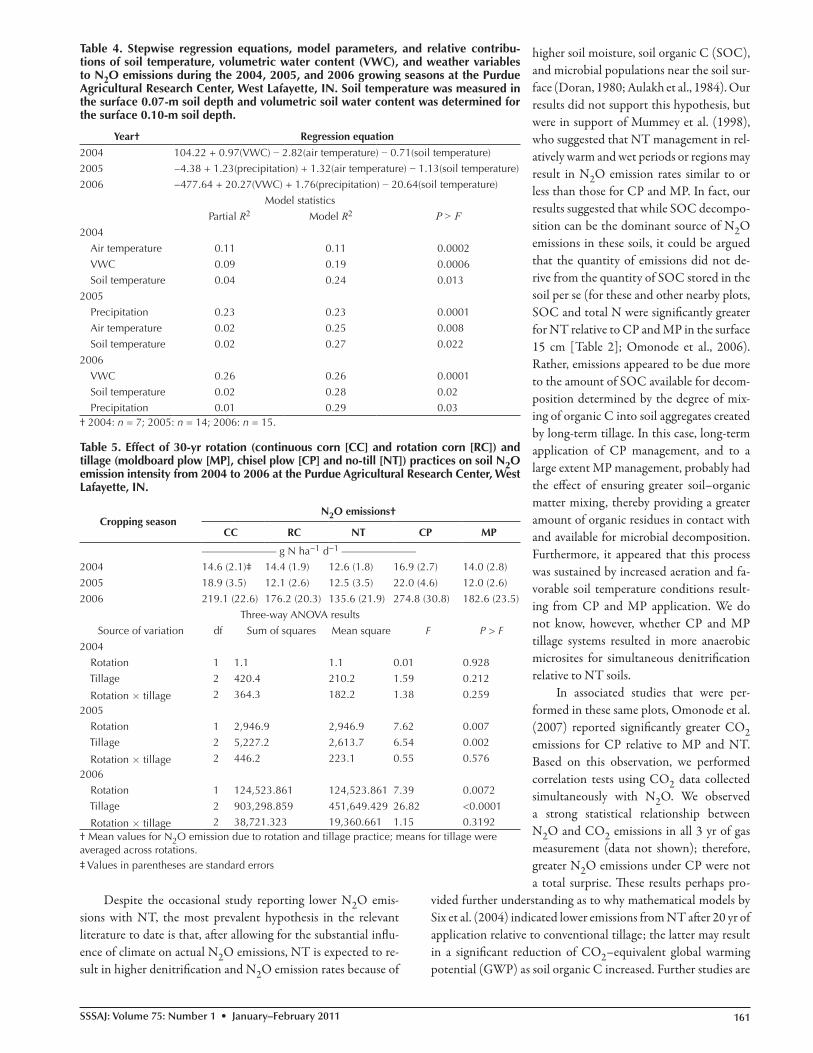
The relationship and effects of environmental factors on N2O emissions are shown in Table 4. Although correlations be-tween emissions and environmental factors were somewhat low (maximum r < 0.54), their functional relationship and effects on emission were highly significant (P < 0.001) in most cases. In 2004, air temperature accounted for about 11 of the 23% of total variability. Similar to the results of Jarecki and Lal (2006), precipitation alone accounted for about 23% of the total vari-ability in N2O emissions in 2005, while soil volumetric water content was the dominant factor of emission variability in 2006, contributing 26 of the 29% variability associated with emissions. It should be noted that in all 3 yr, only soil and air temperature had significant influences on emissions. Although a linear and positive correlation existed between N2O emission and soil NH4–N (r = 0.23, P < 0.002), its contribution to the variability of emissions was rather small (5%).
Rotation and Tillage Effects on Nitrous Oxide Emission
Nitrous oxide emissions in 2004 were low, averaging about 14.5 g N ha−1 d−1 across crop rotations and tillage sys-tems (Table 5); neither rotation, tillage, nor rotation ´ till-age interaction affected seasonal N2O emission. In both 2005 and 2006, however, rotation and tillage effects on N2O emis-sion were highly significant (P < 0.008 and P < 0.007, respec-tively), but emissions were not affected by a rotation ´ tillage interaction. In 2005, seasonal average N2O emissions were sig-nificantly greater under CC (mean = 18.9 g N ha−1 d−1) than
RC (mean = 12.1 g N ha−1 d−1), and emissions were greater for CP (22.0 g N ha−1 d−1) relative to NT (12.5 g N ha−1 d−1) and MP (12.0 g N ha−1 d−1). Significant rotation differences in N2O emissions between rotations occurred only in the early growing season on 25 April and 2 May, while significant tillage differences were observed on 23 May and 26 July (Fig. 4b). In 2006, average seasonal emissions were greater under CC (219.1 g N ha−1 d−1) than RC (176.2 g N ha−1 d−1). Similarly, seasonal average emis-sions were significantly greater for CP (274.8 N ha−1 d−1) rela-tive to MP (182.6 g N ha−1 d−1) and NT (135.6 g N ha−1 d−1).
Across the 3 yr of measurement, however, seasonal average emis-sions were significantly affected by year of measurement, tillage, and year ́ tillage interaction. Neither rotation nor rotation ́ tillage interaction affected N2O emissions (Table 4). On average, emissions were significantly greater under CP (mean = 127 g ha−1 d−1) but were not statistically different between the MP (mean = 84.0 g ha−1 d−1) and NT (mean = 64.8 g ha−1 d−1) systems.
Cumulative seasonal N2O-N emissions were 3.39 kg ha−1 under CC and 2.61 kg ha−1 under RC; these emissions corre-sponded to about 2% of applied N in 2005. In 2006, cumulative N loss represented up to 7% of applied N and was 13.51 kg ha−1 under CC and 11.79 kg ha−1 under RC (Table 5). Cumulative emissions due to tillage were in the order CP > MP = NT in 2005 and CP = MP > NT in 2006. Across all 3 yr of measure-ment, the tillage effect on cumulative emissions was significant (P < 0.0005), but neither rotation nor rotation ´ tillage interac-tion had significant effects on cumulative emissions (Table 6). Three-year cumulative average emissions were in the order CP > MP > NT, being 7.3, 5.6, and 3.4 kg ha−1, respectively, but were not significantly different between rotations (CC = 6.0 kg ha−1, RC = 4.8 kg ha−1). The lack of significant differences in cumula-tive emissions due to rotation could be explained in part by the fact that the majority of the differences in N2O emissions due to rotation occurred either before fertilizer application (as in
Table 3. Effect of 30-yr rotation and tillage treatment practices on soil temperature and volumetric soil water content from 2004 to 2006 at the Purdue Agricultural Research Center, West Lafayette, IN.
Treatment†Soil temperature Volumetric soil water content
2004 2005 2006 2004 2005 2006
————— °C ————— ———— m3 m−3 ————Tillage
NT 23.45 20.53 a‡ 23.93 a 31.00 19.35 22.71 a
CP 23.91 22.19 b 24.48 b 30.76 19.37 22.91 ab
MP 24.14 22.23 b 24.62 b 29.98 19.21 23.52 b
Rotation
CC 23.85 21.59 24.25 29.67 18.60 a 23.13
RC 23.81 21.71 24.44 31.45 20.01 b 22.96
P > F
Rotation 0.82 0.56 0.08 0.30 0.005 0.58
Tillage 0.17 0.001 0.001 0.84 0.95 0.09Rotation ´ tillage 0.85 0.002 0.002 0.88 0.11 0.002† CC, continuous corn; RC, rotation corn; MP, moldboard plow; CP, chisel plow; NT, no-till.‡ Means in columns within treatment followed by the same letter are not significantly different according to an LSD test at P £ 0.05.

SSSAJ: Volume 75: Number 1 • January–February 2011 159
2005) or when emissions were low or not event driven early in the growing season (as in 2006).
In general, N2O emission values reported in this study were similar to those reported for other parts of the Midwest (Goodroad et al., 1984; Jacinthe and Dick, 1997; Parkin and Kaspar, 2006; Grandy et al., 2006). Although not significant, the numerically greater emissions for CC reported here were in sup-port of several results that suggested emissions were greater from CC than from soybean or from the wheat (Triticum aestivum L.) phase of corn–soybean–wheat rotations ( Jacinthe and Dick, 1997; Adviento-Borbe et al., 2006). The lack of a cumulative N2O emission difference due to rotations was in sharp contrast, however, to results obtained by Mosier et al. (2006) that indicated significantly greater emissions for RC than CC with or without added fertilizer N. In this study, the seemingly greater emissions for CC was unexpected but not entirely surprising; both CC and RC plots received equal amounts of fertilizer N and, if anything, more mineral N was expected from the previous soybean crop because of less N immobilization in decomposing soybean vs.
corn residues as well as possible residual mineral N gains from N fixation by the previous soybean crop. In corn–soybean rotation systems, however, significant N2O losses appear to occur more during the soybean year, especially after soybean harvest (Walters et al., 2007). Thus, a possible explanation for the higher emis-sions under CC observed here was that overall nitrification and denitrification rates were higher in that system because of annual N application (and, therefore, long-term doubling of N fertilizer applications vs. the biannual N application to RC). Furthermore, similar to suggestions by Adviento-Borbe et al. (2006), it is pos-sible that several decades of higher crop residue inputs associated with CC vs. RC provided a greater C substrate supply for micro-bial decomposition, which contributed to increased denitrifica-tion. It is interesting to note, however, that total soil N to a 1.0-m sampling depth was not higher in CC vs. RC rotations for these experimental plots (Gál et al., 2007).
Significantly greater N2O-N losses from CP relative to MP and NT was consistent with Jacinthe and Dick (1997), who reported significantly more emissions from CP relative to NT, but
Fig. 3. Soil (a) NO3–N and (b) NH4–N concentrations under chisel plow, moldboard plow, and no-till and under continuous and rotation corn systems. Error bars represent standard error (n = 10).

160 SSSAJ: Volume 75: Number 1 • January–February 2011
contrasted with other studies reported in the Midwest where no differences in N2O-N losses between CP and NT or MP and NT were reported (Robertson et al., 2000; Parkin and Kaspar, 2006). Parkin and Kaspar (2006) reported that 3-yr average emissions from fields in Iowa was not significantly different between CP
and NT emissions. Similarly, in a 12-yr tillage study in Michigan, Grandy et al. (2006) found no significant difference in average emissions under NT than MP. In eastern Canada, Rochette et al. (2004) reported more than double the amount of emissions under NT relative to MP in similar high-clay-content soils.
Fig. 4. Seasonal soil N2O emissions due to rotation and tillage practices in the (a) 2004, (b) 2005, and (C) 2006 growing seasons. Error bars represent standard error. Arrows indicate urea–NH4NO3 (UAN) application dates for each year.
SSSAJ: Volume 75: Number 1 • January–February 2011 161
Despite the occasional study reporting lower N2O emis-sions with NT, the most prevalent hypothesis in the relevant literature to date is that, after allowing for the substantial influ-ence of climate on actual N2O emissions, NT is expected to re-sult in higher denitrification and N2O emission rates because of
higher soil moisture, soil organic C (SOC), and microbial populations near the soil sur-face (Doran, 1980; Aulakh et al., 1984). Our results did not support this hypothesis, but were in support of Mummey et al. (1998), who suggested that NT management in rel-atively warm and wet periods or regions may result in N2O emission rates similar to or less than those for CP and MP. In fact, our results suggested that while SOC decompo-sition can be the dominant source of N2O emissions in these soils, it could be argued that the quantity of emissions did not de-rive from the quantity of SOC stored in the soil per se (for these and other nearby plots, SOC and total N were significantly greater for NT relative to CP and MP in the surface 15 cm [Table 2]; Omonode et al., 2006). Rather, emissions appeared to be due more to the amount of SOC available for decom-position determined by the degree of mix-ing of organic C into soil aggregates created by long-term tillage. In this case, long-term application of CP management, and to a large extent MP management, probably had the effect of ensuring greater soil–organic matter mixing, thereby providing a greater amount of organic residues in contact with and available for microbial decomposition. Furthermore, it appeared that this process was sustained by increased aeration and fa-vorable soil temperature conditions result-ing from CP and MP application. We do not know, however, whether CP and MP tillage systems resulted in more anaerobic microsites for simultaneous denitrification relative to NT soils.
In associated studies that were per-formed in these same plots, Omonode et al. (2007) reported significantly greater CO2 emissions for CP relative to MP and NT. Based on this observation, we performed correlation tests using CO2 data collected simultaneously with N2O. We observed a strong statistical relationship between N2O and CO2 emissions in all 3 yr of gas measurement (data not shown); therefore, greater N2O emissions under CP were not a total surprise. These results perhaps pro-
vided further understanding as to why mathematical models by Six et al. (2004) indicated lower emissions from NT after 20 yr of application relative to conventional tillage; the latter may result in a significant reduction of CO2–equivalent global warming potential (GWP) as soil organic C increased. Further studies are
Table 4. Stepwise regression equations, model parameters, and relative contribu-tions of soil temperature, volumetric water content (VWC), and weather variables to N2O emissions during the 2004, 2005, and 2006 growing seasons at the Purdue Agricultural Research Center, West Lafayette, IN. Soil temperature was measured in the surface 0.07-m soil depth and volumetric soil water content was determined for the surface 0.10-m soil depth.
Year† Regression equation
2004 104.22 + 0.97(VWC) − 2.82(air temperature) − 0.71(soil temperature)2005 −4.38 + 1.23(precipitation) + 1.32(air temperature) − 1.13(soil temperature)
2006 −477.64 + 20.27(VWC) + 1.76(precipitation) − 20.64(soil temperature)
Model statistics
Partial R2 Model R2 P > F2004
Air temperature 0.11 0.11 0.0002
VWC 0.09 0.19 0.0006
Soil temperature 0.04 0.24 0.013
2005
Precipitation 0.23 0.23 0.0001
Air temperature 0.02 0.25 0.008
Soil temperature 0.02 0.27 0.022
2006
VWC 0.26 0.26 0.0001
Soil temperature 0.02 0.28 0.02 Precipitation 0.01 0.29 0.03† 2004: n = 7; 2005: n = 14; 2006: n = 15.
Table 5. Effect of 30-yr rotation (continuous corn [CC] and rotation corn [RC]) and tillage (moldboard plow [MP], chisel plow [CP] and no-till [NT]) practices on soil N2O emission intensity from 2004 to 2006 at the Purdue Agricultural Research Center, West Lafayette, IN.
Cropping seasonN2O emissions†
CC RC NT CP MP
——————— g N ha−1 d−1 ———————2004 14.6 (2.1)‡ 14.4 (1.9) 12.6 (1.8) 16.9 (2.7) 14.0 (2.8)
2005 18.9 (3.5) 12.1 (2.6) 12.5 (3.5) 22.0 (4.6) 12.0 (2.6)
2006 219.1 (22.6) 176.2 (20.3) 135.6 (21.9) 274.8 (30.8) 182.6 (23.5)
Three-way ANOVA results
Source of variation df Sum of squares Mean square F P > F
2004
Rotation 1 1.1 1.1 0.01 0.928
Tillage 2 420.4 210.2 1.59 0.212
Rotation ´ tillage 2 364.3 182.2 1.38 0.259
2005
Rotation 1 2,946.9 2,946.9 7.62 0.007
Tillage 2 5,227.2 2,613.7 6.54 0.002
Rotation ´ tillage 2 446.2 223.1 0.55 0.576
2006
Rotation 1 124,523.861 124,523.861 7.39 0.0072
Tillage 2 903,298.859 451,649.429 26.82 <0.0001
Rotation ´ tillage 2 38,721.323 19,360.661 1.15 0.3192† Mean values for N2O emission due to rotation and tillage practice; means for tillage were averaged across rotations.‡ Values in parentheses are standard errors

162 SSSAJ: Volume 75: Number 1 • January–February 2011
needed to identify the long-term effect of these tillage systems on profile C distribution and microbial dynamics and how they, in turn, affect CO2 and to determine the actual reductions in GWP made possible with continuous NT adoption for this important agricultural region. We also acknowledge the importance of year-round N2O emissions vs. simply concentrating on the growing-sea-son dynamics as we did due to limited resources.
SUMMARY AND CONCLUSIONSAlthough the midwestern United States is one of the world’s
major agricultural production regions, relatively few research data exist to accurately assess the effects of long-term tillage and rotation and, especially, tillage ´ rotation interaction on N2O emissions. This research was initiated to determine the seasonal emissions of N2O from soils that have been uniformly managed using MP, CP, and NT tillage practices under CC and RC for the past three decades. Nitrous oxide emissions during the growing season were affected by both rotation and tillage systems but not by their interaction. Although cumulative N2O emissions during the varying growing-season lengths measured and gas sampling intensities for the 3 yr were not significantly different between rotations, N2O emissions were about 20% greater under CC than RC even though corn in both rotations received identical N fertilizer applications in the year of gas emission determination. Continuous corn may have resulted in even higher N2O emis-sions if the N fertilizer rate were higher for corn following corn relative to soybean, as is typically the case in Midwest corn pro-duction systems. Among tillage systems, seasonal N2O emissions were numerically ranked in the following order: NT < MP < CP.
Although mean N2O emissions for the varying lengths of the growing seasons measured in the 3-yr period were not significantly different for CP and MP, they were approxi-mately double from CP relative to NT systems.
During the growing season, N2O emissions were sig-nificantly related to soil temperature, volumetric soil water content, precipitation, and air temperature. Collectively, these factors accounted for up to 31% of the total variability associated with N2O emissions. Limited data showed that N2O emissions were significantly affected by soil NO3–N, but more data would be needed to quantify the relationship of emissions to soil mineral N for these soils.
Our results suggested that long-term NT manage-ment (i.e., for a period of decades) for these soils may re-sult in lower N2O emissions than CP or MP management. However, in the midwestern United States, long-term con-tinuous corn may not result in more or less N2O emissions from the soil surface of corn production fields during the grow-ing season than corn following soybean.
ACKNOWLEDGMENTSWe thank Terry D. West for his meticulous management of these long-term plots from 1979 to the present. The research was primarily financed by a USDA grant to the Consortium for Agricultural Soil Mitigation of Greenhouse Gases (CASMGS) project coordinated via Kansas State University (principal investigator Dr. C. Rice); the Purdue University sub-project
(Award S03060) was led by principal investigator Dr. R. Turco. Additional personnel funding was provided by the Hungarian State Eotvos Fellowship.
REFERENCESAdviento-Borbe, M.A.A., J.W. Doran, R.A. Drijber, and A. Dobermann. 2006.
Soil electrical conductivity and water content affect nitrous oxide and carbon dioxide emissions in intensively managed soils. J. Environ. Qual. 35:1999–2010.
Al-Kaisi, M.M., and X. Yin. 2005. Tillage and crop residue effects on soil carbon and carbon dioxide emission in corn–soybean rotations. J. Environ. Qual. 34:437–445.
Aulakh, M.S., D.A. Rennie, and E.A. Paul. 1984. Gaseous nitrogen losses under zero-tillage compared with conventional-till management systems. J. Environ. Qual. 13:130–136.
Baggs, E.M., M. Stevenson, M. Pihlatie, A. Regar, H. Cook, and G. Cadisch. 2003. Nitrous oxide emissions following application of residues and fertilizer under zero and conventional tillage. Plant Soil 254:361–370.
Bajracharya, R.M., R. Lal, and J.M. Kimble. 2000. Diurnal and seasonal CO2–C flux from soil as related to erosion phases in central Ohio. Soil Sci. Soc. Am. J. 64:286–293.
Ball, B.C., A. Scott, and J.P. Parker. 1999. Field N2O, CO2, and CH4 fluxes in relation to tillage, compaction and soil quality in Scotland. Soil Tillage Res. 53:29–39.
Choudhary, M.A., A. Akramkhanov, and S. Saggar. 2001. Nitrous oxide emissions in soils cropped with maize under long-term tillage and under permanent pasture in New Zealand. Soil Tillage Res. 62:61–71.
Civerolo, K.L., and R.R. Dickerson. 1998. Nitric oxide soil emissions from tilled and untilled cornfields. Agric. For. Meteorol. 90:307–311.
Conservation Technology Information Center. 2006. Crop residue management survey summary. Available at www.ctic.purdue.edu/media/pdf/2006%20CRM%20summary.pdf (verified 26 Nov. 2010). CTIC, West Lafayette, IN.
Del Grosso, S.J., A.R. Mosier, W.J. Parton, and D.S. Ojima. 2005. DAYCENT model analysis of past and contemporary soil N2O and net greenhouse gas flux for major crops in the USA. Soil Tillage Res. 83:9–24.
Doran, J.W. 1980. Soil microbial and biochemical changes associated with reduced tillage. Soil Sci. Soc. Am. J. 4:765–771.
Table 6. Seasonal cumulative N2O emissions for the 2004, 2005, and 2006 cropping seasons and ANOVA for the combined 3-yr cumulative emissions at the Purdue Agricultural Research Center, West Lafayette, IN.
Treatment†Cumulative N2O emissions
2004 2005 2006 3-yr avg.
—————— kg N ha−1 ——————Tillage
NT 0.66 2.32 b‡ 6.90b 3.37 a
CP 0.60 4.41 a 18.01 a 7.25 b
MP 0.51 2.26 b 13.32 b 5.61 b
Rotation
CC 0.62 3.39 13.51 6.01
RC 0.55 2.61 11.79 4.81
ANOVA for 3-yr cumulative emissions
Source of variation dfSum of squares
Mean square
F P > F
Year§ 2 1466.02 733.01 103.46 0.0001
Rotation 1 19.66 19.66 2.77 0.1049
Year ´ rotation 2 10.30 5.15 0.73 0.4908
Tillage 2 136.20 68.10 9.61 0.0005
Year ´ tillage 4 236.64 59.16 8.35 0.0001
Rotation´ tillage 2 2.92 1.46 0.21 0.8148
Year´ rotation ´ tillage 4 23.23 5.81 0.82 0.5217† CC, continuous corn; RC, rotation corn; MP, moldboard plow; CP, chisel plow; NT, no-till.‡ Means in columns within a treatment that are followed by the same letter are not significantly different.§ Year refers to the 2004, 2005, and 2006 cropping seasons.
SSSAJ: Volume 75: Number 1 • January–February 2011 163
Drury, C.F., W.D. Reynolds, C.S. Tan, T.W. Welacky, W. Calder, and N.B. McLaughlin. 2006. Emissions of nitrous oxide and carbon dioxide: Influence of tillage type and nitrogen placement depth. Soil Sci. Soc. Am. J. 70:570–581.
Drury, C.F., X.M. Yang, W.D. Reynolds, and C.S. Tan. 2004. Influence of crop rotation and aggregate size on carbon dioxide production and denitrification. Soil Tillage Res. 79:87–100.
FAO. 2003. World agriculture: Towards 2015/2030. An FAO perspective. FAO, Rome.
Franzluebbers, A.J., and R.F. Follett. 2005. Greenhouse gas contributions and mitigation potential in agricultural regions of North America: Introduction. Soil Tillage Res. 83:1–8.
Gál, A., T.J. Vyn, E. Micheli, E.J. Kladivko, and W.W. McFee. 2007. Importance of soil sampling depth in assessment of relative carbon and nitrogen accumulation with long-term no-till. Soil Tillage Res. 96:42–51.
Ginting, D., and B. Eghball. 2005. Nitrous oxide emission from no-till irrigated corn: Temporal fluctuation and wheel traffic effects. Soil Sci. Soc. Am. J. 69:915–924.
Goodroad, L.L., D.R. Keeney, and L.A. Peterson. 1984. Nitrous oxide emissions from agricultural soils in Wisconsin. J. Environ. Qual. 13:557–561.
Grandy, A.S., T.D. Loecke, S. Parr, and G.P. Robertson. 2006. Long-term trends in nitrous oxide emissions, soil nitrogen, and crop yields of till and no-till cropping systems. J. Environ. Qual. 35:1487–1495.
Grant, B., W.N. Smith, R. Desjardins, R. Lemke, and C. Li. 2004. Estimated N2O and CO2 emissions as influenced by agricultural practices in Canada. Clim. Change 65:315–332.
Helgason, B.L., H.H. Janzen, M.H. Chantigny, C.F. Drury, B.H. Ellert, E.G. Gregorich, R.L. Lemke, E. Pattey, P. Rochette, and C. Wagner-Riddle. 2005. Toward improved coefficients for predicting direct N2O emissions from soil in Canadian agroecosystems. Nutr. Cycling Agroecosyst. 71:87–99.
Intergovernmental Panel on Climate Change. 2007. Climate change 2007: Impacts, adaptation and vulnerability. Contribution of Working Group II to the Fourth Assessment Report of the IPCC. Cambridge Univ. Press, Cambridge, UK.
Jacinthe, P.A., and W.A. Dick. 1997. Soil management and nitrous oxide emissions from cultivated fields in southern Ohio. Soil Tillage Res. 41:221–235.
Jacinthe, P.A., and R. Lal. 2003. Nitrogen fertilization of wheat residue affecting nitrous oxide and methane emission from a central Ohio Luvisol. Biol. Fertil. Soils 37:338–347.
Jacinthe, P.A., and R. Lal. 2004. Effects of soil cover on fluxes and depth concentration of trace gases. Soil Sci. 169:243–259.
Jarecki, M.K., and R. Lal. 2006. Compost and mulch effects on gaseous flux from an Alfisol in Ohio. Soil Sci. 171:249–260.
Jury, W.A., J. Letey, and T. Collins. 1982. Analysis of chamber methods used for measuring nitrous oxide production in the field. Soil Sci. Soc. Am. J. 46:250–256.
Kessavalou, A., A.R. Mosier, J.W. Doran, R.A. Drijber, D.J. Lyon, and O. Heinemeyer. 1998. Fluxes of carbon dioxide, nitrous oxide, and methane in grass sod and winter wheat–fallow tillage management. J. Environ. Qual. 27:1094–1104.
Lee, J., J. Six, A.P. King, C. van Kessel, and D.E. Rolston. 2006. Tillage and field scale controls on greenhouse gas emissions. J. Environ. Qual. 35:714–725.
Li, C., S. Frolking, and K. Butterback-Bahl. 2005. Carbon sequestration in arable soils is likely to increase nitrous oxide emissions, offsetting reductions in climate radiative forcing. Clim. Change 72:321–328.
MacKenzie, A.F., M.X. Fan, and F. Cadrin. 1997. Nitrous oxide emission as affected by tillage, corn–soybean–alfalfa rotation and nitrogen fertilization. Can. J. Soil Sci. 77:145–152.
Mehlich, A. 1984. Mehlich 3 soil test extractant: A modification of Mehlich 2 extractant. Commun. Soil Sci. Plant Anal. 15:1409–1416.
Mosier, A.R., A.D. Halvorson, C.A. Curtis, A. Reule, and X.J. Liu. 2006. Net global warming potential and greenhouse gas intensity in irrigated cropping systems in northeastern Colorado. J. Environ. Qual. 35:1584–1598.
Mosier, A., R. Wassmann, L. Verchot, J. King, and C. Palm. 2004. Methane and nitrogen oxide fluxes in tropical agricultural soils: Sources, sinks and mechanisms. Environ. Dev. Sustain. 6:11–49.
Mummey, D.L., J.L. Smith, and G. Bluhm. 1998. Assessment of alternative soil management practices on N2O emissions from US agriculture. Agric. Ecosyst. Environ. 70:79–87.
Omonode, R.A., A. Gál, D.E. Stott, T.S. Abney, and T.J. Vyn. 2006. Short-term versus continuous chisel and no-till effects on soil carbon and nitrogen. Soil Sci. Soc. Am. J. 70:419–425.
Omonode, R.A., T.J. Vyn, D.R. Smith, P. Hegymegi, and A. Gál. 2007. Soil carbon dioxide and methane fluxes from long-term tillage systems in continuous corn and corn–soybean rotations. Soil Tillage Res 95:182–195.
Parkin, T.B. 2008. Effect of sampling frequency on estimates of cumulative nitrous oxide emissions. J. Environ. Qual. 37:1390–1395.
Parkin, T.B., and T.C. Kaspar. 2006. Nitrous oxide emissions from corn–soybean systems in the Midwest. J. Environ. Qual. 35:1496–1506.
Robertson, G.P., E.A. Paul, and R.R. Harwood. 2000. Greenhouse gases in intensive agriculture: Contributions of individual gases to the radiative forcing of the atmosphere. Science 289:1922–1925.
Rochette, P., D.A. Angers, G. Belanger, M.H. Chantigny, D. Provost, and G. Levesque. 2004. Emissions of N2O from alfalfa and soybean crops in eastern Canada. Soil Sci. Soc. Am. J. 68:493–506.
Rochette, P., D.A. Angers, M.H. Chantigny, and N. Bertrand. 2008. Nitrous oxide emissions respond differently to no-till in a loam and a heavy clay soil. Soil Sci. Soc. Am. J. 72:1363–1369.
SAS Institute. 2002. The SAS system for Microsoft Windows, version 9.1. SAS Inst., Cary, NC.
Six, J., S.M. Ogle, F.J. Breidt, J.T. Conant, A.R. Mosier, and K. Paustian. 2004. The potential to mitigate global warming with no-tillage management is only realized when practiced in the long term. Global Change Biol. 10:155–160.
Smith, K.A., and F. Conen. 2004. Impacts of land management on fluxes of trace greenhouse gases. Soil Use Manage. 20:255–263.
Smith, P., D. Martino, Z. Cai, D. Gwary, H. Janzen, P. Kumar, B. McCarl, S. Ogle, F. O’Mara, C. Rice, B. Scholes, and O. Sirotenko. 2007. Agriculture. In B. Metz et al. (ed.) Mitigation. Contribution of Working Group III to the fourth assessment report of the Intergovernmental Panel on Climate Change. Cambridge Univ. Press, Cambridge, UK.
USEPA. 2010. Inventory of U.S. greenhouse gas emissions and sinks, 1990–2008: Agriculture. Available at www.epa.gov/climatechange/emissions/usinventoryreport.html (accessed 20 Nov. 2009, verified 24 Nov. 2010). EPA Rep. 430-R-10-006. USEPA, Washington, DC.
Venterea, R.T., M. Burger, and K.A. Spokas. 2005. Nitrogen oxide and methane emissions under varying tillage and fertilizer management. J. Environ. Qual. 34:1467–1477.
Walters, D.T., A. Dobermann, and M.A.A. Adviento-Borbe. 2007. Closing the corn yield gap: Management practices that improve soil quality and net productivity but reduce global warming potential. In Proc. 2007 Indiana Certified Crop Advisor Conf., Indianapolis, IN [CD-ROM]. 18–19 Dec. 2007. Dep. of Agronomy, Purdue Univ., W. Lafayette, IN.
Xu, X., H. Tian, and D. Hui. 2008. Convergence in the relationship of CO2 and N2O exchanges between soil and atmosphere within terrestrial ecosystems. Global Change Biol. 14:1–10.