$ $ Influence( of( reduced( tillage,( organic( amendments(and ...
64
MSc Thesis Report Influence of reduced tillage, organic amendments and Nitrogen application rates on growth and yield components of organic potato. Konstantinos Litsos MSc Thesis Report March 2015 Farming System Ecoclogy Group, Wageningen University, The Netherlands
-
Upload
khangminh22 -
Category
Documents
-
view
1 -
download
0
Transcript of $ $ Influence( of( reduced( tillage,( organic( amendments(and ...
MSc$Thesis$Report$ $ $$
$$Influence( of( reduced( tillage,( organic(amendments(and(Nitrogen(application(rates(on(growth' and' yield' components' of' organic'potato.$
Konstantinos(Litsos(
MSc$Thesis$Report$
$
March$2015$
Farming$System$Ecoclogy$Group,$
Wageningen$University,$The$Netherlands$

MSc$Thesis$Report$ $ $(
$ii$
MSc$Thesis$Report$ $ $
$
$ iii$
Influence of reduced tillage, organic amendments and Nitrogen application rates on growth and yield components of organic potato.
Name$student(s):$Konstantinos$Litsos$
Registration$number$student:$880711K523K120$
Study$programme:$MSc$Organic$Agriculture$
Credits:$36$
Course$code:$FSEK80436$$$
Supervisor(s):$$
Dr.$Johannes$Scholberg$$
$$$$$$$$$$$$$$$$$$$$$$$ Dr.$Egbert$Lantinga$$
Examiner:$$$ $
Dr.$Egbert$Lantinga$
$
March,$2015$$
Farming$Systems$Ecology$Group,$
Wageningen$University,$The$Netherlands
MSc$Thesis$Report$ $ $(
$iv$
Preface'.....................................................................................................................................................................'v$Abstract'.................................................................................................................................................................'vi$Abbreviations'.....................................................................................................................................................'vii$1. Introduction'.....................................................................................................................................................'1$
2.'Research'objectives,'questions'and'hypotheses'..................................................................................'4$2.1$Research$objectives$................................................................................................................................$4$2.2$Research$question$..................................................................................................................................$4$2.3$Hypotheses$.............................................................................................................................................$4$
3.'Materials'and'Methods'..................................................................................................................................'5$3.1$Experimental$site,$field$history$and$weather$conditions$........................................................................$5$3.2$Experimental$design$...............................................................................................................................$5$3.3$Agronomic$practices$...............................................................................................................................$6$3.4$Soil$samples$and$Laboratory$analyses$....................................................................................................$7$
3.4.1%Initial%measurements%.......................................................................................................................%7$3.4.2.%Sample%analysis%..............................................................................................................................%7$
3.5$Crop$measurements$...............................................................................................................................$7$3.5.1%Plant%emergence%..............................................................................................................................%7$3.5.2%Canopy%characteristics%.....................................................................................................................%7$
3.6$Crop$yield$and$quality$.............................................................................................................................$8$3.6.1%Potato%yield%.....................................................................................................................................%8$3.6.2%Tuber%quality%....................................................................................................................................%8$
3.7$Crop$N$dynamics$....................................................................................................................................$9$3.7.1%Crop%N%accumulation%.......................................................................................................................%9$3.7.2%Crop%nitrogen%utilization%..................................................................................................................%9$
3.8$Statistical$analysis$.................................................................................................................................$10$
3.'Results'and'Discussion'...............................................................................................................................'11$3.1$Crop$growth$..........................................................................................................................................$11$
3.1.1%Plant%emergence%............................................................................................................................%11$3.1.2%Leaf%chlorophyll%index%....................................................................................................................%11$3.1.3%Plant%height,%LAI%and%canopy%volume%............................................................................................%12$
3.2$Tuber$and$aboveKground$DM$accumulation$........................................................................................$14$3.$3$Tuber$number,$quality$and$yield$.........................................................................................................$14$3.3.1$Tuber$number$and$average$tuber$size$..............................................................................................$14$
3.3.2%Potato%tuber%quality%......................................................................................................................%16$3.4$N$accumulation,$ANR$and$AE$...............................................................................................................$16$3.5$Regression$analysis$...............................................................................................................................$17$
4'Conclusion'and'Recommendations'..........................................................................................................'19$
5.'Tables'and'figures'........................................................................................................................................'21$5.1$Tables$...................................................................................................................................................$21$5.2$Figures$..................................................................................................................................................$30$
References'...........................................................................................................................................................'34$Appendices'..........................................................................................................................................................'41$Appendix$I.$Experimental$field$layKout$.......................................................................................................$41$Appendix$II.$Experimental$Data$..................................................................................................................$43$
MSc$Thesis$Report$ $ $$
$ v$
Preface'The current research was conducted as part of my thesis at the Farming Systems Ecology group, which is integral part of my MSc program in “Organic Agriculture”
The main objective of this study was to examine the influence of two different tillage systems and three different organic amendments on crop performance in an organic potato production system in the Netherlands. In addition the effect of different nitrogen application rates on resource use efficiency was investigated.
Completing this study would be impossible without the help of certain persons. First of all, the group of students (Carlos Salamanca, Ioannis Koufakis, Maude Quinio) I was working with during all this period. Second my supervisors, Johannes Scholberg and Egbert Lantinga. Without their guidance and advice the completion of this research study would be impossible. In addition, I would like to thank Dine Volker, who helped with data collection procedures, Hennie Halm, who performed all the laboratory analyses and finally Andries Siepel and the staff of Unifarm who provided the necessary equipment, facilities and technical advice. Last but not least, special thanks to all the friends that provided practical help as well as moral support.
'
'
'
'
'
'$
$
MSc$Thesis$Report$ $ $(
$vi$
Abstract'Nutrient management and soil cultivation practices that are currently being used by farmers in the Netherlands might have a negative effect on crop performance, inherent soil fertility as well as on the environment. Thus, research on alternative practices is required to provide a scientific basis for more sustainable production systems. The main objective of this study was to examine the interactive effect of two tillage systems (Reduced Tillage up to 10 cm soil depth - RT vs Standard Tillage up to 30 cm soil depth - ST) and three organic amendments (Solid Cattle Manure - SCM; Lucerne Pellets - LP; Grass/Clover Silage - GCS) on crop performance and nutrient utilization in organic potato systems. In addition the interactive effect between the organic amendments and nitrogen application rates (57, 113, 170 kg N ha-1) was investigated. Results showed that RT had a positive effect on initial plant growth and on total and marketable tuber yield. Plant-based fertilizers and especially GCS had a significant positive effect on crop growth and tuber yield while high nitrogen application rates resulted in reduced resource use efficiency without any significant effect on crop growth or tuber yield. In addition, crop-based indicators as predictors of crop yield was attempted to be identified. Indicators studied were leaf area index (LAI), plant height, canopy volume and leaf chlorophyll index. Final tuber yield was correlated (R2 = 0.54) with LAI at the 8th week after planting. The rest of the indicators could not be sufficiently correlated with the tuber yield. Based on these results it can be stated that RT in combination with plant-based fertilizer could be a viable alternative to the currently prevailing practices in organic potato production systems. However, based on sharp contradictions with a similar study conducted at the same experimental location it is evident that there are numerous factors affecting these systems. Therefore, prevailing soil and weather conditions may to a large extend govern crop performance and depending on the incidence and severity of phytothophtora and drought conditions use of conservation tillage may or may not provide yield benefits. As a result, accurate yield predictions and recommendations that are universally applicable may be difficult to make
Keywords: Organic, Potato, Netherlands, Tillage, Reduced tillage, Nitrogen, Organic amendments
$
$
$
$
MSc$Thesis$Report$ $ $$
$ vii$
Abbreviations'$
CA:$Conservation$agriculture$
NT:$No$till$
RT:$Reduced$tillage$
ST:$Standard$tillage$
C:$Control$
GCS:$Grass/clover$silage$
LP:$Lucerne$pellets$
SCM:$Solid$cattle$manure$
GCSH:$Grass/clover$silage$half$mulch$
GCSM:$Grass/clover$silage$full$mulch$
SG:$Specific$gravity$
SOM:$Soil$organic$matter$
SOC:$Soil$organic$carbon$
E.D.:$Emergence$day$
CV:$Canopy$volume$
LAI:$Leaf$area$index$
DM:$Dry$matter$
FW:$Fresh$weight$
N:$Nitrogen$
Nmin:$Mineral$nitrogen$
DAP:$Days$after$planting$
WAP:$Weeks$after$plantin
MSc$Thesis$Report$ $ $$
$ 1$
1. Introduction During the last decades there has been an intensification of agricultural production based mainly on increased use of synthetic inputs (fertilizers, pesticides, herbicides etc), improved crop varieties and modern agricultural practices. This intensification based on increased input use has increased food production and thereby contributed significantly to enhancing global food security (Matson et al1997, Evenson & Gollin 2003, Tilman 1998). However, this development had also numerous negative effects including soil degradation, a decrease of biodiversity and pollution of groundwater among others (Pimentel et al 2005, Tscharntke et al 2005, Tilman 1998). This is the reason why alternative approaches for agricultural production systems need to be developed that are based on the principles of environmental preservation rather than production intensification.
One of the biggest challenges of highly productive agricultural systems is improved nutrient management with special reference to nitrogen (N) since in most cases this is the most yield-limiting nutrient (Lynch et al 2012, Errebhi 1998, Olfs et al 2005). Managing N in conventional systems is a relatively simple process since N is in an inorganic form that can be applied easily and after application nutrients typically are instantly available for crop uptake. However, in organic systems the use of synthetic fertilizers is prohibited. As a result, N is applied in organic forms that upon mineralization will release the necessary nutrients in a more gradual manner to the soil solution and then can be taken up by the plant roots. However, the mineralization process is affected by numerous factors such as soil temperature, soil moisture, biotic factors such as soil microorganisms and soil fauna as well as the inherent characteristics of the applied material (composition compounds, C/N ratio)(Drinkwater and Snapp, 2010). As a result, it is difficult to predict when N is released which may also hamper synchronization between N supply and crop demand and thereby may hamper effective resource use and optimal crop growth (Scholberg et al, 2013; Nyiraneza & Snapp 2007, Snapp & Fortuna 2003, Berry et al 2002). Plant demand for nutrients and especially for N is not constant but may be fluctuating throughout the growing season (Scholberg et al., 2013). Therefore, synchronizing nutrient release and plant nutrients requirements tends to be very challenging (Van Delden 2001, Pang & Letey 2000, Berry et al 2002). Lack of synchronization can increase the risk of N leaching which eventually may lead to groundwater pollution. Hence, synchronization is not only important for achieving optimal plant growth, but also for minimizing the risk of environmental impacts.
Animal manure is one of the most commonly used sources of nutrients in organic systems. Apart from supplying nutrients to the crop upon mineralization, manure application also contributes to the soil organic matter content, which in turn enhances soil structure and water retention capacity of the soil. Nevertheless, excessive use of
MSc$Thesis$Report$ $ $(
$2$
animal manure in agriculture has also been linked to environmental impacts including nitrate leaching, phosphorus runoff and gaseous ammonia emissions (Joengbloed & Lenis 1998, Oenema 2004). In addition, the contribution of animal manure in terms of balancing nutrient supply is also under dispute since the crop N:P (P2O5) ratio is usually larger than 2.5 while the ratio in animal manures is usually lower than 2. This implies that relying exclusively on animal manure for crop N supply will inherently result in excessive P application and P-hyper-accumulation in the soil thus jeopardizing the overall sustainability of the system (Schröder, 2004). Finally, other concerns about manure refer to the survival and spreading of pathogens that ultimately can pose a risk in terms of potential contamination of food and water and thus posing a threat to human health (Bicudo and Goyal 2003, Nicholson et al 2004). Finally, most organic farms in the Netherlands are specialized, therefore arable farmers depend on imported manures from animal-based farm operations. However, there is not always the possibility of supply of high quality manure within close proximity, which sometimes renders the use of animal-based manure cost-prohibitive due to high transportation costs.
However, nutrient management should not be examined by itself, but it should be included in a more generalized framework that includes also other factors. One of the main factors that should be taken into account is the soil’s inherent fertility and how it is affected by farming practices. One of the practices that affect soil chemical and physical properties is tillage. Tillage is one of the oldest agricultural practices and can serve multiple purposes such as the incorporation of crop residues and fertilizers, weed control, improve soil porosity and prevent compaction (Lal 1991). Farmers usually have the perception that deep soil cultivation is crucial for increasing productivity. However, tillage has also negative effects on soil’s quality parameters since it contributes to organic matter losses, reduces total organic carbon as well as microbial activity. In addition, it consists a labor-intensive practice. Thus, energy costs and by extension production costs are being increased.
Tillage practices described by the broad term “conservation tillage” are examined as viable alternatives of the current deep soil cultivation practices. Inside the borders of this term several different concepts coexist from just tillage at reduced depth to no tillage practices. The common ground of all those concepts is that they try to reduce as much as possible the soil disturbance during the cultivation period. The main benefits of those practices are that enhance soil’s chemical and physical properties by increasing organic matter storage, improve water infiltration and reduced erosion and nutrient runoff (Holland 2004; Uri et al. 1998).
Incorporation of soil amendments can also have beneficial effects regarding soil’s chemical, physical and biological properties. Soil amendments affect mainly soil texture and structure and by extension the rest of the physical properties (bulk density,
MSc$Thesis$Report$ $ $$
$ 3$
porosity). This facilitates water movement, improves drainage and water retention capacity of the soil. Furthermore, amendments have proven to be beneficial on stabilizing soil pH, increasing soil organic matter, reducing nitrate leaching and improving cation exchange capacity of the soil (Bulluck et al 2002). Furthermore, microbial biomass is related to the organic matter content of the soil and can be used as an early indicator for changes regarding organic matter content. Thus, increasing the organic matter by incorporating soil amendments results to enhanced microbial biomass and enzyme activity in the soil (Powlson and Brookes 1987, Albiach et al 2000).
For all these reasons, nutrient management in organic systems should be reoriented and appropriate alternatives to animal-based fertilizers and current tillage practices should be developed. Green manures may be a viable alternative and historically has been a common practice. Green manures are usually grown as a part of a crop rotation and they are ultimately incorporated into the soil in order to provide the nutrients to the succeeding crop. Green manures seem to have a positive impact on soil’s chemical and physical properties, to organic matter content as well as to nutrient leaching (Cherr et al., 2006; FAO 2011). Furthermore, crops with high nitrogen content that are being used as green manures (alfalfa, clover) can be grown in one field and the biomass produced can be applied after harvesting to another field (Sorensen and Thorup-Krinstensen 2011). This technique, know as “cut-and-carry” fertilizer or “mobile green manure” seems to be equally or even more effective compared to animal manures in terms of N use efficiency (Van der Burgt et al 2011) while in addition it may decrease the dependency of arable farmers on external inputs. As a result, further research on this field is necessary in order to evaluate the effects of mobile green manures and plant based fertilizers as a viable alternative of animal-based soil fertility source in organic systems.
$
$
$
'$
$
MSc$Thesis$Report$ $ $(
$4$
2.'Research'objectives,'questions'and'hypotheses'
2.1'Research'objectives'The main objective of this research project is to examine the effect of three different types of organic fertilizers as N source and their effect on the yield and the quality of organic potato grown on a sandy soils at the central part of, the Netherlands. In addition, the interactive effect of each fertilizer type and N application rates for different tillage systems will be examined. Finally, the research will also try to evaluate the potential benefits of mobile green manure in comparison to other animal and plant based organic fertilizers in terms of N use efficiency and profitability.
2.2'Research'question'The main research question to be addressed is:
• Is it possible to replace animal manure with grass clover silage or Lucerne pellets in organically grown potato without reducing potato yield and quality?
Additional questions to be addressed are:
• How do fertilizer type and N-application rate interactively affect soil N dynamics and how is this related to crop growth?
• Which N-application rate is the most effective in terms of yield maximization and
are there interactive differences among the different N sources and tillage systems?
• Which application rate will result in optimal N use efficiency and by extension
minimum N losses within the production system for each of the different N sources and tillage systems?
• What crop-based indicators provide the best predictor for crop yield?
2.3'Hypotheses'• Use of plant-based fertilizers (Lucerne pellets, grass clover silage) will result in
similar or higher yields and tuber quality compared to the use of animal based fertilizers..
• Increasing N application rates will reduce N use efficiency while increasing potential N losses.
• Tillage will affect the depth placement of soil amendments and thereby the distribution, utilisation and crop response to soil amendments.
MSc$Thesis$Report$ $ $$
$ 5$
3.'Materials'and'Methods'
3.1'Experimental'site,'field'history'and'weather'conditions'This trial was conducted from February to August of 2014. The chosen experimental field consists part of the organic experimental farm located in Droevendaal (51°59'33.68"N, 5°39'34.59"E) which is the certified organic research facility of Wageningen University in Wageningen, the Netherlands. The soil of the chosen field can be characterized as sandy and soil analysis prior to the initiation of the experiment showed organic matter content of 27 g Kg-1. The mean air temperature at the experimental site during the last ten years was 11oC while average annual precipitation amounted to 765 ± 130 mm. Cumulative weekly rainfall as well as average temperature during the growing season of the current year is presented in figure 1. Field beans were cultivated the previous year while summer wheat and rye were grown the year before. No supplemental irrigation was used during the 2014 growing season. The actual crop growth period started on the 17th of April 2014 (planting date) and ended on the 29th of July 2014 (harvesting date). Phytopthora infestation observed in the field on the 7th of May and the most heavily infected parts of the field had to be destroyed by fire burning on the 25th of June.
3.2'Experimental'design'A split-plot design was used for this experiment with tillage technique being the main plot and fertilizer types forming the sub-plot while treatment combination were replicated four times within four blocks. The main plot treatments thus consisted of two different tillage practices (reduced-RT vs standard-ST tillage). The sub plot treatment consisted of 3 different organic fertilizer types (solid cattle manure-SCM, lucerne pellets-LP and grass clover silage-GCS) and a non-amended plot was included as a control, which was used for N uptake efficiency calculations. Within the standard tillage plots the different fertilizer types were applied at different rates (0, 57, 113 and 170 kg N ha-1.) Standard tillage treatments thus included all three levels of each amendment type as well as replicated control plots. Reduced tillage treatments, on the other hand, included only both control plots and the 170 kg N ha-1 treatments. Thus, each block consisted of 18 plots (6 dedicated to RT and 12 dedicated to ST). Sub-plot treatments were randomly allocated in each main plot treatment. Plot size was 10m x 3m (Appendix I, figure 1). Four rows of potatoes were planted in each plot. Spacing between potato plants on a single row was 30cm and between rows 75 cm (Appendix I, Fig. 2). Measurements were taken only from plants in the two central rows. The other two rows were excluded in order to minimize the border effect. For the same reason, three plants at the beginning and the end of its plot were not utilized for any kind of measurement.
MSc$Thesis$Report$ $ $(
$6$
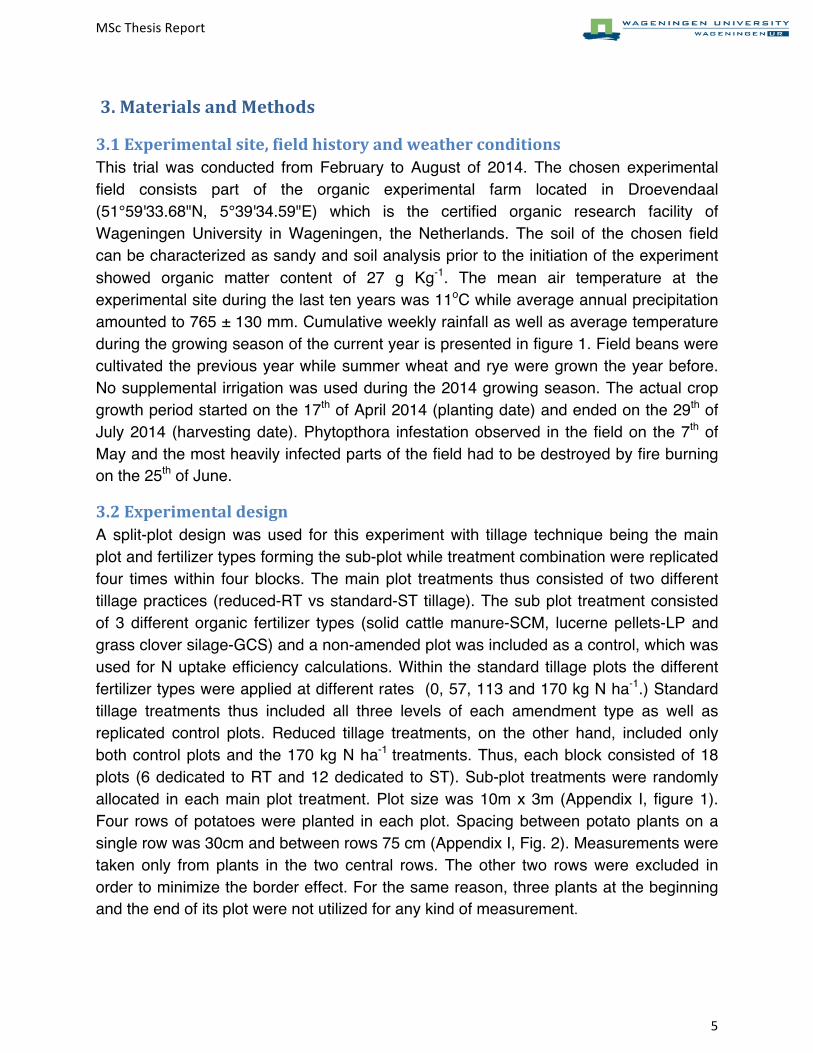
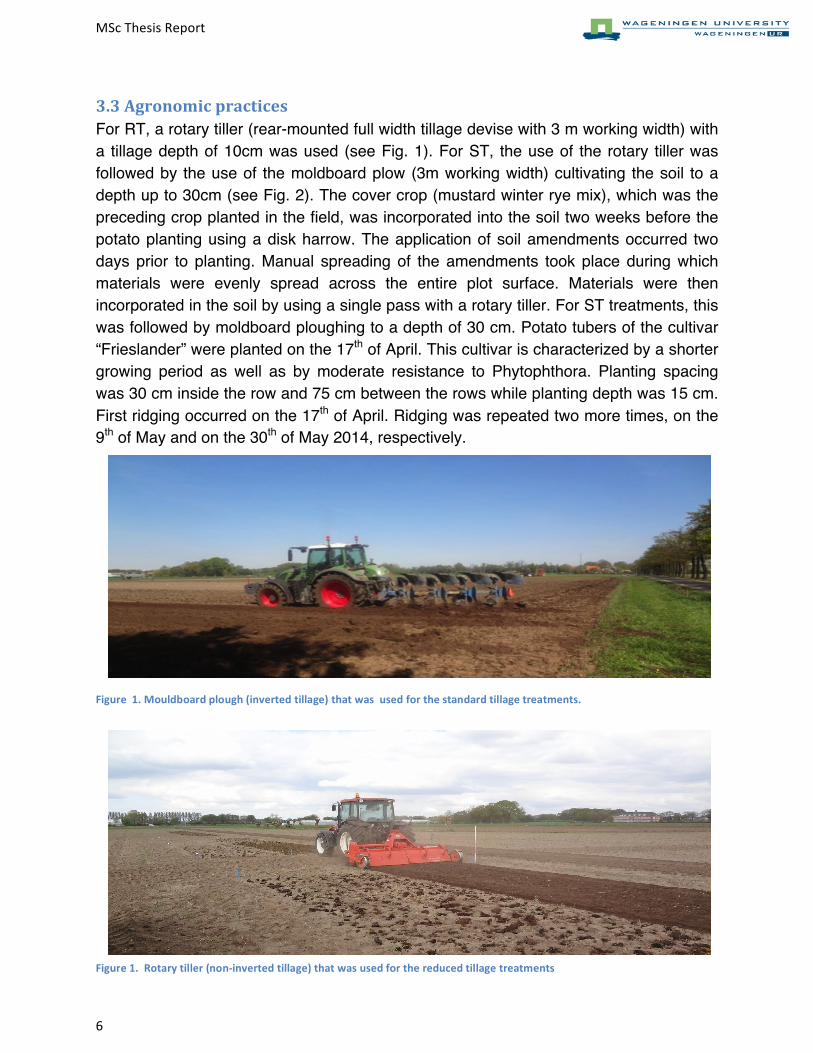
3.3'Agronomic'practices'For RT, a rotary tiller (rear-mounted full width tillage devise with 3 m working width) with a tillage depth of 10cm was used (see Fig. 1). For ST, the use of the rotary tiller was followed by the use of the moldboard plow (3m working width) cultivating the soil to a depth up to 30cm (see Fig. 2). The cover crop (mustard winter rye mix), which was the preceding crop planted in the field, was incorporated into the soil two weeks before the potato planting using a disk harrow. The application of soil amendments occurred two days prior to planting. Manual spreading of the amendments took place during which materials were evenly spread across the entire plot surface. Materials were then incorporated in the soil by using a single pass with a rotary tiller. For ST treatments, this was followed by moldboard ploughing to a depth of 30 cm. Potato tubers of the cultivar “Frieslander” were planted on the 17th of April. This cultivar is characterized by a shorter growing period as well as by moderate resistance to Phytophthora. Planting spacing was 30 cm inside the row and 75 cm between the rows while planting depth was 15 cm. First ridging occurred on the 17th of April. Ridging was repeated two more times, on the 9th of May and on the 30th of May 2014, respectively.
'
'
'
'
'
'$
$
$
$
$
Figure((1.(Mouldboard(plough((inverted(tillage)(that(was((used(for(the(standard(tillage(treatments.((
Figure(1.((Rotary(tiller((non?inverted(tillage)(that(was(used(for(the(reduced(tillage(treatments(
MSc$Thesis$Report$ $ $$
$ 7$
3.4'Soil'samples'and'Laboratory'analyses(
3.4.1'Initial'measurements'Before the application of the soil amendments a total of 25-30 soil samples for the 0-30 cm and 30-60 cm soil layer depths were taken from each of the experimental plots using 30cm incremental soil cores. Samples were placed in a bucket and thoroughly mixed and a composite sample was taken and analyzed in the lab in order to assess total initial soil mineral N (Nmin in kg N ha-1), soil pH as well as soil organic matter content. Representative grab samples from each fertilizer type were taken in order to assess the nitrogen content as well as the dry matter (Table 2). Thus, the total applied quantity of each fertilizer was calculated in order to achieve the target of 53, 113, and 170 kg N ha-
1, respectively. After ridging, soil samples were collected at 5, 9 and 13 weeks after planting (WAP) for the 0-15 cm and 15-30 cm soil depth.
3.4.2.'Sample'analysis'Samples were analyzed for NO3-N and NH4-N content using standard lab procedures. Total soil mineral N (N min, kg N ha-1), soil organic matter and soil pH for the 0-30 cm soil layer (Table 1). Soil available N-NO3
- and N-NH4+ were measured following the
methods as described in Houba et al. (1990). Samples were extracted in 0.01 M CaCl2 and analyzed using a segmented-flow system (Technicon Auto-analyzer II, Dublin, Ireland). Total SOM was determined using the loss-on-ignition (LOI) method by dry combustion of the organic material in a furnace at 500-550 °C. The loss in weight gave an indication of the organic matter content in the sample (Konare et al., 2010). Soil pH was measured after 0.01 M CaCl2 extraction using a pH/mV meter (Inolab pH/Cond Level 1, WTW, Weilheim, Germany).
3.5'Crop'measurements'
3.5.1'Plant'emergence'Emergence date was determined at 2-day intervals by measuring the number of potato plants that emerged within the net plot. When ≥ 50% plants within a net plot had emerged, the emergence day (expressed as days after planting, DAP) was calculated as follows: ED = T1 + (T2 - T1) × [(19 - M1) / (M2 - M1)]; where ED is the emergence day; T1 is DAP when ˂ 50% plants within the net plot had emerged; T2 is DAP when ≥ 50% plants within the net plot had emerged; 19 refers to 50% of the total plant number (i.e., 38) in the net plot having emerged and is used as reference value; M1 is the number of plants measured at T1; M2 is the number of plants measured at T2.
3.5.2'Canopy'characteristics''Plant height, diameter and leaf chlorophyll content were measured at 6, 8 and 10 WAP. The height (Ht) of five representative plants per plot was measured using a measuring tape. Plant canopy diameter (D) was measured for the same five plants taking the
MSc$Thesis$Report$ $ $(
$8$
average of two measurements perpendicular to each other. Canopy volume (CV) was later calculated based on the aforementioned measurements using the following the formula: CV=π$ x$ (D/2)2$ x$ Ht$ where$ D$ stands$ for$ canopy$ diameter$ and$ Ht$ stand$ for$ plant$height.$A SPAD meter (SPAD 502, Konica Minolta Sensing, Inc, Osaka, Japan) was used to measure the leaf chlorophyll content. For this purpose, six representative plants per plot were chosen. Measurements were taken at the third youngest leaf of each plant using always the terminal leaflet. Five readings per leaflet were taken and the average was calculated.$
Leaf area index (LAI) was measured at 5, 7, 9 and 11 WAP. Two plants were harvested from both the beginning and end of each plot. Total fresh weight of each plant was determined and later stems and leafs were separated. Fresh weight of the separated stems and leaves was measured again. A sub sample of 100 gr of fresh leaf material per plant was weighted and the leaf area of the leaf blades was calculated by feeding individual leaflet separately through a leaf area meter (LI3100, Li-Cor, Lincoln, NE, USA). Afterwards, both leaf and stem subsamples were dried at 105oC for 48 hours in order to determine the above-ground dry matter accumulation.
3.6'Crop'yield'and'quality''
3.6.1'Potato'yield''Potato tuber size was monitored after 10 WAP in order to asses the optimal time for harvesting. However, due to phytophthora infestation and spreading in the field, harvesting occurred before all tubers reached their maximum size. Potato tubers for the net plot area (1.5 x 2.7 m) were harvested manually on the 29th of July 2014 and placed in meshed bags. These bags were placed in a well-aerated room and tubers were allowed to air-dry and after shaking to remove any remaining sand total tuber weight was determined in order to calculate total yield per plot, which was then converted to yield per hectare. In addition, tubers were graded into three categories: large (>40mm), small (15-40mm) and culls (damaged, infected tuners) using standardized grading sieves. Exterior evaluation of tubers was done visually and damaged and phythopthora-infected tubers, irrespective of their size, were kept apart and treated as culls. Fresh weight and tuber number for each tuber category was measured after the grading.
3.6.2'Tuber'quality'A representative subsample of 5 kg for each plot was used in order to determine the tuber specific gravity (TSG). First tubers were carefully rinsed to remove any soil particles and then allowed to air-dry. The TSG values were calculated using the following formula: TSG= Wair / Wair - W water where W air is the weight of the tubers measured in the air and Wwater is the weight of the tubers measured after they were submerged in the water. The TSG values were also used to calculate the starch content using the following formula: Starch content= -1.39 + 0.196 x [1000 x (TSG -1)]
MSc$Thesis$Report$ $ $$
$ 9$
(Simmonds, 1977). Subsequently, tuber DM and nitrogen content were determined. Two subsample of 0,5 kg of representative tubers per plot were chosen. First, tubers were chopped in smaller pieces and dried at 105oC for 48 hours in order to determine the DM content. For the second sample, the material was dried at 70oC for 72 hours, grinded to pass a 2mm sieve and then transferred to the lab where the nitrogen content analysis took place. Plant samples were digested with a mixture of H2SO4–Se and salicylic acid (Novozamski et al., 1983). The actual digestion was started by H2O2 and in this step most of the organic matter is being oxidized. After decomposition of the excess H2O2 and evaporation of water, the digestion was completed by using concentrated H2SO4 at elevated temperature (330°C) under the influence of Se as a catalyst. In the resulting digested solution total N was measured spectrophotometrically with a segmented-flow system (Auto-analyzer II, Technicon).
3.7'Crop'N'dynamics''
3.7.1'Crop'N'accumulation'Total crop nitrogen accumulation was calculated using the following formula:
Total Nacc = (DM above-ground x N content above-ground) + (DM tuber x N content tuber)
Where DM above-ground and DM tuber refer to the overall dry matter content in the above-ground biomass and tubers respectively. In order to determine the above-ground N content accumulation, two plants per plot were collected at the 11 WAP. The samples were dried at 70 oC in order to minimize nitrogen losses. Afterwards, they were grinded to pass a 2mm sieve and transferred to the lab where the analysis took place. Plant samples were digested with a mixture of H2SO4-Se and salicylic acid (Novozamsky et al., 1983). Total nitrogen (N total) was measured spectrophotometrically with a segmented-flow system (Technicon Auto-analyzer II, Dublin, Ireland).
3.7.2'Crop'nitrogen'utilization'
3.7.2.1&Fertilizer&recovery&&In order to determine the fate of the applied N, apparent fertilizer N recovery (ANR) values were calculated. Using ANR, a better understanding can be obtained regarding the N losses as well as the amount of N immobilized in the soil (Roberts, 2008). ANR values may be defined as the additional amount of nitrogen accumulated per unit of added nitrogen and can be calculated based on the following formula:
ANR %= (Naccumulation treatment - Naccumulation control) /( Napplied) x 100.
Where N refers to total nitrogen in kg N per hectare. In this approach it was assumed that overall mineralization rates were not affected by soil amendments while tillage may increase mineralization (Drakopoulos, 2014). Therefore for ANR calculations only the reference values for non-amended controls within the same tillage systems were used.
MSc$Thesis$Report$ $ $(
$10$
3.7.2.2&Agronomic&efficiency&In order to assess the plant’s yield ability in relation with N fertilization Agronomic efficiency (AE) was used. The Agronomic efficiency (AE) is defined as the additional yield per unit of added nitrogen and can be calculated based on the following formula:
AE = (Yield treatment – Yield control) / N applied.
3.8'Statistical'analysis'Data analysis included an analysis of variances (ANOVA) using SPSS 20th edition (VSN International Ltd., Hemel Hempstead, UK). The Shapiro-Wilk and Bartlett’s tests were used to verify that data showed a normal distribution and variations were constant. Main effects and interactions were assessed for significance levels, while mean separation was conducted using Fisher’s protected LSD-test. In terms of presentation, results are typically presented in overview tables that first outline main effects for tillage. Since an incomplete factorial design was used, not all fertilizer techniques and rates combinations occurred for each tillage system. Therefore, N source treatment comparisons are presented within each tillage system separately. For standard tillage systems presented values are averaged across N-rates. In this case plant response to N rates averaged across fertilization type is also presented separately in the overview table. If interaction terms were significant, results may be presented in additional graphs as well for specific N treatments.
'$
$
$
$
$
$$
$
MSc$Thesis$Report$ $ $$
$ 11$
3.'Results'and'Discussion'
3.1'Crop'growth'
3.1.1'Plant'emergence'Plant emergence occurred one day later in plots where RT was used. However, this difference was not statistically different (Table 3). Plant emergence is related to soil moisture content as well as soil bulk density. Increased soil moisture and reduced soil bulk density favor faster plant emergence (Singh and Ghildyal 1977, Marsh 1993). However, no differences regarding bulk density and soil moisture content were observed for the current trial until two weeks after planting (Salamanca, 2015). In ST-based systems, neither fertilizer type nor N application rate seemed to have an effect on the emergence date There was an interaction between fertilization type and tillage system. Overall comparison of emergence date across tillage systems is presented in Fig 2. From this figure it may be concluded that in the RT-based system, the non-amended control plots germinated relatively quick while the ones treated with grass clover silage had the slowest emergence. Differences between treatments were less pronounced for ST-based systems. However, it appears that grass clover silage performs slightly better compared to the other soil amendments. These findings are in contrast with the results reported by Drakopoulos (2014) for similar experimental set up at the same experimental location. In that case, use of RT resulted in 3 days faster plant emergence while the combination of ST with grass clover silage resulted also to somewhat quicker plant emergence. Results reported in the literature also confirm the findings of the current research. Altuntas and Dede (2009) reported slower plant emergence under RT in maize. Results from Mohanty et al (2006) and Barut and Celik (2010) reached to the same conclusion regarding wheat seedling emergence in a wheat-rice system and a wheat-corn rotation system respectively. Results from Imholte and Carter (1987) as well as Thomas et al (1990) confirm that reduced or no tillage practices are not favorable to faster plant emergence.
3.1.2'Leaf'chlorophyll'index''SPAD values were similar for both tillage systems at 6 and 8 WAP. However, numeric SPAD values for ST were higher at 10 WAP. However, these difference were statistically not significant (Table 3). Higher N application levels resulted in slightly higher numeric SPAD values. However, only over time (e.g. at 10 WAP) these differences become more articulated obvious and statistically different at the 10th WAP. Grass clover silage treatments had higher SPAD values in both tillage systems. Once more, differences were more evident and statistically different at the 10th WAP.
Drakopoulos (2014) also reported higher SPAD values for ST after 10 WAP. This might be due to the fact that in RT the biggest amount of nutrients are being concentrated in the upper soil layer (0-15cm) (Salamanca, 2015). This might have led to the formation of

MSc$Thesis$Report$ $ $(
$12$
both a more shallow rooting system and better nutrient utilization during initial crop growth. On the contrary, in ST nutrients were translocated to deeper soil layers (15-30cm). As a result, more time was required for the roots to take full advantage of the supplied nutrients at those soil layers. In addition, Drakopoulos (2014) reported lower SPAD values as well as N immobilization in plots amended with GCS especially at the initial growth stages due to high C/N ratio of the material used. C/N ratio of GCS was 22 while C/N ratio of LP and SCM were 16 and 12 respectively. However, the results of the current study show the reverse since plots amended with GCS had the highest SPAD values while plots amended with SCM the lowest. It was observed that N mineralization rate was lower for SCM (Salamanca 2015). So, lower SPAD values may be explained from a soil nutrient supply perspective.
SPAD values are related with nitrogen concentration in the leaves and by extension SPAD values can be used for evaluating crop N status (Majic et al 2008, Vos and Bom 1993) as well as N supply capacity of the soil (Izsaki and Nemeth, 2007). However, higher N applications rates did not result in significantly higher SPAD values until 8 WAP (Table 3). As shown from Table 1, initial soil Nmin content was only 3.6-6.0 kg N ha-1, the lack of a clear response in terms of augmented SPAD value with increased N rates might be an indicator of very high intrinsic soil N mineralization capacity of the soil.
In addition, the lack of clear difference between the 113 and 170 kg N ha-1 application rates at the 10 WAP implies that at the highest application rate, N may be potentially lost due to leaching since it is not effectively being utilized by the plants. Leaf chlorophyll index can be a useful tool regarding timing and rates of supplementary fertilization (Gianquinto et al, 2003). However, it seems to be mainly useful when severe N deficiencies occur while it seems to be not sensitive enough to detect marginal N deficiencies (Minotti et al 1994, Piekielek 1992).
3.1.3'Plant'height,'LAI'and'canopy'volume'Plant height was significantly higher in plots where RT was used throughout the whole growing period and in the end plants in RT-based systems were about 10cm taller. The fully mulched non-tilled treatment showed stunted growth which may have been related to soil compaction and the mulch resulting in excessively wet and relatively cold and poorly aerated soil conditions which may have negatively affected plan growth. Plots treated with GCS had higher plants especially at 8 WAP while N application rate only significant increased plant height y when compared with the unamended plots at 8 WAP (Table 4). These differences may also be explained from a nutrient utilization perspective already as was discussed earlier regarding plant emergence. However, Drakopoulos (2014), observed the opposite trends regarding plant height between tillage systems. In that case, use of ST led to taller plants and differences were evident only at the 10 and 12 WAP. The lack of response during initial growth might have been
MSc$Thesis$Report$ $ $$
$ 13$
due to the high initial soil nutrient status of the field used for the that year’s experiment . Also, it was already mentioned that in ST amendments are incorporated deeper in the soil and as a result more time is necessary for the plants to take advantage of the nutrients in those soil layers while in RT-based systems the root system tends to become more shallow. Thus, differences observed at the later growth stages may be explained based on root adaptation to nutrient placement. In our trial though, the initial soil N status was rather low (4-6 kg N ha-1) and it appears that tillage system and intensive secondary soil tillage associated with ridging events may have a pronounced effect on N mineralization. In this context during 2013, ST tended to supply more N throughout the entire growing period (Drakopoulos, 2014) while in 2014 RT-based systems appeared to have higher Nmin values in the upper 0-30 cm of the soil profile during most of the growing season (Salamanca, 2015).
Canopy volume was also affected by tillage system at 6 and 10 WAP. There was an interactive effect of tillage and fertilization regime, which is presented in Fig 3 and 4. From these figures, it can be observed that canopy volume was higher for RT while the combination of GCS and RT performed best both at 8 and 10 WAP. Drakopoulos (2014) on the other hand reported that RT and SCM resulted in a larger canopy volume.
LAI values were initially higher for ST but RT rapidly caught up and therefore overall values were similar after 5 WAP (Table 4). Fertilization N level seems again to have little influence since significant differences occur only at 9 WAP and only when compared with the control plots (Table 4). Regarding the type of amendment used, there was an interaction between fertilization type system and fertilization level at 7 WAP, which is presented in Fig 8. From this figure it can be concluded that there is a response to increased nitrogen fertilization level for LP and GCS while in SCM the highest nitrogen application level (170 kg N ha-1) performs even worse than control plots. This may point out that immobilization of N may have occurred at a certain point during initial growth. However, low C/N ratio of our materials doesn’t support this assumption. C/N ratio for LP, SCM and GCS was approximately 17, 16 and 16 respectively.
It appears that RT was positively affecting plant emergence and initial plant growth. This can be related to higher nutrient availability due to higher mineralization rates observed in RT. Roo and Waggoner (1961) reported that the physical soil properties and not the lack of nutrient is the factor that will inhibit root growth in deeper soil layers to the largest extend. Bulk density with RT was also higher compared to ST at the initial growth stages (Salamanca, 2015). This might have also contributed to a shallower rooting system for ST while use of GCS as a soil amendment appears to favor initial plant growth mainly because of higher nutrient supply.
MSc$Thesis$Report$ $ $(
$14$
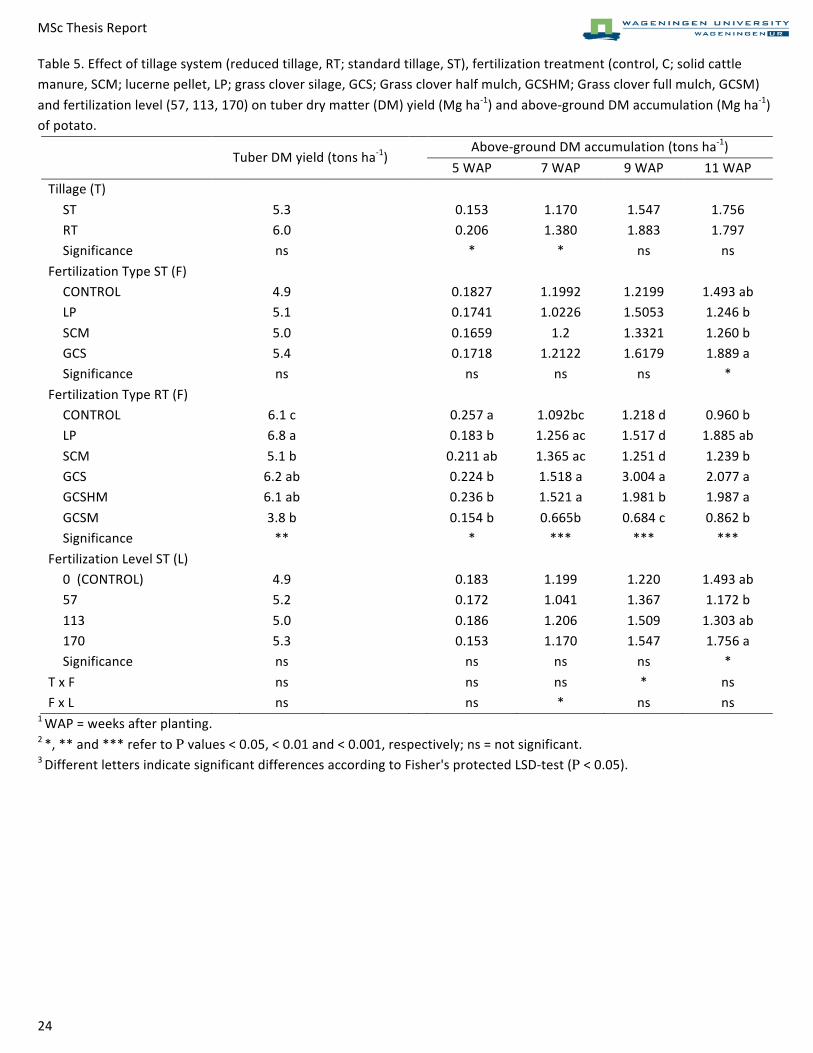
3.2'Tuber'and'aboveSground'DM'accumulation'Tuber DM yield was not affected by tillage system (Table 5). On the contrary, the accumulation of DM in the above-ground part of the plant was higher for RT plots until 7 WAP (Table 5). However, after this time differences no longer were statistically different and final values numerically also seems to be rather similar. It was already mentioned that under RT soil Nmin values were higher. That may explain the differences in DM accumulation in the aboveground part of the plants. The lack of differences in tuber DM yield might be due to the fact that the growing period was terminated 2 to 3 weeks prematurely due to phytophthora infestation. As a result the process of partitioning DM from the above ground part of the plant to the tubers was not completed. Drakopoulos (2014) reported similar aboveground DM accumulation values during initial growth but relatively higher final tuber DM accumulation for ST compared to RT-based systems.
Neither N application rates nor the type of amendment affected tuber DM yield (Table 5). In RT, full mulch plots performed the worst while LP, GCS and GCSHM performed the best. Non-amended control plots perform equally well compared to plots receiving 57 or 113 Kg N ha-1 was applied (Table 5). Also, the effect of the higher N application rates was only obvious only at the later stages of the experiment and statistically different only at the 11th WAP (Table 5). There was an interactive effect of tillage system and fertilization regime at the 9th WAP presented in Fig. 6. From this figure it can be concluded that the combination of RT and GCS results in higher aboveground accumulation. GCS also performed better in ST. An interactive effect was also observed for fertilization regime and fertilization level at the 7 WAP, which is presented in Fig. 7. In this figure it can be seen that with the use of LP there was the most pronounced response to increased fertilization rates but there was no clear response for GCS while with SCM there was an increase until the 113 kg N ha-1. In general Nitrogen availability is considered to have a favorable effect on haulm growth. However, it was shown to have a negative effect on the amount of DM that will be partitioned to tubers (Tekalign and Hammes 2005). Sun et al (2012) arrived also at the conclusion that excess of nitrogen at the initial growth stages increase total DM, but they demonstrated that it will decreased the tuber to total DM ratio (e.g. the DM-based harvest index). Fertilizing regimes that include N side dressing during plant growth may solve this problem. Sharifi et al (2005) reports similar results as well. Vos (1999), on the other hand, reported that using split application for N did not affect crop total DM production while it reduced tuber DM content.
3.'3'Tuber'number,'quality'and'yield'
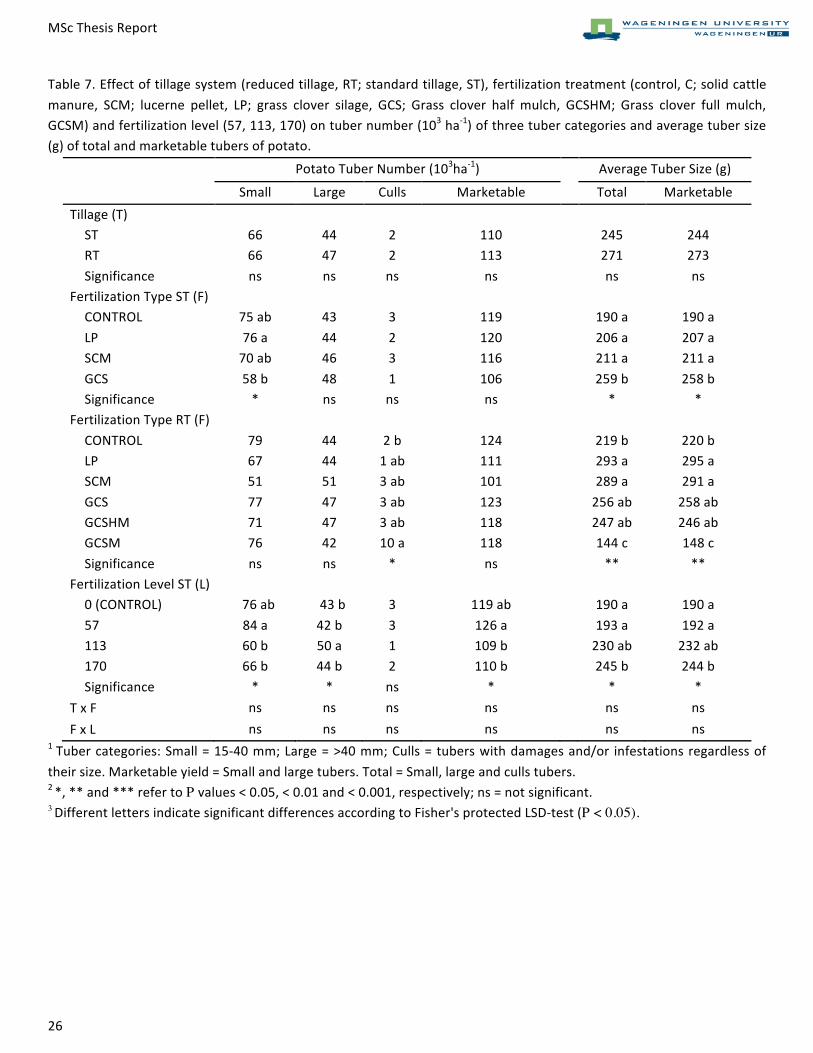
3.3.1'Tuber'number'and'average'tuber'size'Tillage system did not have any effect on either the tuber number or on the average tuber size (Table 7). This is in agreement with reports by Carter and Sandersson (2001),
MSc$Thesis$Report$ $ $$
$ 15$
Carrera et al (2005) and Boligłowa and Gleń (2003) who also reported no effect of the tillage practices on tuber number or tuber size. The number of large tubers was the same regardless what amendment was being applied. Application of 113 kg N ha-1 resulted in a lower number of small tubers and a higher number of large ones (Table 7). Increasing N application rates also increased tuber size. Nitrogen application was shown to have a positive effect on the tuber number and tuber growth (Hanley et al 1965, Wilcox and Hoff 1970, Arsenault et al 2001). In the current study, this increase though, seems to stop when 113 kg N ha -1 was applied since there was no statistical difference between 113 and 170 kg N ha-1 application rates (Table 7). Dubetz and Bole (1975) also reported that excessive nitrogen application did not have any significant effect on the proportion of large tubers. Use of GCS resulted in fewer small tubers and increased average tuber size in ST (Table 7).
Drakopoulos (2014) reported that there was no effect of tillage system on tuber number as well. However, he observed a 10% increase in tuber size under ST mainly due to the drought period that occurred during the experiment. Plants in RT-based systems appeared to have developed a shallower root system and as a result plants were observed to be more susceptible to drought stress and thereby water became a more limiting factor under drought conditions. On the other hand, in ST roots may have proliferated in deeper soil layers since most of the nutrients are concentrated there. As a result, the drought period did not have such a significant effect on plant or tuber growth for ST-based systems during prolonged drought periods. In the current study the absence of differences between ST and RT in terms of tuber size might be due to the earlier harvesting because of the phytophthora infestation, that had a negative effect on tuber bulking and potential tuber yield as the crop cycle was cut short.
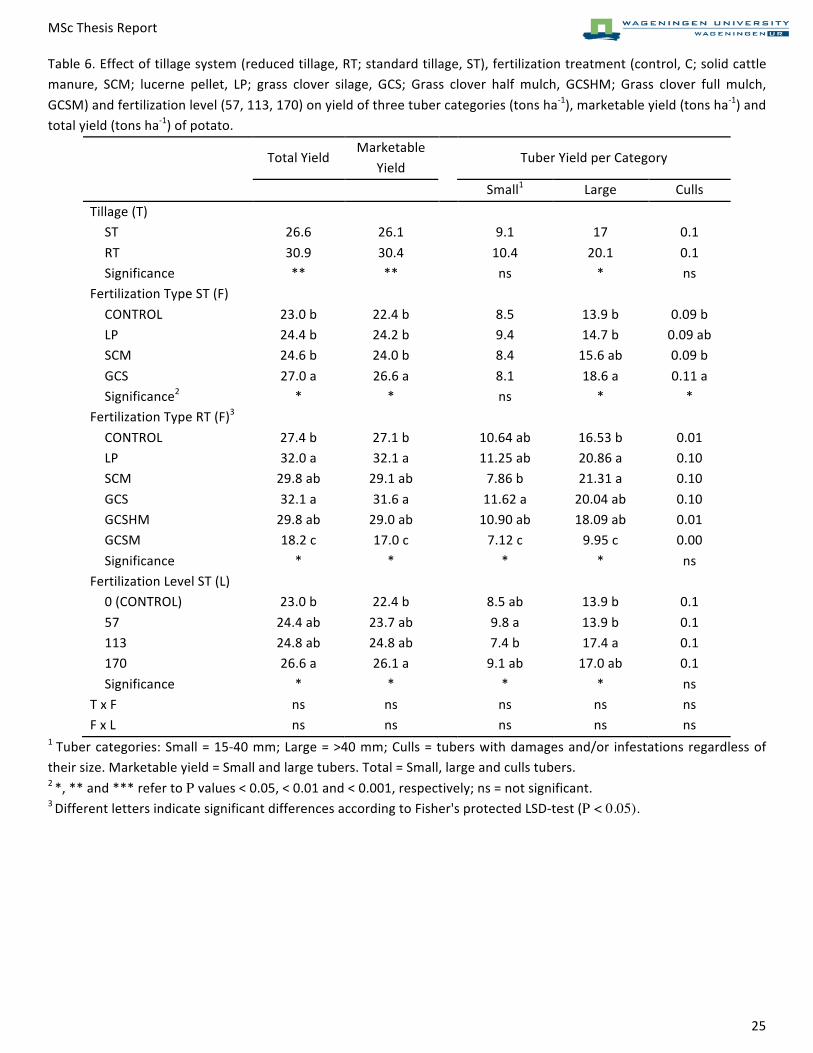
Total yield as well as marketable yield was significantly higher in RT plots (Table 6). Use of RT also led to higher yields of large tubers. Previous research conducted on the effect of tillage system on potato tuber yield showed that RT did not reduce tuber yields either. Carter and Sanderson (2001) also reported that there were no difference between conventional tillage and reduced-shallow tillage systems. Ekeberg and Riley (1996) report similar findings comparing conventional and no tillage (direct planting) systems. Carrera et al (2005) observed that various conservation tillage, cover-cropping systems performed equally well compared to conventional tillage systems. Other researchers (Bennett et al. 1975; Grant and Epstein 1973; Schuler 1979) also arrive at the same conclusion. On the other hand Russell and Bellinder (1989) reported a 20% yield decrease due to late plant emergence in reduced tillage systems.
Use of GCS appeared to have the highest yields in both tillage systems followed by LP (Table 6). Total and marketable yield was not affected by fertilization rates in excess of 57 Kg N ha-1 while fertilization rates up to 113 kg N ha-1 result in higher yield of large
MSc$Thesis$Report$ $ $(
$16$
tubers. However, excessively high nitrogen application rates seem to have a negative effect on yield. Westermann et al (1994) and McKenzie (1981) reported similar findings for the yield of potatoes grown on a silt-loam soil. Errebhi et al (1998) and Atkinson et al (2003) report that applying excessive nitrogen at planting did not affect total yield but increased the proportion of small tubers. Regarding fertilization type, GCS amended plots had higher total and marketable yield in ST while it also performed better under RT although differences in that case were not being significant. Fertilization type thus appears to have a smaller effect on the tuber categories under both ST and RT. Westerman et al (1994) and Waddell et al (1999) also could not detect any effect of the nitrogen source on potato yield. Finally, the findings of Drakopoulos (2014) are in contrast with the findings of the current study, as he showed that total, marketable and large tuber yields were higher for ST mainly due to prolonged drought period occurring at 7 and 8 WAP as discussed earlier.
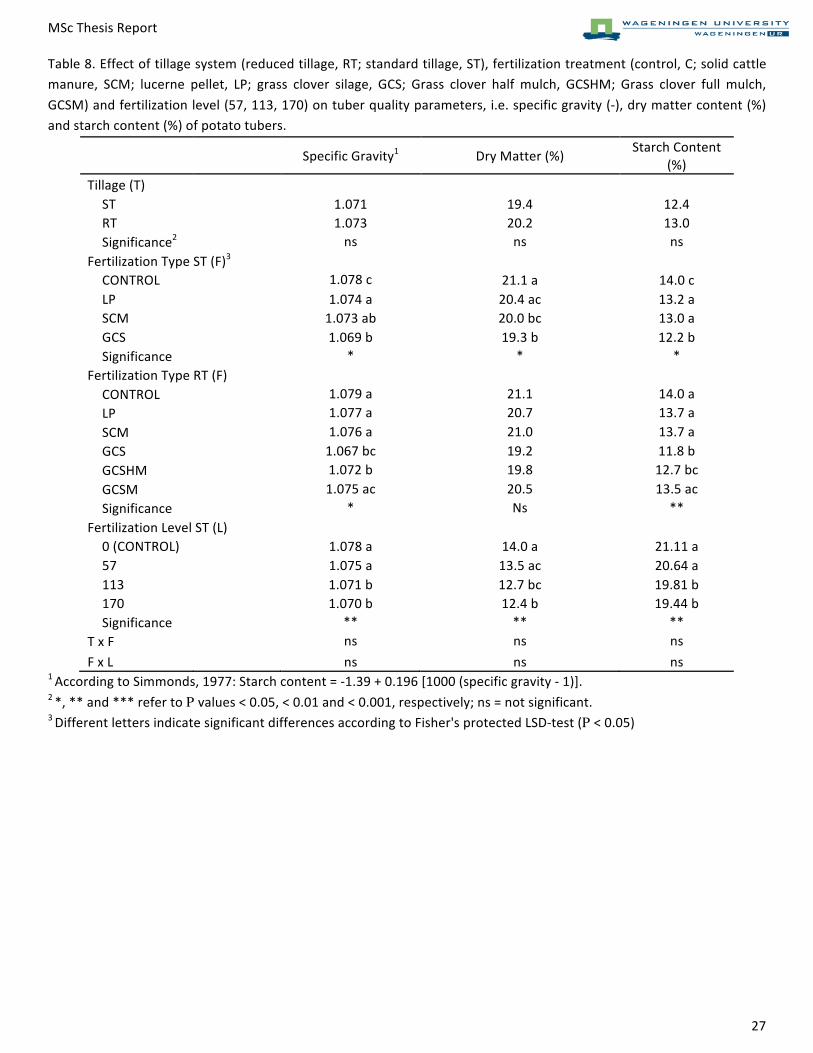
3.3.2'Potato'tuber'quality'No differences were detected in terms of specific gravity, dry matter and starch content of potato tubers between the two different tillage systems (Table 8). Drakopoulos (2014), on the other hand, reported increased values for all these three quality parameters for RT. There was a reverse relation between all these three tuber quality parameters and N application rate since non-amended plots had the highest values for all three of these parameters while these values declined as N application rates increase from 57 to 170 Kg N ha-1 (Table 6). In terms of amendment type, LP performs better than the other amendment in both RT and ST tillage systems. However, non-fertilized plots still perform better than all the fertilized plots (Table 8). Ojala et al (1990) reported similar results regarding the relation between nitrogen availability and specific gravity while Hajšlová et al. (2005) also reported a negative correlation between nitrogen application and tuber starch and DM content.
3.4'N'accumulation,'ANR'and'AE'Total aboveground and tuber N accumulation was not affected by tillage system (Table 9). Results from Ekeberg and Riley (1996) though, suggest that tillage practice affects both haulm and tuber N accumulation with no till (direct planting) accumulating more nitrogen compared to conventional tillage practices. Sidiras et al (1999) also reported higher crop nitrogen accumulation for no tillage compared to reduced (rotary hoeing) and conventional (ploughing followed by rotary hoeing) tillage in vetch (Vicia sativa). According to the findings of Carter (1990), on the other hand, direct drilling practices resulted in lower nitrogen accumulation compared to shallow tillage (rotary harrow), and moldboard plough for cereals grown in sandy loam soils. Locke and Hons (1988), found that conventional tillage led to higher stover and whole plant nitrogen accumulation in sorghum compared to no tillage. Although these last results, are in agreement with those reported by Drakopoulos (2014) for the 2013 experiment at the same field site,
MSc$Thesis$Report$ $ $$
$ 17$
during the 2014 growing season there was no clear tillage effect. This may have been related to the premature ending of the crop growth due to phytopthora.
In terms of soil amendments, GCS performed better, and accumulated significantly more N in tubers in ST-based systems (Table 9). The same occurred in RT for tubers and total N accumulation. However, with SCM N accumulation was significantly lower not only when compared to LP and GCS but also when compared to the non-fertilized control. In general, increasing N application rates resulted in greater crop N accumulation (Table 9). However, differences were no longer significant in rates exceeded 113 kg N ha-1 for tuber N accumulation and 57 kg N ha-1 for total N accumulation.
Regarding ANR, use of GCS resulted in significantly higher N recovery compared to SCM for both RT and ST systems (Table 9). Negative values of ANR for SCM may imply nitrogen immobilization. This is consistent with the observation that SCM also had the lowest values for leaf chlorophyll index and generally demonstrated the worst performance in terms of overall plant growth. However, as mentioned already, low C/N ratio values don’t support this claim. In terms of effect of tillage, overall Agronomic Efficiencies as expressed as partial fraction productivity values for N (PFP-N) values were similar across tillage systems as well while GCS performs better in both tillage systems. Finally, the most efficient use of applied N occurred at the lowest N application rates. Devkota et al (2013) and Cambell et al (1993) also reported the same relation between fertilization rates and nitrogen use efficiency. Moreover, Devkota et al (2013) stated that agronomic nitrogen use efficiency is not related with tillage practices. Similar results were reported by Habtegebrial et al (2006) regarding the relation between tillage and nitrogen use efficiency from experiment conducted on tef (Eragrostis tef). Übelhörn et al (2014), on the other hand, reported higher nitrogen use efficiencies for white cabbage (Brassica oleracea convar. capitata var. alba) when strip tillage was used compared to more intensive strip tillage techniques. Drakopoulos (2014) found that ST has a positive effect on tuber and total N accumulation while the opposite occurred for total and tuber ANR.
3.5'Regression'analysis'In terms of resource management and marketing logistics, it may be desirable to develop simple indicators that correlate well with final yield and crop quality. Linear regression equations and corresponding R-squared and p-values for potato yield as a function of selected plant growth parameters are outlined in Table 10. Starting at 6 WAP, linear relationships expressing yield as a function of plant height and canopy volume appeared to be significant (Table 10). However, they accounted for only a limited part of the total yield variability (54% for plant height at 8 WAP and 44% for Canopy volume at 10 WAP). The same applies for LAI (28% at 11 WAP)(Table 10).
MSc$Thesis$Report$ $ $(
$18$
Based on reports in the literature it appears that yield is closely correlated with light interception, which in turn is affected by LAI and leaf angle distribution and that light interception is an indicator that can be used to predict yield (Wunsche and Lakso 2000, Khurana and McLaren 1982, Boyd et al 2002). Overall radiation use efficiency in tomato was affected to a large degree by light interception as governed by LAI and to a lesser degree with leaf N accumulation (Scholberg et al, 2000). Similarly, in the current study it appears the correlation between leaf chlorophyll index and yield was very weak or non-existing (table 10). Su et al (2007) reported that using SPAD readings could be used in order to predict potato yields early in the season. Ramesh et al (2001) and Le Bail et al (2005) report similar results for rice and wheat respectively. Findings from Mohamed et al (2012) as well De Gil et al (2002) also point out similar trends. However, in the current study there was a direct and positive relation between tuber DM content and N accumulation. This implies that increased N accumulation resulted in increased tuber DM content (Table 11).
'
'
'
'
'$
$
$
$
$
$
$
MSc$Thesis$Report$ $ $$
$ 19$
4'Conclusion'and'Recommendations'The goal of the current thesis was to examine the effect of different tillage systems, fertilization regimes and N application rates on crop performance and nutrient utilization of organic potato. Results demonstrated that RT positively affected initial plant growth. In addition, RT performed better in almost all measurements pertaining to overall crop and tuber performance. Finally, total and marketable yield as well as the yield of large tubers was increased under RT system. Based on these premises it may be concluded that ST could be substituted with RT thereby allowing organic farmers to lower fuel consumption and production costs while improving potato quality and overall profitability. However, the early crop termination due to phytophthora infestation might limit the universal validity of the abovementioned observations regarding tuber yield and tuber quality. It may be argued that under either water limiting conditions or when crop growth duration is not cut short, use of RT may coincide with a growth reduction during the final growth phase.
In terms of fertilizer type, GCS outperformed SCM and LP on a rather consistent basis. With the use of SCM there was some evidence of nitrogen immobilization under both tillage systems. However, in the current year the GCS material was obtained from the last cut of a rather short sward and as a result had a higher fraction clover, low structural component (fibre) content and C/N ratio compared to previous years at the same field site. In case that the C/N ratio of GCS exceeds 18, pronounced N immobilization might be observed. Therefore, the specific characteristics of organic fertilizers (C/N ratio, lignin and N content) must be taken into account before application in order to be able to predict more effectively nutrient release and nutrient uptake synchronization. Applying half of the GCS quantity as mulch later on in the cultivating period showed to hold promise although it still did not perform as good as full incorporation prior to planting. Finally, it appears that the effect of N application rates is lower than expected implying higher N losses and lower N use efficiency when application rates exceed 113 Kg N ha-1.
Based on the results of the current study we conclude that animal-based manures such as SCM could be effectively substituted by plant-based fertilizers with C/N ratio lower than 20, since their use resulted in higher yields and better N use efficiency, especially when combined with RT systems. Taking into account the price of LP and GCS as well as their effect on crop performance, tuber yield and quality, use of GCS appears to be preferable since it is much less expensive and more effective compared to LP. In addition, GCS affords farmers with an on-farm produced renewable N resource thereby decreasing their dependency on external inputs and animal-based manures. However, as discussed before, it is key to ensure that the quality of the GCS material is optimal which is often related to ensuring adequate potassium supply especially for grass clover produced on sandy soils. In terms of fertilization rates, based on the experimental
MSc$Thesis$Report$ $ $(
$20$
results there appears to be no positive crop response to fertilization rates on excess of 113 kg N ha-1. Use of still higher N application rates did not appear to increase tuber yield and quality but on the contrary might peril the sustainability of the system due to potentially increased nutrient loss. Drakopoulos et al (2013), also observed the potentials of plant based fertilizers but concludes that LP had a bigger potential compared to GCS. It appears that the effectiveness of each fertilization regime might vary among years due to difference in environmental condition, intrinsic properties of the amendments being used as well as agronomic practices. As a result, additional research is required to minimize the effect of these variations and be able to provide concrete recommendations that are universally applicable.
MSc$Thesis$Report$ $ $$
$ 21$
5.'Tables'and'figures'
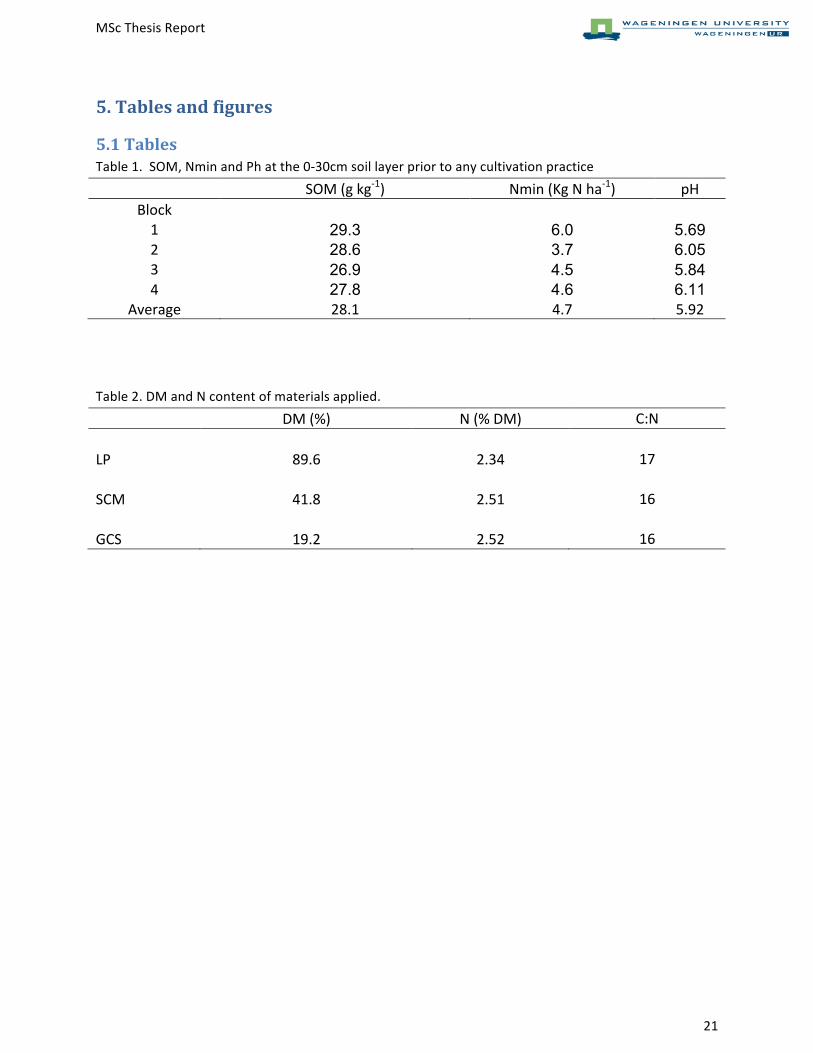
5.1'Tables'Table$1.$$SOM,$Nmin$and$Ph$at$the$0K30cm$soil$layer$prior$to$any$cultivation$practice$
$$ SOM$(g$kgK1)$ Nmin$(Kg$N$haK1)$ pH$Block$
$ $ $1$ 29.3 6.0 5.69 2$ 28.6 3.7 6.05 3$ 26.9 4.5 5.84 4$ 27.8 4.6 6.11
Average$ 28.1$ 4.7$ 5.92$$
$
Table$2.$DM$and$N$content$of$materials$applied.$
$$ DM$(%)$ N$(%$DM)$ C:N$
$ $ $$
LP$ 89.6$ 2.34$ 17$
$ $ $$
SCM$ 41.8$ 2.51$ 16$
$ $ $$
GCS$ 19.2$ 2.52$ 16$$
$
$$$$$$$$$$$$$$$$$$
$$
MSc$Thesis$Report$ $ $(
$22$
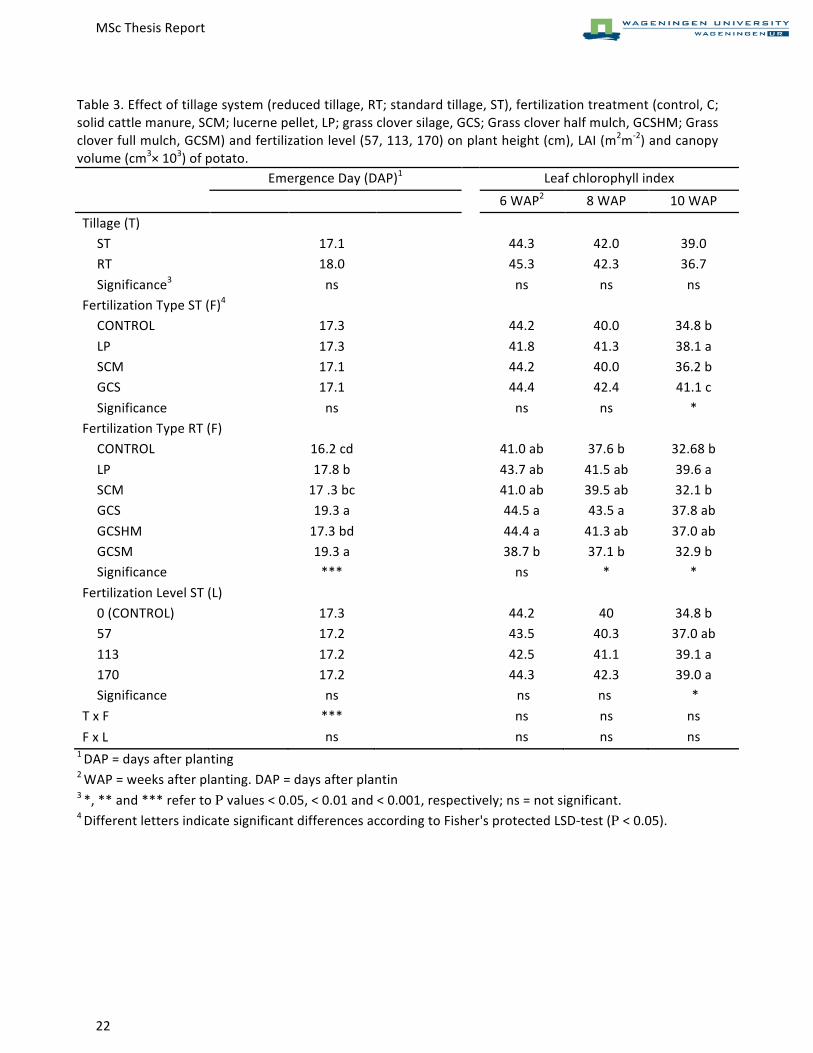
Table$3.$Effect$of$tillage$system$(reduced$tillage,$RT;$standard$tillage,$ST),$fertilization$treatment$(control,$C;$solid$cattle$manure,$SCM;$lucerne$pellet,$LP;$grass$clover$silage,$GCS;$Grass$clover$half$mulch,$GCSHM;$Grass$clover$full$mulch,$GCSM)$and$fertilization$level$(57,$113,$170)$on$plant$height$(cm),$LAI$(m2mK2)$and$canopy$volume$(cm3×$103)$of$potato. $$ Emergence$Day$(DAP)1$ $$ Leaf$chlorophyll$index$
$$ $$ $$ $$ $ 6$WAP2$ 8$WAP$ 10$WAP$
Tillage$(T)$ $ $ $ $ $ $ $
ST$ $ 17.1$ $ $ 44.3$ 42.0$ 39.0$
RT$ $ 18.0$ $ $ 45.3$ 42.3$ 36.7$
Significance3$ ns$ $ $ ns$ ns$ ns$
Fertilization$Type$ST$(F)4$ $ $ $ $ $ $
CONTROL$ $ 17.3$ $ $ 44.2$ 40.0$ 34.8$b$
LP$ $ 17.3$ $ $ 41.8$ 41.3$ 38.1$a$
SCM$ $ 17.1$ $ $ 44.2$ 40.0$ 36.2$b$
GCS$ $ 17.1$ $ $ 44.4$ 42.4$ 41.1$c$
Significance$ ns$ $ $ ns$ ns$ *$
Fertilization$Type$RT$(F)$ $ $ $ $ $ $
CONTROL$ $ 16.2$cd$ $ $ 41.0$ab$ 37.6$b$ 32.68$b$
LP$ $ 17.8$b$ $ $ 43.7$ab$ 41.5$ab$ 39.6$a$
SCM$ $ 17$.3$bc$ $ $ 41.0$ab$ 39.5$ab$ 32.1$b$
GCS$ $ 19.3$a$ $ $ 44.5$a$ 43.5$a$ 37.8$ab$
GCSHM$ $ 17.3$bd$ $ $ 44.4$a$ 41.3$ab$ 37.0$ab$
GCSM$ $ 19.3$a$ $ $ 38.7$b$ 37.1$b$ 32.9$b$
Significance$ ***$ $ $ ns$ *$ *$
Fertilization$Level$ST$(L)$ $ $ $ $ $ $
0$(CONTROL)$ $ 17.3$ $ $ 44.2$ 40$ 34.8$b$
57$ $ 17.2$ $ $ 43.5$ 40.3$ 37.0$ab$
113$ $ 17.2$ $ $ 42.5$ 41.1$ 39.1$a$
170$ $ 17.2$ $ $ 44.3$ 42.3$ 39.0$a$
Significance$ ns$ $ $ $ns$ ns$$ $*$
T$x$F$ $ ***$ $ $ ns$ ns$ ns$
F$x$L$ $$ ns$ $$ $$ ns$ ns$ ns$1$DAP$=$days$after$planting
$
2$WAP$=$weeks$after$planting.$DAP$=$days$after$plantin$3$*,$**$and$***$refer$to$P values$<$0.05,$<$0.01$and$<$0.001,$respectively;$ns$=$not$significant.$4$Different$letters$indicate$significant$differences$according$to$Fisher's$protected$LSDKtest$(P <$0.05).
$
$
MSc$Thesis$Report$ $ $
$
$ 23$
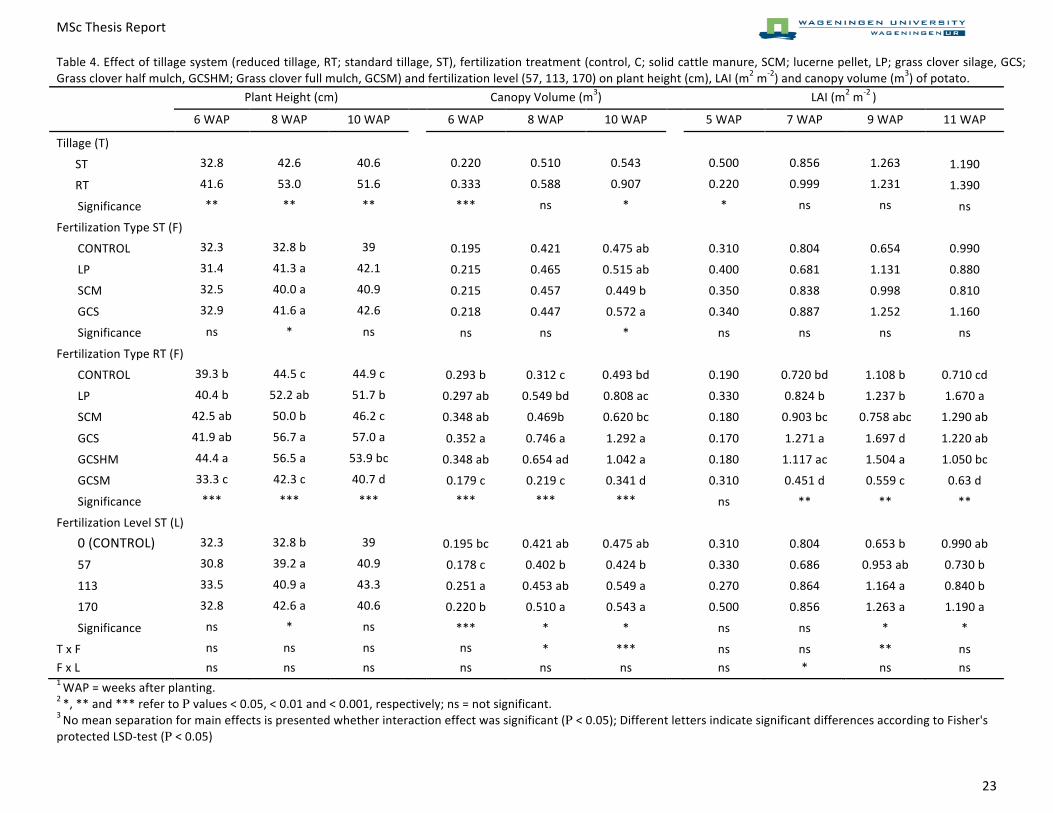
Table$4.$Effect$of$tillage$system$(reduced$tillage,$RT;$standard$tillage,$ST),$fertilization$treatment$(control,$C;$solid$cattle$manure,$SCM;$lucerne$pellet,$LP;$grass$clover$silage,$GCS;$
Grass$clover$half$mulch,$GCSHM;$Grass$clover$full$mulch,$GCSM)$and$fertilization$level$(57,$113,$170)$on$plant$height$(cm),$LAI$(m2$m
O2)$and$canopy$volume$(m
3)$of$potato.$
$$ Plant$Height$(cm)$ $$ Canopy$Volume$(m3)$ $$ LAI$(m
2$m
O2$)$
$$ 6$WAP$ 8$WAP$ 10$WAP$ $$ 6$WAP$ 8$WAP$ 10$WAP$ $$ 5$WAP$ 7$WAP$ 9$WAP$ 11$WAP$
Tillage$(T)$ $ $ $ $ $ $ $ $ $ $ $ $
ST$ 32.8$ 42.6$ 40.6$ $ 0.220$ 0.510$ 0.543$ $ 0.500$ 0.856$ 1.263$ 1.190$
RT$ 41.6$ 53.0$ 51.6$ $ 0.333$ 0.588$ 0.907$ $ 0.220$ 0.999$ 1.231$ 1.390$
Significance$ **$ **$ **$ $ ***$ ns$ *$ $ *$ ns$ ns$ ns$
Fertilization$Type$ST$(F)$ $ $ $ $ $ $ $ $ $ $ $
CONTROL$ 32.3$ 32.8$b$ 39$ $ 0.195$ 0.421$ 0.475$ab$ $ 0.310$ 0.804$ 0.654$ 0.990$
LP$ 31.4$ 41.3$a$ 42.1$ $ 0.215$ 0.465$ 0.515$ab$ $ 0.400$ 0.681$ 1.131$ 0.880$
SCM$ 32.5$ 40.0$a$ 40.9$ $ 0.215$ 0.457$ 0.449$b$ $ 0.350$ 0.838$ 0.998$ 0.810$
GCS$ 32.9$ 41.6$a$ 42.6$ $ 0.218$ 0.447$ 0.572$a$ $ 0.340$ 0.887$ 1.252$ 1.160$
Significance$ ns$ *$ ns$ $ ns$ ns$ *$ $ ns$ ns$ ns$ ns$
Fertilization$Type$RT$(F)$ $ $ $ $ $ $ $ $ $ $ $
CONTROL$ 39.3$b$ 44.5$c$ 44.9$c$ $ 0.293$b$ 0.312$c$ 0.493$bd$ $ 0.190$ 0.720$bd$ 1.108$b$ 0.710$cd$
LP$ 40.4$b$ 52.2$ab$ 51.7$b$ $ 0.297$ab$ 0.549$bd$ 0.808$ac$ $ 0.330$ 0.824$b$ 1.237$b$ 1.670$a$
SCM$ 42.5$ab$ 50.0$b$ 46.2$c$ $ 0.348$ab$ 0.469b$ 0.620$bc$ $ 0.180$ 0.903$bc$ 0.758$abc$ 1.290$ab$
GCS$ 41.9$ab$ 56.7$a$ 57.0$a$ $ 0.352$a$ 0.746$a$ 1.292$a$ $ 0.170$ 1.271$a$ 1.697$d$ 1.220$ab$
GCSHM$ 44.4$a$ 56.5$a$ 53.9$bc$ $ 0.348$ab$ 0.654$ad$ 1.042$a$ $ 0.180$ 1.117$ac$ 1.504$a$ 1.050$bc$
GCSM$ 33.3$c$ 42.3$c$ 40.7$d$ $ 0.179$c$ 0.219$c$ 0.341$d$ $ 0.310$ 0.451$d$ 0.559$c$ 0.63$d$
Significance$ ***$ ***$ ***$ $ ***$ ***$ ***$ $ ns$ **$ **$ **$
Fertilization$Level$ST$(L)$ $ $ $ $ $ $ $ $ $ $ $
0$(CONTROL)$ 32.3$ 32.8$b$ 39$ $ 0.195$bc$ 0.421$ab$ 0.475$ab$ $ 0.310$ 0.804$ 0.653$b$ 0.990$ab$
57$ 30.8$ 39.2$a$ 40.9$ $ 0.178$c$ 0.402$b$ 0.424$b$ $ 0.330$ 0.686$ 0.953$ab$ 0.730$b$
113$ 33.5$ 40.9$a$ 43.3$ $ 0.251$a$ 0.453$ab$ 0.549$a$ $ 0.270$ 0.864$ 1.164$a$ 0.840$b$
170$ 32.8$ 42.6$a$ 40.6$ $ 0.220$b$ 0.510$a$ 0.543$a$ $ 0.500$ 0.856$ 1.263$a$ 1.190$a$
Significance$ ns$ *$ ns$ $ ***$ *$ *$ $ ns$ ns$ *$ *$
T$x$F$ ns$ ns$ ns$ $ ns$ *$ ***$ $ ns$ ns$ **$ ns$
F$x$L$ ns$ ns$ ns$ $$ ns$ ns$ ns$ $$ ns$ *$ ns$ ns$
1$WAP$=$weeks$after$planting.$
2$*,$**$and$***$refer$to$P values$<$0.05,$<$0.01$and$<$0.001,$respectively;$ns$=$not$significant.$
3$No$mean$separation$for$main$effects$is$presented$whether$interaction$effect$was$significant$(P <$0.05);$Different$letters$indicate$significant$differences$according$to$Fisher's$protected$LSDOtest$(P <$0.05)
MSc$Thesis$Report$ $ $(
$24$
Table$5.$Effect$of$tillage$system$(reduced$tillage,$RT;$standard$tillage,$ST),$fertilization$treatment$(control,$C;$solid$cattle$manure,$SCM;$lucerne$pellet,$LP;$grass$clover$silage,$GCS;$Grass$clover$half$mulch,$GCSHM;$Grass$clover$full$mulch,$GCSM)$and$fertilization$level$(57,$113,$170)$on$tuber$dry$matter$(DM)$yield$(Mg$haK1)$and$aboveKground$DM$accumulation$(Mg$haK1)$of$potato. $$
Tuber$DM$yield$(tons$haK1)$$$ AboveKground$DM$accumulation$(tons$haK1)$
$$ $$ 5$WAP$ 7$WAP$ 9$WAP$ 11$WAP$Tillage$(T)$ $ $ $ $ $ $ $ $
ST$ $ 5.3$ $ $ 0.153$ 1.170$ 1.547$ 1.756$RT$ $ 6.0$ $ $ 0.206$ 1.380$ 1.883$ 1.797$Significance$ ns$ $ $ *$ *$ ns$ ns$
Fertilization$Type$ST$(F)$ $ $ $ $ $ $ $CONTROL$ $ 4.9$ $ $ 0.1827$ 1.1992$ 1.2199$ 1.493$ab$LP$ $ 5.1$ $ $ 0.1741$ 1.0226$ 1.5053$ 1.246$b$SCM$ $ 5.0$ $ $ 0.1659$ 1.2$ 1.3321$ 1.260$b$GCS$ $ 5.4$ $ $ 0.1718$ 1.2122$ 1.6179$ 1.889$a$Significance$ ns$ $ $ ns$ ns$ ns$ *$
Fertilization$Type$RT$(F)$ $ $ $ $ $ $ $CONTROL$ $ 6.1$c$ $ $ 0.257$a$ 1.092bc$ 1.218$d$ 0.960$b$LP$ $ 6.8$a$ $ $ 0.183$b$ 1.256$ac$ 1.517$d$ 1.885$ab$SCM$ $ 5.1$b$ $ $ 0.211$ab$ 1.365$ac$ 1.251$d$ 1.239$b$GCS$ $ 6.2$ab$ $ $ 0.224$b$ 1.518$a$ 3.004$a$ 2.077$a$GCSHM$ $ 6.1$ab$ $ $ 0.236$b$ 1.521$a$ 1.981$b$ 1.987$a$GCSM$ $ 3.8$b$ $ $ 0.154$b$ 0.665b$ 0.684$c$ 0.862$b$Significance$ **$ $ $ *$ ***$ ***$ ***$
Fertilization$Level$ST$(L)$ $ $ $ $ $ $ $0$$(CONTROL)$ $ 4.9$ $ $ 0.183$ 1.199$ 1.220$ 1.493$ab$57$ $ 5.2$ $ $ 0.172$ 1.041$ 1.367$ 1.172$b$113$ $ 5.0$ $ $ 0.186$ 1.206$ 1.509$ 1.303$ab$170$ $ 5.3$ $ $ 0.153$ 1.170$ 1.547$ 1.756$a$Significance$ ns$ $ $ ns$ ns$ ns$ *$
T$x$F$ $ ns$ $ $ ns$ ns$ *$ ns$F$x$L$ $$ ns$ $$ $$ ns$ *$ ns$ ns$
1$WAP$=$weeks$after$planting.$$2$*,$**$and$***$refer$to$P values$<$0.05,$<$0.01$and$<$0.001,$respectively;$ns$=$not$significant.$$3$Different$letters$indicate$significant$differences$according$to$Fisher's$protected$LSDKtest$(P <$0.05).$
MSc$Thesis$Report$ $ $$
$ 25$
Table$6.$Effect$of$tillage$system$(reduced$tillage,$RT;$standard$tillage,$ST),$fertilization$treatment$(control,$C;$solid$cattle$manure,$ SCM;$ lucerne$ pellet,$ LP;$ grass$ clover$ silage,$ GCS;$ Grass$ clover$ half$ mulch,$ GCSHM;$ Grass$ clover$ full$ mulch,$GCSM)$and$fertilization$level$(57,$113,$170)$on$yield$of$three$tuber$categories$(tons$haK1),$marketable$yield$(tons$haK1)$and$total$yield$(tons$haK1)$of$potato.$
$$ Total$Yield$Marketable$
Yield$$$ Tuber$Yield$per$Category$
$$ $$ $$ $$ Small1$ Large$ Culls$Tillage$(T)$ $ $ $ $ $ $
ST$ 26.6$ 26.1$ $ 9.1$ 17$ 0.1$RT$ 30.9$ 30.4$ $ 10.4$ 20.1$ 0.1$Significance$ **$ **$ $ ns$ *$ ns$
Fertilization$Type$ST$(F)$ $ $ $ $ $CONTROL$ 23.0$b$ 22.4$b$ $ 8.5$ 13.9$b$ 0.09$b$LP$ 24.4$b$ 24.2$b$ $ 9.4$ 14.7$b$ 0.09$ab$SCM$ 24.6$b$ 24.0$b$ $ 8.4$ 15.6$ab$ 0.09$b$GCS$ 27.0$a$ 26.6$a$ $ 8.1$ 18.6$a$ 0.11$a$Significance2$ *$ *$ $ ns$ *$ *$
Fertilization$Type$RT$(F)3$ $ $ $ $ $CONTROL$ 27.4$b$ 27.1$b$ $ 10.64$ab$ 16.53$b$ 0.01$LP$ 32.0$a$ 32.1$a$ $ 11.25$ab$ 20.86$a$ 0.10$SCM$ 29.8$ab$ 29.1$ab$ $ 7.86$b$ 21.31$a$ 0.10$GCS$ 32.1$a$ 31.6$a$ $ 11.62$a$ 20.04$ab$ 0.10$GCSHM$ 29.8$ab$ 29.0$ab$ $ 10.90$ab$ 18.09$ab$ 0.01$GCSM$ 18.2$c$ 17.0$c$ $ 7.12$c$ 9.95$c$ 0.00$Significance$ *$ *$ $ *$ *$ ns$
Fertilization$Level$ST$(L)$ $ $ $ $ $0$(CONTROL)$ 23.0$b$ 22.4$b$ $ 8.5$ab$ 13.9$b$ 0.1$57$ 24.4$ab$ 23.7$ab$ $ 9.8$a$ 13.9$b$ 0.1$113$ 24.8$ab$ 24.8$ab$ $ 7.4$b$ 17.4$a$ 0.1$170$ 26.6$a$ 26.1$a$ $ 9.1$ab$ 17.0$ab$ 0.1$Significance$ *$ *$ $ *$ *$ ns$
T$x$F$ ns$ ns$ $ ns$ ns$ ns$F$x$L$ ns$ ns$ $$ ns$ ns$ ns$
1$Tuber$categories:$Small$=$15K40$mm;$Large$=$>40$mm;$Culls$=$tubers$with$damages$and/or$ infestations$regardless$of$their$size.$Marketable$yield$=$Small$and$large$tubers.$Total$=$Small,$large$and$culls$tubers.$$2$*,$**$and$***$refer$to$P values$<$0.05,$<$0.01$and$<$0.001,$respectively;$ns$=$not$significant.$$3$Different$letters$indicate$significant$differences$according$to$Fisher's$protected$LSDKtest$(P < 0.05). $$ $ $ $ $
$$$$$$$
MSc$Thesis$Report$ $ $(
$26$
$Table$7.$Effect$of$tillage$system$(reduced$tillage,$RT;$standard$tillage,$ST),$fertilization$treatment$(control,$C;$solid$cattle$manure,$ SCM;$ lucerne$ pellet,$ LP;$ grass$ clover$ silage,$ GCS;$ Grass$ clover$ half$ mulch,$ GCSHM;$ Grass$ clover$ full$ mulch,$GCSM)$and$fertilization$level$(57,$113,$170)$on$tuber$number$(103$haK1)$of$three$tuber$categories$and$average$tuber$size$(g)$of$total$and$marketable$tubers$of$potato.$
$$ Potato$Tuber$Number$(103haK1)$ $$ Average$Tuber$Size$(g)$
$$ Small$ Large$ Culls$ Marketable$ $$ Total$ Marketable$Tillage$(T)$ $$ $$ $$ $$ $$ $$ $$
ST$ 66$ 44$ 2$ 110$ $ 245$ 244$RT$ 66$ 47$ 2$ 113$ $ 271$ 273$Significance$ ns$ ns$ ns$ ns$ $ ns$ ns$
Fertilization$Type$ST$(F)$ $ $ $ $ $ $CONTROL$ 75$ab$ 43$ 3$ 119$ $ 190$a$ 190$a$LP$ 76$a$ 44$ 2$ 120$ $ 206$a$ 207$a$SCM$ 70$ab$ 46$ 3$ 116$ $ 211$a$ 211$a$GCS$ 58$b$ 48$ 1$ 106$ $ 259$b$ 258$b$Significance$ *$ ns$ ns$ ns$ $ *$ *$
Fertilization$Type$RT$(F)$ $ $ $ $ $ $CONTROL$ 79$ 44$ 2$b$ 124$ $ 219$b$ 220$b$LP$ 67$ 44$ 1$ab$ 111$ $ 293$a$ 295$a$SCM$ 51$ 51$ 3$ab$ 101$ $ 289$a$ 291$a$GCS$ 77$ 47$ 3$ab$ 123$ $ 256$ab$ 258$ab$GCSHM$ 71$ 47$ 3$ab$ 118$ $ 247$ab$ 246$ab$GCSM$ 76$ 42$ 10$a$ 118$ $ 144$c$ 148$c$Significance$ ns$ ns$ *$ ns$ $ **$ **$
Fertilization$Level$ST$(L)$ $ $ $ $ $ $0$(CONTROL)$ $$76$ab$ $$43$b$ 3$ 119$ab$ $ 190$a$ 190$a$57$ 84$a$ 42$b$ 3$ 126$a$ $ 193$a$ 192$a$113$ 60$b$ 50$a$ 1$ 109$b$ $ 230$ab$ 232$ab$170$ 66$b$ 44$b$ 2$ 110$b$ $ 245$b$ 244$b$$Significance$ *$ *$ ns$ *$ $ *$ *$
T$x$F$ ns$ ns$ ns$ ns$ $ ns$ ns$F$x$L$ ns$ ns$ ns$ ns$ $$ ns$ ns$
1$Tuber$categories:$Small$=$15K40$mm;$Large$=$>40$mm;$Culls$=$tubers$with$damages$and/or$ infestations$regardless$of$their$size.$Marketable$yield$=$Small$and$large$tubers.$Total$=$Small,$large$and$culls$tubers.$$2$*,$**$and$***$refer$to$P values$<$0.05,$<$0.01$and$<$0.001,$respectively;$ns$=$not$significant.$$3 Different$letters$indicate$significant$differences$according$to$Fisher's$protected$LSDKtest$(P < 0.05). $$$$$$$$
MSc$Thesis$Report$ $ $$
$ 27$
Table$8.$Effect$of$tillage$system$(reduced$tillage,$RT;$standard$tillage,$ST),$fertilization$treatment$(control,$C;$solid$cattle$manure,$ SCM;$ lucerne$ pellet,$ LP;$ grass$ clover$ silage,$ GCS;$ Grass$ clover$ half$ mulch,$ GCSHM;$ Grass$ clover$ full$ mulch,$GCSM)$and$fertilization$level$(57,$113,$170)$on$tuber$quality$parameters,$i.e.$specific$gravity$(K),$dry$matter$content$(%)$and$starch$content$(%)$of$potato$tubers.$
$$ $$ Specific$Gravity1$ Dry$Matter$(%)$ Starch$Content$(%)$
Tillage$(T)$ $ $ $ $ST$ $ 1.071$ 19.4$ 12.4$RT$ $ 1.073$ 20.2$ 13.0$Significance2$ ns$ ns$ ns$
Fertilization$Type$ST$(F)3$ $ $ $CONTROL$ $ 1.078$c$ 21.1$a$ 14.0$c$LP$ $ 1.074$a$ 20.4$ac$ 13.2$a$SCM$ $ 1.073$ab$ 20.0$bc$ 13.0$a$GCS$ $ 1.069$b$ 19.3$b$ 12.2$b$Significance$ *$ *$ *$
Fertilization$Type$RT$(F)$ $ $ $CONTROL$ $ 1.079$a$ 21.1$ 14.0$a$LP$ $ 1.077$a$ 20.7$ 13.7$a$SCM$ $ 1.076$a$ 21.0$ 13.7$a$GCS$ $ 1.067$bc$ 19.2$ 11.8$b$GCSHM$ $ 1.072$b$ 19.8$ 12.7$bc$GCSM$ $ 1.075$ac$ 20.5$ 13.5$ac$Significance$ *$ Ns$ **$
Fertilization$Level$ST$(L)$ $ $ $0$(CONTROL)$ $ 1.078$a$ 14.0$a$ 21.11$a$57$ $ 1.075$a$ 13.5$ac$ 20.64$a$113$ $ 1.071$b$ 12.7$bc$ 19.81$b$170$ $ 1.070$b$ 12.4$b$ 19.44$b$Significance$ **$ **$ **$
T$x$F$ $ ns$ ns$ ns$F$x$L$ $$ ns$ ns$ ns$
1$According$to$Simmonds,$1977:$Starch$content$=$K1.39$+$0.196$[1000$(specific$gravity$K$1)].$$2$*,$**$and$***$refer$to$P values$<$0.05,$<$0.01$and$<$0.001,$respectively;$ns$=$not$significant.$$3$Different$letters$indicate$significant$differences$according$to$Fisher's$protected$LSDKtest$(P <$0.05)$$$$$$$$$$$
MSc$Thesis$Report$ $ $$
$ 28$
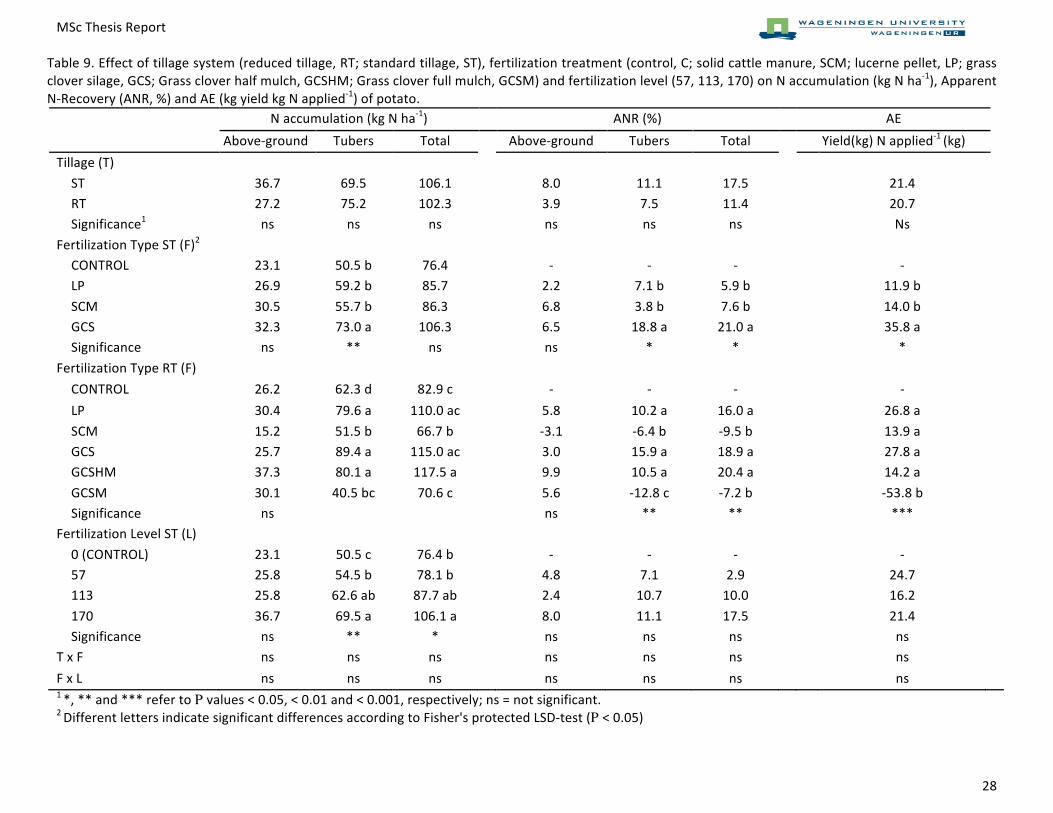
Table$9.$Effect$of$tillage$system$(reduced$tillage,$RT;$standard$tillage,$ST),$fertilization$treatment$(control,$C;$solid$cattle$manure,$SCM;$lucerne$pellet,$LP;$grass$clover$silage,$GCS;$Grass$clover$half$mulch,$GCSHM;$Grass$clover$full$mulch,$GCSM)$and$fertilization$level$(57,$113,$170)$on$N$accumulation$(kg$N$haP1),$Apparent$NPRecovery$(ANR,$%)$and$AE$(kg$yield$kg$N$appliedP1)$of$potato.$ $$ N$accumulation$(kg$N$haP1)$ $$ ANR$(%)$ $$ AE$$$$ AbovePground$ Tubers$ Total$ $$ AbovePground$ Tubers$ Total$ $$ Yield(kg)$N$appliedP1$(kg)$Tillage$(T)$ $ $ $ $ $ $ $ $ $ $ $
ST$ 36.7$ 69.5$ 106.1$ $ 8.0$ 11.1$ 17.5$ $ $ 21.4$ $RT$ 27.2$ 75.2$ 102.3$ $ 3.9$ 7.5$ 11.4$ $ $ 20.7$ $Significance1$ ns$ ns$ ns$ $ ns$ ns$ ns$ $ $ Ns$ $
Fertilization$Type$ST$(F)2$ $ $ $ $ $ $ $ $ $ $CONTROL$ 23.1$ 50.5$b$ 76.4$ $ P$ P$ P$ $ $ P$ $LP$ 26.9$ 59.2$b$ 85.7$ $ 2.2$ 7.1$b$ 5.9$b$ $ $ 11.9$b$ $SCM$ 30.5$ 55.7$b$ 86.3$ $ 6.8$ 3.8$b$ 7.6$b$ $ $ 14.0$b$ $GCS$ 32.3$ 73.0$a$ 106.3$ $ 6.5$ 18.8$a$ 21.0$a$ $ $ 35.8$a$ $Significance$ ns$ **$ ns$ $ ns$ *$ *$ $ $ *$ $
Fertilization$Type$RT$(F)$ $ $ $ $ $ $ $ $ $ $CONTROL$ 26.2$ 62.3$d$ 82.9$c$ $ P$ P$ P$ $ $ P$ $LP$ 30.4$ 79.6$a$ 110.0$ac$ $ 5.8$ 10.2$a$ 16.0$a$ $ $ 26.8$a$ $SCM$ 15.2$ 51.5$b$ 66.7$b$ $ P3.1$ P6.4$b$ P9.5$b$ $ $ 13.9$a$ $GCS$ 25.7$ 89.4$a$ 115.0$ac$ $ 3.0$ 15.9$a$$ 18.9$a$ $ $ 27.8$a$ $GCSHM$ 37.3$ 80.1$a$ 117.5$a$ $ 9.9$ 10.5$a$ 20.4$a$ $ $ 14.2$a$ $GCSM$ 30.1$ 40.5$bc$ 70.6$c$ $ 5.6$ P12.8$c$ P7.2$b$ $ $ P53.8$b$ $Significance$ ns$ $ $ $ ns$ **$ **$ $ $ ***$ $
Fertilization$Level$ST$(L)$ $ $ $ $ $ $ $ $ $ $0$(CONTROL)$ 23.1$ 50.5$c$ 76.4$b$ $ P$ P$ P$ $ $ P$ $57$ 25.8$ 54.5$b$ 78.1$b$ $ 4.8$ 7.1$ 2.9$ $ $ 24.7$ $113$ 25.8$ 62.6$ab$ 87.7$ab$ $ 2.4$ 10.7$ 10.0$ $ $ 16.2$ $170$ 36.7$ 69.5$a$ 106.1$a$ $ 8.0$ 11.1$ 17.5$ $ $ 21.4$ $Significance$ ns$ **$ *$ $ ns$ ns$ ns$ $ $ ns$ $
T$x$F$ ns$ ns$ ns$ $ ns$ ns$ ns$ $ $ ns$ $F$x$L$ ns$ ns$ ns$ $$ ns$ ns$ ns$ $$ $$ ns$ $$1$*,$**$and$***$refer$to$P values$<$0.05,$<$0.01$and$<$0.001,$respectively;$ns$=$not$significant.$$2$Different$letters$indicate$significant$differences$according$to$Fisher's$protected$LSDPtest$(P <$0.05)
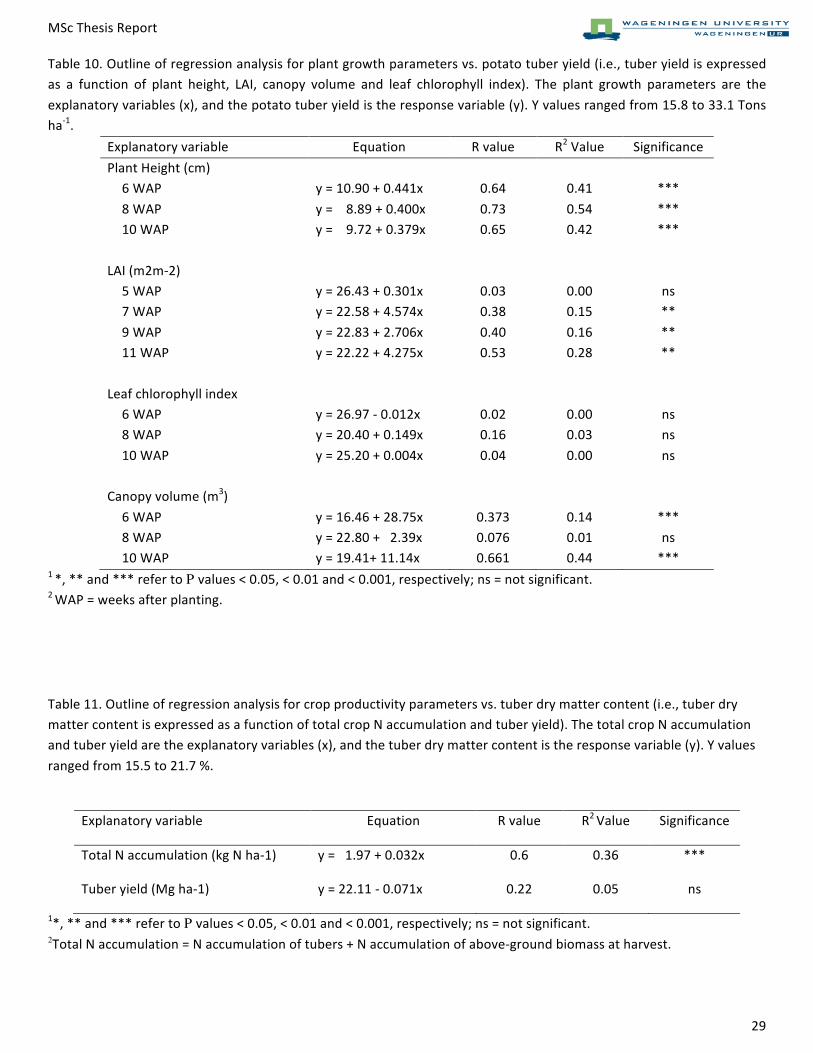
MSc$Thesis$Report$ $ $$
$ 29$
Table$10.$Outline$of$regression$analysis$for$plant$growth$parameters$vs.$potato$tuber$yield$(i.e.,$tuber$yield$is$expressed$as$ a$ function$ of$ plant$ height,$ LAI,$ canopy$ volume$ and$ leaf$ chlorophyll$ index).$ The$ plant$ growth$ parameters$ are$ the$explanatory$variables$(x),$and$the$potato$tuber$yield$is$the$response$variable$(y).$Y$values$ranged$from$15.8$to$33.1$Tons$haK1.
Explanatory$variable$ Equation$ R$value$ R2$Value$ Significance$Plant$Height$(cm)$ $ $ $ $
6$WAP$ y$=$10.90$+$0.441x$ 0.64$ 0.41$ ***$8$WAP$ y$=$$$$8.89$+$0.400x$ 0.73$ 0.54$ ***$10$WAP$ y$=$$$$9.72$+$0.379x$ 0.65$ 0.42$ ***$
$ $ $ $ $LAI$(m2mK2)$ $ $ $ $
5$WAP$ y$=$26.43$+$0.301x$ 0.03$ 0.00$ ns$7$WAP$ y$=$22.58$+$4.574x$ 0.38$ 0.15$ **$9$WAP$ y$=$22.83$+$2.706x$ 0.40$ 0.16$ **$11$WAP$ y$=$22.22$+$4.275x$ 0.53$ 0.28$ **$
$ $ $ $ $Leaf$chlorophyll$index$$$ $ $ $ $
6$WAP$ y$=$26.97$K$0.012x$ 0.02$ 0.00$ ns$8$WAP$ y$=$20.40$+$0.149x$ 0.16$ 0.03$ ns$10$WAP$ y$=$25.20$+$0.004x$ 0.04$ 0.00$ ns$$ $ $ $ $
Canopy$volume$(m3)$ $ $ $ $6$WAP$ y$=$16.46$+$28.75x$ 0.373$ 0.14$ ***$8$WAP$ y$=$22.80$+$$$2.39x$ 0.076$ 0.01$ ns$10$WAP$ y$=$19.41+$11.14x$ 0.661$ 0.44$ ***$
1$*,$**$and$***$refer$to$P values$<$0.05,$<$0.01$and$<$0.001,$respectively;$ns$=$not$significant.$$2$WAP$=$weeks$after$planting.$$
$
$
Table$11.$Outline$of$regression$analysis$for$crop$productivity$parameters$vs.$tuber$dry$matter$content$(i.e.,$tuber$dry$matter$content$is$expressed$as$a$function$of$total$crop$N$accumulation$and$tuber$yield).$The$total$crop$N$accumulation$and$tuber$yield$are$the$explanatory$variables$(x),$and$the$tuber$dry$matter$content$is$the$response$variable$(y).$Y$values$ranged$from$15.5$to$21.7$%.
$$ $ $ $
Explanatory$variable$ Equation$ R$value$ R2$Value$ Significance$
Total$N$accumulation$(kg$N$haK1)$ y$=$$$1.97$+$0.032x$ 0.6$ 0.36$ ***$
Tuber$yield$(Mg$haK1)$ y$=$22.11$K$0.071x$ 0.22$ 0.05$ ns$
1*,$**$and$***$refer$to$P values$<$0.05,$<$0.01$and$<$0.001,$respectively;$ns$=$not$significant.$ 2Total$N$accumulation$=$N$accumulation$of$tubers$+$N$accumulation$of$aboveKground$biomass$at$harvest.
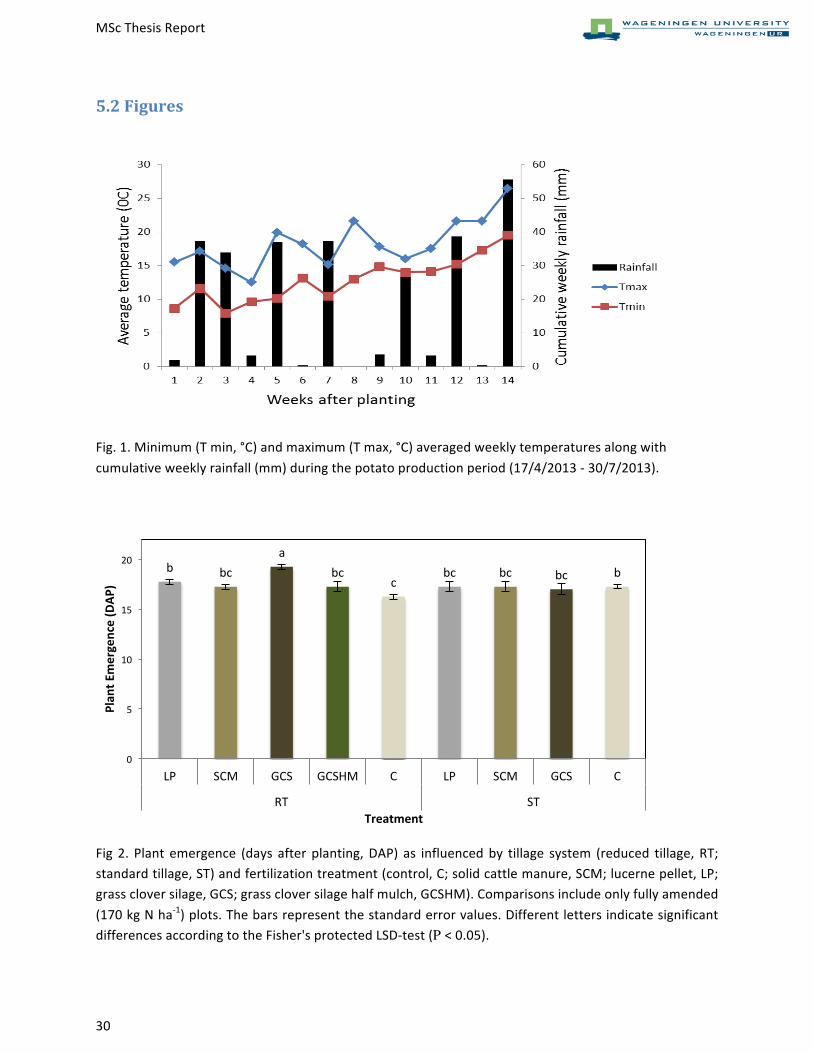
MSc$Thesis$Report$ $ $(
$30$
5.2'Figures'$
$
Fig.$1.$Minimum$(T$min,$°C)$and$maximum$(T$max,$°C)$averaged$weekly$temperatures$along$with$cumulative$weekly$rainfall$(mm)$during$the$potato$production$period$(17/4/2013$K$30/7/2013).$$
$
$
Fig$ 2.$ Plant$ emergence$ (days$ after$ planting,$DAP)$ as$ influenced$by$ tillage$ system$ (reduced$ tillage,$RT;$standard$tillage,$ST)$and$fertilization$treatment$(control,$C;$solid$cattle$manure,$SCM;$lucerne$pellet,$LP;$grass$clover$silage,$GCS;$grass$clover$silage$half$mulch,$GCSHM).$Comparisons$include$only$fully$amended$(170$kg$N$haK1)$plots.$The$bars$represent$the$standard$error$values.$Different$letters$indicate$significant$differences$according$to$the$Fisher's$protected$LSDKtest$(P <$0.05).$$
b$ bc$a$
bc$c$
bc$ bc$ bc$ b$
0$
5$
10$
15$
20$
LP$ SCM$ GCS$ GCSHM$ C$ LP$ SCM$ GCS$ C$
RT$ ST$
Plan
t(Emergence((DAP
)(
Treatment(
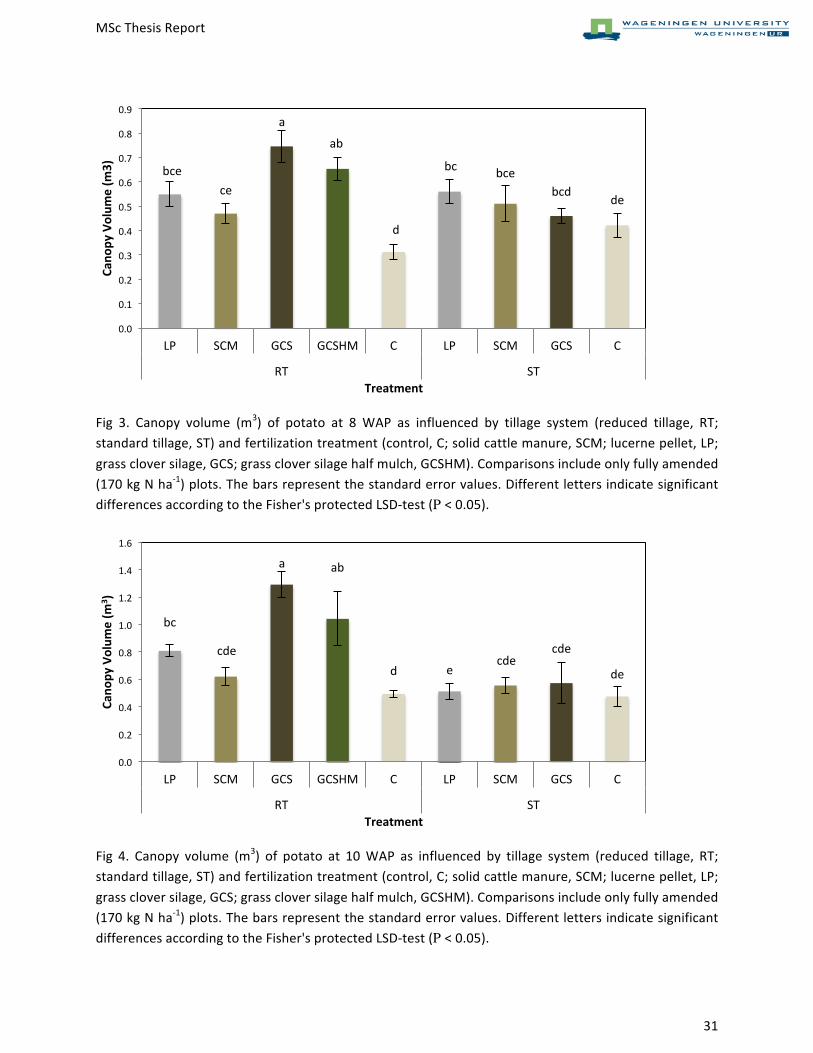
MSc$Thesis$Report$ $ $
$
$ 31$
$
Fig$ 3.$ Canopy$ volume$ (m3)$ of$ potato$ at$ 8$ WAP$ as$ influenced$ by$ tillage$ system$ (reduced$ tillage,$ RT;$
standard$tillage,$ST)$and$fertilization$treatment$(control,$C;$solid$cattle$manure,$SCM;$lucerne$pellet,$LP;$
grass$clover$silage,$GCS;$grass$clover$silage$half$mulch,$GCSHM).$Comparisons$include$only$fully$amended$
(170$kg$N$haK1)$plots.$The$bars$represent$the$standard$error$values.$Different$letters$indicate$significant$
differences$according$to$the$Fisher's$protected$LSDKtest$(P <$0.05).$
$
Fig$ 4.$ Canopy$ volume$ (m3)$ of$ potato$ at$ 10$WAP$ as$ influenced$ by$ tillage$ system$ (reduced$ tillage,$ RT;$
standard$tillage,$ST)$and$fertilization$treatment$(control,$C;$solid$cattle$manure,$SCM;$lucerne$pellet,$LP;$
grass$clover$silage,$GCS;$grass$clover$silage$half$mulch,$GCSHM).$Comparisons$include$only$fully$amended$
(170$kg$N$haK1)$plots.$The$bars$represent$the$standard$error$values.$Different$letters$indicate$significant$
differences$according$to$the$Fisher's$protected$LSDKtest$(P <$0.05).$
$
bce$
ce$
a$
ab$
d$
bc$bce$
bcd$de$
0.0$
0.1$
0.2$
0.3$
0.4$
0.5$
0.6$
0.7$
0.8$
0.9$
LP$ SCM$ GCS$ GCSHM$ C$ LP$ SCM$ GCS$ C$
RT$ ST$
Cano
py(Volum
e((m
3)(
Treatment(
bc$
cde$
a$ ab$
$
$
d$ e$cde$
cde$
$de$
0.0$
0.2$
0.4$
0.6$
0.8$
1.0$
1.2$
1.4$
1.6$
LP$ SCM$ GCS$ GCSHM$ C$ LP$ SCM$ GCS$ C$
RT$ ST$
Cano
py(Volum
e((m
3 )(
Treatment(
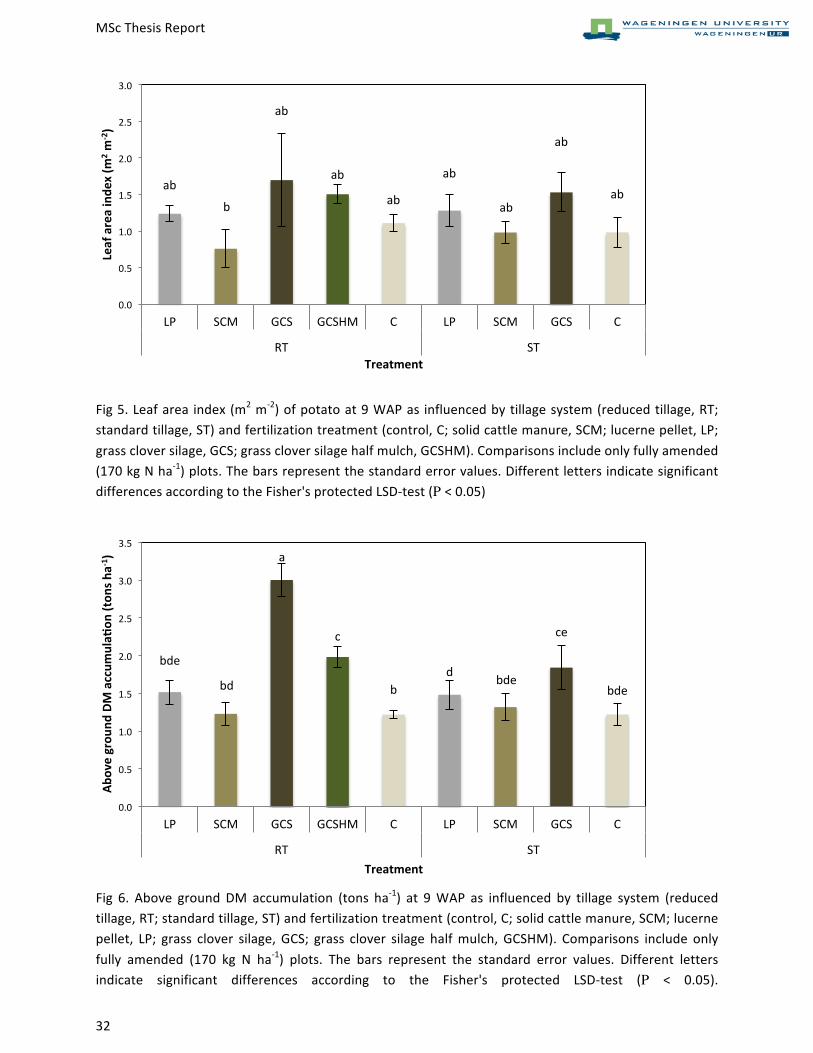
MSc$Thesis$Report$ $ $(
$32$
bde$
bd$
a$
c$
b$d$
bde$
ce$$
bde$
0.0$
0.5$
1.0$
1.5$
2.0$
2.5$
3.0$
3.5$
LP$ SCM$ GCS$ GCSHM$ C$ LP$ SCM$ GCS$ C$
RT$ ST$
Above(grou
nd(DM(accum
ulaI
on((ton
s(ha?
1 )((
Treatment(
ab$
b$$
ab$$$$
ab$
ab$
ab$$
ab$
ab$$$
ab$$
0.0$
0.5$
1.0$
1.5$
2.0$
2.5$
3.0$
LP$ SCM$ GCS$ GCSHM$ C$ LP$ SCM$ GCS$ C$
RT$ ST$
Leaf(area(inde
x((m
2 (m?2)(
Treatment(
$
$
$
$
$
$
$
$
$
Fig$5.$Leaf$area$ index$(m2$mK2)$of$potato$at$9$WAP$as$ influenced$by$tillage$system$(reduced$tillage,$RT;$
standard$tillage,$ST)$and$fertilization$treatment$(control,$C;$solid$cattle$manure,$SCM;$lucerne$pellet,$LP;$
grass$clover$silage,$GCS;$grass$clover$silage$half$mulch,$GCSHM).$Comparisons$include$only$fully$amended$
(170$kg$N$haK1)$plots.$The$bars$represent$the$standard$error$values.$Different$letters$indicate$significant$
differences$according$to$the$Fisher's$protected$LSDKtest$(P <$0.05)$
$
$
$
$
$
$
$
$
$
$
$
Fig$ 6.$ Above$ ground$DM$ accumulation$ (tons$ haK1)$ at$ 9$WAP$ as$ influenced$ by$ tillage$ system$ (reduced$
tillage,$RT;$standard$tillage,$ST)$and$fertilization$treatment$(control,$C;$solid$cattle$manure,$SCM;$lucerne$
pellet,$ LP;$ grass$ clover$ silage,$ GCS;$ grass$ clover$ silage$ half$mulch,$ GCSHM).$ Comparisons$ include$ only$
fully$ amended$ (170$ kg$ N$ haK1)$ plots.$ The$ bars$ represent$ the$ standard$ error$ values.$ Different$ letters$
indicate$ significant$ differences$ according$ to$ the$ Fisher's$ protected$ LSDKtest$ (P <$ 0.05).$
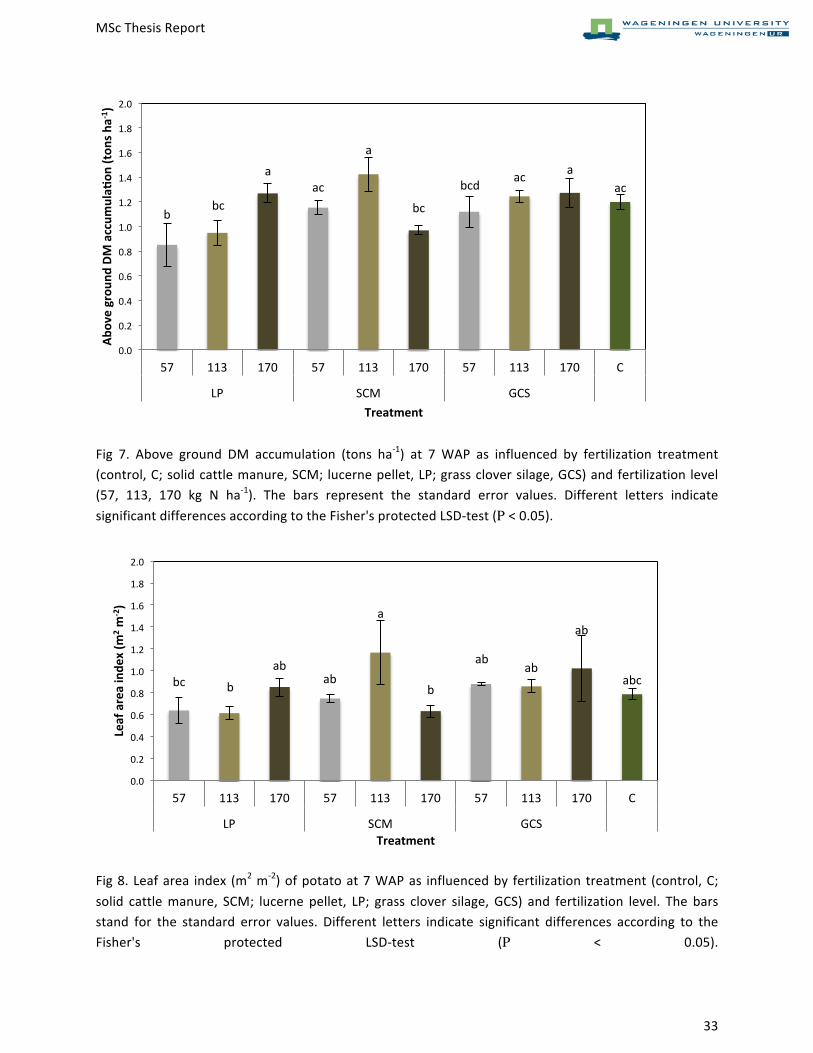
MSc$Thesis$Report$ $ $$
$ 33$
$
$
Fig$ 7.$ Above$ ground$ DM$ accumulation$ (tons$ haK1)$ at$ 7$ WAP$ as$ influenced$ by$ fertilization$ treatment$(control,$C;$solid$cattle$manure,$SCM;$lucerne$pellet,$LP;$grass$clover$silage,$GCS)$and$fertilization$level$(57,$ 113,$ 170$ kg$ N$ haK1).$ The$ bars$ represent$ the$ standard$ error$ values.$ Different$ letters$ indicate$significant$differences$according$to$the$Fisher's$protected$LSDKtest$(P <$0.05).$$
$
$
$
$
$
$
$
$
$
Fig$8.$Leaf$area$ index$ (m2$mK2)$of$potato$at$7$WAP$as$ influenced$by$ fertilization$treatment$ (control,$C;$solid$ cattle$manure,$ SCM;$ lucerne$ pellet,$ LP;$ grass$ clover$ silage,$GCS)$ and$ fertilization$ level.$ The$ bars$stand$ for$ the$ standard$ error$ values.$ Different$ letters$ indicate$ significant$ differences$ according$ to$ the$Fisher's$ protected$ LSDKtest$ (P <$ 0.05).$$$$$$$$$
b$bc$
a$ac$
a$
bc$
bcd$ ac$ a$ac$
0.0$
0.2$
0.4$
0.6$
0.8$
1.0$
1.2$
1.4$
1.6$
1.8$
2.0$
57$ 113$ 170$ 57$ 113$ 170$ 57$ 113$ 170$ C$
LP$ SCM$ GCS$
Above(grou
nd(DM(accum
ulaI
on((ton
s(ha?
1 )((
Treatment(
bc$ b$
ab$ab$
a$$
b$
ab$ab$
ab$$
abc$
0.0$
0.2$
0.4$
0.6$
0.8$
1.0$
1.2$
1.4$
1.6$
1.8$
2.0$
57$ 113$ 170$ 57$ 113$ 170$ 57$ 113$ 170$ C$
LP$ SCM$ GCS$
Leaf(area(inde
x((m
2 (m?2)(
(
Treatment(
MSc$Thesis$Report$ $ $(
$34$
References'
'Albiach,$R.,$Canet,$R.,$Pomares,$F.,$&$Ingelmo,$F.$(2000).$Microbial$biomass$content$and$enzymatic$
activities$after$the$application$of$organic$amendments$to$a$horticultural$soil.$Bioresource%Technology$,%75,$43K48.$
Altuntas,$E.,$&$Dede,$S.$(2009).$Emergence$of$Silage$Maize$as$Affected$by$Conservation$Tillage$and$Ridge$
Planting$Systems.$Agricultural%Engineering%International:%the%CIGR%Ejournal$,%11.$
Arsenault,$W.$J.,$LeBlanc,$D.$A.,$Tai,$G.$C.,$&$Boswall,$P.$(2001).$Effects$of$Nitrogen$Application$and$
Seedpiece$Spacing$on$Yield$and$Tuber$Size$Distribution$in$Eight$Potato$Cultivars.$Amer.%J.%of%Potato%Res.$,%78,$301K309.$
Atkinson,$D.,$Geary,$B.,$Stark,$J.,$Love,$S.,$&$Windes,$J.$(n.d.).$POTATO$VARIETAL$RESPONSES$TO$
NITROGEN$RATE$AND$TIMING.$Presented%at%the%Idaho%Potato%Conference%on%January%22,%2003$.$
Barut,$Z.$B.,$&$Celik,$I.$(2010).$Different$Tillage$Systems$Affect$Plant$Emergence,$Stand$Establishment$and$
Yield$in$WheatKCorn$Rotation.$PHILIPP%AGRIC%SCIENTIST$,%93$(4),$392K398.$
Bennett,$O.$L.,$Michell,$D.,$Mathias,$E.$L.,$&$Lundberg,$P.$E.$(1975).$NoKtillage$production$systems$for$
potatoes.$Agron.%Abstr.%Am.%Soc.%Agron%,$137.$
Berry,$P.$M.,$SylvesterKBradley,$R.,$Phillips,$L.,$Hatch,$D.$J.,$Cuttle,$S.$P.,$Rayns,$F.$W.,$et$al.$(2002).$Is$the$
productivity$of$organic$farms$restricted$by$the$supply$of$available$nitrogen?$Soil%Use%and%Management$,%18,$248K255.$
Bicudo,$J.$R.,$&$Moya,$M.$(2003).$Pathogens$in$manure$management:$a$review.$Environmental%Technology$,%24,$115K130.$
Boliglowa,$E.,$&$Glen,$K.$(2003).$YIELDING%AND%QUALITY%OF%POTATO%TUBERS%DEPENDING%ON%THE%KIND%OF%ORGANIC%FERTILISATION%AND%TILLAGE%METHOD.$Retrieved$March$2015,$from$Electronic$journal$of$
Polish$Agricultural$Universities,$series$agronomy:$http://www.ejpau.media.pl$
Boyd,$N.$S.,$Gordon,$R.,$&$Martin,$R.$C.$(2002).$Relationship$between$leaf$area$index$and$ground$cover$in$
potato$under$different$management$conditions$.$Potato%Research$,%45,$117K129.$
Bulluck,$L.$R.,$Brosius,$M.,$Evanylo,$G.$K.,$&$Ristaino,$J.$B.$(2002).$Organic$and$synthetic$fertility$
amendments$influence$soil$microbial,$physical$and$chemical$properties$on$organic$and$conventional$
farms.$Applied%Soil%Ecology$,%19,$147K160.$
Cambell,$C.$A.,$Zentner,$R.$P.,$Selles,$F.,$McConkey,$B.$G.,$&$Dyck,$F.$B.$(1993).$Nitrogen$Management$for$
Spring$Wheat$Grown$Annually$on$ZeroKTillage:$Yields$and$Nitrogen$Use$Efficiency.$Agron.%J$,%85$(1),$107K114.$
MSc$Thesis$Report$ $ $$
$ 35$
Carrera,$L.$M.,$Morse,$R.$D.,$Hima,$B.$L.,$AbdulKBaki,$A.$A.,$Haynes,$K.$G.,$&$Teasdale,$J.$R.$(2005).$A$ConservationKTillage,$CoverKCropping$Strategy$and$Economic$Analysis$for$Creamer$Potato$Production.$Amer.%J.%of%Potato%Res.$,%82,$471K479.$
Carter,$M.$R.$(1990).$Evaluation$of$shallow$tillage$for$spring$cereals$on$a$fine$sandy$loam.$1.$Growth$and$yield$components,$N$accumulation$and$tillage$economics.$Soil%&%Tillage%Reasearch$,%21,$23K35.$
Carter,$M.$R.,$&$Sanderson,$J.$B.$(2001).$Influence$of$conservation$tillage$and$rotation$length$on$potato$productivity,$tuber$disease$and$soil$quality$parameters$on$a$fine$sandy$loam$in$eastern$Canada.$Soil%&%Tillage%Research$,%63,$1K13.$
Cherr,$C.$M.,$Scholberg,$J.$M.,$&$McSortley,$R.$(2006).$Green$Manure$Approaches$to$Crop$Production:$A$Synthesis.$Agron.%J$,%98,$302K319.$
De$Gil,$P.$T.,$Fontes,$P.$C.,$Cecon,$P.$R.,$&$Affonso,$F.$(2002).$SPAD$index$for$nitrogen$status$diagnosis$and$potato$yield$prognosis.$Hortic.%bras$,%20$(4),$611K615.$
Devkota,$M.,$Martius,$C.,$Lamers,$J.$P.,$Sayre,$K.$D.,$Devkota,$K.$P.,$&$Vlek,$P.$L.$(2013).$Tillage$and$nitrogen$fertilization$effects$on$yield$and$nitrogen$use$efficiency$of$irrigated$cotton.$Soil%&%Tillage%Research$,%134,$72K82.$
Drakopoulos,$D.,$Scholberg,$J.$M.,$Lantinga,$E.$A.,$&$Tittonell,$P.$A.$Influence%of%reduced%tillage%and%fertilization%regime%on%crop%performance%and%nutrient%utilization%of%organic%potato%in%the%Netherlands.$Master$Thesis,$Wageningen$University,$Farming$Systems$Ecology$,$Wageningen,$the$Netherlands.$
Drinkwater,$L.$E.,$&$Snapp,$S.$S.$(2007).$Nutrietnts$in$agriculture:$Rethinking$the$management$paradigm.$Advances%in%Agronomy$,%92,$163K186.$
Dubetz,$S.,$&$Bole,$J.$B.$(1975).$EFFECT$OF$NITROGEN,$PHOSPHORUS,$AND$POTASSIUM$FERTILIZERS$ON$YIELD$COMPONENTS$AND$SPECIFIC$GRAVITY$OF$POTATOES.$AMERICAN%POTATO%JOURNAL$,%52,$399K405.$
Ekeberg,$E.,$&$Riley,$H.$C.$(1996).$Effects$of$mouldboard$ploughing$and$direct$planting$on$yield$and$nutrient$uptake$of$potatoes$in$Norway.$&%Tilluge%Reseurch$,%39,$131K142.$
Errebhi,$M.,$Rosen,$C.$J.,$Gupta,$S.$C.,$&$Birong,$D.$E.$(1998).$Potato$Yield$Response$and$Nitrate$Leaching$as$Influenced$by$Nitrogen$Management.$Agron.%J$,%90,$10K15.$
Evenson,$R.$E.,$&$Gollin,$D.$(2003).$Assessing$the$impact$of$the$green$revolution.$Science$,%300,$758K762.$
FAO.$(1996).$Environmental%Impact%of%Animal%Manure.$Retrieved$March$2014,$from$http://www.fao.org/wairdocs/lead/x6113e/x6113e00.htm#Contents$
FAO.$(2011).$Green%Manures/Cover%Crops%and%Crop%Rotation%in%Conservation%Agriculture%on%Small%Farms.$Retrieved$March$2014,$from$http://www.fao.org/fileadmin/user_upload/agp/icm12.pdf$
Gianquinto,$G.,$Sambo,$P.,$&$Bona,$S.$(2003).$The$Use$of$SPADK502$Chlorophyll$Meter$for$Dynamically$Optimizing$the$Nitrogen$Supply$in$Potato$Crop:$A$Methodological$Approach.$Acta%Hort.$,%607,$197K204.$
MSc$Thesis$Report$ $ $(
$36$
Grant,$W.$J.,$&$Epstein,$E.$(1973).$Minimum$tillage$for$potatoes.$Am.%Potato%J$,%50,$193K203.$
Habtegebrial,$K.,$Singh,$B.$R.,$&$Haile,$M.$(2007).$Impact$of$tillage$and$nitrogen$fertilization$on$yield,$nitrogen$use$efficiency$of$tef$(Eragrostis$tef$(Zucc.)$Trotter)$and$soil$properties.$Soil%&%Tillage%Research$,%94,$55K63.$
Hajslova,$J.,$Schulzova,$V.,$Slanina,$P.,$Janne,$K.,$Hellenas,$K.$E.,$&$Andersson,$C.$(2005).$Quality$of$organically$and$conventionally$grown$potatoes:$FourKyear$study$of$micronutrients,$metals,$secondary$metabolites,$enzymic$browning$and$organoleptic$properties.$Food%Additives%and%Contaminants$,%22,$514K534.$
Hanley,$F.,$Jarvis,$R.$H.,$&$Ridgman,$W.$J.$(1965).$The$effects$of$fertilizer$on$the$bulking$of$Majestic$potatoes.$J.%Agric.%Sci$,%65,$159K169.$
Holland,$J.$M.$(2004).$he$environmental$consequences$of$adopting$conservation$tillage$in$Europe:$reviewing$the$evidence.$Agriculture,%Ecosystems%and%Environment$,%103,$1K25.$
Houba,$V.$J.,$Novozamsky,$I.,$Lexmond,$T.$M.,$&$Van$der$Lee,$J.$J.$(1990).$Applicability$of$0.01$M$CaCl2$as$a$single$extraction$solution$for$the$assessment$of$the$nutrient$status$of$soils$and$other$diagnostic$purposes.$Communications%in%Soil%Science%and%Plant%Analysis$,%21$(19K20),$2281K2290.$
Imholte,$A.$A.,$&$Carter,$P.$R.$(1987).$Planting$Date$and$Tillage$Effects$on$Corn$Following$Corn.$Agron.%J$,%79,$746K751.$
Izsaki,$Z.,$&$Nemeth,$T.$K.$(2007).$Use$of$chlorophyll$meter$to$determine$the$nitrogen$status$of$winter$barley$(Hordeum$vulgare$L.).$Cereal%Research%Communications$,%35$(2),$521K524.$
Joengbloed,$A.$W.,$&$Lenis,$N.$P.$(1998).$Environmental$Concerns$about$Animal$Manure.$American%Society%of%Animal%Science$,%76,$2641K2648.$
Khurana,$S.$C.,$&$McLaren,$J.$S.$(1982).$The$influence$of$leaf$area,$light$interception$and$season$on$potato$growth$and$yield.$Potato%Res$,%25,$329K342.$
Konare,$H.,$Yost,$R.$S.,$Doumbia,$M.,$McCarty,$G.$W.,$Jarju,$A.,$&$Kablan,$R.$(2010).$Loss$on$ignition:$Measuring$soil$organic$carbon$in$soils$of$the$Sahel.$West%Africa.%African%Journal%of%Agricultural%Research$,%5,$3088K3095.$
Lal,$R.$(1991).$Tillage$and$agricultural$sustainability.$Soil%&%Tillage%research$,%20,$133K146.$
Le$Bail,$M.,$Jeuffroy,$M.$H.,$Bouchard,$C.,$&$Barbottin,$A.$(2005).$Is$it$possible$to$forecast$the$grain$quality$and$yield$of$different$varieties$of$winter$wheat$from$Minolta$SPAD$meter$measurements?$Europ.%J.%Agronomy$,%23,$379K391.$
Locke,$M.$A.,$&$Hons,$F.$M.$(1988).$Effect$of$N$Rate$and$Tillage$on$Yield,$N$Accumulation$and$Leaf$N$Concentration$of$Grain$Sorghum.$Soil%&%Tillage%Research$,%12,$223K233.$
MSc$Thesis$Report$ $ $$
$ 37$
Lynch,$D.$H.,$Sharifi,$M.,$Hammermeister,$A.,$&$Burton,$D.$(2012).$Nitrogen$Management$in$Organic$Potato$Production.$In$Z.$H.$al,$Sustainable%Potato%Production:%Global%Case%Studies$(pp.$209K231).$Springer$Science+Business$Media$B.V.$
MacKenzie,$D.$R.$(1981).$Association$of$Potato$Early$Blight,$Nitrogen$Fertilizer$Rate$and$Potato$Yield.$Plant%disease$,%65$(7),$575K577.$
Majic,$A.,$Poljak,$M.,$Sabljo,$A.,$Knejovic,$Z.,$&$Horvat,$T.$(2008).$EFFICIENCY$OF$USE$OF$CHLOROPHYLL$METER$AND$CARDYKION$METER$IN$POTATO$NITROGEN$NUTRITION$SUPPLY.$Cereal%Research%Communications$,%36,$1431K1434.$
Marsh,$L.$(1993).$Moisture$Affects$Cowpea$and$Okra$Seed$Emergence$and$Growth$at$Low$Temperatures.$HORT.%SCIENCE$,%28$(8),$774K777.$
Matson,$P.$A.,$Parton,$W.$J.,$Power,$A.$G.,$&$Swift,$M.$J.$(1977).$Agricultural$Intesification$and$Ecosystem$Properties.$Science$,%277,$504K509.$
Minotti,$P.$L.,$Halseth,$D.$E.,$&$Sieczka,$J.$B.$(1994).$Field$Chlorophyll$Measurements$to$Assess$the$Nitrogen$Status$of$Potato$Varieties.$HORT.%SCIENCE%,%29$(12),$1497K1500.$
Mohanty,$M.,$Painuli,$D.$K.,$Misra,$A.$K.,$Bandyopadhyaya,$K.$K.,$&$Ghosh,$P.$K.$(2006).$Estimating$impact$of$puddling,$tillage$and$residue$management$on$wheat$($Triticum$aestivum$,$L.)$seedling$emergence$and$growth$in$a$rice–wheat$system$using$nonlinear$regression$models.$Soil%&%Tillage%Research$,%87,$119K130.$
Nicholson,$F.$A.,$Groves,$S.$J.,$&$Chambers,$B.$J.$(2005).$Pathogen$Survival$during$Livestock$Manure$Storage$and$Following$Land$Application.$Bioresource%Technology$,%96,$135K143.$
Novozamsky,$I.,$Houba,$V.$J.,$Van$Eck,$R.,$&$van$Vark,$W.$(1983).$A$novel$digestion$technique$for$multiKelement$plant$analysis.$Communications%in%Soil%Science%and%Plant%Analysis$,%14,$239K248.$
Nyirarenza,$J.,$&$Snapp,$S.$(2006).$Integrated$Management$of$Inorganic$and$Organic$Nitrogen$and$Efficiency$in$Potato$Systems.$Soil%Sci.%Soc.%Am.%J$,%71,$1508K1515.$
Oenema,$O.$(2004).$Governmental$policies$and$measures$regulating$nitrogen$and$phosphorus$from$animal$manure$in$European$agriculture.$Journal%of%Animal%Science$,%82,$196K206.$
Ojala,$J.$C.,$Stark,$C.,$&$Kleinkopf,$G.$E.$(1990).$Influence$of$irrigation$and$nitrogen$management$on$potato$yield$and$quality.$American%Potato%Journal$,%67,$29K43.$
Olfs,$H.$W.,$Blankenau,$K.,$Brentrup,$F.,$Jasper,$J.,$Link,$A.,$&$Lammel,$J.$(2005).$SoilK$and$plantKbased$nitrogenKfertilizer$recommendations$in$arable$farming.$J.%Plant%Nutr.%Soil%Sci$,%168,$414K431.$
Pang,$X.$P.,$&$Letey,$J.$(2000).$Organic$Farming:$Challenge$of$Timing$Nitrogen$Availability$to$Crop$Nitrogen$Requirements.$Soil%Sci.%Soc.%Am.%J$,%64,$247K253.$
Piekielek,$W.$P.,$&$FOX,$R.$H.$(1992).$Use$of$a$Chlorophyll$Meter$to$Predict$Sidedress$Nitrogen$Requirements$for$Maize.$Agron.%J$,%84,$59K65.$
MSc$Thesis$Report$ $ $(
$38$
Pimentel,$D.,$Hepperly,$P.,$Hanson,$J.,$Douds,$D.,$&$Seidel,$R.$(2005).$Environmental,$Energetic,$and$Economic$Comparisons$of$Organic$and$Conventional$Farming$Systems.$BioScience$,%55$(7),$573K582.$
Powlson,$D.$S.,$&$Brookes,$P.$C.$(1987).$MEASUREMENT$OF$SOIL$MICROBIAL$BIOMASS$PROVIDES$AN$EARLY$INDICATION$OF$CHANGES$IN$TOTAL$SOIL$ORGANIC$MATTER$DUE$TO$STRAW$INCORPORATION.$Soil%Biol.%Biochem$,%19$(2),$159K164.$
Ramesh,$K.,$Chandrasekaran,$B.,$Balasubramanian,$T.$N.,$Bangarusamy,$U.,$Sivasamy,$R.,$&$Sankaran,$N.$(2001).$Chlorophyll$Dynamics$in$Rice$�Oryza$sativa)$Before$and$After$Flowering$Based$on$SPAD$�Chlorophyll)$Meter$Monitoring$and$its$Relation$with$Grain$Yield.$J.%Agronomy%&%Crop%Science$,%188,$102K105.$
Roberts,$T.$L.$(2008).$Improving$Nutrient$Use$Efficiency.$Turk%J%Agric$,%32,$177K182.$
Roo,$H.$C.,$&$Waggoner,$P.$E.$(1961).$Root$Development$of$Potatoes.$Agronomy%Journal$,%53$(1),$15K17.$
Russell,$W.$W.,$&$Bellinder,$R.$R.$(1989).$Potato$(Solanum$tuberosum)$yields$and$weed$populations$in$conventional$and$reduce$tillage$systems.$Weed%Tech$,%3,$590K595.$
Salamanca,$C.$(2015).$Influence%of%different%tillage%practices%in%soil%water%and%soil%N%mineralisation%dynamics%in%an%organic%potato%production%system.$MSc$Thesis,$Wageningen$University,$Farming$System$Ecology.$
Scholberg,$J.$M.,$Zotarelli,$L.,$Dukes,$M.,$OzoresKHampton,$M.,$Liu,$G.,$&$Tittonell,$P.$(2013).$Enhancing$Fertilizer$Efficiency$in$High$Input$Cropping$Systems$in$Florida.$In$E.$Lichtfouse,$Sustainable%Agriculture%Reviews,%Sustainable%Agriculture%Reviews$(pp.$143K174).$Springer$Science+Business$Media$Dordrecht.$
Schroder,$J.$(2004).$Revisiting$the$Agronomic$Benefots$of$Manure:$a$Correct$Assessment$and$Exploitation$of$its$Fertilizer$Value$Spares$the$Environment.$Bioresource%Technology$,%96,$253K261.$
Schuler,$R.$T.$(1979).$Reduce$tillage$studies$in$potatoes$following$corn.$Am.%Soc.%Agr.%Eng.%,%79,$1524.$
Sharifi,$M.,$Zebarth,$B.$J.,$Hajabbasi,$M.$A.,$&$Kalbasi,$M.$(2005).$Dry$Matter$and$Nitrogen$Accumulation$and$Root$Morphological$Characteristics$of$Two$Clonal$Selections$of$‘Russet$Norkotah’$Potato$as$Affected$by$Nitrogen$Fertilization.$Journal%of%Plant%Nutrition$,%28$(12),$2243K2253.$
Sidiras,$N.,$Avgoulas,$C.,$Bilalis,$D.,$&$Tsougrianis,$N.$(1999).$Effects$of$Tillage$and$Fertilization$on$Biomass\$Roots\$N!Accumulation$and$Nodule$Bacteria$of$Vetch$(Vicia$sativa$cv$Alexander).$J.%Agronomy%&%Crop%Science$,%182,$209K216.$
Simmonds,$N.$W.$(1977).$Relations$between$specific$gravity,$dry$matter$content$and$starch$content$of$potatoes.$Potato%Research$,%20,$137K140.$
Singh,$R.,$&$Ghildyal,$B.$P.$(1977).$INFLUENCE$OF$SOIL$EDAPHIC$FACTORS$AND$THEIR$CRITICAL$LIMITS$ON$SEEDLING$EMERGENCE$OF$CORN$(ZEA$MA$YS$L.).$Plant%and%Soil$,%47,$125K136.$
MSc$Thesis$Report$ $ $
$
$ 39$
Snapp,$S.$S.,$&$Fortuna,$A.$M.$(2011).$Predicting$Nitrogen$Availability$in$Irrigated$Potato$Vegetable$
Production.$Journal%of%Plant%Nutrition%and%Soil%Science$,%174,$321K332.$
Sorensen,$J.$N.,$&$ThorupKKristensen,$K.$(2011).$PlantKbased$fertilizers$for$organic$vegetable$production.$
J.%Plant%Nutr.%Soil%Sci$,%174,$321K332.$
Su,$Y.$S.,$Guo,$H.$C.,$&$Chen,$Y.$L.$(2007).$Relationship$between$SPAD$readings$chlorophyll$contents$and$
yield$of$potato(Solanum$tubersosum$L.).$Southwest%China%Journal%of%Agricultural%Sciences$,%4.$
Sun,$L.,$Gu,$L.,$Peng,$X.,$Liu,$Y.,$Li,$X.,$&$Yan,$X.$(2012).$Effects$of$Nitrogen$Fertilizer$Application$Time$on$
Dry$Matter$Accumulation$and$Yield$of$Chinese$Potato$Variety$KX$13.$Potato%Research$,%55,$303K313.$
Tekalign,$T.,$&$Hammes,$P.$S.$(2005).$Growth$and$productivity$of$potato$as$influenced$by$cultivar$and$
reproK$ductive$growth.$I.$Stomatal$conductance,$rate$of$transpiration,$net$photosynthesis,$and$dry$
matter$production$and$allocation.$Sci.%Hort$,%105$(13),$13K27.$
Thomas,$G.$A.,$Standley,$J.,$Webb,$A.$A.,$Blight,$G.$W.,$&$Hunter,$H.$M.$(1990).$Tillage$and$crop$residue$
management$affect$VertiK$sols$properties$and$grain$sorghum$growth$over$seven$years$in$semiarid$
subtropics.$1.$Crop$residue$and$soul$water$during$fallow$periods.$Soil%Till.%Res$,%17,$179K181.$
Tilman,$D.$(1998).$The$Greening$of$the$Green$Revolution.$Nature$,%396,$211K212.$
Tscharntke,$T.,$Klein,$A.$M.,$Kruess,$A.,$SteffanKDewenter,$I.,$&$Thies,$C.$(2005).$Landscape$perspectives$
on$agricultural$intensification$and$biodiversity$–$ecosystem$service$management.$Ecology%Letters$,%8,$857K874.$
Ubelhor,$A.,$Gruber,$S.,$&$Claupein,$W.$(2014).$Influence$of$tillage$intensity$and$nitrogen$placement$on$
nitrogen$uptake$and$yield$in$stripKtilled$white$cabbage$(Brassica$oleracea$convar.$capitata$var.$alba).$Soil%&%Tillage%Research$,%144,$156K163.$
Uri,$N.$D.,$Atwood,$J.$D.,$&$Sanabria,$J.$(1998).$AN$EVALUATION$OF$THE$ENVIRONMENTAL$COSTS$AND$
BENEFITS$OF$CONSERVATION$TILLAGE.$Environ.%Impact%Asses.%Rev$,%18,$521K550.$
Van$Delden,$A.$(2001).$Yield$and$Growth$Components$of$Potato$and$Wheat$under$Organic$Nitrogen$
Management.$AGRONOMY%JOURNAL$,%93,$1370K1385.$
Van$der$Burgt,$G.$J.,$Scholberg,$J.,$&$Koopmans,$C.$J.$Developing%novel%farming%systems:%effective%use%of%nutrients%from%cover%crops%in%intensive%Organic%Farming.$Louis$Bolk$Institute$LBI.$
Vos,$J.$(1999).$Split$nitrogen$application$in$potato:$eects$on$accumulation$of$nitrogen$and$dry$matter$in$
the$crop$and$on$the$soil$nitrogen$budget.$Journal%of%Agricultural%Science$,%133,$263K274.$
Vos,$J.,$&$Bom,$M.$(1993).$HandKheld$chlorophyll$meter:$a$promising$tool$to$assess$the$nitrogen$status$of$
potato$foliage.$Potato%research$,%36,$301K308.$
Waddell,$J.$T.,$Gupta,$S.$C.,$Moncrief,$J.$F.,$Rosen,$C.$J.,$&$Steele,$D.$D.$(1999).$Irrigation$and$Nitrogen$
Management$Effects$on$Potato$Yield,$Tuber$Quality,$and$Nitrogen$Uptake.$Agron.%J$,%91,$991K997.$
MSc$Thesis$Report$ $ $(
$40$
Westermann,$D.$T.,$Tindall,$T.$A.,$James,$D.$W.,$&$Hurst,$R.$L.$(1994).$NITROGEN$AND$POTASSIUM$FERTILIZATION$OF$POTATOES:$YIELD$AND$SPECIFIC$GRAvity.$American%Potato%Journal$,%71,$417K431.$
Wilcox,$G.$E.,$&$Hoff,$J.$(1970).$Nitrogen$fertilization$of$potatoes$for$early$summer$harvest.$Am.%Potato%J$,%47,$99K102.$
Wunsche,$J.$N.,$&$Lakso,$A.$N.$(2000).$The$relationship$between$leaf$area$and$light$interception$by$spur$and$extension$shoot$leaves$and$apple$orchard$productivity.$Hort.%Science$,%33$(7),$1202K1206.$
$
$
$
'
'
'
'
'
'
'
'
'
'$
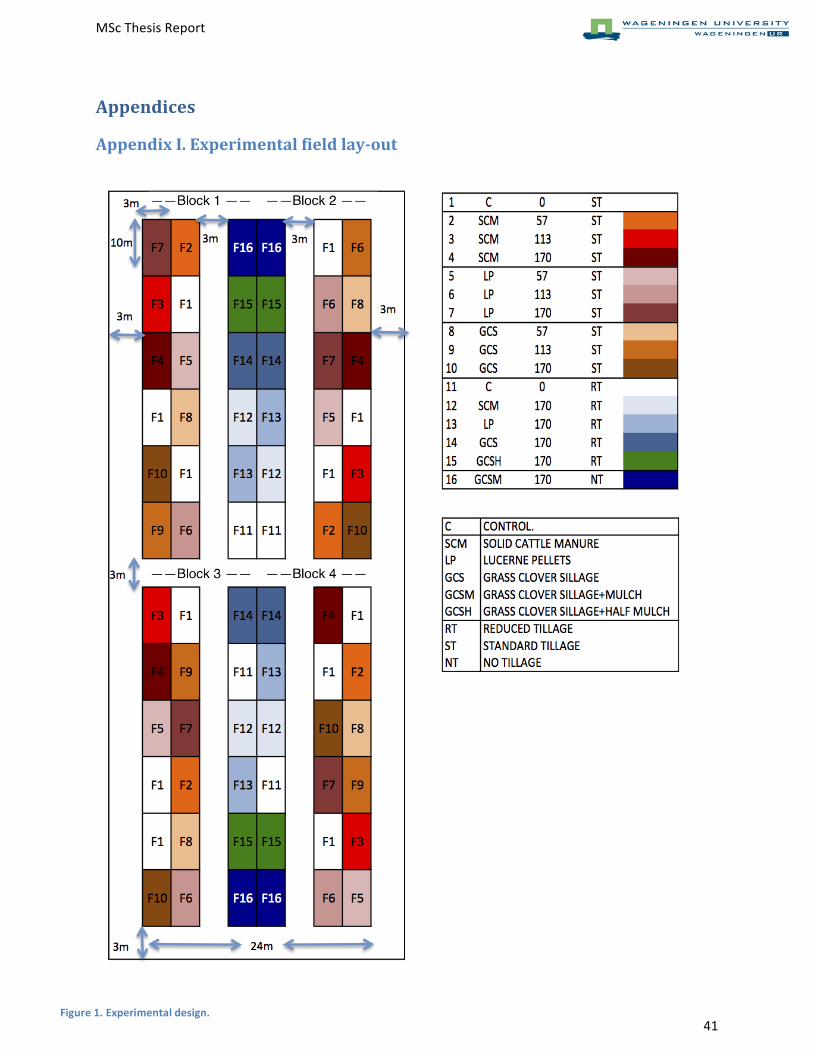
MSc$Thesis$Report$ $ $$
$ 41$
Appendices'
Appendix'I.'Experimental'field'laySout'
'$
$
$
$
$
$
$
$
$
$
$
$
$
$
$
$
$
$
$
$
$
$
$
Figure(1.(Experimental(design.((
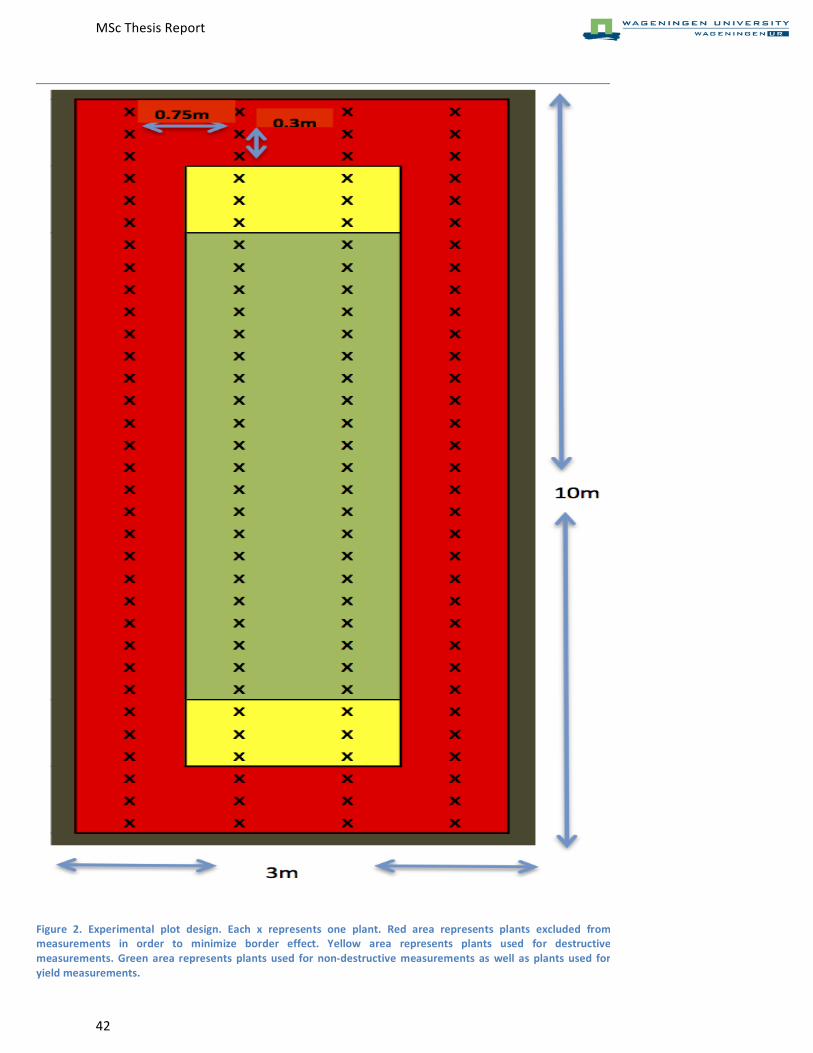
MSc$Thesis$Report$ $ $(
$42$
$
Figure( 2.( Experimental( plot( design.( Each( x( represents( one( plant.( Red( area( represents( plants( excluded( from(measurements( in( order( to( minimize( border( effect.( Yellow( area( represents( plants( used( for( destructive(measurements.(Green(area( represents(plants(used( for(non?destructive(measurements( as(well( as(plants(used( for(yield(measurements.((
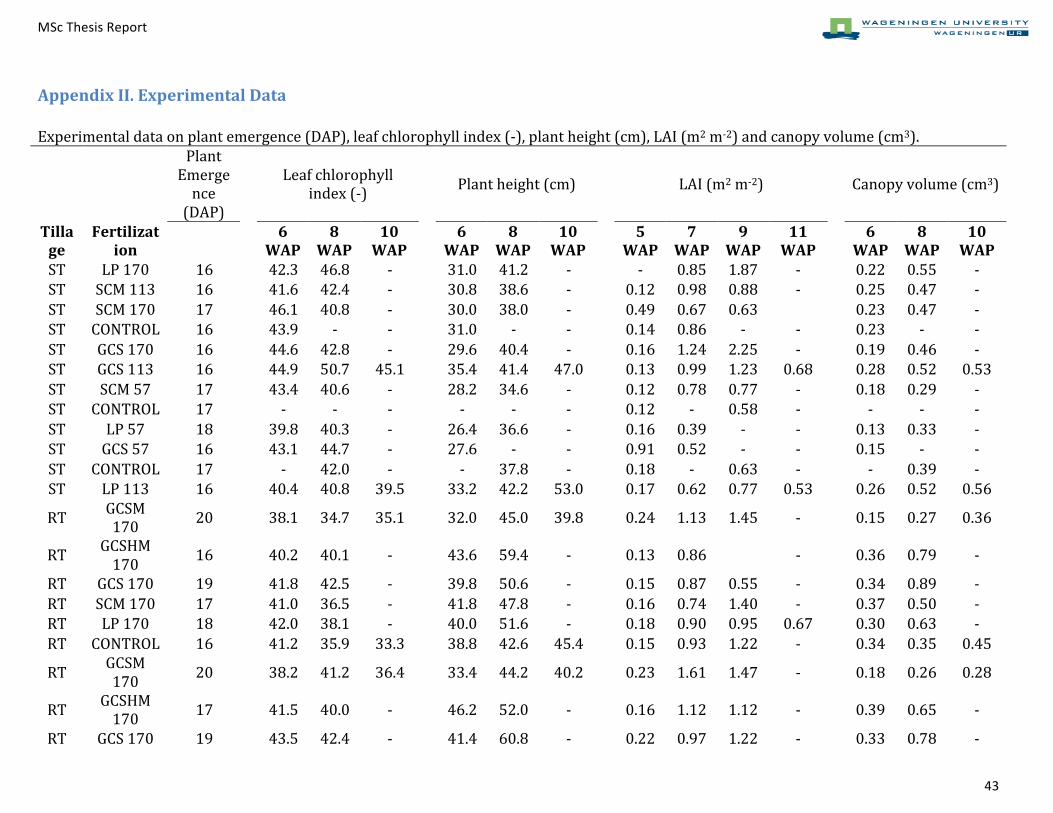
MSc$Thesis$Report$ $ $!$
$ 43$
Appendix(II.(Experimental(Data(!Experimental!data!on!plant!emergence!(DAP),!leaf!chlorophyll!index!(:),!plant!height!(cm),!LAI!(m2!m:2)!and!canopy!volume!(cm3).!
!! !!
Plant!Emergence!(DAP)! !!
Leaf!chlorophyll!index!(:)! !! Plant!height!(cm)! !! LAI!(m2!m:2)! !! Canopy!volume!(cm3)!
Τillage(
Fertilization(
! !
6(WAP(
8(WAP(
10(WAP(
(
6(WAP(
8(WAP(
10(WAP(
(
5(WAP(
7(WAP(
9(WAP(
11(WAP(
(
6(WAP(
8(WAP(
10(WAP(
ST! LP!170! 16! !! 42.3! 46.8! :! ! 31.0! 41.2! :! ! :! 0.85! 1.87! :! ! 0.22! 0.55! :!ST! SCM!113! 16! !! 41.6! 42.4! :! ! 30.8! 38.6! :! ! 0.12! 0.98! 0.88! :! ! 0.25! 0.47! :!ST! SCM!170! 17! !! 46.1! 40.8! :! ! 30.0! 38.0! :! ! 0.49! 0.67! 0.63! ! ! 0.23! 0.47! :!ST! CONTROL! 16! !! 43.9! :! :! ! 31.0! :! :! ! 0.14! 0.86! :! :! ! 0.23! :! :!ST! GCS!170! 16! !! 44.6! 42.8! :! ! 29.6! 40.4! :! ! 0.16! 1.24! 2.25! :! ! 0.19! 0.46! :!ST! GCS!113! 16! !! 44.9! 50.7! 45.1! ! 35.4! 41.4! 47.0! ! 0.13! 0.99! 1.23! 0.68! ! 0.28! 0.52! 0.53!ST! SCM!57! 17! !! 43.4! 40.6! :! ! 28.2! 34.6! :! ! 0.12! 0.78! 0.77! :! ! 0.18! 0.29! :!ST! CONTROL! 17! !! :! :! :! ! :! :! :! ! 0.12! :! 0.58! :! ! :! :! :!ST! LP!57! 18! !! 39.8! 40.3! :! ! 26.4! 36.6! :! ! 0.16! 0.39! :! :! ! 0.13! 0.33! :!ST! GCS!57! 16! !! 43.1! 44.7! :! ! 27.6! :! :! ! 0.91! 0.52! :! :! ! 0.15! :! :!ST! CONTROL! 17! !! :! 42.0! :! ! :! 37.8! :! ! 0.18! :! 0.63! :! ! :! 0.39! :!ST! LP!113! 16! !! 40.4! 40.8! 39.5! ! 33.2! 42.2! 53.0! ! 0.17! 0.62! 0.77! 0.53! ! 0.26! 0.52! 0.56!
RT! GCSM!170! 20! !! 38.1! 34.7! 35.1! ! 32.0! 45.0! 39.8! ! 0.24! 1.13! 1.45! :! ! 0.15! 0.27! 0.36!
RT! GCSHM!170! 16! !! 40.2! 40.1! :! ! 43.6! 59.4! :! ! 0.13! 0.86! ! :! ! 0.36! 0.79! :!
RT! GCS!170! 19! !! 41.8! 42.5! :! ! 39.8! 50.6! :! ! 0.15! 0.87! 0.55! :! ! 0.34! 0.89! :!RT! SCM!170! 17! !! 41.0! 36.5! :! ! 41.8! 47.8! :! ! 0.16! 0.74! 1.40! :! ! 0.37! 0.50! :!RT! LP!170! 18! !! 42.0! 38.1! :! ! 40.0! 51.6! :! ! 0.18! 0.90! 0.95! 0.67! ! 0.30! 0.63! :!RT! CONTROL! 16! !! 41.2! 35.9! 33.3! ! 38.8! 42.6! 45.4! ! 0.15! 0.93! 1.22! :! ! 0.34! 0.35! 0.45!
RT! GCSM!170! 20! !! 38.2! 41.2! 36.4! ! 33.4! 44.2! 40.2! ! 0.23! 1.61! 1.47! :! ! 0.18! 0.26! 0.28!
RT! GCSHM!170! 17! !! 41.5! 40.0! :! ! 46.2! 52.0! :! ! 0.16! 1.12! 1.12! :! ! 0.39! 0.65! :!
RT! GCS!170! 19! !! 43.5! 42.4! :! ! 41.4! 60.8! :! ! 0.22! 0.97! 1.22! :! ! 0.33! 0.78! :!
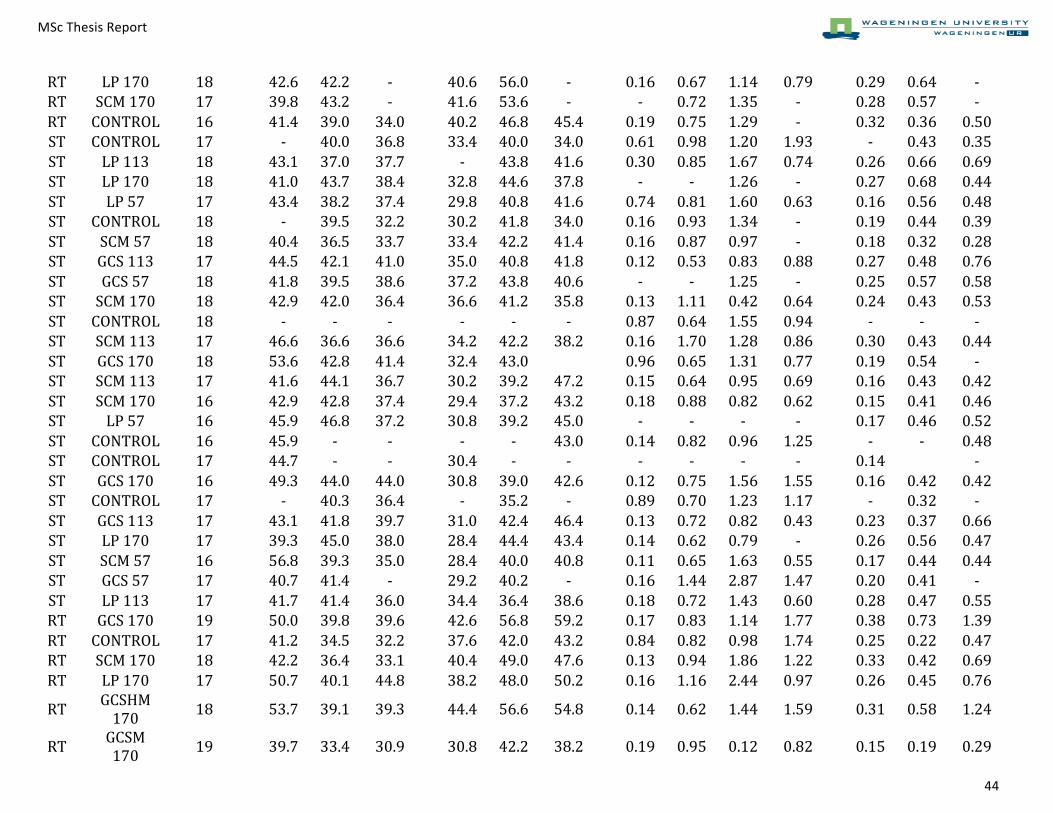
MSc$Thesis$Report$ $ $!$
$ 44$
RT! LP!170! 18! !! 42.6! 42.2! :! ! 40.6! 56.0! :! ! 0.16! 0.67! 1.14! 0.79! ! 0.29! 0.64! :!RT! SCM!170! 17! !! 39.8! 43.2! :! ! 41.6! 53.6! :! ! :! 0.72! 1.35! :! ! 0.28! 0.57! :!RT! CONTROL! 16! !! 41.4! 39.0! 34.0! ! 40.2! 46.8! 45.4! ! 0.19! 0.75! 1.29! :! ! 0.32! 0.36! 0.50!ST! CONTROL! 17! !! :! 40.0! 36.8! ! 33.4! 40.0! 34.0! ! 0.61! 0.98! 1.20! 1.93! ! :! 0.43! 0.35!ST! LP!113! 18! !! 43.1! 37.0! 37.7! ! :! 43.8! 41.6! ! 0.30! 0.85! 1.67! 0.74! ! 0.26! 0.66! 0.69!ST! LP!170! 18! !! 41.0! 43.7! 38.4! ! 32.8! 44.6! 37.8! ! :! :! 1.26! :! ! 0.27! 0.68! 0.44!ST! LP!57! 17! !! 43.4! 38.2! 37.4! ! 29.8! 40.8! 41.6! ! 0.74! 0.81! 1.60! 0.63! ! 0.16! 0.56! 0.48!ST! CONTROL! 18! !! :! 39.5! 32.2! ! 30.2! 41.8! 34.0! ! 0.16! 0.93! 1.34! :! ! 0.19! 0.44! 0.39!ST! SCM!57! 18! !! 40.4! 36.5! 33.7! ! 33.4! 42.2! 41.4! ! 0.16! 0.87! 0.97! :! ! 0.18! 0.32! 0.28!ST! GCS!113! 17! !! 44.5! 42.1! 41.0! ! 35.0! 40.8! 41.8! ! 0.12! 0.53! 0.83! 0.88! ! 0.27! 0.48! 0.76!ST! GCS!57! 18! !! 41.8! 39.5! 38.6! ! 37.2! 43.8! 40.6! ! :! :! 1.25! :! ! 0.25! 0.57! 0.58!ST! SCM!170! 18! !! 42.9! 42.0! 36.4! ! 36.6! 41.2! 35.8! ! 0.13! 1.11! 0.42! 0.64! ! 0.24! 0.43! 0.53!ST! CONTROL! 18! !! :! :! :! ! :! :! :! ! 0.87! 0.64! 1.55! 0.94! ! :! :! :!ST! SCM!113! 17! !! 46.6! 36.6! 36.6! ! 34.2! 42.2! 38.2! ! 0.16! 1.70! 1.28! 0.86! ! 0.30! 0.43! 0.44!ST! GCS!170! 18! !! 53.6! 42.8! 41.4! ! 32.4! 43.0! ! ! 0.96! 0.65! 1.31! 0.77! ! 0.19! 0.54! :!ST! SCM!113! 17! !! 41.6! 44.1! 36.7! ! 30.2! 39.2! 47.2! ! 0.15! 0.64! 0.95! 0.69! ! 0.16! 0.43! 0.42!ST! SCM!170! 16! !! 42.9! 42.8! 37.4! ! 29.4! 37.2! 43.2! ! 0.18! 0.88! 0.82! 0.62! ! 0.15! 0.41! 0.46!ST! LP!57! 16! !! 45.9! 46.8! 37.2! ! 30.8! 39.2! 45.0! ! :! :! :! :! ! 0.17! 0.46! 0.52!ST! CONTROL! 16! !! 45.9! :! :! ! :! :! 43.0! ! 0.14! 0.82! 0.96! 1.25! ! :! :! 0.48!ST! CONTROL! 17! !! 44.7! :! :! ! 30.4! :! :! ! :! :! :! :! ! 0.14! ! :!ST! GCS!170! 16! !! 49.3! 44.0! 44.0! ! 30.8! 39.0! 42.6! ! 0.12! 0.75! 1.56! 1.55! ! 0.16! 0.42! 0.42!ST! CONTROL! 17! !! :! 40.3! 36.4! ! :! 35.2! :! ! 0.89! 0.70! 1.23! 1.17! ! :! 0.32! :!ST! GCS!113! 17! !! 43.1! 41.8! 39.7! ! 31.0! 42.4! 46.4! ! 0.13! 0.72! 0.82! 0.43! ! 0.23! 0.37! 0.66!ST! LP!170! 17! !! 39.3! 45.0! 38.0! ! 28.4! 44.4! 43.4! ! 0.14! 0.62! 0.79! :! ! 0.26! 0.56! 0.47!ST! SCM!57! 16! !! 56.8! 39.3! 35.0! ! 28.4! 40.0! 40.8! ! 0.11! 0.65! 1.63! 0.55! ! 0.17! 0.44! 0.44!ST! GCS!57! 17! !! 40.7! 41.4! :! ! 29.2! 40.2! :! ! 0.16! 1.44! 2.87! 1.47! ! 0.20! 0.41! :!ST! LP!113! 17! !! 41.7! 41.4! 36.0! ! 34.4! 36.4! 38.6! ! 0.18! 0.72! 1.43! 0.60! ! 0.28! 0.47! 0.55!RT! GCS!170! 19! !! 50.0! 39.8! 39.6! ! 42.6! 56.8! 59.2! ! 0.17! 0.83! 1.14! 1.77! ! 0.38! 0.73! 1.39!RT! CONTROL! 17! !! 41.2! 34.5! 32.2! ! 37.6! 42.0! 43.2! ! 0.84! 0.82! 0.98! 1.74! ! 0.25! 0.22! 0.47!RT! SCM!170! 18! !! 42.2! 36.4! 33.1! ! 40.4! 49.0! 47.6! ! 0.13! 0.94! 1.86! 1.22! ! 0.33! 0.42! 0.69!RT! LP!170! 17! !! 50.7! 40.1! 44.8! ! 38.2! 48.0! 50.2! ! 0.16! 1.16! 2.44! 0.97! ! 0.26! 0.45! 0.76!
RT! GCSHM!170! 18! !! 53.7! 39.1! 39.3! ! 44.4! 56.6! 54.8! ! 0.14! 0.62! 1.44! 1.59! ! 0.31! 0.58! 1.24!
RT! GCSM!170! 19! !! 39.7! 33.4! 30.9! ! 30.8! 42.2! 38.2! ! 0.19! 0.95! 0.12! 0.82! ! 0.15! 0.19! 0.29!
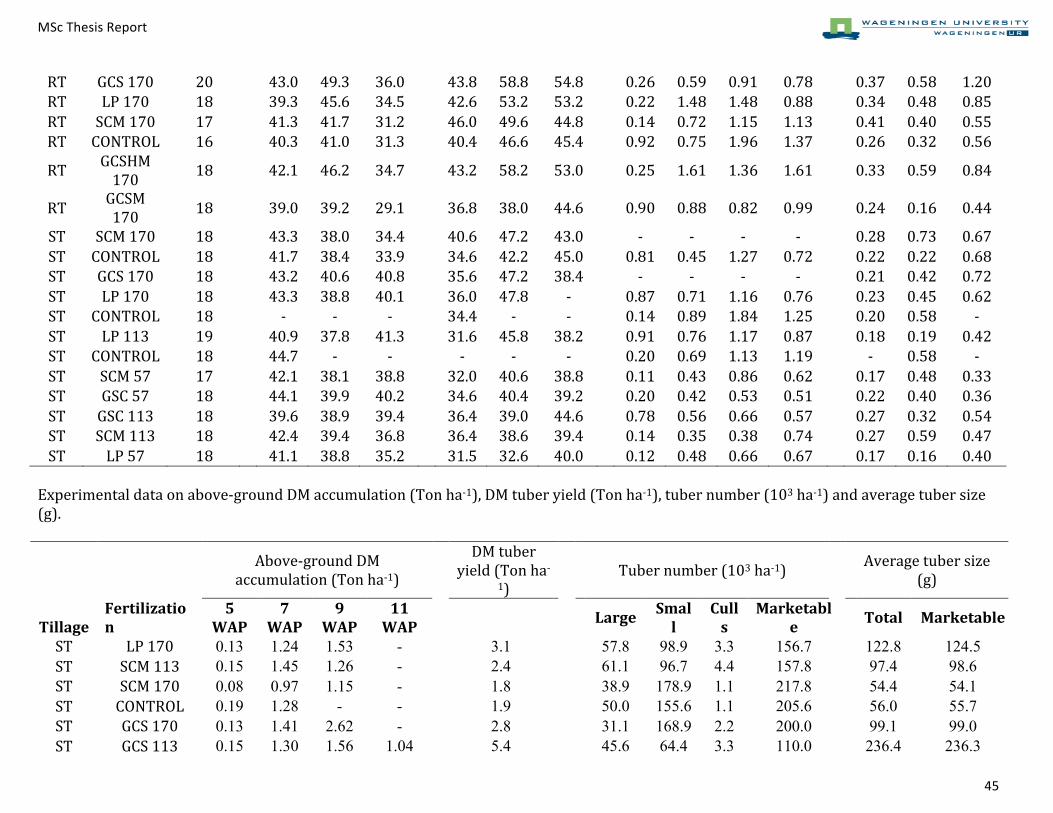
MSc$Thesis$Report$ $ $!$
$ 45$
RT! GCS!170! 20! !! 43.0! 49.3! 36.0! ! 43.8! 58.8! 54.8! ! 0.26! 0.59! 0.91! 0.78! ! 0.37! 0.58! 1.20!RT! LP!170! 18! !! 39.3! 45.6! 34.5! ! 42.6! 53.2! 53.2! ! 0.22! 1.48! 1.48! 0.88! ! 0.34! 0.48! 0.85!RT! SCM!170! 17! !! 41.3! 41.7! 31.2! ! 46.0! 49.6! 44.8! ! 0.14! 0.72! 1.15! 1.13! ! 0.41! 0.40! 0.55!RT! CONTROL! 16! !! 40.3! 41.0! 31.3! ! 40.4! 46.6! 45.4! ! 0.92! 0.75! 1.96! 1.37! ! 0.26! 0.32! 0.56!
RT! GCSHM!170! 18! !! 42.1! 46.2! 34.7! ! 43.2! 58.2! 53.0! ! 0.25! 1.61! 1.36! 1.61! ! 0.33! 0.59! 0.84!
RT! GCSM!170! 18! !! 39.0! 39.2! 29.1! ! 36.8! 38.0! 44.6! ! 0.90! 0.88! 0.82! 0.99! ! 0.24! 0.16! 0.44!
ST! SCM!170! 18! !! 43.3! 38.0! 34.4! ! 40.6! 47.2! 43.0! ! :! :! :! :! ! 0.28! 0.73! 0.67!ST! CONTROL! 18! !! 41.7! 38.4! 33.9! ! 34.6! 42.2! 45.0! ! 0.81! 0.45! 1.27! 0.72! ! 0.22! 0.22! 0.68!ST! GCS!170! 18! !! 43.2! 40.6! 40.8! ! 35.6! 47.2! 38.4! ! :! :! :! :! ! 0.21! 0.42! 0.72!ST! LP!170! 18! !! 43.3! 38.8! 40.1! ! 36.0! 47.8! :! ! 0.87! 0.71! 1.16! 0.76! ! 0.23! 0.45! 0.62!ST! CONTROL! 18! !! :! :! :! ! 34.4! :! :! ! 0.14! 0.89! 1.84! 1.25! ! 0.20! 0.58! :!ST! LP!113! 19! !! 40.9! 37.8! 41.3! ! 31.6! 45.8! 38.2! ! 0.91! 0.76! 1.17! 0.87! ! 0.18! 0.19! 0.42!ST! CONTROL! 18! !! 44.7! :! :! ! :! :! :! ! 0.20! 0.69! 1.13! 1.19! ! :! 0.58! :!ST! SCM!57! 17! !! 42.1! 38.1! 38.8! ! 32.0! 40.6! 38.8! ! 0.11! 0.43! 0.86! 0.62! ! 0.17! 0.48! 0.33!ST! GSC!57! 18! !! 44.1! 39.9! 40.2! ! 34.6! 40.4! 39.2! ! 0.20! 0.42! 0.53! 0.51! ! 0.22! 0.40! 0.36!ST! GSC!113! 18! !! 39.6! 38.9! 39.4! ! 36.4! 39.0! 44.6! ! 0.78! 0.56! 0.66! 0.57! ! 0.27! 0.32! 0.54!ST! SCM!113! 18! !! 42.4! 39.4! 36.8! ! 36.4! 38.6! 39.4! ! 0.14! 0.35! 0.38! 0.74! ! 0.27! 0.59! 0.47!ST! LP!57! 18! !! 41.1! 38.8! 35.2! !! 31.5! 32.6! 40.0! !! 0.12! 0.48! 0.66! 0.67! !! 0.17! 0.16! 0.40!
!Experimental!data!on!above:ground!DM!accumulation!(Ton!ha:1),!DM!tuber!yield!(Ton!ha:1),!tuber!number!(103!ha:1)!and!average!tuber!size!(g).!!!
!! !!
Above:ground!DM!accumulation!(Ton!ha:1)! !!
DM!tuber!yield!(Ton!ha:
1)!!! Tuber!number!(103!ha:1)! !! Average!tuber!size!
(g)!
Τillage(Fertilization(
5(WAP(
7(WAP(
9(WAP(
11(WAP( ! ! ! ! Large( Smal
l(Culls((
Marketable( ! Total( Marketable(
ST! LP!170! 0.13 1.24 1.53 - $ 3.1 $
$ 57.8 98.9 3.3 156.7 $
122.8 124.5 ST! SCM!113! 0.15 1.45 1.26 - $ 2.4
$$ 61.1 96.7 4.4 157.8
$97.4 98.6
ST! SCM!170! 0.08 0.97 1.15 - $ 1.8 $
$ 38.9 178.9 1.1 217.8 $
54.4 54.1 ST! CONTROL! 0.19 1.28 - - $ 1.9
$$ 50.0 155.6 1.1 205.6
$56.0 55.7
ST! GCS!170! 0.13 1.41 2.62 - $ 2.8 $
$ 31.1 168.9 2.2 200.0 $
99.1 99.0 ST! GCS!113! 0.15 1.30 1.56 1.04 $ 5.4
$$ 45.6 64.4 3.3 110.0
$236.4 236.3
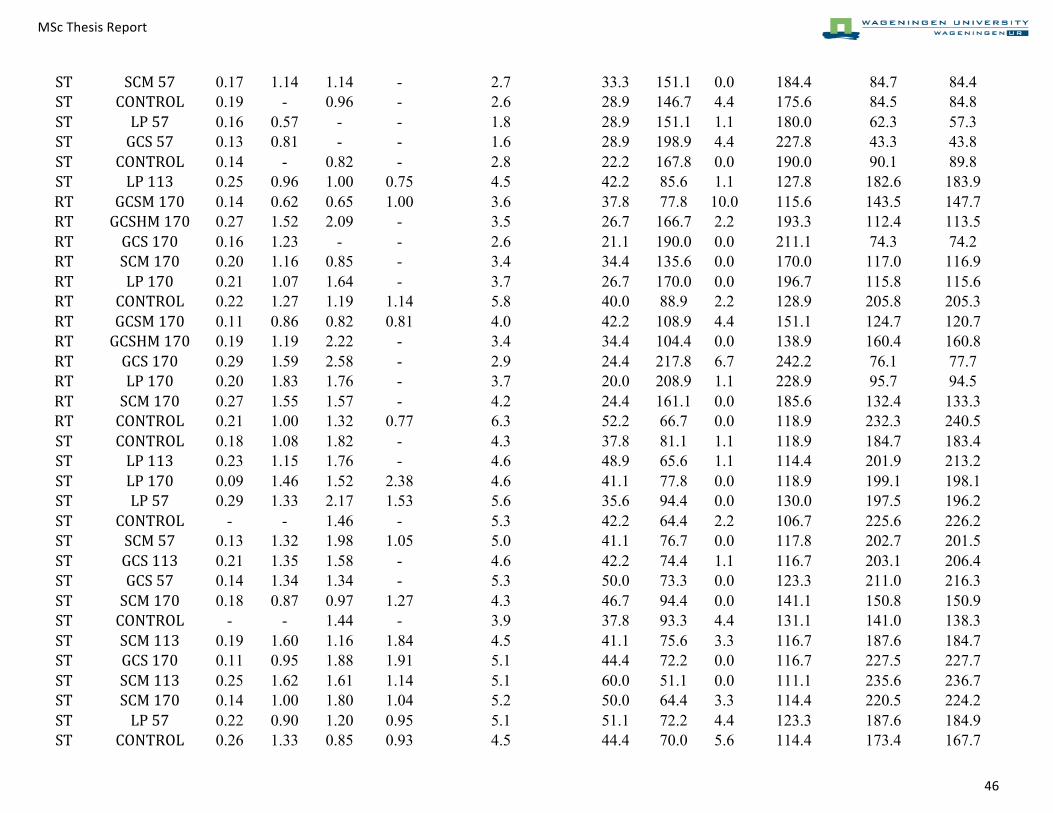
MSc$Thesis$Report$ $ $!$
$ 46$
ST! SCM!57! 0.17 1.14 1.14 - $ 2.7 $
$ 33.3 151.1 0.0 184.4 $
84.7 84.4 ST! CONTROL! 0.19 - 0.96 - $ 2.6
$$ 28.9 146.7 4.4 175.6
$84.5 84.8
ST! LP!57! 0.16 0.57 - - $ 1.8 $
$ 28.9 151.1 1.1 180.0 $
62.3 57.3 ST! GCS!57! 0.13 0.81 - - $ 1.6
$$ 28.9 198.9 4.4 227.8
$43.3 43.8
ST! CONTROL! 0.14 - 0.82 - $ 2.8 $
$ 22.2 167.8 0.0 190.0 $
90.1 89.8 ST! LP!113! 0.25 0.96 1.00 0.75 $ 4.5
$$ 42.2 85.6 1.1 127.8
$182.6 183.9
RT! GCSM!170! 0.14 0.62 0.65 1.00 $ 3.6 $
$ 37.8 77.8 10.0 115.6 $
143.5 147.7 RT! GCSHM!170! 0.27 1.52 2.09 - $ 3.5
$$ 26.7 166.7 2.2 193.3
$112.4 113.5
RT! GCS!170! 0.16 1.23 - - $ 2.6 $
$ 21.1 190.0 0.0 211.1 $
74.3 74.2 RT! SCM!170! 0.20 1.16 0.85 - $ 3.4
$$ 34.4 135.6 0.0 170.0
$117.0 116.9
RT! LP!170! 0.21 1.07 1.64 - $ 3.7 $
$ 26.7 170.0 0.0 196.7 $
115.8 115.6 RT! CONTROL! 0.22 1.27 1.19 1.14 $ 5.8
$$ 40.0 88.9 2.2 128.9
$205.8 205.3
RT! GCSM!170! 0.11 0.86 0.82 0.81 $ 4.0 $
$ 42.2 108.9 4.4 151.1 $
124.7 120.7 RT! GCSHM!170! 0.19 1.19 2.22 - $ 3.4
$$ 34.4 104.4 0.0 138.9
$160.4 160.8
RT! GCS!170! 0.29 1.59 2.58 - $ 2.9 $
$ 24.4 217.8 6.7 242.2 $
76.1 77.7 RT! LP!170! 0.20 1.83 1.76 - $ 3.7
$$ 20.0 208.9 1.1 228.9
$95.7 94.5
RT! SCM!170! 0.27 1.55 1.57 - $ 4.2 $
$ 24.4 161.1 0.0 185.6 $
132.4 133.3 RT! CONTROL! 0.21 1.00 1.32 0.77 $ 6.3
$$ 52.2 66.7 0.0 118.9
$232.3 240.5
ST! CONTROL! 0.18 1.08 1.82 - $ 4.3 $
$ 37.8 81.1 1.1 118.9 $
184.7 183.4 ST! LP!113! 0.23 1.15 1.76 - $ 4.6
$$ 48.9 65.6 1.1 114.4
$201.9 213.2
ST! LP!170! 0.09 1.46 1.52 2.38 $ 4.6 $
$ 41.1 77.8 0.0 118.9 $
199.1 198.1 ST! LP!57! 0.29 1.33 2.17 1.53 $ 5.6
$$ 35.6 94.4 0.0 130.0
$197.5 196.2
ST! CONTROL! - - 1.46 - $ 5.3 $
$ 42.2 64.4 2.2 106.7 $
225.6 226.2 ST! SCM!57! 0.13 1.32 1.98 1.05 $ 5.0
$$ 41.1 76.7 0.0 117.8
$202.7 201.5
ST! GCS!113! 0.21 1.35 1.58 - $ 4.6 $
$ 42.2 74.4 1.1 116.7 $
203.1 206.4 ST! GCS!57! 0.14 1.34 1.34 - $ 5.3
$$ 50.0 73.3 0.0 123.3
$211.0 216.3
ST! SCM!170! 0.18 0.87 0.97 1.27 $ 4.3 $
$ 46.7 94.4 0.0 141.1 $
150.8 150.9 ST! CONTROL! - - 1.44 - $ 3.9
$$ 37.8 93.3 4.4 131.1
$141.0 138.3
ST! SCM!113! 0.19 1.60 1.16 1.84 $ 4.5 $
$ 41.1 75.6 3.3 116.7 $
187.6 184.7 ST! GCS!170! 0.11 0.95 1.88 1.91 $ 5.1
$$ 44.4 72.2 0.0 116.7
$227.5 227.7
ST! SCM!113! 0.25 1.62 1.61 1.14 $ 5.1 $
$ 60.0 51.1 0.0 111.1 $
235.6 236.7 ST! SCM!170! 0.14 1.00 1.80 1.04 $ 5.2
$$ 50.0 64.4 3.3 114.4
$220.5 224.2
ST! LP!57! 0.22 0.90 1.20 0.95 $ 5.1 $
$ 51.1 72.2 4.4 123.3 $
187.6 184.9 ST! CONTROL! 0.26 1.33 0.85 0.93 $ 4.5
$$ 44.4 70.0 5.6 114.4
$173.4 167.7
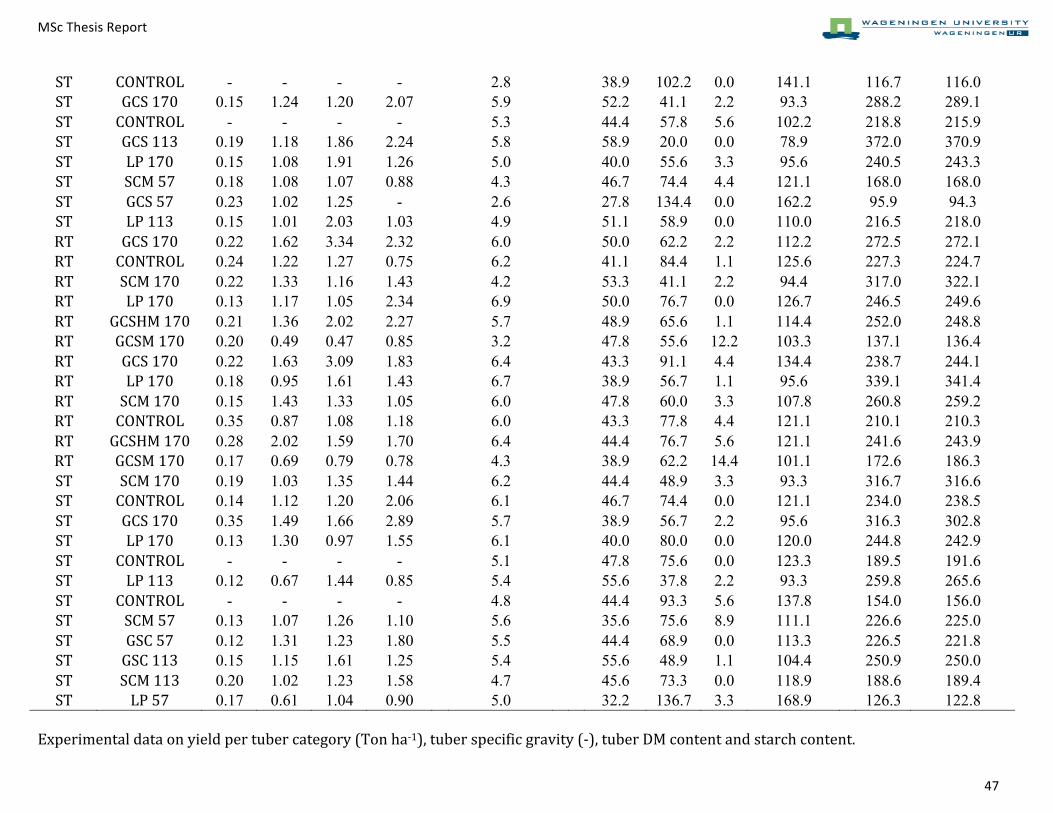
MSc$Thesis$Report$ $ $!$
$ 47$
ST! CONTROL! - - - - $ 2.8 $
$ 38.9 102.2 0.0 141.1 $
116.7 116.0 ST! GCS!170! 0.15 1.24 1.20 2.07 $ 5.9
$$ 52.2 41.1 2.2 93.3
$288.2 289.1
ST! CONTROL! - - - - $ 5.3 $
$ 44.4 57.8 5.6 102.2 $
218.8 215.9 ST! GCS!113! 0.19 1.18 1.86 2.24 $ 5.8
$$ 58.9 20.0 0.0 78.9
$372.0 370.9
ST! LP!170! 0.15 1.08 1.91 1.26 $ 5.0 $
$ 40.0 55.6 3.3 95.6 $
240.5 243.3 ST! SCM!57! 0.18 1.08 1.07 0.88 $ 4.3
$$ 46.7 74.4 4.4 121.1
$168.0 168.0
ST! GCS!57! 0.23 1.02 1.25 - $ 2.6 $
$ 27.8 134.4 0.0 162.2 $
95.9 94.3 ST! LP!113! 0.15 1.01 2.03 1.03 $ 4.9
$$ 51.1 58.9 0.0 110.0
$216.5 218.0
RT! GCS!170! 0.22 1.62 3.34 2.32 $ 6.0 $
$ 50.0 62.2 2.2 112.2 $
272.5 272.1 RT! CONTROL! 0.24 1.22 1.27 0.75 $ 6.2
$$ 41.1 84.4 1.1 125.6
$227.3 224.7
RT! SCM!170! 0.22 1.33 1.16 1.43 $ 4.2 $
$ 53.3 41.1 2.2 94.4 $
317.0 322.1 RT! LP!170! 0.13 1.17 1.05 2.34 $ 6.9
$$ 50.0 76.7 0.0 126.7
$246.5 249.6
RT! GCSHM!170! 0.21 1.36 2.02 2.27 $ 5.7 $
$ 48.9 65.6 1.1 114.4 $
252.0 248.8 RT! GCSM!170! 0.20 0.49 0.47 0.85 $ 3.2
$$ 47.8 55.6 12.2 103.3
$137.1 136.4
RT! GCS!170! 0.22 1.63 3.09 1.83 $ 6.4 $
$ 43.3 91.1 4.4 134.4 $
238.7 244.1 RT! LP!170! 0.18 0.95 1.61 1.43 $ 6.7
$$ 38.9 56.7 1.1 95.6
$339.1 341.4
RT! SCM!170! 0.15 1.43 1.33 1.05 $ 6.0 $
$ 47.8 60.0 3.3 107.8 $
260.8 259.2 RT! CONTROL! 0.35 0.87 1.08 1.18 $ 6.0
$$ 43.3 77.8 4.4 121.1
$210.1 210.3
RT! GCSHM!170! 0.28 2.02 1.59 1.70 $ 6.4 $
$ 44.4 76.7 5.6 121.1 $
241.6 243.9 RT! GCSM!170! 0.17 0.69 0.79 0.78 $ 4.3
$$ 38.9 62.2 14.4 101.1
$172.6 186.3
ST! SCM!170! 0.19 1.03 1.35 1.44 $ 6.2 $
$ 44.4 48.9 3.3 93.3 $
316.7 316.6 ST! CONTROL! 0.14 1.12 1.20 2.06 $ 6.1
$$ 46.7 74.4 0.0 121.1
$234.0 238.5
ST! GCS!170! 0.35 1.49 1.66 2.89 $ 5.7 $
$ 38.9 56.7 2.2 95.6 $
316.3 302.8 ST! LP!170! 0.13 1.30 0.97 1.55 $ 6.1
$$ 40.0 80.0 0.0 120.0
$244.8 242.9
ST! CONTROL! - - - - $ 5.1 $
$ 47.8 75.6 0.0 123.3 $
189.5 191.6 ST! LP!113! 0.12 0.67 1.44 0.85 $ 5.4
$$ 55.6 37.8 2.2 93.3
$259.8 265.6
ST! CONTROL! - - - - $ 4.8 $
$ 44.4 93.3 5.6 137.8 $
154.0 156.0 ST! SCM!57! 0.13 1.07 1.26 1.10 $ 5.6
$$ 35.6 75.6 8.9 111.1
$226.6 225.0
ST! GSC!57! 0.12 1.31 1.23 1.80 $ 5.5 $
$ 44.4 68.9 0.0 113.3 $
226.5 221.8 ST! GSC!113! 0.15 1.15 1.61 1.25 $ 5.4
$$ 55.6 48.9 1.1 104.4
$250.9 250.0
ST! SCM!113! 0.20 1.02 1.23 1.58 $ 4.7 $
$ 45.6 73.3 0.0 118.9 $
188.6 189.4 ST! LP!57! 0.17 0.61 1.04 0.90 5.0
$ 32.2 136.7 3.3 168.9 126.3 122.8 !Experimental!data!on!yield!per!tuber!category!(Ton!ha:1),!tuber!specific!gravity!(:),!tuber!DM!content!and!starch!content.!!
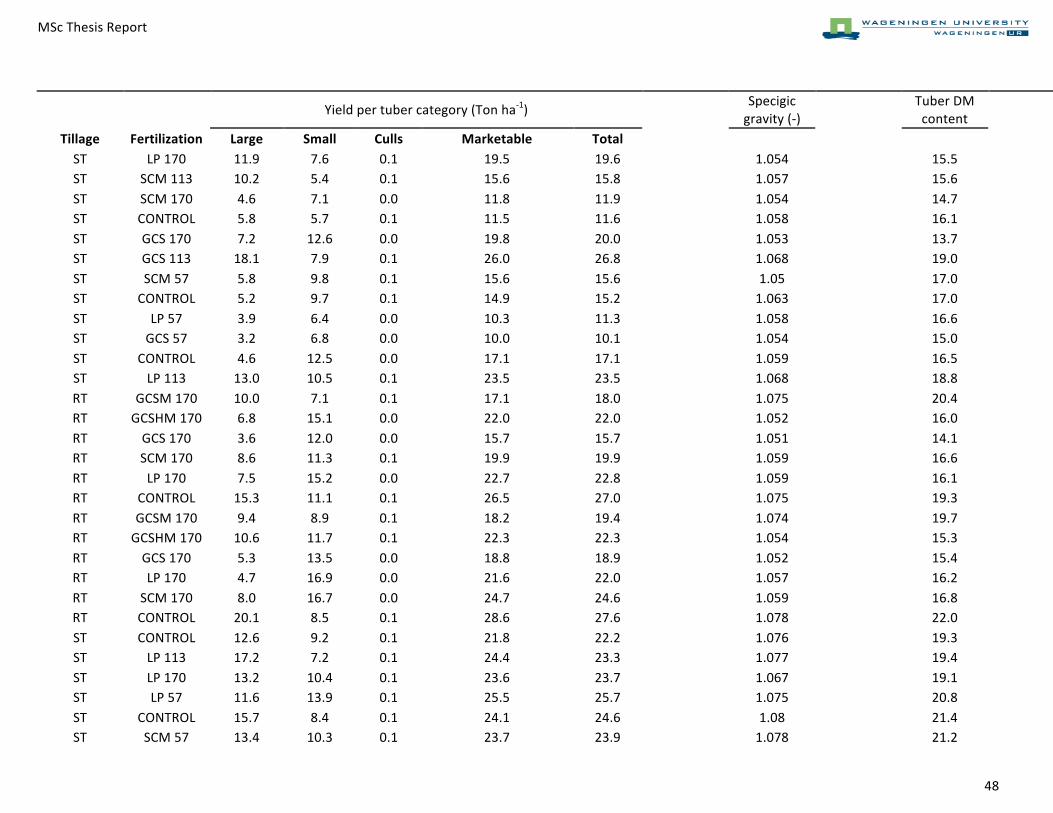
MSc$Thesis$Report$ $ $!$
$ 48$
!
$$ $$ Yield$per$tuber$category$(Ton$ha?1)$ $$ Specigic$gravity$(?)$ $$ Tuber$DM$
content$ $$ Starch$content$
Τillage! Fertilization! Large! Small! Culls!! Marketable! Total!$ $ $ $ $ $ST$ LP$170$ 11.9$ 7.6$ 0.1$ 19.5$ 19.6$ $ 1.054$ $ 15.5$ $ 9.2$
ST$ SCM$113$ 10.2$ 5.4$ 0.1$ 15.6$ 15.8$ $ 1.057$ $ 15.6$ $ 9.7$ST$ SCM$170$ 4.6$ 7.1$ 0.0$ 11.8$ 11.9$ $ 1.054$ $ 14.7$ $ 9.2$ST$ CONTROL$ 5.8$ 5.7$ 0.1$ 11.5$ 11.6$ $ 1.058$ $ 16.1$ $ 10.1$ST$ GCS$170$ 7.2$ 12.6$ 0.0$ 19.8$ 20.0$ $ 1.053$ $ 13.7$ $ 9.0$ST$ GCS$113$ 18.1$ 7.9$ 0.1$ 26.0$ 26.8$ $ 1.068$ $ 19.0$ $ 11.9$ST$ SCM$57$ 5.8$ 9.8$ 0.1$ 15.6$ 15.6$ $ 1.05$ $ 17.0$ $ 8.4$ST$ CONTROL$ 5.2$ 9.7$ 0.1$ 14.9$ 15.2$ $ 1.063$ $ 17.0$ $ 10.9$ST$ LP$57$ 3.9$ 6.4$ 0.0$ 10.3$ 11.3$ $ 1.058$ $ 16.6$ $ 9.9$ST$ GCS$57$ 3.2$ 6.8$ 0.0$ 10.0$ 10.1$ $ 1.054$ $ 15.0$ $ 9.1$ST$ CONTROL$ 4.6$ 12.5$ 0.0$ 17.1$ 17.1$ $ 1.059$ $ 16.5$ $ 10.2$ST$ LP$113$ 13.0$ 10.5$ 0.1$ 23.5$ 23.5$ $ 1.068$ $ 18.8$ $ 12.0$RT$ GCSM$170$ 10.0$ 7.1$ 0.1$ 17.1$ 18.0$ $ 1.075$ $ 20.4$ $ 13.4$RT$ GCSHM$170$ 6.8$ 15.1$ 0.0$ 22.0$ 22.0$ $ 1.052$ $ 16.0$ $ 8.8$RT$ GCS$170$ 3.6$ 12.0$ 0.0$ 15.7$ 15.7$ $ 1.051$ $ 14.1$ $ 8.5$RT$ SCM$170$ 8.6$ 11.3$ 0.1$ 19.9$ 19.9$ $ 1.059$ $ 16.6$ $ 10.2$RT$ LP$170$ 7.5$ 15.2$ 0.0$ 22.7$ 22.8$ $ 1.059$ $ 16.1$ $ 10.2$RT$ CONTROL$ 15.3$ 11.1$ 0.1$ 26.5$ 27.0$ $ 1.075$ $ 19.3$ $ 13.4$RT$ GCSM$170$ 9.4$ 8.9$ 0.1$ 18.2$ 19.4$ $ 1.074$ $ 19.7$ $ 13.1$RT$ GCSHM$170$ 10.6$ 11.7$ 0.1$ 22.3$ 22.3$ $ 1.054$ $ 15.3$ $ 9.3$RT$ GCS$170$ 5.3$ 13.5$ 0.0$ 18.8$ 18.9$ $ 1.052$ $ 15.4$ $ 8.9$RT$ LP$170$ 4.7$ 16.9$ 0.0$ 21.6$ 22.0$ $ 1.057$ $ 16.2$ $ 9.7$RT$ SCM$170$ 8.0$ 16.7$ 0.0$ 24.7$ 24.6$ $ 1.059$ $ 16.8$ $ 10.3$RT$ CONTROL$ 20.1$ 8.5$ 0.1$ 28.6$ 27.6$ $ 1.078$ $ 22.0$ $ 13.9$ST$ CONTROL$ 12.6$ 9.2$ 0.1$ 21.8$ 22.2$ $ 1.076$ $ 19.3$ $ 13.6$ST$ LP$113$ 17.2$ 7.2$ 0.1$ 24.4$ 23.3$ $ 1.077$ $ 19.4$ $ 13.8$ST$ LP$170$ 13.2$ 10.4$ 0.1$ 23.6$ 23.7$ $ 1.067$ $ 19.1$ $ 11.7$ST$ LP$57$ 11.6$ 13.9$ 0.1$ 25.5$ 25.7$ $ 1.075$ $ 20.8$ $ 13.3$ST$ CONTROL$ 15.7$ 8.4$ 0.1$ 24.1$ 24.6$ $ 1.08$ $ 21.4$ $ 14.2$ST$ SCM$57$ 13.4$ 10.3$ 0.1$ 23.7$ 23.9$ $ 1.078$ $ 21.2$ $ 13.9$
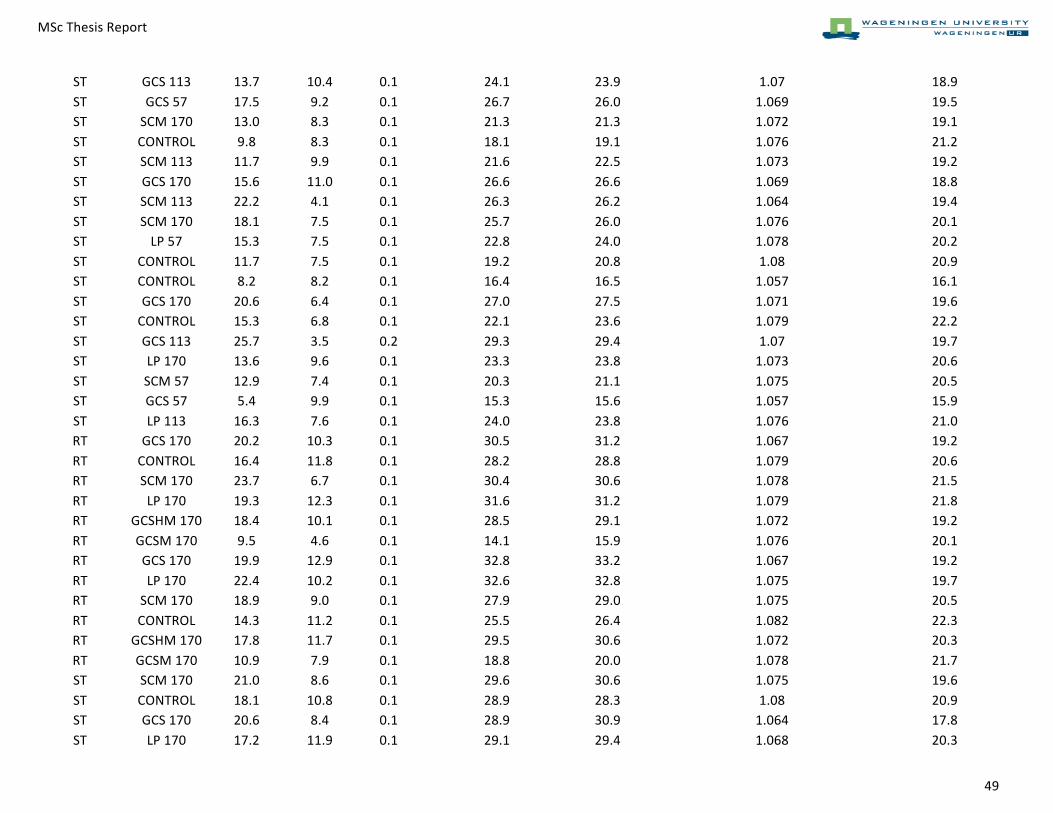
MSc$Thesis$Report$ $ $!$
$ 49$
ST$ GCS$113$ 13.7$ 10.4$ 0.1$ 24.1$ 23.9$ $ 1.07$ $ 18.9$ $ 12.3$ST$ GCS$57$ 17.5$ 9.2$ 0.1$ 26.7$ 26.0$ $ 1.069$ $ 19.5$ $ 12.1$ST$ SCM$170$ 13.0$ 8.3$ 0.1$ 21.3$ 21.3$ $ 1.072$ $ 19.1$ $ 12.7$ST$ CONTROL$ 9.8$ 8.3$ 0.1$ 18.1$ 19.1$ $ 1.076$ $ 21.2$ $ 13.5$ST$ SCM$113$ 11.7$ 9.9$ 0.1$ 21.6$ 22.5$ $ 1.073$ $ 19.2$ $ 12.8$ST$ GCS$170$ 15.6$ 11.0$ 0.1$ 26.6$ 26.6$ $ 1.069$ $ 18.8$ $ 12.2$ST$ SCM$113$ 22.2$ 4.1$ 0.1$ 26.3$ 26.2$ $ 1.064$ $ 19.4$ $ 11.2$ST$ SCM$170$ 18.1$ 7.5$ 0.1$ 25.7$ 26.0$ $ 1.076$ $ 20.1$ $ 13.5$ST$ LP$57$ 15.3$ 7.5$ 0.1$ 22.8$ 24.0$ $ 1.078$ $ 20.2$ $ 14.0$ST$ CONTROL$ 11.7$ 7.5$ 0.1$ 19.2$ 20.8$ $ 1.08$ $ 20.9$ $ 14.2$ST$ CONTROL$ 8.2$ 8.2$ 0.1$ 16.4$ 16.5$ $ 1.057$ $ 16.1$ $ 9.7$ST$ GCS$170$ 20.6$ 6.4$ 0.1$ 27.0$ 27.5$ $ 1.071$ $ 19.6$ $ 12.6$ST$ CONTROL$ 15.3$ 6.8$ 0.1$ 22.1$ 23.6$ $ 1.079$ $ 22.2$ $ 14.0$ST$ GCS$113$ 25.7$ 3.5$ 0.2$ 29.3$ 29.4$ $ 1.07$ $ 19.7$ $ 12.4$ST$ LP$170$ 13.6$ 9.6$ 0.1$ 23.3$ 23.8$ $ 1.073$ $ 20.6$ $ 12.9$ST$ SCM$57$ 12.9$ 7.4$ 0.1$ 20.3$ 21.1$ $ 1.075$ $ 20.5$ $ 13.4$ST$ GCS$57$ 5.4$ 9.9$ 0.1$ 15.3$ 15.6$ $ 1.057$ $ 15.9$ $ 9.8$ST$ LP$113$ 16.3$ 7.6$ 0.1$ 24.0$ 23.8$ $ 1.076$ $ 21.0$ $ 13.5$RT$ GCS$170$ 20.2$ 10.3$ 0.1$ 30.5$ 31.2$ $ 1.067$ $ 19.2$ $ 11.8$RT$ CONTROL$ 16.4$ 11.8$ 0.1$ 28.2$ 28.8$ $ 1.079$ $ 20.6$ $ 14.0$RT$ SCM$170$ 23.7$ 6.7$ 0.1$ 30.4$ 30.6$ $ 1.078$ $ 21.5$ $ 14.0$RT$ LP$170$ 19.3$ 12.3$ 0.1$ 31.6$ 31.2$ $ 1.079$ $ 21.8$ $ 14.2$RT$ GCSHM$170$ 18.4$ 10.1$ 0.1$ 28.5$ 29.1$ $ 1.072$ $ 19.2$ $ 12.7$RT$ GCSM$170$ 9.5$ 4.6$ 0.1$ 14.1$ 15.9$ $ 1.076$ $ 20.1$ $ 13.4$RT$ GCS$170$ 19.9$ 12.9$ 0.1$ 32.8$ 33.2$ $ 1.067$ $ 19.2$ $ 11.8$RT$ LP$170$ 22.4$ 10.2$ 0.1$ 32.6$ 32.8$ $ 1.075$ $ 19.7$ $ 13.3$RT$ SCM$170$ 18.9$ 9.0$ 0.1$ 27.9$ 29.0$ $ 1.075$ $ 20.5$ $ 13.4$RT$ CONTROL$ 14.3$ 11.2$ 0.1$ 25.5$ 26.4$ $ 1.082$ $ 22.3$ $ 14.7$RT$ GCSHM$170$ 17.8$ 11.7$ 0.1$ 29.5$ 30.6$ $ 1.072$ $ 20.3$ $ 12.6$RT$ GCSM$170$ 10.9$ 7.9$ 0.1$ 18.8$ 20.0$ $ 1.078$ $ 21.7$ $ 14.0$ST$ SCM$170$ 21.0$ 8.6$ 0.1$ 29.6$ 30.6$ $ 1.075$ $ 19.6$ $ 13.2$ST$ CONTROL$ 18.1$ 10.8$ 0.1$ 28.9$ 28.3$ $ 1.08$ $ 20.9$ $ 14.4$ST$ GCS$170$ 20.6$ 8.4$ 0.1$ 28.9$ 30.9$ $ 1.064$ $ 17.8$ $ 11.1$ST$ LP$170$ 17.2$ 11.9$ 0.1$ 29.1$ 29.4$ $ 1.068$ $ 20.3$ $ 11.9$
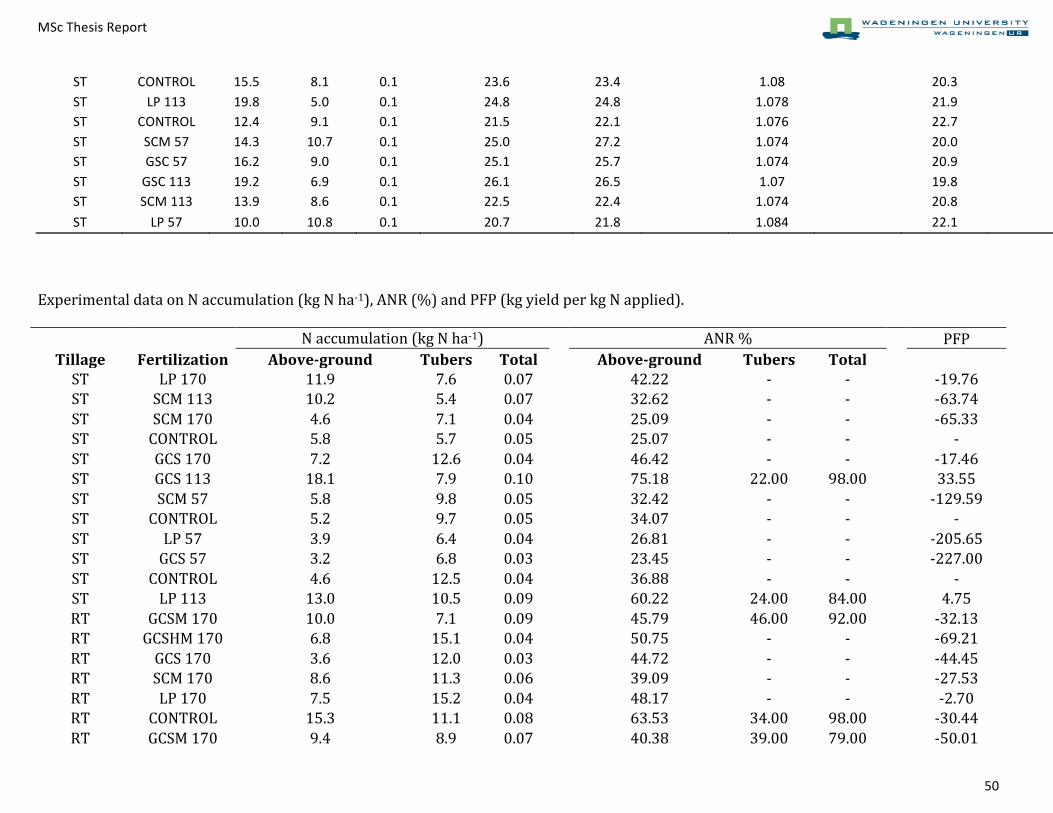
MSc$Thesis$Report$ $ $!$
$ 50$
ST$ CONTROL$ 15.5$ 8.1$ 0.1$ 23.6$ 23.4$ $ 1.08$ $ 20.3$ $ 14.3$ST$ LP$113$ 19.8$ 5.0$ 0.1$ 24.8$ 24.8$ $ 1.078$ $ 21.9$ $ 13.9$ST$ CONTROL$ 12.4$ 9.1$ 0.1$ 21.5$ 22.1$ $ 1.076$ $ 22.7$ $ 13.5$ST$ SCM$57$ 14.3$ 10.7$ 0.1$ 25.0$ 27.2$ $ 1.074$ $ 20.0$ $ 13.1$ST$ GSC$57$ 16.2$ 9.0$ 0.1$ 25.1$ 25.7$ $ 1.074$ $ 20.9$ $ 13.2$ST$ GSC$113$ 19.2$ 6.9$ 0.1$ 26.1$ 26.5$ $ 1.07$ $ 19.8$ $ 12.4$ST$ SCM$113$ 13.9$ 8.6$ 0.1$ 22.5$ 22.4$ $ 1.074$ $ 20.8$ $ 13.2$ST$ LP$57$ 10.0$ 10.8$ 0.1$ 20.7$ 21.8$ $$ 1.084$ $$ 22.1$ $$ 15.1$
!!!Experimental!data!on!N!accumulation!(kg!N!ha:1),!ANR!(%)!and!PFP!(kg!yield!per!kg!N!applied).!!!!! !! N!accumulation!(kg!N!ha:1)! !! ANR!%! !! PFP!Τillage( Fertilization( AboveJground( Tubers( Total(
(AboveJground( Tubers( Total(
! !ST! LP!170! 11.9! 7.6! 0.07! ! 42.22! :! :! ! :19.76!ST! SCM!113! 10.2! 5.4! 0.07! ! 32.62! :! :! ! :63.74!ST! SCM!170! 4.6! 7.1! 0.04! ! 25.09! :! :! ! :65.33!ST! CONTROL! 5.8! 5.7! 0.05! ! 25.07! :! :! ! :!ST! GCS!170! 7.2! 12.6! 0.04! ! 46.42! :! :! ! :17.46!ST! GCS!113! 18.1! 7.9! 0.10! ! 75.18! 22.00! 98.00! ! 33.55!ST! SCM!57! 5.8! 9.8! 0.05! ! 32.42! :! :! ! :129.59!ST! CONTROL! 5.2! 9.7! 0.05! ! 34.07! :! :! ! :!ST! LP!57! 3.9! 6.4! 0.04! ! 26.81! :! :! ! :205.65!ST! GCS!57! 3.2! 6.8! 0.03! ! 23.45! :! :! ! :227.00!ST! CONTROL! 4.6! 12.5! 0.04! ! 36.88! :! :! ! :!ST! LP!113! 13.0! 10.5! 0.09! ! 60.22! 24.00! 84.00! ! 4.75!RT! GCSM!170! 10.0! 7.1! 0.09! ! 45.79! 46.00! 92.00! ! :32.13!RT! GCSHM!170! 6.8! 15.1! 0.04! ! 50.75! :! :! ! :69.21!RT! GCS!170! 3.6! 12.0! 0.03! ! 44.72! :! :! ! :44.45!RT! SCM!170! 8.6! 11.3! 0.06! ! 39.09! :! :! ! :27.53!RT! LP!170! 7.5! 15.2! 0.04! ! 48.17! :! :! ! :2.70!RT! CONTROL! 15.3! 11.1! 0.08! ! 63.53! 34.00! 98.00! ! :30.44!RT! GCSM!170! 9.4! 8.9! 0.07! ! 40.38! 39.00! 79.00! ! :50.01!
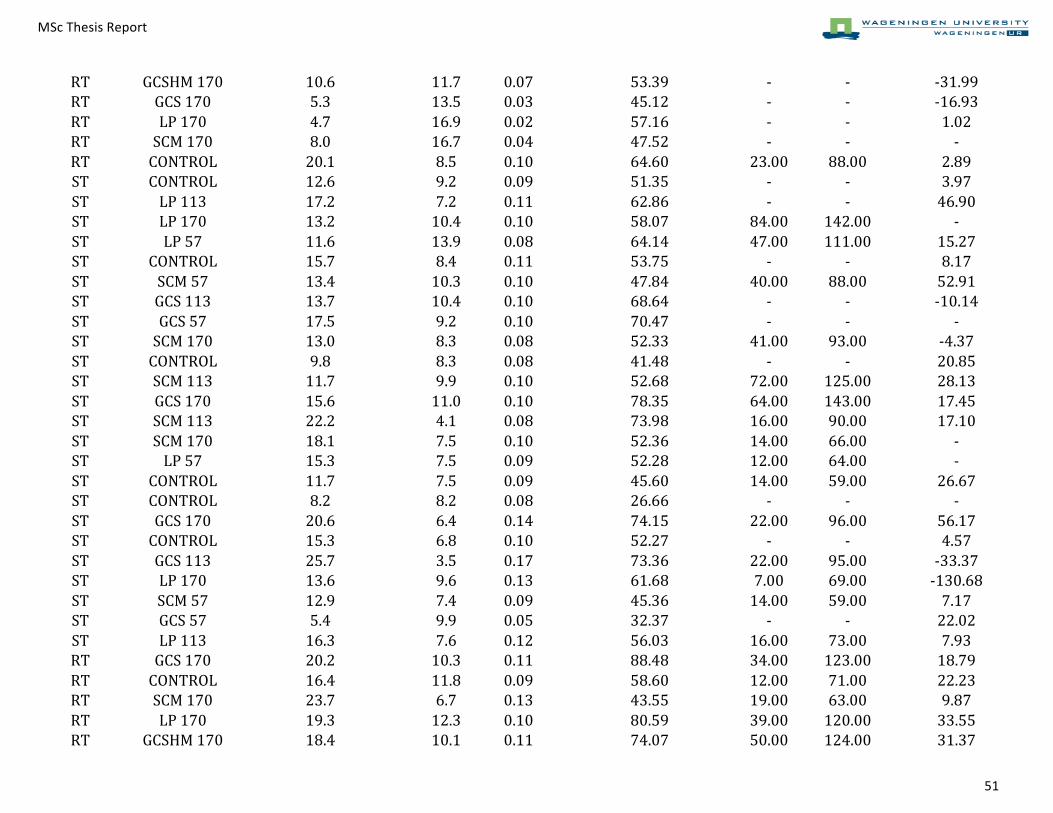
MSc$Thesis$Report$ $ $!$
$ 51$
RT! GCSHM!170! 10.6! 11.7! 0.07! ! 53.39! :! :! ! :31.99!RT! GCS!170! 5.3! 13.5! 0.03! ! 45.12! :! :! ! :16.93!RT! LP!170! 4.7! 16.9! 0.02! ! 57.16! :! :! ! 1.02!RT! SCM!170! 8.0! 16.7! 0.04! ! 47.52! :! :! ! :!RT! CONTROL! 20.1! 8.5! 0.10! ! 64.60! 23.00! 88.00! ! 2.89!ST! CONTROL! 12.6! 9.2! 0.09! ! 51.35! :! :! ! 3.97!ST! LP!113! 17.2! 7.2! 0.11! ! 62.86! :! :! ! 46.90!ST! LP!170! 13.2! 10.4! 0.10! ! 58.07! 84.00! 142.00! ! :!ST! LP!57! 11.6! 13.9! 0.08! ! 64.14! 47.00! 111.00! ! 15.27!ST! CONTROL! 15.7! 8.4! 0.11! ! 53.75! :! :! ! 8.17!ST! SCM!57! 13.4! 10.3! 0.10! ! 47.84! 40.00! 88.00! ! 52.91!ST! GCS!113! 13.7! 10.4! 0.10! ! 68.64! :! :! ! :10.14!ST! GCS!57! 17.5! 9.2! 0.10! ! 70.47! :! :! ! :!ST! SCM!170! 13.0! 8.3! 0.08! ! 52.33! 41.00! 93.00! ! :4.37!ST! CONTROL! 9.8! 8.3! 0.08! ! 41.48! :! :! ! 20.85!ST! SCM!113! 11.7! 9.9! 0.10! ! 52.68! 72.00! 125.00! ! 28.13!ST! GCS!170! 15.6! 11.0! 0.10! ! 78.35! 64.00! 143.00! ! 17.45!ST! SCM!113! 22.2! 4.1! 0.08! ! 73.98! 16.00! 90.00! ! 17.10!ST! SCM!170! 18.1! 7.5! 0.10! ! 52.36! 14.00! 66.00! ! :!ST! LP!57! 15.3! 7.5! 0.09! ! 52.28! 12.00! 64.00! ! :!ST! CONTROL! 11.7! 7.5! 0.09! ! 45.60! 14.00! 59.00! ! 26.67!ST! CONTROL! 8.2! 8.2! 0.08! ! 26.66! :! :! ! :!ST! GCS!170! 20.6! 6.4! 0.14! ! 74.15! 22.00! 96.00! ! 56.17!ST! CONTROL! 15.3! 6.8! 0.10! ! 52.27! :! :! ! 4.57!ST! GCS!113! 25.7! 3.5! 0.17! ! 73.36! 22.00! 95.00! ! :33.37!ST! LP!170! 13.6! 9.6! 0.13! ! 61.68! 7.00! 69.00! ! :130.68!ST! SCM!57! 12.9! 7.4! 0.09! ! 45.36! 14.00! 59.00! ! 7.17!ST! GCS!57! 5.4! 9.9! 0.05! ! 32.37! :! :! ! 22.02!ST! LP!113! 16.3! 7.6! 0.12! ! 56.03! 16.00! 73.00! ! 7.93!RT! GCS!170! 20.2! 10.3! 0.11! ! 88.48! 34.00! 123.00! ! 18.79!RT! CONTROL! 16.4! 11.8! 0.09! ! 58.60! 12.00! 71.00! ! 22.23!RT! SCM!170! 23.7! 6.7! 0.13! ! 43.55! 19.00! 63.00! ! 9.87!RT! LP!170! 19.3! 12.3! 0.10! ! 80.59! 39.00! 120.00! ! 33.55!RT! GCSHM!170! 18.4! 10.1! 0.11! ! 74.07! 50.00! 124.00! ! 31.37!
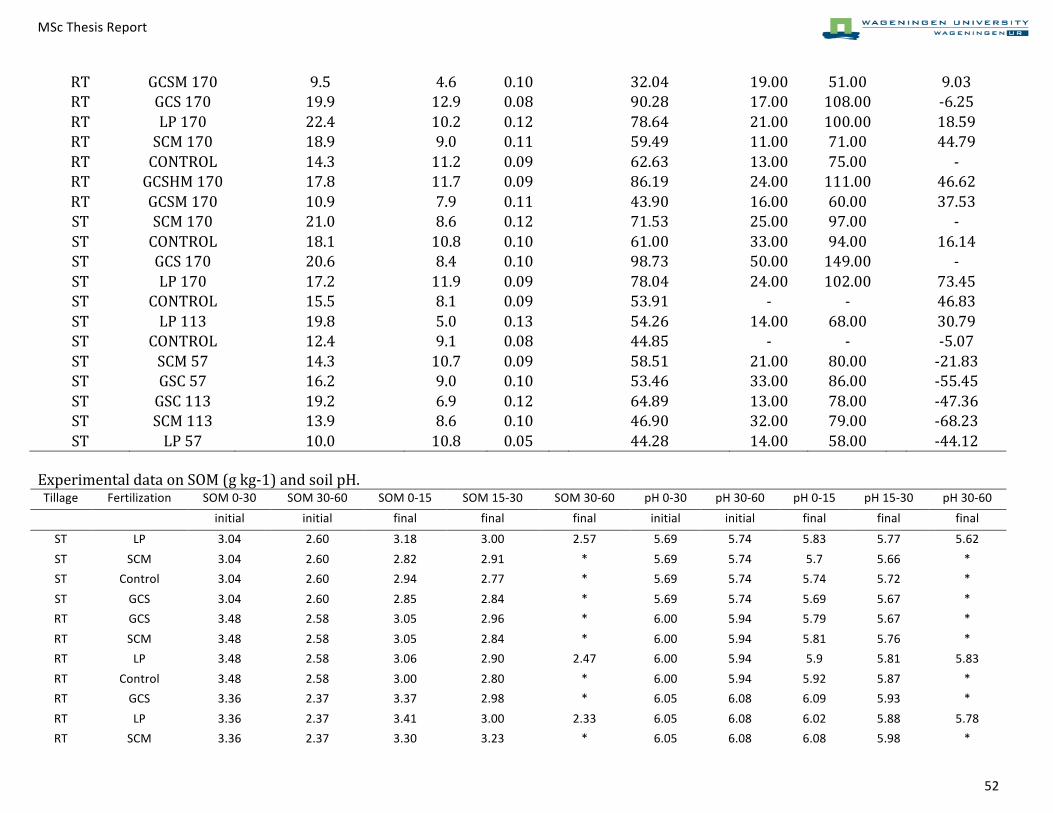
MSc$Thesis$Report$ $ $!$
$ 52$
RT! GCSM!170! 9.5! 4.6! 0.10! ! 32.04! 19.00! 51.00! ! 9.03!RT! GCS!170! 19.9! 12.9! 0.08! ! 90.28! 17.00! 108.00! ! :6.25!RT! LP!170! 22.4! 10.2! 0.12! ! 78.64! 21.00! 100.00! ! 18.59!RT! SCM!170! 18.9! 9.0! 0.11! ! 59.49! 11.00! 71.00! ! 44.79!RT! CONTROL! 14.3! 11.2! 0.09! ! 62.63! 13.00! 75.00! ! :!RT! GCSHM!170! 17.8! 11.7! 0.09! ! 86.19! 24.00! 111.00! ! 46.62!RT! GCSM!170! 10.9! 7.9! 0.11! ! 43.90! 16.00! 60.00! ! 37.53!ST! SCM!170! 21.0! 8.6! 0.12! ! 71.53! 25.00! 97.00! ! :!ST! CONTROL! 18.1! 10.8! 0.10! ! 61.00! 33.00! 94.00! ! 16.14!ST! GCS!170! 20.6! 8.4! 0.10! ! 98.73! 50.00! 149.00! ! :!ST! LP!170! 17.2! 11.9! 0.09! ! 78.04! 24.00! 102.00! ! 73.45!ST! CONTROL! 15.5! 8.1! 0.09! ! 53.91! :! :! ! 46.83!ST! LP!113! 19.8! 5.0! 0.13! ! 54.26! 14.00! 68.00! ! 30.79!ST! CONTROL! 12.4! 9.1! 0.08! ! 44.85! :! :! ! :5.07!ST! SCM!57! 14.3! 10.7! 0.09! ! 58.51! 21.00! 80.00! ! :21.83!ST! GSC!57! 16.2! 9.0! 0.10! ! 53.46! 33.00! 86.00! ! :55.45!ST! GSC!113! 19.2! 6.9! 0.12! ! 64.89! 13.00! 78.00! ! :47.36!ST! SCM!113! 13.9! 8.6! 0.10! ! 46.90! 32.00! 79.00! ! :68.23!ST! LP!57! 10.0! 10.8! 0.05! !! 44.28! 14.00! 58.00! !! :44.12!
!Experimental!data!on!SOM!(g!kg:1)!and!soil!pH.!Tillage$ Fertilization$ SOM$0?30$$ SOM$30?60$$ SOM$0?15$$ SOM$15?30$$ SOM$30?60$$ pH$0?30$$ pH$30?60$$ pH$0?15$$ pH$15?30$$ pH$30?60$$
$ $ initial$ initial$ final$ final$ final$ initial$ initial$ final$ final$ final$ST$ LP$ 3.04$ 2.60$ 3.18$ 3.00$ 2.57$ 5.69$ 5.74$ 5.83$ 5.77$ 5.62$ST$ SCM$ 3.04$ 2.60$ 2.82$ 2.91$ *$ 5.69$ 5.74$ 5.7$ 5.66$ *$ST$ Control$ 3.04$ 2.60$ 2.94$ 2.77$ *$ 5.69$ 5.74$ 5.74$ 5.72$ *$ST$ GCS$ 3.04$ 2.60$ 2.85$ 2.84$ *$ 5.69$ 5.74$ 5.69$ 5.67$ *$RT$ GCS$ 3.48$ 2.58$ 3.05$ 2.96$ *$ 6.00$ 5.94$ 5.79$ 5.67$ *$RT$ SCM$ 3.48$ 2.58$ 3.05$ 2.84$ *$ 6.00$ 5.94$ 5.81$ 5.76$ *$RT$ LP$ 3.48$ 2.58$ 3.06$ 2.90$ 2.47$ 6.00$ 5.94$ 5.9$ 5.81$ 5.83$RT$ Control$ 3.48$ 2.58$ 3.00$ 2.80$ *$ 6.00$ 5.94$ 5.92$ 5.87$ *$RT$ GCS$ 3.36$ 2.37$ 3.37$ 2.98$ *$ 6.05$ 6.08$ 6.09$ 5.93$ *$RT$ LP$ 3.36$ 2.37$ 3.41$ 3.00$ 2.33$ 6.05$ 6.08$ 6.02$ 5.88$ 5.78$RT$ SCM$ 3.36$ 2.37$ 3.30$ 3.23$ *$ 6.05$ 6.08$ 6.08$ 5.98$ *$
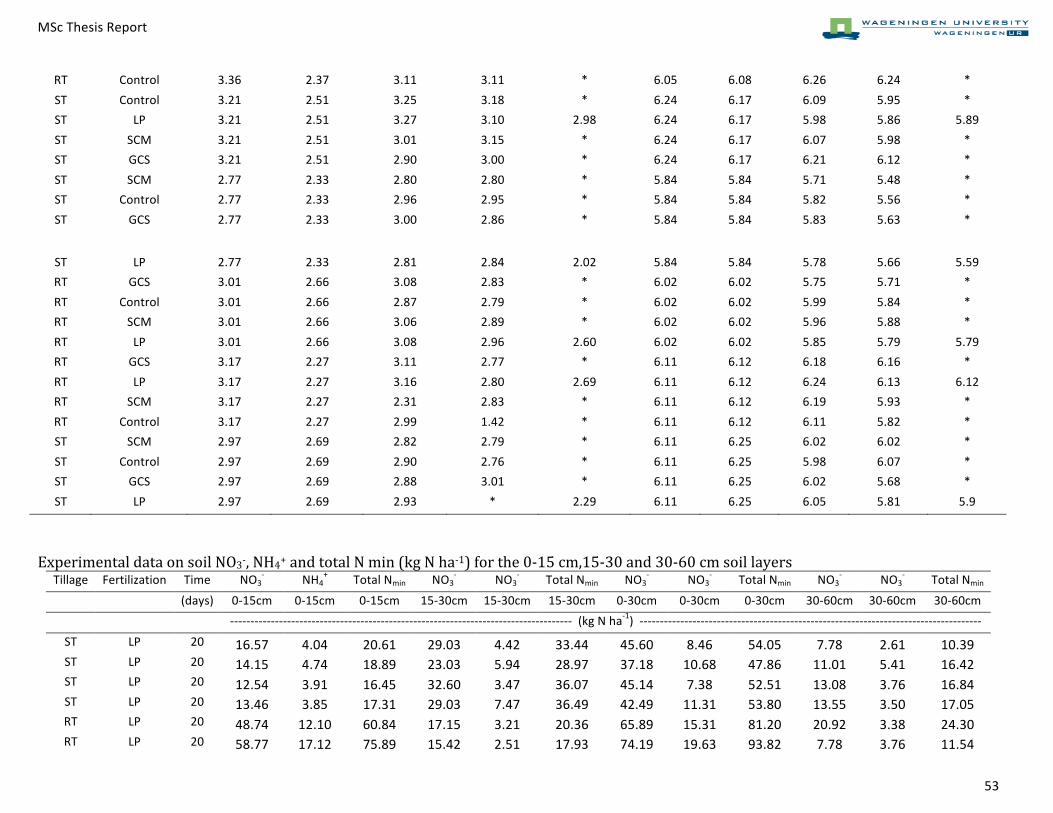
MSc$Thesis$Report$ $ $!$
$ 53$
RT$ Control$ 3.36$ 2.37$ 3.11$ 3.11$ *$ 6.05$ 6.08$ 6.26$ 6.24$ *$ST$ Control$ 3.21$ 2.51$ 3.25$ 3.18$ *$ 6.24$ 6.17$ 6.09$ 5.95$ *$ST$ LP$ 3.21$ 2.51$ 3.27$ 3.10$ 2.98$ 6.24$ 6.17$ 5.98$ 5.86$ 5.89$ST$ SCM$ 3.21$ 2.51$ 3.01$ 3.15$ *$ 6.24$ 6.17$ 6.07$ 5.98$ *$ST$ GCS$ 3.21$ 2.51$ 2.90$ 3.00$ *$ 6.24$ 6.17$ 6.21$ 6.12$ *$ST$ SCM$ 2.77$ 2.33$ 2.80$ 2.80$ *$ 5.84$ 5.84$ 5.71$ 5.48$ *$ST$ Control$ 2.77$ 2.33$ 2.96$ 2.95$ *$ 5.84$ 5.84$ 5.82$ 5.56$ *$ST$ GCS$ 2.77$ 2.33$ 3.00$ 2.86$ *$ 5.84$ 5.84$ 5.83$ 5.63$ *$
ST$ LP$ 2.77$ 2.33$ 2.81$ 2.84$ 2.02$ 5.84$ 5.84$ 5.78$ 5.66$ 5.59$RT$ GCS$ 3.01$ 2.66$ 3.08$ 2.83$ *$ 6.02$ 6.02$ 5.75$ 5.71$ *$RT$ Control$ 3.01$ 2.66$ 2.87$ 2.79$ *$ 6.02$ 6.02$ 5.99$ 5.84$ *$RT$ SCM$ 3.01$ 2.66$ 3.06$ 2.89$ *$ 6.02$ 6.02$ 5.96$ 5.88$ *$RT$ LP$ 3.01$ 2.66$ 3.08$ 2.96$ 2.60$ 6.02$ 6.02$ 5.85$ 5.79$ 5.79$RT$ GCS$ 3.17$ 2.27$ 3.11$ 2.77$ *$ 6.11$ 6.12$ 6.18$ 6.16$ *$RT$ LP$ 3.17$ 2.27$ 3.16$ 2.80$ 2.69$ 6.11$ 6.12$ 6.24$ 6.13$ 6.12$RT$ SCM$ 3.17$ 2.27$ 2.31$ 2.83$ *$ 6.11$ 6.12$ 6.19$ 5.93$ *$RT$ Control$ 3.17$ 2.27$ 2.99$ 1.42$ *$ 6.11$ 6.12$ 6.11$ 5.82$ *$ST$ SCM$ 2.97$ 2.69$ 2.82$ 2.79$ *$ 6.11$ 6.25$ 6.02$ 6.02$ *$ST$ Control$ 2.97$ 2.69$ 2.90$ 2.76$ *$ 6.11$ 6.25$ 5.98$ 6.07$ *$ST$ GCS$ 2.97$ 2.69$ 2.88$ 3.01$ *$ 6.11$ 6.25$ 6.02$ 5.68$ *$ST$ LP$ 2.97$ 2.69$ 2.93$ *$ 2.29$ 6.11$ 6.25$ 6.05$ 5.81$ 5.9$
!!Experimental!data!on!soil!NO3:,!NH4+!and!total!N!min!(kg!N!ha:1)!for!the!0:15!cm,15:30!and!30:60!cm!soil!layers!
Tillage$ Fertilization$ Time$ NO3?$ NH4
+$ Total$Nmin$ NO3?$ NO3
?$ Total$Nmin$ NO3?$ NO3
?$ Total$Nmin$ NO3?$ NO3
?$ Total$Nmin$$ $ (days)$ 0?15cm$ 0?15cm$ 0?15cm$ 15?30cm$ 15?30cm$ 15?30cm$ 0?30cm$ 0?30cm$ 0?30cm$ 30?60cm$ 30?60cm$ 30?60cm$$ $ $ ????????????????????????????????????????????????????????????????????????????????????$$(kg$N$ha?1)$$????????????????????????????????????????????????????????????????????????????????????$ST$ LP$ 20$ 16.57$ 4.04$ 20.61$ 29.03$ 4.42$ 33.44$ 45.60$ 8.46$ 54.05$ 7.78$ 2.61$ 10.39$ST$ LP$ 20$ 14.15$ 4.74$ 18.89$ 23.03$ 5.94$ 28.97$ 37.18$ 10.68$ 47.86$ 11.01$ 5.41$ 16.42$ST$ LP$ 20$ 12.54$ 3.91$ 16.45$ 32.60$ 3.47$ 36.07$ 45.14$ 7.38$ 52.51$ 13.08$ 3.76$ 16.84$ST$ LP$ 20$ 13.46$ 3.85$ 17.31$ 29.03$ 7.47$ 36.49$ 42.49$ 11.31$ 53.80$ 13.55$ 3.50$ 17.05$RT$ LP$ 20$ 48.74$ 12.10$ 60.84$ 17.15$ 3.21$ 20.36$ 65.89$ 15.31$ 81.20$ 20.92$ 3.38$ 24.30$RT$ LP$ 20$ 58.77$ 17.12$ 75.89$ 15.42$ 2.51$ 17.93$ 74.19$ 19.63$ 93.82$ 7.78$ 3.76$ 11.54$
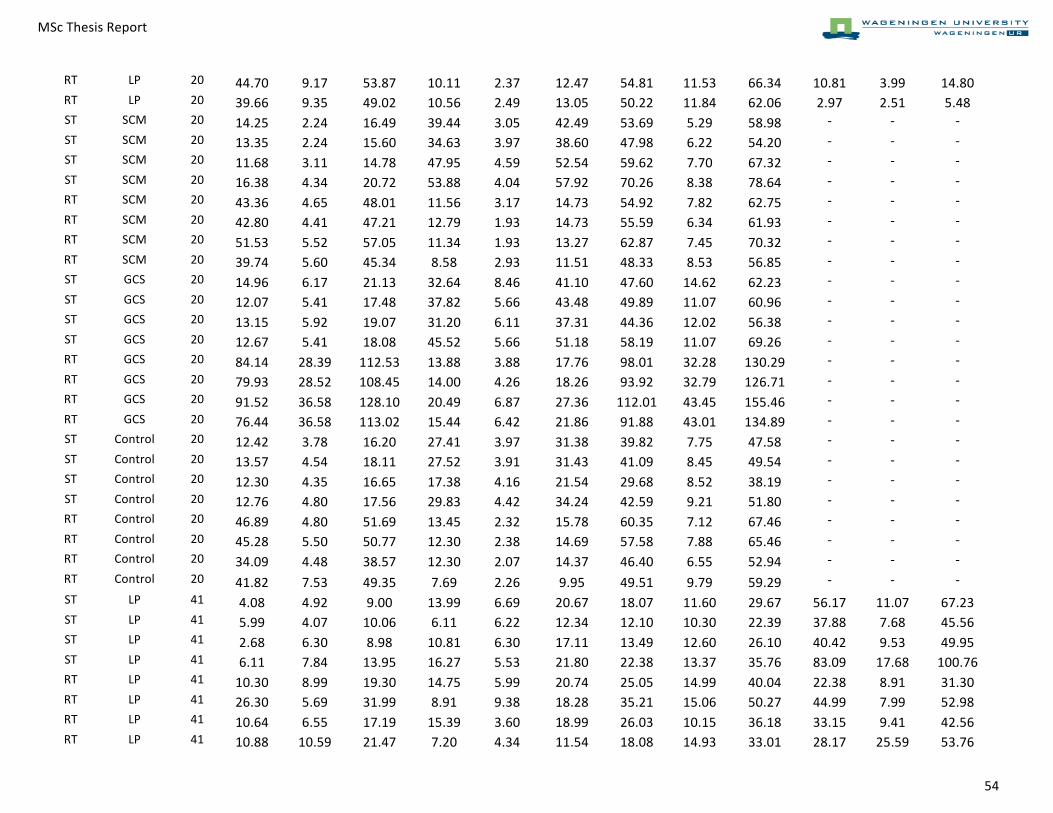
MSc$Thesis$Report$ $ $!$
$ 54$
RT$ LP$ 20$ 44.70$ 9.17$ 53.87$ 10.11$ 2.37$ 12.47$ 54.81$ 11.53$ 66.34$ 10.81$ 3.99$ 14.80$RT$ LP$ 20$ 39.66$ 9.35$ 49.02$ 10.56$ 2.49$ 13.05$ 50.22$ 11.84$ 62.06$ 2.97$ 2.51$ 5.48$ST$ SCM$ 20$ 14.25$ 2.24$ 16.49$ 39.44$ 3.05$ 42.49$ 53.69$ 5.29$ 58.98$ ?$ ?$ ?$ST$ SCM$ 20$ 13.35$ 2.24$ 15.60$ 34.63$ 3.97$ 38.60$ 47.98$ 6.22$ 54.20$ ?$ ?$ ?$ST$ SCM$ 20$ 11.68$ 3.11$ 14.78$ 47.95$ 4.59$ 52.54$ 59.62$ 7.70$ 67.32$ ?$ ?$ ?$ST$ SCM$ 20$ 16.38$ 4.34$ 20.72$ 53.88$ 4.04$ 57.92$ 70.26$ 8.38$ 78.64$ ?$ ?$ ?$RT$ SCM$ 20$ 43.36$ 4.65$ 48.01$ 11.56$ 3.17$ 14.73$ 54.92$ 7.82$ 62.75$ ?$ ?$ ?$RT$ SCM$ 20$ 42.80$ 4.41$ 47.21$ 12.79$ 1.93$ 14.73$ 55.59$ 6.34$ 61.93$ ?$ ?$ ?$RT$ SCM$ 20$ 51.53$ 5.52$ 57.05$ 11.34$ 1.93$ 13.27$ 62.87$ 7.45$ 70.32$ ?$ ?$ ?$RT$ SCM$ 20$ 39.74$ 5.60$ 45.34$ 8.58$ 2.93$ 11.51$ 48.33$ 8.53$ 56.85$ ?$ ?$ ?$ST$ GCS$ 20$ 14.96$ 6.17$ 21.13$ 32.64$ 8.46$ 41.10$ 47.60$ 14.62$ 62.23$ ?$ ?$ ?$ST$ GCS$ 20$ 12.07$ 5.41$ 17.48$ 37.82$ 5.66$ 43.48$ 49.89$ 11.07$ 60.96$ ?$ ?$ ?$ST$ GCS$ 20$ 13.15$ 5.92$ 19.07$ 31.20$ 6.11$ 37.31$ 44.36$ 12.02$ 56.38$ ?$ ?$ ?$ST$ GCS$ 20$ 12.67$ 5.41$ 18.08$ 45.52$ 5.66$ 51.18$ 58.19$ 11.07$ 69.26$ ?$ ?$ ?$RT$ GCS$ 20$ 84.14$ 28.39$ 112.53$ 13.88$ 3.88$ 17.76$ 98.01$ 32.28$ 130.29$ ?$ ?$ ?$RT$ GCS$ 20$ 79.93$ 28.52$ 108.45$ 14.00$ 4.26$ 18.26$ 93.92$ 32.79$ 126.71$ ?$ ?$ ?$RT$ GCS$ 20$ 91.52$ 36.58$ 128.10$ 20.49$ 6.87$ 27.36$ 112.01$ 43.45$ 155.46$ ?$ ?$ ?$RT$ GCS$ 20$ 76.44$ 36.58$ 113.02$ 15.44$ 6.42$ 21.86$ 91.88$ 43.01$ 134.89$ ?$ ?$ ?$ST$ Control$ 20$ 12.42$ 3.78$ 16.20$ 27.41$ 3.97$ 31.38$ 39.82$ 7.75$ 47.58$ ?$ ?$ ?$ST$ Control$ 20$ 13.57$ 4.54$ 18.11$ 27.52$ 3.91$ 31.43$ 41.09$ 8.45$ 49.54$ ?$ ?$ ?$ST$ Control$ 20$ 12.30$ 4.35$ 16.65$ 17.38$ 4.16$ 21.54$ 29.68$ 8.52$ 38.19$ ?$ ?$ ?$ST$ Control$ 20$ 12.76$ 4.80$ 17.56$ 29.83$ 4.42$ 34.24$ 42.59$ 9.21$ 51.80$ ?$ ?$ ?$RT$ Control$ 20$ 46.89$ 4.80$ 51.69$ 13.45$ 2.32$ 15.78$ 60.35$ 7.12$ 67.46$ ?$ ?$ ?$RT$ Control$ 20$ 45.28$ 5.50$ 50.77$ 12.30$ 2.38$ 14.69$ 57.58$ 7.88$ 65.46$ ?$ ?$ ?$RT$ Control$ 20$ 34.09$ 4.48$ 38.57$ 12.30$ 2.07$ 14.37$ 46.40$ 6.55$ 52.94$ ?$ ?$ ?$RT$ Control$ 20$ 41.82$ 7.53$ 49.35$ 7.69$ 2.26$ 9.95$ 49.51$ 9.79$ 59.29$ ?$ ?$ ?$ST$ LP$ 41$ 4.08$ 4.92$ 9.00$ 13.99$ 6.69$ 20.67$ 18.07$ 11.60$ 29.67$ 56.17$ 11.07$ 67.23$ST$ LP$ 41$ 5.99$ 4.07$ 10.06$ 6.11$ 6.22$ 12.34$ 12.10$ 10.30$ 22.39$ 37.88$ 7.68$ 45.56$ST$ LP$ 41$ 2.68$ 6.30$ 8.98$ 10.81$ 6.30$ 17.11$ 13.49$ 12.60$ 26.10$ 40.42$ 9.53$ 49.95$ST$ LP$ 41$ 6.11$ 7.84$ 13.95$ 16.27$ 5.53$ 21.80$ 22.38$ 13.37$ 35.76$ 83.09$ 17.68$ 100.76$RT$ LP$ 41$ 10.30$ 8.99$ 19.30$ 14.75$ 5.99$ 20.74$ 25.05$ 14.99$ 40.04$ 22.38$ 8.91$ 31.30$RT$ LP$ 41$ 26.30$ 5.69$ 31.99$ 8.91$ 9.38$ 18.28$ 35.21$ 15.06$ 50.27$ 44.99$ 7.99$ 52.98$RT$ LP$ 41$ 10.64$ 6.55$ 17.19$ 15.39$ 3.60$ 18.99$ 26.03$ 10.15$ 36.18$ 33.15$ 9.41$ 42.56$RT$ LP$ 41$ 10.88$ 10.59$ 21.47$ 7.20$ 4.34$ 11.54$ 18.08$ 14.93$ 33.01$ 28.17$ 25.59$ 53.76$
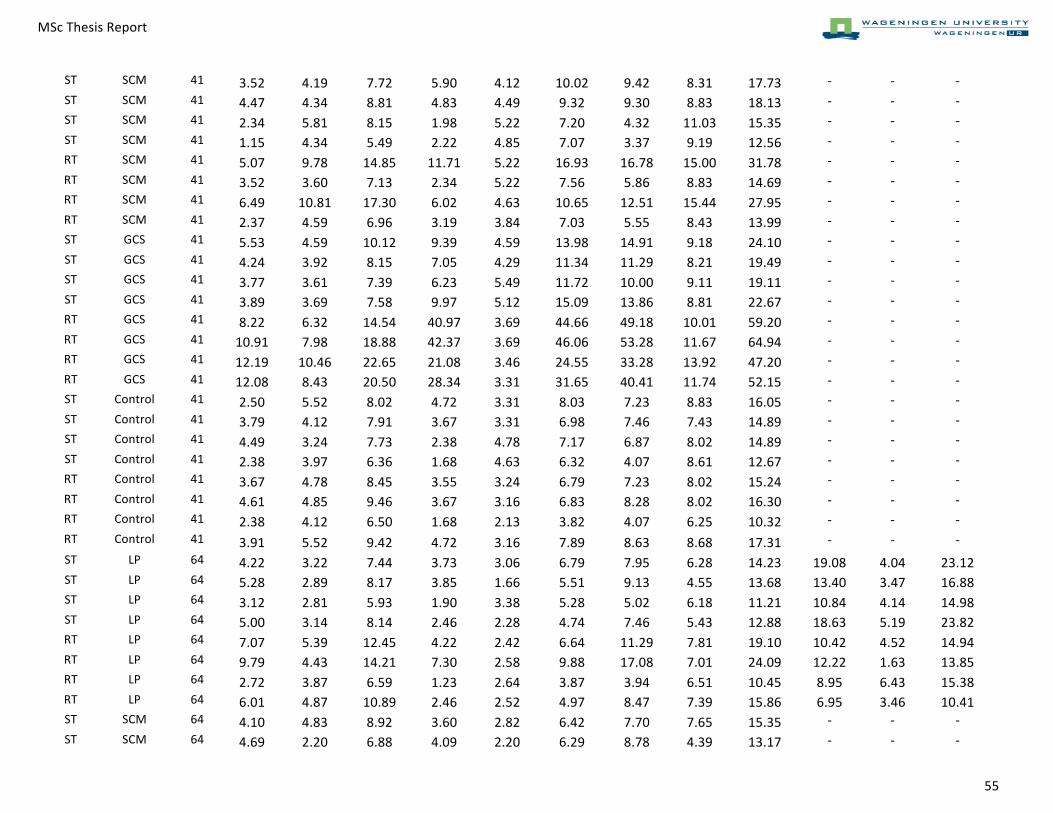
MSc$Thesis$Report$ $ $!$
$ 55$
ST$ SCM$ 41$ 3.52$ 4.19$ 7.72$ 5.90$ 4.12$ 10.02$ 9.42$ 8.31$ 17.73$ ?$ ?$ ?$ST$ SCM$ 41$ 4.47$ 4.34$ 8.81$ 4.83$ 4.49$ 9.32$ 9.30$ 8.83$ 18.13$ ?$ ?$ ?$ST$ SCM$ 41$ 2.34$ 5.81$ 8.15$ 1.98$ 5.22$ 7.20$ 4.32$ 11.03$ 15.35$ ?$ ?$ ?$ST$ SCM$ 41$ 1.15$ 4.34$ 5.49$ 2.22$ 4.85$ 7.07$ 3.37$ 9.19$ 12.56$ ?$ ?$ ?$RT$ SCM$ 41$ 5.07$ 9.78$ 14.85$ 11.71$ 5.22$ 16.93$ 16.78$ 15.00$ 31.78$ ?$ ?$ ?$RT$ SCM$ 41$ 3.52$ 3.60$ 7.13$ 2.34$ 5.22$ 7.56$ 5.86$ 8.83$ 14.69$ ?$ ?$ ?$RT$ SCM$ 41$ 6.49$ 10.81$ 17.30$ 6.02$ 4.63$ 10.65$ 12.51$ 15.44$ 27.95$ ?$ ?$ ?$RT$ SCM$ 41$ 2.37$ 4.59$ 6.96$ 3.19$ 3.84$ 7.03$ 5.55$ 8.43$ 13.99$ ?$ ?$ ?$ST$ GCS$ 41$ 5.53$ 4.59$ 10.12$ 9.39$ 4.59$ 13.98$ 14.91$ 9.18$ 24.10$ ?$ ?$ ?$ST$ GCS$ 41$ 4.24$ 3.92$ 8.15$ 7.05$ 4.29$ 11.34$ 11.29$ 8.21$ 19.49$ ?$ ?$ ?$ST$ GCS$ 41$ 3.77$ 3.61$ 7.39$ 6.23$ 5.49$ 11.72$ 10.00$ 9.11$ 19.11$ ?$ ?$ ?$ST$ GCS$ 41$ 3.89$ 3.69$ 7.58$ 9.97$ 5.12$ 15.09$ 13.86$ 8.81$ 22.67$ ?$ ?$ ?$RT$ GCS$ 41$ 8.22$ 6.32$ 14.54$ 40.97$ 3.69$ 44.66$ 49.18$ 10.01$ 59.20$ ?$ ?$ ?$RT$ GCS$ 41$ 10.91$ 7.98$ 18.88$ 42.37$ 3.69$ 46.06$ 53.28$ 11.67$ 64.94$ ?$ ?$ ?$RT$ GCS$ 41$ 12.19$ 10.46$ 22.65$ 21.08$ 3.46$ 24.55$ 33.28$ 13.92$ 47.20$ ?$ ?$ ?$RT$ GCS$ 41$ 12.08$ 8.43$ 20.50$ 28.34$ 3.31$ 31.65$ 40.41$ 11.74$ 52.15$ ?$ ?$ ?$ST$ Control$ 41$ 2.50$ 5.52$ 8.02$ 4.72$ 3.31$ 8.03$ 7.23$ 8.83$ 16.05$ ?$ ?$ ?$ST$ Control$ 41$ 3.79$ 4.12$ 7.91$ 3.67$ 3.31$ 6.98$ 7.46$ 7.43$ 14.89$ ?$ ?$ ?$ST$ Control$ 41$ 4.49$ 3.24$ 7.73$ 2.38$ 4.78$ 7.17$ 6.87$ 8.02$ 14.89$ ?$ ?$ ?$ST$ Control$ 41$ 2.38$ 3.97$ 6.36$ 1.68$ 4.63$ 6.32$ 4.07$ 8.61$ 12.67$ ?$ ?$ ?$RT$ Control$ 41$ 3.67$ 4.78$ 8.45$ 3.55$ 3.24$ 6.79$ 7.23$ 8.02$ 15.24$ ?$ ?$ ?$RT$ Control$ 41$ 4.61$ 4.85$ 9.46$ 3.67$ 3.16$ 6.83$ 8.28$ 8.02$ 16.30$ ?$ ?$ ?$RT$ Control$ 41$ 2.38$ 4.12$ 6.50$ 1.68$ 2.13$ 3.82$ 4.07$ 6.25$ 10.32$ ?$ ?$ ?$RT$ Control$ 41$ 3.91$ 5.52$ 9.42$ 4.72$ 3.16$ 7.89$ 8.63$ 8.68$ 17.31$ ?$ ?$ ?$ST$ LP$ 64$ 4.22$ 3.22$ 7.44$ 3.73$ 3.06$ 6.79$ 7.95$ 6.28$ 14.23$ 19.08$ 4.04$ 23.12$ST$ LP$ 64$ 5.28$ 2.89$ 8.17$ 3.85$ 1.66$ 5.51$ 9.13$ 4.55$ 13.68$ 13.40$ 3.47$ 16.88$ST$ LP$ 64$ 3.12$ 2.81$ 5.93$ 1.90$ 3.38$ 5.28$ 5.02$ 6.18$ 11.21$ 10.84$ 4.14$ 14.98$ST$ LP$ 64$ 5.00$ 3.14$ 8.14$ 2.46$ 2.28$ 4.74$ 7.46$ 5.43$ 12.88$ 18.63$ 5.19$ 23.82$RT$ LP$ 64$ 7.07$ 5.39$ 12.45$ 4.22$ 2.42$ 6.64$ 11.29$ 7.81$ 19.10$ 10.42$ 4.52$ 14.94$RT$ LP$ 64$ 9.79$ 4.43$ 14.21$ 7.30$ 2.58$ 9.88$ 17.08$ 7.01$ 24.09$ 12.22$ 1.63$ 13.85$RT$ LP$ 64$ 2.72$ 3.87$ 6.59$ 1.23$ 2.64$ 3.87$ 3.94$ 6.51$ 10.45$ 8.95$ 6.43$ 15.38$RT$ LP$ 64$ 6.01$ 4.87$ 10.89$ 2.46$ 2.52$ 4.97$ 8.47$ 7.39$ 15.86$ 6.95$ 3.46$ 10.41$ST$ SCM$ 64$ 4.10$ 4.83$ 8.92$ 3.60$ 2.82$ 6.42$ 7.70$ 7.65$ 15.35$ ?$ ?$ ?$ST$ SCM$ 64$ 4.69$ 2.20$ 6.88$ 4.09$ 2.20$ 6.29$ 8.78$ 4.39$ 13.17$ ?$ ?$ ?$
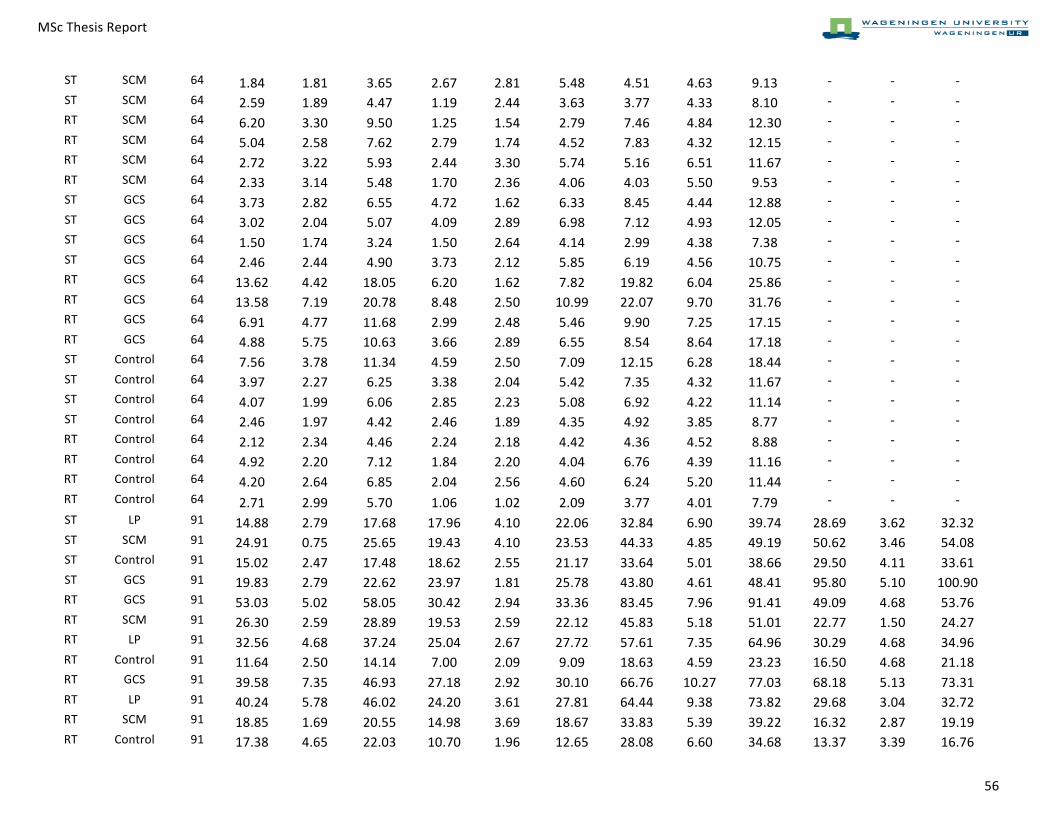
MSc$Thesis$Report$ $ $!$
$ 56$
ST$ SCM$ 64$ 1.84$ 1.81$ 3.65$ 2.67$ 2.81$ 5.48$ 4.51$ 4.63$ 9.13$ ?$ ?$ ?$ST$ SCM$ 64$ 2.59$ 1.89$ 4.47$ 1.19$ 2.44$ 3.63$ 3.77$ 4.33$ 8.10$ ?$ ?$ ?$RT$ SCM$ 64$ 6.20$ 3.30$ 9.50$ 1.25$ 1.54$ 2.79$ 7.46$ 4.84$ 12.30$ ?$ ?$ ?$RT$ SCM$ 64$ 5.04$ 2.58$ 7.62$ 2.79$ 1.74$ 4.52$ 7.83$ 4.32$ 12.15$ ?$ ?$ ?$RT$ SCM$ 64$ 2.72$ 3.22$ 5.93$ 2.44$ 3.30$ 5.74$ 5.16$ 6.51$ 11.67$ ?$ ?$ ?$RT$ SCM$ 64$ 2.33$ 3.14$ 5.48$ 1.70$ 2.36$ 4.06$ 4.03$ 5.50$ 9.53$ ?$ ?$ ?$ST$ GCS$ 64$ 3.73$ 2.82$ 6.55$ 4.72$ 1.62$ 6.33$ 8.45$ 4.44$ 12.88$ ?$ ?$ ?$ST$ GCS$ 64$ 3.02$ 2.04$ 5.07$ 4.09$ 2.89$ 6.98$ 7.12$ 4.93$ 12.05$ ?$ ?$ ?$ST$ GCS$ 64$ 1.50$ 1.74$ 3.24$ 1.50$ 2.64$ 4.14$ 2.99$ 4.38$ 7.38$ ?$ ?$ ?$ST$ GCS$ 64$ 2.46$ 2.44$ 4.90$ 3.73$ 2.12$ 5.85$ 6.19$ 4.56$ 10.75$ ?$ ?$ ?$RT$ GCS$ 64$ 13.62$ 4.42$ 18.05$ 6.20$ 1.62$ 7.82$ 19.82$ 6.04$ 25.86$ ?$ ?$ ?$RT$ GCS$ 64$ 13.58$ 7.19$ 20.78$ 8.48$ 2.50$ 10.99$ 22.07$ 9.70$ 31.76$ ?$ ?$ ?$RT$ GCS$ 64$ 6.91$ 4.77$ 11.68$ 2.99$ 2.48$ 5.46$ 9.90$ 7.25$ 17.15$ ?$ ?$ ?$RT$ GCS$ 64$ 4.88$ 5.75$ 10.63$ 3.66$ 2.89$ 6.55$ 8.54$ 8.64$ 17.18$ ?$ ?$ ?$ST$ Control$ 64$ 7.56$ 3.78$ 11.34$ 4.59$ 2.50$ 7.09$ 12.15$ 6.28$ 18.44$ ?$ ?$ ?$ST$ Control$ 64$ 3.97$ 2.27$ 6.25$ 3.38$ 2.04$ 5.42$ 7.35$ 4.32$ 11.67$ ?$ ?$ ?$ST$ Control$ 64$ 4.07$ 1.99$ 6.06$ 2.85$ 2.23$ 5.08$ 6.92$ 4.22$ 11.14$ ?$ ?$ ?$ST$ Control$ 64$ 2.46$ 1.97$ 4.42$ 2.46$ 1.89$ 4.35$ 4.92$ 3.85$ 8.77$ ?$ ?$ ?$RT$ Control$ 64$ 2.12$ 2.34$ 4.46$ 2.24$ 2.18$ 4.42$ 4.36$ 4.52$ 8.88$ ?$ ?$ ?$RT$ Control$ 64$ 4.92$ 2.20$ 7.12$ 1.84$ 2.20$ 4.04$ 6.76$ 4.39$ 11.16$ ?$ ?$ ?$RT$ Control$ 64$ 4.20$ 2.64$ 6.85$ 2.04$ 2.56$ 4.60$ 6.24$ 5.20$ 11.44$ ?$ ?$ ?$RT$ Control$ 64$ 2.71$ 2.99$ 5.70$ 1.06$ 1.02$ 2.09$ 3.77$ 4.01$ 7.79$ ?$ ?$ ?$ST$ LP$ 91$ 14.88$ 2.79$ 17.68$ 17.96$ 4.10$ 22.06$ 32.84$ 6.90$ 39.74$ 28.69$ 3.62$ 32.32$ST$ SCM$ 91$ 24.91$ 0.75$ 25.65$ 19.43$ 4.10$ 23.53$ 44.33$ 4.85$ 49.19$ 50.62$ 3.46$ 54.08$ST$ Control$ 91$ 15.02$ 2.47$ 17.48$ 18.62$ 2.55$ 21.17$ 33.64$ 5.01$ 38.66$ 29.50$ 4.11$ 33.61$ST$ GCS$ 91$ 19.83$ 2.79$ 22.62$ 23.97$ 1.81$ 25.78$ 43.80$ 4.61$ 48.41$ 95.80$ 5.10$ 100.90$RT$ GCS$ 91$ 53.03$ 5.02$ 58.05$ 30.42$ 2.94$ 33.36$ 83.45$ 7.96$ 91.41$ 49.09$ 4.68$ 53.76$RT$ SCM$ 91$ 26.30$ 2.59$ 28.89$ 19.53$ 2.59$ 22.12$ 45.83$ 5.18$ 51.01$ 22.77$ 1.50$ 24.27$RT$ LP$ 91$ 32.56$ 4.68$ 37.24$ 25.04$ 2.67$ 27.72$ 57.61$ 7.35$ 64.96$ 30.29$ 4.68$ 34.96$RT$ Control$ 91$ 11.64$ 2.50$ 14.14$ 7.00$ 2.09$ 9.09$ 18.63$ 4.59$ 23.23$ 16.50$ 4.68$ 21.18$RT$ GCS$ 91$ 39.58$ 7.35$ 46.93$ 27.18$ 2.92$ 30.10$ 66.76$ 10.27$ 77.03$ 68.18$ 5.13$ 73.31$RT$ LP$ 91$ 40.24$ 5.78$ 46.02$ 24.20$ 3.61$ 27.81$ 64.44$ 9.38$ 73.82$ 29.68$ 3.04$ 32.72$RT$ SCM$ 91$ 18.85$ 1.69$ 20.55$ 14.98$ 3.69$ 18.67$ 33.83$ 5.39$ 39.22$ 16.32$ 2.87$ 19.19$RT$ Control$ 91$ 17.38$ 4.65$ 22.03$ 10.70$ 1.96$ 12.65$ 28.08$ 6.60$ 34.68$ 13.37$ 3.39$ 16.76$
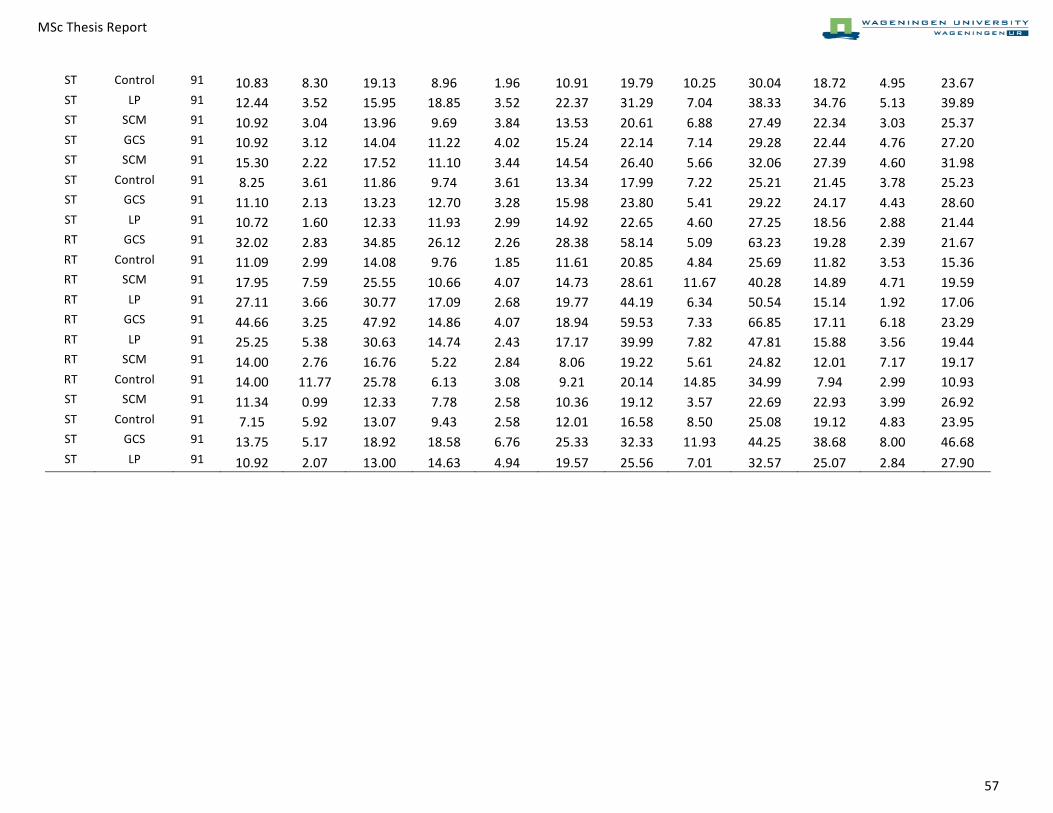
MSc$Thesis$Report$ $ $!$
$ 57$
ST$ Control$ 91$ 10.83$ 8.30$ 19.13$ 8.96$ 1.96$ 10.91$ 19.79$ 10.25$ 30.04$ 18.72$ 4.95$ 23.67$ST$ LP$ 91$ 12.44$ 3.52$ 15.95$ 18.85$ 3.52$ 22.37$ 31.29$ 7.04$ 38.33$ 34.76$ 5.13$ 39.89$ST$ SCM$ 91$ 10.92$ 3.04$ 13.96$ 9.69$ 3.84$ 13.53$ 20.61$ 6.88$ 27.49$ 22.34$ 3.03$ 25.37$ST$ GCS$ 91$ 10.92$ 3.12$ 14.04$ 11.22$ 4.02$ 15.24$ 22.14$ 7.14$ 29.28$ 22.44$ 4.76$ 27.20$ST$ SCM$ 91$ 15.30$ 2.22$ 17.52$ 11.10$ 3.44$ 14.54$ 26.40$ 5.66$ 32.06$ 27.39$ 4.60$ 31.98$ST$ Control$ 91$ 8.25$ 3.61$ 11.86$ 9.74$ 3.61$ 13.34$ 17.99$ 7.22$ 25.21$ 21.45$ 3.78$ 25.23$ST$ GCS$ 91$ 11.10$ 2.13$ 13.23$ 12.70$ 3.28$ 15.98$ 23.80$ 5.41$ 29.22$ 24.17$ 4.43$ 28.60$ST$ LP$ 91$ 10.72$ 1.60$ 12.33$ 11.93$ 2.99$ 14.92$ 22.65$ 4.60$ 27.25$ 18.56$ 2.88$ 21.44$RT$ GCS$ 91$ 32.02$ 2.83$ 34.85$ 26.12$ 2.26$ 28.38$ 58.14$ 5.09$ 63.23$ 19.28$ 2.39$ 21.67$RT$ Control$ 91$ 11.09$ 2.99$ 14.08$ 9.76$ 1.85$ 11.61$ 20.85$ 4.84$ 25.69$ 11.82$ 3.53$ 15.36$RT$ SCM$ 91$ 17.95$ 7.59$ 25.55$ 10.66$ 4.07$ 14.73$ 28.61$ 11.67$ 40.28$ 14.89$ 4.71$ 19.59$RT$ LP$ 91$ 27.11$ 3.66$ 30.77$ 17.09$ 2.68$ 19.77$ 44.19$ 6.34$ 50.54$ 15.14$ 1.92$ 17.06$RT$ GCS$ 91$ 44.66$ 3.25$ 47.92$ 14.86$ 4.07$ 18.94$ 59.53$ 7.33$ 66.85$ 17.11$ 6.18$ 23.29$RT$ LP$ 91$ 25.25$ 5.38$ 30.63$ 14.74$ 2.43$ 17.17$ 39.99$ 7.82$ 47.81$ 15.88$ 3.56$ 19.44$RT$ SCM$ 91$ 14.00$ 2.76$ 16.76$ 5.22$ 2.84$ 8.06$ 19.22$ 5.61$ 24.82$ 12.01$ 7.17$ 19.17$RT$ Control$ 91$ 14.00$ 11.77$ 25.78$ 6.13$ 3.08$ 9.21$ 20.14$ 14.85$ 34.99$ 7.94$ 2.99$ 10.93$ST$ SCM$ 91$ 11.34$ 0.99$ 12.33$ 7.78$ 2.58$ 10.36$ 19.12$ 3.57$ 22.69$ 22.93$ 3.99$ 26.92$ST$ Control$ 91$ 7.15$ 5.92$ 13.07$ 9.43$ 2.58$ 12.01$ 16.58$ 8.50$ 25.08$ 19.12$ 4.83$ 23.95$ST$ GCS$ 91$ 13.75$ 5.17$ 18.92$ 18.58$ 6.76$ 25.33$ 32.33$ 11.93$ 44.25$ 38.68$ 8.00$ 46.68$ST$ LP$ 91$ 10.92$ 2.07$ 13.00$ 14.63$ 4.94$ 19.57$ 25.56$ 7.01$ 32.57$ 25.07$ 2.84$ 27.90$
!!!