Foliar application of potassium and moringa leaf ... - PLOS ONE
Upload
khangminh22Category
view
5download
0
1
Vol.:(0123456789)
Scientific Reports | (2022) 12:3161 | https://doi.org/10.1038/s41598-022-07148-w
www.nature.com/scientificreports
Double zero tillage and foliar phosphorus fertilization coupled with microbial inoculants enhance maize productivity and quality in a maize–wheat rotationM. N. Harish1,14, Anil K. Choudhary1,2,14*, Sandeep Kumar3, Anchal Dass1, V. K. Singh1,4, V. K. Sharma1, T. Varatharajan1, M. K. Dhillon1, Seema Sangwan5, V. K. Dua2, S. D. Nitesh6, M. Bhavya7, S. Sangwan1, Shiv Prasad1, Adarsh Kumar1,8, S. K. Rajpoot1,9, Gaurendra Gupta1,10, Prakash Verma1,11, Anil Kumar12 & S. George13
Maize is an important industrial crop where yield and quality enhancement both assume greater importance. Clean production technologies like conservation agriculture and integrated nutrient management hold the key to enhance productivity and quality besides improving soil health and environment. Hence, maize productivity and quality were assessed under a maize–wheat cropping system (MWCS) using four crop-establishment and tillage management practices [FBCT–FBCT (Flat bed–conventional tillage both in maize and wheat); RBCT–RBZT (Raised bed–CT in maize and raised bed–zero tillage in wheat); FBZT–FBZT (FBZT both in maize and wheat); PRBZT–PRBZT (Permanent raised bed–ZT both in maize and wheat], and five P-fertilization practices [P100 (100% soil applied-P); P50 + 2FSP (50% soil applied-P + 2 foliar-sprays of P through 2% DAP both in maize and wheat); P50 + PSB + AM-fungi; P50 + PSB + AMF + 2FSP; and P0 (100% NK with no-P)] in split-plot design replicated-thrice. Double zero-tilled PRBZT–PRBZT system significantly enhanced the maize grain, starch, protein and oil yield by 13.1–19% over conventional FBCT–FBCT. P50 + PSB + AMF + 2FSP, integrating soil applied-P, microbial-inoculants and foliar-P, had significantly higher grain, starch, protein and oil yield by 12.5–17.2% over P100 besides saving 34.7% fertilizer-P both in maize and on cropping-system basis. P50 + PSB + AMF + 2FSP again had significantly higher starch, lysine and tryptophan content by 4.6–10.4% over P100 due to sustained and synchronized P-bioavailability. Higher amylose content (24.1%) was observed in grains under P50 + PSB + AMF + 2FSP, a beneficial trait due to its lower glycemic-index highly required for diabetic patients, where current COVID-19 pandemic further necessitated the use of such dietary ingredients. Double zero-tilled PRBZT–PRBZT reported greater MUFA (oleic acid, 37.1%), MUFA: PUFA ratio and P/S index with 6.9% higher P/S index in corn-oil (an oil quality parameter highly required for heart-health) over RBCT-RBCT. MUFA, MUFA: PUFA ratio and P/S index were also higher under P50 + PSB + AMF + 2FSP; avowing the obvious role of foliar-P and microbial-inoculants in influencing maize fatty acid composition.
OPEN
1ICAR–Indian Agricultural Research Institute, New Delhi 110 012, India. 2ICAR–Central Potato Research Institute, Shimla, Himachal Pradesh 171 001, India. 3ICAR–National Bureau of Plant Genetic Resources, New Delhi 110012, India. 4ICAR–Central Research Institute for Dryland Agriculture, Hyderabad 500 059, India. 5CCS Haryana Agricultural University, Hisar, Haryana 125 004, India. 6CSA University of Agriculture & Technology, Kanpur, Uttar Pradesh 208 002, India. 7University of Agricultural & Horticultural Sciences, Shivamogga, Karnataka 577 204, India. 8ICAR-National Bureau of Agriculturally Important Microorganisms, Kushmaur, Mau, Uttar Pradesh 275 103, India. 9Institute of Agricultural Sciences, Banaras Hindu University, Varanasi, Uttar Pradesh 221 005, India. 10ICAR–Indian Grassland and Fodder Research Institute, Jhansi, Uttar Pradesh 284 003, India. 11ICAR-National Dairy Research Institute, Karnal, Haryana 132 001, India. 12Farm Science Centre, GAD Veterinary and Animal Sciences University, Tarn Taran, Punjab 143 412, India. 13Farm Science Centre, ICAR-Indian Institute of Horticultural Research, Gonikoppal, Karnataka 571213, India. 14These authors contributed equally: M. N. Harish and Anil K. Choudhary. *email: [email protected]
2
Vol:.(1234567890)
Scientific Reports | (2022) 12:3161 | https://doi.org/10.1038/s41598-022-07148-w
www.nature.com/scientificreports/
Overall, double zero-tilled PRBZT–PRBZT with crop residue retention at 6 t/ha per year along with P50 + PSB + AMF + 2FSP while saving 34.7% fertilizer-P in MWCS, may prove beneficial in enhancing maize productivity and quality so as to reinforce the food and nutritional security besides boosting food, corn-oil and starch industry in south-Asia and collateral arid agro-ecologies across the globe.
AbbreviationsAMF Arbuscular mycorrhizal fungiCA Conservation agricultureCETM Crop establishment and tillage managementCPTs Clean production technologiesCRR Crop residue retentionC18:1 Oleic acidC18:2 Linoleic acidC16:0 Palmitic acidC18:0 Stearic acidCT Conventional tillageDAP Di-ammonium phosphateEC Electrical conductivityFBCT Flat bed–conventional tillageFBZT Flat bed–zero tillage2FSP Two foliar sprays of phosphorusha HectareIGPR Indo-Gangetic Plains RegionK PotassiumKHS Knee-high stage in maizem Meterm ha Million hectaresMt Million tonnesMWCS Maize–wheat cropping systemMUFA Monounsaturated fatty acidN NitrogenODR Oleic desaturation ratioP PhosphorusP0 No-phosphorusP50 50% recommended dose of P (as basal)P100 100% recommended dose of P (as basal)PUE Phosphorus-use efficiencyPRBZT Permanent raised bed–zero tillagePSB Phosphorus solubilizing bacteriaPUFA Polyunsaturated fatty acidPUE Phosphorus-use efficiencyP/S index PUFA/SFA ratioRBCT Raised bed–conventional tillageRWCS Rice–wheat cropping systemSFA Saturated fatty acidSOC Soil organic carbont TonnesTS Tillering stage in wheatUFA Unsaturated fatty acidZT Zero tillage
Under the aegis of United Nations Sustainable Development Goals (SDGs), there is an urgent need to focus both on food and nutritional quality enhancement for eradication of all types of hunger and malnutrition by 2030 especially in under-developed countries1. We already know that rice–wheat cropping system (RWCS), a major system in south-Asia in general and India in particular, is a major contributor to the food and nutritional security of the region2,3. However, intensive agriculture practices under RWCS especially in the Indo-Gangetic Plains Region (IGPR) coupled with intensive conventional tillage4,5, sole use of chemical fertilizers6–8, over-exploitation of groundwater9, and in situ crop residue burning10,11; has led to stagnation in productivity with impaired qual-ity, sub-soil compaction, soil health deterioration, groundwater depletion and gradual degradation of natural resource-base11,12. The escalating labour, capital, and energy requirements4 coupled with receding groundwater table (~ 0.30–0.40 m year−1)13, erratic rainfall pattern and intermittent droughts5, has further triggered the chronic fatigue in RWCS in south-Asian IGPR for over last three decades5,11. Rice and wheat crops’ residue burning has also long been a major cause of air pollution releasing huge gaseous emission in northern India10,14, impairing soil and human health and environment15. To deter these ill-effects, crop diversification and conservation agri-culture (CA) are two viable options4,16, over the policy backed conventional RWCS17. Bringing National Policy for Management of Crop Residues18 in India is again a timely effort which stresses upon in-situ residue management through CA and other sustainable residue management methods19. Hence, research priorities integrating clean

3
Vol.:(0123456789)
Scientific Reports | (2022) 12:3161 | https://doi.org/10.1038/s41598-022-07148-w
www.nature.com/scientificreports/
production technologies (CPTs) viz. CA, best nutrient management practices and crop diversification should be set-up to avert these production- and resource vulnerabilities in IGPR17,20,21. Overall, this study heeds to the SDGs of the United Nations (with respect to land degradation neutrality and land restoration) from exploitation to the sustainable use of resources22,23, and soil health management24,25; so as to end hunger, achieve food security and improved nutrition, and promote sustainable agriculture as per SDG226. The climate-resilient conservation agriculture which follows minimal soil disturbance, crop residue retention and crop rotations6,27, have been advocated to significantly improve the soil organic matter and soil health in holistic manner besides enhanced resource-use efficiency and crop yields in the vulnerable agro-ecologies across the globe8,21,28–35. Since, maize is one of the important cereal crops in south-Asia after rice and wheat, with the consumption of ~ 39.4 Mt maize grains in the region where India alone consumes ~ 24 Mt maize grains36. Hence, in order to safeguard the food security of millions of south-Asian families, maize farming tailored with CA practices followed in maize–wheat cropping system (MWCS) may prove as viable alternative to diversify the RWCS and boosting the productivity while concurrently conserving the soil, environment and natural resources21,27,37.
Globally, maize (Zea mays L.) is grown in ~ 193.7 m ha area producing ~ 1147.6 Mt grains with an average yield of 5.92 t ha−1 36. Alone in India, maize is grown on ~ 9.2 m ha area producing 27.8 Mt grains but with poor productivity ~ 3.05 t ha−1 36, and quality38. Maize is popularly known as queen of the cereals because of its high yield potential and wider adaptability to diverse agro-ecologies39. Maize is a vital crop for food and nutritional security in world’s poorest regions in Asia, Africa and Latin America1,40. Worldwide, maize is consumed in ~ 94 developing countries comprising > 4.5 billion people where it supplies ~ 30% of total calorie needs. Maize grain is a good source of high quality starch41; while its oil contains essential polyunsaturated fatty acids (PUFAs) that are highly beneficial in the management of cardiovascular diseases due to their vital role in blood cholesterol regulation and lowering of elevated blood pressure38,42. Maize is a versatile industrial crop processed into various food and non-food products viz. starch, vegetable oil, sweeteners, beverages, glue, alcohol and bioethanol, etc. Alone in India, ~ 20% of total maize consumption is utilized for non-food industrial product development, ~ 14% of which is solely utilized in starch manufacturing for pharmaceutical, textile, paper and food industry uses43. Likewise, higher amylose content in maize grains is a beneficial trait as it contains resistant starch (RS) type-2 with low glycemic index44, which is high demand in food industry for diabetic patients45. Current COVID-19 pandemic has further necessitated the management of this major comorbidity factor (diabetes) using such dietary ingredients46. For meeting global edible oil demands, maize is again a vital alternative containing ~ 3–4% oils in maize germ, an oil-rich part of maize kernel47,48. Corn oil is a rich source of linoleic acid (essential fatty acid), which is one of the two essential acids necessary for the integrity of the skin, cell membranes and immune system and for synthesis of eicosanoids necessary for reproductive, cardiovascular, renal, gastrointestinal functions and resistance to the diseases besides being highly effective in lowering the serum cholesterol primarily low-density-lipoprotein cholesterol49. Overall, maize grains with higher starch, oil and protein content are in high demand in food and non-food industry43,50. However, lysine and tryptophan are the deficient amino acids in cereals like maize which are essential for making the building blocks of human body. The crop productivity and quality can be increased through appropriate best plant nutrition17, bio-fortification approaches51, and agronomic practices like CA33,52,53 besides using breeding tools54. Hence, maize productivity and quality enhancement through agronomic approaches assumes utmost importance in curtailing the hunger and malnutrition besides promoting its indus-trial usages55. As, ~ 73% of total global maize area is located in developing world, hence, improved productivity and quality traits through low-cost CPTs may open new vistas for maize growers and agri-entrepreneurs to fetch higher prices for quality maize produce in food and industrial sectors.
Phosphorus (P) is one of the most important nutrient elements which plays an important role in enhancing the productivity and quality while influencing various plant processes like energy storage and transfer, photo-synthesis, root growth, flowering, seed setting and seed yield, etc.56–58. Due to poor native-P status, low solubility and low efficiency ~ 10–20% across the majority of global arable soils, the P is a critical nutrient that greatly limits plant growth, yield and quality57,59. In order to improve the productivity, quality and P-use efficiency (PUE) in this high nutrient requiring crop due to its high yield potential, devising efficient P management strategies with integration of soil applied P-fertilizers, biofertilizers and innovative approaches like foliar-P fertilization that too under CA based systems, may assume utmost importance. Alluvial soils in Indian IGPR are characterized as most fertile soils but now majority of them are diagnosed with low soil-P status60. The P-fertilizers are already very costly and the most of the soil applied-P gives low PUE with fate of native and applied-P being fixed as Ca and Mg phosphate in alkaline soils of IGPR60. Phosphorus-solubilizing bacteria (PSB) and AM-fungi also hold great potential in solubilization and mobilization of native and applied-P51,61. Foliar P-fertilization has also shown positive influence on crop productivity and quality in many crops58,62. Thus, foliar-P fertilization along with microbial inoculants may prove as a low-cost CPT in nutrient exhaustive crops like maize to harness higher yield with better quality and PUE besides saving soil applied-P. However, the impacts of conservation agriculture coupled with this innovative P-management strategy integrating soil applied P, foliar-P and microbial inoculants in maize–wheat cropping system are yet to be evaluated with respect to maize productivity and quality parameters (starch, protein, amino acid and fatty acid composition) that too under South-Asian semi-arid climate. Overall, the CPTs like conservation agriculture along with foliar-P fertilization may enhance both productivity and quality to augment its safe food and industrial uses besides improving soil health and environment. However, no systematic research work has been carried-out till date to assess the impact of such climate-resilient CPTs especially CA and the innovative foliar-P fertilization on quality parameters of maize in a semi-arid agro-ecology. Therefore, this study assessed the impacts of the CA based crop establishment and tillage management (CETM) and microbial inoculants’ imbedded P-fertilization practices on maize yield and grain quality under MWCS so as to scale-up the food and nutrition security under the precept of United Nations SDGs, besides augmenting its safe food and industrial uses in blooming food, starch and corn-oil industry in south-Asia.

4
Vol:.(1234567890)
Scientific Reports | (2022) 12:3161 | https://doi.org/10.1038/s41598-022-07148-w
www.nature.com/scientificreports/
ResultsMaize grain yield. Maize grain yield was significantly (p < 0.05) influenced by the crop establishment and tillage management practices (CETMs) as well as P-fertilization practices (PFPs) during both years (Fig. 1). The double zero-tilled permanent raised-beds with crop residue retention of 6 t ha−1 per year under treatment PRBZT–PRBZT in MWCS resulted in significantly higher mean maize grain yield (6.13 t ha−1) by 6.4, 5.7 and 13.1% over RBCT–RBZT, FBZT–FBZT and FBCT–FBCT. The integration of 50% P + PSB + AMF + 2FSP, a com-bination of soil applied-P, microbial inoculants and the two foliar-P sprays (2% DAP), observed significantly (p < 0.05) higher grain yield (6.3 t ha−1) by 5.4, 8.3, 11.3 and 17.5% over P50 + PSB + AMF, P50 + 2FSP, P100 and P0, respectively. However, P50 + 2FSP, P50 + PSB + AMF and P100 treatments were statistically at par with each other. The interaction effects between the CETMs and PFPs were found significant in the current study (Supplemen-tary Table S1). On an average, PRBZT–PRBZT and P50 + PSB + AMF + 2FSP exhibited ~ 13.1 and 11.3% higher maize grain yield over their respective counterpart treatments FBCT–FBCT (conventional-tilled FB system both in maize and wheat) and the P100 (100% soil applied-P), respectively (Fig. 1).
Starch content and starch yield. The CETMs exhibited higher magnitude of starch content (65.1–67.2%) in maize grains under CA plots (PRBZT–PRBZT, FBZT–FBZT, RBCT–RBZT) compared to 64.4% in the conventional-tilled FB system (FBCT–FBCT) (Table 1). Likewise, maize under raised-beds (PRBZT–PRBZT,
3
3.5
4
4.5
5
5.5
6
6.5
7
FBCT–FBCT RBCT–RBZT FBZT–FBZT PRBZT–PRBZT
Gra
in y
ield
(t h
a-1)
Crop establishment methods
Grain yield 2018 Grain yield 2019 Grain yield Mean
a
3
3.5
4
4.5
5
5.5
6
6.5
7
P100 P50+2FSP P50+PSB+AMF P50+PSB+AMF+2FSP P0
Gra
in y
ield
(t h
a-1)
Phosphorus fertilization practices
Grain yield 2018 Grain yield 2019 Grain yield Mean
b
Figure 1. Influence of (a) CETM and (b) P-fertilization practices on grain yield (t ha−1) of maize under MWCS. The vertical bars represent LSD0.05 values.

5
Vol.:(0123456789)
Scientific Reports | (2022) 12:3161 | https://doi.org/10.1038/s41598-022-07148-w
www.nature.com/scientificreports/
RBCT–RBZT) exhibited higher starch content (~ 66.2%) compared to ~ 64.9% under flat-beds (FBZT–FBZT, FBCT–FBCT) irrespective of the tillage practices.
Among PFPs, significantly (p < 0.05) higher starch content (68.9%) were obtained by applying P50 + PSB + AMF + 2FSP followed by P50 + 2FSP (67.1%) and least under P0 (61.6%). Despite of non-significant effect of CETMs on starch content, the starch yield was significantly (p < 0.05) influenced by both CETMs and PFPs with significantly (p < 0.05) higher values under PRBZT–PRBZT (4157 kg ha−1), a double zero-tilled PRB system, and the P50 + PSB + AMF + 2FSP (4350 kg ha−1), a combination of soil applied-P, microbial inoculants and the two foliar-P sprays (Table 1). On an average, PRBZT–PRBZT and P50 + PSB + AMF + 2FSP reported ~ 18.6 and 16.8% higher starch yield over their respective counterpart treatments FBCT–FBCT and P100, respectively (Table 1).
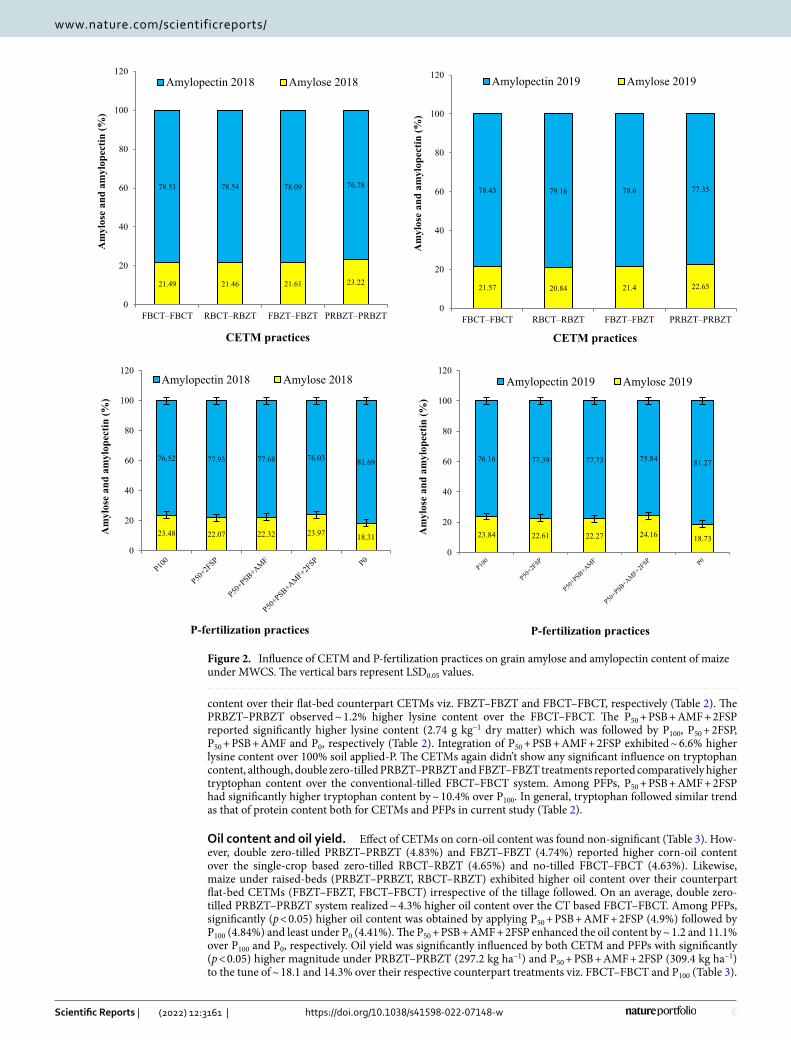
Amylose and amylopectin content. The CETMs did not show any significant influence on the amyl-ose content while PFPs exhibited significant effect (p < 0.05) on the amylose content in maize grains during both years (Fig. 2). Under CETMs, highest amylose content (23%) were reported under PRBZT–PRBZT while other treatments exhibited ~ 21.2–21.5% amylose content. Integration of P50 + PSB + AMF + 2FSP resulted in sig-nificantly (p < 0.05) higher amylose content (24.1%) which was followed by P100, P50 + 2FSP, P50 + PSB + AMF and P0, respectively (Fig. 2). On an average, PRBZT–PRBZT and P50 + PSB + AMF + 2FSP exhibited ~ 6.5 and 1.7% higher amylose content over the FBCT–FBCT and P100, respectively. The PFPs again exhibited significant effect (p < 0.05) on amylopectin content while CETMs did not show any significant influence on amylopectin content during both years (Fig. 2). The amylopectin followed the reverse trend as that of amylose content both for CETMs and PFPs. Highest amylopectin content was achieved under RBCT–RBZT (78.9%) and least under PRBZT–PRBZT (77.1%). The P0 exhibited significantly (p < 0.05) higher amylopectin content (81.5%) while P50 + PSB + AMF + 2FSP exhibited least values (75.9%).
Protein content and protein yield. The CETMs had non-significant influence on protein content in maize grains during first year; however the effects were significant (p < 0.05) during second year (Table 1), where CA-based CETMs (PRBZT–PRBZT, FBZT–FBZT, RBCT–RBZT) had higher protein content (9.2–9.33%) com-pared to FBCT–FBCT (8.88%). Maize grown on raised-beds (PRBZT–PRBZT, RBCT–RBZT) exhibited higher protein content compared to flat-beds (FBZT–FBZT, FBCT–FBCT) during both years. Double zero-tilled PRBZT–PRBZT system produced ~ 5.1% higher protein content compared to conventional-tilled FBCT–FBCT system. Among PFPs, P50 + PSB + AMF + 2FSP exhibited significantly (p < 0.05) higher protein content (9.59%) which was followed by P50 + 2FSP with lowest magnitude under P0 (9.46%) during the study. The integration of P50 + PSB + AMF + 2FSP enhanced the protein content by ~ 3.9% over the recommended PFP (P100). The CETMs and PFPs both had significant (p < 0.05) influence on protein yield following the similar trend as that of grain yield where PRBZT–PRBZT and P50 + PSB + AMF + 2FSP both produced significantly superior protein yield dur-ing both years (Table 1). However, the interaction effects between the CETMs and PFPs for the protein yield were found to be significant only during second year (Supplementary Table S2). On an average, PRBZT–PRBZT and P50 + PSB + AMF + 2FSP exhibited ~ 19 and 17.2% higher protein yield over their respective counterpart treat-ments viz. FBCT–FBCT and P100, respectively (Table 1).
Lysine and tryptophan content. The CETMs did not have any significant effect on the lysine content in maize grains, however, the raised-bed CETMs viz. PRBZT–PRBZT and RBCT-RBZT produced higher lysine
Table 1. Influence of CETM and P-fertilization practices on grain starch content (%), starch yield (kg ha−1), protein content (%) and protein yield (kg ha−1) in maize under MWCS. CD values indicate the critical difference at p = 0.05.
Treatment
Starch (%) Starch yield (kg ha−1) Protein content (%) Protein yield (kg ha−1)
2018 2019 Mean 2018 2019 Mean 2018 2019 Mean 2018 2019 Mean
CETM practices
FBCT–FBCT 64.5 64.2 64.4 3511 3494 3503 8.85 8.91 8.88 481.4 483.0 482.2
RBCT–RBZT 65.5 64.6 65.1 3774 3836 3805 9.18 9.22 9.20 527.8 538.2 533.0
FBZT–FBZT 65.5 65.3 65.4 3752 3798 3775 9.12 9.38 9.25 520.6 543.3 531.9
PRBZT–PRBZT 67.4 67.0 67.2 4113 4202 4157 9.17 9.50 9.33 558.3 589.5 573.9
CD (p = 0.05) NS NS NS 362 438 307 NS 0.30 0.3 34.0 49.4 29.1
P–fertilization practices
P100 66.3 65.9 66.1 3681 3767 3724 9.10 9.35 9.23 505.2 528.0 516.6
P50 + 2FSP 67.0 67.1 67.0 3854 3914 3884 9.30 9.62 9.46 535.9 560.5 548.2
P50 + PSB + AMF 64.9 65.3 65.1 3855 3906 3881 9.23 9.43 9.33 548.2 563.6 555.9
P50 + PSB + AMF + 2FSP 68.6 69.2 68.9 4288 4413 4350 9.48 9.70 9.59 591.9 619.8 605.6
P0 62.1 61.0 61.5 3260 3163 3211 8.28 8.15 8.22 428.9 421.2 425.0
CD (p = 0.05) 4.3 4.2 4.1 354 358 321 0.49 0.43 0.45 30.9 32.8 24.4
Interaction NS NS NS NS NS NS NS NS NS NS S NS
6
Vol:.(1234567890)
Scientific Reports | (2022) 12:3161 | https://doi.org/10.1038/s41598-022-07148-w
www.nature.com/scientificreports/
content over their flat-bed counterpart CETMs viz. FBZT–FBZT and FBCT–FBCT, respectively (Table 2). The PRBZT–PRBZT observed ~ 1.2% higher lysine content over the FBCT–FBCT. The P50 + PSB + AMF + 2FSP reported significantly higher lysine content (2.74 g kg−1 dry matter) which was followed by P100, P50 + 2FSP, P50 + PSB + AMF and P0, respectively (Table 2). Integration of P50 + PSB + AMF + 2FSP exhibited ~ 6.6% higher lysine content over 100% soil applied-P. The CETMs again didn’t show any significant influence on tryptophan content, although, double zero-tilled PRBZT–PRBZT and FBZT–FBZT treatments reported comparatively higher tryptophan content over the conventional-tilled FBCT–FBCT system. Among PFPs, P50 + PSB + AMF + 2FSP had significantly higher tryptophan content by ~ 10.4% over P100. In general, tryptophan followed similar trend as that of protein content both for CETMs and PFPs in current study (Table 2).
Oil content and oil yield. Effect of CETMs on corn-oil content was found non-significant (Table 3). How-ever, double zero-tilled PRBZT–PRBZT (4.83%) and FBZT–FBZT (4.74%) reported higher corn-oil content over the single-crop based zero-tilled RBCT–RBZT (4.65%) and no-tilled FBCT–FBCT (4.63%). Likewise, maize under raised-beds (PRBZT–PRBZT, RBCT–RBZT) exhibited higher oil content over their counterpart flat-bed CETMs (FBZT–FBZT, FBCT–FBCT) irrespective of the tillage followed. On an average, double zero-tilled PRBZT–PRBZT system realized ~ 4.3% higher oil content over the CT based FBCT–FBCT. Among PFPs, significantly (p < 0.05) higher oil content was obtained by applying P50 + PSB + AMF + 2FSP (4.9%) followed by P100 (4.84%) and least under P0 (4.41%). The P50 + PSB + AMF + 2FSP enhanced the oil content by ~ 1.2 and 11.1% over P100 and P0, respectively. Oil yield was significantly influenced by both CETM and PFPs with significantly (p < 0.05) higher magnitude under PRBZT–PRBZT (297.2 kg ha−1) and P50 + PSB + AMF + 2FSP (309.4 kg ha−1) to the tune of ~ 18.1 and 14.3% over their respective counterpart treatments viz. FBCT–FBCT and P100 (Table 3).
21.49 21.46 21.61 23.22
78.51 78.54 78.09 76.78
0
20
40
60
80
100
120
FBCT–FBCT RBCT–RBZT FBZT–FBZT PRBZT–PRBZT
Am
ylos
e an
d am
ylop
ectin
(%)
CETM practices
Amylopectin 2018 Amylose 2018
21.57 20.84 21.4 22.65
78.43 79.16 78.6 77.35
0
20
40
60
80
100
120
FBCT–FBCT RBCT–RBZT FBZT–FBZT PRBZT–PRBZT
Am
ylos
e an
dam
ylop
ectin
(%)
CETM practices
Amylopectin 2019 Amylose 2019
23.48 22.07 22.32 23.9718.31
76.52 77.93 77.68 76.0381.69
0
20
40
60
80
100
120
Am
ylos
e an
d am
ylop
ectin
(%)
P-fertilization practices
Amylopectin 2018 Amylose 2018
23.84 22.61 22.27 24.1618.73
76.16 77.39 77.73 75.8481.27
0
20
40
60
80
100
120
Am
ylos
e an
d am
ylop
ectin
(%)
P-fertilization practices
Amylopectin 2019 Amylose 2019
Figure 2. Influence of CETM and P-fertilization practices on grain amylose and amylopectin content of maize under MWCS. The vertical bars represent LSD0.05 values.

7
Vol.:(0123456789)
Scientific Reports | (2022) 12:3161 | https://doi.org/10.1038/s41598-022-07148-w
www.nature.com/scientificreports/
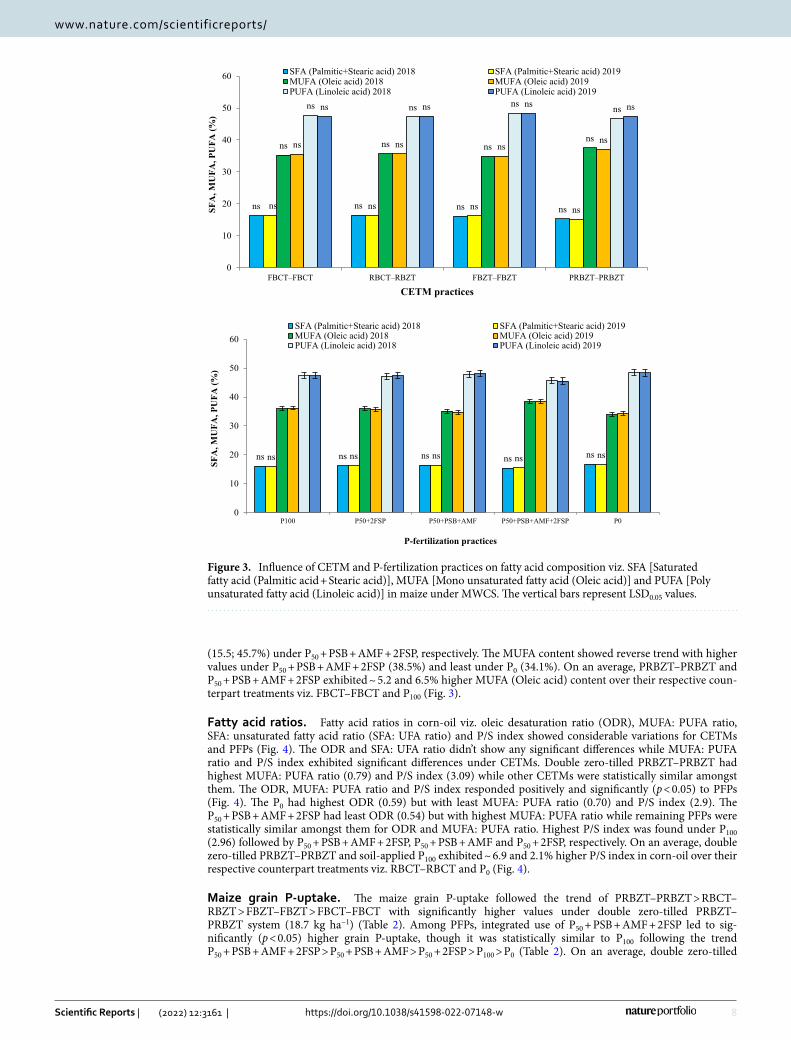
Fatty acid profiling. Effect of CETMs on fatty acid content in maize grain oil was found non-significant (Fig. 3). However, the saturated fatty acid (SFA) (Palmitic acid + Stearic acid) and poly unsaturated fatty acid (PUFA) (Linoleic acid) content, were higher under conventionally-tilled plots (RBCT–RBZT, FBCT–FBCT) compared to double zero-tilled plots (PRBZT–PRBZT, FBZT–FBZT). A reverse trend was observed for mono unsaturated fatty acid (MUFA) content (Oleic acid) where double zero-tilled CETMs (PRBZT–PRBZT, FBZT–FBZT) exhibited higher MUFA (Oleic acid) content over the conventionally-tilled RBCT–RBZT and FBCT–FBCT CETMs. The PRBZT–PRBZT exhibited highest MUFA (oleic acid) content (37.3%) while FBZT–FBZT had highest PUFA (Linoleic acid) content (48.4%). The PFPs showed significant effect on PUFA and MUFA composition except SFA (Palmitic acid + Stearic acid). The SFA and PUFA content were higher under P0 (16.7; 48.4%) and lowest under P50 + PSB + AMF + 2FSP (15.5; 45.7%), respectively; whereas MUFA content were higher under P50 + PSB + AMF + 2FSP (38.5%) and least under P0 (34.1%); exhibiting the obvious role of PFPs in influencing fatty acid concentration in corn-oil. No-P supply (P0) resulted in inhibitory effect on MUFA (Oleic acid) content and resulted in higher SFA (Palmitic and Stearic acid) and PUFA (Linoleic acid) content. Thus, MUFA and PUFA content differed significantly due to PFPs. The SFA and PUFA followed the trend of P0 > P50 + PSB + AMF > P50 + 2FSP > P100 with respective higher values (16.7; 48.4%) under P0 and lowest values
Table 2. Influence of CETM and P-fertilization practices on lysine (g per kg dry matter), tryptophan content (µg g−1) and grain-P uptake (kg ha−1) of maize under MWCS. CD values indicate the critical difference at p = 0.05.
Treatment
Lysine content (g per kg dry matter) Tryptophan (µg g−1)
P uptake by grains (kg ha−1)
2018 2019 Mean 2018 2019 Mean 2018 2019 Mean
CETM practices
FBCT–FBCT 2.45 2.44 2.44 0.64 0.65 0.64 14.92 15.45 15.18
RBCT–RBZT 2.48 2.46 2.47 0.64 0.66 0.65 16.30 16.77 16.53
FBZT–FBZT 2.44 2.48 2.46 0.66 0.66 0.66 14.54 17.35 15.94
PRBZT–PRBZT 2.48 2.47 2.47 0.65 0.67 0.66 18.28 19.03 18.65
SEm ± 0.02 0.03 0.03 0.02 0.02 0.02 0.60 0.38 0.41
CD (p = 0.05) NS NS NS NS NS NS 2.01 1.31 1.41
P–fertilization practices
P100 2.55 2.59 2.57 0.65 0.67 0.67 14.78 16.52 15.65
P50 + 2FSP 2.47 2.50 2.48 0.72 0.73 0.72 16.46 17.81 17.13
P50 + PSB + AMF 2.45 2.42 2.44 0.66 0.69 0.68 17.18 17.29 17.24
P50 + PSB + AMF + 2FSP 2.72 2.75 2.74 0.74 0.75 0.74 18.73 20.98 19.86
P0 2.11 2.06 2.09 0.45 0.43 0.44 12.88 13.14 13.01
SEm ± 0.06 0.06 0.06 0.02 0.02 0.02 0.72 0.57 0.51
CD (p = 0.05) 0.18 0.17 0.18 0.04 0.05 0.04 2.06 1.64 1.47
Interaction NS NS NS NS NS NS S S S
Table 3. Influence of CETM and P-fertilization practices on oil content (%) and oil yield (kg ha−1) of maize under MWCS. CD values indicate the critical difference at p = 0.05.
Treatment
Oil content (%) Oil yield (kg ha−1)
2018–19 2019–20 Mean 2018–19 2019–20 Mean
CETM practices
FBCT–FBCT 4.62 4.64 4.63 251.3 252.0 251.7
RBCT–RBZT 4.63 4.66 4.65 266.6 272.3 269.4
FBZT–FBZT 4.73 4.75 4.74 269.3 274.2 271.8
PRBZT–PRBZT 4.81 4.86 4.83 292.7 301.7 297.2
CD (p = 0.05) NS NS NS 25.09 18.56 15.00
P–fertilization practices
P100 4.81 4.86 4.84 266.8 274.6 270.7
P50 + 2FSP 4.79 4.82 4.81 276.2 281.3 278.7
P50 + PSB + AMF 4.59 4.61 4.60 272.9 275.6 274.2
P50 + PSB + AMF + 2FSP 4.86 4.95 4.90 303.0 315.7 309.3
P0 4.43 4.40 4.41 231.2 228.0 229.6
CD (p = 0.05) 0.25 0.24 0.25 21.55 22.56 19.7
Interaction NS NS NS NS NS NS
8
Vol:.(1234567890)
Scientific Reports | (2022) 12:3161 | https://doi.org/10.1038/s41598-022-07148-w
www.nature.com/scientificreports/
(15.5; 45.7%) under P50 + PSB + AMF + 2FSP, respectively. The MUFA content showed reverse trend with higher values under P50 + PSB + AMF + 2FSP (38.5%) and least under P0 (34.1%). On an average, PRBZT–PRBZT and P50 + PSB + AMF + 2FSP exhibited ~ 5.2 and 6.5% higher MUFA (Oleic acid) content over their respective coun-terpart treatments viz. FBCT–FBCT and P100 (Fig. 3).
Fatty acid ratios. Fatty acid ratios in corn-oil viz. oleic desaturation ratio (ODR), MUFA: PUFA ratio, SFA: unsaturated fatty acid ratio (SFA: UFA ratio) and P/S index showed considerable variations for CETMs and PFPs (Fig. 4). The ODR and SFA: UFA ratio didn’t show any significant differences while MUFA: PUFA ratio and P/S index exhibited significant differences under CETMs. Double zero-tilled PRBZT–PRBZT had highest MUFA: PUFA ratio (0.79) and P/S index (3.09) while other CETMs were statistically similar amongst them. The ODR, MUFA: PUFA ratio and P/S index responded positively and significantly (p < 0.05) to PFPs (Fig. 4). The P0 had highest ODR (0.59) but with least MUFA: PUFA ratio (0.70) and P/S index (2.9). The P50 + PSB + AMF + 2FSP had least ODR (0.54) but with highest MUFA: PUFA ratio while remaining PFPs were statistically similar amongst them for ODR and MUFA: PUFA ratio. Highest P/S index was found under P100 (2.96) followed by P50 + PSB + AMF + 2FSP, P50 + PSB + AMF and P50 + 2FSP, respectively. On an average, double zero-tilled PRBZT–PRBZT and soil-applied P100 exhibited ~ 6.9 and 2.1% higher P/S index in corn-oil over their respective counterpart treatments viz. RBCT–RBCT and P0 (Fig. 4).
Maize grain P-uptake. The maize grain P-uptake followed the trend of PRBZT–PRBZT > RBCT–RBZT > FBZT–FBZT > FBCT–FBCT with significantly higher values under double zero-tilled PRBZT–PRBZT system (18.7 kg ha−1) (Table 2). Among PFPs, integrated use of P50 + PSB + AMF + 2FSP led to sig-nificantly (p < 0.05) higher grain P-uptake, though it was statistically similar to P100 following the trend P50 + PSB + AMF + 2FSP > P50 + PSB + AMF > P50 + 2FSP > P100 > P0 (Table 2). On an average, double zero-tilled
ns ns ns nsns ns ns ns
ns ns nsns
ns ns nsns
ns ns nsnsns ns ns ns
0
10
20
30
40
50
60
FBCT–FBCT RBCT–RBZT FBZT–FBZT PRBZT–PRBZT
SFA
, MU
FA, P
UFA
(%)
CETM practices
SFA (Palmitic+Stearic acid) 2018 SFA (Palmitic+Stearic acid) 2019MUFA (Oleic acid) 2018 MUFA (Oleic acid) 2019PUFA (Linoleic acid) 2018 PUFA (Linoleic acid) 2019
ns ns ns ns nsns ns ns ns ns
0
10
20
30
40
50
60
P100 P50+2FSP P50+PSB+AMF P50+PSB+AMF+2FSP P0
SFA
, MU
FA, P
UFA
(%)
P-fertilization practices
SFA (Palmitic+Stearic acid) 2018 SFA (Palmitic+Stearic acid) 2019MUFA (Oleic acid) 2018 MUFA (Oleic acid) 2019PUFA (Linoleic acid) 2018 PUFA (Linoleic acid) 2019
Figure 3. Influence of CETM and P-fertilization practices on fatty acid composition viz. SFA [Saturated fatty acid (Palmitic acid + Stearic acid)], MUFA [Mono unsaturated fatty acid (Oleic acid)] and PUFA [Poly unsaturated fatty acid (Linoleic acid)] in maize under MWCS. The vertical bars represent LSD0.05 values.

9
Vol.:(0123456789)
Scientific Reports | (2022) 12:3161 | https://doi.org/10.1038/s41598-022-07148-w
www.nature.com/scientificreports/
PRBZT–PRBZT and P50 + PSB + AMF + 2FSP exhibited ~ 22.9 and 26.9% higher grain P-uptake over their respective counterpart treatments viz. FBCT–FBCT and P100.
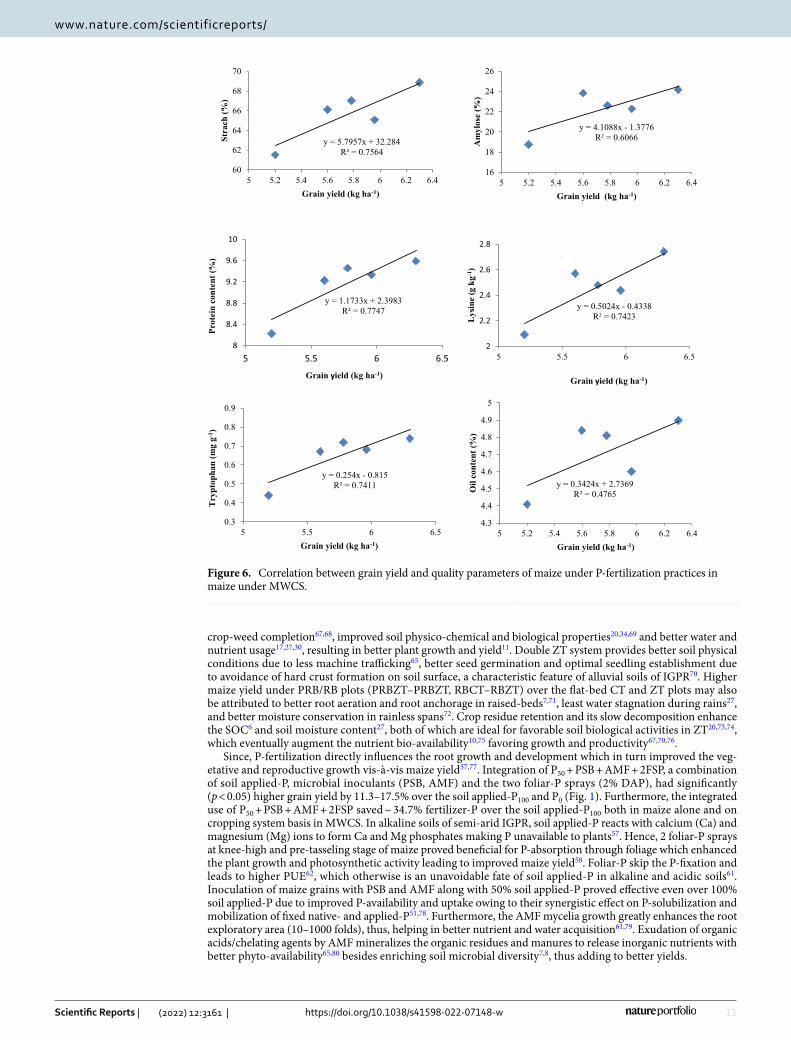
Correlation studies. Starch content in maize grains showed positive correlation (p < 0.05) with grain yield both for CETMs (R2 = 0.921) and PFPs (R2 = 0.756) (Figs. 5, 6). Starch content again showed positive corre-lation (p < 0.05) with grain P-uptake (R2 = 0.852) under PFPs (Fig. 7). Amylose content had positive correla-tion (R2 = 0.54; 0.606), while amylopectin had negative association (R2 = − 0.54; − 0.635) with grain yield both for CETMs and PFPs, respectively (Figs. 5, 6). Amylose content again had positive association (R2 = 0.658) while amylopectin had negative correlation (R2 = − 0.676) with grain P-uptake under PFPs (Fig. 7). More to the point, protein content showed positive correlation with grain yield both under CETMs (R2 = 0.832) and PFPs (R2 = 0.774) as well as with grain P-uptake (R2 = 0.828) under PFPs (Figs. 5, 6, 7). Lysine (R2 = 0.754; 0.742) and tryptophan content (R2 = 0.669; 0741) had positive correlation with grain yield both for CETMs and PFPs, respectively (Figs. 5, 6).
Likewise, lysine (R2 = 0.795) and tryptophan content (R2 = 0.802) showed positive correlation with grain P-uptake under PFPs (Fig. 7). Oil content had strong positive association (R2 = 0.76) with grain yield under CETMs (Fig. 5), but a moderate positive correlation (R2 = 0.476) under PFPs (Fig. 6). Oil content showed a mod-erate positive correlation with grain P-uptake (R2 = 0.584) under PFPs (Fig. 7). Among various fatty acids, only MUFA had positive correlation (p < 0.05) with grain P-uptake (R2 = 0.726) while SFA (R2 = − 0.676) and PUFA (R2 = − 0.724) had negative relationship with grain P-uptake under PFPs (Fig. 7). Grain P-uptake and MUFA: PUFA ratio had a positive correlation (R2 = 0.723), whereas ODR (R2 = − 0.729) and SFA: UFA ratio (R2 = − 0.684) had negative correlation with grain P-uptake under PFPs (Fig. 7).
Principal component analysis and clustered heatmap. Principal component analysis (PCA) revealed the differences in the composition of maize quality parameters under different combinations of CETMs and PFPs (p < 0.05). As shown in Fig. 8, all the treatment combinations clustered distinctly. Treatment combinations M4S3 (PRBZT–PRBZT coupled with P50 + PSB + AMF) and M3S4 (FBZT–FBZT coupled with P50 + PSB + AMF + 2FSP) exhibited higher amylose, protein, lysine, tryptophan and oil content. Likewise, M4 (PRBZT–PRBZT), M3 (FBZT–FBZT) and M2 (RBCT–RBZT) in combination with S4 (P50 + PSB + AMF + 2FSP), S3 (P50 + PSB + AMF) and S2
ns ns nsns
ns ns ns ns
2
2.2
2.4
2.6
2.8
3
3.2
3.4
0
0.1
0.2
0.3
0.4
0.5
0.6
0.7
0.8
0.9
FBCT–FBCT RBCT–RBZT FBZT–FBZT PRBZT–PRBZT
P/S index
OD
R; M
UFA
: PU
FA a
ndSa
tura
ted:
Uns
atur
ated
fatty
aci
d ra
tio
CETM practices
ODR (Oleic desaturation ratio) MUFA: PUFA ratioSaturated: Unsaturated fatty acid ratio P/S index
ns ns ns ns ns
2.75
2.80
2.85
2.90
2.95
3.00
3.05
3.10
3.15
0.10
0.20
0.30
0.40
0.50
0.60
0.70
0.80
0.90
1.00
P100 P50+2FSP P50+PSB+AMF P50+PSB+AMF+2FSP P0
P/S index
OD
R; M
UFA
: PU
FA a
ndSa
tura
ted:
Uns
atur
ated
fatty
aci
d ra
tio
P-fertilization practices
ODR (Oleic desaturation ratio) MUFA: PUFA ratioSaturated: Unsaturated fatty acid ratio P/S index
Figure 4. Influence of CETM and P-fertilization practices on various fatty acid ratios of maize under MWCS. The vertical bars represent LSD0.05 values.

10
Vol:.(1234567890)
Scientific Reports | (2022) 12:3161 | https://doi.org/10.1038/s41598-022-07148-w
www.nature.com/scientificreports/
(P50 + 2FSP) had a positive correlation with both component one and component two, exhibiting increased grain yield, protein yield, oil yield and starch content. The conventionally-tilled M1 (FBCT–FBCT) along with S5 (P0) exhibited higher amylopectin content than other treatment combinations (Fig. 8). For a better understanding of the clustering pattern of grain yield and quality parameters across the treatment combinations; a biclustering heatmap was generated (Fig. 9). This heatmap showed that maize yield and quality parameters (except amylo-pectin) clustered closely and displayed an increase under CA based CETMs (M4, M3 and M2) in combination with the PFPs viz. S4 (P50 + PSB + AMF + 2FSP), S3 (P50 + PSB + AMF) and S2 (P50 + 2FSP). Most significant and remarkable shifts were found for amylopectin content where conventionally-tilled M1 clustered closer to the CA based CETMs (M4, M3 and M2) all supplied with no-P. On an average, CA based CETMs (M4 and M3) in combi-nation with S4 (P50 + PSB + AMF + 2FSP) and S2 (P50 + 2FSP) showed higher similarity to each other and formed a cluster for maize yield and the majority of the quality parameters. The M4S4 (CA based PRBZT–PRBZT supplied with P50 + PSB + AMF + 2FSP) was proved as best treatment combination for realizing higher maize yield and quality parameters as tangibly evident from the heatmap (Fig. 9).
DiscussionDiversifying the existing dominant RWCS towards viable alternative maize-based systems particularly the MWCS16,21,35, the conservation agriculture based CETMs (PRBZT–PRBZT; FBZT–FBZT) along with the appro-priate P-fertilization practices (PFPs), could enhance and stabilize the yields besides improving soil health in long-run17,63, and more importantly the quality parameters of this potential food and industrial crop of south-Asia. The tillage and input-intensive RWCS in the IGPR of south-Asia is facing multiple production- and resource-vulnerabilities viz. exaggerating decline in crop productivity, groundwater table, input-use efficiencies and soil-health5,11,17,21. Henceforth, CA based MWCS has ample potential to combat these assailabilities besides resolving twin challenges of maize productivity and quality enhancement for ushering in food and nutritional security vis-à-vis augmenting industrial applications of this crop in south-Asia.
In this study, the CA-based double zero-tilled permanent raised-bed system (PRBZT–PRBZT) with crop residue retention at 6 t ha−1 per year in MWCS had significantly (p < 0.05) higher maize grain yield by 13.1% over the CT-based FBZT–FBZT, and by 5.7–6.4% over the double zero-tilled flat-bed system (FBZT–FBZT) and the single crop basis zero-tilled system in preceding wheat (RBCT–RBZT) across the years (Fig. 1). It could be associ-ated with the positive impact of crop residue retention and zero-tillage on modulation of soil temperature64,65, improved water retention, infiltration and moisture conservation29,66, soil surface characteristics5, reduced
y = 3.9586x + 42.691R² = 0.9217
63
64
65
66
67
68
5.2 5.4 5.6 5.8 6 6.2
Stra
ch (%
)
Grain yield (kg ha-1)
y = 2.0031x + 10.23R² = 0.5407
20
21
22
23
24
5.2 5.4 5.6 5.8 6 6.2
Am
ylos
e (%
)
Grain yield (kg ha-1)
y = 0.6202x + 5.5882R² = 0.8326
8.8
8.9
9
9.1
9.2
9.3
9.4
9.5
5.2 5.4 5.6 5.8 6 6.2
Prot
ein
cont
ent (
%)
Grain yield (kg ha-1)
y = 0.0423x + 2.2162R² = 0.754
2.43
2.44
2.45
2.46
2.47
2.48
5.2 5.4 5.6 5.8 6 6.2
Lysin
e (g
kg-1
)
Grain yield (kg ha-1)
y = 0.027x + 0.497R² = 0.6693
0.63
0.64
0.65
0.66
0.67
5.2 5.4 5.6 5.8 6 6.2
Tryp
toph
an (m
g g-1
)
Grain yield (kg ha-1)
y = 0.2755x + 3.1235R² = 0.76
4.6
4.7
4.8
4.9
5.2 5.4 5.6 5.8 6 6.2O
il co
nten
t (%
)
Grain yield (kg ha-1)
Figure 5. Correlation between grain yield and quality parameters of maize under CETM practices in maize under MWCS.
11
Vol.:(0123456789)
Scientific Reports | (2022) 12:3161 | https://doi.org/10.1038/s41598-022-07148-w
www.nature.com/scientificreports/
crop-weed completion67,68, improved soil physico-chemical and biological properties20,34,69 and better water and nutrient usage17,27,30, resulting in better plant growth and yield11. Double ZT system provides better soil physical conditions due to less machine trafficking65, better seed germination and optimal seedling establishment due to avoidance of hard crust formation on soil surface, a characteristic feature of alluvial soils of IGPR70. Higher maize yield under PRB/RB plots (PRBZT–PRBZT, RBCT–RBZT) over the flat-bed CT and ZT plots may also be attributed to better root aeration and root anchorage in raised-beds7,71, least water stagnation during rains27, and better moisture conservation in rainless spans72. Crop residue retention and its slow decomposition enhance the SOC6 and soil moisture content27, both of which are ideal for favorable soil biological activities in ZT20,73,74, which eventually augment the nutrient bio-availability10,75 favoring growth and productivity67,70,76.
Since, P-fertilization directly influences the root growth and development which in turn improved the veg-etative and reproductive growth vis-à-vis maize yield57,77. Integration of P50 + PSB + AMF + 2FSP, a combination of soil applied-P, microbial inoculants (PSB, AMF) and the two foliar-P sprays (2% DAP), had significantly (p < 0.05) higher grain yield by 11.3–17.5% over the soil applied-P100 and P0 (Fig. 1). Furthermore, the integrated use of P50 + PSB + AMF + 2FSP saved ~ 34.7% fertilizer-P over the soil applied-P100 both in maize alone and on cropping system basis in MWCS. In alkaline soils of semi-arid IGPR, soil applied-P reacts with calcium (Ca) and magnesium (Mg) ions to form Ca and Mg phosphates making P unavailable to plants57. Hence, 2 foliar-P sprays at knee-high and pre-tasseling stage of maize proved beneficial for P-absorption through foliage which enhanced the plant growth and photosynthetic activity leading to improved maize yield58. Foliar-P skip the P-fixation and leads to higher PUE62, which otherwise is an unavoidable fate of soil applied-P in alkaline and acidic soils61. Inoculation of maize grains with PSB and AMF along with 50% soil applied-P proved effective even over 100% soil applied-P due to improved P-availability and uptake owing to their synergistic effect on P-solubilization and mobilization of fixed native- and applied-P51,78. Furthermore, the AMF mycelia growth greatly enhances the root exploratory area (10–1000 folds), thus, helping in better nutrient and water acquisition61,79. Exudation of organic acids/chelating agents by AMF mineralizes the organic residues and manures to release inorganic nutrients with better phyto-availability65,80 besides enriching soil microbial diversity7,8, thus adding to better yields.
y = 5.7957x + 32.284R² = 0.7564
60
62
64
66
68
70
5 5.2 5.4 5.6 5.8 6 6.2 6.4
Stra
ch (%
)
Grain yield (kg ha-1)
y = 4.1088x - 1.3776R² = 0.6066
16
18
20
22
24
26
5 5.2 5.4 5.6 5.8 6 6.2 6.4
Am
ylos
e (%
)
Grain yield (kg ha-1)
y = 1.1733x + 2.3983R² = 0.7747
8
8.4
8.8
9.2
9.6
10
5 5.5 6 6.5
Prot
ein
cont
ent (
%)
Grain yield (kg ha-1)
y = 0.5024x - 0.4338R² = 0.7423
2
2.2
2.4
2.6
2.8
5 5.5 6 6.5
Lysin
e (g
kg-1
)
Grain yield (kg ha-1)
y = 0.254x - 0.815R² = 0.7411
0.3
0.4
0.5
0.6
0.7
0.8
0.9
5 5.5 6 6.5
Tryp
toph
an (m
g g-1
)
Grain yield (kg ha-1)
y = 0.3424x + 2.7369R² = 0.4765
4.3
4.4
4.5
4.6
4.7
4.8
4.9
5
5 5.2 5.4 5.6 5.8 6 6.2 6.4
Oil
cont
ent (
%)
Grain yield (kg ha-1)
Figure 6. Correlation between grain yield and quality parameters of maize under P-fertilization practices in maize under MWCS.

12
Vol:.(1234567890)
Scientific Reports | (2022) 12:3161 | https://doi.org/10.1038/s41598-022-07148-w
www.nature.com/scientificreports/
Phosphorus and potassium nutrition is vital for starch biosynthesis81,82. The CA based CETMs (PRBZT–PRBZT, FBZT–FBZT, RBCT–RBZT) had higher starch content (65.1–67.2%) compared to 64.4% in the CT based FBCT–FBCT (Table 1). This may be attributed to enhanced macro- and micronutrient avail-ability especially P and K30, owing to residue decomposition with better nutrient-recycling especially K10,83, and mineralization and solubilization of native-and applied-P by the organic acids released from decomposing residues under ZT28,84. Likewise, maize under raised-beds (PRBZT–PRBZT, RBCT–RBZT) exhibited higher starch content (~ 66.2%) compared to ~ 64.9% under flat-beds (FBZT–FBZT, FBCT–FBCT) irrespective of till-age practices owing to better root aeration and anchorage for nutrients71 especially limiting nutrients like P61. Thus, ZT based CETMs enhanced the starch content over the conventional-tillage. Among PFPs, significantly (p < 0.05) higher starch (68.9%) was obtained by integrated use of P50 + PSB + AMF + 2FSP followed by P50 + 2FSP and least under P0. Here, foliar-P fertilization proved beneficial in higher P absorption by maize foliage and its assimilation which enhanced the starch content. Under P-deficiency, starch content decreases because of reduced ATP production in chloroplast resulting in reduced activity of ADPG enzyme, a key enzyme in starch metabolism; so the starch produced in chloroplast was unable to diffuse to cytoplasm as tri-phosphate, thus, resulting in reduced translocation of carbohydrates to grains82. Starch content showed positive correlation with grain yield both for CETMs and PFPs, owing to greater role of starch in grain biomass accumulation being influ-enced by both CETMs30, and P-fertilization38. The CETM practices again did not show any significant effect on amylose and amylopectin content in maize grains like starch content. Starch biosynthesis is mainly dependant on proteins present in the starch granules82, particularly the granule-bound starch synthase I protein (GBSSI) which is involved in amylose synthesis85. Hence, enhanced N-availability and protein content in ZT based CETMs might have enhanced the amylose content to some extend over CT based CETMs. Henceforth, higher amylose content under PRBZT–PRBZT and P50 + PSB + AMF + 2FSP may be associated to improved nutrient availability and acquisition86–88. Higher amylose content under PRBZT–PRBZT and 50% P + PSB + AMF + 2FSP, considered as a beneficial trait due to its lower glycemic-index, required by diabetic patients45. As, amylose
y = 1.0058x + 49.039
R² = 0.8526
y = 0.6996x + 10.724
R² = 0.6582
y = -0.7192x + 89.745
R² = 0.6764
10
20
30
40
50
60
70
80
90
12 13 14 15 16 17 18 19 20
Star
ch, a
myl
ose a
nd
amyl
opec
tin (%
)
Grain P-uptake (kg ha-1)
Starch Amylose Amylopectin
y = 0.1983x + 5.8787
R² = 0.8281
y = 0.085x + 1.0543
R² = 0.7958
y = 0.0432x - 0.0662R² = 0.8023
0
2
4
6
8
10
12 13 14 15 16 17 18 19 20
Prot
ein
(%),
Lysin
e (g
kg-1
) an
d Tr
ypto
phan
(mg
g-1)
Grain P-uptake (kg ha-1)
Protein Lysine Tryptophan
y = 0.062x + 3.6847
R² = 0.584
y = -0.1552x + 18.739
R² = 0.6765
y = 0.5637x + 26.555
R² = 0.7268
y = -0.3518x + 53.162
R² = 0.7245
0
10
20
30
40
50
60
12 13 14 15 16 17 18 19 20
Oil,
SFA
, MU
FA
and
PUFA
(%)
Grain P-uptake (kg ha-1)
Oil SFA MUFA PUFA
y = -0.0057x + 0.6626
R² = 0.7293
y = 0.0178x + 0.4647
R² = 0.7239
y = -0.0024x + 0.2333
R² = 0.6842
0.00
0.20
0.40
0.60
0.80
1.00
12 14 16 18 20
OD
R, M
UFA
:PU
FA a
nd
Satu
rate
d:U
nsat
urat
ed ra
tio
Grain P-uptake (kg ha-1)
ODR (Oleic desaturation ratio)
MUFA: PUFA ratio
Saturated: Unsaturated ratio
Figure 7. Correlation between grain P-uptake and quality parameters of maize under P-fertilization practices in maize under MWCS.

13
Vol.:(0123456789)
Scientific Reports | (2022) 12:3161 | https://doi.org/10.1038/s41598-022-07148-w
www.nature.com/scientificreports/
and amylopectin together constitute the starch, hence, the treatments having higher amylose had a lower amy-lopectin content and vice-versa as evident from correlation studies and the heatmap clustering. Furthermore, amylose content and grain yield had positive correlation while amylopectin had negative correlation with yield both under CETMs and PFPs. Starch yield was significantly influenced by CETMs and PFPs due to higher grain yield under PRBZT–PRBZT and P50 + PSB + AMF + 2FSP treatments. In nutshell, PRBZT–PRBZT along with P50 + PSB + AMF + 2FSP proved beneficial to harness higher starch content, starch yield and amylose content; which can amplify the maize based food, starch and pharmaceutical industry in the south-Asia.
Figure 8. PCA biplots showing the effect of different treatment combinations of CETMs and PFPs on productivity and quality parameters of maize (pooled data).
Figure 9. Biclustering heatmap analysis of maize productivity and the quality parameters at different treatment combinations of CETMs and PFPs in maize (pooled data), using R-software package ‘gplots’, Software version number ‘R package version 3.1.1’, Software URL https:// CRAN.R- proje ct. org/ packa ge= gplots.
14
Vol:.(1234567890)
Scientific Reports | (2022) 12:3161 | https://doi.org/10.1038/s41598-022-07148-w
www.nature.com/scientificreports/
The ZT based CETMs had higher protein content over the conventional-tillage due to residue retention (3–6 t ha−1 per year) which on decomposition and mineralization enhanced the N-availability and uptake to synthe-size amino acids and proteins20,89,90. Higher protein content in maize may also be associated with preferential deposition of zein protein over other endosperm proteins89,91. Protein yield was higher under ZT based CETMs compared to CT plots due to improved nutrient availability and soil health92,93, optimal soil moisture status and better root activities88,94. The PFPs had significant influence on protein content and protein yield owing to the vital role of P in protein biosynthesis and energy relations81,82. Furthermore, the P and N are found to have synergistic effect, thus, integrated use of P50 + PSB + AMF + 2FSP might have significantly enhanced the N uptake and assimilation95, leading to greater protein content and protein yield96. Nutritionally essential amino acids viz. lysine and tryptophan are highly important to improve maize grain quality97. Here, different CETMs had non-significant effect on lysine and tryptophan content. It may be strengthened with the fact that an increase in grain-N content as a result of improved N-availability is accompanied by decrease in the relative lysine content of grain proteins98. On the other hand, P indirectly influences the lysine content because when P-supply is reduced, it results in reduced grain yield but with increased grain-N concentration; thus, leads to reduced lysine content in grains98. Although under optimal P-fertilization, here P50 + PSB + AMF + 2FSP, the grain yield increases which results in reduced grain-N content due to dilution effect, which in turn, increases the lysine content under optimal or excess P-supply99. Henceforth, a similar pattern was observed for lysine content under PFPs in current study. Since, P and Zn are found to have antagonistic effects, so the P plays a vital role in tryptophan production100. The Zn is involved in various oxidation–reduction reactions101; thereby, Zn-deficiency leads to oxidation of auxins and reduction of tryptophan102. As, tryptophan is the precursor of auxins97, hence, tryptophan was higher under P50 + PSB + AMF + 2FSP over soil applied-P100; because of reduced Zn-uptake under soil applied-P100 compared to P50 + PSB + AMF + 2FSP, a combination of soil, microbial and foliar-P application which had an advantage over soil applied-P owing to reduced competition for Zn-uptake100,103. Positive correlation of protein, lysine and tryptophan content with the grain yield both under CETMs and PFPs, further emphasize the importance of ZT based CETMs and integrated use of P50 + PSB + AMF + 2FSP in enhancement of protein, lysine and tryptophan content as well as protein yield. Thus, deployment of such CPTs may altogether boost farm productivity and quality for better profitability of resource-poor south-Asian farmers and the maize based food, feed, and phar-maceutical industry in the region.
Different CETM practices had non-significant effect on oil content in maize grains although ZT based CETMs proved superior over conventional-tillage; where PRBZT–PRBZT had higher oil content due to crop residues decomposition104, which slowly released the essential nutrients (soluble-P and S-compounds) into rhizosphere which later became available to plants specifically during reproductive phase105. Sulfur (S) is a key element in chlorophyll formation, yield enhancement and oil synthesis57. Furthermore, S-concentration and S-uptake has a strong synergistic relationship with P in plants57,106. Positive correlation and heatmap clustering between oil content and grain P uptake under PFPs has further strengthens this fact. As per an estimate, the wheat straw of 2700 kg ha−1, on average add ~ 28 kg N, 4.5 kg P, 52 kg K and 6 kg S ha−1 under ZT system; on the other hand, this advantage may lack in CT system107. Hence, crop residues decomposition released both P and S while additional application of foliar-P augmented S uptake from the soil, thereby, enhancing the oil content. The P50 + PSB + AMF + 2FSP exhibited significantly higher oil content and oil yield over other PFPs which may be accrued to the fact that P directly participates in synthesis of oils, fats and phospholipids108, besides its vital role in S acquisition57. Better plant nutrition under CA based CETMs and integrated P-fertilization practices though caused a slight improvement in grain oil content in current study109, but harnessed greater oil production per unit area because of enhanced grain yield38. Positive correlation between oil content and maize grain yield has strongly established this relationship in current study. Hence, maize cultivation under PRBZT–PRBZT system along with P50 + PSB + AMF + 2FSP may lead to higher corn-oil productivity which may cut down the oil imports by the developing nations like India.
The ZT and CT based CETMs exhibited non-significant effect on the composition of fatty acids viz. satu-rated fatty acids (SFA), mono unsaturated fatty acids (MUFA) and poly unsaturated fatty acid (PUFA) like oil content. However, these fatty acids were greatly influenced by PFPs both under CT and ZT systems with pattern of fatty acid composition as PUFA > MUFA > SFA both under CETMs and PFPs110. With increase in P-supply, SFA (Palmitic acid + Stearic acid) content decreased while MUFA (Oleic acid) content increased considerably, again as an indicator of better oil quality42. These observations are in agreement with the findings of Ray38, who observed similar findings with respect to SFA and MUFA content while using higher doses of plant nutrients. The PUFA (linoleic acid) content were higher under P0 in current study; which further corroborate with the findings of Krueger56, who observed an increase in linoleic acid with the P-omission. In current study, the influence of different CETMs and PFPs on the status of individual fatty acid may not lead to definite conclusion about the overall fatty acid composition in corn-oil. Thus, various fatty acid ratios were estimated to draw logical conclu-sions. Among CETMs, double zero-tilled PRBZT–PRBZT had significantly higher MUFA: PUFA ratio and P/S index over CT plots which show better oil quality under ZT system owing to better N-supply encouraging carbon chain elongation in linoleic acid (PUFA) and oleic acid (MUFA)111–113. The P/S index is a vital factor among all parameters as it represents the nutritional value of edible oils38. Here, P/S index was found to be > 1.0 irrespective of CETMs and PFPs, which sufficiently indicated the better nutritional value of corn-oil with reduced tendency of deposition of lipids in the human body114. It was found that ZT based CETMs and P50 + PSB + AMF + 2FSP exhibited higher P/S index over the CT system and P0. It is reported that with an increase in unsaturation content and a degree in fatty acid, the susceptibility to oil oxidation increases; thus, releasing free radicals causing off-flavor and reduced nutritional quality38. On average, oleic acid is 25-times less vulnerable to oxidation compared to linoleic acid, while linoleic acid is 2-times less susceptible compared to linolenic acid because of an increase in bond association energy as compared to linolenic acid115. As, ZT based CETMs and P50 + PSB + AMF + 2FSP had higher oleic acid and lowest linoleic acid content, a positive sign for producing good quality corn-oil having

15
Vol.:(0123456789)
Scientific Reports | (2022) 12:3161 | https://doi.org/10.1038/s41598-022-07148-w
www.nature.com/scientificreports/
less susceptibility to oxidation which may help in flourishing the corn-oil industry. Linolenic acid is suscep-tible to oxidation and causes adverse effect on human health like cardiovascular diseases and improper brain development116,117. As corn-oil contained negligible amount (< 1%) of linolenic acid in current study, hence, it would not exert any adverse effect on human health38. Under P0, higher oleic desaturation ratio (ODR) and lesser MUFA: PUFA ratio compared to other PFPs again point out a better quality corn-oil105. Higher ODR indicates better and longer shelf-life of corn-oil; while lower ODR inhibits the subsequent desaturation steps which lead to reduced linolenic acid content112. The P-fertilization considerably increased the ODR and MUFA: PUFA ratio under P50 + 2FSP, P50 + PSB + AMF and sole P100; but P50 + PSB + AMF + 2FSP showed slight reduction in ODR and an increase in MUFA: PUFA ratio may be due to enhanced P-availability over P0. The MUFA: PUFA ratio is directly linked with the oxidative stability and nutritional properties of the oil118, thus, indicating that optimal P-nutrition and the ZT system both may improve the oil quality due to sustained and synchronized P bio-availability throughout crop season. Significantly higher P/S index under P50 + PSB + AMF + 2FSP is another indicator of better nutritional value of edible maize oil38. The heatmap also demonstrated that optimal P-nutrition and ZT system proved highly promising in producing good quality corn-oil, a good indication for corn-oil industry to target health conscious clientele114.
The CETMs and PFPs showed significant influence on P uptake in maize grains with greater magnitude under PRBZT–PRBZT and P50 + PSB + AMF + 2FSP, owing to higher grain-P concentrations and maize yield in these treatments. Higher grain-P uptake in PRBZT–PRBZT is attributed to affirmative effects of crop resi-due retention which added substantial amount of nutrients including P in soil while improving soil physico-chemical and microbiological properties compared to CT plots27,72,119. The P-fertilization along with PSB and AMF vis-à-vis foliar-P had a significant influence on grain-P uptake as a result of optimal P bio-availability61, better root and shoot system11, enhanced native and applied-P solubilization and mobilization65,120, and foliar-P supplementation58; which collectively led to higher P uptake121. Thus, better the P-fertilization better is the P uptake by the crop and its subsequent accumulation in grains62. The P-fertilization in adequate amounts is essential for root and shoot development, seed formation and biochemical reactions viz., synthesis of proteins, oils and fats, phospholipids and energy relations, thus, it played a vital role in enhancing the maize quality108. That’s why, the quality parameters of maize viz., starch, protein, lysine, tryptophan, MUFA, and MUFA: PUFA ratio had positive correlation with grain-P uptake. Contrary to that, the amylopectin, PUFA, SFA, ODR and SFA: UFA ratio showed an inverse relationship with the grain-P uptake owing to complex interrelationships with their counterpart constituents82,85,108, and with varying P supplies as reported by various researchers86–88,99,100. The heatmap biclustering validated the superiority of CA-based PRBZT–PRBZT and FBZT–FBZT systems in combination with two PFPs viz. P50 + PSB + AMF + 2FSP and P50 + PSB + AMF in enhancing the grain, protein and oil yield as well as starch, amylose, lysine and tryptophan content; which demonstrate the sustainability of CA based crop management over the conventional agriculture while integrating P50 + PSB + AMF + 2FSP in MWCS. It is tangibly evident from the PCA analysis and heatmap biclustering that the M4S4, a combination of double zero-tilled PRBZT–PRBZT system in combination with P50 + PSB + AMF + 2FSP may prove highly sustainable for realizing higher maize grain yield and quality under a maize–wheat cropping system in a semi-arid agro-ecology. Thus, clean production technologies like double zero-tilled PRBZT–PRBZT along with P50 + PSB + AMF + 2FSP not only enhanced the maize yield significantly while saving ~ 34.7% fertilizer-P both in maize and MWCS, but they also augmented the maize quality parameters to reinforce the food and nutritional security besides boosting food, corn-oil and starch industry in the south-Asia.
ConclusionsIn order to safeguard the food and nutritional security of millions of south-Asian families concurrently conserv-ing the soil, environment and natural resources, the application of clean production technologies (CPTs) like CA-based CETMs (PRBZT–PRBZT/FBZT–FBZT) that allows rapidly increases of yield and food quality should be a norm, not the exception. In our study, the production technology of the PRBZT–PRBZT/FBZT–FBZT along with integrated use of P50 + PSB + AMF + 2FSP in MWCS proved to be excelled in the maize yield and quality parameters. On average, double zero-tilled PRBZT–PRBZT system and P50 + PSB + AMF + 2FSP both significantly enhanced the maize grain, starch, protein and oil yield by 13.1–19% and 12.5–17.2%, over their respective counterpart treatments i.e. FBCT–FBCT and 100% soil applied-P (P100); while concurrently sav-ing ~ 34.7% fertilizer-P both in maize (20.8 kg P2O5/ha) and on cropping system basis (41.6 kg P2O5/ha). Inte-grated use of P50 + PSB + AMF + 2FSP had significantly higher starch, amylose, protein, lysine, tryptophan and oil content by 1.2–10.4% over the 100% soil applied-P due to sustained and synchronized P bio-availability to the crop. The PRBZT–PRBZT had greater MUFA (oleic acid, 37.1%), MUFA: PUFA ratio (0.79) and P/S index (3.09). The ODR, MUFA: PUFA ratio and P/S index responded positively and significantly to P-fertilization practices. Double zero-tilled PRBZT–PRBZT system concurred with residue retention at 6 t ha−1 per year along with P50 + PSB + AMF + 2FSP while saving ~ 34.7% fertilizer-P in MWCS, proved as a potential clean production technology for enhancing the maize productivity and quality. Accordingly, deserves strong recommendation to augment maize yield and quality besides augmenting safe industrial uses in maize based industries, climate-resilience and farmers’ well-being in semi-arid IGPR in south-Asia and similar agro-ecologies across the globe.
Materials and methodsExperimental details and crop management. A field experiment was carried-out in maize (Zea mays L.) for two years during Kharif 2018 and 2019 at Experimental Farm of ICAR-Indian Agricultural Research Institute, New Delhi, India [Latitude 28° 63′ N; Longitude 77° 15′ E; Altitude 228.6 m] under maize–wheat crop-ping system (MWCS). This experimental site is located in semi-arid sub-tropics having sandy-loam Alluvial soil
16
Vol:.(1234567890)
Scientific Reports | (2022) 12:3161 | https://doi.org/10.1038/s41598-022-07148-w
www.nature.com/scientificreports/
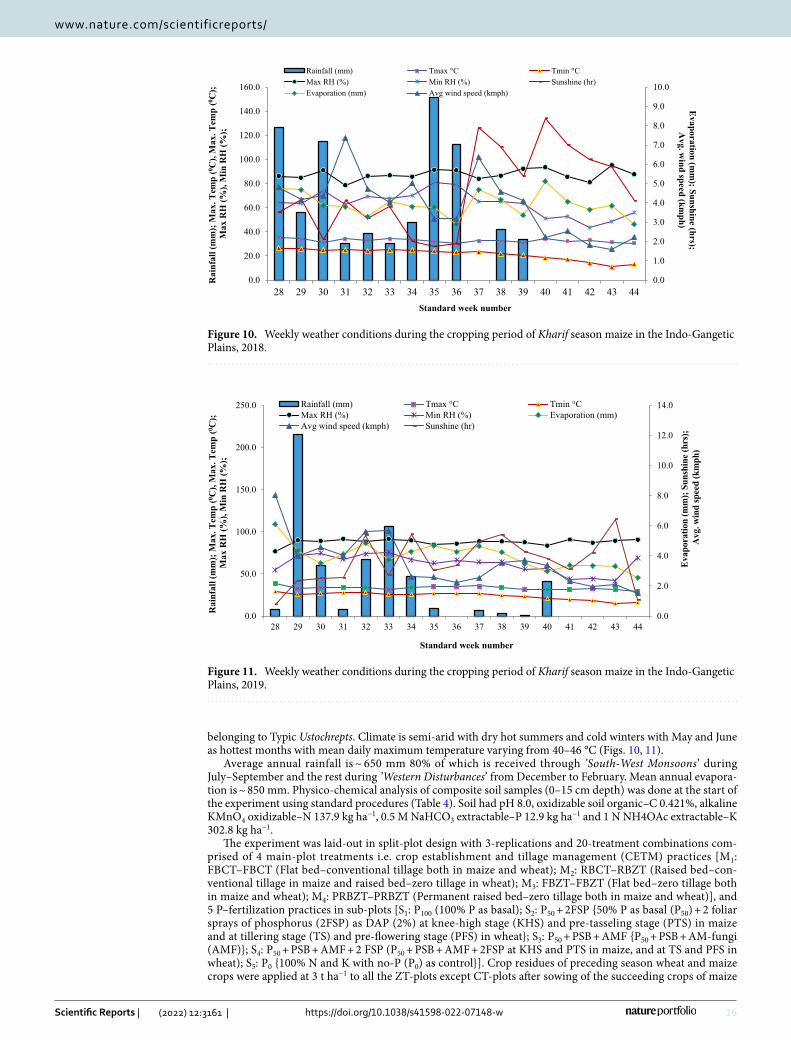
belonging to Typic Ustochrepts. Climate is semi-arid with dry hot summers and cold winters with May and June as hottest months with mean daily maximum temperature varying from 40–46 °C (Figs. 10, 11).
Average annual rainfall is ~ 650 mm 80% of which is received through ’South-West Monsoons’ during July–September and the rest during ’Western Disturbances’ from December to February. Mean annual evapora-tion is ~ 850 mm. Physico-chemical analysis of composite soil samples (0–15 cm depth) was done at the start of the experiment using standard procedures (Table 4). Soil had pH 8.0, oxidizable soil organic–C 0.421%, alkaline KMnO4 oxidizable–N 137.9 kg ha−1, 0.5 M NaHCO3 extractable–P 12.9 kg ha−1 and 1 N NH4OAc extractable–K 302.8 kg ha−1.
The experiment was laid-out in split-plot design with 3-replications and 20-treatment combinations com-prised of 4 main-plot treatments i.e. crop establishment and tillage management (CETM) practices [M1: FBCT–FBCT (Flat bed–conventional tillage both in maize and wheat); M2: RBCT–RBZT (Raised bed–con-ventional tillage in maize and raised bed–zero tillage in wheat); M3: FBZT–FBZT (Flat bed–zero tillage both in maize and wheat); M4: PRBZT–PRBZT (Permanent raised bed–zero tillage both in maize and wheat)], and 5 P–fertilization practices in sub-plots [S1: P100 (100% P as basal); S2: P50 + 2FSP {50% P as basal (P50) + 2 foliar sprays of phosphorus (2FSP) as DAP (2%) at knee-high stage (KHS) and pre-tasseling stage (PTS) in maize and at tillering stage (TS) and pre-flowering stage (PFS) in wheat}; S3: P50 + PSB + AMF {P50 + PSB + AM-fungi (AMF)}; S4: P50 + PSB + AMF + 2 FSP (P50 + PSB + AMF + 2FSP at KHS and PTS in maize, and at TS and PFS in wheat); S5: P0 {100% N and K with no-P (P0) as control}]. Crop residues of preceding season wheat and maize crops were applied at 3 t ha−1 to all the ZT-plots except CT-plots after sowing of the succeeding crops of maize
0.0
1.0
2.0
3.0
4.0
5.0
6.0
7.0
8.0
9.0
10.0
0.0
20.0
40.0
60.0
80.0
100.0
120.0
140.0
160.0
28 29 30 31 32 33 34 35 36 37 38 39 40 41 42 43 44
Evaporation (mm
); Sunshine (hrs);A
vg. wind speed (km
ph)
Rai
nfal
l (m
m);
Max
. Tem
p (0 C
), M
ax. T
emp
(0 C);
Max
RH
(%),
Min
RH
(%);
Standard week number
Rainfall (mm) Tmax °C Tmin °C
Max RH (%) Min RH (%) Sunshine (hr)
Evaporation (mm) Avg wind speed (kmph)
Figure 10. Weekly weather conditions during the cropping period of Kharif season maize in the Indo-Gangetic Plains, 2018.
0.0
2.0
4.0
6.0
8.0
10.0
12.0
14.0
0.0
50.0
100.0
150.0
200.0
250.0
28 29 30 31 32 33 34 35 36 37 38 39 40 41 42 43 44
Evap
orat
ion
(mm
); Su
nshi
ne (h
rs);
Avg
. win
d sp
eed
(km
ph)
Rai
nfal
l (m
m);
Max
. Tem
p (0 C
), M
ax. T
emp
(0 C);
Max
RH
(%),
Min
RH
(%);
Standard week number
Rainfall (mm) Tmax °C Tmin °C
Max RH (%) Min RH (%) Evaporation (mm)
Avg wind speed (kmph) Sunshine (hr)
Figure 11. Weekly weather conditions during the cropping period of Kharif season maize in the Indo-Gangetic Plains, 2019.

17
Vol.:(0123456789)
Scientific Reports | (2022) 12:3161 | https://doi.org/10.1038/s41598-022-07148-w
www.nature.com/scientificreports/
and wheat, respectively. In current study, ‘PMH-1’ high yielding single cross maize hybrid was used as the test cultivar being one of the most promising and popular cultivar of Indian IGPR. Hybrid ‘PMH-1’ was sown in gross plot size of 5.0 × 4.2 m at plant spacing of 60 × 25 cm using seed drill with seed at 20 kg ha−1 and fertilizer recom-mendation of N: P2O5: K2O at 150: 60: 40 kg ha−1 on 12th and 9th July and harvested on 29th and 24th October during Kharif 2018 and 2019, respectively. Whole K and whole treatment-wise fertilizer-P were applied as basal dose while N was applied in 3 equal splits (1/3rd as basal, 1/3rd top-dressed at KHS, 1/3rd top-dressed at PTS). Foliar P-fertilization was done at KHS and PTS using 2% DAP (Di-ammonium phosphate; 18% N and 46% P2O5) in 750 L water ha−1. Expect treatments, maize crop was grown using standard crop management practices132.
Maize grain yield, protein content and protein yield. After harvesting, the maize crop from net-plots was sun-dried, threshed plot-wise, grains cleaned and sun-dried till 10% seed moisture was obtained. Grain yield (t ha−1) was estimated using standard procedures132. Nitrogen content (%) in maize grains was determined using standard procedure132. Protein content (%) in maize grains was calculated by multiplying grain-N content (%) by the factor 6.25 while protein yield (kg ha−1) in maize grains was calculated by using following formula:
Starch estimation. A grain sample of 0.4 g was homogenized in hot 80% ethanol to remove sugars. The residues retained after centrifugation were washed repeatedly with hot ethanol (80%) till the washing is colorless. The residues were dried and the extraction was done from the dried samples with the application of 5 mL water and 6.5 mL of percholoric acid (52%). The 0° C temperature was maintained for 20 min (min) and then samples were put under centrifugation at 10,000 rpm for 8 min. The supernatant was decanted and kept for starch esti-mation. The extraction was repeated 2–3 times for full and final extraction. With the addition of distilled water, final volume of the pooled-up supernatant was made to 100 mL. The 0.1 mL of supernatant was pipetted-out and the volume was made-up to 1.0 mL with distilled water. Similarly for reference, different aliquots of standard glucose solution were taken and volume was made-up to 1.0 mL using distilled water. The 4.0 mL of anthrone reagent was added to each tube and heated for 8 min in water bath. Intensity of color, green to dark green, was recorded at 630 nm133. The glucose concentration of the samples was determined using the calibration curve and the values obtained were multiplied by a factor 0.9 to quantify the starch content (%). Starch yield (kg ha−1) in maize grains was calculated by using following formula:
Amylose and amylopectin content. Maize grains from different plots were ground to make fine powder with particle size of 500 µ after milling. 100 mg of powdered samples was added with a mixture of ethanol and 1 M NaOH (1 mL + 10 mL) and was left as such overnight. Subsequently, distilled water was added to sample
Protein yield (kg/ha) =
(
Protein content (%)× Grain yield (kg/ha)
100
)
Starch yield (kg/ha) =
(
Starch content (%)× Grain yield (kg/ha)
100
)
Table 4. Initial fertility status of the experimental site.
S. No. Particulars Values Method followed
1
Mechanical analysis
Sand (%) 64.9
Hydrometer method122Silt (%) 21.0
Clay (%) 14.1
Textural class Sandy-loam
2Physical properties
Bulk density (Mg m−3) 1.57 Veihmeyer and Hendrickson123
3
Chemical properties
Organic carbon (%) 0.42 Walkley and Black method124
Available N (kg ha−1) 137.9 Alkaline permanganate method125
Available P (kg ha−1) 12.9 Olsen’s method126
Available K (kg ha−1) 302.8 Flame photometer method124
pH (1:2.5 soil: water ratio) 8.0 Beckman’s pH meter127
EC (dSm−1) (1:2 soil: water ratio) 0.46 Richards128
4
Biological properties
Soil microbial biomass carbon (µg SMBC g soil−1) 183.4 Nunan et al.129
Dehydrogenase activity (µg TPF g soil−1 day−1) 28.3 Casida et al.130
Alkaline phosphatase activity (µg PNP g soil−1 h−1) 185.4 Tabatabai and Bremner131
Acid phosphatase activity (µg PNP g soil−1 h−1) 29.2 Tabatabai and Bremner131

18
Vol:.(1234567890)
Scientific Reports | (2022) 12:3161 | https://doi.org/10.1038/s41598-022-07148-w
www.nature.com/scientificreports/
solution to make the final volume to 100 mL. An aliquot of 2.5 mL of extract was mixed with 20 mL distilled water and 3 drops of Phenolphthalein, where by the solution changes into pink-color. On addition of 0.1 M HCl drop by drop, the pink color disappears. To the treated sample, 1 mL of iodine reagent was added and volume was made-up to 50 mL by adding distilled water and then absorbance was recorded at 590 nm with reference to blank (1 mL iodine reagent diluted to 50 mL with distilled water). The amylose content in maize grains was determined using standard curve derived from potato amylose134. Standard amylose solution was prepared by dissolving 100 mg in 10 mL of 1 M NaOH and making up to 100 mL final volume. The amount of amylose in samples was determined by using standard curve prepared from amylase (0.2, 0.4, 0.6, 0.8 and 1.0 mL) against a blank for which dilute 1 mL of iodine reagent to 50 mL with water. The relevant calculations were done using following formula:
Since, 2.5 mL of the test solution = x mg amylose; therefore, 100mL contains =(
x2.5 × 100
)
.The amylopectin content (%) in maize grains was determined by subtracting the amylose content from the
total starch content135.
Lysine and tryptophan estimation. The 5 mL papain solution was added to 100 g defatted maize grain sample and incubated at 65 °C overnight. It was cooled down to room temperature, centrifuged and decanted. Carbonate buffer (0.5 mL, pH 9.0) and copper phosphate suspension (0.5 mL) was added to 1 mL digest; after that the mixture was shaken for 5 min in a vortex mix and centrifuged. To 1 mL supernatant 0.1 mL of pyridine reagent was added, mixed well and shaken for 2 h. Then after adding 5 mL of 1.2 M HCl and mixing, extraction was done 3 times with 5 mL ethyl acetate, and ethyl acetate top layer was discarded. The absorbance of aqueous layer was read at 390 nm136. The standard lysine solution was prepared by dissolving 62.5 mg lysine mono hydro-chloride in 50 mL carbonate buffer. For preparing a standard curve, 0.2, 0.4, 0.6, 0.8 and 1.0 mL of the standard lysine solution was pipetted out in different test tubes and final volume of 1 mL was made using carbonate buffer. Later, added 4 mL papain to each tube and mixed thoroughly. Now, 1 mL was pipetted out and 0.5 mL of amino acid mixture and 0.5 mL of copper phosphate suspension were added to it. Afterwards, 1 mL solution from each test tube was transferred to other test tubes and adding 0.5 mL amino acid mixture and 0.5 mL copper phosphate suspension to each one. The above steps were repeated as followed in case of samples and the absorbance of aqueous layer was read at 390 nm136. The lysine content in maize samples was determined from standard curve and results were expressed as g kg−1 dry matter.
For estimation of tryptophan, 15 mg defatted maize grain sample was taken in three different 50 mL conical flasks. In 2 flasks, 30 mg of p-dimethyl amino benzaldehyde was added. Third flask acted as the blank. To all the flasks, 9.5 M H2SO4 solution was added. The flasks were kept in dark for 20 h at 30 °C followed by addition of 0.1 mL of 0.045% NaNO2 solution to each flask. After mixing, the flasks were again kept for 30 min at room temperature. After centrifugation, the absorbance of blue color of the solution was measured at 660 nm137. A standard curve of tryptophan was prepared by taking various concentrations (10 to 60 µg mL) of standard tryp-tophan solution; the volume was made up to 0.6 mL by adding distilled water followed by addition of 9.4 mL of 9.5 M H2SO4 solution slowly and mixed gently. Same steps were followed for the standard solutions. Tryptophan content in the samples was determined from standard curve and expressed as µg g−1.
Oil content and oil yield. Oil content (%) in maize grains was determined by petroleum ether extraction in a Soxhlet apparatus for 16 h according to AOAC procedure 948.22138. Oil yield (kg ha−1) in maize grains was calculated by using following formula:
Fatty acid analysis and fatty acid ratios. The 100 mg powdered maize grain samples were defatted with solvent mixture of Chloroform:Hexane:Methanol (8:5:2 v/v) for fatty acid analysis. The extracts were dried under a stream of nitrogen and fatty acids were converted into methyl-esters using 0.5 M KOH and 0.5 M HCl. Fatty acids were separated using Gas Chromatography-Mass Spectrometry (GC–MS) following the method as suggested by Kumar and Dhillon139. Separation of fatty acids viz. Palmitic acid, Stearic acid, Oleic acid and Lin-oleic acid was carried-out using HP Innowax capillary column (30 m × 0.32 m × 0.5 µm). The separated peaks were identified on the basis of retention time of standard fatty acid peaks and confirmed using GC–MS library. Besides fatty acid synthesis, different fatty acid ratios viz. ODR, MUFA: PUFA, SFA: UFA and PUFA: SFA were also worked-out using standard formulae38. These ratios were calculated excluding the linolenic acid because its contribution to total fatty acid composition was < 1% in maize grain oil.
Amylose content =
(
O.D.×Dilution factor
Slope
)
Tryptophan (µg/g) =µg tryptophan from standard curve
Weight of grain sample (g)
Oil yield (kg/ha) =
(
Oil content (%)× Grain yield (kg/ha)
100
)
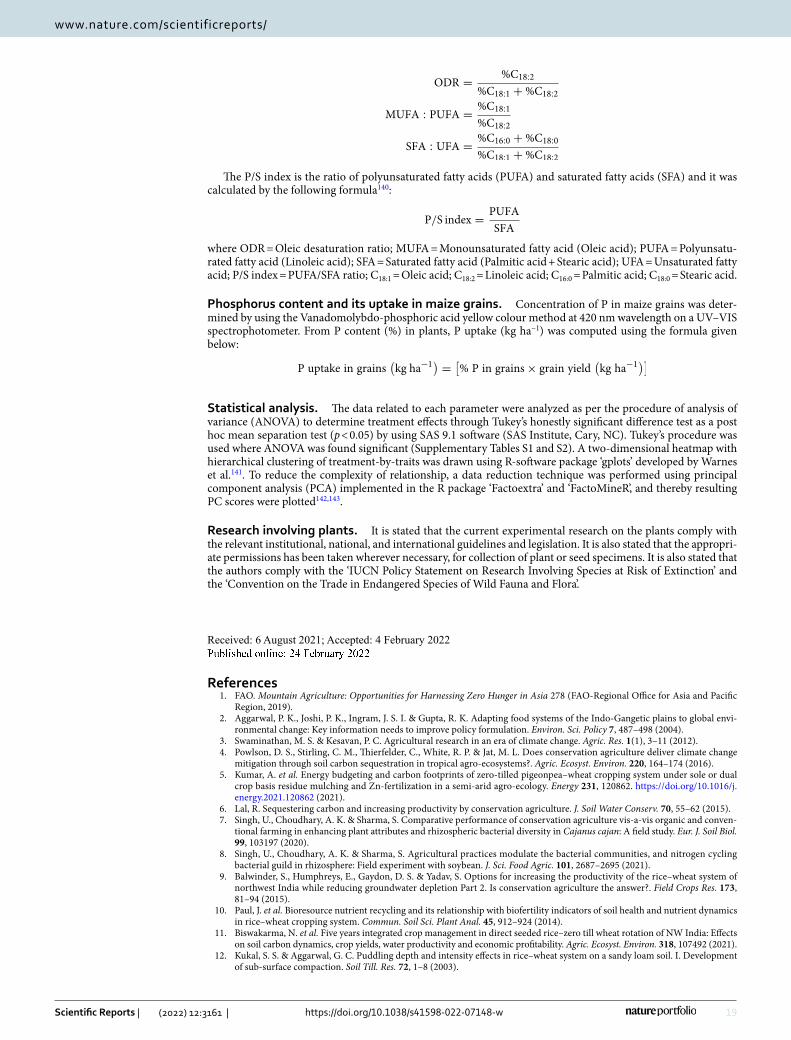
19
Vol.:(0123456789)
Scientific Reports | (2022) 12:3161 | https://doi.org/10.1038/s41598-022-07148-w
www.nature.com/scientificreports/
The P/S index is the ratio of polyunsaturated fatty acids (PUFA) and saturated fatty acids (SFA) and it was calculated by the following formula140:
where ODR = Oleic desaturation ratio; MUFA = Monounsaturated fatty acid (Oleic acid); PUFA = Polyunsatu-rated fatty acid (Linoleic acid); SFA = Saturated fatty acid (Palmitic acid + Stearic acid); UFA = Unsaturated fatty acid; P/S index = PUFA/SFA ratio; C18:1 = Oleic acid; C18:2 = Linoleic acid; C16:0 = Palmitic acid; C18:0 = Stearic acid.
Phosphorus content and its uptake in maize grains. Concentration of P in maize grains was deter-mined by using the Vanadomolybdo-phosphoric acid yellow colour method at 420 nm wavelength on a UV–VIS spectrophotometer. From P content (%) in plants, P uptake (kg ha−1) was computed using the formula given below:
Statistical analysis. The data related to each parameter were analyzed as per the procedure of analysis of variance (ANOVA) to determine treatment effects through Tukey’s honestly significant difference test as a post hoc mean separation test (p < 0.05) by using SAS 9.1 software (SAS Institute, Cary, NC). Tukey’s procedure was used where ANOVA was found significant (Supplementary Tables S1 and S2). A two-dimensional heatmap with hierarchical clustering of treatment-by-traits was drawn using R-software package ‘gplots’ developed by Warnes et al.141. To reduce the complexity of relationship, a data reduction technique was performed using principal component analysis (PCA) implemented in the R package ‘Factoextra’ and ‘FactoMineR’, and thereby resulting PC scores were plotted142,143.
Research involving plants. It is stated that the current experimental research on the plants comply with the relevant institutional, national, and international guidelines and legislation. It is also stated that the appropri-ate permissions has been taken wherever necessary, for collection of plant or seed specimens. It is also stated that the authors comply with the ‘IUCN Policy Statement on Research Involving Species at Risk of Extinction’ and the ‘Convention on the Trade in Endangered Species of Wild Fauna and Flora’.
Received: 6 August 2021; Accepted: 4 February 2022
References 1. FAO. Mountain Agriculture: Opportunities for Harnessing Zero Hunger in Asia 278 (FAO-Regional Office for Asia and Pacific
Region, 2019). 2. Aggarwal, P. K., Joshi, P. K., Ingram, J. S. I. & Gupta, R. K. Adapting food systems of the Indo-Gangetic plains to global envi-
ronmental change: Key information needs to improve policy formulation. Environ. Sci. Policy 7, 487–498 (2004). 3. Swaminathan, M. S. & Kesavan, P. C. Agricultural research in an era of climate change. Agric. Res. 1(1), 3–11 (2012). 4. Powlson, D. S., Stirling, C. M., Thierfelder, C., White, R. P. & Jat, M. L. Does conservation agriculture deliver climate change
mitigation through soil carbon sequestration in tropical agro-ecosystems?. Agric. Ecosyst. Environ. 220, 164–174 (2016). 5. Kumar, A. et al. Energy budgeting and carbon footprints of zero-tilled pigeonpea–wheat cropping system under sole or dual
crop basis residue mulching and Zn-fertilization in a semi-arid agro-ecology. Energy 231, 120862. https:// doi. org/ 10. 1016/j. energy. 2021. 120862 (2021).
6. Lal, R. Sequestering carbon and increasing productivity by conservation agriculture. J. Soil Water Conserv. 70, 55–62 (2015). 7. Singh, U., Choudhary, A. K. & Sharma, S. Comparative performance of conservation agriculture vis-a-vis organic and conven-
tional farming in enhancing plant attributes and rhizospheric bacterial diversity in Cajanus cajan: A field study. Eur. J. Soil Biol. 99, 103197 (2020).
8. Singh, U., Choudhary, A. K. & Sharma, S. Agricultural practices modulate the bacterial communities, and nitrogen cycling bacterial guild in rhizosphere: Field experiment with soybean. J. Sci. Food Agric. 101, 2687–2695 (2021).
9. Balwinder, S., Humphreys, E., Gaydon, D. S. & Yadav, S. Options for increasing the productivity of the rice–wheat system of northwest India while reducing groundwater depletion Part 2. Is conservation agriculture the answer?. Field Crops Res. 173, 81–94 (2015).
10. Paul, J. et al. Bioresource nutrient recycling and its relationship with biofertility indicators of soil health and nutrient dynamics in rice–wheat cropping system. Commun. Soil Sci. Plant Anal. 45, 912–924 (2014).
11. Biswakarma, N. et al. Five years integrated crop management in direct seeded rice–zero till wheat rotation of NW India: Effects on soil carbon dynamics, crop yields, water productivity and economic profitability. Agric. Ecosyst. Environ. 318, 107492 (2021).
12. Kukal, S. S. & Aggarwal, G. C. Puddling depth and intensity effects in rice–wheat system on a sandy loam soil. I. Development of sub-surface compaction. Soil Till. Res. 72, 1–8 (2003).
ODR =%C18:2
%C18:1 +%C18:2
MUFA : PUFA =%C18:1
%C18:2
SFA : UFA =%C16:0 +%C18:0
%C18:1 +%C18:2
P/S index =PUFA
SFA
P uptake in grains(
kg ha−1)
=[
% P in grains× grain yield(
kg ha−1)]

20
Vol:.(1234567890)
Scientific Reports | (2022) 12:3161 | https://doi.org/10.1038/s41598-022-07148-w
www.nature.com/scientificreports/
13. Mahajan, G., Singh, K. & Gill, M. S. Scope for enhancing and sustaining rice productivity in Punjab (food bowl of India). Afr. J. Agric. Res. 7, 5611–5620 (2012).
14. IPCC Intergovernmental Panel on Climate Change: The physical science basis. In Contribution to the Fourth Assessment Report of the Intergovernmental Panel on Climate Change (eds Solomon, S. et al.) (Cambridge University Press, 2007).
15. Abdurrahman, M. I., Chaki, S. & Saini, G. Stubble burning: Effects on health and environment, regulations and management practices. Environ. Adv. 2, 100011 (2020).
16. Parihar, C. M. et al. Conservation agriculture in irrigated intensive maize-based systems of NW India: Effects on crop yields, water productivity and economic profitability. Field Crops Res. 193, 104–116 (2016).
17. Pooniya, V. et al. Long-term conservation agriculture and best nutrient management improves productivity and profitability coupled with soil properties of a maize–chickpea rotation. Sci. Rep. 11, 10386 (2021).
18. NPMCR. National Policy on Management of Crop Residues-2014. Available online: http:// agric oop. nic. in/ sites/ defau lt/ files/ NPMCR_1. pdf (2014).
19. Bhuvaneshwari, S., Hettiarachchi, H. & Meegoda, J. N. Crop residue burning in India: Policy challenges and potential solutions. Int. J. Environ. Res. Public Health 16, 832 (2019).
20. Page, K. L., Dang, Y. P. & Dalal, R. C. Ability of conservation agriculture to conserve soil organic carbon and the subsequent impact on soil physical, chemical, biological properties and yield. Front. Sust. Food Syst. 4, 31 (2020).
21. Jat, H. S. et al. Conservation agriculture-based sustainable intensification of cereal systems leads to energy conservation, higher productivity and farm profitability. Environ. Manag. https:// doi. org/ 10. 1007/ s00267- 020- 01273-w (2020).
22. Keesstra, S. et al. The significance of soils and soil science towards realization of the United Nations Sustainable Development Goals. Soil 2, 111–128 (2016).
23. Keesstra, S. et al. Soil-related sustainable development goals: Four concepts to make land degradation neutrality and restoration work. Land 7(4), 133 (2018).
24. Visser, S., Keesstra, S., Maas, G., De Cleen, M. & Molenaar, C. Soil as a basis to create enabling conditions for transitions towards sustainable land management as a key to achieve the SDGs by 2030. Sustainability 11, 6792 (2019).
25. Soil Health and Food Mission Board. Caring for Soil is Caring for Life. Ensure 75% of Soils are Healthy by 2030 for Healthy Food, People, Nature and Climate: Interim Report of the Mission Board for Soil Health and Food (Soil Health and Food Mission Board, 2020).
26. Fonseca, L. M., Domingues, J. P. & Dima, A. M. Mapping the sustainable development goals relationships. Sustainability 12, 3359 (2020).
27. Govaerts, B., Sayre, K. D., Lichter, E., Dendooven, L. & Deckers, J. Influence of permanent raised bed planting and residue management on physical and chemical soil quality in rain fed maize–wheat systems. Plant Soil 291, 39–54 (2007).
28. Machado, P. L. O. A. & Silva, C. A. Soil management under no tillage systems in the tropics with special reference to Brazil. Nutr. Cycl. Agroecosyst. 61, 119–130 (2001).
29. Bescansa, P., Imaz, M. J., Virto, I., Enrique, A. & Hoogmoed, W. B. Soil water retention as affected by tillage and residue manage-ment in semiarid Spain. Soil Till. Res. 87, 19–27 (2006).
30. Thomas, G. A., Dalal, R. C. & Standley, J. No-till effects on organic matter, pH and cation exchange capacity and nutrient dis-tribution in a Luvisol in the semi-arid subtropics. Soil Till. Res. 94, 295–304 (2007).
31. Hansen, N. C., Allen, B. L., Baumhardt, R. L. & Lyon, D. J. Research achievements and adoption of no-till, dryland cropping in the semi-arid US Great Plains. Field Crops Res. 132, 196–203 (2012).
32. Luo, Z., Wang, E. & Sun, O. J. Can no-tillage stimulate carbon sequestration in agricultural soils? A meta-analysis of paired experiments. Agric. Ecosyst. Environ. 139, 224–231 (2012).
33. Zhang, H. L., Lal, R., Zhao, X., Xue, J. F. & Chen, F. Opportunities and challenges of soil carbon sequestration by conservation agriculture in China. Adv. Agron. 124, 1–36 (2014).
34. Blanco-Canqui, H. & Ruis, S. J. No-tillage and soil physical environment. Geoderma 326, 164–200 (2018). 35. Parihar, C. M. et al. Changes in carbon pools and biological activities of a sandy loam soil under medium-term conservation
agriculture and diversified cropping systems. Eur. J. Soil Sci. 69, 902–912 (2018). 36. FAOSTAT. Statistical Databases and Data-Sets of the Food and Agriculture Organization of the United Nations http:// faost at. fao.
org/ site/ 567/ Deskt opDef ault. aspx? PageID= 567# ancor (2018). 37. Blanchart, E. Fourteen years of evidence for positive effects of conservation agriculture and organic farming on soil life. Agron.
Sust. Dev. 35, 169–181 (2015). 38. Ray, K., Banerjee, H., Dutta, S., Hazra, A. K. & Majumdar, K. Macronutrients influence yield and oil quality of hybrid maize.
PLoS ONE 14, e0216939 (2019). 39. Yadav, O. P. et al. Genetic improvement of maize in India: Retrospect and prospects. Agric. Res. 4, 325–338 (2015). 40. Shiferaw, B., Prasanna, B. M., Hellin, J. & Banziger, M. Crops that feed the world 6. Past successes and future challenges to the
role played by maize in global food security. Food Secur. 3, 303–327 (2011). 41. Kumar, N. & Salakinkop, S. R. Agronomic bio-fortification of maize with zinc and iron micronutrients. Modern Concepts Dev.
Agron. 1, 1–4 (2018). 42. Dupont, J. et al. Food uses and health effects of corn oil. J. Am. Coll. Nutr. 9, 438–470 (1990). 43. FICCI. Maize Vision–2020 86 (Federation of Indian Chambers of Commerce and Industry (FICCI), 2018). 44. Ortiz-Fernandez, M. P. et al. Digestibility and acceptability of wheat flour cookies partially substituted with high amylose maize
starch. Plant Foods Hum. Nutr. 74, 446–447 (2019). 45. Dipnaik, K. & Kokare, P. Ratio of amylose and amylopectin as indicators of glycemic index and in vitro enzymatic hydrolysis of
starches of long, medium and short grain rice. Int. J. Res. Med. Sci. 5, 4502–4505 (2017). 46. Mondal, D., Simgh, A., Praveen, S. & Krishnan, V. Resistant starch: could this immunity booster play a positive role in COVID-
19 management?. Sci. Rep. 57, 30–31 (2020). 47. Laurie, C. C. et al. The genetic architecture of response to long-term artificial selection for oil concentration in the maize kernel.
Genetics 168, 2141–2155 (2004). 48. Moreau, R. A., Johnston, D. B. & Hicks, K. B. The influence of moisture content and cooking on the screw pressing and pre-
pressing of corn oil from corn germ. J. Am. Oil Chem. Soc. 82, 851–854 (2005). 49. Rajendran, A. et al. Corn Oil: An Emerging Industrial Product. Technical Bulletin No. 8, p. 36 (Directorate of Maize Research,
2012). 50. Bilgin, O. et al. Interrelationships among some quality characteristics in dent corn (Zea mays L.). Cereal Res. Commun. 38,
233–242 (2010). 51. Kumar, A., Choudhary, A. K. & Suri, V. K. Agronomic bio-fortification and quality enhancement in okra-pea cropping system
through AM-fungi at varying phosphorus and irrigation regimes in Himalayan acid Alfisol. J. Plant Nutr. 40, 1213–1229 (2017). 52. Hobbs, P. R., Sayre, K. & Gupta, R. The role of conservation agriculture in sustainable agriculture. Philos. Trans. R. Soc. 363,
543–555 (2008). 53. Garry, D., Bridge, B. J. & Radford, B. J. Contrasting soil physical properties after zero and traditional tillage of an alluvial soil in
semi-arid subtropics. Soil Till. Res. 53, 105–115 (2009). 54. Kumar, S., Choudhary, A. K., Rana, K. S., Sarkar, A. & Singh, M. Bio-fortification potential of global wild annual lentil core
collection. PLoS ONE 13, e0191122 (2018).

21
Vol.:(0123456789)
Scientific Reports | (2022) 12:3161 | https://doi.org/10.1038/s41598-022-07148-w
www.nature.com/scientificreports/
55. Ali, A. & Ullah, S. Effect of nitrogen on achene protein, oil, fatty acid profile and yield of sunflower hybrids. Chilean J. Agric. Res. 72, 564–567 (2012).
56. Krueger, K., Goggi, A. S., Mallarino, A. P. & Mullen, R. E. Phosphorus and potassium fertilization effects on soybean seed quality and composition. Crop Sci. 53, 602–610 (2013).
57. Rana, D. S., Dass, A., Rajanna, G. A. & Choudhary, A. K. Fertilizer phosphorus solubility effects on Indian mustard–maize and wheat–soybean cropping systems productivity. Agron. J. 110, 2608–2618 (2018).
58. Rafiullah Khan, M. J. & Muhammad, D. Foliar application of P to enhance P utilization and crop growth: A hydroponic study. Sarhad J. Agric. 34, 47–53 (2017).
59. Zou, X., Binkley, D. & Doxtader, K. G. A new method for estimating gross phosphorus mineralization and immobilization rates in soils. Plant Soil 147, 243–250 (1992).
60. Pooniya, V. et al. ‘Nutrient expert’ assisted SSNM: An alternative precision fertilization technology for maize–wheat cropping system in south-Asian Indo-Gangetic plains. Indian J. Agric. Sci. 85, 996–1002 (2015).
61. Harrier, L. A. & Watson, C. A. The role of arbuscular mycorrhizal fungi in sustainable cropping systems. Adv. Agron. 42, 185–225 (2003).
62. Amanullah, S. A., Iqbal, A. & Fahad, S. Foliar P and Zn application improve growth and productivity of maize under moisture stress conditions in semi-arid climates. J. Microbiol. Biochem. Technol. 8, 433–439 (2016).
63. Abrol, I. P. & Sangar, S. Sustaining Indian agriculture-conservation agriculture the way forward. Curr. Sci. 91, 1020–1025 (2006). 64. Stone, J. A., Vyn, T. J., Martin, H. & Groerevelt, P. A. Ridge tillage and early season soil moisture and temperature on a poorly
drained soil. Can. J. Soil Sci. 69, 181–186 (1989). 65. Varatharajan, T. et al. Influence of integrated crop management practices on yield, PAR interception, resource-use-efficiency
and energetics in pigeonpea in north Indian plains. J. Environ. Biol. 40(6), 1204–1210 (2019). 66. Lafond, G. P., Loeppky, H. & Derksen, D. A. Effects of tillage systems and crop rotations on soil water conservation: Seedling
establishment and crop yield. Can. J. Soil Sci. 72, 103–115 (1992). 67. Mashingaidze, N., Twomlow, S. J. & Hove, L. Crop and weed responses to residue retention and method of weeding in first 2
years of a hoe based minimum tillage system in semi arid Zimbabwe. J. Semi Arid Trop. Agric. Res. 7, 1–11 (2009). 68. Dass, A. et al. Weed management in rice using crop competition-a review. Crop Prot. 95, 45–52 (2016). 69. Six, J., Elliott, E. T. & Paustian, K. Soil macroaggregate turnover and microaggregate formation: A mechanism for C sequestra-
tion under no-tillage agriculture. Soil Biol. Biochem. 32, 2099–2103 (2000). 70. Choudhary, A. K. et al. Integrated crop management technology for enhanced productivity, resource use efficiency and soil
health in legumes—A review. Indian J. Agric. Sci. 90, 1839–1849 (2020). 71. Thierfelder, C., Amezquita, E. & Stahr, K. Effects of intensifying organic manuring and tillage practices on penetration resistance
and infiltration rate. Soil Till. Res. 82, 211–226 (2005). 72. Ram, H. et al. Agronomic and economic evaluation of permanent raised beds, no tillage and straw mulching for an irrigated
maize–wheat system in northwest India. Exp. Agric. 48, 21–38 (2011). 73. Peixoto, R. S., Coutinho, H. L. C., Madari, B. & Machado, P. L. O. A. Soil aggregation and bacterial community structure as
affected by tillage and cover cropping in the Brazilian Cerrados. Soil Till. Res. 90, 16–28 (2006). 74. Singh, G., Kumar, D., Marwaha, T. S., Singh, A. K. & Srinivasmurthy, K. Conservation tillage and integrated nitrogen manage-
ment stimulates soil microbial properties under varying water regimes in maize–wheat cropping system in northern India. Arch. Agron. Soil Sci. 57, 507–521 (2011).
75. Verachtert, E. et al. Short term changes in dynamics of C and N in soil when crops are cultivated on permanent raised beds. Plant Soil 320, 281–293 (2009).
76. Naresh, R. K. et al. Effect of precision land leveling and permanent raised bed planting on soil properties, input use efficiency, productivity and profitability under maize–wheat cropping system. Indian J. Agric. Sci. 84, 725–732 (2014).
77. Rogério, F., da Silva, T. R. B., dos Santos, J. I. & Poletine, J. P. Phosphorus fertilization influences grain yield and oil content in crambe. Ind. Crops Prod. 41, 266–268 (2013).
78. Suri, V. K. & Choudhary, A. K. Effect of VAM fungi and phosphorus application through soil-test crop response precision model on crop productivity, nutrient dynamics, and soil fertility in soybean–wheat–soybean crop sequence in an acidic Alfisol. Com-mun. Soil Sci. Plant Anal. 44, 2032–2041 (2013).
79. Marschner, H. & Dell, B. Nutrient uptake in mycorrhizal symbiosis. Plant Soil 159, 89–102 (1994). 80. Suri, V. K., Choudhary, A. K., Chander, G., Gupta, M. K. & Dutt, N. Improving P-use through co-inoculation of VAM fungi and
PSB in maize in an acid Alfisol. Commun. Soil Sci. Plant Anal. 42, 2265–2273 (2011). 81. Sadiq, G. et al. Impact of phosphorus and potassium levels on yield and yield components of maize. Pure Appl. Biol. 6, 1071–1078
(2017). 82. Zhang, R., Li, C., Fu, K., Li, C. & Li, C. Phosphorus alters starch morphology and gene expression related to starch biosynthesis
and degradation in wheat grain. Front. Plant Sci. 8, 2252 (2018). 83. Raghavendra, M. et al. Residue and potassium management strategies to improve crop productivity, potassium mobilization,
and assimilation under zero-till maize–wheat cropping system. Agriculture 10, 401 (2020). 84. Rathke, G. W., Wienhold, B. J., Wilhelm, W. W. & Diepenbrock, W. Tillage and rotation effect on corn-soybean energy balances
in eastern Nebraska. Soil Till. Res. 97, 60–70 (2007). 85. Bertoft, E. Understanding starch structure: recent progress. Agronomy 7, 56 (2017). 86. Unger, P. W. Wheat residue management effects on soil water storage and corn production. Soil Sci. Soc. Am. J. 50, 764–770
(1986). 87. Saxton, K. E., Bristow, K. L., Flerchinger, G. N. & Omer, M. A. Tillage and crop residue management for water conservation. In
Proceedings of the International Conference on Dryland Farming, Amarillo, USA 493–497 (1988). 88. Iyamuremye, F. & Dick, R. P. Organic amendments and phosphorus sorption by soils. Adv. Agron. 56, 139–185 (1996). 89. Oikeh, S. O., Kling, J. G. & Okoruwa, A. E. Nitrogen management effects on maize grain quality in the West Africa moist savanna.
Crop Sci. 38, 1056–1061 (1998). 90. Seebauer, J. R., Moose, S. P., Fabbri, B. J., Crossland, L. D. & Below, F. E. Amino acid metabolism in maize earshoots. Implications
for assimilate preconditioning and nitrogen signaling. Plant Physiol. 136, 4326–4334 (2004). 91. Tsai, C. Y., Warren, H. L., Huber, D. M. & Bressan, R. A. Interactions between the kernel N sink, grain yield and protein nutri-
tional quality of maize. J. Sci. Food Agric. 34, 255–263 (1983). 92. Rhoton, F. E. Influence of time on soil response to no-till practices. Soil Sci. Soc. Am. J. 64, 700–709 (2000). 93. Mbuthia, L. W., Acosta-Martínez, V. & DeBruyn, J. Long term tillage, cover crop, and fertilization effects on microbial community
structure, activity: Implications for soil quality. Soil Biol. Biochem. 89, 24–34 (2015). 94. Choudhary, A. K. & Rahi, S. Organic cultivation of high yielding turmeric (Curcuma longa L.) cultivars: A viable alternative
to enhance rhizome productivity, profitability, quality and resource-use efficiency in monkey-menace areas of north-western Himalayas. Ind. Crops Prod. 124, 495–504 (2018).
95. Son, T., Diep, N. C., Giang, T. T. M. & Thu, T. T. A. Effect of co-inoculants (Bradyrhizobia & PSB) liquid on soybean under rice based cropping system. Omon Rice 15, 135–143 (2016).
96. Choudhary, A. K. et al. Post-emergence herbicides for effective weed management, enhanced wheat productivity, profitability and quality in NW Himalayas: A ‘participatory-mode’ technology development and dissemination. Sustainability 13, 5425 (2021).

22
Vol:.(1234567890)
Scientific Reports | (2022) 12:3161 | https://doi.org/10.1038/s41598-022-07148-w
www.nature.com/scientificreports/
97. Huang, S., Frizzi, A., Florida, C. A., Kruger, D. E. & Luethy, M. H. High lysine and high tryptophan transgenic maize resulting from the reduction of both 19- and 22-kD α-zeins. Plant Mol. Biol. 61, 525–535 (2006).
98. Kirkman, M. A., Shewry, P. R. & Miflin, B. J. Effect of nitrogen nutrition on lysine content and protein composition of barley seeds. J. Sci. Food Agric. 33, 115–127 (1982).
99. Eppendorfer, W. H. Effects of nitrogen, phosphorus and potassium on amino acid composition and on relationships between nitrogen and amino acids in wheat and oat grain. J. Sci. Food Agric. 29, 995–1001 (1978).
100. Olsen, S. R. Micronutrient interaction. In Micronutrients in Agriculture (ed. Dinauer, R. C.) 243–264 (Soil Science Society of America, Inc., 1972).
101. Heba, M. N., Rana, D. S., Choudhary, A. K., Rajanna, G. A. & Pande, P. Influence of sulphur and zinc nutrition on productivity, quality and biofortification in groundnut (Arachis hypogaea L.) in south-Asian alluvial soil. J. Plant Nutr. 44, 1151–1174 (2021).
102. Skoog, F. Relationships between Zn and auxin in the growth of higher plants. Am. J. Bot. 27, 939–951 (1940). 103. Kumar, A., Choudhary, A. K., Pooniya, V., Suri, V. K. & Singh, U. Soil factors associated with micronutrient acquisition in
crops—Biofortification perspective. In Biofortification of Food Crops (eds Singh, U. et al.) 159–176 (Springer Publishers, 2016). 104. Abdullah, A. S. Minimum tillage and residue management increase soil water content, soil organic matter and canola seed yield
and seed oil content in semi-arid areas of northern Iraq. Soil Till. Res. 144, 150–155 (2014). 105. Dag, A. et al. Olive oil composition as a function of nitrogen, phosphorus and potassium plant nutrition. J. Sci. Food Agric. 89,
1871–1878 (2009). 106. Rahul, K. S., Amit, M. P., Aravinda, K. B. N. & Hebsur, N. S. Sulphur nutrition in maize—A critical review. Int. J. Pure Appl.
Biosci. 5, 1582–1596 (2017). 107. WCFA. Plant Nutrients Removed by Crops (Western Canada Fertilizer Association, 1992). 108. Malavolta, E., Vitti, G. C. & Oliveira, S. A. Avaliac¸ ão do estado nutricional das plantas. In princípios e aplicac¸ ões 2nd edn,
319 (Potafos, 1997). 109. Welch, L. F. Effect of N, P and K on the percent and yield of oil in corn. Agron. J. 61, 890–891 (1969). 110. Sanjeev, P. et al. Comparison of fatty acid profile of specialty maize to normal maize. J. Am. Oil Chem. Soc. 91, 1001–1005 (2014). 111. Israel, D. W., Kwanyuen, P., Burton, J. W. & Walker, D. R. Response of low seed phytic acid soybeans to increases in external
phosphorus supply. Crop Sci. 47, 2036–2046 (2007). 112. Genet, T., Labuschagne, M. & Hugo, A. Capillary gas chromatography analysis of Ethiopian mustard to determine variability
of fatty acid composition. J. Sci. Food Agric. 84, 1663–1670 (2004). 113. Sawan, Z. M., Hafez, S. A., Basyony, A. E. & Alkassas, A. R. Nitrogen, potassium and plant growth retardant effects on oil content
and quality of cotton seed. Grasas Aceites 58, 243–251 (2007). 114. Alipatra, A. Response of Sunflower to Varied Levels of Fertilizer and Irrigation Management Under New Alluvial Zone of West
Bengal. Ph.D. Thesis, Bidhan Chandra Krishi Viswavidyalaya, West Bengal, India (2017). 115. McClements, D. J. & Decker, E. A. Lipids. In Food Chemistry (eds Srinivasan, D. et al.) 155–216 (CRC Press, 2008). 116. Simopoulos, A. P. Summary of NATO advanced research workshop on dietary w-3 and w-6 fatty acids: Biological effects and
nutritional essentiality. J. Nutr. 19, 521–528 (1989). 117. Surai, P. F. & Sparks, N. H. C. Designer eggs: From improvement of egg composition to functional food. Trends Food Sci. Technol.
12, 7–16 (2001). 118. Gutierrez, F., Jimenez, B., Ruiz, A. & Albi, M. A. Effect of olive ripeness on the oxidative stability of virgin olive oil extracted
from the varieties Picual and Hojiblanca and on the different components involved. J Agric. Food Chem. 47, 121–127 (1999). 119. Cerdà, A., Rodrigo-Comino, J., Giménez-Morera, A. & Keesstra, S. D. An economic perception and biophysical approach to
the use of oat straw as mulch in Mediterranean rainfed agriculture land. Ecol. Eng. 108, 162–171 (2017). 120. Paul, J. et al. Potato production through bio-resources: Long-term effects on tuber productivity, quality, carbon sequestration
and soil health in temperate Himalayas. Sci. Hort. 213, 152–163 (2016). 121. Mehta, Y. K., Shaktawat, M. S. & Singhi, S. M. Influence of S, P and FYM on yield attributes and yield of maize in southern
Rajasthan conditions. Ind. J. Agron. 50, 203–205 (2005). 122. Bouyoucos, C. J. Hydrometer method improved for making particle size analysis of soil. Agron. J. 54, 464–465 (1962). 123. Veihmeyer, F. J. & Hendrickson, A. Soil density and root penetration. Soil Sci. 65, 487–494 (1948). 124. Jackson, M. L. Soil Chemical Analysis 187 (Prentice Hall of India Private Limited, 1973). 125. Subbiah, B. V. & Asija, G. L. A rapid procedure for estimation of available-N in soils. Curr. Sci. 25, 259–260 (1956). 126. Olsen, S. R., Cole, C. V., Watanabe, F. S. & Dean. L. A. Estimation of Available Phosphorus in Soils by Extraction with Sodium
Bicarbonate. Government Printing Office Washington D.C., USDA, Circular No. 939, pp. 1–19 (1954). 127. Piper, C. S. Soil and Plant Analysis 355 (The University of Adelaide Press, 1965). 128. Richards, L. A. Diagnosis and Improvement of Saline and Alkaline Soils. US Soil Salinity Staff Agricultural Handbook No. 60 160
(USDA, 1954). 129. Nunan, N., Morgan, M. A. & Herlihy, M. Ultraviolet absorbance (280 nm) of compounds released from soil during chloroform
fumigation as an estimate of microbial biomass. Soil Biol. Biochem. 30, 1599–1603 (1998). 130. Casida, L., Klein, D. & Santoro, T. Soil dehydrogenase activity. Soil Sci. 98, 371–376 (1964). 131. Tabatabai, M. A. & Bremner, J. M. Use of p-nitrophenyl phosphate for assay of soil phosphatase activity. Soil Biol. Biochem. 1,
254–260 (1969). 132. Rana, K. S., Choudhary, A. K., Sepat, S., Bana, R. S. & Dass, A. Methodological and Analytical Agronomy 276 (Post Graduate
School, IARI, 2014). 133. Basu, S., Roychoudhury, A., Sanyal, S. & Sengupta, D. N. Carbohydyrate content and antioxidative potential of the seed of three
edible Indica rice cultivars. Ind. J. Biochem. Biophys. 49, 115–123 (2012). 134. Juliano, B. O. Relation of physiochemical properties to processing characteristics of rice. In Proceedings of 5th World Cereal and
Bread Congress, Dresden Vol. 4, 21 (1971). 135. Chattopadhyay, T., Biswas, T., Chatterjee, M., Mandal, N. & Battacharyya, S. Biochemical and SSR based characterization of
some Bengal landraces of rice suffixed with ‘sail’ in their name. Indian J. Gen. Plant Breed. 68, 15 (2008). 136. Mertz, E. T., Jambunathan, R. & Misra, P. S. In Protein Quality. Bulletin No. 70, p. 11 (Purdue University, 1975). 137. Spies, J. R. & Chambers, D. C. Chemical determination of tryptophan in proteins. Anal. Chem. 21, 1249–1252 (1949). 138. AOAC. AOAC Official Method 948.22. 2012. Fat (crude) in nuts and nut products. Gravimetric methods. In Official Methods
of Analysis of AOAC International, 19th edn (AOAC International, 2012) 139. Kumar, S. & Dhillon, M. K. Lipophilic metabolite profiling of maize and sorghum seeds and seedlings, and their pest spotted
stem borer larvae: A standardized GC-MS based approach. Indian J. Exp. Biol. 53, 170–176 (2015). 140. Kostik, V., Memeti, S. & Bauer, B. Fatty acid composition of edible oils and fats. J. Hyg. Eng. Des. 4, 112–116 (2013). 141. Warnes, G. R. et al. Gplots: Various R programming tools for plotting data. Software version number: ‘R package version 3.1.1’.
https:// CRAN.R- proje ct. org/ packa ge= gplots (2020). 142. R Core Team. R: A Language and Environment for Statistical Computing (R Foundation for Statistical Computing, 2020). https://
www.R- proje ct. org/. 143. Sebastien, L., Josse, J. & Husson, F. FactoMineR: An R package for multivariate analysis. J. Stat. Soft. 25, 1–18 (2008).

23
Vol.:(0123456789)
Scientific Reports | (2022) 12:3161 | https://doi.org/10.1038/s41598-022-07148-w
www.nature.com/scientificreports/
AcknowledgementsThe authors are grateful to ICAR–Indian Agricultural Research Institute, New Delhi and the Indian Council of Agricultural Research, New Delhi, India for financial assistance and technical support to carry-out this study. Technical support provided by the ICAR–National Bureau of Plant Genetic Resources, New Delhi, India and ICAR–Central Potato Research Institute, Shimla, India for extending the plant biochemical analytical facilities is also gratefully acknowledged.
Author contributionsH.M.N. conducted the research study, carried out the biochemical analysis, assembled the data, and wrote the manuscript. A.K.C. conceptualized, designed and conducted the research study, carried out the biochemical analysis, assembled the data, wrote, reviewed and edited the manuscript. S.K. carried out the biochemical analysis and edited the manuscript. A.D. designed the research study. V.K.S. did the interpretations. V.K.S. carried out the plant chemical analysis. V.T. carried out the biochemical analysis. M.K.D. carried out the biochemical analysis. S.S. carried out the biochemical analysis. V.K.D. wrote the manuscript. N.S.D. performed the statistical analysis. B.M. performed the statistical analysis. S.S. did the interpretations. S.P. carried out the plant chemical analysis. A.K. assembled the data and wrote the manuscript. S.K.R. prepared the figures and tables. G.G. wrote and edited the manuscript. P.V. carried out the biochemical analysis. A.K. reviewed the manuscript. S.G. prepared the figures and tables and edited the manuscript.
Competing interests The authors declare no competing interests.
Additional informationSupplementary Information The online version contains supplementary material available at https:// doi. org/ 10. 1038/ s41598- 022- 07148-w.
Correspondence and requests for materials should be addressed to A.K.C.
Reprints and permissions information is available at www.nature.com/reprints.
Publisher’s note Springer Nature remains neutral with regard to jurisdictional claims in published maps and institutional affiliations.
Open Access This article is licensed under a Creative Commons Attribution 4.0 International License, which permits use, sharing, adaptation, distribution and reproduction in any medium or
format, as long as you give appropriate credit to the original author(s) and the source, provide a link to the Creative Commons licence, and indicate if changes were made. The images or other third party material in this article are included in the article’s Creative Commons licence, unless indicated otherwise in a credit line to the material. If material is not included in the article’s Creative Commons licence and your intended use is not permitted by statutory regulation or exceeds the permitted use, you will need to obtain permission directly from the copyright holder. To view a copy of this licence, visit http:// creat iveco mmons. org/ licen ses/ by/4. 0/.
© The Author(s) 2022
Copyright © 2022 FDOKUMEN