Effect of Short-Term Zero Tillage and Legume Intercrops on ...
15
Citation: Saleem, M.F.; Ghaffar, A.; Rahman, M.H.u.; Imran, M.; Iqbal, R.; Soufan, W.; Danish, S.; Datta, R.; Rajendran, K.; EL Sabagh, A. Effect of Short-Term Zero Tillage and Legume Intercrops on Soil Quality, Agronomic and Physiological Aspects of Cotton under Arid Climate. Land 2022, 11, 289. https:// doi.org/10.3390/land11020289 Academic Editors: Cezary Kabala and Amrakh I. Mamedov Received: 17 December 2021 Accepted: 2 February 2022 Published: 14 February 2022 Publisher’s Note: MDPI stays neutral with regard to jurisdictional claims in published maps and institutional affil- iations. Copyright: © 2022 by the authors. Licensee MDPI, Basel, Switzerland. This article is an open access article distributed under the terms and conditions of the Creative Commons Attribution (CC BY) license (https:// creativecommons.org/licenses/by/ 4.0/). land Article Effect of Short-Term Zero Tillage and Legume Intercrops on Soil Quality, Agronomic and Physiological Aspects of Cotton under Arid Climate Muhammad Faisal Saleem 1 , Abdul Ghaffar 1 , Muhammad Habib ur Rahman 1,2 , Muhammad Imran 3 , Rashid Iqbal 4 , Walid Soufan 5 , Subhan Danish 6 , Rahul Datta 7 , Karthika Rajendran 8 and Ayman EL Sabagh 9, * 1 Department of Agronomy, MNS—University of Agriculture, Multan 60000, Pakistan; [email protected] (M.F.S.); [email protected] (A.G.); [email protected] (M.H.u.R.) 2 Crop Science, Institute of Crop Science and Resource Conservation (INRES), University of Bonn, 53115 Bonn, Germany 3 Department of Soil Science, MNS—University of Agriculture, Multan 60000, Pakistan; [email protected] 4 Department of Agronomy, The Islamia University Bahawalpur, Punjab 63100, Pakistan; [email protected] 5 Plant Production Department, College of Food and Agriculture Sciences, King Saud University, P.O. Box 2460, Riyadh 11451, Saudi Arabia; [email protected] 6 Department of Soil Science, Faculty of Agricultural Sciences and Technology, Bahauddin Zakariya University, Multan 60800, Pakistan; [email protected] 7 Department of Geology and Pedology, Faculty of Forestry and Wood Technology, Mendel University in Brno, 61300 Brno, Czech Republic; [email protected] 8 Vellore Institute of Technology (VIT), VIT School of Agricultural Innovations and Advanced Learning (VAIAL), Vellore 632014, Tamil Nadu, India; [email protected] 9 Department of Agronomy, Faculty of Agriculture, University of Kafrelsheikh, Kafrelsheikh 33516, Egypt * Correspondence: [email protected] Abstract: A detailed field experiment was carried out to study the effect of conventional and zero tillage and legume intercrops on soil health indicators and cotton productivity and also yield compo- nents of leguminous crops at the Research Farm, MNS-University of Agriculture, Multan, Pakistan. The field experiment was comprised of four legume intercrops (no intercrops (sole cotton), mung bean, mash bean, and soybean) and two tillage systems (three years zero tillage (ZT) and long-term conventional tillage (CT)). The CT showed the highest plant height (121 cm), total bolls per plant (22.9 bolls), boll weight (2.74 g) and seed yield (2031 kg ha -1 ) of the cotton crop, as compared to ZT. The highest leaf transpiration rate (9.28 mmol H 2 Om -2 s -1 ), net leaf photosynthetic rate (27.17 μmol m -2 s -1 ), stomatal conductance (0.493 mmol m -2 s -1 ), chlorophyll content (62.3 SPAD value), plant height (123 cm), total bolls per plant (24.4), boll weight (2.83 g), and seed yield (2090 kg ha -1 ) of cotton crop were recorded when it was grown as a sole crop, as compared to legume intercrops. However, soil organic matter (0.77%), phosphorus (8.08 mg kg -1 ), potassium (253 mg kg -1 ), and microbial population (7.26 × 10 6 Cfu) were higher in ZT than in CT. Mung bean showed a maximum number of pods (32), seed yield (173 kg ha -1 ), biomass (950 kg ha -1 ), and harvest index (19.0%), when intercropped with cotton. The highest land equivalent ratio and area time equivalent ratio were recorded in mung bean and cotton intercropping, grown under a CT system. Furthermore, the maximum benefit-cost ratio was recorded in mung bean and cotton intercropping, over sole cotton cropping under CT (1.75) and ZT (1.67) systems. The ZT and intercropping of leguminous crops with cotton might be a promising option for increasing the seed cotton yield, seed yield of leguminous crops, system profitability, and sustainability of soil health. Keywords: legume intercrop; soil productivity; sustainable agriculture; tillage practices; soil organic matter (SOM) Land 2022, 11, 289. https://doi.org/10.3390/land11020289 https://www.mdpi.com/journal/land
-
Upload
khangminh22 -
Category
Documents
-
view
0 -
download
0
Transcript of Effect of Short-Term Zero Tillage and Legume Intercrops on ...

�����������������
Citation: Saleem, M.F.; Ghaffar, A.;
Rahman, M.H.u.; Imran, M.; Iqbal, R.;
Soufan, W.; Danish, S.; Datta, R.;
Rajendran, K.; EL Sabagh, A. Effect of
Short-Term Zero Tillage and Legume
Intercrops on Soil Quality,
Agronomic and Physiological
Aspects of Cotton under Arid
Climate. Land 2022, 11, 289. https://
doi.org/10.3390/land11020289
Academic Editors: Cezary Kabala
and Amrakh I. Mamedov
Received: 17 December 2021
Accepted: 2 February 2022
Published: 14 February 2022
Publisher’s Note: MDPI stays neutral
with regard to jurisdictional claims in
published maps and institutional affil-
iations.
Copyright: © 2022 by the authors.
Licensee MDPI, Basel, Switzerland.
This article is an open access article
distributed under the terms and
conditions of the Creative Commons
Attribution (CC BY) license (https://
creativecommons.org/licenses/by/
4.0/).
land
Article
Effect of Short-Term Zero Tillage and Legume Intercrops onSoil Quality, Agronomic and Physiological Aspects of Cottonunder Arid ClimateMuhammad Faisal Saleem 1, Abdul Ghaffar 1, Muhammad Habib ur Rahman 1,2 , Muhammad Imran 3 ,Rashid Iqbal 4 , Walid Soufan 5 , Subhan Danish 6 , Rahul Datta 7 , Karthika Rajendran 8 andAyman EL Sabagh 9,*
1 Department of Agronomy, MNS—University of Agriculture, Multan 60000, Pakistan;[email protected] (M.F.S.); [email protected] (A.G.);[email protected] (M.H.u.R.)
2 Crop Science, Institute of Crop Science and Resource Conservation (INRES), University of Bonn,53115 Bonn, Germany
3 Department of Soil Science, MNS—University of Agriculture, Multan 60000, Pakistan;[email protected]
4 Department of Agronomy, The Islamia University Bahawalpur, Punjab 63100, Pakistan;[email protected]
5 Plant Production Department, College of Food and Agriculture Sciences, King Saud University, P.O. Box 2460,Riyadh 11451, Saudi Arabia; [email protected]
6 Department of Soil Science, Faculty of Agricultural Sciences and Technology, Bahauddin Zakariya University,Multan 60800, Pakistan; [email protected]
7 Department of Geology and Pedology, Faculty of Forestry and Wood Technology, Mendel University in Brno,61300 Brno, Czech Republic; [email protected]
8 Vellore Institute of Technology (VIT), VIT School of Agricultural Innovations and AdvancedLearning (VAIAL), Vellore 632014, Tamil Nadu, India; [email protected]
9 Department of Agronomy, Faculty of Agriculture, University of Kafrelsheikh, Kafrelsheikh 33516, Egypt* Correspondence: [email protected]
Abstract: A detailed field experiment was carried out to study the effect of conventional and zerotillage and legume intercrops on soil health indicators and cotton productivity and also yield compo-nents of leguminous crops at the Research Farm, MNS-University of Agriculture, Multan, Pakistan.The field experiment was comprised of four legume intercrops (no intercrops (sole cotton), mungbean, mash bean, and soybean) and two tillage systems (three years zero tillage (ZT) and long-termconventional tillage (CT)). The CT showed the highest plant height (121 cm), total bolls per plant(22.9 bolls), boll weight (2.74 g) and seed yield (2031 kg ha−1) of the cotton crop, as compared toZT. The highest leaf transpiration rate (9.28 mmol H2O m−2 s−1), net leaf photosynthetic rate (27.17µmol m−2 s−1), stomatal conductance (0.493 mmol m−2 s−1), chlorophyll content (62.3 SPAD value),plant height (123 cm), total bolls per plant (24.4), boll weight (2.83 g), and seed yield (2090 kg ha−1)of cotton crop were recorded when it was grown as a sole crop, as compared to legume intercrops.However, soil organic matter (0.77%), phosphorus (8.08 mg kg−1), potassium (253 mg kg−1), andmicrobial population (7.26 × 10⁶ Cfu) were higher in ZT than in CT. Mung bean showed a maximumnumber of pods (32), seed yield (173 kg ha−1), biomass (950 kg ha−1), and harvest index (19.0%),when intercropped with cotton. The highest land equivalent ratio and area time equivalent ratiowere recorded in mung bean and cotton intercropping, grown under a CT system. Furthermore, themaximum benefit-cost ratio was recorded in mung bean and cotton intercropping, over sole cottoncropping under CT (1.75) and ZT (1.67) systems. The ZT and intercropping of leguminous crops withcotton might be a promising option for increasing the seed cotton yield, seed yield of leguminouscrops, system profitability, and sustainability of soil health.
Keywords: legume intercrop; soil productivity; sustainable agriculture; tillage practices; soil organicmatter (SOM)
Land 2022, 11, 289. https://doi.org/10.3390/land11020289 https://www.mdpi.com/journal/land

Land 2022, 11, 289 2 of 15
1. Introduction
Cotton (Gossypium hirsutum L.) is known as white gold and is extensively cultivatedall over the world. It is a major fiber crop, with an economic impact of more than USD600 billion per year, worldwide [1]. It is the primary driver of the textile industry [2].Pakistan positioned fourth among cotton-producing countries, after India, China, andthe USA, and is the seventh largest cloth producer, globally [3]. Its production remainedat 11.94 million bales, from 2699 thousand hectares, having a share of 1% in the grossdomestic product (GDP) and 5.50% in agriculture value addition [3]. However, cottonproductivity is affected by low seed quality, water shortage, high input price, soil fertilitydepletion [4]. The agronomic factors, including tillage operations, improper irrigation,and sowing techniques, significantly further decrease cotton yield and production [5,6].Notably, the adoption of intensive tillage and mono-cropping of cotton leads to a depletionof soil health and its productivity [7]. Excessive monoculture and conventional tillagepractices cause soil erosion, degradation of soil structure, increased nutrient depletion, andreduced water retention capacity [8].
Nevertheless, many countries could undergo issues related to low soil fertility andpoor soil quality, due to land use changes, soil erosion, deforestation, and extreme climaticconditions in the future, especially arid and semi-arid regions in the Middle East, Asia, andAustralia [9,10]. The aim, now, should be focused on sustainable land development strate-gies that facilitate the fulfillment of needs of the current population, without compromisingthe resources, and preserving the resources to meet the demand of future generations [11].Indeed, sustainable agriculture is part of a sustainable land development strategy thatemphasizes the long-term production of food and cash crops, with minimal environmentaleffects and improved soil health [12]. Sustainable agriculture uses techniques that have noor minimal impacts, especially soil environments, such as soil flora and fauna [13]. Thesetechniques include soil microbiota management [14], zero tillage [15], prevention from soilerosion [16], fallowing the soils, and cover cropping, as well as inter-cropping [17,18].
The long-term zero tillage system is a sustainable tool which can sustain soil qualityand ultimately crop productivity [19]. Minimum tillage and zero tillage practices improvethe availability of soil phosphorus, potassium, soil organic matter under arid climaticconditions [19,20]. Similarly, many field trials have shown that soil organic matter increasesunder long-term zero tillage systems [21,22]. Additionally, the microbial population alsoshowed an increasing trend under long-term zero tillage systems [23,24]. The green manureof mustard also increased soil organic matter under an arid climate [25]. Secondly, inclusionof legume intercrops increases the nitrogen budget of soil, which is attributed to its vital, inincreasing the activities of microbes and nitrogen fixation [26].
Similarly, more diversified farming systems with intercropping and cover croppingare essential for restoring soil biodiversity and fertility [27]. Particularly, the intercroppingof legumes and organic amendments could improve crop yield, productivity, and soilhealth [28]. Leguminous crops are also proven to be effective in sustaining soil fertility bysupplying atmospheric N to the soil, which is attributed to the ability of legumes to fixnitrogen through the symbiotic association, called biological nitrogen fixation (BNF) [29].Leguminous intercropping may provide many additional benefits to soil health and quality,by reducing soil erosion, improving soil processes [30], increasing moisture retention [31],improving soil fertility [32], increasing nutrient cycling, and enhancing soil conserva-tion [33,34]. One recent field study has shown that legume crops have the potential toimprove the physical properties of soil, which was attributed to its role as soil condi-tioner [35]. They positively affect soil physical properties, mainly due to the enormousbiomass production capacity, which provides the substrate for soil biological activity thatfacilitates increasing soil organic matter [36].
Considering the potential benefits of zero tillage and cover crops, in the form oflegumes that have not been explored, to improve cotton productivity and soil health inPakistan, we hypothesized that zero tillage and legume intercropping might improve cottonproductivity and soil health. We set the following two main objectives in this study: (i) to
Land 2022, 11, 289 3 of 15
evaluate the effect of conventional and zero tillage and inclusion of leguminous crops onsoil health indicators, cotton productivity, and yield components of leguminous crops; (ii)to identify the most suitable leguminous crop for intercropping with a cotton crop underan arid climate.
2. Materials and Methods2.1. Site Characteristics and Climatic Conditions
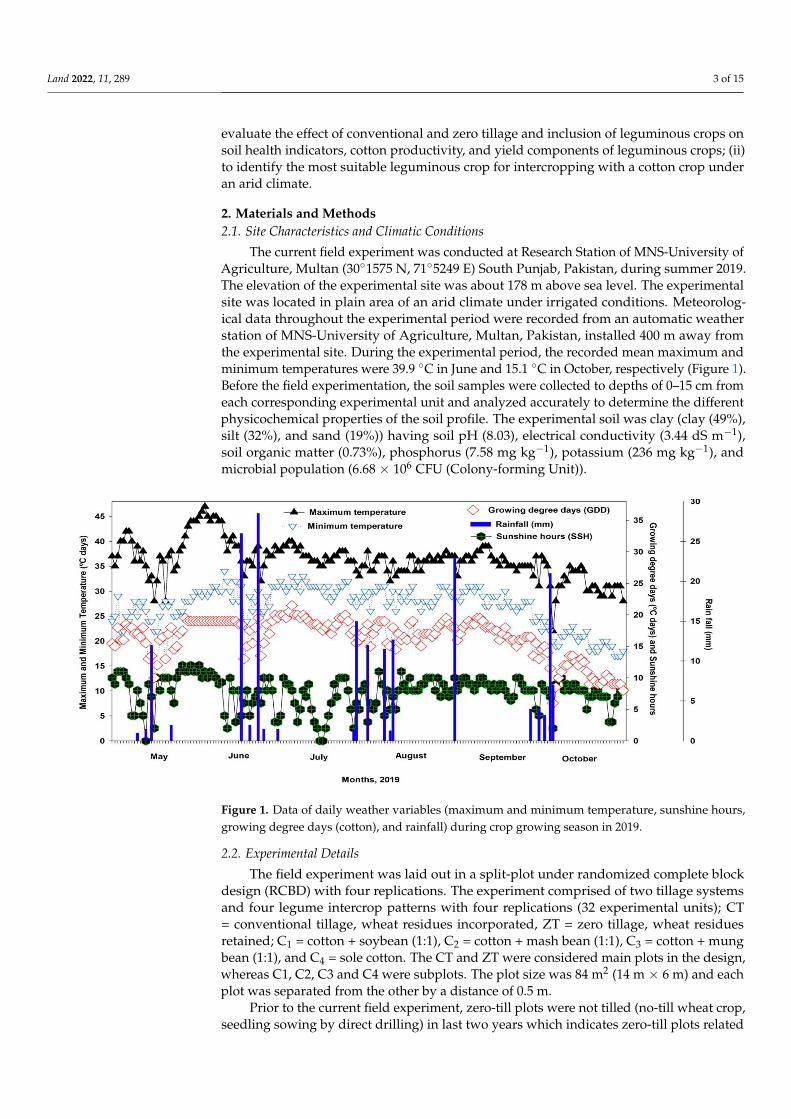
The current field experiment was conducted at Research Station of MNS-University ofAgriculture, Multan (30◦1575 N, 71◦5249 E) South Punjab, Pakistan, during summer 2019.The elevation of the experimental site was about 178 m above sea level. The experimentalsite was located in plain area of an arid climate under irrigated conditions. Meteorolog-ical data throughout the experimental period were recorded from an automatic weatherstation of MNS-University of Agriculture, Multan, Pakistan, installed 400 m away fromthe experimental site. During the experimental period, the recorded mean maximum andminimum temperatures were 39.9 ◦C in June and 15.1 ◦C in October, respectively (Figure 1).Before the field experimentation, the soil samples were collected to depths of 0–15 cm fromeach corresponding experimental unit and analyzed accurately to determine the differentphysicochemical properties of the soil profile. The experimental soil was clay (clay (49%),silt (32%), and sand (19%)) having soil pH (8.03), electrical conductivity (3.44 dS m−1),soil organic matter (0.73%), phosphorus (7.58 mg kg−1), potassium (236 mg kg−1), andmicrobial population (6.68 × 10⁶ CFU (Colony-forming Unit)).
Land 2022, 11, x FOR PEER REVIEW 3 of 15
productivity and soil health. We set the following two main objectives in this study: (i) to
evaluate the effect of conventional and zero tillage and inclusion of leguminous crops on
soil health indicators, cotton productivity, and yield components of leguminous crops; (ii)
to identify the most suitable leguminous crop for intercropping with a cotton crop under
an arid climate.
2. Materials and Methods
2.1. Site Characteristics and Climatic Conditions
The current field experiment was conducted at Research Station of MNS-University
of Agriculture, Multan (30°1575 N, 71°5249 E) South Punjab, Pakistan, during summer
2019. The elevation of the experimental site was about 178 m above sea level. The experi-
mental site was located in plain area of an arid climate under irrigated conditions. Mete-
orological data throughout the experimental period were recorded from an automatic
weather station of MNS-University of Agriculture, Multan, Pakistan, installed 400 m away
from the experimental site. During the experimental period, the recorded mean maximum
and minimum temperatures were 39.9 °C in June and 15.1 °C in October, respectively
(Figure 1). Before the field experimentation, the soil samples were collected to depths of
0–15 cm from each corresponding experimental unit and analyzed accurately to determine
the different physicochemical properties of the soil profile. The experimental soil was clay
(clay (49%), silt (32%), and sand (19%)) having soil pH (8.03), electrical conductivity (3.44
dS m−1), soil organic matter (0.73%), phosphorus (7.58 mg kg−1), potassium (236 mg kg−1),
and microbial population (6.68 × 10⁶ CFU (Colony-forming Unit)).
Figure 1. Data of daily weather variables (maximum and minimum temperature, sunshine hours,
growing degree days (cotton), and rainfall) during crop growing season in 2019.
2.2. Experimental Details
The field experiment was laid out in a split-plot under randomized complete block
design (RCBD) with four replications. The experiment comprised of two tillage systems
and four legume intercrop patterns with four replications (32 experimental units); CT =
conventional tillage, wheat residues incorporated, ZT = zero tillage, wheat residues re-
tained; C1 = cotton + soybean (1:1), C2 = cotton + mash bean (1:1), C3 = cotton + mung bean
(1:1), and C4 = sole cotton. The CT and ZT were considered main plots in the design,
whereas C1, C2, C3 and C4 were subplots. The plot size was 84 m2 (14 m × 6 m) and each
plot was separated from the other by a distance of 0.5 m.
Figure 1. Data of daily weather variables (maximum and minimum temperature, sunshine hours,growing degree days (cotton), and rainfall) during crop growing season in 2019.
2.2. Experimental Details
The field experiment was laid out in a split-plot under randomized complete blockdesign (RCBD) with four replications. The experiment comprised of two tillage systemsand four legume intercrop patterns with four replications (32 experimental units); CT= conventional tillage, wheat residues incorporated, ZT = zero tillage, wheat residuesretained; C1 = cotton + soybean (1:1), C2 = cotton + mash bean (1:1), C3 = cotton + mungbean (1:1), and C4 = sole cotton. The CT and ZT were considered main plots in the design,whereas C1, C2, C3 and C4 were subplots. The plot size was 84 m2 (14 m × 6 m) and eachplot was separated from the other by a distance of 0.5 m.
Prior to the current field experiment, zero-till plots were not tilled (no-till wheat crop,seedling sowing by direct drilling) in last two years which indicates zero-till plots related

Land 2022, 11, 289 4 of 15
to third years zero-till (no-till); initial soil properties were related to the first year underno-till. The CT plots from long-term experiment were used for CT in current experiment.In the CT system, experimental plots were prepared using traditional disc plough to thedepth of 30 cm, followed by proper planking to incorporate the wheat crop residues intothe soil. However, ZT meant there was sowing of cotton seeds after wheat harvestingdirectly on the untilled soil which retained 50% wheat crop residues. Weeds were removedmanually without disturbing the wheat crop residues in the ZT system. Cotton varietyBS-15 was sown on 10 May 2019, with seed rate of 15 kg ha−1 in both tillage systems usinga tractor-mounted Kharif drill. Furthermore, after 30 days of sowing (at first irrigation),cover crops (mung bean variety NM-2016, mash bean variety Urooj, and soybean varietyFaisal soybean) were intercropped with cotton crop. One-third of the dose of nitrogen (oftotal 160 kg ha−1) and recommended doses of P (90 kg ha−1) and K (60 kg ha−1) wereapplied at the time of sowing as basal application. The remaining N was divided into threeequal splits of 35.6 kg ha−1 and used at 1st, 3rd and 5th irrigation. Good quality irrigationwas achieved from the canal irrigation system by a diesel-operated water-lifting pump atprescribed irrigation scheduled stages (1st irrigation was done at 30 days after sowing andsubsequent irrigations at 10–15 day intervals depending upon weather conditions and croprequirements).
2.3. Measurements and Analytical Procedures2.3.1. Phenological, Physiological, and Yield Attributes of the Cotton Crop
The number of days required for 1st square formation, 1st flower formation, 1st bollopening, and 1st boll maturity was recorded in each plot for cotton. A total of five plantswere selected and tagged randomly from each experimental unit. At the full canopy devel-opment stage, the observations, including stomatal conductance, net leaf photosynthesisrate, and net leaf transpiration rate were recorded with the help of the CIRAS-3 PortablePhotosynthesis System. Similarly, chlorophyll content was estimated using a chlorophyllmeter (SPAD-502; Minolta, Tokyo, Japan). Agronomic traits including plant height (frombase to the tip of the main stem), mature and effective bolls per plant (before the start ofpicking), and mean boll weight (ten bolls were randomly chosen from each experimentalunit) were calculated. The seed cotton yield obtained from the net plot area was added intothe seed cotton weight of the previously picked ten bolls and was converted as seed cottonyield (kg ha−1).
2.3.2. Number of Pods Per Plant, Seed Yield, Biomass, and Harvest Index of LeguminousIntercrops
In each experimental unit, the number of pods of five randomly tagged plants ofmung bean, mash bean, and soybean were counted, and the mean number of pods perplant was calculated. The mung bean, mash bean, and soybean were harvested fromeach experimental unit and sun-dried. After sun-drying, harvested plants of mung bean,mash bean, and soybean were threshed, and the seed yield of each experimental unit wascalculated and converted into seed yield (kg ha−1) by using the below formula.
Seed yield (kg/ha) =Seed yield (kg/plot)× 10, 000
(m2)
Net plot area (m2)(1)
At maturity, the plants were harvested from an area of 1 m2 to compute the biomass.The harvested samples were sun-dried until samples showed a constant weight. Thenthe recorded dry weight of samples was converted into biomass (kg ha−1). Moreover, theharvest index was calculated by using the formula given below.
Harvest index (%) =Seed yield (kg/ha)
Biological yield(kg/ha)(2)

Land 2022, 11, 289 5 of 15
2.3.3. Determination of Soil Physicochemical Properties
According to experimental treatments, five soil samples (0–30 cm depth) were collectedusing a soil auger from each experimental unit after harvesting and analyzed for thedifferent physio-chemical properties of soil. Saturated soil paste was prepared; soil pHand electrical conductivity were measured using a pH meter and electrical conductivitymeter, respectively. Then, the soil samples were dried and sieved (2-mm mesh). Soilorganic matter was analyzed using the wet oxidation method [37]. Soil available N, P, andK were estimated by using the protocols of alkaline potassium permanganate [38], sodiumbicarbonate [39], and ammonium acetate [40], respectively. Furthermore, the soil microbialpopulation was assessed using Starkey’s medium in a colony-forming unit (CFU) using theequation below.
CFU per ml of Sample =Number of colonies
Amount planted × Dilution(3)
2.3.4. Statistical Analysis
Analysis of variance (ANOVA) for all the study parameters was used for the statisticalanalysis. Further, Tukey’s honestly significant difference (HSD) test for mean comparisonwas used to distinguish differences between treatment means at p ≤ 0.05 as a significantlevel [41].
2.3.5. Economic Analysis and Assessment of System Productivity
The economic analysis was done by using the standard protocols and procedures ofCIMMYT (1988). Land equivalent ratio (LER) and area time equivalent ratio (ATER) wereassessed for all treatments.
3. Results3.1. Phenological Attributes
The effects of tillage systems on phenological traits, including the number of daysto first square formation, first flower formation, first boll opening, and first boll maturity,are presented in Table 1. However, the effects of legume intercrops were significant forthe days to first square and flower formation but were not significant for days to first bollopening and boll maturity (shown in Figure 2). The interaction of the tillage system andlegume intercrops had no significant effect on these traits. However, the trend was observeddifferently in terms of the main effect of tillage systems and leguminous intercropping onthem (Table 1). The cotton crop grown under CT, with wheat residue incorporated, tookmore time for the number of days to first square formation (36.9), first flower formation(61.6), first boll opening (90.0), and first boll maturity (104.5), compared to ZT with wheatresidue retained (Table 1). Furthermore, the treatment C4 (sole cotton crop) took fewer daysto achieve the number of days to first square formation (36.3) and first flower formation(59.0) of the cotton crop, as compared to C3, C2 and C1; the treatments C1, C2, and C3 werestatistically on par for these two traits, but significantly differed from C4 (p ≤ 0.05), shownin Figure 2. All treatments in leguminous intercropping recorded the same number ofdays to first boll opening, and first boll maturity; they did not demonstrate a statisticallysignificant difference for this trait (Figure 2).

Land 2022, 11, 289 6 of 15
Table 1. Effect of different tillage systems on phenological, physiological, morphological, and yield-related attributes of cotton crop, and soil health indicators.
Treatments DSF DFF DBO DBM
Tillage Systems(TS)CT 36.9 a 61.6 a 90.0 a 104.5 aZT 38.4 b 62.4 b 92.6 b 102.0 b
HSD (p ≤ 0.05) 1.10 0.50 0.50 0.596Tillage Systems
(TS) NLTR NLPR SC CHC
CT 8.70 241 0.466 56.8ZT 8.40 236 0.464 58.2
HSD (p ≤ 0.05) NS NS NS NSTillage Systems
(TS) PH TBPP MBW SCY
CT 121 a 22.9 a 2.74 a 2031 aZT 116 b 21.4 b 2.37 b 1889 b
HSD (p ≤ 0.05) 4.00 0.30 0.21 80.0Tillage Systems
(TS) SOM P K MP
CT 0.75 b 7.84 b 245 b 7.04 bZT 0.77 a 8.08 a 253 a 7.26 a
HSD (p ≤ 0.05) 0.02 0.055 1.866 0.062Mean sharing of the same case letter did not significantly differ at p ≤ 0.05; DSF = days to first square formation;DFF = days to first flower formation; DBO = days to first boll opening; DBM = days to first boll maturity; NLTR= net leaf transpiration rate (mmol H2O m−2 s−1); NLPR = net leaf photosynthesis rate (µmol m−2 s−1); SC =stomatal conductance (mmol m−2 s−1); CHC = chlorophyll content (SPAD value); PH = plant height (cm); TBPP =total bolls per plant; MBW = mean boll weight; SCY = seed cotton yield (kg ha−1); SOM = soil organic matter (%);P = soil available phosphorus (mg kg−1); K = soil available phosphorus (mg kg−1); MP = soil microbial population(106 CFU).
Land 2022, 11, x FOR PEER REVIEW 6 of 15
Figure 2. Effect of different legume intercrops on phenological attributes of the cotton crop under
arid climatic conditions (tillage systems data are presented in Table 1, as some parameters were not
significant, making them difficult to present in graph form). (Letter “a” on all graph bars showed
the non-significance of the data at p ≤ 0.05.
Table 1. Effect of different tillage systems on phenological, physiological, morphological, and yield-
related attributes of cotton crop, and soil health indicators.
Treatments DSF DFF DBO DBM
Tillage Systems
(TS)
CT 36.9 a 61.6 a 90.0 a 104.5 a
ZT 38.4 b 62.4 b 92.6 b 102.0 b
HSD (p ≤ 0.05) 1.10 0.50 0.50 0.596
Tillage Systems
(TS) NLTR NLPR SC CHC
CT 8.70 241 0.466 56.8
ZT 8.40 236 0.464 58.2
HSD (p ≤ 0.05) NS NS NS NS
Tillage Systems
(TS) PH TBPP MBW SCY
CT 121 a 22.9 a 2.74 a 2031 a
ZT 116 b 21.4 b 2.37 b 1889 b
HSD (p ≤ 0.05) 4.00 0.30 0.21 80.0
Tillage Systems
(TS) SOM P K MP
CT 0.75 b 7.84 b 245 b 7.04 b
ZT 0.77 a 8.08 a 253 a 7.26 a
HSD (p ≤ 0.05) 0.02 0.055 1.866 0.062
Mean sharing of the same case letter did not significantly differ at p ≤ 0.05; DSF = days to first square
formation; DFF = days to first flower formation; DBO = days to first boll opening; DBM = days to
first boll maturity; NLTR = net leaf transpiration rate (mmol H2O m−2 s−1); NLPR = net leaf photosyn-
thesis rate (µmol m−2 s−1); SC = stomatal conductance (mmol m−2 s−1); CHC = chlorophyll content
(SPAD value); PH = plant height (cm); TBPP = total bolls per plant; MBW = mean boll weight; SCY
= seed cotton yield (kg ha−1); SOM = soil organic matter (%); P = soil available phosphorus (mg kg−1);
K = soil available phosphorus (mg kg−1); MP = soil microbial population (106 CFU).
Figure 2. Effect of different legume intercrops on phenological attributes of the cotton crop underarid climatic conditions (tillage systems data are presented in Table 1, as some parameters were notsignificant, making them difficult to present in graph form). (Letter “a” on all graph bars showed thenon-significance of the data at p ≤ 0.05.
Land 2022, 11, 289 7 of 15
3.2. Physiological Attributes
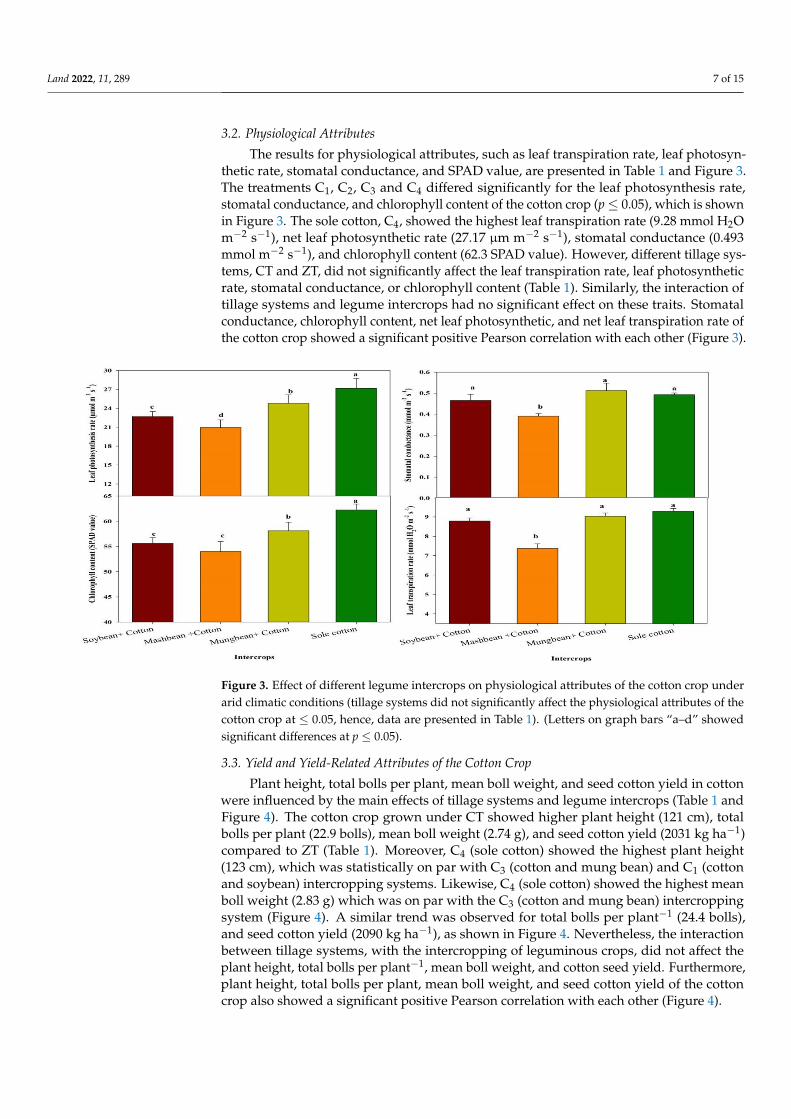
The results for physiological attributes, such as leaf transpiration rate, leaf photosyn-thetic rate, stomatal conductance, and SPAD value, are presented in Table 1 and Figure 3.The treatments C1, C2, C3 and C4 differed significantly for the leaf photosynthesis rate,stomatal conductance, and chlorophyll content of the cotton crop (p ≤ 0.05), which is shownin Figure 3. The sole cotton, C4, showed the highest leaf transpiration rate (9.28 mmol H2Om−2 s−1), net leaf photosynthetic rate (27.17 µm m−2 s−1), stomatal conductance (0.493mmol m−2 s−1), and chlorophyll content (62.3 SPAD value). However, different tillage sys-tems, CT and ZT, did not significantly affect the leaf transpiration rate, leaf photosyntheticrate, stomatal conductance, or chlorophyll content (Table 1). Similarly, the interaction oftillage systems and legume intercrops had no significant effect on these traits. Stomatalconductance, chlorophyll content, net leaf photosynthetic, and net leaf transpiration rate ofthe cotton crop showed a significant positive Pearson correlation with each other (Figure 3).
Land 2022, 11, x FOR PEER REVIEW 7 of 15
3.2. Physiological Attributes
The results for physiological attributes, such as leaf transpiration rate, leaf photosyn-
thetic rate, stomatal conductance, and SPAD value, are presented in Table 1 and Figure 3.
The treatments C1, C2, C3 and C4 differed significantly for the leaf photosynthesis rate, sto-
matal conductance, and chlorophyll content of the cotton crop (p ≤ 0.05), which is shown
in Figure 3. The sole cotton, C4, showed the highest leaf transpiration rate (9.28 mmol H2O
m−2 s−1), net leaf photosynthetic rate (27.17 µm m−2 s−1), stomatal conductance (0.493 mmol
m−2 s−1), and chlorophyll content (62.3 SPAD value). However, different tillage systems,
CT and ZT, did not significantly affect the leaf transpiration rate, leaf photosynthetic rate,
stomatal conductance, or chlorophyll content (Table 1). Similarly, the interaction of tillage
systems and legume intercrops had no significant effect on these traits. Stomatal conduct-
ance, chlorophyll content, net leaf photosynthetic, and net leaf transpiration rate of the
cotton crop showed a significant positive Pearson correlation with each other (Figure 3).
Figure 3. Effect of different legume intercrops on physiological attributes of the cotton crop under
arid climatic conditions (tillage systems did not significantly affect the physiological attributes of
the cotton crop at ≤ 0.05, hence, data are presented in Table 1). (Letters on graph bars “a–d” showed
significant differences at p ≤ 0.05)
3.3. Yield and Yield-Related Attributes of the Cotton Crop
Plant height, total bolls per plant, mean boll weight, and seed cotton yield in cotton
were influenced by the main effects of tillage systems and legume intercrops (Table 1 and
Figure 4). The cotton crop grown under CT showed higher plant height (121 cm), total
bolls per plant (22.9 bolls), mean boll weight (2.74 g), and seed cotton yield (2031 kg ha−1)
compared to ZT (Table 1). Moreover, C4 (sole cotton) showed the highest plant height (123
cm), which was statistically on par with C3 (cotton and mung bean) and C1 (cotton and
soybean) intercropping systems. Likewise, C4 (sole cotton) showed the highest mean boll
weight (2.83 g) which was on par with the C3 (cotton and mung bean) intercropping sys-
tem (Figure 4). A similar trend was observed for total bolls per plant−1 (24.4 bolls), and
seed cotton yield (2090 kg ha−1), as shown in Figure 4. Nevertheless, the interaction be-
tween tillage systems, with the intercropping of leguminous crops, did not affect the plant
height, total bolls per plant−1, mean boll weight, and cotton seed yield. Furthermore, plant
height, total bolls per plant, mean boll weight, and seed cotton yield of the cotton crop
also showed a significant positive Pearson correlation with each other (Figure 4).
Figure 3. Effect of different legume intercrops on physiological attributes of the cotton crop underarid climatic conditions (tillage systems did not significantly affect the physiological attributes of thecotton crop at ≤ 0.05, hence, data are presented in Table 1). (Letters on graph bars “a–d” showedsignificant differences at p ≤ 0.05).
3.3. Yield and Yield-Related Attributes of the Cotton Crop
Plant height, total bolls per plant, mean boll weight, and seed cotton yield in cottonwere influenced by the main effects of tillage systems and legume intercrops (Table 1 andFigure 4). The cotton crop grown under CT showed higher plant height (121 cm), totalbolls per plant (22.9 bolls), mean boll weight (2.74 g), and seed cotton yield (2031 kg ha−1)compared to ZT (Table 1). Moreover, C4 (sole cotton) showed the highest plant height(123 cm), which was statistically on par with C3 (cotton and mung bean) and C1 (cottonand soybean) intercropping systems. Likewise, C4 (sole cotton) showed the highest meanboll weight (2.83 g) which was on par with the C3 (cotton and mung bean) intercroppingsystem (Figure 4). A similar trend was observed for total bolls per plant−1 (24.4 bolls),and seed cotton yield (2090 kg ha−1), as shown in Figure 4. Nevertheless, the interactionbetween tillage systems, with the intercropping of leguminous crops, did not affect theplant height, total bolls per plant−1, mean boll weight, and cotton seed yield. Furthermore,plant height, total bolls per plant, mean boll weight, and seed cotton yield of the cottoncrop also showed a significant positive Pearson correlation with each other (Figure 4).

Land 2022, 11, 289 8 of 15Land 2022, 11, x FOR PEER REVIEW 8 of 15
Figure 4. Effect of different legume intercrops on morphological and yield attributes of the cotton
crop under arid climatic conditions. (Letters on graph bars “a, b, c, ab, and bc” showed significant
differences at p ≤ 0.05). (Tillage systems data are presented in Table 1, as some parameters were not
significant, making them difficult to present in graph form.).
3.4. Yield and Yield-Related Attributes of Leguminous Intercrops
The results, including pods per plant, seed yield, biological yield, and harvest index
of legume intercrops, are presented in Table 2 They were affected significantly by the main
effect due to tillage systems and legume intercrops, except for biological yield in the case
of different tillage systems. The highest pods per plant (31), seed yield (163 kg ha−1), bio-
logical yield (907 kg ha−1), and harvest index (18%) were observed in CT, as compared to
ZT. However, the interaction of tillage systems with the intercropping of legume inter-
crops was observed as non-significant for these traits. Among leguminous intercrops,
mung bean intercropped with cotton (C3) had the highest pods per plant, seed yield, bio-
logical yield, and harvest index (Table 2).
Table 2. Effect of different tillage systems and legume intercrops on pods per plant, seed yield,
biological yield, and harvest index of leguminous intercrops.
Treatments Pods Per
Plant
Seed Yield
(kg ha−1)
Biological Yield
(kg ha−1)
Harvest Index
(%)
Tillage Systems (TS)
CT 31.0 a 163 a 907 18.0 a
ZT 28.0 b 124 b 867 15.0 b
HSD (p ≤ 0.05) 0.90 4.10 NS 0.90
Leguminous intercrops (LI)
C1 31.0 a 118 c 866 b 14.0 b
C2 26.0 b 139 b 841 b 16.0 b
C3 32.0 a 173 a 950 a 19.0 a
HSD (p ≤ 0.05) 2.20 23.70 79 2.00
TS NS ** NS **
LI * ** ** **
TS × LI NS NS NS NS
Figure 4. Effect of different legume intercrops on morphological and yield attributes of the cottoncrop under arid climatic conditions. (Letters on graph bars “a, b, c, ab, and bc” showed significantdifferences at p ≤ 0.05). (Tillage systems data are presented in Table 1, as some parameters were notsignificant, making them difficult to present in graph form.).
3.4. Yield and Yield-Related Attributes of Leguminous Intercrops
The results, including pods per plant, seed yield, biological yield, and harvest indexof legume intercrops, are presented in Table 2 They were affected significantly by themain effect due to tillage systems and legume intercrops, except for biological yield in thecase of different tillage systems. The highest pods per plant (31), seed yield (163 kg ha−1),biological yield (907 kg ha−1), and harvest index (18%) were observed in CT, as compared toZT. However, the interaction of tillage systems with the intercropping of legume intercropswas observed as non-significant for these traits. Among leguminous intercrops, mung beanintercropped with cotton (C3) had the highest pods per plant, seed yield, biological yield,and harvest index (Table 2).
Table 2. Effect of different tillage systems and legume intercrops on pods per plant, seed yield,biological yield, and harvest index of leguminous intercrops.
Treatments Pods Per Plant Seed Yield(kg ha−1)
Biological Yield(kg ha−1) Harvest Index (%)
Tillage Systems(TS)CT 31.0 a 163 a 907 18.0 aZT 28.0 b 124 b 867 15.0 b
HSD (p ≤ 0.05) 0.90 4.10 NS 0.90Leguminous
intercrops (LI)C1 31.0 a 118 c 866 b 14.0 bC2 26.0 b 139 b 841 b 16.0 bC3 32.0 a 173 a 950 a 19.0 a
HSD (p ≤ 0.05) 2.20 23.70 79 2.00TS NS ** NS **LI * ** ** **
TS × LI NS NS NS NSCT = Conventional tillage; ZT = Zero tillage; C1 = Cotton + Soybean (1:1); C2 = Cotton + Mash bean (1:1); C3= Cotton + Mung bean (1:1); C4 = Sole cotton; Means sharing same case letter for parameters did not differsignificantly at p ≤ 0.05; * = Significant at p ≤ 0.05; ** = Significant at p ≤ 0.01; NS = Non-significant at p ≤ 0.05.

Land 2022, 11, 289 9 of 15
3.5. Soil Health Indicators
The results about soil health indicators, i.e., soil organic matter (SOM), microbialpopulation (MP), soil available P and K, are presented in Table 1 and Figure 5. They wereinfluenced significantly by different tillage systems and legume intercrops. ZT showedimprovement in SOM (0.77%), MP (7.26 × 10⁶ CFU), soil available P (8.08 mg kg−1) and K(253 mg kg−1) and all were recorded under ZT. Similarly, the inclusion of legume intercropsimproved SOM, MP, soil available P and K. The highest SOM (0.75%), MP (7.32 × 10⁶ CFU),soil available P (8.12 mg kg−1), and K (251 mg kg−1) were recorded in the intercroppingsystems, C1, C2 and C3 (Figure 5). Nonetheless, the interaction of tillage systems withlegume intercrops was non-significant for soil health indicators. Moreover, soil organicmatter, soil available phosphorus and potassium, and microbial population showed asignificant negative Pearson correlation with each other (Figure 6). The number of podsper plant, seed yield, biological yield, and harvest index of leguminous crops also showeda significant positive Pearson correlation with each other (Figure 6).
Land 2022, 11, x FOR PEER REVIEW 9 of 15
CT = Conventional tillage; ZT = Zero tillage; C1 = Cotton + Soybean (1:1); C2 = Cotton + Mash bean
(1:1); C3 = Cotton + Mung bean (1:1); C4 = Sole cotton; Means sharing same case letter for parameters
did not differ significantly at p ≤ 0.05; * = Significant at p ≤ 0.05; ** = Significant at p ≤ 0.01; NS = Non-
significant at p ≤ 0.05.
3.5. Soil Health Indicators
The results about soil health indicators, i.e., soil organic matter (SOM), microbial pop-
ulation (MP), soil available P and K, are presented in Table 1 and Figure 5. They were
influenced significantly by different tillage systems and legume intercrops. ZT showed
improvement in SOM (0.77%), MP (7.26 × 10⁶ CFU), soil available P (8.08 mg kg−1) and K
(253 mg kg−1) and all were recorded under ZT. Similarly, the inclusion of legume inter-
crops improved SOM, MP, soil available P and K. The highest SOM (0.75%), MP (7.32 ×
106 CFU), soil available P (8.12 mg kg−1), and K (251 mg kg−1) were recorded in the inter-
cropping systems, C1, C2 and C3 (Figure 5). Nonetheless, the interaction of tillage systems
with legume intercrops was non-significant for soil health indicators. Moreover, soil or-
ganic matter, soil available phosphorus and potassium, and microbial population showed
a significant negative Pearson correlation with each other (Figure 6). The number of pods
per plant, seed yield, biological yield, and harvest index of leguminous crops also showed
a significant positive Pearson correlation with each other (Figure 6).
Figure 5. Effect of different legume intercrops on soil health indicators under arid climatic condi-
tions. (Letters on graph bars “a, b, c, and ab” showed significant differences at p ≤ 0.05). (Tillage
systems data are presented in Table 1, as some parameters were not significant, making them diffi-
cult to present in graph form).
Figure 5. Effect of different legume intercrops on soil health indicators under arid climatic conditions.(Letters on graph bars “a, b, c, and ab” showed significant differences at p ≤ 0.05). (Tillage systemsdata are presented in Table 1, as some parameters were not significant, making them difficult topresent in graph form).

Land 2022, 11, 289 10 of 15Land 2022, 11, x FOR PEER REVIEW 10 of 15
Figure 6. Correlation of growth, yield and physiological attributes of cotton crop, yield components
of legume intercrops and soil health indicators under different tillage systems and legume inter-
crops; the areas of circles show the absolute value of corresponding correlation coefficients tested at
* 0.01 significant level. PH = Plant height; TB = Total bolls per plant; ABW = Average boll weight;
SCY = Seed cotton yield; BY = Biological yield; HI = Harvest index; NPPP = Number of pods per
plant; EC = Electrical conductivity; OM = Organic matter; P = Soil available phosphorus; K = Soil
available potassium; MP = Microbial population; pH = soil pH; SY= seed yield.
3.6. System Productivity
In the current study, the land equivalent ratio (LER) and area time equivalent ratio
(ATER) were recorded as the maximum in mung bean and cotton intercropping, grown
under CT (conventional tillage system) (Table 3). The effect of different tillage systems
and legume intercrops on system productivity is summarized in Table 4. The positive ag-
gressivity value of the cotton crop, in both conventional and zero tillage, indicated that
cotton was dominant over legumes. The level of aggressivity was higher in soybean and
cotton intercropping and decreased in mash bean and cotton and mung bean and cotton
intercropping. The maximum benefit-cost ratio was recorded in mung bean and cotton
intercropping, under CT and ZT systems (Table 5).
Table 3. Effect of different tillage systems and legume intercrops on land equivalent ratio and area
time equivalent ratio of system productivity.
Treatments Legumes Intercropping (LI)
Land Equivalent Ratio
Tillage Systems C1 C2 C3
CT 1.06 1.04 1.11
ZT 1.04 0.99 1.06
Figure 6. Correlation of growth, yield and physiological attributes of cotton crop, yield componentsof legume intercrops and soil health indicators under different tillage systems and legume intercrops;the areas of circles show the absolute value of corresponding correlation coefficients tested at * 0.01significant level. PH = Plant height; TB = Total bolls per plant; ABW = Average boll weight; SCY =Seed cotton yield; BY = Biological yield; HI = Harvest index; NPPP = Number of pods per plant; EC= Electrical conductivity; OM = Organic matter; P = Soil available phosphorus; K = Soil availablepotassium; MP = Microbial population; pH = soil pH; SY= seed yield.
3.6. System Productivity
In the current study, the land equivalent ratio (LER) and area time equivalent ratio(ATER) were recorded as the maximum in mung bean and cotton intercropping, grownunder CT (conventional tillage system) (Table 3). The effect of different tillage systemsand legume intercrops on system productivity is summarized in Table 4. The positiveaggressivity value of the cotton crop, in both conventional and zero tillage, indicated thatcotton was dominant over legumes. The level of aggressivity was higher in soybean andcotton intercropping and decreased in mash bean and cotton and mung bean and cottonintercropping. The maximum benefit-cost ratio was recorded in mung bean and cottonintercropping, under CT and ZT systems (Table 5).

Land 2022, 11, 289 11 of 15
Table 3. Effect of different tillage systems and legume intercrops on land equivalent ratio and areatime equivalent ratio of system productivity.
Treatments Legumes Intercropping (LI)
Land Equivalent RatioTillage Systems C1 C2 C3
CT 1.06 1.04 1.11ZT 1.04 0.99 1.06
Area Time Equivalent RatioTillage Systems C1 C2 C3
CT 1.03 1.00 1.07ZT 1.01 0.96 1.03
Table 4. Effect of different tillage systems and legume intercrops on the aggressivity of systemproductivity.
Treatments Aggressivity
ZT Cotton IntercropConventional tillage
C1 0.84 −0.84C2 0.76 −0.76C3 0.79 −0.79
CT Zero tillageC1 0.80 −0.80C2 0.75 −0.75C3 0.74 −0.74
CT = Conventional tillage; ZT = Zero tillage; C1 = Cotton + Soybean (1:1); C2 = Cotton + Mash bean (1:1); C3 =Cotton + Mung bean (1:1); C4 = Sole cotton.
Table 5. Effect of different tillage systems and legume intercrops on the economics of the system.
Treatment VariableCost Fixed Cost Total Cost Gross
IncomeNet
Benefits BCR
CTC1 5430 110,000 115,430 194,982 79,552 1.67CTC2 7274 110,000 117,274 190,485 73,211 1.65CTC3 4980 110,000 114,980 202,030 87,050 1.75CTC4 3500 110,000 112,000 192,240 80,240 1.71ZTC1 3430 110,000 113,430 172,575 59,145 1.47ZTC2 3274 110,000 115,274 178,740 63,466 1.54ZTC3 2980 110,000 112,980 181,480 68,500 1.67ZTC4 1120 110,000 111,120 183,870 72,750 1.57
CT = Conventional tillage; ZT = Zero tillage; C1 = Cotton + Soybean (1:1); C2 = Cotton + Mash bean (1:1); C3 =Cotton + Mung bean (1:1); C4 = Sole cotton.
4. Discussion
The cotton crop grown under ZT took less time for the completion of different phe-nological stages, such as days to first square formation, first flower formation, first bollopening, and first boll maturity (Table 1). It is similar to the previous study in cotton, undera zero-tillage system [42]. Moreover, the sole cotton crop, C4, took less time for all theabove-mentioned phenological traits (Figure 2) and better physiological attributes (net leafphotosynthetic rate, net leaf transpiration rate, stomatal conductance, and chlorophyll con-tent) were recorded due to suitable soil and other environmental conditions (Figure 2). Thisis because there is no competition for light, space, water, and nutrient acquisition, leadingto high growth and development, leading to improved phenological attributes [43]. TheCT system showed higher values for the physiological traits of the cotton crop, measuredin previous research, than the ZT system (Table 1). It might be due to the maximum rootgrowth and development, which ultimately accounted for increased assimilate partitioning

Land 2022, 11, 289 12 of 15
and high physiological attributes [44]. However, the current results did not show significantdifferences under CT and ZT.
CT significantly improved the morphological, yield and yield-related attributes of thecotton crop, having higher plant height, total bolls per plant, mean boll weight, and seedcotton yield, compared to ZT (Table 1), which might be due to higher root penetration intothe soil and higher nutrients uptake (N, P, and K), to meet the growth requirements of thecotton crop [45]. Several studies have reported that the morphological and yield attributesof the cotton crop improve under a conventional tillage system in the initial years [46].However, the seed cotton yield increased under ZT, due to better soil porosity [42] andimproved water use efficiency [47,48]. In our findings, legume intercrops improved theplant height, total bolls per plant, and mean boll weight, which could be associated withthe increased nitrogen availability due to nitrogen fixation of the legume crops [31,33].
In the current study, legume intercrops, grown under a CT system, accelerated thenumber of pods per plant, seed yield, biological yield, and harvest index compared to ZT.It is also evident that a previous study had reported the same results under CT [49]. Itmight be because of the effective use of nitrogen under optimal seedbed for ideal growthand development that the yield of leguminous crops ultimately improved [31,50]. Severalother studies have also concluded that CT enhances the yield of legume intercrops [50].Current findings of the experiment showed that, mung bean intercropped with cotton (C3)set the highest values for the yield and yield-related attributes, which might be due tohigher nitrogen fixation and optimum growth conditions for mung beans [51].
Conservation tillage (zero tillage) is a promising option, which maintains soil healthindicators under an arid climate [19]. It increases the available soil phosphorus, potassium,organic matter, and ultimately soil health indicators [20,21]. Furthermore, due to improvedsoil quality indicators, SOM, available soil phosphorus, and potassium were higher underZT. Similarly, legume intercrop mung beans showed higher soil quality indicators (SOM,P, K). Earlier studies found similar results for higher soil organic matter under ZT andleguminous intercropping [22,23]. Finally, the soil microbial population was recordedas higher under ZT, as compared to CT, which might be due to improved soil qualityindicators under ZT [26,28]. These results align with Rajpoot et al. [52] where soil microbialpopulation and activities were enhanced under zero tillage. A higher microbial populationrecorded in leguminous intercropping might be attributed to the greater biomass of legumeintercrops [53,54].
In our results, the maximum land equivalent ratio (LER) and area time equivalentratio (ATER) were recorded in mung bean and cotton intercropping, grown under a CT.Dhima et al. [55] stated similar findings, that the LER and ATER of intercropped legumeswere more than for sole crop, which highlighted an advantage of intercropping overthe mono-cropping pattern, in using environmental resources for plant growth. Cottondominated all of the intercropped legumes. The low aggressivity of mash bean and cottonintercropping in a CT system and mung bean and cotton intercropping in a zero tillagesystem proves that mash beans and mung beans are less competitive to cotton in CT and ZTsystems, respectively. In current study the higher aggressivity value of soybean and cottonintercropping suggests that soybeans are the most competitive legume crop to cotton. Themaximum benefit-cost ratio was recorded in mung bean and cotton intercropping, underboth CT and ZT systems, suggesting that this is the best intercropping system for cottonfarmers. The higher seed cotton yield and mung bean yield increased the net benefits and,ultimately, economic benefit ratio. The results and findings showed the significance ofthe issues, as similar aspects have been investigated in previous studies, under arid tosemi-arid climatic conditions [56–61].
5. Conclusions
The current study indicated that conventional tillage and leguminous crop intercrop-ping performed better in terms of phenological, physiological, morphological, and yieldattributes. However, soil analysis results revealed that zero tillage and leguminous crop
Land 2022, 11, 289 13 of 15
intercropping somewhat improved soil health indicators. Moreover, the leguminous crop“mung bean” showed the maximum number of pods, seed yield, biological yield, andharvest index, when intercropped with the cotton crop. Furthermore, the maximum benefit-cost ratio was recorded from mung bean and cotton intercropping under conventionaltillage. In conclusion, zero tillage and the intercropping of leguminous crops with cottoncrops could be recommended for achieving higher seed cotton yield, seed yield of legu-minous crops, system profitability and soil health indicators. Further research and fieldresearch trials (for farmers, extension workers, and other associated stakeholders’ fields)need to be conducted to create awareness on zero tillage, the role of leguminous cropsin nitrogen fixation, economic profitability, and sustaining soil health, besides improvingcotton productivity. Seasonal and locational trials may also be required in the future toconfirm the findings, while modeling studies may also require investigation of the effectsof seasonal and climate change effects, in the longer term, on soil health and crop yield.
Author Contributions: Data curation, M.F.S., A.G. and M.H.u.R.; formal analysis, M.H.u.R., M.I. andR.I.; funding acquisition, W.S.; investigation, M.I., R.I., S.D. and A.G.; methodology, M.F.S., A.G.,M.H.u.R. and M.I.; project administration, M.H.u.R., A.G. and M.I.; resources, M.F.S., M.H.u.R. andM.I.; software, M.H.u.R.; supervision, A.G.; validation, A.G. and M.H.u.R.; writing—original draft,M.F.S., M.H.u.R., and A.G.; writing—review and editing, R.D., W.S., S.D., K.R. and A.E.S. All authorshave read and agreed to the published version of the manuscript.
Funding: This research was funded by the Researchers Supporting Project, number (RSP-2021/390),King Saud University, Riyadh, Saudi Arabia.
Institutional Review Board Statement: Not applicable.
Informed Consent Statement: Not applicable.
Data Availability Statement: Not applicable for their financial support to complete this project.
Acknowledgments: The authors extend their appreciation to the Researchers Supporting Project,number (RSP-2021/390), King Saud University, Riyadh, Saudi Arabia.
Conflicts of Interest: The authors declare that there are no conflict of interest.
References1. Shuli, F.; Jarwar, A.H.; Wang, X.; Wang, L.; Ma, Q. Overview of the Cotton in Pakistan and its Future Prospects. Pak. J. Agric. Res.
2018, 31, 396–407. [CrossRef]2. Ibrahim, N.A.; Moneim, N.M.A.; Halim, E.A.; Hosni, M.M. Pollution Prevention of Cotton-Cone Reactive Dyeing. J. Clean. Prod.
2008, 16, 1321–1326. [CrossRef]3. Government of Pakistan (GOP). Agriculture. In Economic Survey of Pakistan; Economic Advisory Wing, Ministry of Finance,
Division: Islamabad, Pakistan, 2018; pp. 14–32.4. Abdullaev, I.; Hassan, M.U.; Jumaboev, K. Water Saving and Economic Impacts of Land Leveling: The Case Study of Cotton
Production in Tajikistan. Irrig. Drain. Syst. 2007, 21, 251–263. [CrossRef]5. Khalid, M.Z.; Ahmed, S.; Al-Ashkar, I.; EL Sabagh, A.; Liu, L.; Zhong, G. Evaluation of Resistance Development in Bemisia Tabaci
Genn. (Homoptera: Aleyrodidae) in Cotton against Different Insecticides. Insects 2021, 12, 996. [CrossRef] [PubMed]6. Farooq, O.; Mubeen, K.; Khan, A.A.; Ahmad, S. Sowing Methods for Cotton Production. In Cotton Production and Uses; Springer:
Singapore, 2020; pp. 45–57.7. Das, A.; Yadav, G.; Lal, R. Legumes for Soil Health and Sustainable Management; Springer: Singapore, 2018; pp. 347–484.8. Ryken, N.; Nest, T.V.; Al-Barri, B.; Blake, W.; Taylor, A.; Bodé, S.; Ruysschaert, G.; Boeckx, P.; Verdoodt, A. Soil Erosion Rates
under Different Tillage Practices in Central Belgium: New Perspectives from a Combined Approach of Rainfall Simulations and7Be Measurements. Soil Tillage Res. 2018, 179, 29–37. [CrossRef]
9. Nosrati, K.; Collins, M.; Adrian, L. A Soil Quality Index for Evaluation of Degradation under Land Use and Soil Erosion Categoriesin a Small Mountainous Catchment. Iran. J. Mt. Sci. 2019, 16, 2577–2590. [CrossRef]
10. Zeraatpisheh, M.; Bakhshandeh, E.; Hosseini, M.; Alavi, S.M. Assessing the Effects of Deforestation and Intensive Agriculture onthe Soil Quality through Digital Soil Mapping. Geoderma 2020, 363, 114–139. [CrossRef]
11. Broman, G.I.; Robert, K.H. A Framework for Strategic Sustainable Development. J. Clean. Prod. 2017, 14, 17–31. [CrossRef]12. Busby, P.E.; Wagner, C.; Friesen, M.R.; Kremer, M.L.; Bennett, J.; Dangl, A. Research Priorities for Harnessing Plant Micro Biomes
in Sustainable Agriculture. PLoS Biol. 2017, 15, 200–293. [CrossRef]13. Yadav, S.K.; Soni, R.; Rajput, A.S. Role of Microbes in Organic Farming for Sustainable Agro-Ecosystem. In Microorganisms for
Green Revolution; Springer: Singapore, 2018; pp. 241–252.

Land 2022, 11, 289 14 of 15
14. Jousset, A. Application of Protists to Improve Plant Growth in Sustainable Agriculture; Springer: Singapore, 2017; pp. 263–273.15. Singh, R.K.; Singh, A.K.; Singh, J.B.; Singh, L. Success of Zero Tillage Technology: A Case of Knowledge Management for
Sustainable Agriculture. Ind. J. Extent. Educ. 2016, 12, 110–115.16. Bowers, C.; Toews, M.; Liu, Y.; Schmidt, J.M. Cover Crops Improve Early Season Natural Enemy Recruitment and Pest Manage-
ment in Cotton Production. Biol. Cont. 2020, 141, 104149. [CrossRef]17. Sharma, P.; Singh, A.; Kahlon, C.S.; Brar, A.S.; Grover, K.; Dia, K.; Steiner, R.L. The Role of Cover Crops towards Sustainable Soil
Health and Agriculture. A Review Paper. Am. J. Plant Sci. 2018, 9, 1935–1951. [CrossRef]18. Martin, G.; Paquette, A.; Dupras, A.; Rivest, D. The New Green Revolution: Sustainable Intensification of Agriculture by
Intercropping. Sci. Total Environ. 2018, 615, 767–772. [CrossRef] [PubMed]19. Busari, M.A.; Kukal, S.S.; Kaur, A.; Bhatt, R.; Dulazi, A.A. Conservation Tillage Impacts on Soil, Crop and the Environment. Int.
Soil Water Conserv. Res. 2015, 3, 119–129. [CrossRef]20. Bhatt, R. Zero Tillage Impacts on Soil Environment and Properties. J. Environ. Agric. Sci. 2017, 10, 1–19.21. Sayed, A.; Sarker, A.; Kim, J.E.; Rahman, M.; Mahmud, M.G.A. Environmental Sustainability and Water Productivity on
Conservation Tillage of Irrigated Maize in Red Brown Terrace Soil of Bangladesh. J. Saudi Soc. Agric. Sci. 2020, 19, 276–284.[CrossRef]
22. Duggan, L.; Yeates, J.; Stephen, A.; Greg, B. Bed Preparation Techniques and Herbicide Tolerance Technology for Tropical DrySeason Cotton Production. Trop. Agric. 2005, 82, 233–240.
23. Page, K.L.; Dang, Y.P.; Dalal, R.C. The Ability of Conservation Agriculture to Conserve Soil Organic Carbon and the SubsequentImpact on Soil Physical, Chemical, and Biological Properties and Yield. Front. Sustain. Food Syst. 2020, 4, 31. [CrossRef]
24. Saha, L.; Bauddh, K. Sustainable Agricultural Approaches for Enhanced Crop Productivity, Better Soil Health, and ImprovedEcosystem Services. In Ecological and Practical Applications for Sustainable Agriculture; Springer: Singapore, 2020; pp. 1–23.
25. Koishi, A.; Bragazza, L.; Maltas, A.; Guillaume, T.; Sinaj, S. Long-Term Effects of Organic Amendments on Soil Organic MatterQuantity and Quality in Conventional Cropping Systems in Switzerland. Agronomy 2020, 10, 1977. [CrossRef]
26. Moran, P.J.; Greenberg, S.M. Winter Cover Crops and Vinegar for Early-Season Weed Control in Sustainable Cotton. J. Sustain.Agric. 2008, 32, 483–506. [CrossRef]
27. Brussaard, L.; Ruiter, P.C.; Brown, G.G. Soil Biodiversity for Agricultural Sustainability. Agric. Ecosyst. Environ. 2007, 121, 233–244.[CrossRef]
28. Baritz, R.; Wiese, L.; Verbeke, I.; Vargas, R. Voluntary Guidelines for Sustainable Soil Management: Global Action for HealthySoils. In International Yearbook of Soil Law and Policy 2017; Springer: Cham, Switzerland, 2018; pp. 17–36.
29. Fustec, J.; Lesuffleur, F.; Mahieu, S.; Cliquet, J.B. Nitrogen Rhizodeposition of Legumes. A Review. Agron. Sustain. Dev. 2010, 30,57–66. [CrossRef]
30. Hauggaard-Nielsen, H.; Jornsgaard, B.; Kinane, J.; Jensen, E.S. Grain Legume-Cereal Intercropping: The Practical Applicationof Diversity, Competition and Facilitation in Arable and Organic Cropping Systems. Renew Agric. Food Syst. 2007, 23, 3–12.[CrossRef]
31. Ghanbari, A.; Dahmardeh, M.; Siahsar, B.A.; Ramroudi, M. Effect of Maize-Cowpea (Vignaunguiculata, L.) Intercropping on LightDistribution, Soil Temperature and Soil Moisture in Arid Environment. J. Food Agric. Environ. 2010, 8, 102–108.
32. Hauggaard, N.H.; Gooding, M.; Ambus, P.; Corre-Hellou, G.; Crozat, Y.; Dahlmann, C.; Dibet, A.; von Fragstein, P.; Pristeri, A.;Monti, M.; et al. Pea-Barley Intercropping for Efficient Symbiotic N2–Fixation, Soil N Acquisition and Use of Other Nutrients inEuropean Organic Cropping Systems. Field Crop. Res. 2009, 113, 64–71. [CrossRef]
33. Lithourgidis, A.S.; Dordas, C.A.; Damalas, C.A.; Vlachostergios, D.N. Annual Intercrops: An Alternative Pathway for SustainableAgriculture. Aust. J. Crop. Sci. 2011, 5, 396–410.
34. Chalka, M.K.; Nepalia, V. Nutrient Uptake Appraisal of Maize Intercropped with Legumes and Associated Weeds under theInfluence of Weed Control. Indian J. Agric. Res. 2006, 40, 86–91.
35. Srinivasarao, C.; Venkateswarlu, B.; Lal, R. Long-Term Effects of Soil Fertility Management on Carbon Sequestration in aRice-Lentil Cropping System of the Indo-Gangetic Plains. Soil Sci. Soc. Am. J. 2012, 76, 167–178. [CrossRef]
36. Lal, R. Restoring Soil Quality to Mitigate Soil Degradation. Sustainability 2015, 7, 5875–5895. [CrossRef]37. Walkley, A.; Black, I.A. An Examination of the Digestion Method for Determining Soil Organic Matter and a Proposed Modification
of the Chromic Acid Titration Method. Soil Sci. 1934, 1, 29–38. [CrossRef]38. Subbaiah, V.V.; Asija, G.K. A Rapid Procedure for Utilization of Available Nitrogen in Soil. Curr. Sci. 1956, 26, 258–260.39. Olsen, S.R. Estimation of Available Phosphorus in Soils by Extraction with Sodium Bicarbonate; United States Department of Agriculture:
Washington, DC, USA, 1954.40. Nelson, L.; Heidel, H. Soil Analysis Methods as Used in the Iowa State College Soil Testing Laboratory; Iowa State College, Agronomy
Department: Ames, IA, USA, 1952.41. Steel, R.G.D.; Torrie, J.H.; Dickey, D.A. Principles and Procedures of Statistics: A Biometric Approach, 3rd ed.; McGraw Hill Book Co.
Inc.: New York, NY, USA, 1997.42. Wang, X.B.; Cai, D.X.; Hoogmoed, W.B.; Oenema, O.; Perdok, U.D. Developments in Conservation Tillage in Rainfed Regions of
North China. Soil Till. Res. 2007, 93, 239–250. [CrossRef]

Land 2022, 11, 289 15 of 15
43. Layek, J.; Das, A.; Mitran, T.; Nath, C.; Meena, R.S.; Yadav, G.S.; Shivakumar, B.G.; Kumar, S.; Lal, R. Cereal + LegumeIntercropping: An Option for Improving Productivity and Sustaining Soil Health. In Legumes for Soil Health and SustainableManagement; Springer: Singapore, 2018; pp. 347–386.
44. Choudhary, R.; Singh, P.; Sidhu, H.S.; Nandal, D.P.; Jat, H.S.; Jat, M.L. Evaluation of Tillage and Crop Establishment MethodsIntegrated with Relay Seeding of Wheat and Mungbean for Sustainable Intensification of Cotton-Wheat System in South Asia.Field Crops Res. 2016, 199, 31–41. [CrossRef]
45. Bessam, F.; Mrabet, R. Long-Term Changes in Soil Organic Matter under Conventional Tillage and No-Tillage Systems in SemiaridMorocco. Soil Use Manag. 2003, 19, 139–143. [CrossRef]
46. Mitchell, J.; Shrestha, A.; Mathesius, K.; Scow, K.; Southard, R.; Haney, R.; Schmidt, R.; Munk, D.; Horwath, W. Cover Cropping,and no-Tillage Improve Soil Health in an Arid Irrigated Cropping System in California’s San Joaquin Valley, USA. Soil Tillage Res.2017, 165, 325–335. [CrossRef]
47. Bhatt, R.; Kukal, S. Delineating Soil Moisture Dynamics as Affected by Tillage in Wheat, Rice and Establishment Methods of Riceduring Intervening Period. J. Appl. Nat. Sci. 2015, 7, 364–368. [CrossRef]
48. Qamar, R.; Ullah, E.; Saqib, M.; Javeed, H.M.R.; Rehman, A.; Ali, A. Influence of Tillage and Mulch on Soil Physical Propertiesand Wheat Yield in Rice-Wheat Systém. West Afr. J. Appl. Ecol. 2015, 23, 21–38.
49. Nawar, A.I.; Fraihat, A.; Khalil, A.H.; El-Ela, A.M.A. Response of Faba Bean to Tillage Systems Different Regimes of NPKFertilization and Plant Interspacing. Int. J. Agric. Biol. 2010, 12, 606–610.
50. Bedoussac, L.; Justes, E. Dynamic Analysis of Competition and Complementarity for Light and Use to Understand the Yield andthe Protein Content of a Durum Wheat-Winter Pea Intercrop. Plant. Soil. 2010, 330, 37–54. [CrossRef]
51. Paul, B.K.; Vanlauwe, B.; Ayuke, F.; Gassner, A.; Hoogmoed, M.; Hurisso, T.T.; Pulleman, M.M. Medium-Term Impact of Tillageand Residue Management on Soil Aggregate Stability, Soil Carbon and Crop Productivity. Agric. Ecosyst. Environ. 2013, 164,14–22. [CrossRef]
52. Rajpoot, S.K.; Rana, D.S.; Choudhary, A.K. Bt-Cotton–Vegetable-Based Intercropping Systems as Influenced by Crop EstablishmentMethod and Planting Geometry of Bt-Cotton in Indo-Gangetic Plains Region. Curr. Sci. 2018, 115, 516–522. [CrossRef]
53. Rahman, M.H.; Ahmad, I.; Wang, D.; Fahad, S.; Afzal, M.; Ghaffar, A.; Saddique, Q.; Khan, M.A.; Saud, S.; Hassan, S.; et al.Influence of semi-arid environment on radiation use efficiency and other growth attributes of lentil crop. Environ. Sci. Pollut. Res.2021, 28, 13697–13711. [CrossRef] [PubMed]
54. Dhima, K.V.; Lithourgidis, A.S.; Vasilakoglou, I.B.; Dordas, C.A. Competition Indices of Common Vetch and Cereal Intercrops inTwo Seeding Ratio. Field Crops Res. 2007, 100, 249–256. [CrossRef]
55. Rahman, M.H.; Ahmad, A.; Wang, X.; Wajid, A.; Nasim, W.; Hussain, M.; Ahmad, B.; Ahmad, I.; Ali, Z.; Ishaque, W.; et al.Multi-Model Projections of Future Climate and Climate Change Impacts Uncertainty Assessment for Cotton Production inPakistan. Agric. For. Meteorol. 2018, 253, 94–113. [CrossRef]
56. Ahmad, S.; Ghaffar, A.; Rahman, M.H.U.; Hussain, I.; Iqbal, R.; Haider, G.; Khan, M.A.; Ikram, R.M.; Hussnain, H.; Bashir, M.S.Effect of Application of Biochar, Poultry and Farmyard Manures in Combination with Synthetic Fertilizers on Soil Fertility andCotton Productivity under Arid Environment. Commun. Soil Sci. Plant Anal. 2021, 52, 2018–2031. [CrossRef]
57. Rahman, M.H.; Ahmad, A.; Wajid, A.; Hussain, M.; Rasul, F.; Ishaque, W.; Islam, M.A.; Shelia, V.; Awais, M.; Ullah, A.; et al.Application of CSM-CROPGRO-Cotton Model for Cultivars and Optimum Planting Dates: Evaluation in Changing Semi-AridClimate. Field Crop. Res. 2019, 238, 139–152. [CrossRef]
58. Rahman, M.H.U.; Ahmad, A.; Wajid, A.; Akhtar, J.; Hoogenboom, G.; Hussain, M. Estimation of Temporal Variation Resilience inCotton Varieties Using Statistical Models. Pak. J. Agric. Sci. 2016, 53, 787–807.
59. Rahman, M.H.U.; Ahmad, I.; Ghaffar, A.; Haider, G.; Ahmad, B.; Tariq, M.; Nasim, W.; Rasul, G.; Fahad, S.; Ahmad, S.; et al.Climate Resilient Cotton Production System: A Case Study in Pakistan; Springer: Singapore, 2020; pp. 447–484. [CrossRef]
60. Manzoor, S.; Habib-Ur-Rahman, M.; Haider, G.; Ghafoor, I.; Ahmad, S.; Afzal, M.; Nawaz, F.; Iqbal, R.; Yasin, M.; Haq, T.U.; et al.Biochar and Slow-Releasing Nitrogen Fertilizers Improved Growth, Nitrogen Use, Yield, and Fiber Quality of Cotton under AridClimatic Conditions. Environ. Sci. Pollut. Res. 2021, 29, 13742–13755. [CrossRef]
61. Majid, M.; Ali, M.; Shahzad, K.; Ahmad, F.; Ikram, R.M.; Ishtiaq, M.; Alaraidh, I.A.; Al-Hashimi, A.; Ali, H.M.; Zarei, T.; et al.Mitigation of Osmotic Stress in Cotton for the Improvement in Growth and Yield through Inoculation of Rhizobacteria andPhosphate Solubilizing Bacteria Coated Diammonium Phosphate. Sustainability 2020, 12, 10456. [CrossRef]