POPULATION DIFFERENTIATION IN AN ANNUAL LEGUME: GENETIC ARCHITECTURE
16
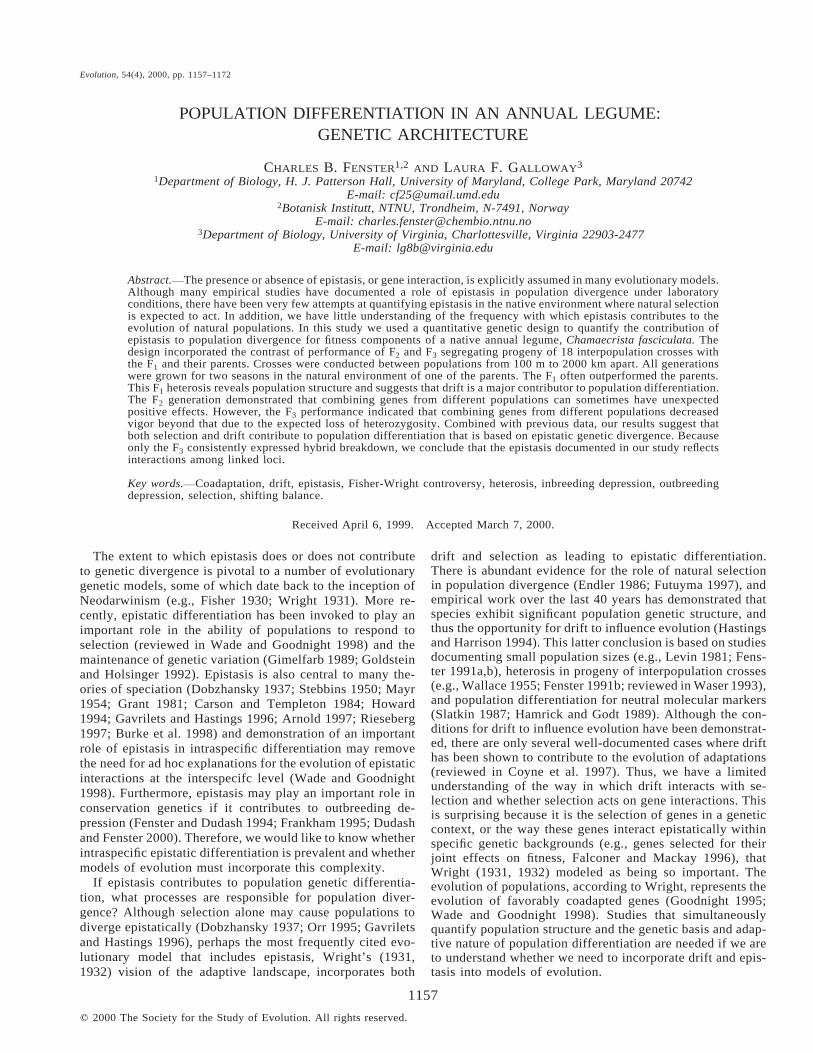
1157 q 2000 The Society for the Study of Evolution. All rights reserved. Evolution, 54(4), 2000, pp. 1157–1172 POPULATION DIFFERENTIATION IN AN ANNUAL LEGUME: GENETIC ARCHITECTURE CHARLES B. FENSTER 1,2 AND LAURA F. GALLOWAY 3 1 Department of Biology, H. J. Patterson Hall, University of Maryland, College Park, Maryland 20742 E-mail: [email protected] 2 Botanisk Institutt, NTNU, Trondheim, N-7491, Norway E-mail: [email protected] 3 Department of Biology, University of Virginia, Charlottesville, Virginia 22903-2477 E-mail: [email protected] Abstract. The presence or absence of epistasis, or gene interaction, is explicitly assumed in many evolutionary models. Although many empirical studies have documented a role of epistasis in population divergence under laboratory conditions, there have been very few attempts at quantifying epistasis in the native environment where natural selection is expected to act. In addition, we have little understanding of the frequency with which epistasis contributes to the evolution of natural populations. In this study we used a quantitative genetic design to quantify the contribution of epistasis to population divergence for fitness components of a native annual legume, Chamaecrista fasciculata. The design incorporated the contrast of performance of F 2 and F 3 segregating progeny of 18 interpopulation crosses with the F 1 and their parents. Crosses were conducted between populations from 100 m to 2000 km apart. All generations were grown for two seasons in the natural environment of one of the parents. The F 1 often outperformed the parents. This F 1 heterosis reveals population structure and suggests that drift is a major contributor to population differentiation. The F 2 generation demonstrated that combining genes from different populations can sometimes have unexpected positive effects. However, the F 3 performance indicated that combining genes from different populations decreased vigor beyond that due to the expected loss of heterozygosity. Combined with previous data, our results suggest that both selection and drift contribute to population differentiation that is based on epistatic genetic divergence. Because only the F 3 consistently expressed hybrid breakdown, we conclude that the epistasis documented in our study reflects interactions among linked loci. Key words. Coadaptation, drift, epistasis, Fisher-Wright controversy, heterosis, inbreeding depression, outbreeding depression, selection, shifting balance. Received April 6, 1999. Accepted March 7, 2000. The extent to which epistasis does or does not contribute to genetic divergence is pivotal to a number of evolutionary genetic models, some of which date back to the inception of Neodarwinism (e.g., Fisher 1930; Wright 1931). More re- cently, epistatic differentiation has been invoked to play an important role in the ability of populations to respond to selection (reviewed in Wade and Goodnight 1998) and the maintenance of genetic variation (Gimelfarb 1989; Goldstein and Holsinger 1992). Epistasis is also central to many the- ories of speciation (Dobzhansky 1937; Stebbins 1950; Mayr 1954; Grant 1981; Carson and Templeton 1984; Howard 1994; Gavrilets and Hastings 1996; Arnold 1997; Rieseberg 1997; Burke et al. 1998) and demonstration of an important role of epistasis in intraspecific differentiation may remove the need for ad hoc explanations for the evolution of epistatic interactions at the interspecifc level (Wade and Goodnight 1998). Furthermore, epistasis may play an important role in conservation genetics if it contributes to outbreeding de- pression (Fenster and Dudash 1994; Frankham 1995; Dudash and Fenster 2000). Therefore, we would like to know whether intraspecific epistatic differentiation is prevalent and whether models of evolution must incorporate this complexity. If epistasis contributes to population genetic differentia- tion, what processes are responsible for population diver- gence? Although selection alone may cause populations to diverge epistatically (Dobzhansky 1937; Orr 1995; Gavrilets and Hastings 1996), perhaps the most frequently cited evo- lutionary model that includes epistasis, Wright’s (1931, 1932) vision of the adaptive landscape, incorporates both drift and selection as leading to epistatic differentiation. There is abundant evidence for the role of natural selection in population divergence (Endler 1986; Futuyma 1997), and empirical work over the last 40 years has demonstrated that species exhibit significant population genetic structure, and thus the opportunity for drift to influence evolution (Hastings and Harrison 1994). This latter conclusion is based on studies documenting small population sizes (e.g., Levin 1981; Fens- ter 1991a,b), heterosis in progeny of interpopulation crosses (e.g., Wallace 1955; Fenster 1991b; reviewed in Waser 1993), and population differentiation for neutral molecular markers (Slatkin 1987; Hamrick and Godt 1989). Although the con- ditions for drift to influence evolution have been demonstrat- ed, there are only several well-documented cases where drift has been shown to contribute to the evolution of adaptations (reviewed in Coyne et al. 1997). Thus, we have a limited understanding of the way in which drift interacts with se- lection and whether selection acts on gene interactions. This is surprising because it is the selection of genes in a genetic context, or the way these genes interact epistatically within specific genetic backgrounds (e.g., genes selected for their joint effects on fitness, Falconer and Mackay 1996), that Wright (1931, 1932) modeled as being so important. The evolution of populations, according to Wright, represents the evolution of favorably coadapted genes (Goodnight 1995; Wade and Goodnight 1998). Studies that simultaneously quantify population structure and the genetic basis and adap- tive nature of population differentiation are needed if we are to understand whether we need to incorporate drift and epis- tasis into models of evolution.
Transcript of POPULATION DIFFERENTIATION IN AN ANNUAL LEGUME: GENETIC ARCHITECTURE
1157
q 2000 The Society for the Study of Evolution. All rights reserved.
Evolution, 54(4), 2000, pp. 1157–1172
POPULATION DIFFERENTIATION IN AN ANNUAL LEGUME:GENETIC ARCHITECTURE
CHARLES B. FENSTER1,2 AND LAURA F. GALLOWAY3
1Department of Biology, H. J. Patterson Hall, University of Maryland, College Park, Maryland 20742E-mail: [email protected]
2Botanisk Institutt, NTNU, Trondheim, N-7491, NorwayE-mail: [email protected]
3Department of Biology, University of Virginia, Charlottesville, Virginia 22903-2477E-mail: [email protected]
Abstract. The presence or absence of epistasis, or gene interaction, is explicitly assumed in many evolutionary models.Although many empirical studies have documented a role of epistasis in population divergence under laboratoryconditions, there have been very few attempts at quantifying epistasis in the native environment where natural selectionis expected to act. In addition, we have little understanding of the frequency with which epistasis contributes to theevolution of natural populations. In this study we used a quantitative genetic design to quantify the contribution ofepistasis to population divergence for fitness components of a native annual legume, Chamaecrista fasciculata. Thedesign incorporated the contrast of performance of F2 and F3 segregating progeny of 18 interpopulation crosses withthe F1 and their parents. Crosses were conducted between populations from 100 m to 2000 km apart. All generationswere grown for two seasons in the natural environment of one of the parents. The F1 often outperformed the parents.This F1 heterosis reveals population structure and suggests that drift is a major contributor to population differentiation.The F2 generation demonstrated that combining genes from different populations can sometimes have unexpectedpositive effects. However, the F3 performance indicated that combining genes from different populations decreasedvigor beyond that due to the expected loss of heterozygosity. Combined with previous data, our results suggest thatboth selection and drift contribute to population differentiation that is based on epistatic genetic divergence. Becauseonly the F3 consistently expressed hybrid breakdown, we conclude that the epistasis documented in our study reflectsinteractions among linked loci.
Key words. Coadaptation, drift, epistasis, Fisher-Wright controversy, heterosis, inbreeding depression, outbreedingdepression, selection, shifting balance.
Received April 6, 1999. Accepted March 7, 2000.
The extent to which epistasis does or does not contributeto genetic divergence is pivotal to a number of evolutionarygenetic models, some of which date back to the inception ofNeodarwinism (e.g., Fisher 1930; Wright 1931). More re-cently, epistatic differentiation has been invoked to play animportant role in the ability of populations to respond toselection (reviewed in Wade and Goodnight 1998) and themaintenance of genetic variation (Gimelfarb 1989; Goldsteinand Holsinger 1992). Epistasis is also central to many the-ories of speciation (Dobzhansky 1937; Stebbins 1950; Mayr1954; Grant 1981; Carson and Templeton 1984; Howard1994; Gavrilets and Hastings 1996; Arnold 1997; Rieseberg1997; Burke et al. 1998) and demonstration of an importantrole of epistasis in intraspecific differentiation may removethe need for ad hoc explanations for the evolution of epistaticinteractions at the interspecifc level (Wade and Goodnight1998). Furthermore, epistasis may play an important role inconservation genetics if it contributes to outbreeding de-pression (Fenster and Dudash 1994; Frankham 1995; Dudashand Fenster 2000). Therefore, we would like to know whetherintraspecific epistatic differentiation is prevalent and whethermodels of evolution must incorporate this complexity.
If epistasis contributes to population genetic differentia-tion, what processes are responsible for population diver-gence? Although selection alone may cause populations todiverge epistatically (Dobzhansky 1937; Orr 1995; Gavriletsand Hastings 1996), perhaps the most frequently cited evo-lutionary model that includes epistasis, Wright’s (1931,1932) vision of the adaptive landscape, incorporates both
drift and selection as leading to epistatic differentiation.There is abundant evidence for the role of natural selectionin population divergence (Endler 1986; Futuyma 1997), andempirical work over the last 40 years has demonstrated thatspecies exhibit significant population genetic structure, andthus the opportunity for drift to influence evolution (Hastingsand Harrison 1994). This latter conclusion is based on studiesdocumenting small population sizes (e.g., Levin 1981; Fens-ter 1991a,b), heterosis in progeny of interpopulation crosses(e.g., Wallace 1955; Fenster 1991b; reviewed in Waser 1993),and population differentiation for neutral molecular markers(Slatkin 1987; Hamrick and Godt 1989). Although the con-ditions for drift to influence evolution have been demonstrat-ed, there are only several well-documented cases where drifthas been shown to contribute to the evolution of adaptations(reviewed in Coyne et al. 1997). Thus, we have a limitedunderstanding of the way in which drift interacts with se-lection and whether selection acts on gene interactions. Thisis surprising because it is the selection of genes in a geneticcontext, or the way these genes interact epistatically withinspecific genetic backgrounds (e.g., genes selected for theirjoint effects on fitness, Falconer and Mackay 1996), thatWright (1931, 1932) modeled as being so important. Theevolution of populations, according to Wright, represents theevolution of favorably coadapted genes (Goodnight 1995;Wade and Goodnight 1998). Studies that simultaneouslyquantify population structure and the genetic basis and adap-tive nature of population differentiation are needed if we areto understand whether we need to incorporate drift and epis-tasis into models of evolution.

1158 C. B. FENSTER AND L. F. GALLOWAY
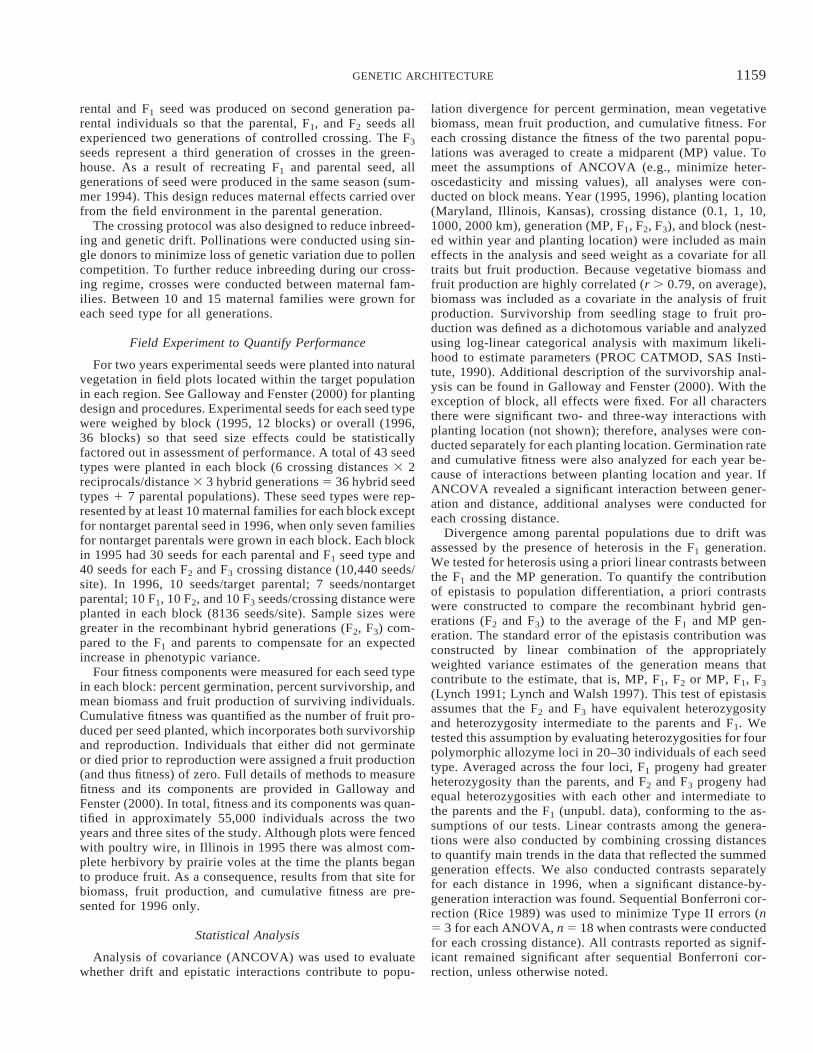
FIG. 1. Crossing design to examine the spatial scale of local adaptation, inbreeding, and epistatic differentiation between populations.The design was replicated for three target populations.
Several recent reviews of these alternative conceptions ofthe evolutionary process conclude that there are too few field-based studies that address selection on gene interactions, in-teractions between selection and drift, and the genetic ar-chitecture of adaptive evolution to evaluate either vision(Whitlock et al. 1995; Coyne et al. 1997; Fenster et al. 1997;Wade and Goodnight 1998). Although laboratory or com-mon-garden studies can provide a detailed understanding ofthe genetic mechanisms underlying adaptation, studies in na-ture are necessary to fully understand how genetic architec-ture may dictate evolution because the interaction betweennatural selection and genetic variation ultimately determinesthe evolutionary process.
In a companion paper (Galloway and Fenster 2000), wedemonstrated limited evidence for a home-site advantage orlocal adaptation at the scale of populations separated by #100 km. However, it is still possible that there is geneticdifferentiation in the way the same populations are adaptedto their environments, especially if fitness differentiation islargely due to nonadditive gene action. Here we examine thecontribution of nonadditive genetic variation to populationdifferentiation for fitness and its components in an outcross-ing annual, Chamaecrista fasciculata. We ask (1) do patternsof dominance differ among populations, suggesting a role fordrift in population divergence, and (2) does epistasis con-tribute to population divergence for fitness components? Be-cause gene flow is limited in C. fasciculata (Fenster 1991a,b;Fenster and Dudash 1994), we expect the processes of pop-ulation differentiation and the type of gene action may changewith increasing distance between populations. Thus, we askour questions within a spatial context to determine how thegenetic architecture and the influence of selection and drifton population differentiation scale with distance.
MATERIALS AND METHODS
Study Organism and Study Site
Chamaecrista fasciculata Michx., partridge pea (5 Cassiafasciculata; Irwin and Barneby 1982), is a self-compatible,mostly outcrossing (Fenster 1991a, 1995), annual legume na-tive to eastern North America. There are no pre- or post-mating sterility barriers between populations separated by upto 2000 km. Fuller description of characteristics such as hab-itat and life history can be found in Galloway and Fenster(2000).
Five populations in each of three regions were selected toquantify local adaptation (Galloway and Fenster 2000), pop-ulation inbreeding, and the contribution of epistasis to pop-ulation genetic differentiation in C. fasciculata. The threeregions span the species range in eastern North America. Ineach region a target or home-site population was chosen. Theremaining four populations in each region were located atincreasing distances from the target population (0.1, 1, 10,100 km). Seeds were collected separately by maternal familyin each population.
Crossing Design
Each of the target populations was crossed to populationsin the same state and to the other target populations for atotal of six interpopulation crossing distances (Fig. 1). From20–40 maternal families of field-collected seed were grownto flowering in the greenhouse for each population. Uponflowering, single-donor crosses were made both within andbetween populations. Within-population crosses were con-ducted between randomly selected individuals from the 20–40 different maternal families for each parental population.Within-population crosses represented crosses between in-dividuals that were within several Wright neighborhoods ofone another based on previous gene flow estimates (Fenster1991a,b). Each population was also reciprocally crossed withits local target population. The Maryland and Kansas targetpopulations were crossed to Illinois and to each other togenerate 1000-km and 2000-km crossing distances, respec-tively. Because of the intermediate location of Illinois, two1000 km crosses were conducted, one to Maryland and theother to Kansas. These crosses resulted in parental seed(crossing distance 0) and F1 hybrids between populations 0.1,1, 10, 100, 1000, and 2000 km apart.
Crosses were conducted for two more generations to pro-duce F2 and F3 hybrids between populations and parentalseed that had experienced equivalent cultural conditions tohybrids. F1 plants within a seed type were randomly crossedto one another to produce F2 individuals. F2 seeds were thengrown and randomly crossed to produce third generation hy-brid seeds (F3). Reciprocal hybrids were crossed separatelyfor all generations, producing two groups of F1, F2, and F3hybrids that share the same nuclear genes, but differ in theircytoplasmic genes. In the field experiments each reciprocalcross was evenly represented in the hybrid generations. Pa-
1159GENETIC ARCHITECTURE
rental and F1 seed was produced on second generation pa-rental individuals so that the parental, F1, and F2 seeds allexperienced two generations of controlled crossing. The F3seeds represent a third generation of crosses in the green-house. As a result of recreating F1 and parental seed, allgenerations of seed were produced in the same season (sum-mer 1994). This design reduces maternal effects carried overfrom the field environment in the parental generation.
The crossing protocol was also designed to reduce inbreed-ing and genetic drift. Pollinations were conducted using sin-gle donors to minimize loss of genetic variation due to pollencompetition. To further reduce inbreeding during our cross-ing regime, crosses were conducted between maternal fam-ilies. Between 10 and 15 maternal families were grown foreach seed type for all generations.
Field Experiment to Quantify Performance
For two years experimental seeds were planted into naturalvegetation in field plots located within the target populationin each region. See Galloway and Fenster (2000) for plantingdesign and procedures. Experimental seeds for each seed typewere weighed by block (1995, 12 blocks) or overall (1996,36 blocks) so that seed size effects could be statisticallyfactored out in assessment of performance. A total of 43 seedtypes were planted in each block (6 crossing distances 3 2reciprocals/distance 3 3 hybrid generations 5 36 hybrid seedtypes 1 7 parental populations). These seed types were rep-resented by at least 10 maternal families for each block exceptfor nontarget parental seed in 1996, when only seven familiesfor nontarget parentals were grown in each block. Each blockin 1995 had 30 seeds for each parental and F1 seed type and40 seeds for each F2 and F3 crossing distance (10,440 seeds/site). In 1996, 10 seeds/target parental; 7 seeds/nontargetparental; 10 F1, 10 F2, and 10 F3 seeds/crossing distance wereplanted in each block (8136 seeds/site). Sample sizes weregreater in the recombinant hybrid generations (F2, F3) com-pared to the F1 and parents to compensate for an expectedincrease in phenotypic variance.
Four fitness components were measured for each seed typein each block: percent germination, percent survivorship, andmean biomass and fruit production of surviving individuals.Cumulative fitness was quantified as the number of fruit pro-duced per seed planted, which incorporates both survivorshipand reproduction. Individuals that either did not germinateor died prior to reproduction were assigned a fruit production(and thus fitness) of zero. Full details of methods to measurefitness and its components are provided in Galloway andFenster (2000). In total, fitness and its components was quan-tified in approximately 55,000 individuals across the twoyears and three sites of the study. Although plots were fencedwith poultry wire, in Illinois in 1995 there was almost com-plete herbivory by prairie voles at the time the plants beganto produce fruit. As a consequence, results from that site forbiomass, fruit production, and cumulative fitness are pre-sented for 1996 only.
Statistical Analysis
Analysis of covariance (ANCOVA) was used to evaluatewhether drift and epistatic interactions contribute to popu-
lation divergence for percent germination, mean vegetativebiomass, mean fruit production, and cumulative fitness. Foreach crossing distance the fitness of the two parental popu-lations was averaged to create a midparent (MP) value. Tomeet the assumptions of ANCOVA (e.g., minimize heter-oscedasticity and missing values), all analyses were con-ducted on block means. Year (1995, 1996), planting location(Maryland, Illinois, Kansas), crossing distance (0.1, 1, 10,1000, 2000 km), generation (MP, F1, F2, F3), and block (nest-ed within year and planting location) were included as maineffects in the analysis and seed weight as a covariate for alltraits but fruit production. Because vegetative biomass andfruit production are highly correlated (r . 0.79, on average),biomass was included as a covariate in the analysis of fruitproduction. Survivorship from seedling stage to fruit pro-duction was defined as a dichotomous variable and analyzedusing log-linear categorical analysis with maximum likeli-hood to estimate parameters (PROC CATMOD, SAS Insti-tute, 1990). Additional description of the survivorship anal-ysis can be found in Galloway and Fenster (2000). With theexception of block, all effects were fixed. For all charactersthere were significant two- and three-way interactions withplanting location (not shown); therefore, analyses were con-ducted separately for each planting location. Germination rateand cumulative fitness were also analyzed for each year be-cause of interactions between planting location and year. IfANCOVA revealed a significant interaction between gener-ation and distance, additional analyses were conducted foreach crossing distance.
Divergence among parental populations due to drift wasassessed by the presence of heterosis in the F1 generation.We tested for heterosis using a priori linear contrasts betweenthe F1 and the MP generation. To quantify the contributionof epistasis to population differentiation, a priori contrastswere constructed to compare the recombinant hybrid gen-erations (F2 and F3) to the average of the F1 and MP gen-eration. The standard error of the epistasis contribution wasconstructed by linear combination of the appropriatelyweighted variance estimates of the generation means thatcontribute to the estimate, that is, MP, F1, F2 or MP, F1, F3(Lynch 1991; Lynch and Walsh 1997). This test of epistasisassumes that the F2 and F3 have equivalent heterozygosityand heterozygosity intermediate to the parents and F1. Wetested this assumption by evaluating heterozygosities for fourpolymorphic allozyme loci in 20–30 individuals of each seedtype. Averaged across the four loci, F1 progeny had greaterheterozygosity than the parents, and F2 and F3 progeny hadequal heterozygosities with each other and intermediate tothe parents and the F1 (unpubl. data), conforming to the as-sumptions of our tests. Linear contrasts among the genera-tions were also conducted by combining crossing distancesto quantify main trends in the data that reflected the summedgeneration effects. We also conducted contrasts separatelyfor each distance in 1996, when a significant distance-by-generation interaction was found. Sequential Bonferroni cor-rection (Rice 1989) was used to minimize Type II errors (n5 3 for each ANOVA, n 5 18 when contrasts were conductedfor each crossing distance). All contrasts reported as signif-icant remained significant after sequential Bonferroni cor-rection, unless otherwise noted.
1160 C. B. FENSTER AND L. F. GALLOWAY
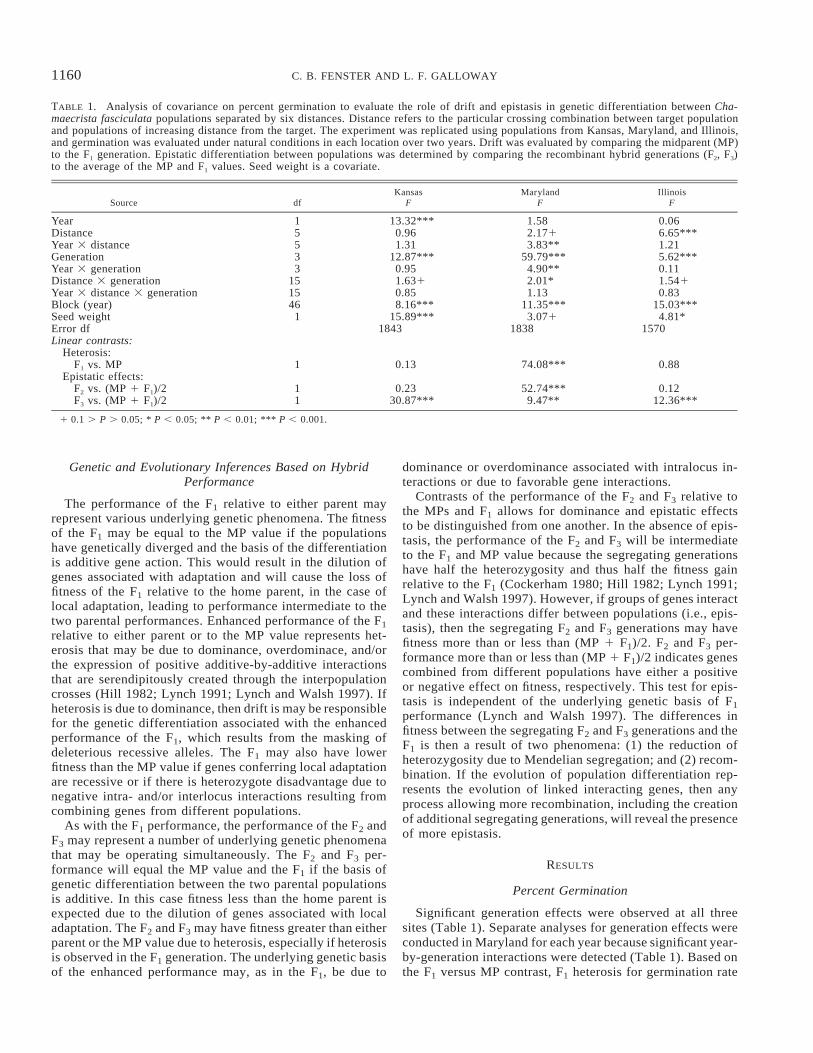
TABLE 1. Analysis of covariance on percent germination to evaluate the role of drift and epistasis in genetic differentiation between Cha-maecrista fasciculata populations separated by six distances. Distance refers to the particular crossing combination between target populationand populations of increasing distance from the target. The experiment was replicated using populations from Kansas, Maryland, and Illinois,and germination was evaluated under natural conditions in each location over two years. Drift was evaluated by comparing the midparent (MP)to the F1 generation. Epistatic differentiation between populations was determined by comparing the recombinant hybrid generations (F2, F3)to the average of the MP and F1 values. Seed weight is a covariate.
Source dfKansas
FMaryland
FIllinois
F
YearDistanceYear 3 distanceGenerationYear 3 generation
15533
13.32***0.961.31
12.87***0.95
1.582.1713.83**
59.79***4.90**
0.066.65***1.215.62***0.11
Distance 3 generationYear 3 distance 3 generationBlock (year)Seed weightError df
151546
1
1.6310.858.16***
15.89***1843
2.01*1.13
11.35***3.071
1838
1.5410.83
15.03***4.81*
1570Linear contrasts:
Heterosis:F1 vs. MP
Epistatic effects:1 0.13 74.08*** 0.88
F2 vs. (MP 1 F1)/2F3 vs. (MP 1 F1)/2
11
0.2330.87***
52.74***9.47**
0.1212.36***
1 0.1 . P . 0.05; * P , 0.05; ** P , 0.01; *** P , 0.001.
Genetic and Evolutionary Inferences Based on HybridPerformance
The performance of the F1 relative to either parent mayrepresent various underlying genetic phenomena. The fitnessof the F1 may be equal to the MP value if the populationshave genetically diverged and the basis of the differentiationis additive gene action. This would result in the dilution ofgenes associated with adaptation and will cause the loss offitness of the F1 relative to the home parent, in the case oflocal adaptation, leading to performance intermediate to thetwo parental performances. Enhanced performance of the F1relative to either parent or to the MP value represents het-erosis that may be due to dominance, overdominace, and/orthe expression of positive additive-by-additive interactionsthat are serendipitously created through the interpopulationcrosses (Hill 1982; Lynch 1991; Lynch and Walsh 1997). Ifheterosis is due to dominance, then drift is may be responsiblefor the genetic differentiation associated with the enhancedperformance of the F1, which results from the masking ofdeleterious recessive alleles. The F1 may also have lowerfitness than the MP value if genes conferring local adaptationare recessive or if there is heterozygote disadvantage due tonegative intra- and/or interlocus interactions resulting fromcombining genes from different populations.
As with the F1 performance, the performance of the F2 andF3 may represent a number of underlying genetic phenomenathat may be operating simultaneously. The F2 and F3 per-formance will equal the MP value and the F1 if the basis ofgenetic differentiation between the two parental populationsis additive. In this case fitness less than the home parent isexpected due to the dilution of genes associated with localadaptation. The F2 and F3 may have fitness greater than eitherparent or the MP value due to heterosis, especially if heterosisis observed in the F1 generation. The underlying genetic basisof the enhanced performance may, as in the F1, be due to
dominance or overdominance associated with intralocus in-teractions or due to favorable gene interactions.
Contrasts of the performance of the F2 and F3 relative tothe MPs and F1 allows for dominance and epistatic effectsto be distinguished from one another. In the absence of epis-tasis, the performance of the F2 and F3 will be intermediateto the F1 and MP value because the segregating generationshave half the heterozygosity and thus half the fitness gainrelative to the F1 (Cockerham 1980; Hill 1982; Lynch 1991;Lynch and Walsh 1997). However, if groups of genes interactand these interactions differ between populations (i.e., epis-tasis), then the segregating F2 and F3 generations may havefitness more than or less than (MP 1 F1)/2. F2 and F3 per-formance more than or less than (MP 1 F1)/2 indicates genescombined from different populations have either a positiveor negative effect on fitness, respectively. This test for epis-tasis is independent of the underlying genetic basis of F1performance (Lynch and Walsh 1997). The differences infitness between the segregating F2 and F3 generations and theF1 is then a result of two phenomena: (1) the reduction ofheterozygosity due to Mendelian segregation; and (2) recom-bination. If the evolution of population differentiation rep-resents the evolution of linked interacting genes, then anyprocess allowing more recombination, including the creationof additional segregating generations, will reveal the presenceof more epistasis.
RESULTS
Percent Germination
Significant generation effects were observed at all threesites (Table 1). Separate analyses for generation effects wereconducted in Maryland for each year because significant year-by-generation interactions were detected (Table 1). Based onthe F1 versus MP contrast, F1 heterosis for germination rate

1161GENETIC ARCHITECTURE
FIG. 2. Deviation of F2 and F3 hybrids from the average of the F1 and midparent values to determine the contribution of epistasis topopulation differentiation for germination rates. Significant deviations from zero (noted in the body of the figure) indicate epistaticdifferentiation between the populations of Chamaecrista fasciculata. Experiments were conducted in nature and replicated in Maryland(MD), Illinois (IL), and Kansas (KS). Crosses are among populations separated by six distances. Bars represent two standard errors.Missing bars indicate a value of zero.
was observed for both years in Maryland (F1,468 5 9.87, P, 0.01; F1,452 5 102.39, P , 0.001, 1995 and 1996, re-spectively). However, the expression of heterosis for ger-mination rate was greater in 1996 for Maryland (1995: F167% . MP 58%; 1996: F1 68% . MP 52%). Epistatic in-teractions for germination differ between populations in allthree locations. In Maryland in 1995 (F1,468 5 17.97, P ,0.01) and in Kansas over both years, fewer F3 seeds ger-minated than expected based on the average of the MP andF1 generation (Fig. 2). In contrast, germination exceeded ex-pectations for the F3 in Illinois and the F2 in Maryland in1996 (F1,1452 5 46.22, P ,0.001, Fig. 2). Nonsignificant oronly marginally significant crossing distance-by-generationeffects indicate that crossing distance did not influence thedegree of dominance or epistatic differentiation between pop-ulations in any planting location (see also Fig. 2).
Survivorship
A significant generation-by-year effect in Kansas (Table2) was manifested as generations not differing for survivor-ship in 1995 (x2 5 6.55, df 5 3, P 5 0.08), but differing in1996 (x2 5 90.43, df 5 3, P , 0.001, analyses not shown).The F1 hybrids had greater survivorship than the parental
generation mean, indicating heterosis in between-populationcrosses in Kansas in 1996 (x2 5 71.95, df 5 1, P 5 0.0001,analysis not shown) and in Maryland over both years (Table2, Fig. 3). The survivorship of the recombinant hybrids wasgreater than the expected MP-F1 average for both F2 and F3generations in Maryland (Table 2) and in Kansas in 1996 (F2x2 5 48.80, df 5 1, P 5 0.0001; F3 x2 5 39.59, df 5 1, P, 0.0001; Fig. 4). Generation differences were largely dueto low levels of survivorship of the parental generation (Fig.3). As with germination, there was no evidence that the de-gree of nonadditive differentiation between populations var-ied with crossing distance (Table 2, distance-by-generationnot significant and therefore not in model).
Vegetative Biomass
Nonadditive genetic effects contributed to population dif-ferentiation for vegetative biomass in Kansas and Maryland.These effects were consistent across years, as demonstratedby the lack of significant interactions involving both year andgeneration (Table 3). For both planting locations the F1 bio-mass was greater than the average of the two parental popu-lations, indicating heterosis (Table 3, Fig. 5). The pattern ofepistatic differentiation varied between Maryland and Kansas.

1162 C. B. FENSTER AND L. F. GALLOWAY
TABLE 2. Log-linear analysis of survivorship to evaluate the role of drift and epistasis to genetic differentiation of Chamaecrista fasciculatapopulations sampled over six distances and planted in three locations over two years. The models vary among the three planting locations;factors omitted from models are indicated by a dash. Factors not significant for any site and year combination are not included in the table.See Table 1 for details.
Source dfKansas
x2
Marylandx2
Illinois1
x2
GenerationDistanceYearDistance 3 yearDistance 3 generation 3 yearGeneration 3 yearBlock
3515
153
14
37.14***14.01*6.11*
11.16*—
33.76***59.36***
49.55***43.01***5.94*———
168.27***
3.633.03
15.64***—
27.05*—
140.96***Linear contrasts:
Heterosis:F1 vs. MP
Epistatic effects:F2 vs. (MP 1 F1)/2F3 vs. (MP 1 F1)/2
1
11
35.36***
7.28**3.50
45.93***
11.86***7.42**
Likelihood ratio: x2
df132.00352
397.61360
359.50345
1 Contrasts not conducted because generation effect was not significant.
FIG. 4. Deviation of F2 and F3 hybrids from the average of the F1and midparent values to determine the contribution of epistasis topopulation differentiation for high survivorship in Chamaecristafasciculata. F2 and F3 that are significantly different from (F1 1MP)/2 are starred. Bars represent 2 standard errors. See Figure twofor details.
FIG. 3. Contrasts of F1 of interpopulation crosses and midparent(MP) values to determine the contribution of drift to populationdifferentiation for high survivorhip in Chamaerista fasciculata. Be-cause the definition of ‘‘high survivorship’’ differs between plant-ing locations, it is only meaningful to compare the magnitude ofsurvivorship among generations within each location. F1 that aresignificantly different from MP are starred. Bars represent two stan-dard errors. See Figure 2 for details.
In Maryland, the F2 generation had greater biomass than theexpected MP-F1 average, whereas in Kansas the F3 generationhad lower biomass than expected (Table 3, Fig. 6). Significantdistance-by-generation interactions in Maryland and Illinoisdemonstrate that the magnitude of the generation effect varieswith crossing distance (Table 3). However, this variation doesnot scale in a simple way with distance (Fig. 6).
Fruit Production
Fruit production adjusted for plant size demonstrates nohybrid vigor, but appreciable hybrid breakdown was foundin both Maryland and Illinois across years (Table 4). Bothrecombinant hybrid generations in Maryland and the F3 inIllinois had lower than expected fruit production (Fig. 7).
1163GENETIC ARCHITECTURE
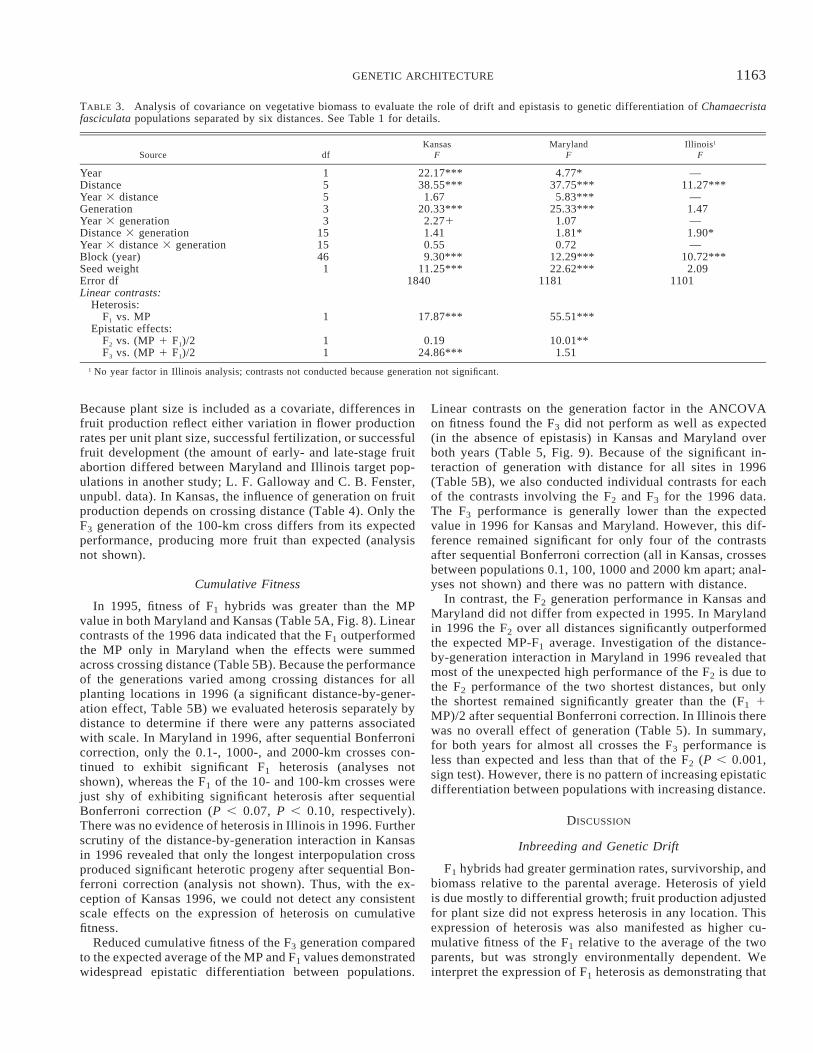
TABLE 3. Analysis of covariance on vegetative biomass to evaluate the role of drift and epistasis to genetic differentiation of Chamaecristafasciculata populations separated by six distances. See Table 1 for details.
Source dfKansas
FMaryland
FIllinois1
F
YearDistanceYear 3 distanceGenerationYear 3 generation
15533
22.17***38.55***1.67
20.33***2.271
4.77*37.75***5.83***
25.33***1.07
—11.27***
—1.47—
Distance 3 generationYear 3 distance 3 generationBlock (year)Seed weightError df
151546
1
1.410.559.30***
11.25***1840
1.81*0.72
12.29***22.62***
1181
1.90*—
10.72***2.09
1101Linear contrasts:
Heterosis:F1 vs. MP
Epistatic effects:F2 vs. (MP 1 F1)/2F3 vs. (MP 1 F1)/2
1
11
17.87***
0.1924.86***
55.51***
10.01**1.51
1 No year factor in Illinois analysis; contrasts not conducted because generation not significant.
Because plant size is included as a covariate, differences infruit production reflect either variation in flower productionrates per unit plant size, successful fertilization, or successfulfruit development (the amount of early- and late-stage fruitabortion differed between Maryland and Illinois target pop-ulations in another study; L. F. Galloway and C. B. Fenster,unpubl. data). In Kansas, the influence of generation on fruitproduction depends on crossing distance (Table 4). Only theF3 generation of the 100-km cross differs from its expectedperformance, producing more fruit than expected (analysisnot shown).
Cumulative Fitness
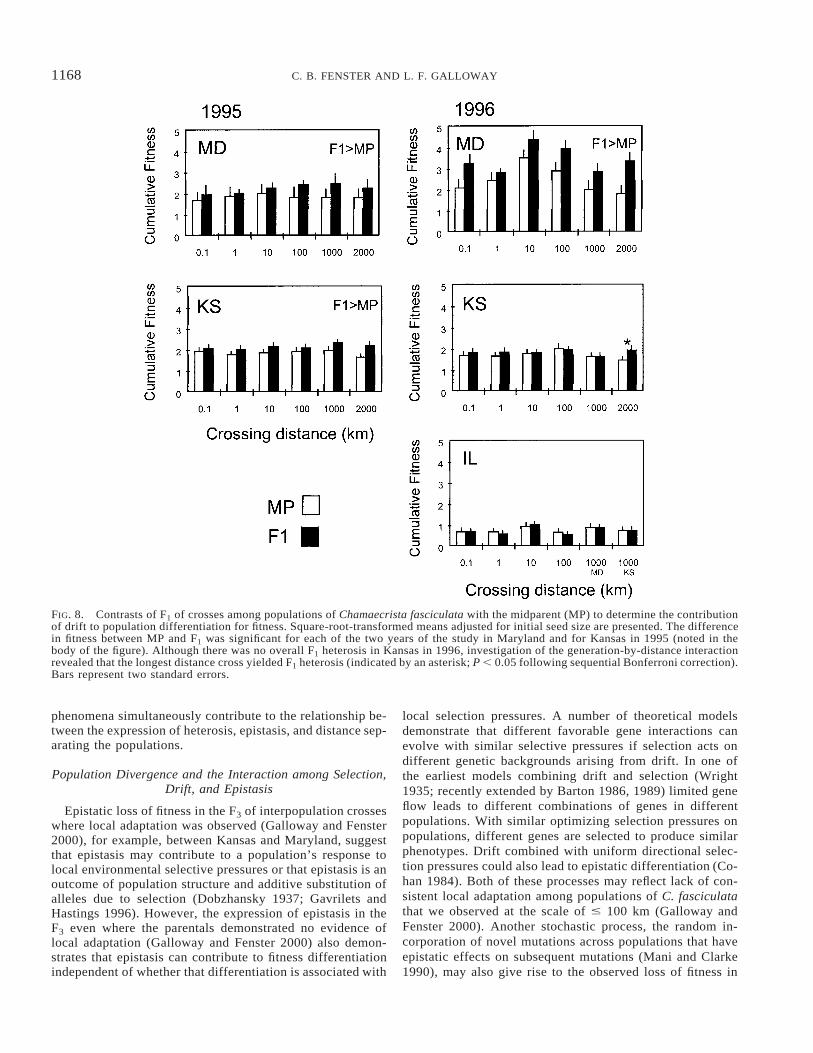
In 1995, fitness of F1 hybrids was greater than the MPvalue in both Maryland and Kansas (Table 5A, Fig. 8). Linearcontrasts of the 1996 data indicated that the F1 outperformedthe MP only in Maryland when the effects were summedacross crossing distance (Table 5B). Because the performanceof the generations varied among crossing distances for allplanting locations in 1996 (a significant distance-by-gener-ation effect, Table 5B) we evaluated heterosis separately bydistance to determine if there were any patterns associatedwith scale. In Maryland in 1996, after sequential Bonferronicorrection, only the 0.1-, 1000-, and 2000-km crosses con-tinued to exhibit significant F1 heterosis (analyses notshown), whereas the F1 of the 10- and 100-km crosses werejust shy of exhibiting significant heterosis after sequentialBonferroni correction (P , 0.07, P , 0.10, respectively).There was no evidence of heterosis in Illinois in 1996. Furtherscrutiny of the distance-by-generation interaction in Kansasin 1996 revealed that only the longest interpopulation crossproduced significant heterotic progeny after sequential Bon-ferroni correction (analysis not shown). Thus, with the ex-ception of Kansas 1996, we could not detect any consistentscale effects on the expression of heterosis on cumulativefitness.
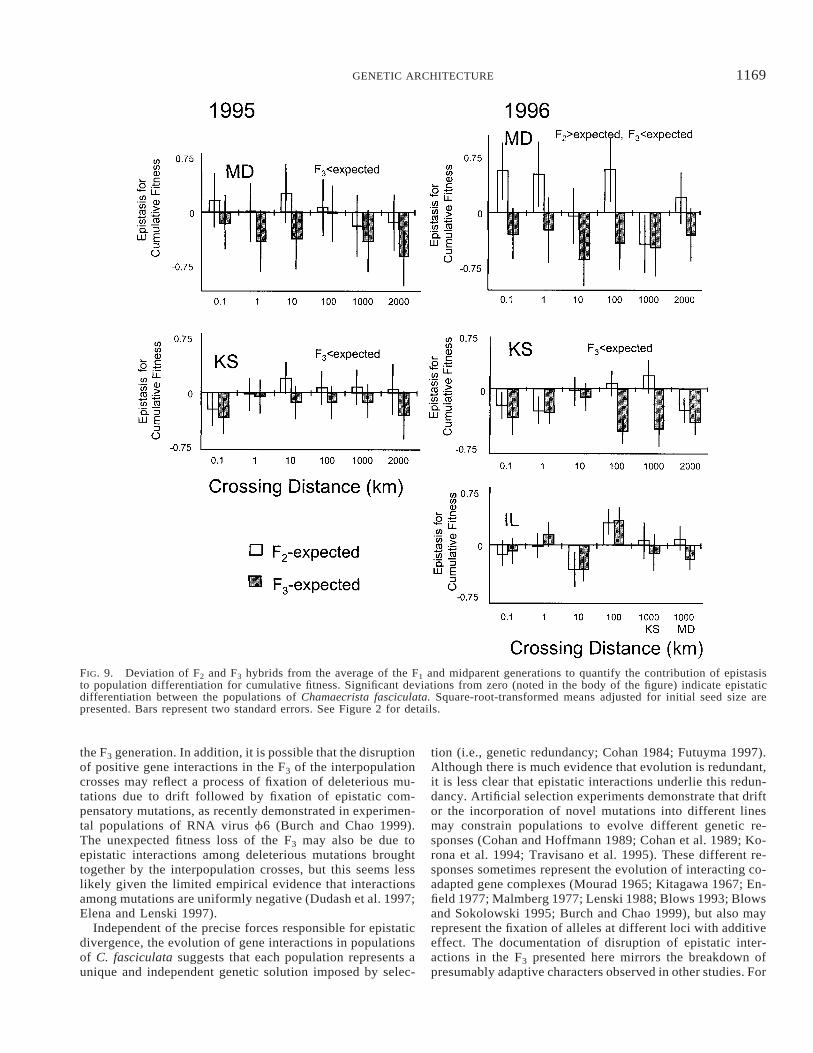
Reduced cumulative fitness of the F3 generation comparedto the expected average of the MP and F1 values demonstratedwidespread epistatic differentiation between populations.
Linear contrasts on the generation factor in the ANCOVAon fitness found the F3 did not perform as well as expected(in the absence of epistasis) in Kansas and Maryland overboth years (Table 5, Fig. 9). Because of the significant in-teraction of generation with distance for all sites in 1996(Table 5B), we also conducted individual contrasts for eachof the contrasts involving the F2 and F3 for the 1996 data.The F3 performance is generally lower than the expectedvalue in 1996 for Kansas and Maryland. However, this dif-ference remained significant for only four of the contrastsafter sequential Bonferroni correction (all in Kansas, crossesbetween populations 0.1, 100, 1000 and 2000 km apart; anal-yses not shown) and there was no pattern with distance.
In contrast, the F2 generation performance in Kansas andMaryland did not differ from expected in 1995. In Marylandin 1996 the F2 over all distances significantly outperformedthe expected MP-F1 average. Investigation of the distance-by-generation interaction in Maryland in 1996 revealed thatmost of the unexpected high performance of the F2 is due tothe F2 performance of the two shortest distances, but onlythe shortest remained significantly greater than the (F1 1MP)/2 after sequential Bonferroni correction. In Illinois therewas no overall effect of generation (Table 5). In summary,for both years for almost all crosses the F3 performance isless than expected and less than that of the F2 (P , 0.001,sign test). However, there is no pattern of increasing epistaticdifferentiation between populations with increasing distance.
DISCUSSION
Inbreeding and Genetic Drift
F1 hybrids had greater germination rates, survivorship, andbiomass relative to the parental average. Heterosis of yieldis due mostly to differential growth; fruit production adjustedfor plant size did not express heterosis in any location. Thisexpression of heterosis was also manifested as higher cu-mulative fitness of the F1 relative to the average of the twoparents, but was strongly environmentally dependent. Weinterpret the expression of F1 heterosis as demonstrating that
1164 C. B. FENSTER AND L. F. GALLOWAY
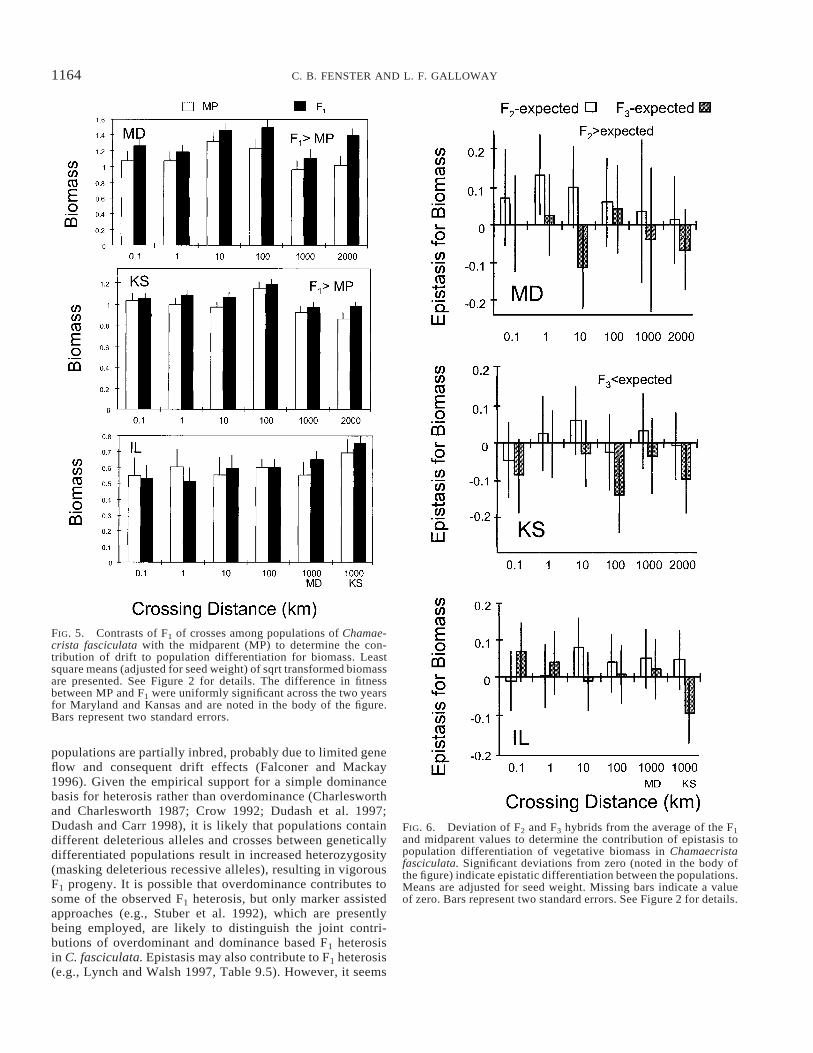
FIG. 5. Contrasts of F1 of crosses among populations of Chamae-crista fasciculata with the midparent (MP) to determine the con-tribution of drift to population differentiation for biomass. Leastsquare means (adjusted for seed weight) of sqrt transformed biomassare presented. See Figure 2 for details. The difference in fitnessbetween MP and F1 were uniformly significant across the two yearsfor Maryland and Kansas and are noted in the body of the figure.Bars represent two standard errors.
FIG. 6. Deviation of F2 and F3 hybrids from the average of the F1and midparent values to determine the contribution of epistasis topopulation differentiation of vegetative biomass in Chamaecristafasciculata. Significant deviations from zero (noted in the body ofthe figure) indicate epistatic differentiation between the populations.Means are adjusted for seed weight. Missing bars indicate a valueof zero. Bars represent two standard errors. See Figure 2 for details.
populations are partially inbred, probably due to limited geneflow and consequent drift effects (Falconer and Mackay1996). Given the empirical support for a simple dominancebasis for heterosis rather than overdominance (Charlesworthand Charlesworth 1987; Crow 1992; Dudash et al. 1997;Dudash and Carr 1998), it is likely that populations containdifferent deleterious alleles and crosses between geneticallydifferentiated populations result in increased heterozygosity(masking deleterious recessive alleles), resulting in vigorousF1 progeny. It is possible that overdominance contributes tosome of the observed F1 heterosis, but only marker assistedapproaches (e.g., Stuber et al. 1992), which are presentlybeing employed, are likely to distinguish the joint contri-butions of overdominant and dominance based F1 heterosisin C. fasciculata. Epistasis may also contribute to F1 heterosis(e.g., Lynch and Walsh 1997, Table 9.5). However, it seems
1165GENETIC ARCHITECTURE
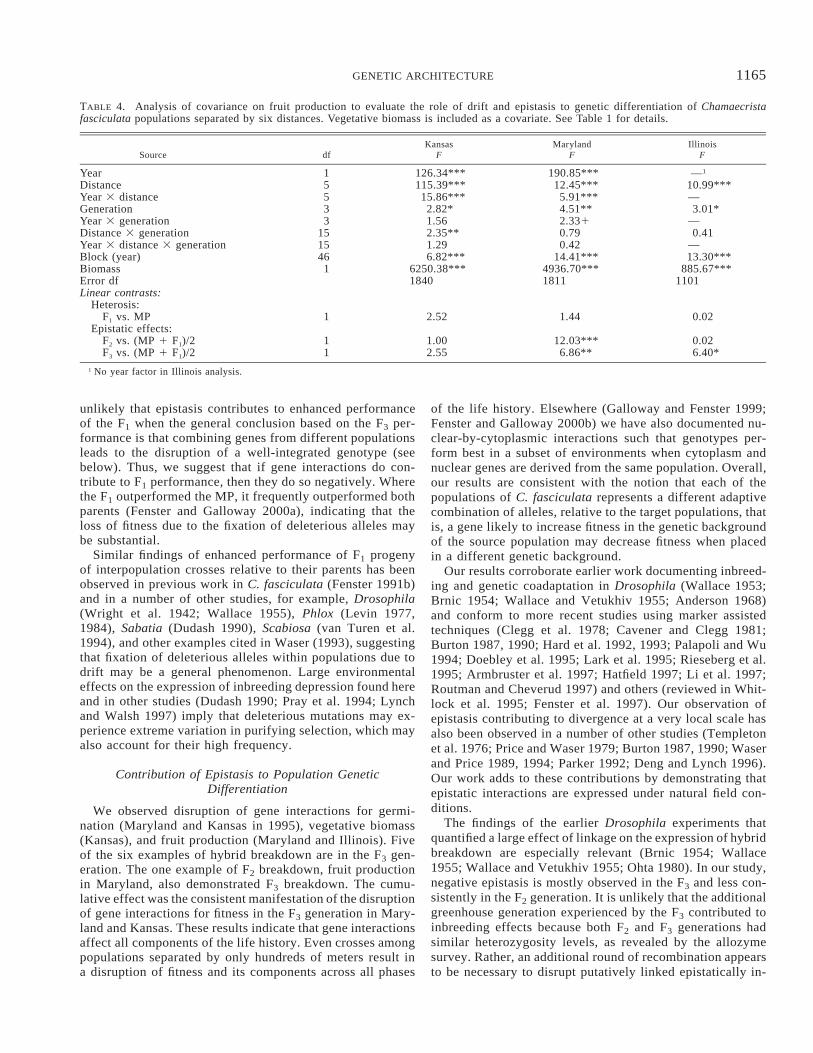
TABLE 4. Analysis of covariance on fruit production to evaluate the role of drift and epistasis to genetic differentiation of Chamaecristafasciculata populations separated by six distances. Vegetative biomass is included as a covariate. See Table 1 for details.
Source dfKansas
FMaryland
FIllinois
F
YearDistanceYear 3 distanceGenerationYear 3 generation
15533
126.34***115.39***15.86***2.82*1.56
190.85***12.45***5.91***4.51**2.331
—1
10.99***—3.01*
—Distance 3 generationYear 3 distance 3 generationBlock (year)BiomassError df
151546
1
2.35**1.296.82***
6250.38***1840
0.790.42
14.41***4936.70***1811
0.41—13.30***
885.67***1101
Linear contrasts:Heterosis:
F1 vs. MPEpistatic effects:
F2 vs. (MP 1 F1)/2F3 vs. (MP 1 F1)/2
1
11
2.52
1.002.55
1.44
12.03***6.86**
0.02
0.026.40*
1 No year factor in Illinois analysis.
unlikely that epistasis contributes to enhanced performanceof the F1 when the general conclusion based on the F3 per-formance is that combining genes from different populationsleads to the disruption of a well-integrated genotype (seebelow). Thus, we suggest that if gene interactions do con-tribute to F1 performance, then they do so negatively. Wherethe F1 outperformed the MP, it frequently outperformed bothparents (Fenster and Galloway 2000a), indicating that theloss of fitness due to the fixation of deleterious alleles maybe substantial.
Similar findings of enhanced performance of F1 progenyof interpopulation crosses relative to their parents has beenobserved in previous work in C. fasciculata (Fenster 1991b)and in a number of other studies, for example, Drosophila(Wright et al. 1942; Wallace 1955), Phlox (Levin 1977,1984), Sabatia (Dudash 1990), Scabiosa (van Turen et al.1994), and other examples cited in Waser (1993), suggestingthat fixation of deleterious alleles within populations due todrift may be a general phenomenon. Large environmentaleffects on the expression of inbreeding depression found hereand in other studies (Dudash 1990; Pray et al. 1994; Lynchand Walsh 1997) imply that deleterious mutations may ex-perience extreme variation in purifying selection, which mayalso account for their high frequency.
Contribution of Epistasis to Population GeneticDifferentiation
We observed disruption of gene interactions for germi-nation (Maryland and Kansas in 1995), vegetative biomass(Kansas), and fruit production (Maryland and Illinois). Fiveof the six examples of hybrid breakdown are in the F3 gen-eration. The one example of F2 breakdown, fruit productionin Maryland, also demonstrated F3 breakdown. The cumu-lative effect was the consistent manifestation of the disruptionof gene interactions for fitness in the F3 generation in Mary-land and Kansas. These results indicate that gene interactionsaffect all components of the life history. Even crosses amongpopulations separated by only hundreds of meters result ina disruption of fitness and its components across all phases
of the life history. Elsewhere (Galloway and Fenster 1999;Fenster and Galloway 2000b) we have also documented nu-clear-by-cytoplasmic interactions such that genotypes per-form best in a subset of environments when cytoplasm andnuclear genes are derived from the same population. Overall,our results are consistent with the notion that each of thepopulations of C. fasciculata represents a different adaptivecombination of alleles, relative to the target populations, thatis, a gene likely to increase fitness in the genetic backgroundof the source population may decrease fitness when placedin a different genetic background.
Our results corroborate earlier work documenting inbreed-ing and genetic coadaptation in Drosophila (Wallace 1953;Brnic 1954; Wallace and Vetukhiv 1955; Anderson 1968)and conform to more recent studies using marker assistedtechniques (Clegg et al. 1978; Cavener and Clegg 1981;Burton 1987, 1990; Hard et al. 1992, 1993; Palapoli and Wu1994; Doebley et al. 1995; Lark et al. 1995; Rieseberg et al.1995; Armbruster et al. 1997; Hatfield 1997; Li et al. 1997;Routman and Cheverud 1997) and others (reviewed in Whit-lock et al. 1995; Fenster et al. 1997). Our observation ofepistasis contributing to divergence at a very local scale hasalso been observed in a number of other studies (Templetonet al. 1976; Price and Waser 1979; Burton 1987, 1990; Waserand Price 1989, 1994; Parker 1992; Deng and Lynch 1996).Our work adds to these contributions by demonstrating thatepistatic interactions are expressed under natural field con-ditions.
The findings of the earlier Drosophila experiments thatquantified a large effect of linkage on the expression of hybridbreakdown are especially relevant (Brnic 1954; Wallace1955; Wallace and Vetukhiv 1955; Ohta 1980). In our study,negative epistasis is mostly observed in the F3 and less con-sistently in the F2 generation. It is unlikely that the additionalgreenhouse generation experienced by the F3 contributed toinbreeding effects because both F2 and F3 generations hadsimilar heterozygosity levels, as revealed by the allozymesurvey. Rather, an additional round of recombination appearsto be necessary to disrupt putatively linked epistatically in-

1166 C. B. FENSTER AND L. F. GALLOWAY
←
FIG. 7. Deviation of fruit production of F2 and F3 hybrids fromthe average of the F1 and midparent values to determine the con-tribution of epistasis to population differentiation of Chamaecristafasciculata. Significant deviations from zero (noted in the body ofthe figure) indicate epistatic differentiation between the populations.Although over all distances there was no deviation of the F2 andF3 from zero in Kansas, investigation of the generation-by-distanceinteraction revealed that the performance of the F3 of the 100-kmcross was significantly greater than the (F1 1 MP)/2 value (indicatedby an asterisk; P , 0.05 following sequential Bonferroni correc-tion). Means are adjusted for vegetative biomass. Bars representtwo standard errors. See Figure 2 for details.
teracting genes. This may explain why our results are incontrast to the outcome of a large-scale agricultural fieldstudy with maize, where no differentiation in epistatic in-teractions between cultivars were detected through the F2generation (Moll et al. 1965). Recombination disrupts theevolution of coadapted gene complexes (Turner 1967). Ourresults of coadaptation among linked genes conforms to the-oretical predictions that the evolution of interacting gene sys-tems is facilitated where recombination is limited (Wade andGoodnight 1998).
Four of the seven cases of enhanced recombinant hybridperformance for fitness components were for survivorshipand four were found in Maryland. Only the F2 in Marylandin 1996 had a significantly greater performance than expectedin the absence of epistasis. These results suggest that betterthan expected performance of recombinant hybrids may beattributed to the chance bringing together of groups of allelesthat in combination enhance fitness. Similar findings of en-hanced recombinant hybrid performance have been seen inother studies. For example, better than expected performancefor viability and development time was found in the F2 gen-eration of crosses between D. melanogaster populations(Blows and Sokolowski 1995). These type of results dem-onstrate a possible microevolutionary basis for speciation thatincludes both the generation of genome-wide negative epis-tasis among loci expressed in species hybrids (Dobzhansky1937; Gavrilets and Hastings 1996) and the formation ofchance novel recombinants with high fitness following intra-or interspecific crosses resulting in adaptive evolution (Steb-bins 1950; Grant 1981; Rieseberg 1997; Burke et al. 1998).
Scale of Population Differentiation
If genetic differentiation between populations follows anisolation-by-distance model and if the amount of heterosisand epistasis is a product of the genetic divergence betweenlines or populations (Lynch 1991; Orr 1995; Falconer andMackay 1996), then levels of dominance and epistasis areexpected to increase with distance. There was little evidencethat nonadditive genetic variation increased with distancebetween populations. Changes in the contribution of domi-nance and epistasis to population differentiation with distancewas determined by the distance-by-generation effect in theanalyses of variance. This interaction was significant for ger-mination (Maryland in 1996), vegetative biomass (Marylandand Illinois), fruit production (Kansas), and cumulative fit-ness (Maryland in 1996, Illinois in 1996, and Kansas in

1167GENETIC ARCHITECTURE
TABLE 5. Analysis of covariance to evaluate the roles of drift and epistasis in differentiation for cumulative fitness of Chamaecrista fasciculatapopulations separated by six distances. Seed weight is included as a covariate. See Table 1 for details.
A. 1995
Source dfKansas
FMaryland
F
DistanceGenerationDistance 3 generationBlockSeed weightError
53
1511
14411
6.17***20.87***1.35
11.51***4.87*
2.69*15.56***0.918.98***6.61*
Linear contrasts:Heterosis:
F1 vs. MPEpistatic effects:
F2 vs. (MP 1 F1)/2F3 vs. (MP 1 F1)/2
1
11
30.71***
1.3312.38***
13.36***
0.0314.31***
B. 1996
Source dfKansas
FMaryland
FIllinois2
F
DistanceGenerationDistance 3 generationBlockSeed weightError
53
1535
11452
13.04***29.92***3.40***6.78***
17.48***
22.63***55.63***2.12**
12.57***19.09***
1.8710.321.95*
18.11***9.32**
Linear contrasts:Heterosis:
F1 vs. MPEpistatic effects:
F2 vs. (MP 1 F1)/2F3 vs. (MP 1 F1)/2
1
11
2.64
3.5367.15***
101.81***
6.95**16.12***
0.21
0.030.53
1 df error for Kansas equals 465.2 Crossing distances differ in Illinois, with the two longest crosses of Illinois to Kansas and to Maryland both representing distances of 1000 km.
1996). Although in these analyses differentiation between thegenerations differs with distance, this tends to be associatedwith particularly low (e.g., Fig. 6, KS F3 100 km) or high(Fig. 7, KS F3 100 km) hybrid performance of one crossingdistance compared to the others rather than a pattern of dif-ferentiation that corresponds with changes in distance. Theone exception is vegetative biomass in Maryland and cu-mulative fitness in Maryland in 1996, where the F2 exceedsexpectations more frequently in short crosses (# 100 km)than longer crosses. This last result may indicate that genesthat have been tested under roughly the same local conditionsare more likely to result in favorable interactions. Lack of aconsistent scale effect for nonadditive genetic differentiationbetween populations may not be surprising in light of limitedscale effects in comparisons of the parental populations (Gal-loway and Fenster 2000). Although there is some evidencefrom other studies for scale-dependent changes in nonaddi-tive genetic differentiation (Moll et al. 1965; Burton 1990;Blows 1993; Waser and Price 1994), others have found itlacking (Lair et al. 1997). These contrasting findings likelyreflect the genetic processes that underlie population estab-lishment as well as population differentiation.
The relationship between heterosis, epistasis, and inter-parent distance may not be linear for several reasons. Naturalpopulations do not evolve in uniform environments, thus theexpression of nonadditive genetic variation may be affectedby a balance between the dilution of adaptive parental genesand the expression of heterosis and hybrid breakdown due
to dominance and epistasis (e.g., Moll et al. 1965). Our ob-servation of F1 heterosis expressed at all crossing distancesis consistent with the limited evidence for local adaptationin C. fasciculata and indicates that the masking of deleteriousrecessive alleles provides greater benefit than the decrease infitness expected with loss of local adaptation. The degree ofheterosis expressed due to dominance effects can also becomplicated by the expression of epistasis in the F1 (seeabove). Thus, if negative additive-by-additive interactions docontribute to F1 performance, then heterosis gained by pop-ulation divergence may be also be counteracted by increaseddisruption of coadapted genes. Furthermore, if gene flow isvery limited, then genetic relatedness among individuals fallsoff exponentially with distance (Malecot 1969) and there isan exponential decrease of allelic lethal genes with distanceseparating populations (Yokoyama 1979). Because gene flowis very limited in C. fasciculata, differences in relationshipamong populations may be undetectable in terms of differ-ences in performances of the F1. Finally, interpopulation dis-tance may not be related to genetic differentiation if colo-nization follows an island model, which may be consistentwith our results, at least within the scale of tens of kilometers.Corroborating these last two points, an allozyme survey ofpopulations at a similar spatial scale indicates that as muchpopulation differentiation occurs at the level of between pop-ulations at local levels as at higher levels (Fenster 1988;Fenster and Dudash 1994; L. F. Galloway, C. Hardy, and C.B. Fenster, unpubl. data). It is possible that all of the above
1168 C. B. FENSTER AND L. F. GALLOWAY
FIG. 8. Contrasts of F1 of crosses among populations of Chamaecrista fasciculata with the midparent (MP) to determine the contributionof drift to population differentiation for fitness. Square-root-transformed means adjusted for initial seed size are presented. The differencein fitness between MP and F1 was significant for each of the two years of the study in Maryland and for Kansas in 1995 (noted in thebody of the figure). Although there was no overall F1 heterosis in Kansas in 1996, investigation of the generation-by-distance interactionrevealed that the longest distance cross yielded F1 heterosis (indicated by an asterisk; P , 0.05 following sequential Bonferroni correction).Bars represent two standard errors.
phenomena simultaneously contribute to the relationship be-tween the expression of heterosis, epistasis, and distance sep-arating the populations.
Population Divergence and the Interaction among Selection,Drift, and Epistasis
Epistatic loss of fitness in the F3 of interpopulation crosseswhere local adaptation was observed (Galloway and Fenster2000), for example, between Kansas and Maryland, suggestthat epistasis may contribute to a population’s response tolocal environmental selective pressures or that epistasis is anoutcome of population structure and additive substitution ofalleles due to selection (Dobzhansky 1937; Gavrilets andHastings 1996). However, the expression of epistasis in theF3 even where the parentals demonstrated no evidence oflocal adaptation (Galloway and Fenster 2000) also demon-strates that epistasis can contribute to fitness differentiationindependent of whether that differentiation is associated with
local selection pressures. A number of theoretical modelsdemonstrate that different favorable gene interactions canevolve with similar selective pressures if selection acts ondifferent genetic backgrounds arising from drift. In one ofthe earliest models combining drift and selection (Wright1935; recently extended by Barton 1986, 1989) limited geneflow leads to different combinations of genes in differentpopulations. With similar optimizing selection pressures onpopulations, different genes are selected to produce similarphenotypes. Drift combined with uniform directional selec-tion pressures could also lead to epistatic differentiation (Co-han 1984). Both of these processes may reflect lack of con-sistent local adaptation among populations of C. fasciculatathat we observed at the scale of # 100 km (Galloway andFenster 2000). Another stochastic process, the random in-corporation of novel mutations across populations that haveepistatic effects on subsequent mutations (Mani and Clarke1990), may also give rise to the observed loss of fitness in
1169GENETIC ARCHITECTURE
FIG. 9. Deviation of F2 and F3 hybrids from the average of the F1 and midparent generations to quantify the contribution of epistasisto population differentiation for cumulative fitness. Significant deviations from zero (noted in the body of the figure) indicate epistaticdifferentiation between the populations of Chamaecrista fasciculata. Square-root-transformed means adjusted for initial seed size arepresented. Bars represent two standard errors. See Figure 2 for details.
the F3 generation. In addition, it is possible that the disruptionof positive gene interactions in the F3 of the interpopulationcrosses may reflect a process of fixation of deleterious mu-tations due to drift followed by fixation of epistatic com-pensatory mutations, as recently demonstrated in experimen-tal populations of RNA virus f6 (Burch and Chao 1999).The unexpected fitness loss of the F3 may also be due toepistatic interactions among deleterious mutations broughttogether by the interpopulation crosses, but this seems lesslikely given the limited empirical evidence that interactionsamong mutations are uniformly negative (Dudash et al. 1997;Elena and Lenski 1997).
Independent of the precise forces responsible for epistaticdivergence, the evolution of gene interactions in populationsof C. fasciculata suggests that each population represents aunique and independent genetic solution imposed by selec-
tion (i.e., genetic redundancy; Cohan 1984; Futuyma 1997).Although there is much evidence that evolution is redundant,it is less clear that epistatic interactions underlie this redun-dancy. Artificial selection experiments demonstrate that driftor the incorporation of novel mutations into different linesmay constrain populations to evolve different genetic re-sponses (Cohan and Hoffmann 1989; Cohan et al. 1989; Ko-rona et al. 1994; Travisano et al. 1995). These different re-sponses sometimes represent the evolution of interacting co-adapted gene complexes (Mourad 1965; Kitagawa 1967; En-field 1977; Malmberg 1977; Lenski 1988; Blows 1993; Blowsand Sokolowski 1995; Burch and Chao 1999), but also mayrepresent the fixation of alleles at different loci with additiveeffect. The documentation of disruption of epistatic inter-actions in the F3 presented here mirrors the breakdown ofpresumably adaptive characters observed in other studies. For

1170 C. B. FENSTER AND L. F. GALLOWAY
example, between-population crosses result in larger retinasize in the blind cave fish (Wilkens 1971), breakdown ofpesticide resistance in houseflies (King 1955), the recoveryof the wild-type breeding system in Eichhornia paniculata(Fenster and Barrett 1994), and others (Cohan 1984). Thisbreakdown may reflect either the fixation of recessive allelesat different loci (e.g., E. paniculata, Fenster and Barrett 1994)or interlocus interactions. Our results differ from many ofthe above examples because we have explicitly demonstratedthat epistasis contributes to the variety of genetic solutionsto selection pressures imposed by the environment.
One of the motivating reasons behind our study was todocument the relevancy of epistasis to the evolution of naturalpopulations. Whether or not epistasis contributes to popu-lation divergence was one of the distinguishing features ofWright’s (1931) and Fisher’s (1930) alternative visions ofthe evolutionary process. Although three important featuresof Wright’s shifting balance theory—genetic drift (Fenster1991a,b), adaptive differentiation (Fenster 1997; Gallowayand Fenster 2000), and epistasis for fitness—are present inC. fasciculata, our results do not prove one of the definingtrademarks of shifting balance, namely that population dif-ferences have evolved by crossing a fitness valley (Coyne etal. 1997). In other words, the multilocus interactions that wedetected in our experiments do not necessarily demonstratethat populations of C. fasciculata are sitting on peaks com-pletely surrounded by a landscape of genetic combinationsof lower fitness. With intermediate environments or genefrequencies it is just as possible that simple selection on theindividual effects of genes as opposed to selection on geneinteractions may have resulted in populations becoming dif-ferentiated for epistatic interactions (Dobzhansky 1937; May-nard Smith 1989; Orr 1995; Gavrilets and Hastings 1996).In this case, with ridges connecting peaks, it may not benecessary to invoke populations crossing through a fitnessvalley. Theoretical investigations demonstrate that whereridges and valleys are both present, populations are muchmore likely to evolve along the ridges (Wagner et al. 1994;Barton 1996). Furthermore, the environmental dependence ofgene expression demonstrated by variation in parental per-formance (Galloway and Fenster 2000) and fluctuations inthe amount of heterosis and epistasis expressed across thelife history in different sites and years suggests that the fitnesssurface is fluid for populations of C. fasciculata, which mayfacilitate peak shifts (Whitlock 1995, 1997). Thus, a fitnessvalley one year may be a peak or a ridge in another. Therefore,our results may be concordant with both Fisher’s (1930) andWright’s (1931) vision of the evolutionary process in thatpopulations may always evolve to increase fitness, but thatdifferent populations have different genetic starting pointsbecause of drift and epistasis.
The prevalence of epistatic differentiation suggests that theevolutionary process is complex within C. fasciculata. Thepresence of epistasis also implicates population structure orsmall population size as being an important determinant ofevolutionary process, because panmixia would not allow theformation of the observed gene interactions. Thus, the evo-lution of populations of C. fasciculata appears to reflect ‘‘aseries of small experiments’’ (Wade 1992) where ‘‘contextis of the essence’’ (Lewontin 1974). The future challenge
will be to determine the generality of our results and whetherthe genetic architecture of population differentiation de-scribed here contributes to diversification at the species level.
ACKNOWLEDGMENTS
B. Husband, L. Chao, M. Lynch, and D. Schemske pro-vided helpful discussion in the early phases of the project.D. Carr; S. Gimelfarb; G. McVean; S. Otto; J. Pannell; M.Scheirup; S. Spencer; N. Waser; M. Whitlock; anonymousreviewers; the editors, J. Conner and C. Lively; and especiallyM. Dudash made helpful comments on previous versions ofthe manuscript, which also benefited from discussion duringa sabbatical by CBF in the laboratory of N. Barton. The helpof staff at USDA Beltsville, Gooselake Prairie (Illinois); theIllinois Department of Natural Resources, Konza Prairie(Kansas); and the University of Maryland greenhouse alongwith many undergraduate and graduate students is gratefullyappreciated. We especially appreciate the help of T. Finney,B. Glass, C. Hardy, L. Hellmen, C. Jones, A. Kuhl, J. Nyhoff,and M. Sanchez. This work was funded by National ScienceFoundation grants DEB 9312067 and DEB-9815780 to CBF.
LITERATURE CITED
Anderson, W. W. 1968. Further evidence for coadaptation in crossesbetween geographic populations of Drosophila pseudoobscura.Genet. Res. Camb. 12:317–330.
Armbruster, P., W. E. Bradshaw, and C. M. Holzapel. 1997. Evo-lution of the genetic architecture underlying fitness in the pitch-er-plant mosquito, Wyoemyia smithii. Evolution 51:451–458.
Arnold, M. L. 1997. Natural hybridization and evolution. OxfordUniv. Press, Oxford, U.K.
Barton, N. H. 1986. The maintenance of polygenic variation througha balance between mutation and stabilizing selection. Genet.Res. Camb. 47:209–216.
———. 1989. The divergence of a polygenic system under stabi-lizing selection, mutation and drift. Genet. Res. Camb. 54:59–77.
———. 1996. Natural selection and random genetic drift as causesof evolution on islands. Phil. Trans. R. Soc. Lond. B Biol. Sci.351:785–795.
Blows, M. W. 1993. The genetics of central and marginal popu-lations of Drosophila serrata. II. Hybrid breakdown in fitnesscomponents as a correlated response to selection for desiccationresistance. Evolution 47:1271–1285.
Blows, M. W., and M. B. Sokolowski. 1995. The expression ofadditive and nonadditive genetic variation under stress. Genetics140:1149–1159.
Brncic, D. 1954. Heterosis and the integration of the genotype ingeographic populations of Drosophila pseudoobscura. Genetics39:77–88.
Burch, C. L., and L. Chao. 1999. Evolution by small steps andrugged landscapes in the RNA virus f6. Genetics 151:921–927.
Burke, J. M., T. J. Voss, and M. L. Arnold. 1998. Genetic inter-actions and natural selection in Louisiana Iris hybrids. Evolution52:1304–1310.
Burton, R. S. 1987. Differentiation and integration of the genomein populations of the marine copepod Tigriopus californicus.Evolution 41:504–513.
———. 1990. Hybrid breakdown in developmental time in the co-pepod Tigriopus californicus. Evolution 44:1814–1822.
Carson, H. L., and A. R. Templeton. 1984. Genetic revolutions inrelation to speciation phenomena: yhe founding of new popu-lations. Annu. Rev. Ecol. Syst. 15:97–131.
Cavner, D. R., and M. L. Clegg. 1981. Multigenic response toethanol in Drosophila melanogaster. Evolution 35:1–10.
Charlesworth, D., and B. Charlesworth. 1987. Inbreeding depres-sion and its evolutionary consequences. Annu. Rev. Ecol. Syst.18:237–268.

1171GENETIC ARCHITECTURE
Clegg, M. T., A. L. Kahler, and R. W. Allard. 1978. Estimation oflife cycle components of selection in an experimental plant pop-ulation. Genetics 89:765–792.
Cockerham, C. C. 1980. Random and fixed effects in plant genetics.Theor. Appl. Genet. 56:119–131.
Cohan, F. M. 1984. Can uniform selection retard random geneticdivergence between isolated conspecific populations? Evolution38:495–504.
Cohan, F. M., and A. A. Hoffmann. 1989. Uniform selection as adiversifying force in evolution: evidence from Drosophila. Am.Nat. 134:613–637.
Cohan, F. M., A. A. Hoffman, and T. W. Gayley. 1989. A test ofthe role of epistasis in divergence under uniform selection. Evo-lution 43:766–774.
Coyne, J. A., N. H. Barton, and M. Turelli. 1997. Perspective: acritique of Sewall Wright’s shifting balance theory of evolution.Evolution 51:643–671.
Crow, J. F. 1992. Mutation, mean fitness, and genetic load. Oxf.Surv. Evol. Biol. 9:3–42.
Deng, H.-W., and M. Lynch. 1996. Change of genetic architecturein response to sex. Genetics 143:203–212.
Dobzhansky, T. 1937. Genetics and the origin of species. ColumbiaUniv. Press, New York.
Doebley, J., A. Stec, and C. Gustus. 1995. teosinte branched1 andthe origin of maize: evidence for epistasis and the evolution ofdominance. Genetics 141:333–346.
Dudash, M. R. 1990. Relative fitness of selfed and outcrossed prog-eny in a self-compatible, protandrous species, Sabatia angularisl. (Gentianaceae): a comparison in three environments. Evolu-tion 44:1129–1139.
Dudash, M. R., and D. E. Carr. 1998. Genetics underlying inbreed-ing depression in Mimulus with contrasting mating systems. Na-ture 393:682–684.
Dudash, M. R., and C. B. Fenster. 2000. Inbreeding and outbreedingdepression in fragmented populations. Pp. 35–53in A. Youngand G. Clarke, eds. Genetics, demography and viability of frag-mented populations. Cambridge Univ. Press, Cambridge, U.K.
Dudash, M. R., D. E. Carr, and C. B. Fenster. 1997. Five generationsof enforced selfing and outcrossing in Mimulus guttatus: in-breeding depression variation at the population and family level.Evolution 51:52–65.
Elena, S. F. and R. E. Lenski. 1997. Test of synergistic interactionsamong deleterious mutations in bacteria. Nature 390:395–398.
Endler, J. A. 1986. Natural selection in the wild. Princeton Univ.Press, Princeton, NJ.
Enfield, F. D. 1977. Selection experiments in Tribolium designedto look at gene action issues. Pp. 177–190 in E. Pollak, O.Kempthorne, and T. B. Bailey, eds. Proc. Int. Conf. Quantitativegenetics. Iowa State Univ., Ames IA.
Falconer, D. S., and T. F. C. Mackay. 1996. Introduction to quan-titative genetics. Longman, London.
Fenster, C. B. 1988. Gene flow and population differentiation inChamaecrista fasciculata (Leguminosae). Ph.D. diss., Universityof Chicago, Chicago, IL.
———. 1991a. Gene flow in Chamaecrista fasciculata (Legumi-nosae). I. Gene dispersal. Evolution 45:398–409.
———. 1991b. Gene flow in Chamaecrista fasciculata (Legumi-nosae). II. Gene establishment. Evolution 45:410–422.
———. 1995. Mirror image flowers and mating system in Cha-maecrista fasciculata (Leguminosae). Am. J. Bot. 82:46–50.
———. 1997. Ecotypic differentiation for flood tolerance and itsmorphological correlates in Chamaecrista fasciculata. Aquat.Bot. 56:215–231.
Fenster, C. B., and S. C. H. Barrett. 1994. Inheritance of mating-system modifier genes in Eichhornia paniculata (Pontederi-aceae). Heredity 72:433–445.
Fenster, C. B., and M. R. Dudash. 1994. Genetic considerations forplant population restoration and conservation. Pp. 34–62 in M.L. Bowles and C. J. Whelan, eds. Restoration of endangeredspecies. Cambridge Univ. Press., Cambridge, U.K.
Fenster, C. B., and L. F. Galloway. 2000a. Inbreeding and out-breeding depression in natural populations of Chamaecrista fas-
ciculata (Fabaceae): consequences for conservation biology. J.Conserv. Biol. In Press.
———. 2000b. The contribution of epistasis to the evolution ofnatural populations: a case study of an annual plant. Pp. 232–244 in J. B. Wolf, E. D. Brodie III, and M. J. Wade, eds. Epistasisand the evolutionary process. Oxford Univ. Press, Oxford, NewYork.
Fenster, C. B., L. F. Galloway, and L. Chao. 1997. Epistasis andits consequences for the evolution of natural populations. Trendsin Ecology and Evolution 12:282–286.
Fisher, R. A. 1930. The genetical theory of natural selection. OxfordUniv. Press, Oxford, U.K.
Frankham, R. 1995. Conservation genetics. Annu. Rev. Genetics29:305–327.
Futuyma, D. J. 1997. Evolutionary biology. Sinauer, Sunderland,MA.
Galloway, L. F., and C. B. Fenster. 1999. The role of nuclear andcytoplasmic factors in the adaptive evolution of populations ofChamaecrista fasciculata (Fabaceae). Evolution 53:1724–1743.
———. 2000. Population differentiation in an annual legume: localadaptation. Evolution 54:1173–1181.
Gavrilets, S., and A. Hastings. 1996. Founder effect speciation: atheoretical reassessment. The American Naturalist 147:466–491.
Gimelfarb, S. A. 1989. Genotypic variation for a quantitative char-acter maintained under stabilizing selection without mutations:epistasis. Genetics 123:217–227.
Goldstein, D. B., and K. E. Holsinger. 1992. Maintenance of poly-genic variation in spatially structured populations: roles for localmating and genetic redundancy. Evolution 46:412–429.
Goodnight, C. J. 1995. Epistasis and the increase in additive geneticvariance: implications for phase I of Wright’s shifting balanceprocess. Evolution 49:501–511.
Grant, V. 1981. Plant speciation. Columbia Univ. Press, New York.Hamrick, J. L., and M. J. W. Godt. 1989. Allozyme diversity in
plant species. Pp. 43–63 in A. H. D. Brown, M. T. Clegg, A. L.Kahler, and A. H. J. Wier, eds. Plant population genetics, breed-ing and genetic resources. Sinauer, Sunderland, MA.
Hard, J. J., W. E. Bradshaw, and C. M. Holzapfel. 1992. Epistasisand the genetic divergence of photoperiodism between popu-lations of the pitcher-plant mosquito Wyeomyia smithii. Genetics131:389–396.
———. 1993. The genetic basis of photoperiodism and its evolu-tionary divergence among populations of the pitcher-plant mos-quito, Wyeomyia smithii. Am. Nat. 142:457–473.
Hastings, A., and S. Harrison. 1994. Metapopulation dynamics andgenetics. Annu. Rev. Ecol. Syst. 25:167–188.
Hatfield, T. 1997. Genetic divergence in adaptive characters betweensympatric species of stickleback. Am. Nat. 149:1009–1029.
Hill, W. G. 1982. Dominance and epistasis as components of het-erosis. Z. Teirzuchtg. Zuchtgsbiol. 99:161–168.
Howard, D. J. 1994. Small populations, inbreeding and speciation.Pp. 118–142 in N. W. Thornhill, ed. The natural history of in-breeding and outbreeding depression. Univ, of Chicago Press,Chicago, IL.
Irwin, H. S., and R. C. Barneby. 1982. The American Cassiinea: Asynoptical revision of Leguminosae tribe Cassieae subtribe Cas-siinae in the New World. Memoirs of the New York BotanicalGarden 35, pts. 1 and 2.
King, J. C. 1955. Evidence for the integration of the gene pool fromstudies of DDT resistance in Drosophila. Cold Spring HarborSym. Quant. Biol. 20:311–317.
Kitagawa, O. 1967. Genetic divergence in M. Vetukhiv’s experi-mental populations of Drosophila psudoobscura. 4. Relative vi-ability. Genet. Res. 10:303–312.
Korona, R., C. H. Nakatsu, L. J. Forney, and R. E. Lenski. 1994.Evidence for multiple adaptive peaks from populations of bac-teria evolving in a structured habitat. Proc. Natl. Acad. Sci. USA91:9037–9041.
Lair, K. G., K. Chase, F. Adler, L. M. Mansur, and J. H. Orf. 1995.Interactions between quantitative trait loci in soybean in whichtrait variation at one locus is conditional upon a specific alleleat another. Proc. Nat. Acad. Sci. USA 92:4656–4660.
Lair, K. P., W. E. Bradshaw, and C. M. Holzapfel. 1997. Evolu-

1172 C. B. FENSTER AND L. F. GALLOWAY
tionary divergence of the genetic architecture underlying pho-toperiodism in the pitcher-plant mosquito, Wyeomyia smithii. Ge-netics 147:1873–1883.
Lenski R. E. 1988. Experimental studies of pleiotropy and epistasisin Escherichia coli. II. Compensation for maladaptive effectsassociated with resistance to T4. Evolution 42:433–440.
Levin, D. A. 1977. The organization of genetic diversity in Phloxdrummondii. Evolution 31:477–494.
———. 1981. Dispersal versus gene flow in plants. Ann. Mo. Bot.Gard. 68:233–253.
———. 1984. Inbreeding depression and proximity-dependentcrossing success in Phlox drummondii. Evolution 38:116–127.
Lewontin, R. C. 1974. Genetic basis of evolutionary change. Co-lumbia Univ. Press, New York.
Li, Z., S. R. M. Pinson, W. D. Park, A. H. Paterson, and J. W.Stansel. 1997. Epistasis for three grain yield components in rice(Oryza sativa L). Genetics 145:453–456.
Lynch, M. 1991. The genetic interpretation of inbreeding depressionand outbreeding depression. Evolution 45:622–629.
Lynch, M., and B. Walsh. 1997. Genetics and analysis of quanti-tative traits. Sinauer, Sunderland, MA.
Malecot, G. 1969. The mathematics of heredity. Freeman, NewYork.
Malmberg, R. L. 1977. The evolution of epistasis and the advantageof recombination in populations of bacterophage T4. Genetics86:607–621.
Mani, G. S., and B. C. Clarke. 1990. Mutational order: a majorstochastic process in evolution. Proc. R. Soc. Lond. B Biol. Sci.240:29–37.
Maynard Smith, J. 1989. Evolutionary genetics. Oxford Univ. Press,Oxford, U.K.
Mayr, E. 1954. Change of genetic environment and evolution. Pp.157–180 in J. Huxley, A. C. Hardy, and E. B. Ford, eds. Evo-lution as a process. Allen and Unwin, London.
Moll, R. H., J. H. Longquist, J. V. Fortuno, and E. C. Johnson.1965. The relationship of heterosis and genetic divergence inmaize. Genetics 52:139–144.
Mourad, A. F. 1965. Genetic divergence in M. Vetukhiv’s exper-imental populations of Drosophila pseudoobscura. Genet. Res.6:139–146.
Ohta, A. T. 1980. Coadaptive gene complexes in incipient speciesof Hawaiian Drosophila. Am. Nat. 115:121–131.
Orr, H. A. 1995. The population genetics of speciation: the evo-lution of hybrid compatibilities. Genetics 139:1805–1813.
Palapoli, M. F., and C. I. Wu. 1994. Genetics of hybrid male sterilitybetween Drosophila sibling species: a complex web of epistasisis revealed in interspecific studies. Genetics 138:329–341.
Parker, M. A. 1992. Outbreeding depression in a selfing annual.Evolution 46:837–840.
Pray, L. A., J. M. Schwartz, C. J. Goodnight, and L. Stevens. 1994.Environmental dependency of inbreeding depression: implica-tions for conservation biology. Conserv. Biol. 8:562–568.
Price, M. V., and N. M. Waser. 1979. Pollen dispersal and optimaloutcrossing in Delphinium nelsonii. Nature 277:294–297.
Rieseberg, L. H. 1997. Hybrid origins of plant species. Annu. Rev.Ecol. Syst. 28:359–389.
Rieseberg, L. H., B. Sinervo, C. R. Linder, M. C. Ungerer and D.M. Arias. 1995. Role of gene interactions in hybrid speciation:evidence from ancient and experimental hybrids. Science 272:741–745.
Rice, W. R. 1989. Analyzing tables of statistical tests. Evolution43:223–225.
Routman, E. J., and J. M. Cheverud. 1997. Gene effects on a quan-titative trait: two-locus epistatic effects measured at microsat-ellite markers and at estimated QTL. Evolution 51:1654–1662.
SAS Institute. 1990. SAS/STAT user’s guide. Vers. 6, 4th ed. SASInstitute, Inc., Cary, NC.
Slatkin, M. 1987. Gene flow and the geographic structure of naturalpopulations. Science 236:787–792.
Stebbins, G. L. 1950. Variation and evolution in plants. ColumbiaUniv. Press, NY.
Stuber, C. W., S. E. Lincoln, D. W. Wolff, T. L. Helentjaris, andE. S. Lander. 1992. Identification of genetic factors contributingto heterosis in a hybrid from two elite maize inbred lines usingmolecular markers. Genetics 132:823–839.
Templeton, A. R., C. F. Sing, and B. Brokaw. 1976. The unit ofselection in Drosophila mercatorum. I. The interaction of selec-tion and meiosis in parthenogenetic strains. Genetics 82:349–376.
Travisano, M., J. A. Mongold, A. F. Bennett, and R. E. Lenski.1995. Experimental tests of the roles of adaptation, chance, andhistory in evolution. Science 267:87–90.
Turner, J. R. 1967. Why does the genome not congeal? Evolution21:645–656.
van Truen, R., R. Bijlsma, N. J. Ouborg, and W. van Delden. 1994.The significance of genetic erosion in the process of extinction.IV. Inbreeding depression and heterosis effects caused by selfingand outcrossing in Scabiosa columbaria. Evolution 47:1660–1680.
Wade, M. J. 1992. Sewall Wright: gene interaction and the shiftingbalance theory. Oxf. Surv. Evol. Biol. 8:35–62.
Wade, M. J., and C. J. Goodnight. 1998. Perspective: the theoriesof Fisher and Wright in the context of metapopulations: whennature does many small experiments. Evolution 52:1537–1553.
Wagner, A., G. P. Wagner, and P. Similion. 1994. Epistasis canfacilitate the evolution of reproductive isolation by peak shifts;a two locus two-allelic model. Genetics 138:533–545.
Wallace, B. 1953. On coadaptation in Drosophila. Am. Nat. 87:343–358.
———. 1955. Interpopulation hybrids in Drosophilia melanogaster.Evolution 9:302–316.
Wallace, B., and M. Vetukhiv. 1955. Adaptive organization of thegene pools of Drosophila populations. Cold Spring HarborSymp. Quant. Biol. 20:303–309.
Waser, N. M. 1993. Population structure, optimal outbreeding andassortative mating in angiosperms. Pp. 173–199 in N. W. Thorn-hill, ed. The natural history of inbreeding and outbreeding: the-oretical and empirical perspectives. Univ. of Chicago Press, Chi-cago, IL.
Waser, N. M., and M. V. Price. 1989. Optimal outcrossing in Ipom-opsis aggregata: Seed set and offspring fitness. Evolution 43:1097–1109.
———. 1994. Crossing distance effects in Delphinium nelsonii: out-breeding and inbreeding depression in progeny fitness. Evolution48:842–852.
Whitlock, M. C. 1995. Variance induced peak shifts. Evolution 49:252–265.
———. 1997. Founder effects and peak shifts without genetic drift:adaptive peak shifts occur easily when environments fluctuateslightly. Evolution 51:1044–1048.
Whitlock, M. C. P. C. Phillips, F. G.-G. Moore, and S. J. Tonsor.1995. Multiple fitness peaks and epistasis. Annu. Rev. Ecol. Syst.26:601–629.
Wilkens, H. 1971. Genetic interpretation of regressive evolutionaryprocesses. Evolution 25:530–540.
Wright, S. 1931. Evolution in mendelian populations. Genetics 16:97–159.
———. 1932. The roles of mutation, inbreeding, crossbreeding andselection in evolution. Proc. 6th Int. Cong. Genet. 1:356–366.
———. 1935. Evolution in populations. I. Approximate equilibri-um. J. Genet. 30:257–266.
Wright, S., T. Dobzhansky, and W. Hovanitz. 1942. Genetics ofnatural populations. VII. The allelism of lethals in the thirdchromosome of Drosophila pseudoobscura. Genetics 27:363–394.
Yokoyama, S. 1979. The rate of allelism of lethal genes in a geo-graphically structured population. Genetics 93:245–262.
Corresponding Editor: J. Conner