Adoption and impacts of zero tillage as a resource conserving ...
59
Adoption and Impacts of Zero Tillage as a Resource Conserving Technology in the Irrigated Plains of South Asia Olaf Erenstein, Umar Farooq, R.K. Malik and Muhammad Sharif Research Report 19
-
Upload
khangminh22 -
Category
Documents
-
view
1 -
download
0
Transcript of Adoption and impacts of zero tillage as a resource conserving ...
ISSN 1391-9407ISBN 978-92-9090-678-0
Postal Address: IWMI, P O Box 2075, Colombo, Sri Lanka Location: 127 Sunil Mawatha, Pelawatte, Battaramulla, Sri LankaTelephone: +94-11 2880000 Fax: +94-11 2786854
Email: [email protected] Website: www.iwmi.org/assessment
Adoption and Impacts of Zero Tillage as a Resource Conserving Technology in the Irrigated Plains of South Asia
Olaf Erenstein, Umar Farooq, R.K. Malik and Muhammad Sharif
Research Report 19
The Comprehensive Assessment of Water Management in Agriculture takesstock of the costs, benefits and impacts of the past 50 years of water developmentfor agriculture, the water management challenges communities are facing today,and solutions people have developed. The results of the Assessment will enablefarming communities, governments and donors to make better-quality investmentand management decisions to meet food and environmental security objectives inthe near future and over the next 25 years.
The Research Report Series captures results of collaborative research conductedunder the Assessment. It also includes reports contributed by individual scientistsand organizations that significantly advance knowledge on key Assessmentquestions. Each report undergoes a rigorous peer-review process. The researchpresented in the series feeds into the Assessment’s primary output—a “State ofthe World” report and set of options backed by hundreds of leading water anddevelopment professionals and water users.
Reports in this series may be copied freely and cited with dueacknowledgement. Electronic copies of reports can be downloaded from theAssessment website (www.iwmi.org/assessment).
If you are interested in submitting a report for inclusion in the series, pleasesee the submission guidelines available on the Assessment website or send awritten request to: Sepali Goonaratne, P.O. Box 2075, Colombo, Sri Lanka.
i
Comprehensive Assessment of Water Management inAgriculture Research Report 19
Adoption and Impacts of Zero Tillage as aResource Conserving Technology in theIrrigated Plains of South Asia
Olaf ErensteinUmar FarooqR.K. MalikandMuhammad Sharif
International Water Management InstituteP O Box 2075, Colombo, Sri Lanka
The authors: Olaf Erenstein is Agricultural Economist, International Maize and WheatImprovement Center (CIMMYT), NASC Complex, Pusa, New Delhi 110012, India. e-mail:[email protected]. Umar Farooq is Chief Scientific Officer, Social Sciences Division,Pakistan Agricultural Research Council, Islamabad, Pakistan. R. K. Malik is DirectorExtension Education, Chaudhary Charan Singh Haryana Agricultural University (CCS HAU),Hisar, India. Muhammad Sharif is Chief Scientific Officer/Director, Social Sciences Institute,National Agricultural Research Center, Islamabad, Pakistan.
The study was funded through the Comprehensive Assessment of Water Management inAgriculture. The views expressed in this report are those of individual scientists and donot necessarily reflect the views of the donor or the authors’ institutions. This reportsynthesizes the findings of two detailed country studies (Erenstein et al. 2007a; Farooq etal. 2007). The present study benefited from the assistance of numerous individuals andinstitutions that have been acknowledged in the corresponding country reports to theextent possible. This report benefited from the comments of external reviewers.
Erenstein, O.; Farooq, U.; Malik, R. K.; Sharif, M. 2007. Adoption and impacts of zerotillage as a resource conserving technology in the irrigated plains of South Asia. Colombo,Sri Lanka: International Water Management Institue. 55p. (Comprehensive Assessmentof Water Management in Agriculture Research Report 19)
/ zero tillage / rice / wheat / water conservation / India / Pakistan /
ISSN 1391-9407ISBN 978-92-9090-678-0
Copyright © 2007, by International Water Management Institute. All rights reserved.
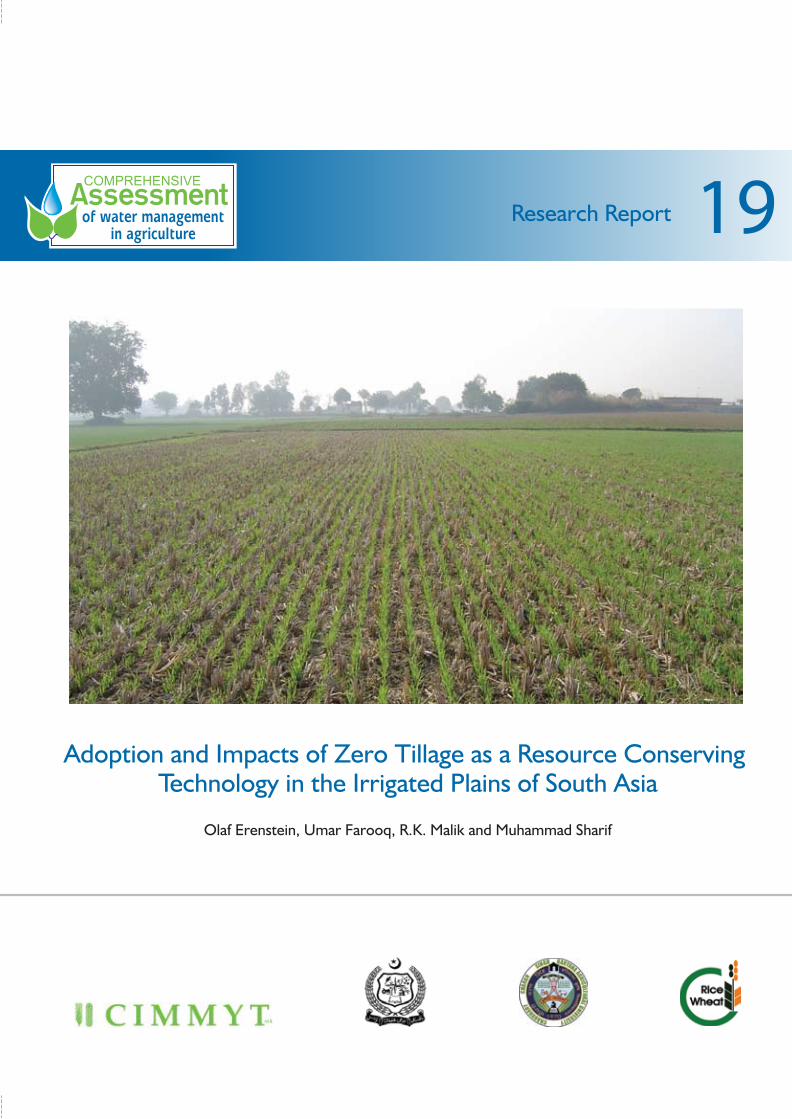
Cover photograph: Zero-tillage wheat field in the rice-wheat belt of Haryana, India (photocredit: CIMMYT/RWC).
Please send inquiries and comments to: [email protected]
The Comprehensive Assessment is organized through the CGIAR’s System-WideInitiative on Water Management (SWIM), which is convened by the International WaterManagement Institute. The Assessment is carried out with inputs from over 90 nationaland international development and research organizations – including CGIAR Centersand FAO. Financial support for the Assessment comes from a range of donors, includingthe Governments of the Netherlands, Switzerland, Japan, Taiwan and Austria; OPECFund; FAO; and the Rockefeller Foundation.
iii
iii
Contents
Acronyms .............................................................................................. iv
Abstract .................................................................................................. v
Introduction ........................................................................................... 1
Study Area and Research Methodology .............................................. 4
Diffusion of Zero Tillage ........................................................................ 9
Understanding Adoption of Zero Tillage ............................................ 18
Technical Impacts of ZT Technology .................................................. 25
Financial Impacts of ZT Technology .................................................. 33
Farm and Regional Impacts of ZT ..................................................... 37
Conclusions and Recommendations .................................................. 42
Literature Cited.................................................................................... 45
Acronyms
CT conventional tillage
IGP Indo-Gangetic Plains
mt metric ton/s (1,000 kg)
na not applicable
ns not significant
OFWM On-Farm Water Management, Lahore
RCT resource conserving technology
RWC Rice-Wheat Consortium for the Indo-Gangetic Plains (www.rwc.cgiar.org)
s.d. standard deviation
WP water productivity
ZT zero tillage
ZTD zero tillage drill
v
The recent stagnation of productivity growth in theirrigated areas of the Indo-Gangetic Plains ofSouth Asia has led to a quest for resource-conserving technologies that can save water,reduce production costs and improve production.The present synthesis of two detailed countrystudies confirmed widespread adoption of zerotillage (ZT) wheat in the rice-wheat systems ofIndia’s Haryana State (34.5% of surveyedhouseholds) and Pakistan’s Punjab province(19%). The combination of a significant “yieldeffect” and “cost-saving effect” makes adoptionworthwhile and is the main driver behind the rapidspread and widespread acceptance of ZT inHaryana, India. In Punjab, Pakistan, adoption isdriven by the significant ZT-induced cost savingsfor wheat cultivation. Thus, the prime driver for ZTadoption is not water savings or natural resourceconservation but monetary gain in both sites.Water savings are only a potential added benefit.
ZT adoption for wheat has accelerated frominsignificant levels from 2000 onwards in bothsites. Geographic penetration of ZT is far fromuniform, suggesting the potential for furtherdiffusion, particularly in Haryana, India.Diffusion seems to have stagnated in thePunjab study area, and further follow-up studiesare needed to confirm this. The study alsorevealed significant dis-adoption of ZT in thesurvey year: Punjab, Pakistan 14 percent andHaryana, India 10 percent. Better understandingthe rationale for dis-adoption merits furtherscrutiny. Our findings suggest that there is noclear single overarching constraint but that acombination of factors is at play, includingtechnology performance, technology access,seasonal constraints and, particularly in thecase of Punjab, Pakistan, the institutional ZT
controversy. In terms of technologyperformance, the relative ZT yield wasparticularly influential: dis-adopters of ZTreporting low ZT yields as a major contributor tofarmer disillusionment in Punjab, Pakistan andthe lack of a significant yield effect in Haryana,India. In neither site did the ZT-induced timesavings in land preparation translate intotimelier establishment, contributing to thegeneral lack of a yield increase. Knowledgeblockages, resource constraints and ZT drillcost and availability all contributed to non-adoption. This suggests that there is potentialto further enhance access to this technologyand thereby its penetration.
The study highlights that in both Haryana,India and Punjab, Pakistan ZT has been primarilyadopted by the larger and more productivefarmers. The structural differences between theadopters and non-adopters/dis-adopters in termsof resource base, crop management andperformance thereby easily confound theassessment of ZT impact across adoptioncategories. This calls for the comparison of theZT plots and conventional tillage plots on adopterfarms.
ZT-induced effects primarily apply to theestablishment and production costs of the wheatcrop. Both the Haryana, India and Punjab,Pakistan studies confirmed significant ZT-inducedresource-saving effects in farmers’ fields in termsof diesel and tractor time for wheat cultivation.Water savings are, however, less pronouncedthan expected from on-farm trial data. It was onlyin Haryana, India that there were significant ZT-induced water savings in addition to significantyield enhancement. The higher yield and watersavings in Haryana, India result in significantly
Abstract

vi
higher water productivity indicators for ZT wheat.In both sites, there are limited implications for theoverall wheat crop management, the subsequentrice crop and the rice-wheat system as a whole.The ZT-induced yield enhancement and costsavings provide a much needed boost to the
returns to, and competitiveness of, wheatcultivation in Haryana, India. In Punjab, Pakistan,ZT is primarily a cost-saving technology. Basedon these findings the study provides a number ofrecommendations for research and developmentin South Asia’s rice-wheat systems.
1
Adoption and Impacts of Zero Tillage as a ResourceConserving Technology in the Irrigated Plains ofSouth Asia
Olaf Erenstein, Umar Farooq, R.K. Malik and Muhammad Sharif
Introduction1
In South Asia, rice-wheat cropping systems cover13.5 million hectares (mha) and provide incomesand food to many millions of people (Gupta et al.2003; Timsina and Connor 2001). The rice-wheatsystem is primarily irrigated, with 85 percentconcentrated in the Indo-Gangetic Plains (IGP)(Timsina and Connor 2001). In the face ofincreasing competition for water from industrial,domestic and environmental sectors, concernsare being raised about the productivity of waterused in agriculture (Kijne et al. 2003). Increasingwater scarcity is also seen as a major contributorto stagnating productivity in the rice-wheatcropping systems of the IGP (Byerlee et al. 2003;Kumar et al. 2002). Due to the absence ofefficient water-pricing mechanisms, the scarcityvalue of water is not reflected in water prices(Pingali and Shah 2001). In the face of unreliablecanal water supplies, many farmers haveincreased their reliance on private tube wells,placing tremendous pressure on groundwatersupplies (Abrol 1999; Ahmad et al. 2007; Qureshiet al. 2003). Negative environmental effectsrelated to irrigation are increasing asoverexploitation of groundwater and poor watermanagement lead to the dropping of water tablesin some areas and increased waterlogging andsalinity in others (Harrington et al. 1993; Pingaliand Shah 2001; Qureshi et al. 2003). In addition,tube-well irrigation has raised production costs in
view of the energy expenses incurred (electricityor diesel) (Qureshi et al. 2003). Agriculturaltechnologies that can save water, reduceproduction costs and improve production aretherefore becoming increasingly important (Guptaet al. 2002; Hobbs and Gupta 2003b).
The Rice-Wheat Consortium (RWC) for theIGP (www.rwc.cgiar.org), which is made up ofinternational agricultural research centers, nationalagricultural research organizations fromBangladesh, India, Nepal and Pakistan, andadvanced research institutes has developed andpromoted a number of technologies that increasefarm-level productivity, conserve natural resourcesand limit negative environmental impacts (Guptaand Sayre 2007; Gupta and Seth 2007; Hobbsand Gupta 2003a). These resource-conservingtechnologies (RCTs) form the basis forconservation agriculture. “Conservationagriculture” is the term used for a diverse array ofcrop management practices that involve minimaldisturbance of the soil, retention of residue mulchon the soil surface and use of crop rotations(FAO 2007; Harrington and Erenstein 2005; Hobbs2007).
Since the mid-1980s, researchers, farmers,extension specialists, machinery importers andlocal machinery manufacturers have been workingto adapt RCTs to South Asia’s rice-wheatcropping systems (Ekboir 2002; Seth et al. 2003).
1 This section draws from Morris 2003.
2
The RCTs have been actively promoted in theIGP for about 10 years and recent evidencesuggests that these efforts are beginning to bearfruit. Data collected from benchmark and farmerfields show that RCTs provide a wide array ofbenefits, including higher yields, lower productioncosts, improved water and fertilizer useefficiency, better control of pests and diseasesand reduced greenhouse gas emissions (seeAnwar et al. 2002; Hobbs and Gupta 2003a; Khanet al. 2002; Malik et al. 2002a, 2005a).
To date, the RCT that has been mostsuccessful in the IGP is zero-tillage (ZT)planting of wheat after rice (Laxmi et al. 2007).ZT in rice-wheat systems ranges from surfaceseeding to planting with seed drills drawn byfour-wheel tractors (Hobbs et al. 1997). Insurface seeding, wheat seeds are broadcast ona saturated soil surface before or after riceharvest (Tripathi et al. 2006). It is a simpletechnology for resource-poor farmers requiring noland preparation and no machinery, but its use isstill largely confined to low-lying fields thatremain too moist for tractors to enter, particularlyin the eastern IGP. Mechanized ZT has provenmore popular in the IGP, but implies the need fora tractor-drawn ZT seed drill. This specializedseeding implement allows wheat seed to beplanted directly into unplowed fields with a singlepass of the tractor, often with simultaneousbasal fertilizer application (Mehla et al. 2000). Incontrast, conventional tillage (CT) practices forwheat involve multiple passes of the tractor toaccomplish plowing, harrowing, planking andseeding operations. The use of ZT significantlyreduces energy costs, mainly by reducing tractorcosts associated with CT methods, and alsobecause water savings reduce the time that tubewells must be operated. The use of ZT alsoallows the wheat crop to be planted sooner thanwould be possible using CT methods, whichsignificantly reduces turnaround time. This is animportant consideration in many parts of therice-wheat belt, where late planting of wheat is amajor cause of reduced yields: terminal heatimplies that wheat yield potential reduces by1-1.5 percent per day if planting occurs after
20th November (Ortiz-Monasterio et al. 1994;Hobbs and Gupta 2003a).
Of particular interest here is the impact ofZT on water use efficiency. Experimentalevidence has shown that ZT reduces irrigationrequirements in wheat compared to CT (Gupta etal. 2002; Hobbs and Gupta 2003b). ZT usesresidual soil water more effectively. With ZTirrigation, water spreads faster across thesurface, whereby irrigation can be stopped oncethe field is covered. ZT potentially improves thesoil structure and facilitates the buildup of cropresidue, which have been linked to increasedwater retention, better infiltration and reducedoverall water use. In addition, the fasterturnaround time made possible by ZT allows thewheat crop to be planted and harvested earlier,potentially reducing the need for one or morelate-season irrigations in some areas. At thetime this study was initiated, these benefits hadyet to be conclusively documented in farmers’self-adopted fields, although now some suchstudies are available (Ahmad et al. 2007;Chandra et al. 2007; Jehangir et al. 2007; Maliket al. 2005b).
A prerequisite for any ex-post adoption andimpact study is that the technology of interestmust have moved beyond the research stationand into farmers’ fields. While a number ofresource-conserving technologies were beingdeveloped and tested in the northwest IGP at thetime of initiating this study (PARC-RWC 2003;RWC 2002), most had yet to be widely promoted,and uptake by farmers was minimal, althoughmore recently technologies like laser leveling andbed planting have also shown promise (Connor etal. 2003; Jat et al. 2006). For this reason, thecurrent study focuses on ZT wheat, which isknown to have spread into farmers’ fields.
The extent to which ZT has diffused acrossthe IGP is also not known exactly. Fieldobservations and knowledgeable experts estimatethat the area under ZT is significant and is rapidlyincreasing, particularly in India (Laxmi et al.2007). Area estimates are often based on thesales of ZT drills and average area coverage perdrill (e.g., Malik et al. 2005b, 6-7). There was
3
thus a need to verify the extent of adoption andits impact through structured empirical surveys.Without such data, the technical and economicbenefits actually realized by farmers also remainunknown, since scaling up from plot-levelexperimental data to arrive at aggregatemeasures of impact is problematic and misseseventual adaptations of farmers in terms of fine-tuning and modifying the technology to theircircumstances.
To promote faster and extensive adoption ofRCTs in general and ZT in particular, a betterunderstanding is needed not only of their impactsat various levels of aggregation (field, farm andregion), but also of the factors that influence theadoption and diffusion. Research has indicatedthe potential technological benefits, butexperience suggests that successful adoptiondepends on a favorable confluence of technical,economic, institutional and policy factors(CIMMYT 1993; Feder et al. 1985). It is only byunderstanding these factors that researchers,extension specialists, machinery manufacturersand policymakers will be able to modify thetechnology, delivery mechanisms and policyenvironment to stimulate successful adoption anddiffusion.
The overall objective of the present study isto enhance our understanding of the adoption andimpacts of ZT as a resource-conservingtechnology in farmers’ rice-wheat fields in the
IGP. The specific objectives of the present studyare to:
1. Document the diffusion of ZT in the rice-wheat belt of the western irrigated IGP,particularly in Haryana, India and Punjab,Pakistan.2
2. Identify technical, economic, institutional andpolicy factors that affect ZT adoption anddiffusion in the study area.
3. Evaluate impacts of ZT adoption onproductivity and profitability of rice-wheatsystems in the study area, including impactsstemming from water use savings.
4. Identify research and extension needs, policyinterventions and institutional changes neededto accelerate adoption and diffusion of ZT.
This report synthesizes the findings of thetwo detailed country studies (Erenstein et al.2007a; Farooq et al. 2007) and is organized intoeight chapters. In the second chapter we reviewthe methodology. In the third we document thediffusion of the technology. In the fourth weanalyze the factors affecting ZT adoption. In thefifth we analyze and evaluate the technical plot-level impact of the technology and in the sixththe financial plot-level impacts. In the seventhchapter we analyze the farm and regionalimpacts. In the eighth and final chapter we givethe conclusions and recommendations.
2In this report, Haryana means Haryana State, India; Punjab means Punjab Province, Pakistan.
4
Study Area and Research Methodology
Study Area
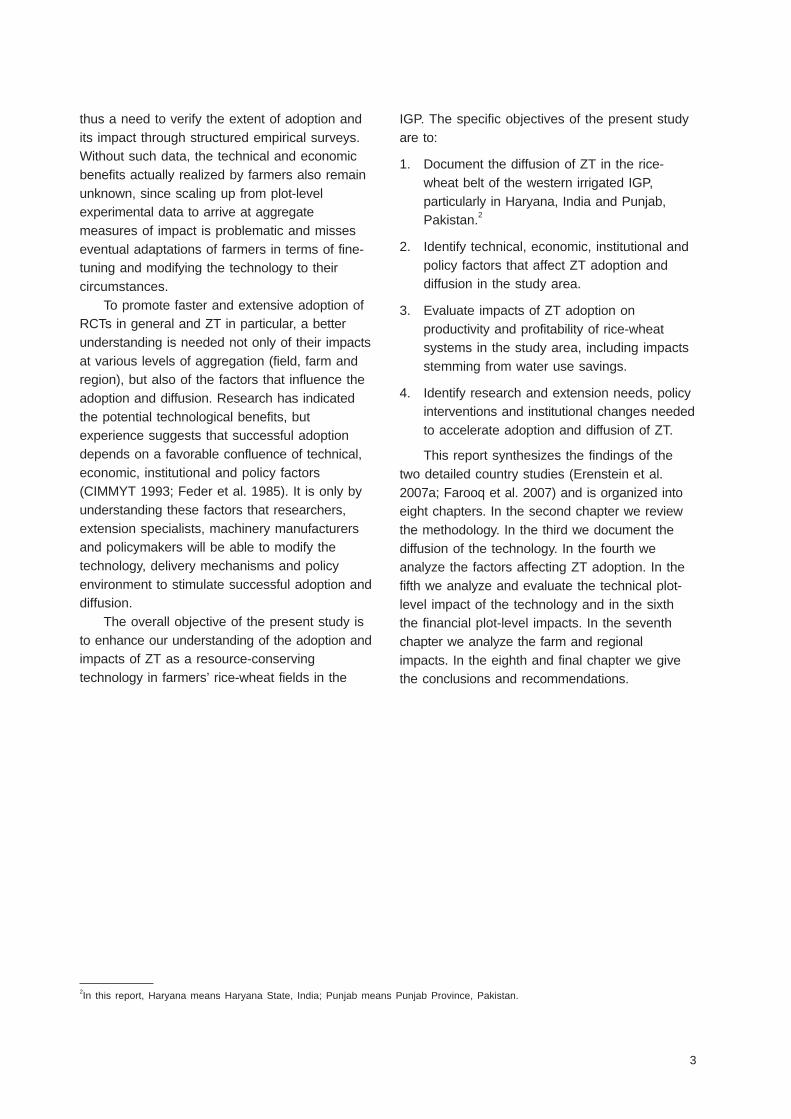
The study focuses on two irrigated rice-wheatareas in the northwest IGP (figure 1). The first isthe rice-wheat zone in Haryana, located in thenorthwest of India and falling in the Trans-Gangetic Plains. The second is the rice-wheatzone in Punjab, located in the northeast ofPakistan close to the Indian border and fallingwithin the Indus Plains. In the Haryana studyarea the average annual precipitation ranges from300 mm yr-1 (Sirsa district) to 1,100 mm yr-1
(Yamunanagar district) (Central Ground WaterBoard 2007). In the Punjab study area theaverage annual precipitation ranges from400 mm yr-1 (Sheikhupura district) to 800 mm yr-1
(Sialkot district) (Byerlee et al. 1984). Thesemiarid climate is continental monsoonal, withsome 80 percent of the total precipitation duringthe monsoonal season from June to September.Wheat is grown in the cold and dry weather from
November to March, whereas rice is grown duringthe warm humid/semi-humid season from June toOctober (Timsina and Connor 2001). With anannual potential evapotranspiration of at least1,400 mm (Harrington et al. 1993; Jehangir et al.2007), rice and wheat are dependent on irrigation,which includes the conjunctive use of surfacewater and groundwater. Both study areas areserved by a developed canal irrigation system,although groundwater now provides the majorshare of total water supply at the farm gate(Harrington et al. 1993; Jehangir et al. 2007)making up for the inadequate volume, frequencyand timing of canal water (Ahmad et al. 2007).The soils in the study areas are predominantlyalluvial, calcareous, very low in organic carbonand weakly structured, with light to mediumtexture (sandy loam to clay loam) (Harrington etal. 1993; Jehangir et al. 2007).
FIGURE 1.Survey locations.
5
The rice-wheat systems in the study areasare highly mechanized, input-intensive,commercial and with relatively large farmholdings, particularly when compared to theeastern IGP (Erenstein et al. 2007b; Gupta et al.2003). Another distinguishing feature of bothstudy areas within the IGP is the popularity ofbasmati rice (Timsina and Connor 2001), anaromatic fine-quality rice which takes a longertime to mature. Wheat has traditionally been, andcontinues to be, the mainstay of food security inthe northwest IGP, and the introduction andwidespread cultivation of rice have only occurredin recent decades (Erenstein et al. 2007d). Theintroduction of rice has, thereby, put increasingpressure on the ability to plant wheat timelywithout incurring yield losses. The delay inplanting the wheat crop is mainly due to the lateharvest of the previous crop and/or a longturnaround time. The late harvest of the previousrice crop can be linked to both the late riceestablishment and the duration of the rice crop,particularly basmati. The long turnaround timeoften reflects intensive tillage operations, soil-moisture problems (too wet or too dry),nonavailability of traction power for plowing, andthe urgency to store the rice crop beforepreparing land for wheat cultivation. Farmersperceive the need for intensive tillage due to thedifference in soil management practices for riceand wheat – the former being grown underanaerobic conditions and the latter under aerobicconditions (Laxmi et al. 2007).
Data Sources
This study interprets ZT as the planting of wheatwith a tractor-drawn ZT seed drill directly intounplowed fields with a single pass of the tractor.Although prototype ZT seed drills were firstintroduced into South Asia during the mid- to late1980s, significant adoption of ZT by farmersbegan only in the late 1990s. The two studyareas in Haryana and Punjab were purposivelychosen for this study as they comprise thelocations where ZT promotion was initiated and
adoption was most significant (Khan et al. 2002;Malik et al. 2005c). Each study draws from twosimilar primary data sources: the survey of ZTdrill manufacturers and a formal adoption surveyof rice-wheat farmers. The Punjab study wascomplemented with a village survey (Farooq et al.2007) and the Haryana study with a water-usesurvey of rice-wheat farmers (Erenstein et al.2007a).
This study focuses on ZT through the use ofthe tractor-drawn ZT seed drill, i.e., ZT as a cropmanagement technology that is embodied inunique agricultural machinery. As a result, it ispossible to assess the advent of the technologythrough a supply-side analysis. For this purpose,a survey of ZT drill manufacturers wasimplemented in December 2003 (Anwar et al.2004; Parwez et al. 2004). Altogether 35 ZTmanufacturers were identified in Haryana and 43in Punjab, of whom about two-thirds were directlyinterviewed for this study (table 1).
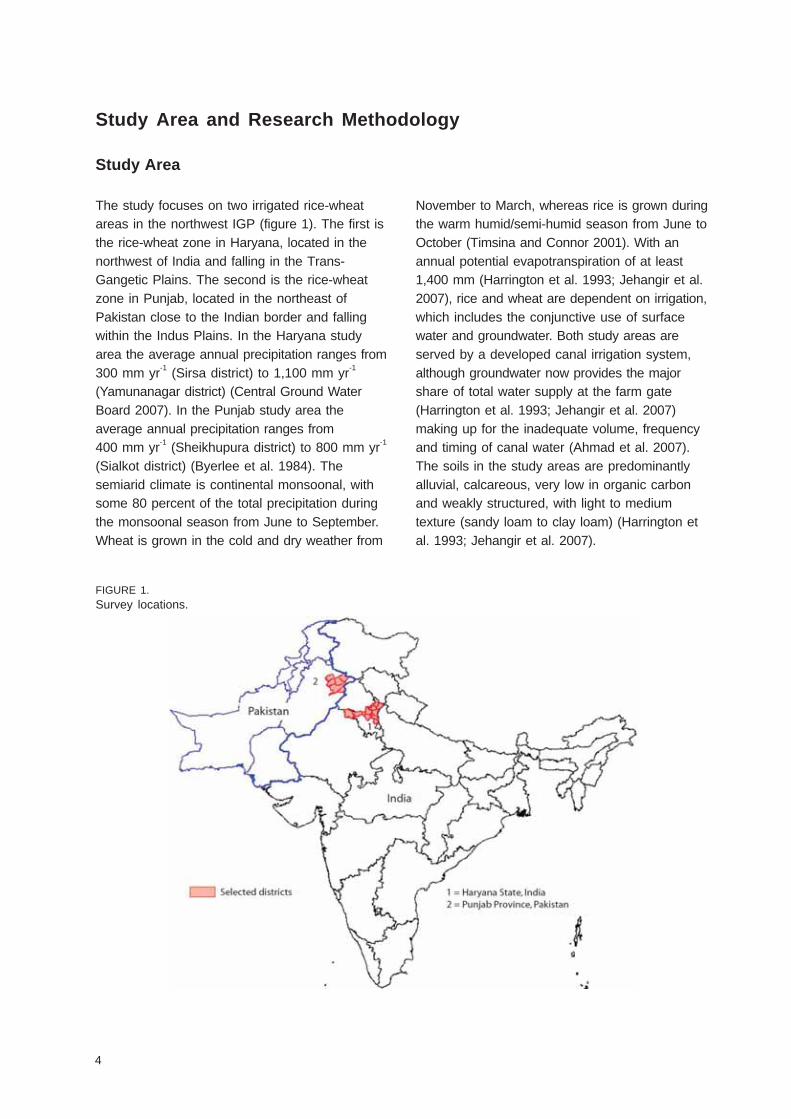
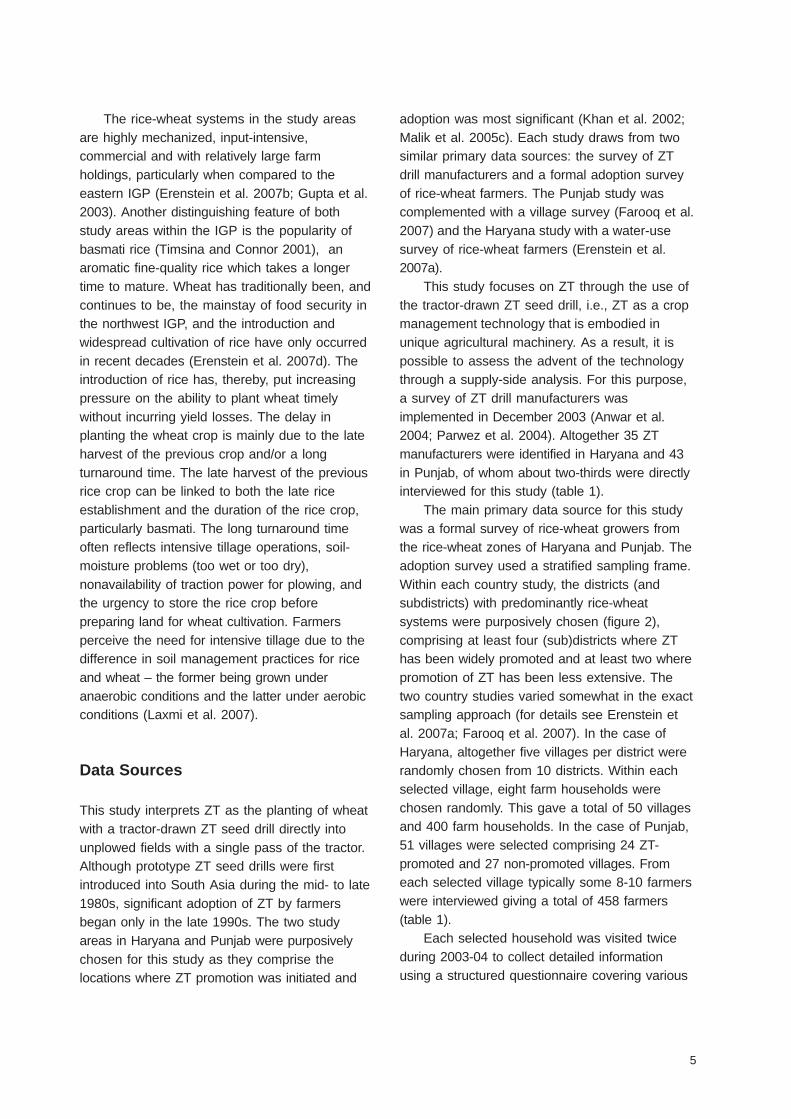
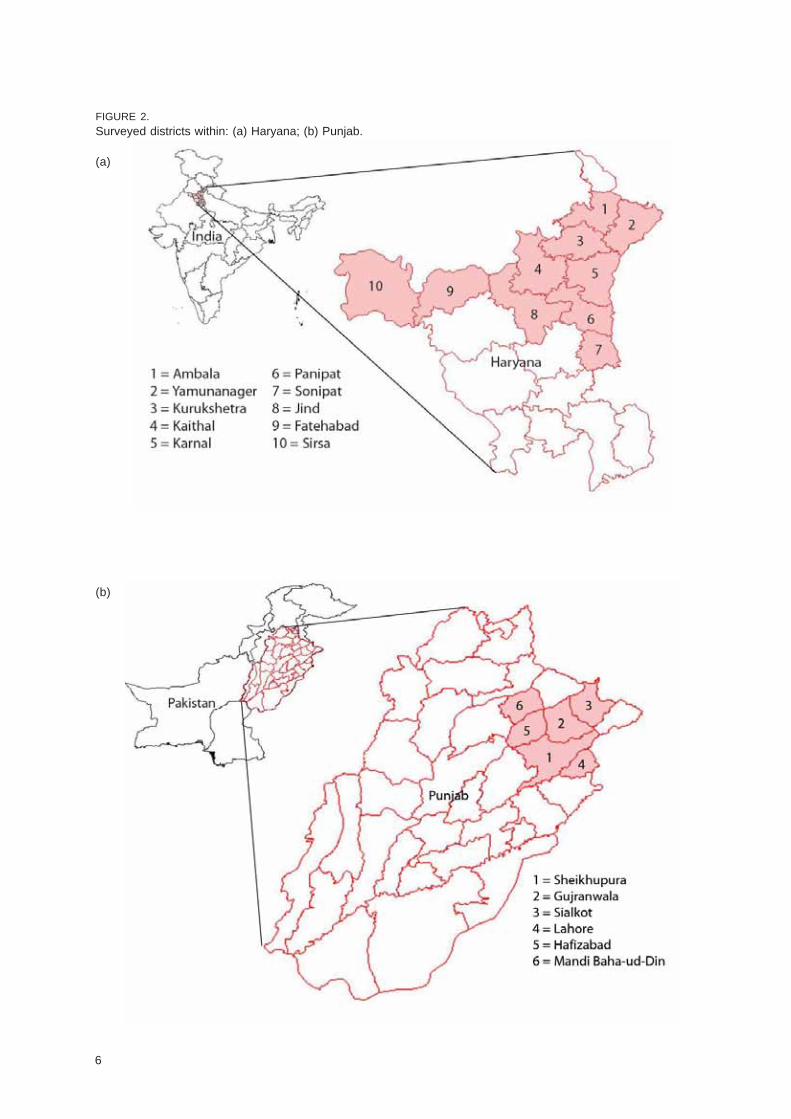
The main primary data source for this studywas a formal survey of rice-wheat growers fromthe rice-wheat zones of Haryana and Punjab. Theadoption survey used a stratified sampling frame.Within each country study, the districts (andsubdistricts) with predominantly rice-wheatsystems were purposively chosen (figure 2),comprising at least four (sub)districts where ZThas been widely promoted and at least two wherepromotion of ZT has been less extensive. Thetwo country studies varied somewhat in the exactsampling approach (for details see Erenstein etal. 2007a; Farooq et al. 2007). In the case ofHaryana, altogether five villages per district wererandomly chosen from 10 districts. Within eachselected village, eight farm households werechosen randomly. This gave a total of 50 villagesand 400 farm households. In the case of Punjab,51 villages were selected comprising 24 ZT-promoted and 27 non-promoted villages. Fromeach selected village typically some 8-10 farmerswere interviewed giving a total of 458 farmers(table 1).
Each selected household was visited twiceduring 2003-04 to collect detailed informationusing a structured questionnaire covering various
6
FIGURE 2.Surveyed districts within: (a) Haryana; (b) Punjab.
(a)
(b)
7
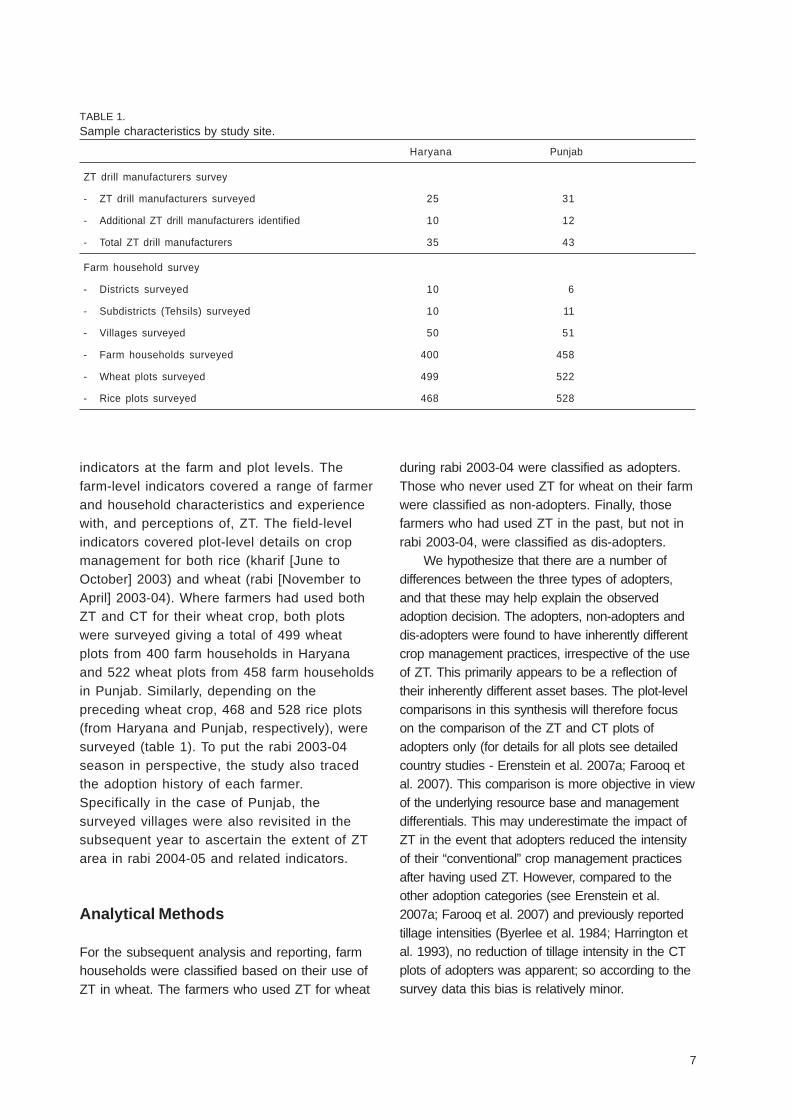
indicators at the farm and plot levels. Thefarm-level indicators covered a range of farmerand household characteristics and experiencewith, and perceptions of, ZT. The field-levelindicators covered plot-level details on cropmanagement for both rice (kharif [June toOctober] 2003) and wheat (rabi [November toApril] 2003-04). Where farmers had used bothZT and CT for their wheat crop, both plotswere surveyed giving a total of 499 wheatplots from 400 farm households in Haryanaand 522 wheat plots from 458 farm householdsin Punjab. Similarly, depending on thepreceding wheat crop, 468 and 528 rice plots(from Haryana and Punjab, respectively), weresurveyed (table 1). To put the rabi 2003-04season in perspective, the study also tracedthe adoption history of each farmer.Specifically in the case of Punjab, thesurveyed villages were also revisited in thesubsequent year to ascertain the extent of ZTarea in rabi 2004-05 and related indicators.
Analytical Methods
For the subsequent analysis and reporting, farmhouseholds were classified based on their use ofZT in wheat. The farmers who used ZT for wheat
TABLE 1.Sample characteristics by study site.
Haryana Punjab
ZT drill manufacturers survey
- ZT drill manufacturers surveyed 25 31
- Additional ZT drill manufacturers identified 10 12
- Total ZT drill manufacturers 35 43
Farm household survey
- Districts surveyed 10 6
- Subdistricts (Tehsils) surveyed 10 11
- Villages surveyed 50 51
- Farm households surveyed 400 458
- Wheat plots surveyed 499 522
- Rice plots surveyed 468 528
during rabi 2003-04 were classified as adopters.Those who never used ZT for wheat on their farmwere classified as non-adopters. Finally, thosefarmers who had used ZT in the past, but not inrabi 2003-04, were classified as dis-adopters.
We hypothesize that there are a number ofdifferences between the three types of adopters,and that these may help explain the observedadoption decision. The adopters, non-adopters anddis-adopters were found to have inherently differentcrop management practices, irrespective of the useof ZT. This primarily appears to be a reflection oftheir inherently different asset bases. The plot-levelcomparisons in this synthesis will therefore focuson the comparison of the ZT and CT plots ofadopters only (for details for all plots see detailedcountry studies - Erenstein et al. 2007a; Farooq etal. 2007). This comparison is more objective in viewof the underlying resource base and managementdifferentials. This may underestimate the impact ofZT in the event that adopters reduced the intensityof their “conventional” crop management practicesafter having used ZT. However, compared to theother adoption categories (see Erenstein et al.2007a; Farooq et al. 2007) and previously reportedtillage intensities (Byerlee et al. 1984; Harrington etal. 1993), no reduction of tillage intensity in the CTplots of adopters was apparent; so according to thesurvey data this bias is relatively minor.
8
The significance of all bivariate contrastsbetween adopter categories and plot types wascalculated using the relevant statistical tests(e.g., ANOVA with post-hoc test; t-test). Thefactors affecting the farm-level decision to adoptZT were analyzed using the logit regressionmodel, a standard limited-dependent variableapproach (CIMMYT 1993). The dependentvariable is dichotomous, and takes the value ofone when ZT is used and zero if it is not. Theindependent variables included in the adoptionmodels covered a range of relatively fixed andexogenous characteristics of farm householdsthat were expected to be associated with the ZTadoption decision. Not all variables originallyhypothesized could be included in the finalmodels: some variables proved to be highlycorrelated (e.g., tractor ownership and farm size),and some were not unambiguously measured orproved nondiscriminating. For consistencyreasons, we retained the same explanatoryvariables in the two country studies. Thedescriptive statistics of the independent variablesincluded in the models and further details aregiven in the respective country case studies(Erenstein et al. 2007a; Farooq et al. 2007).
The water productivity analysis follows thewater productivity framework developed byMolden and associates (Molden 1997; Molden etal. 1998; Seckler 1996), which is increasinglybeing applied (Ahmad et al. 2004; Cabangon etal. 2002; Jehangir et al. 2007). The main inflowcomponents of the study area and considered inthis study are irrigation from the canal and tube-well sources and rainfall. Water productivity wasestimated on the basis of the yield and monetaryvalue per unit of the gross inflow (irrigation + rain)and irrigation inflow.
The water inflow indicators draw from farmerrecall plot-level data for number and duration ofirrigations by source (canal and tube well). Thesewere converted into water volumes using averageirrigation volumetric rates and seasonal rainfall inthe study area. For the Haryana study area weused the average irrigation rates from the watersurvey conducted within the context of this study
(Erenstein et al. 2007a: 52.5 m3/hour for tube welland 69.4 m3/hour for canal) and seasonal rainfall(93 mm in rabi 2003-04 and 509 mm in kharif2003, Office of the Deputy Director, Agriculture,Kurukshetra, unpublished data). For the Punjabstudy area we used the irrigation rates and rainfalldata reported by Jehangir et al. (2007) within thesame area (102 m3/hour for tube well [i.e., 1cusec] and 117 m3/hour for canal; seasonalrainfall of 103 mm in rabi [average 2001-03] and239 mm in kharif 2003).
The financial analysis was done perindividual surveyed household using the reportedphysical input/output levels and local farm pricesthat prevailed at the time of the survey. Pricesare reported financial market prices, includingeventual taxes and subsidies. These marketrates are assumed to be a reliable reflection ofopportunity costs, irrespective of ownership(e.g., in case of land and tractors) and facilitatecomparison. Missing values have beensubstituted with the corresponding average forthe locality. Local currency was converted to USdollars at the average conversion rate at thetime.
The gross revenue from crop cultivationcomprises the value of all the grain and the valueof the residues/straw. The total production costincludes:
1. Land preparation (all tillage plus eventualpost-sowing pass to cover seed).
2. Crop establishment (cost of seeding operationonly, includes seed, labor and machinery).
3. Fertilizer cost (includes chemical fertilizer andfarm yard manure).
4. Plant protection cost (includes herbicides,manual weeding, pesticides/fungicides).
5. Irrigation cost (flat area-based rate for canaland variable time-based cost for tube well).
6. Harvesting expenditures (includes labor andmachinery for harvesting and threshing).
7. Land rent (prevailing seasonal rent).
8. Interest on capital invested (9% of all costs).
9
As performance indicators are included:
• Net revenue = (gross revenue) – (totalproduction cost)
• Percentage of plots with positive net revenue
• Benefit:cost (ratio) = (gross revenue) / (totalproduction cost)
Diffusion of Zero Tillage
In India, rapid and widespread adoption of ZTstarted in Haryana (Laxmi et al. 2007; Malik etal. 2005c). The emphasis on ZT developmentoriginated from diagnostic studies thathighlighted the importance of time conflictsbetween rice harvesting and wheat planting inthe area (Fujisaka et al. 1994; Harrington et al.1993). ZT was thereby perceived to be a viableoption to alleviate the problem of late planting ofwheat after rice, the combined result of latematuring rice and long turnaround time. Byreducing soil movement, ZT also serves as aneffective control measure of Phalaris minor, amajor weed, which reduced wheat yields in theIGP and which showed emerging resistance toisoproturon herbicide after repeated andwidespread use in the mid-1990s (Malik et al.2002b; Yadav and Malik 2005). The ability tocontrol herbicide-resistant phalaris therebybecame a major initial driver for adoption of ZTin northwest India, which in combination withnew herbicides eventually managed to controlthe phalaris problem. Experts estimated thezero/reduced tillage (ZT/RT) area in Haryana tobe 350,000 hectares in 2003-04 (Laxmi et al.2007; RWC 2004).
In Pakistan, promotion and adoption of ZTstarted in Punjab (Aslam et al. 1993; Iqbal etal. 2002; Khan et al. 2002; Sheikh et al. 1993).The emphasis on ZT development againoriginated from diagnostic studies thathighlighted the importance of time conflictsbetween rice harvesting and wheat planting in
• Production cost = (total production cost) /(grain yield)
Further details are given in the respectivecountry case studies (Erenstein et al. 2007a;Farooq et al. 2007).
the area (Amir and Aslam 1992; Byerlee et al.1984; Sharif et al. 1992). Favorableexperimental findings led to a ZT pilotproduction program in the 1990s to expand theuse of this technology in the rice-wheat zone ofPunjab (Aslam et al. 1993). ZT wassubsequently picked up by farmers with anestimated 0.2 mha planted with ZT drill during2001-02 (Mann and Meisner 2003) while,according to unpublished data from the On-Farm Water Management, an estimated 0.3mha had been planted in 2003-04 (RWC 2004).
Supply of Zero-Tillage Drills
In both India and Pakistan, promotion andadoption of ZT emphasized the use of a tractor-drawn ZT seed drill. This drill typically opens anumber (6-11) of narrow slits with inverted-T tinesfor placement of seed (and sometimes fertilizer)at a depth of 7.5-10 cm into the soil. Thisspecialized agricultural machinery was originallynot available in South Asia. A key component inthe technology diffusion was creating the localmanufacturing capacity to supply adequate andaffordable ZT drills. In both study areas, ZTmanufacturing capacity is geographicallyconcentrated in the rice-wheat belt (northwest ofHaryana and northeast of Punjab). In Pakistan,this corresponds to the traditional farm-machinery-making centers for cultivators andthreshers like Daska town in the Sialkot district,
10
Punjab. In India, the first commercial ZT drillsalso originated from the traditional machinery-manufacturing centers like Ludhiana and Amritsarin Indian Punjab. It was only later thatmanufacturers in Haryana joined this business.
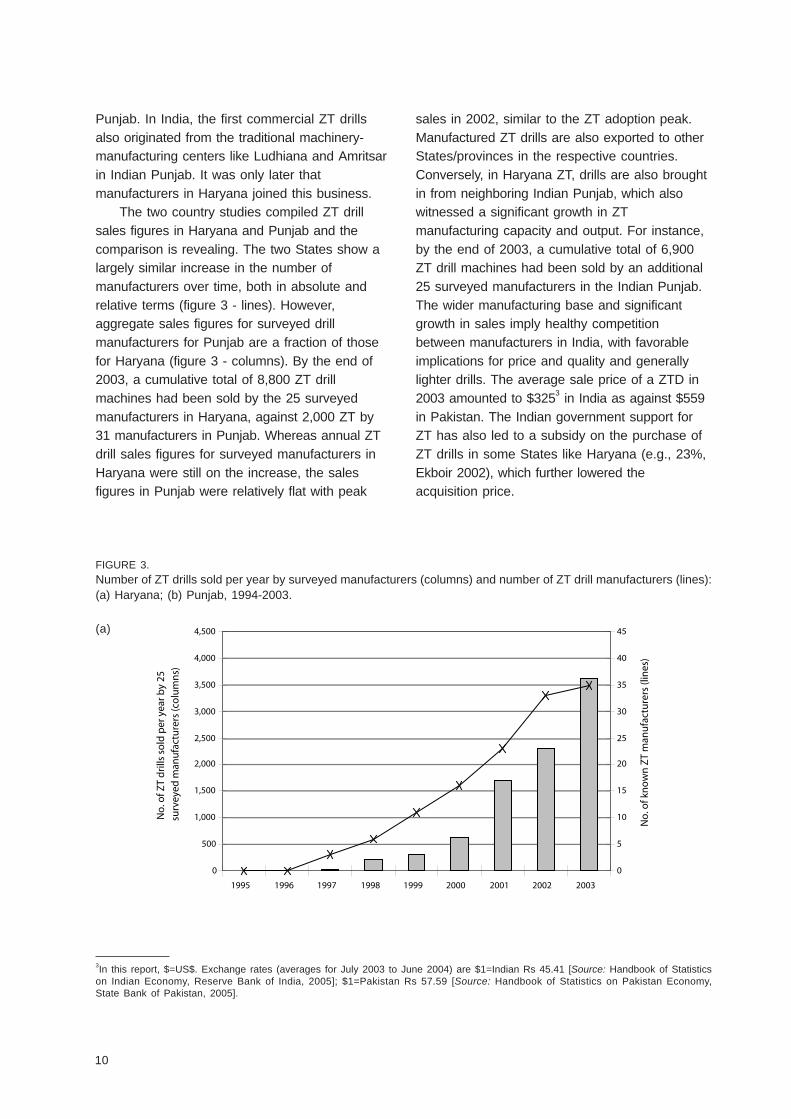
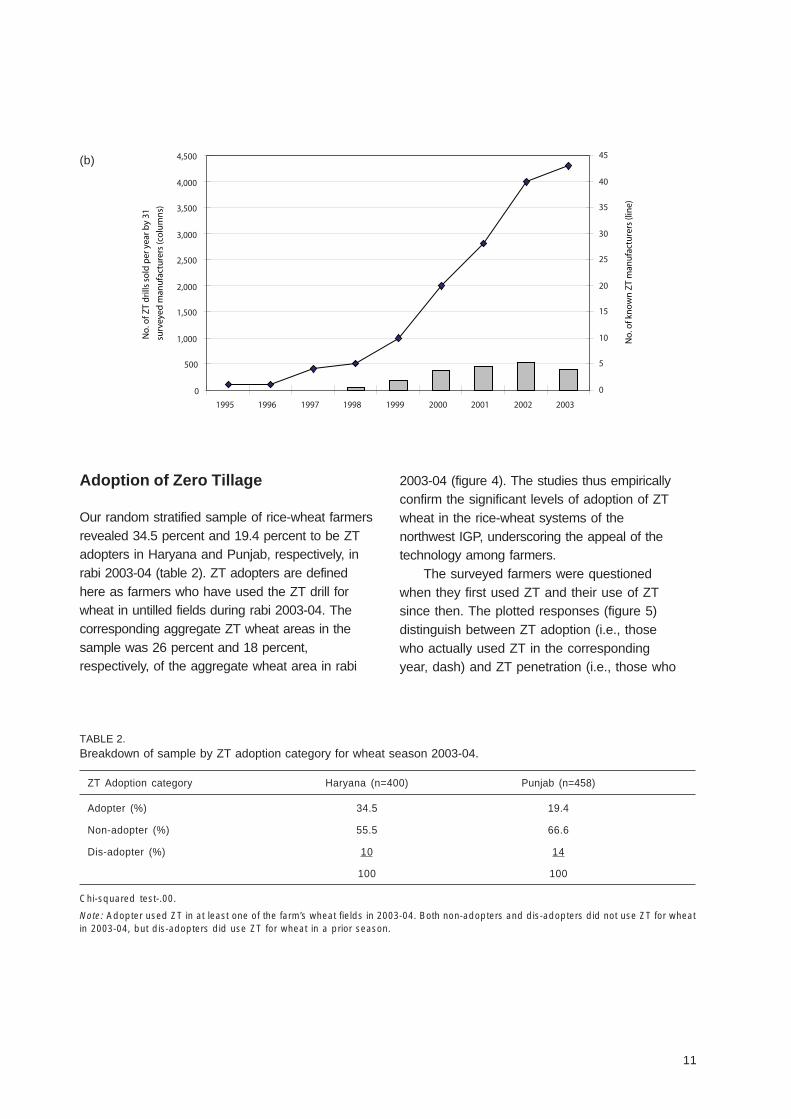
The two country studies compiled ZT drillsales figures in Haryana and Punjab and thecomparison is revealing. The two States show alargely similar increase in the number ofmanufacturers over time, both in absolute andrelative terms (figure 3 - lines). However,aggregate sales figures for surveyed drillmanufacturers for Punjab are a fraction of thosefor Haryana (figure 3 - columns). By the end of2003, a cumulative total of 8,800 ZT drillmachines had been sold by the 25 surveyedmanufacturers in Haryana, against 2,000 ZT by31 manufacturers in Punjab. Whereas annual ZTdrill sales figures for surveyed manufacturers inHaryana were still on the increase, the salesfigures in Punjab were relatively flat with peak
sales in 2002, similar to the ZT adoption peak.Manufactured ZT drills are also exported to otherStates/provinces in the respective countries.Conversely, in Haryana ZT, drills are also broughtin from neighboring Indian Punjab, which alsowitnessed a significant growth in ZTmanufacturing capacity and output. For instance,by the end of 2003, a cumulative total of 6,900ZT drill machines had been sold by an additional25 surveyed manufacturers in the Indian Punjab.The wider manufacturing base and significantgrowth in sales imply healthy competitionbetween manufacturers in India, with favorableimplications for price and quality and generallylighter drills. The average sale price of a ZTD in2003 amounted to $3253 in India as against $559in Pakistan. The Indian government support forZT has also led to a subsidy on the purchase ofZT drills in some States like Haryana (e.g., 23%,Ekboir 2002), which further lowered theacquisition price.
FIGURE 3.Number of ZT drills sold per year by surveyed manufacturers (columns) and number of ZT drill manufacturers (lines):(a) Haryana; (b) Punjab, 1994-2003.
0
500
1,000
1,500
2,000
2,500
3,000
3,500
4,000
4,500
1995 1996 1997 1998 1999 2000 2001 2002 2003
No
. of Z
T d
rills
so
ld p
er y
ear b
y 25
su
rvey
ed m
anu
fact
ure
rs (c
olu
mn
s)
0
5
10
15
20
25
30
35
40
45
No
. of k
no
wn
ZT
man
ufa
ctu
rers
(lin
es)
3In this report, $=US$. Exchange rates (averages for July 2003 to June 2004) are $1=Indian Rs 45.41 [Source: Handbook of Statisticson Indian Economy, Reserve Bank of India, 2005]; $1=Pakistan Rs 57.59 [Source: Handbook of Statistics on Pakistan Economy,State Bank of Pakistan, 2005].
(a)
11
Adoption of Zero Tillage
Our random stratified sample of rice-wheat farmersrevealed 34.5 percent and 19.4 percent to be ZTadopters in Haryana and Punjab, respectively, inrabi 2003-04 (table 2). ZT adopters are definedhere as farmers who have used the ZT drill forwheat in untilled fields during rabi 2003-04. Thecorresponding aggregate ZT wheat areas in thesample was 26 percent and 18 percent,respectively, of the aggregate wheat area in rabi
0
500
1,000
1,500
2,000
2,500
3,000
3,500
4,000
4,500
1995 1996 1997 1998 1999 2000 2001 2002 2003
No
. of Z
T d
rills
so
ld p
er y
ear b
y 31
surv
eyed
man
ufa
ctu
rers
(co
lum
ns)
0
5
10
15
20
25
30
35
40
45
No
. of k
no
wn
ZT
man
ufa
ctu
rers
(lin
e)
2003-04 (figure 4). The studies thus empiricallyconfirm the significant levels of adoption of ZTwheat in the rice-wheat systems of thenorthwest IGP, underscoring the appeal of thetechnology among farmers.
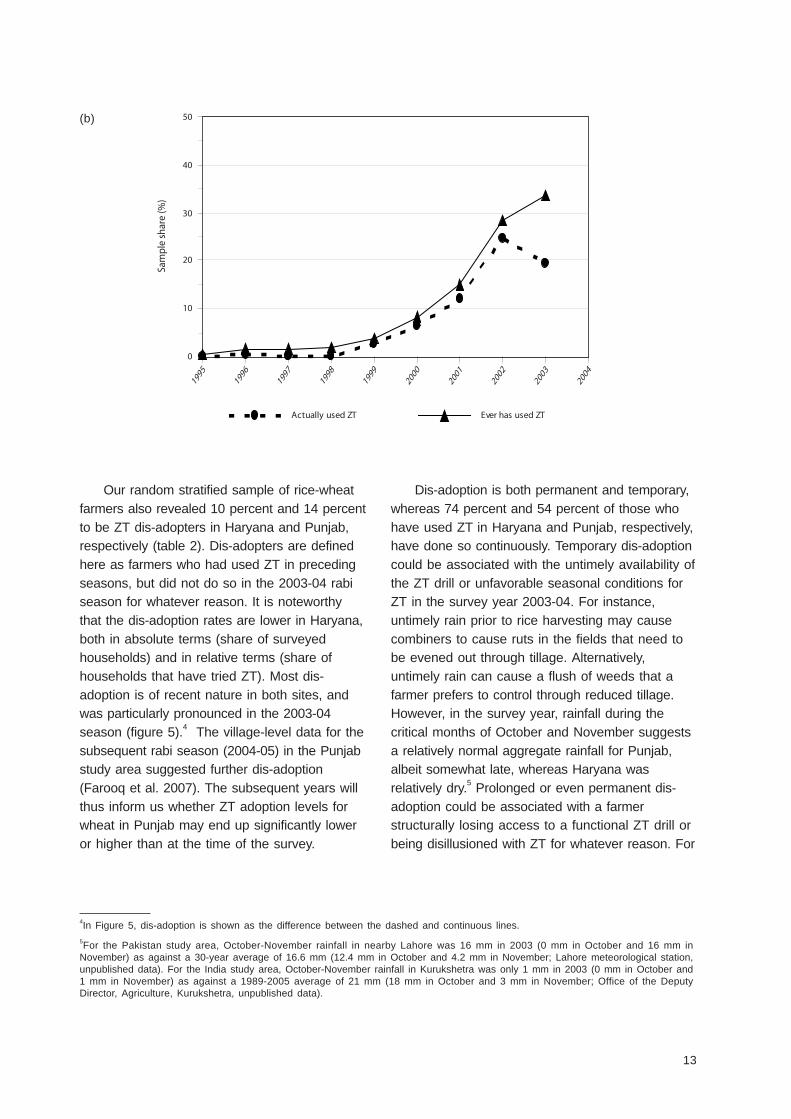
The surveyed farmers were questionedwhen they first used ZT and their use of ZTsince then. The plotted responses (figure 5)distinguish between ZT adoption (i.e., thosewho actually used ZT in the correspondingyear, dash) and ZT penetration (i.e., those who
(b)
TABLE 2.Breakdown of sample by ZT adoption category for wheat season 2003-04.
ZT Adoption category Haryana (n=400) Punjab (n=458)
Adopter (%) 34.5 19.4
Non-adopter (%) 55.5 66.6
Dis-adopter (%) 10 14
100 100
Chi-squared test-.00.
Note: Adopter used ZT in at least one of the farm’s wheat fields in 2003-04. Both non-adopters and dis-adopters did not use ZT for wheatin 2003-04, but dis-adopters did use ZT for wheat in a prior season.

12
had used ZT by that year, adopters and dis-adopters combined, line). In the case of Haryana,the ZTD diffusion in many ways follows thetraditional diffusion pattern of technologicalinnovations. After nearly a decade of adaptiveresearch, demonstration and slow initial diffusion,diffusion started to pick up rapidly from 2000onwards. The data suggest that ZT adoptionlevels for wheat may end up somewhat higherthan the observed one-third of the surveyedrice-wheat farmers at the time of the survey
(figure 5a). In the case of Punjab, up to 2002-03,ZT diffusion in many ways seemed to follow thetraditional diffusion pattern of technologicalinnovations similar to that of Haryana. Diffusionstarted to pick up rapidly from 2000, but adoptionrates seem to have abruptly peaked in 2002-03(at 24%, figure 5b). A separate study in Punjabalso reports a considerable increase in theadoption of ZT between 2000 and 2003, althoughwithout showing signs of peaking (Ahmad et al.2007).
0
10
20
30
40
50
1995
1996
1997
1998
1999
2000
2001
2002
2003
2004
Sam
ple
shar
e (%
)
Actually used ZT Ever has used ZT
FIGURE 5.Diffusion of ZT based on first year of use: (a) Haryana; (b) Punjab.
FIGURE 4.Aggregate ZT area share for surveyed farms over time in Haryana and Punjab.
0
5
10
15
20
25
30
2000 2001 2002 2003
Ann
ual a
ggre
gate
ZT
area
sha
re
over
sam
ple
farm
s (%
)
Haryana Punjab
(a)
13
Our random stratified sample of rice-wheatfarmers also revealed 10 percent and 14 percentto be ZT dis-adopters in Haryana and Punjab,respectively (table 2). Dis-adopters are definedhere as farmers who had used ZT in precedingseasons, but did not do so in the 2003-04 rabiseason for whatever reason. It is noteworthythat the dis-adoption rates are lower in Haryana,both in absolute terms (share of surveyedhouseholds) and in relative terms (share ofhouseholds that have tried ZT). Most dis-adoption is of recent nature in both sites, andwas particularly pronounced in the 2003-04season (figure 5).4 The village-level data for thesubsequent rabi season (2004-05) in the Punjabstudy area suggested further dis-adoption(Farooq et al. 2007). The subsequent years willthus inform us whether ZT adoption levels forwheat in Punjab may end up significantly loweror higher than at the time of the survey.
Dis-adoption is both permanent and temporary,whereas 74 percent and 54 percent of those whohave used ZT in Haryana and Punjab, respectively,have done so continuously. Temporary dis-adoptioncould be associated with the untimely availability ofthe ZT drill or unfavorable seasonal conditions forZT in the survey year 2003-04. For instance,untimely rain prior to rice harvesting may causecombiners to cause ruts in the fields that need tobe evened out through tillage. Alternatively,untimely rain can cause a flush of weeds that afarmer prefers to control through reduced tillage.However, in the survey year, rainfall during thecritical months of October and November suggestsa relatively normal aggregate rainfall for Punjab,albeit somewhat late, whereas Haryana wasrelatively dry.5 Prolonged or even permanent dis-adoption could be associated with a farmerstructurally losing access to a functional ZT drill orbeing disillusioned with ZT for whatever reason. For
4In Figure 5, dis-adoption is shown as the difference between the dashed and continuous lines.5For the Pakistan study area, October-November rainfall in nearby Lahore was 16 mm in 2003 (0 mm in October and 16 mm inNovember) as against a 30-year average of 16.6 mm (12.4 mm in October and 4.2 mm in November; Lahore meteorological station,unpublished data). For the India study area, October-November rainfall in Kurukshetra was only 1 mm in 2003 (0 mm in October and1 mm in November) as against a 1989-2005 average of 21 mm (18 mm in October and 3 mm in November; Office of the DeputyDirector, Agriculture, Kurukshetra, unpublished data).
0
10
20
30
40
50
1995
1996
1997
1998
1999
2000
2001
2002
2003
2004
Sam
ple
shar
e (%
)
Actually used ZT Ever has used ZT
(b)
14
instance, particularly dis-adopters and the Punjabstudy reported the lack of yield enhancement withZT as an issue (see subsequent chapters). It isalso noteworthy that in both study areas dis-adopters had typically used ZT for one singleyear, suggesting an unsuccessful first experienceand/or limited perseverance.
The slower diffusion and higher dis-adoptionin Punjab are likely associated with the ongoinginstitutional ZT controversy there. ZT diffusion inPunjab has been hampered by institutional rivalrywhereby “some government agencies … havedifferences of opinion on the usefulness and thebenefits of zero-tillage technology” (Iqbal et al.2002:677). This is also illustrated by Sheikh et al.(2003:90), who find a significantly negativeassociation between the number of extensionvisits and ZT adoption, leading them to concludethat “[t]his suggests that extension workers arenot recommending the technology.” Provincialagricultural extension is indeed not supportive ofZT wheat and this message is carried through intheir extension campaigns and by their field staff.One of their fears is that ZT, by not plowing, mayenhance over-wintering of the stem borer in therice stubble which may undermine the productivityand competitiveness of basmati rice, a majorexport crop. However, there is no scientificevidence of such risk (Inayatullah et al. 1989;Srivastava et al. 2005). Filling the institutionalvacuum, OFWM has played an important role inpromoting this technology. This has createdinstitutional rivalry between OFWM andagricultural extension with unfortunate implicationsfor the farmers and the technology alike inPunjab, particularly in view of conflictinginformation. In contrast, the initial reluctance ofmany stakeholders vis-à-vis ZT in India wastransformed into a significant support for ZT at alllevels.
Better understanding the rationale for dis-adoption merits further scrutiny. Our findingssuggest that there is no clear single overarchingconstraint, but that a combination of factors is atplay, including technology performance,technology access, seasonal constraints and,particularly in the case of Punjab, the institutionalZT controversy.
In line with ZT drill sales and ZT use, ZT drillownership is significantly less widespread inPunjab than in Haryana, being reported by 7percent and 15 percent of the surveyedhouseholds, respectively. As expected, drillownership was significantly higher for adopters,less common for dis-adopters and virtually absentfor non-adopters in each site (table 4). Themajority of ZT adopters therefore relied oncontracted ZT drill services at the time of thesurvey in both sites (74% and 60% of ZTadopters, respectively). This is in line with thecommon tillage practices in these areas wheremany farmers do not own a tractor but rely ontillage contract services to get their fieldsprepared. Contracted ZT drill services havethereby made the technology accessible tosmallholders without a tractor, whereas tractorowners can put off the investment decision. Atthe same time, the prevailing reliance oncontractual services may constrain timelyavailability of the ZT drill and thereby (partially)forfeit the timely establishment of the wheat crop.Also, not all ZT drills are available for contractservices: about a third of the operational ZT drillsin Punjab were reportedly only used on theowners’ farm during the last 3 years. Anotherstudy of ZT drill owners in Punjab found that only40 percent were providing the drills on a rentalbasis (Khan et al. 2002:63). Anecdotal evidencesuggests that large land- and tractor-owningfarmers in Punjab are often reluctant to contractout their machinery – an issue also reported forthe 2000-01 season (Iqbal et al. 2002:677). Thevarying access to ZT drills adds to the site-specificity of findings. For instance, yet anotherstudy in Punjab revealed that the reasons for ZTusers not purchasing a ZT drill included havingeasy access to drills on rent or free of cost fromrelatives/friends, drills still in an experimentalphase and high drill costs (Tahir and Younas2004). Yet, the same study also reported that 40percent of ZT users claimed that the number ofavailable drills was insufficient.
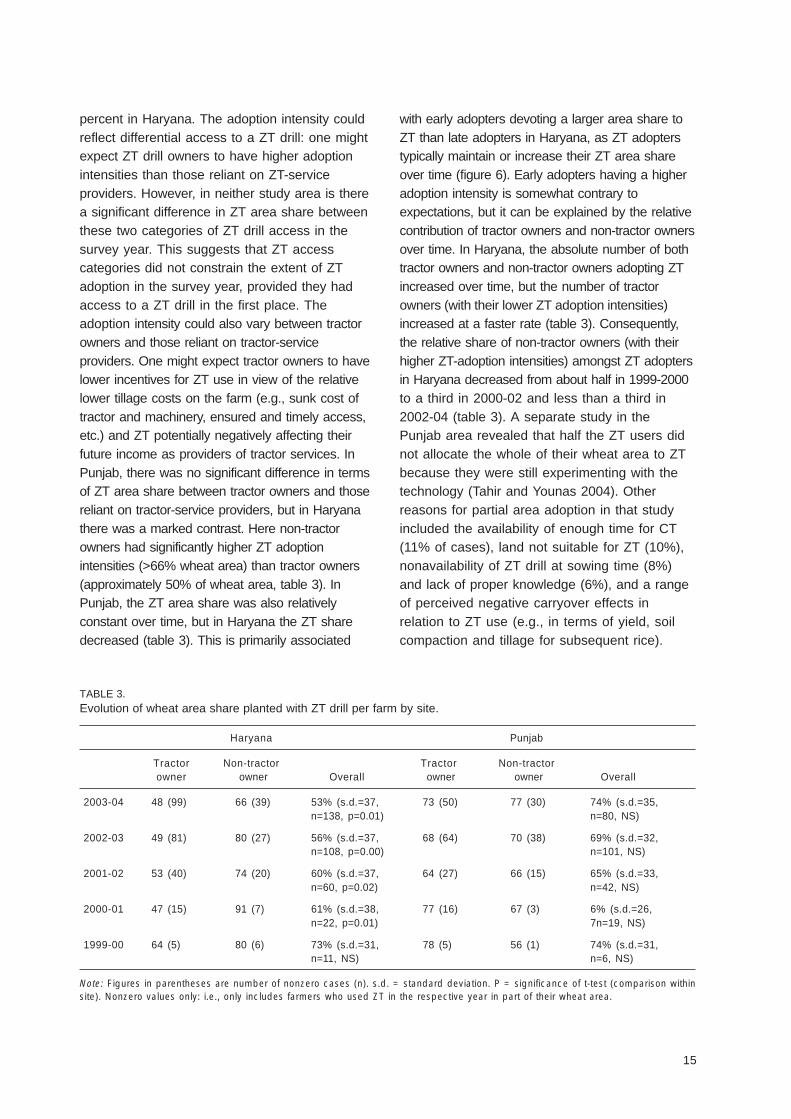
Partial adoption of ZT on a share of thewheat area of the adopting farm seems to be theprevalent practice. In Punjab, this share averaged74 percent in the survey year, as against 53
15
TABLE 3.Evolution of wheat area share planted with ZT drill per farm by site.
Haryana Punjab
Tractor Non-tractor Tractor Non-tractorowner owner Overall owner owner Overall
2003-04 48 (99) 66 (39) 53% (s.d.=37, 73 (50) 77 (30) 74% (s.d.=35,n=138, p=0.01) n=80, NS)
2002-03 49 (81) 80 (27) 56% (s.d.=37, 68 (64) 70 (38) 69% (s.d.=32,n=108, p=0.00) n=101, NS)
2001-02 53 (40) 74 (20) 60% (s.d.=37, 64 (27) 66 (15) 65% (s.d.=33,n=60, p=0.02) n=42, NS)
2000-01 47 (15) 91 (7) 61% (s.d.=38, 77 (16) 67 (3) 6% (s.d.=26,n=22, p=0.01) 7n=19, NS)
1999-00 64 (5) 80 (6) 73% (s.d.=31, 78 (5) 56 (1) 74% (s.d.=31,n=11, NS) n=6, NS)
Note: Figures in parentheses are number of nonzero cases (n). s.d. = standard deviation. P = significance of t-test (comparison withinsite). Nonzero values only: i.e., only includes farmers who used ZT in the respective year in part of their wheat area.
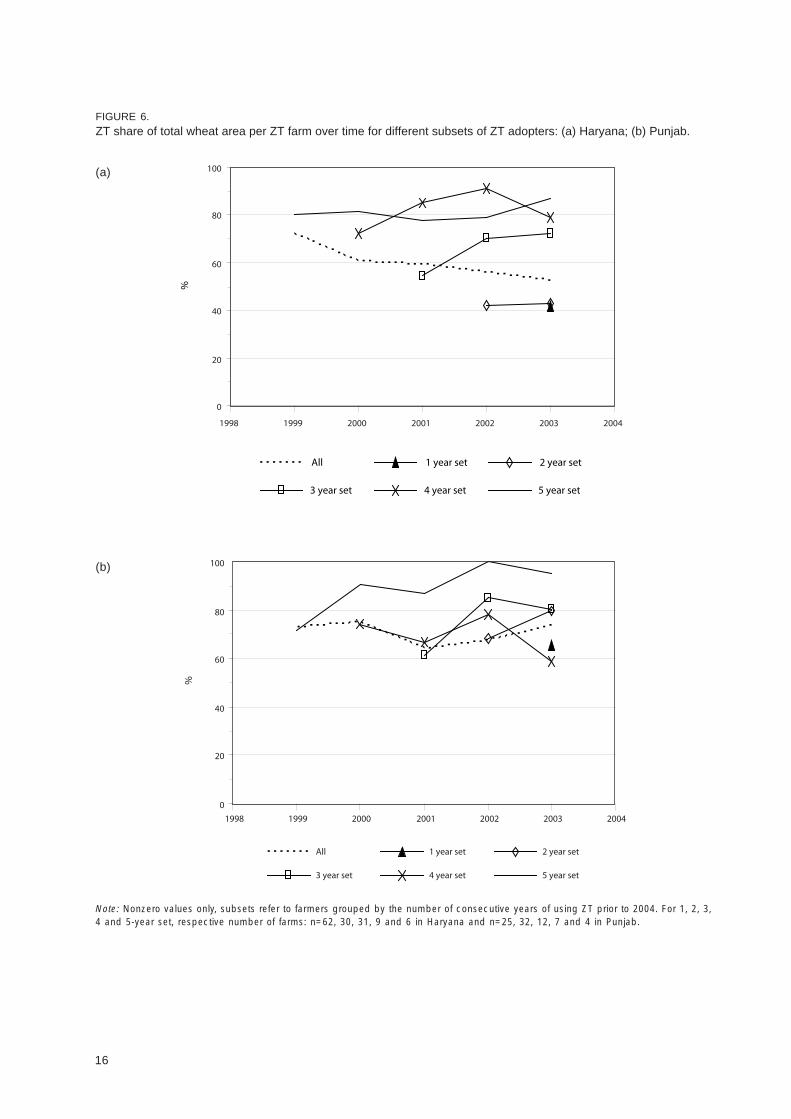
percent in Haryana. The adoption intensity couldreflect differential access to a ZT drill: one mightexpect ZT drill owners to have higher adoptionintensities than those reliant on ZT-serviceproviders. However, in neither study area is therea significant difference in ZT area share betweenthese two categories of ZT drill access in thesurvey year. This suggests that ZT accesscategories did not constrain the extent of ZTadoption in the survey year, provided they hadaccess to a ZT drill in the first place. Theadoption intensity could also vary between tractorowners and those reliant on tractor-serviceproviders. One might expect tractor owners to havelower incentives for ZT use in view of the relativelower tillage costs on the farm (e.g., sunk cost oftractor and machinery, ensured and timely access,etc.) and ZT potentially negatively affecting theirfuture income as providers of tractor services. InPunjab, there was no significant difference in termsof ZT area share between tractor owners and thosereliant on tractor-service providers, but in Haryanathere was a marked contrast. Here non-tractorowners had significantly higher ZT adoptionintensities (>66% wheat area) than tractor owners(approximately 50% of wheat area, table 3). InPunjab, the ZT area share was also relativelyconstant over time, but in Haryana the ZT sharedecreased (table 3). This is primarily associated
with early adopters devoting a larger area share toZT than late adopters in Haryana, as ZT adopterstypically maintain or increase their ZT area shareover time (figure 6). Early adopters having a higheradoption intensity is somewhat contrary toexpectations, but it can be explained by the relativecontribution of tractor owners and non-tractor ownersover time. In Haryana, the absolute number of bothtractor owners and non-tractor owners adopting ZTincreased over time, but the number of tractorowners (with their lower ZT adoption intensities)increased at a faster rate (table 3). Consequently,the relative share of non-tractor owners (with theirhigher ZT-adoption intensities) amongst ZT adoptersin Haryana decreased from about half in 1999-2000to a third in 2000-02 and less than a third in2002-04 (table 3). A separate study in thePunjab area revealed that half the ZT users didnot allocate the whole of their wheat area to ZTbecause they were still experimenting with thetechnology (Tahir and Younas 2004). Otherreasons for partial area adoption in that studyincluded the availability of enough time for CT(11% of cases), land not suitable for ZT (10%),nonavailability of ZT drill at sowing time (8%)and lack of proper knowledge (6%), and a rangeof perceived negative carryover effects inrelation to ZT use (e.g., in terms of yield, soilcompaction and tillage for subsequent rice).
16
FIGURE 6.ZT share of total wheat area per ZT farm over time for different subsets of ZT adopters: (a) Haryana; (b) Punjab.
0
20
40
60
80
100
1998 1999 2000 2001 2002 2003 2004
All 1 year set 2 year set
3 year set 4 year set 5 year set
%
0
20
40
60
80
100
1998 1999 2000 2001 2002 2003 2004
All 1 year set 2 year set
3 year set 4 year set 5 year set
%
Note: Nonzero values only, subsets refer to farmers grouped by the number of consecutive years of using ZT prior to 2004. For 1, 2, 3,4 and 5-year set, respective number of farms: n=62, 30, 31, 9 and 6 in Haryana and n=25, 32, 12, 7 and 4 in Punjab.
(a)
(b)
17
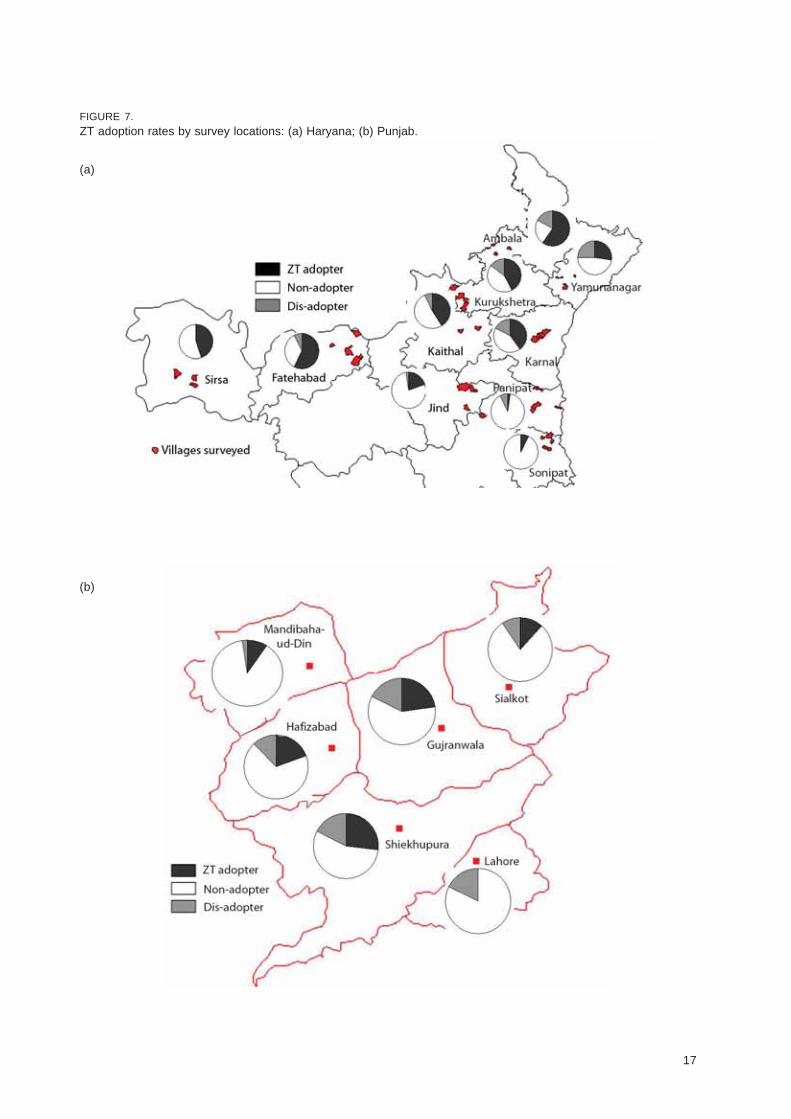
FIGURE 7.ZT adoption rates by survey locations: (a) Haryana; (b) Punjab.
(a)
(b)
18
ZT adoption is also far from uniform, withsignificant variations in terms of penetration anduse over districts and villages in both study sites(figure 7). In Haryana, the variations over districtsseem to be associated with prevailing croppingsystems, with dis-adoption more prevalent in bothrice-wheat and sugarcane-based cropping systems.Although ZT promotion has emphasized rice-wheatdistricts in Haryana, ZT adoption is also spreadingrapidly in districts where cotton-wheatpredominates. Cotton-wheat systems tend to havethe same problem of late wheat planting. However,in Punjab, ZT is even more controversial in cotton-wheat systems because of feared carryover ofbollworms on unincorporated cotton residues. InPunjab, ZT penetration (adoption + dis-adoption) isgeographically concentrated in the rice-wheatheartland: the contiguous Sheikhupura, Gujranwalaand Hafizabad districts. In these districts, 32-45percent of surveyed farmers have tested the ZTdrill, with 20-27 percent current adopters. The soilsin these districts are relatively heavy, suggestingthat the need for the ZT drill is relatively felt morein these areas. In the remaining three Punjabdistricts, ZT penetration was modest with 11-21percent of surveyed farmers having tested the ZTdrill. In both Haryana and Punjab, the district-leveldata show that a) an increased penetration of ZT isassociated not only with increased adoption levelsbut also with increased dis-adoption levels; and b)ZT adopters typically outnumber dis-adopters. Theassumed intensity of ZT promotion at the district
level did not show a clear linkage to increasedadoption rates, an issue likely associated with thetechnology primarily spreading from farmer tofarmer in both study sites and the institutionalrivalry in Punjab.
In both Haryana and Punjab, village-wiseadoption rates show a considerable gradient fromnone to saturation. The village-level data therebyallow for some important inferences. First, itillustrates that ZT penetration to individualvillages was widespread but not comprehensiveat the time of the survey in both Haryana andPunjab. Second, the gradient in village-wiseadoption rates suggests that intrinsically there isnothing wrong with the technology itself, but thataccess and application of the technology maybe an issue. Indeed, the fact that some villagesare saturated and others show no dis-adoptionsuggests that ZT has considerable merit andwide applicability once the technology hasproven itself within a community. Third, village-wise dis-adoption varies over the two studysites. In Haryana, the village-level data showthat the average dis-adoption of 10 percent istypically piecemeal and only occasionallywidespread and likely associated with cropdiversification in favor of sugarcane andvegetables. In Punjab, dis-adoption seems to beconcentrated in about half the villages where ZThad penetrated. Access to ZT drills varies overvillages and is likely to have contributed to theobserved adoption patterns.
Factors Affecting the Adoption
The ZT adopters, non-adopters and dis-adopterscategories differ significantly in terms of theirresource base in both study areas. For the variousindicators compiled, adopters typically have themost favorable values and the non-adopters theleast favorable, with dis-adopters taking anintermediate position. This has two importantimplications. First, it highlights that ZT adoption inthe initial diffusion stage is strongly associated with
Understanding Adoption ofZero Tillage
The previous chapter confirmed the significantadoption of ZT in Haryana and Punjab. However,it also highlighted that adoption is far fromuniversal and that a significant share ofhouseholds had become dis-adopters. Thischapter synthesizes the differences at thehousehold level that may help explain thedecision to become adopters or dis-adopters.
19
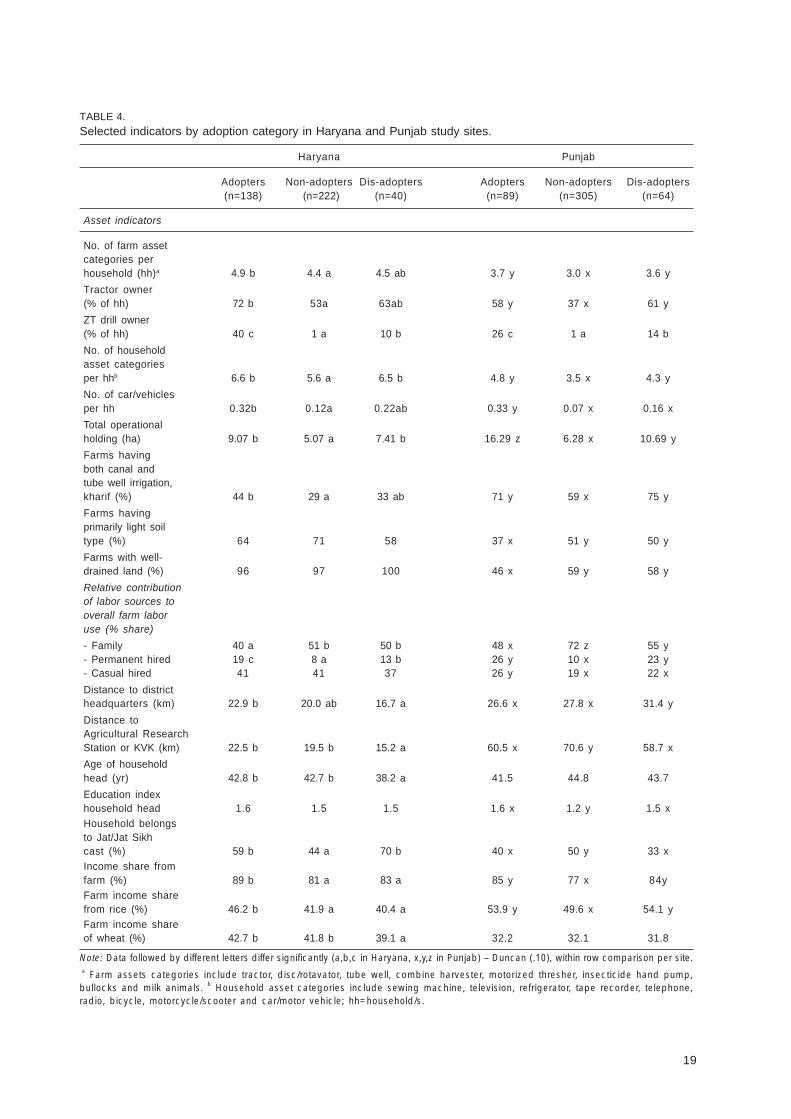
TABLE 4.Selected indicators by adoption category in Haryana and Punjab study sites.
Haryana Punjab
Adopters Non-adopters Dis-adopters Adopters Non-adopters Dis-adopters(n=138) (n=222) (n=40) (n=89) (n=305) (n=64)
Asset indicators
No. of farm assetcategories perhousehold (hh)a 4.9 b 4.4 a 4.5 ab 3.7 y 3.0 x 3.6 y
Tractor owner(% of hh) 72 b 53a 63ab 58 y 37 x 61 y
ZT drill owner(% of hh) 40 c 1 a 10 b 26 c 1 a 14 b
No. of householdasset categoriesper hhb 6.6 b 5.6 a 6.5 b 4.8 y 3.5 x 4.3 y
No. of car/vehiclesper hh 0.32b 0.12a 0.22ab 0.33 y 0.07 x 0.16 x
Total operationalholding (ha) 9.07 b 5.07 a 7.41 b 16.29 z 6.28 x 10.69 y
Farms havingboth canal andtube well irrigation,kharif (%) 44 b 29 a 33 ab 71 y 59 x 75 y
Farms havingprimarily light soiltype (%) 64 71 58 37 x 51 y 50 y
Farms with well-drained land (%) 96 97 100 46 x 59 y 58 y
Relative contributionof labor sources tooverall farm laboruse (% share)
- Family 40 a 51 b 50 b 48 x 72 z 55 y- Permanent hired 19 c 8 a 13 b 26 y 10 x 23 y- Casual hired 41 41 37 26 y 19 x 22 x
Distance to districtheadquarters (km) 22.9 b 20.0 ab 16.7 a 26.6 x 27.8 x 31.4 y
Distance toAgricultural ResearchStation or KVK (km) 22.5 b 19.5 b 15.2 a 60.5 x 70.6 y 58.7 x
Age of householdhead (yr) 42.8 b 42.7 b 38.2 a 41.5 44.8 43.7
Education indexhousehold head 1.6 1.5 1.5 1.6 x 1.2 y 1.5 xHousehold belongsto Jat/Jat Sikhcast (%) 59 b 44 a 70 b 40 x 50 y 33 xIncome share fromfarm (%) 89 b 81 a 83 a 85 y 77 x 84yFarm income sharefrom rice (%) 46.2 b 41.9 a 40.4 a 53.9 y 49.6 x 54.1 yFarm income shareof wheat (%) 42.7 b 41.8 b 39.1 a 32.2 32.1 31.8
Note: Data followed by different letters differ significantly (a,b,c in Haryana, x,y,z in Punjab) – Duncan (.10), within row comparison per site. a Farm assets categories include tractor, disc/rotavator, tube well, combine harvester, motorized thresher, insecticide hand pump,bullocks and milk animals. b Household asset categories include sewing machine, television, refrigerator, tape recorder, telephone,radio, bicycle, motorcycle/scooter and car/motor vehicle; hh=household/s.
20
the wealth of the farm household, likely reflectingtheir risk-bearing capacity and ability to innovate.Second, it highlights that ZT dis-adopters combinecharacteristics of both adopters and non-adopters.The favorable characteristics may thereby facilitatethe initial adoption of ZT, whereas the unfavorablecharacteristics undermine its continued use.
Bivariate analysis of the various adoption-survey indicators highlighted contrasts andsimilarities between ZT adopters, dis-adoptersand non-adopters in each site. Table 4 lists someof the factors that differed significantly, whichincluded:
• Farm and household assets: In both Haryanaand Punjab, penetration of ZT (adoption +dis-adoption) was positively associated withthe possession of farming assets (particularlya tractor and farm equipment) and householdassets (particularly a car/vehicle andhousehold appliances).
• Land characteristics: In both Haryana andPunjab, adoption of ZT is positivelyassociated with the size of operationalholding, with dis-adopters having intermediatefarm sizes. Adoption of ZT was alsopositively associated with the conjunctive useof canal and tube-well irrigation in both sites.Soils in Haryana tend to be lighter and better-drained than in Punjab (farms with only[sandy] loam soils 67% and 46%,respectively; farms with well-drained land97% and 57%, respectively). In Punjab,heavy soils and drainage problems areassociated with continued ZT use. Thesesoils would be more difficult to plow and soZT would have more potential in reducingturnaround time. In Haryana, there was nosignificant association between soil type ordrainage and ZT adoption. In Punjab, ZTadoption was also positively associated withfarms having fallow land in the rabi season.In part, this is associated with the strongassociation of ZT with farm size; but it alsoreflects the potential of ZT to increase thearea cultivated as compared to CT.
• Sources of farm labor: In both Haryana andPunjab, adoption of ZT was positively
associated with reliance on permanent laborand negatively associated with reliance onfamily labor. In Punjab, adoption of ZT wasalso positively associated with reliance oncasual labor.
• Selected farm and farmer characteristics:Distance is associated with adoption and dis-adoption in each site, but no clear patternemerges across the two sites. In Haryana,various proximity indicators were associatedwith dis-adoption, the latter likely reflectingthe combined effect of exposure to ZT anddiversification incentives. In Haryana, dis-adoption of ZT was also positively associatedwith the youth of household head and the Jatcaste, whereas adoption of ZT was positivelyassociated with the Jat Sikh caste. InPunjab, non-adoption was associated with alow literacy ratio. Family size, organizationalmembership and credit access indicatorsprovided no clear association with adoptionclasses.In both Haryana and Punjab, farming was the
main income source across households,contributing 80 percent or more of overallhousehold income. In Haryana, the share offarming was significantly higher for adopterscompared to non-adopters and dis-adopters(table 4). In Punjab, the share of farming wassignificantly higher for adopters and dis-adopterscompared to non-adopters. This highlights apositive association of ZT adoption andpenetration, respectively, with the farmhouseholds’ reliance on agriculture for income.This agricultural specialization reflects their largerlandholding and more commercial orientation.
In Haryana, rice and wheat contributed aboutequal shares to household income (43% and 42%,respectively). In Punjab, the relative income sharefavors rice over wheat (51% and 32%,respectively), associated with the more widespreadcultivation of high-value basmati rice. In ourHaryana sample, adopters have taken the rice-wheat specialization furthest. In Punjab, adoptersand dis-adopters had a significantly higher relativecontribution of rice to farm income compared tonon-adopters, and the wheat share was similar. Onaverage, rice and wheat crops occupied three-
21
fourths of the total operational holding in Punjab,while slightly more than 15 percent of the farmsize was allocated for fodder crops during bothseasons. The combination of these factors likelyenhances the incentives for adopters in Haryanaand adopters and dis-adopters in Punjab toinnovate and cut production costs in rice-wheatsystems. In Haryana, dis-adoption of ZT waspositively associated with sugarcane cultivation,which is often grown in a 2-year rotation withwheat. This reduced their reliance on rice-wheatsystems whereas the prevailing tine-type ZT drillswill not work without prior tillage in formersugarcane fields owing to the persistentrootstocks. To use ZT in such fields, heavierdouble-disc drills are needed that can cut throughthe rootstocks, and these only started becomingavailable in 2002-03.
ZT Adoption Constraints
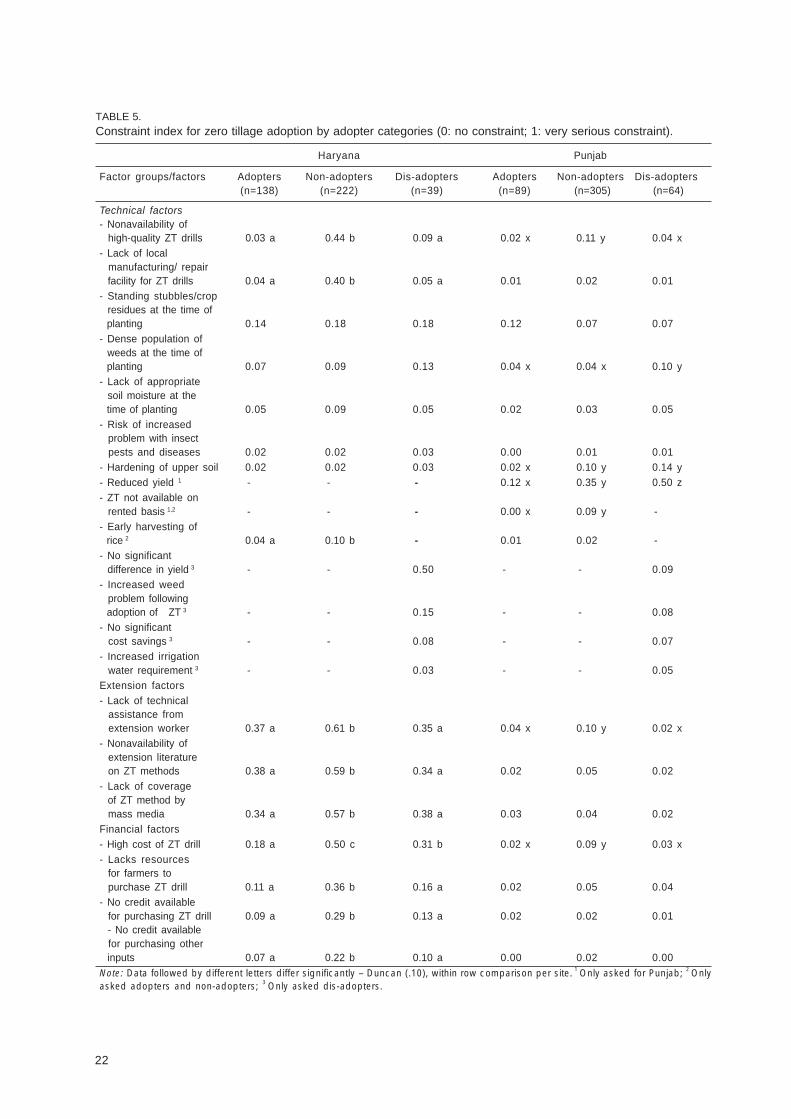
Each household was requested to rate a numberof technical, extension and financial factors interms of the degree they constrained theadoption of the ZT technology. The list of factorsto be rated was largely similar for both studysites and all households irrespective of adoptioncategory. Overall, the individual constraints weregenerally rated as less severe in Punjab than inHaryana. Therefore, instead of the absolutevalues, the relative values within each site aremore revealing. The results of the rankinganalysis are presented in table 5 and discussedsubsequently.
Technical Factors
Compared to extension and financial factors,technical factors as a group rated relatively highin terms of constraining ZT adoption in Punjab,whereas they played a relatively lesser role inHaryana (table 5). The most pressing andrevealing technical constraint is the yield of ZTrelative to CT in both study areas. The singlemost serious constraint for dis-adopters was thereduced/low yield with ZT in Punjab (constraintindex of 0.5, implying it is a moderate constraint)
and the lack of a significant difference in yield inHaryana (constraint index of 0.5), contributing totheir dis-adoption of the technology. The yieldconstraint also scored relatively high for non-adopters in Punjab, thereby adding to theirreluctance to try the technology.
The nonavailability of high-quality ZT drillswas primarily raised by non-adopters in each site.In Haryana, non-adopters also highlighted the lackof local manufacturing and/or repair facilities forZT drills. In Punjab, the nonavailability of the ZTdrill on a rental basis was solely reported bysome of the non-adopters. This suggests thatthere is still scope for further diffusion of thetechnology in both sites, and that these ZT-drill-related constraints were not related to ZT dis-adoption.
In Punjab, soil hardening was particularlyreported by non-adopters and dis-adopters, but notreally by adopters, suggesting this may either be aperceived issue or something related to thedifferences in soil types reported earlier. In Punjab,the weed problem at the time of planting wasparticularly mentioned by dis-adopters, possiblycontributing to the dis-adoption decision, perceivingtillage as a more economical means for controllingthe problem. The extension services in Punjabhave discredited ZT for the perceived danger inpest carryover in the rice stubble (particularly ricestem borer). Interestingly, the risk of increasedinsect and disease problems was ratedinsignificant by the farmers across adoptioncategories in both sites.
Extension Factors
Compared to technical and financial factors,extension factors as a group rated relatively highin terms of constraining ZT adoption in Haryana,whereas they played a relatively lesser role inPunjab (table 5). This finding is contradictory toour expectations in view of the ZT controversy inPunjab and the public support for ZT in Haryana.In part, these findings may reflect the overallmore lax scoring of constraints in Punjab and/ordivergences in interpretation. Still, the “lack oftechnical assistance from extension workers”highlighted a significant and consistent difference
22
TABLE 5.Constraint index for zero tillage adoption by adopter categories (0: no constraint; 1: very serious constraint).
Haryana Punjab
Factor groups/factors Adopters Non-adopters Dis-adopters Adopters Non-adopters Dis-adopters(n=138) (n=222) (n=39) (n=89) (n=305) (n=64)
Technical factors- Nonavailability of high-quality ZT drills 0.03 a 0.44 b 0.09 a 0.02 x 0.11 y 0.04 x- Lack of local manufacturing/ repair facility for ZT drills 0.04 a 0.40 b 0.05 a 0.01 0.02 0.01- Standing stubbles/crop residues at the time of planting 0.14 0.18 0.18 0.12 0.07 0.07- Dense population of weeds at the time of planting 0.07 0.09 0.13 0.04 x 0.04 x 0.10 y- Lack of appropriate soil moisture at the time of planting 0.05 0.09 0.05 0.02 0.03 0.05- Risk of increased problem with insect pests and diseases 0.02 0.02 0.03 0.00 0.01 0.01- Hardening of upper soil 0.02 0.02 0.03 0.02 x 0.10 y 0.14 y- Reduced yield 1 - - - 0.12 x 0.35 y 0.50 z- ZT not available on rented basis 1,2 - - - 0.00 x 0.09 y -- Early harvesting of rice 2 0.04 a 0.10 b - 0.01 0.02 -- No significant difference in yield 3 - - 0.50 - - 0.09- Increased weed problem following adoption of ZT 3 - - 0.15 - - 0.08- No significant cost savings 3 - - 0.08 - - 0.07- Increased irrigation water requirement 3 - - 0.03 - - 0.05Extension factors- Lack of technical assistance from extension worker 0.37 a 0.61 b 0.35 a 0.04 x 0.10 y 0.02 x- Nonavailability of extension literature on ZT methods 0.38 a 0.59 b 0.34 a 0.02 0.05 0.02- Lack of coverage of ZT method by mass media 0.34 a 0.57 b 0.38 a 0.03 0.04 0.02Financial factors- High cost of ZT drill 0.18 a 0.50 c 0.31 b 0.02 x 0.09 y 0.03 x- Lacks resources for farmers to purchase ZT drill 0.11 a 0.36 b 0.16 a 0.02 0.05 0.04- No credit available for purchasing ZT drill 0.09 a 0.29 b 0.13 a 0.02 0.02 0.01 - No credit available for purchasing other inputs 0.07 a 0.22 b 0.10 a 0.00 0.02 0.00Note: Data followed by different letters differ significantly – Duncan (.10), within row comparison per site. 1 Only asked for Punjab; 2 Onlyasked adopters and non-adopters; 3 Only asked dis-adopters.
23
between adoption categories in both sites. Thesame pattern emerges for the two other constraintsin Haryana (“nonavailability of extension literature onZT methods” and “lack of coverage of ZT methodby mass media”). These extension constraints wereconsistently rated highest by non-adopters,suggesting that they lacked adequate access to ZTknowledge. This suggests there is still significantscope for further enhancing ZT adoption byalleviating knowledge blockages, possibly throughfarmer to farmer extension which so far is theprevailing source of ZT information. Adopters anddis-adopters gave similar ratings for these extensionconstraints, suggesting that the knowledge of ZTtechnology was not an underlying reason for dis-adopting its use.
Financial Factors
The most serious financial constraint was theperceived high cost of the ZT drill in both sites(table 5), particularly being reported by non-adopters. However, dis-adopters in Haryana alsorated this constraint significantly higher thanadopters, suggesting this is one factor that alsocontributed to their dis-adoption of ZT. Again inHaryana, non-adopters’ ratings for the remainingthree financial indicators (in relation to resourcesand credit) were consistently highest, but therewas no significant difference between adoptersand dis-adopters. This reiterates that the non-adopters in Haryana are more resource-constrained, and that this may have contributedto their reluctance to adopt ZT so far.
A separate study suggests that ZT diffusionin the Punjab study area is constrained by thelack of financial resources, lack or untimelyavailability of ZT drills and lack of familiarityamong the smallholders (Jehangir et al. 2007).
Logit Analysis
A multivariate analysis with a logit regressionmodel allows us to include various indicators ina single adoption model to analyze their
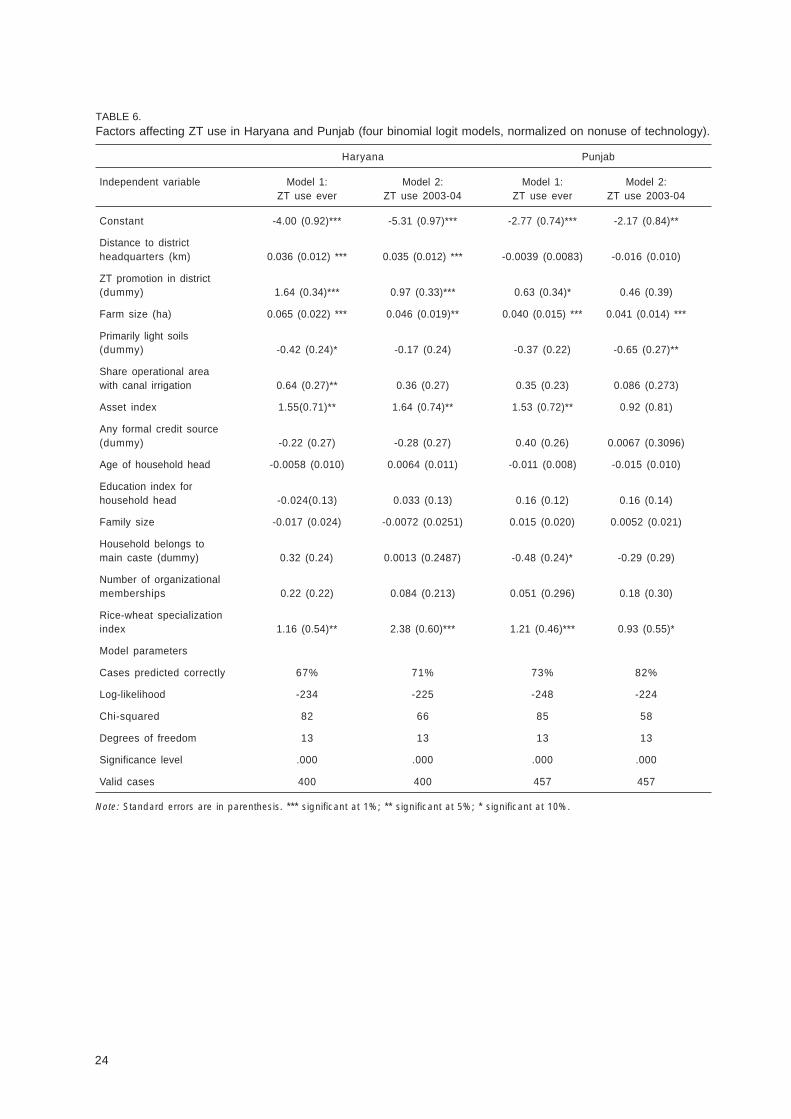
combined effect on the likelihood of ZT adoption.For each site we present two different binomiallogit models (table 6). The first model reflectsthe penetration of ZT, using as dependentvariable whether the household ever used ZT.The second model reflects the current use ofZT, using as dependent variable whether thehousehold used ZT in the survey year (2003-04).The contrasts between the two models highlightsome of the factors particularly associated withdis-adoption.
In Haryana, the binomial logit models reiteratethat ZT adoption is closely associated with ZTpromotion, remoteness, farm size, assets andrice-wheat specialization. Canal irrigationenhanced, and predominantly light soils reduced,the likelihood of trying out the technology, but didnot significantly affect the likelihood of itscontinued use.
In Punjab, the binomial logit models reiteratethat ZT adoption is again closely associated withfarm size and rice-wheat specialization. ZTpromotion, having more physical assets and notbelonging to the prevailing caste, played animportant role in trying out ZT, but less so incontinuing with its use. Conversely, predominantlylight soils reduced the likelihood of continued ZTuse. The negative role of light soils in both modelslikely reflects that these soils would be easier toplow and so the potential time saving of ZT is lessimportant since turnaround time would already befast (Hobbs pers. comm. 2007, Ithaca).
Characteristics of farm households thereforecontribute significantly to the explanation of theobserved adoption and dis-adoption patterns,given that the explanatory power of the adoptionmodels could be enhanced by including othervariables at the household, community or regionallevel. For instance, our models do not adequatelycapture some features of the ZT innovationprocess, such as local ZT champions and thefunctioning (or absence) of ZT service providers.In the end though, adoption and dis-adoption canbe expected to reflect the underlying performanceof the technology in the farmers’ fields, an issuewe explore in the next chapter.
24
TABLE 6.Factors affecting ZT use in Haryana and Punjab (four binomial logit models, normalized on nonuse of technology).
Haryana Punjab
Independent variable Model 1: Model 2: Model 1: Model 2:ZT use ever ZT use 2003-04 ZT use ever ZT use 2003-04
Constant -4.00 (0.92)*** -5.31 (0.97)*** -2.77 (0.74)*** -2.17 (0.84)**
Distance to districtheadquarters (km) 0.036 (0.012) *** 0.035 (0.012) *** -0.0039 (0.0083) -0.016 (0.010)
ZT promotion in district(dummy) 1.64 (0.34)*** 0.97 (0.33)*** 0.63 (0.34)* 0.46 (0.39)
Farm size (ha) 0.065 (0.022) *** 0.046 (0.019)** 0.040 (0.015) *** 0.041 (0.014) ***
Primarily light soils(dummy) -0.42 (0.24)* -0.17 (0.24) -0.37 (0.22) -0.65 (0.27)**
Share operational areawith canal irrigation 0.64 (0.27)** 0.36 (0.27) 0.35 (0.23) 0.086 (0.273)
Asset index 1.55(0.71)** 1.64 (0.74)** 1.53 (0.72)** 0.92 (0.81)
Any formal credit source(dummy) -0.22 (0.27) -0.28 (0.27) 0.40 (0.26) 0.0067 (0.3096)
Age of household head -0.0058 (0.010) 0.0064 (0.011) -0.011 (0.008) -0.015 (0.010)
Education index forhousehold head -0.024(0.13) 0.033 (0.13) 0.16 (0.12) 0.16 (0.14)
Family size -0.017 (0.024) -0.0072 (0.0251) 0.015 (0.020) 0.0052 (0.021)
Household belongs tomain caste (dummy) 0.32 (0.24) 0.0013 (0.2487) -0.48 (0.24)* -0.29 (0.29)
Number of organizationalmemberships 0.22 (0.22) 0.084 (0.213) 0.051 (0.296) 0.18 (0.30)
Rice-wheat specializationindex 1.16 (0.54)** 2.38 (0.60)*** 1.21 (0.46)*** 0.93 (0.55)*
Model parameters
Cases predicted correctly 67% 71% 73% 82%
Log-likelihood -234 -225 -248 -224
Chi-squared 82 66 85 58
Degrees of freedom 13 13 13 13
Significance level .000 .000 .000 .000
Valid cases 400 400 457 457
Note: Standard errors are in parenthesis. *** significant at 1%; ** significant at 5%; * significant at 10%.
25
Technical Impacts of ZT Technology
there. Although we cannot test or control for allsuch considerations, the available data at leastshow no significant difference in terms of soiltype between ZT and CT plots on adopter farms.We therefore prefer to err on the safe side andassume that the comparison between the ZTplots and CT plots of adopters is the least-biasedassessment of ZT’s impact. The first section ofthis chapter synthesizes the effects on the wheatcrop. The second section synthesizes thecarryover effects on the rice crop. The thirdsection sums up.
Wheat Crop
The CT wheat establishment practice in bothHaryana and Punjab involves intensive tractortillage and broadcasting of wheat. ZT drasticallyreduces tractor operations in farmers’ ZT wheatfields from an average of eight passes to a singlepass, implying a per ha saving of 6 and 7 tractorhours and 36 and 35 liters of diesel in Haryanaand Punjab, respectively (table 7).
Earlier diagnostic studies reported an averageof six tillage operations in Punjab (ranging from 2to 10; Byerlee et al. 1984) and eight tillageoperations in Haryana (4-8 on lighter soils and 8-12 on heavier soils; Harrington et al. 1993),followed by another tractor cultivation afterbroadcasting. Our study highlights that the currentCT practices do not deviate much from the earlierstudies. It was only in Haryana that mechanizedsowing had gained ground, being now reported in32 percent of CT fields, whereas broadcastingstill prevailed in Punjab. The total number oftillage operations in CT wheat plots (including anycultivation to cover broadcast seed) also did notvary between the two study areas (8.2 in Haryanaand 8.1 in Punjab), soil types or adoptercategories. Therefore, contrary to expectations,the diffusion of ZT has, so far, not resulted in anyreduction in “conventional” tillage intensity.
The ZT-induced time savings in landpreparation did not translate into a timelier
On-station and on-farm trials with ZT wheat in therice-wheat systems of the IGP have shownprimarily positive impacts on wheat-cropmanagement, particularly through reduced inputneeds combined with potential yield increases(Hobbs and Gupta 2003b; Laxmi et al. 2007;Malik et al. 2002a; Malik et al. 2005a). At thesame time, no major carryover effects on thesubsequent rice are reported (Inayatullah et al.1989; Srivastava et al. 2005). This chapterpresents the technical impacts of ZT technologyin farmers’ fields, by synthesizing survey resultsof how the farmers’ use of ZT has reportedlyaffected crop management and productivity of therice-wheat system. In doing so, we will primarilycontrast the ZT fields and CT fields on adopterfarms in the two study sites. The detailed countrystudies also present the information for the CTfields of non-adopters and dis-adopters (Erensteinet al. 2007a; Farooq et al. 2007). The previouschapter has highlighted significant differences atthe household level that helped explain the dis-adoption decision, but these were also found tosignificantly influence crop managementpractices, yields and water productivity (Erensteinet al. 2007a; Farooq et al. 2007). Adopters anddis-adopters may have adapted their“conventional” crop management practices afterhaving used ZT. However, contrasting our“conventional” data with earlier diagnostic studies(Byerlee et al. 1984; Harrington et al. 1993)suggests that this is not the case. Furthermore,in the absence of a real baseline, we cannotunambiguously establish causality. Partial ZTadoption prevails and thereby enables us to limitourselves to adopter farms, but this may alsointroduce a new bias. Partial adopters havepurposively chosen to apply ZT to one field andCT to another in the survey year. Typically, suchchoice is influenced by a number ofconsiderations and field characteristics. Forinstance, a partial adopter may be using ZT onrelatively less-productive soils and CT on betterones because ZT is still under evaluation in theearly adoption phase and/or CT performs poorly
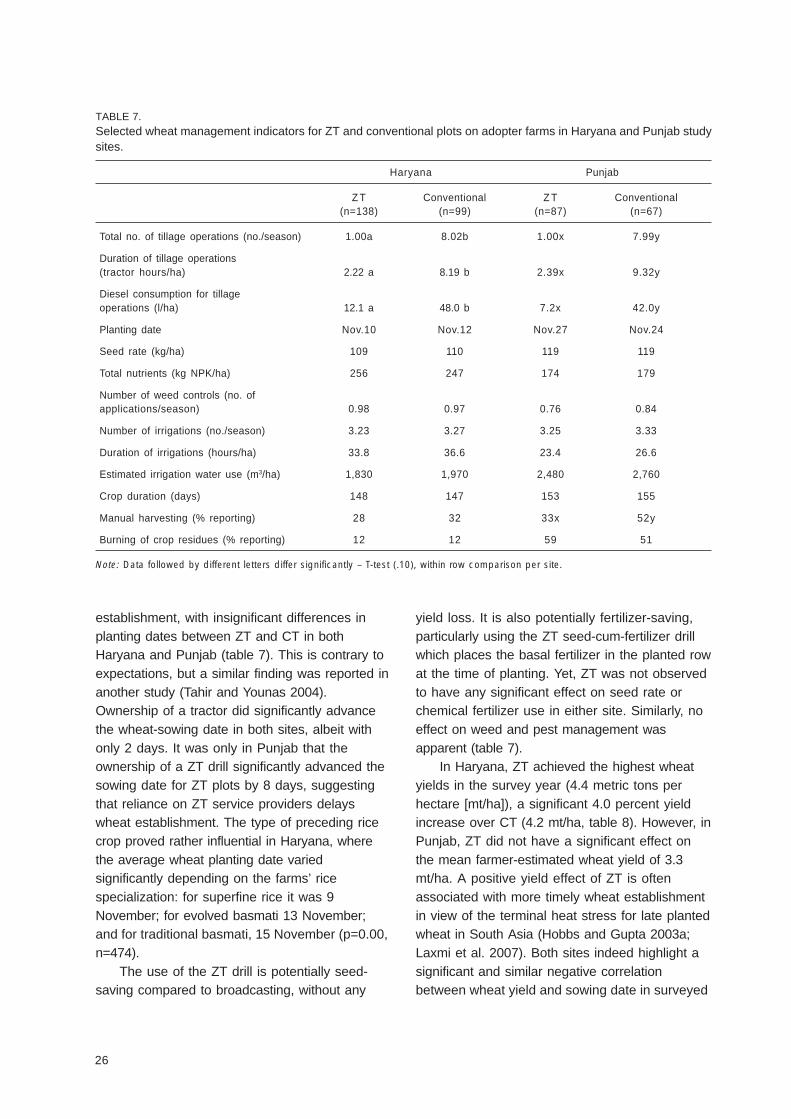
26
TABLE 7.Selected wheat management indicators for ZT and conventional plots on adopter farms in Haryana and Punjab studysites.
Haryana Punjab
Z T Conventional Z T Conventional(n=138) (n=99) (n=87) (n=67)
Total no. of tillage operations (no./season) 1.00a 8.02b 1.00x 7.99y
Duration of tillage operations(tractor hours/ha) 2.22 a 8.19 b 2.39x 9.32y
Diesel consumption for tillageoperations (l/ha) 12.1 a 48.0 b 7.2x 42.0y
Planting date Nov.10 Nov.12 Nov.27 Nov.24
Seed rate (kg/ha) 109 110 119 119
Total nutrients (kg NPK/ha) 256 247 174 179
Number of weed controls (no. ofapplications/season) 0.98 0.97 0.76 0.84
Number of irrigations (no./season) 3.23 3.27 3.25 3.33
Duration of irrigations (hours/ha) 33.8 36.6 23.4 26.6
Estimated irrigation water use (m3/ha) 1,830 1,970 2,480 2,760
Crop duration (days) 148 147 153 155
Manual harvesting (% reporting) 28 32 33x 52y
Burning of crop residues (% reporting) 12 12 59 51
Note: Data followed by different letters differ significantly – T-test (.10), within row comparison per site.
establishment, with insignificant differences inplanting dates between ZT and CT in bothHaryana and Punjab (table 7). This is contrary toexpectations, but a similar finding was reported inanother study (Tahir and Younas 2004).Ownership of a tractor did significantly advancethe wheat-sowing date in both sites, albeit withonly 2 days. It was only in Punjab that theownership of a ZT drill significantly advanced thesowing date for ZT plots by 8 days, suggestingthat reliance on ZT service providers delayswheat establishment. The type of preceding ricecrop proved rather influential in Haryana, wherethe average wheat planting date variedsignificantly depending on the farms’ ricespecialization: for superfine rice it was 9November; for evolved basmati 13 November;and for traditional basmati, 15 November (p=0.00,n=474).
The use of the ZT drill is potentially seed-saving compared to broadcasting, without any
yield loss. It is also potentially fertilizer-saving,particularly using the ZT seed-cum-fertilizer drillwhich places the basal fertilizer in the planted rowat the time of planting. Yet, ZT was not observedto have any significant effect on seed rate orchemical fertilizer use in either site. Similarly, noeffect on weed and pest management wasapparent (table 7).
In Haryana, ZT achieved the highest wheatyields in the survey year (4.4 metric tons perhectare [mt/ha]), a significant 4.0 percent yieldincrease over CT (4.2 mt/ha, table 8). However, inPunjab, ZT did not have a significant effect onthe mean farmer-estimated wheat yield of 3.3mt/ha. A positive yield effect of ZT is oftenassociated with more timely wheat establishmentin view of the terminal heat stress for late plantedwheat in South Asia (Hobbs and Gupta 2003a;Laxmi et al. 2007). Both sites indeed highlight asignificant and similar negative correlationbetween wheat yield and sowing date in surveyed
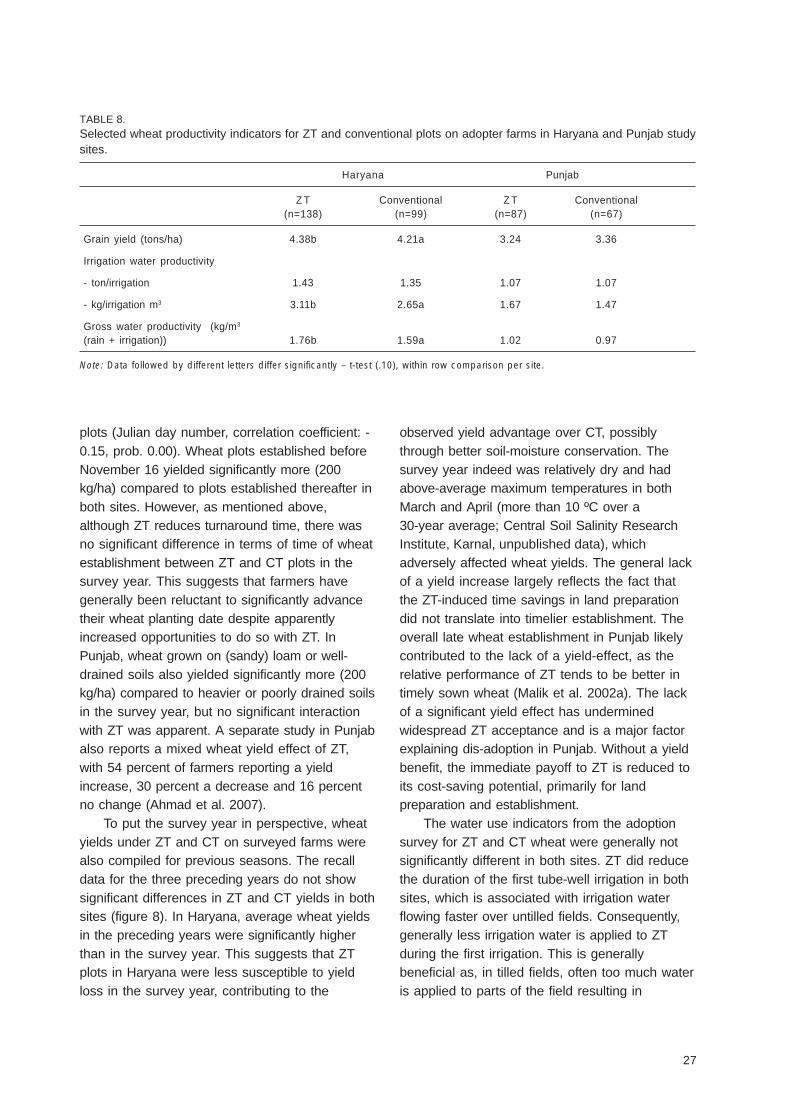
27
plots (Julian day number, correlation coefficient: -0.15, prob. 0.00). Wheat plots established beforeNovember 16 yielded significantly more (200kg/ha) compared to plots established thereafter inboth sites. However, as mentioned above,although ZT reduces turnaround time, there wasno significant difference in terms of time of wheatestablishment between ZT and CT plots in thesurvey year. This suggests that farmers havegenerally been reluctant to significantly advancetheir wheat planting date despite apparentlyincreased opportunities to do so with ZT. InPunjab, wheat grown on (sandy) loam or well-drained soils also yielded significantly more (200kg/ha) compared to heavier or poorly drained soilsin the survey year, but no significant interactionwith ZT was apparent. A separate study in Punjabalso reports a mixed wheat yield effect of ZT,with 54 percent of farmers reporting a yieldincrease, 30 percent a decrease and 16 percentno change (Ahmad et al. 2007).
To put the survey year in perspective, wheatyields under ZT and CT on surveyed farms werealso compiled for previous seasons. The recalldata for the three preceding years do not showsignificant differences in ZT and CT yields in bothsites (figure 8). In Haryana, average wheat yieldsin the preceding years were significantly higherthan in the survey year. This suggests that ZTplots in Haryana were less susceptible to yieldloss in the survey year, contributing to the
observed yield advantage over CT, possiblythrough better soil-moisture conservation. Thesurvey year indeed was relatively dry and hadabove-average maximum temperatures in bothMarch and April (more than 10 ºC over a30-year average; Central Soil Salinity ResearchInstitute, Karnal, unpublished data), whichadversely affected wheat yields. The general lackof a yield increase largely reflects the fact thatthe ZT-induced time savings in land preparationdid not translate into timelier establishment. Theoverall late wheat establishment in Punjab likelycontributed to the lack of a yield-effect, as therelative performance of ZT tends to be better intimely sown wheat (Malik et al. 2002a). The lackof a significant yield effect has underminedwidespread ZT acceptance and is a major factorexplaining dis-adoption in Punjab. Without a yieldbenefit, the immediate payoff to ZT is reduced toits cost-saving potential, primarily for landpreparation and establishment.
The water use indicators from the adoptionsurvey for ZT and CT wheat were generally notsignificantly different in both sites. ZT did reducethe duration of the first tube-well irrigation in bothsites, which is associated with irrigation waterflowing faster over untilled fields. Consequently,generally less irrigation water is applied to ZTduring the first irrigation. This is generallybeneficial as, in tilled fields, often too much wateris applied to parts of the field resulting in
TABLE 8.Selected wheat productivity indicators for ZT and conventional plots on adopter farms in Haryana and Punjab studysites.
Haryana Punjab
Z T Conventional Z T Conventional(n=138) (n=99) (n=87) (n=67)
Grain yield (tons/ha) 4.38b 4.21a 3.24 3.36
Irrigation water productivity
- ton/irrigation 1.43 1.35 1.07 1.07
- kg/irrigation m3 3.11b 2.65a 1.67 1.47
Gross water productivity (kg/m3
(rain + irrigation)) 1.76b 1.59a 1.02 0.97
Note: Data followed by different letters differ significantly – t-test (.10), within row comparison per site.
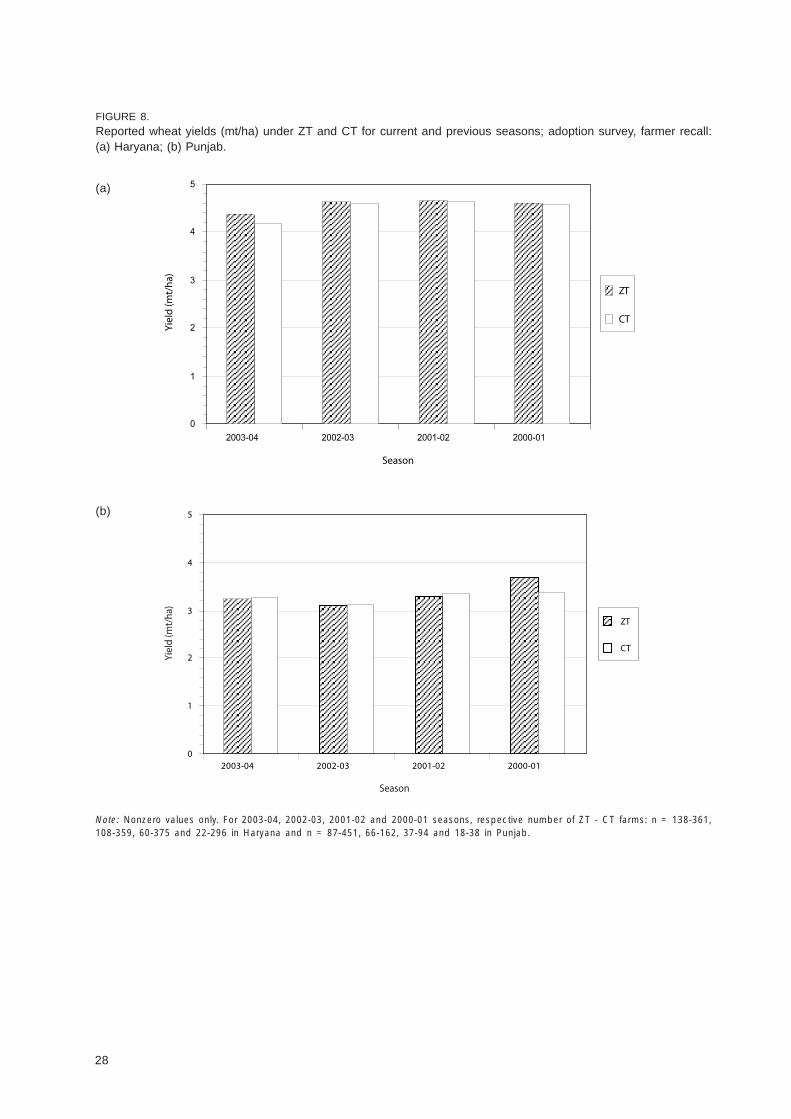
28
FIGURE 8.Reported wheat yields (mt/ha) under ZT and CT for current and previous seasons; adoption survey, farmer recall:(a) Haryana; (b) Punjab.
Note: Nonzero values only. For 2003-04, 2002-03, 2001-02 and 2000-01 seasons, respective number of ZT - CT farms: n = 138-361,108-359, 60-375 and 22-296 in Haryana and n = 87-451, 66-162, 37-94 and 18-38 in Punjab.
0
1
2
3
4
5
2003-04 2002-03 2001-02 2000-01
Season
Yie
ld (m
t/h
a)
ZT
CT
0
1
2
3
4
5
2003-04 2002-03 2001-02 2000-01
Season
Yiel
d (m
t/ha
)
ZT
CT
(a)
(b)
29
and 0.9 weedings, respectively, typically aherbicide application) and seed rate (109 and 117kg/ha of seed, respectively). Wheat establishmentis timelier in Haryana (12 November on average)than in Punjab (26 November). However, chemicalfertilizer use is significantly higher in Haryana(246 kg/ha of fertilizer-nutrients, 187:58:1 against179 kg/ha of fertilizer-nutrients, 115:61:1). Manualharvesting was less common in Haryana (43% ofplots, remainder combined) than in Punjab (52%of plots, remainder combined and reaped).Compared to Punjab, wheat straw removal inHaryana was more widespread (reported as 74%against 98% plots, respectively) and burning ofwheat residues was less common (45% against11%, respectively). The survey results also flagthe risky prevalence of one single wheat varietyin each area, with PBW 343 being reported in 89percent of the wheat plots in Haryana andInqalab-91 being reported in 69 percent of plots inPunjab. The prevalence of a single variety overlarge areas is worrying in view of the underlyingrisk from any resistance breakdown. This hasbecome even more pressing in view of theirsusceptibility to, and advent of, the virulent newstem rust for wheat (UG99, Mackenzie 2007;Raloff 2005).
Mean farmer-estimated wheat yields (allsurveyed plots) in Haryana (4.2 mt/ha) aresubstantially higher than in Punjab (3.3 mt/ha), adifferential that is likely associated with the laterwheat establishment and lower fertilizer use inPunjab and agro-ecological differences. Across allsurveyed plots, water productivity was estimatedto average 2.5 kg of wheat per irrigation m3 and1.5 kg of wheat per gross m3 in Haryana, whereasthe same indicators for Punjab were 1.5 kg and1.0 kg of wheat, respectively. The lower waterproductivity in Punjab is the combined result oflower wheat yields and larger water input.
Rice Crop
The prevailing practice in both Haryana andPunjab is to transplant rice in puddled fields andkeep the fields ponded. ZT wheat did not haveany significant spillover effect in terms of
waterlogging and yellowing of wheat plants.However, in neither site did ZT have anysignificant effect on the total number of irrigations(3.4/season), duration of subsequent and totalirrigations and the estimated irrigation volume(table 7). The higher yield in combination with thelimited water savings still results in significantlyhigher water productivity indicators for ZT wheatcompared to CT wheat in Haryana (table 8). Therelatively similar yields in the survey year,combined with the relatively modest irrigationsavings by ZT, imply that water productivityindicators are generally not significantly differentfrom CT in Punjab (table 8).
The results therefore provide some support tothe postulated water saving nature of ZT. Still oneshould realize that the results presented hererelate to survey findings, which are subject tofarmer recall and where we cannot control for allunderlying sources of variation. Theseconfounding effects may mask some of the ZTtechnology effects, if any. A separate water usesurvey conducted within the context of theHaryana study indeed showed more significantwater savings attributable to ZT than thoseobserved in the adoption survey (Erenstein et al.2007a).This survey confirmed that ZT for wheatsaves irrigation time (6.4 hours/ha/season), savesirrigation water (340 m3/ha/season) and enhanceswheat yield (260 kg/ha), but ZT again did notsignificantly reduce the number of irrigations.According to the same survey, total tube-wellwater volume applied to ZT amounted to 2,200 m3
compared to 2,500 m3 for CT, a statisticallysignificant water saving of 13.4 percent whichwas primarily achieved in the first irrigation. Thisimplied significantly higher water productivityindicators for ZT wheat (1.5 kg/gross m3)compared to CT wheat (1.3 kg/gross m3, p.:0.00)in Haryana.
The discussion so far focused on the specificcontrast between ZT and CT in the two studysites. The available data however also highlightsome similarities and contrasts between the twosites. On average, across all surveyed plots,Haryana and Punjab reported relatively similarwheat management practices, for instance interms of CT practices, weedings (1.0 weeding
30
after transplanting vs. 123 days for both varietiesof basmati) and is transplanted earlier, therebyvacating the field 3 weeks earlier than traditionalbasmati. These varietal groups had a markedeffect on rice-management practices (e.g.,nutrient, water, harvest; Erenstein et al. 2007a).Superfine rice is also higher yielding (5.9 mt/ha)than evolved basmati (4.5 mt/ha) or traditionalbasmati (2.6 mt/ha) and has the highest physicalwater productivity (0.5 kg/ irrigation m3 and 0.3kg/gross m3). In Punjab, super basmati is theprevailing rice variety reported in 88 percent ofplots and has a similar yield as the other basmativarieties being reported for the remaining plots.Super basmati is late maturing (130 days aftertransplanting vs. 123 days for other varieties) andis transplanted late, thereby vacating the fieldnearly 2 weeks later than the other varieties, andthus highly conflicting with optimum wheatsowing. ZT potentially reduces the turnaroundtime between rice and wheat. One might thusexpect a positive association between ricevarieties that vacate the field late and the use ofZT wheat. However, no significant associationwas found, except for traditional basmati beingless commonly cultivated by dis-adopters inHaryana (which may thus have reduced the needto continue with ZT).
Harvesting rice mechanically with a combineharvester is markedly more common in Punjab(79% of plots) than in Haryana (38%) in thesurvey year. This is associated with the ricevarieties being grown. In Haryana, superfine riceis predominantly combine harvested (82% ofplots), whereas the basmati varieties wereuniversally hand-harvested for a number ofreasons, including the tendency of its long grainsto break, being more prone to lodging (reducingthe effectiveness of mechanical harvesting),smaller field sizes and more intensive residueuse (Erenstein et al. 2007d). In Punjab, superbasmati is typically combine harvested (81%)whereas this is less common for the otherbasmati varieties (55%). The popularity ofcombine harvesting of rice in Punjab is alsoassociated with the larger farm size, limitedturnaround time between rice and wheat and the
affecting crop management, yield and waterproductivity of subsequent rice crop in bothHaryana and Punjab. Most significant differencesbetween surveyed rice plots reflect structuraldifferences between adopters and non-adopters(Erenstein et al. 2007a; Farooq et al. 2007).Actual differences between rice plots after ZTwheat and rice plots after CT wheat for adopterswere typically not significant (table 9; table 10).One exception was the above-average pesticideuse in rice after ZT wheat plots in Punjab (appliedto 92% of ZT plots compared to 83% of CTplots).
Surveyed rice crop management indicators forHaryana and Punjab (all surveyed plots) included:
• Tillage operations (average of 5.3 and 9.1/season in Haryana and Punjab, respectively).
• Seed rate (11 and 8.8 kg/ha of seed,respectively).
• Chemical fertilizer use (204 kg/ha of fertilizer-nutrients, 156:44:4 and 132 kg/ha, 98:34:0,respectively).
• Weed management (1.7 and 0.9 weedings,respectively).
• Pesticide use (89% and 83% of plots,respectively).
• Irrigation (34 and 35 irrigations/season,respectively).
• Harvesting practices (62% and 21% manual,respectively).Various rice-management practices thus differ
substantially between Haryana and Punjab. As inthe case of wheat, Haryana has a substantiallyhigher chemical fertilizer use. Tillage for rice ismarkedly more intensive for Punjab, whereasHaryana tends to do more weedings. In bothsites, chemical weed control is the dominantmethod, but in Haryana this is oftensupplemented by a manual weed control.
In Haryana, three groups of high-quality ricevarieties were reported in the surveyed rice plots:superfine rice varieties (46.5% of plots), evolvedbasmati (30.2%) and traditional basmati (23.2%).Superfine rice is of shorter duration (117 days
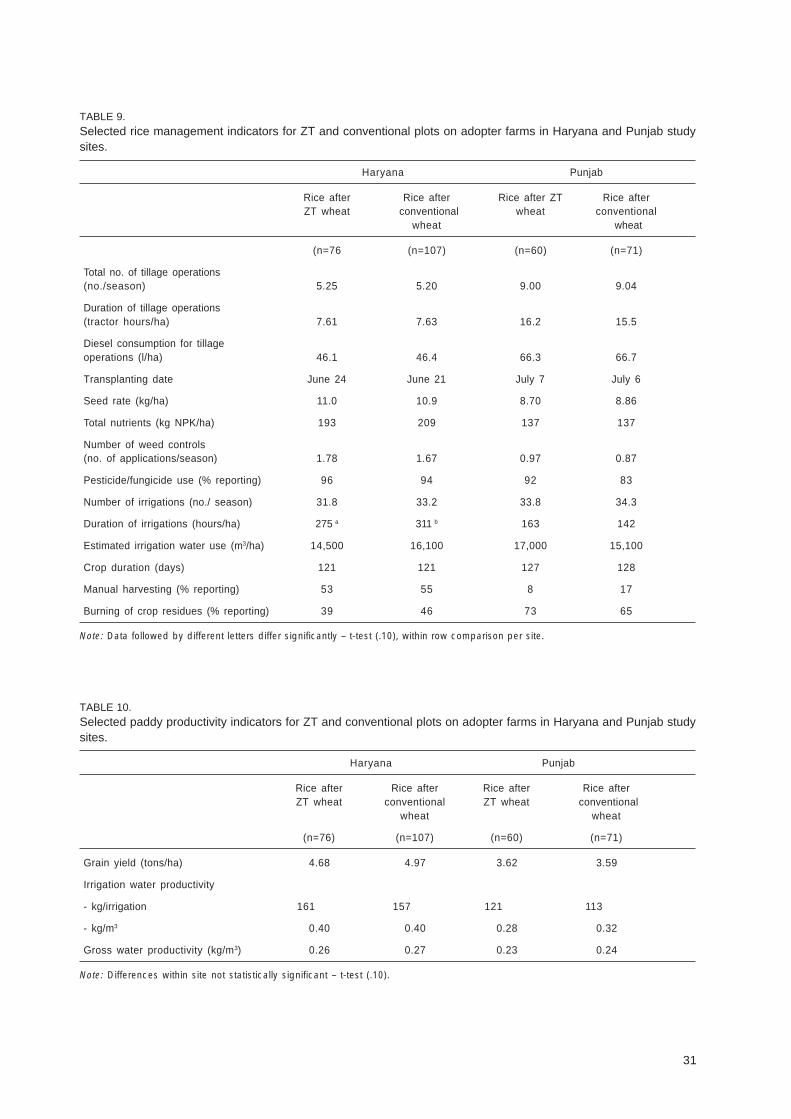
31
TABLE 9.Selected rice management indicators for ZT and conventional plots on adopter farms in Haryana and Punjab studysites.
Haryana Punjab
Rice after Rice after Rice after ZT Rice afterZT wheat conventional wheat conventional
wheat wheat
(n=76 (n=107) (n=60) (n=71)
Total no. of tillage operations(no./season) 5.25 5.20 9.00 9.04
Duration of tillage operations(tractor hours/ha) 7.61 7.63 16.2 15.5
Diesel consumption for tillageoperations (l/ha) 46.1 46.4 66.3 66.7
Transplanting date June 24 June 21 July 7 July 6
Seed rate (kg/ha) 11.0 10.9 8.70 8.86
Total nutrients (kg NPK/ha) 193 209 137 137
Number of weed controls(no. of applications/season) 1.78 1.67 0.97 0.87
Pesticide/fungicide use (% reporting) 96 94 92 83
Number of irrigations (no./ season) 31.8 33.2 33.8 34.3
Duration of irrigations (hours/ha) 275 a 311 b 163 142
Estimated irrigation water use (m3/ha) 14,500 16,100 17,000 15,100
Crop duration (days) 121 121 127 128
Manual harvesting (% reporting) 53 55 8 17
Burning of crop residues (% reporting) 39 46 73 65
Note: Data followed by different letters differ significantly – t-test (.10), within row comparison per site.
TABLE 10.Selected paddy productivity indicators for ZT and conventional plots on adopter farms in Haryana and Punjab studysites.
Haryana Punjab
Rice after Rice after Rice after Rice afterZT wheat conventional ZT wheat conventional
wheat wheat
(n=76) (n=107) (n=60) (n=71)
Grain yield (tons/ha) 4.68 4.97 3.62 3.59
Irrigation water productivity
- kg/irrigation 161 157 121 113
- kg/m3 0.40 0.40 0.28 0.32
Gross water productivity (kg/m3) 0.26 0.27 0.23 0.24
Note: Differences within site not statistically significant – t-test (.10).
32
fact that mean rice harvesting date is 3 weekslater than in Haryana. The latter is the combinedeffect of later rice transplanting (12 days: 6 Julyvs. 24 June in Punjab and Haryana,respectively) and longer duration of the rice crop(9 days: 129 vs. 120 days in Punjab andHaryana, respectively). Combine harvesting hasimplications for ZT. The loose residues left bythe combiner hamper the operation of theprevailing ZT drills and are typically removed orburned. Untimely rain prior to rice harvestingmay also cause combiners to cause ruts in thefields that need to be evened out through tillage.Compared to Punjab, in Haryana the removal ofrice straw from the field was less common(reported in 84% against 58% plots,respectively) and rice straw burning wasrelatively similar (56% against 47%,respectively).
The differential management practices,varieties and overall agro-ecology contribute tothe mean farmer-estimated paddy yields (allsurveyed plots) in Haryana (4.7 mt/ha) againbeing substantially higher than in Punjab (3.5 mt/ha). Water productivity was estimated to average0.34 kg of paddy per irrigation m3 and 0.23 kg ofpaddy per gross m3 for all surveyed rice plots inHaryana whereas the same indicators for Punjabwere 0.28 kg and 0.22 kg of paddy, respectively.The lower water productivity in Punjab isprimarily a reflection of the lower paddy yields,as estimated water input was relatively similar(table 9).
Water productivity indicators for rice ismarkedly lower than that for wheat, largely areflection of significantly higher water inputs in
paddy cultivation so as to maintain standingwater in the paddies during the hot monsoonalseason with relatively similar yields. Ricecultivation practices also differ from wheat interms of:
• Intensity of land preparation (in Haryana lesstractor passes but including wet cultivation; inPunjab one more tractor pass and wetcultivation).
• Fertilization practices (less inorganic fertilizeruse and more farmyard manure).
• Pesticide use (near-universal).
• Harvesting practices (less reliance oncombine harvesting in Haryana; wider relianceon combine harvesting in Punjab).
In Sum
The underlying studies cannot unambiguouslyconfirm that the generally favorableimplications of ZT in terms of enhancing wheatyield and saving water reported in trials arealso achieved in farmers’ fields. It was only inHaryana that ZT had significant positiveeffects on yield and water productivity for thewheat crop in the survey year. Both studiesconcur in that there were no significant effectson yield and water productivity for thesubsequent rice crop. Both studies alsoconfirmed the drastic reduction in tractor timeand diesel use in wheat land preparation andestablishment, which imply substantial costsavings.
33
primarily a reflection of the higher land rent ($126difference). Due to the relatively low net returns inHaryana the average net-revenue-based waterproductivities thereby amount to only $0.033 perirrigation m3 and $0.017 per gross m3, whereasthe corresponding values for Punjab are $0.069and 0.044, respectively.
ZT plots in Haryana show significantly lowertotal costs and significantly higher gross and netrevenues. Compared to the CT plots of adopters,ZT shows a conclusive net advantage of $69 perha in the survey year, composed of a “yieldeffect” of $26 and a “cost saving effect” of $43(table 11). The ZT-induced cost saving issubstantial, and represents a saving of 7.0percent on total costs, or 15.3 percent onoperational costs (excluding land). The relativelyminor net revenues derived from wheat cultivationunderscore the need for continued yieldenhancement and cost savings to maintain wheatcompetitiveness in rice-wheat systems. It alsohighlights the relative significance of the ZT-induced income enhancement, which boostsreturns well above breakeven. Indeed, 92 percentof ZT plots had positive net revenues. ZT plotsthereby achieved a significantly higher return onproduction costs (17%) and significantly higherestimates for net-revenue-based waterproductivities ($0.08/ irrigation m3 and $0.042/gross m3 - table 12). The combination of asignificant “yield effect” and “cost saving effect”makes ZT adoption worthwhile and is the maindriver behind the rapid spread and widespreadacceptance of ZT in Haryana.
The difference between ZT and CT plots inPunjab is less pronounced and therefore lessconclusive. Gross revenue does not significantlydiffer between wheat plots, but compared to non-adopters and dis-adopters, adopters achievedsignificantly lower total costs and higher netrevenues in both their ZT and CT plots.Compared to the CT plots of adopters, ZT doesimply a significant cost-saving effect of $45 perha, but this was partially annulled by anonsignificant negative yield effect of $20,
Financial Impacts of ZT Technology
The financial implications of a new technology area major determinant of technological change. Theon-station and on-farm trials with ZT wheat in therice-wheat systems of the IGP do not alwaysinclude a financial analysis (Laxmi et al. 2007;Malik et al. 2002a; Malik et al. 2005a). But inthose where such an analysis was included,results are generally very favorable for ZT due tothe combined “yield-enhancement effect” and“cost-saving effect” (e.g., Laxmi et al. 2007; Maliket al. 2005a). Most financial analyses are basedon partial budgets, and typically limited to thewheat crop.
The previous chapter reviewed the technicalimpact of ZT in terms of crop management andproductivity for both the wheat crop and thesubsequent rice crop. The present chapter puts amonetary value on the observed changes andthereby allows us to aggregate the observedtechnical impacts and assess the financial impactof ZT at the individual crop and plot levels. Thefirst section of this chapter reviews the ZTeffects on the wheat-crop budget. The secondsection reviews the carryover effects on the rice-crop budget. The third section aggregates thewheat- and rice-crop budget effects to derive thecrop-system effects at the plot level.
Wheat Profitability
On an average hectare basis (across all surveyedplots), wheat production implies a gross revenueof $654 and 581, total costs of $619 and 473and a net revenue of $36 and 108 in Haryana andPunjab, respectively (Erenstein et al. 2007a;Farooq et al. 2007). This implies an averagereturn of 6 percent and 23 percent to productioncosts, with 68 percent and 81 percent of wheatplots having positive net revenues in Haryana andPunjab, respectively. Although yields and grossrevenue are higher in Haryana, this is annulled bythe higher production costs resulting in moremeager returns to wheat production. The higherproduction costs in Haryana ($146 difference) are
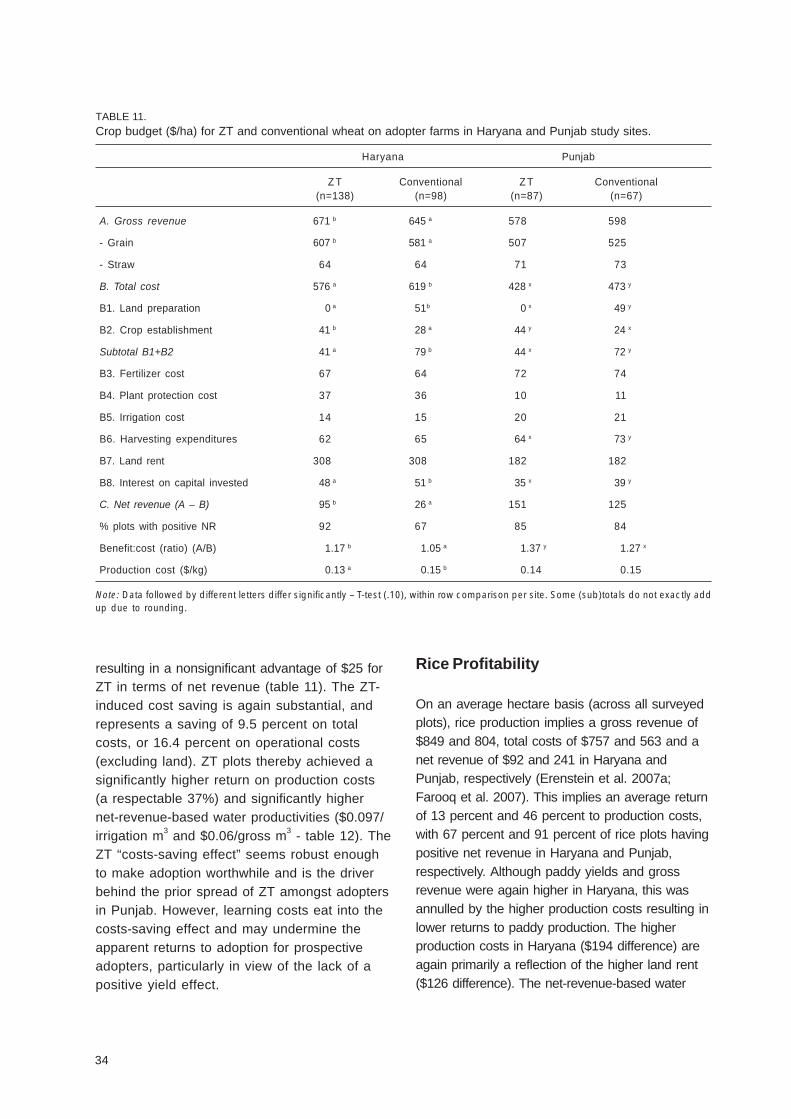
34
resulting in a nonsignificant advantage of $25 forZT in terms of net revenue (table 11). The ZT-induced cost saving is again substantial, andrepresents a saving of 9.5 percent on totalcosts, or 16.4 percent on operational costs(excluding land). ZT plots thereby achieved asignificantly higher return on production costs(a respectable 37%) and significantly highernet-revenue-based water productivities ($0.097/irrigation m3 and $0.06/gross m3 - table 12). TheZT “costs-saving effect” seems robust enoughto make adoption worthwhile and is the driverbehind the prior spread of ZT amongst adoptersin Punjab. However, learning costs eat into thecosts-saving effect and may undermine theapparent returns to adoption for prospectiveadopters, particularly in view of the lack of apositive yield effect.
TABLE 11.Crop budget ($/ha) for ZT and conventional wheat on adopter farms in Haryana and Punjab study sites.
Haryana Punjab
Z T Conventional Z T Conventional(n=138) (n=98) (n=87) (n=67)
A. Gross revenue 671 b 645 a 578 598
- Grain 607 b 581 a 507 525
- Straw 64 64 71 73
B. Total cost 576 a 619 b 428 x 473 y
B1. Land preparation 0 a 51b 0 x 49 y
B2. Crop establishment 41 b 28 a 44 y 24 x
Subtotal B1+B2 41 a 79 b 44 x 72 y
B3. Fertilizer cost 67 64 72 74
B4. Plant protection cost 37 36 10 11
B5. Irrigation cost 14 15 20 21
B6. Harvesting expenditures 62 65 64 x 73 y
B7. Land rent 308 308 182 182
B8. Interest on capital invested 48 a 51 b 35 x 39 y
C. Net revenue (A – B) 95 b 26 a 151 125
% plots with positive NR 92 67 85 84
Benefit:cost (ratio) (A/B) 1.17 b 1.05 a 1.37 y 1.27 x
Production cost ($/kg) 0.13 a 0.15 b 0.14 0.15
Note: Data followed by different letters differ significantly – T-test (.10), within row comparison per site. Some (sub)totals do not exactly addup due to rounding.
Rice Profitability
On an average hectare basis (across all surveyedplots), rice production implies a gross revenue of$849 and 804, total costs of $757 and 563 and anet revenue of $92 and 241 in Haryana andPunjab, respectively (Erenstein et al. 2007a;Farooq et al. 2007). This implies an average returnof 13 percent and 46 percent to production costs,with 67 percent and 91 percent of rice plots havingpositive net revenue in Haryana and Punjab,respectively. Although paddy yields and grossrevenue were again higher in Haryana, this wasannulled by the higher production costs resulting inlower returns to paddy production. The higherproduction costs in Haryana ($194 difference) areagain primarily a reflection of the higher land rent($126 difference). The net-revenue-based water
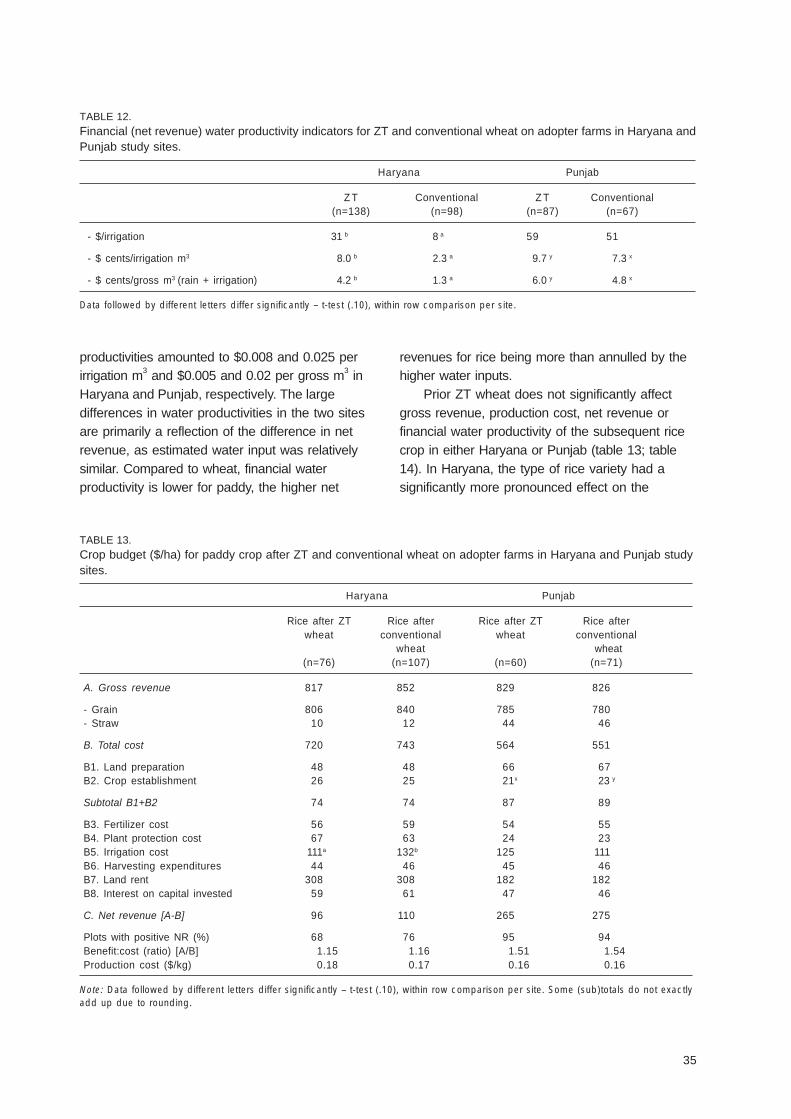
35
productivities amounted to $0.008 and 0.025 perirrigation m3 and $0.005 and 0.02 per gross m3 inHaryana and Punjab, respectively. The largedifferences in water productivities in the two sitesare primarily a reflection of the difference in netrevenue, as estimated water input was relativelysimilar. Compared to wheat, financial waterproductivity is lower for paddy, the higher net
TABLE 12.Financial (net revenue) water productivity indicators for ZT and conventional wheat on adopter farms in Haryana andPunjab study sites.
Haryana Punjab
Z T Conventional Z T Conventional(n=138) (n=98) (n=87) (n=67)
- $/irrigation 31 b 8 a 59 51
- $ cents/irrigation m3 8.0 b 2.3 a 9.7 y 7.3 x
- $ cents/gross m3 (rain + irrigation) 4.2 b 1.3 a 6.0 y 4.8 x
Data followed by different letters differ significantly – t-test (.10), within row comparison per site.
revenues for rice being more than annulled by thehigher water inputs.
Prior ZT wheat does not significantly affectgross revenue, production cost, net revenue orfinancial water productivity of the subsequent ricecrop in either Haryana or Punjab (table 13; table14). In Haryana, the type of rice variety had asignificantly more pronounced effect on the
TABLE 13.Crop budget ($/ha) for paddy crop after ZT and conventional wheat on adopter farms in Haryana and Punjab studysites.
Haryana Punjab
Rice after ZT Rice after Rice after ZT Rice afterwheat conventional wheat conventional
wheat wheat(n=76) (n=107) (n=60) (n=71)
A. Gross revenue 817 852 829 826
- Grain 806 840 785 780- Straw 10 12 44 46
B. Total cost 720 743 564 551
B1. Land preparation 48 48 66 67B2. Crop establishment 26 25 21x 23 y
Subtotal B1+B2 74 74 87 89
B3. Fertilizer cost 56 59 54 55B4. Plant protection cost 67 63 24 23B5. Irrigation cost 111a 132b 125 111B6. Harvesting expenditures 44 46 45 46B7. Land rent 308 308 182 182B8. Interest on capital invested 59 61 47 46
C. Net revenue [A-B] 96 110 265 275
Plots with positive NR (%) 68 76 95 94Benefit:cost (ratio) [A/B] 1.15 1.16 1.51 1.54Production cost ($/kg) 0.18 0.17 0.16 0.16
Note: Data followed by different letters differ significantly – t-test (.10), within row comparison per site. Some (sub)totals do not exactlyadd up due to rounding.
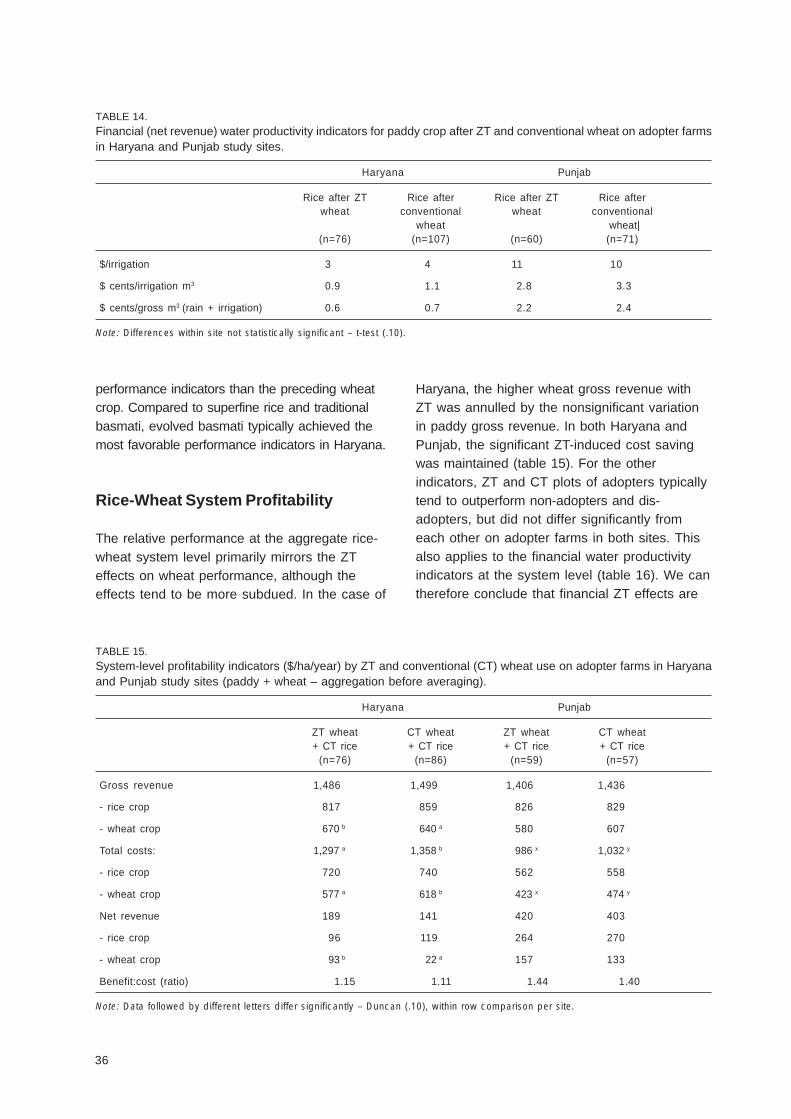
36
performance indicators than the preceding wheatcrop. Compared to superfine rice and traditionalbasmati, evolved basmati typically achieved themost favorable performance indicators in Haryana.
Rice-Wheat System Profitability
The relative performance at the aggregate rice-wheat system level primarily mirrors the ZTeffects on wheat performance, although theeffects tend to be more subdued. In the case of
Haryana, the higher wheat gross revenue withZT was annulled by the nonsignificant variationin paddy gross revenue. In both Haryana andPunjab, the significant ZT-induced cost savingwas maintained (table 15). For the otherindicators, ZT and CT plots of adopters typicallytend to outperform non-adopters and dis-adopters, but did not differ significantly fromeach other on adopter farms in both sites. Thisalso applies to the financial water productivityindicators at the system level (table 16). We cantherefore conclude that financial ZT effects are
TABLE 15.System-level profitability indicators ($/ha/year) by ZT and conventional (CT) wheat use on adopter farms in Haryanaand Punjab study sites (paddy + wheat – aggregation before averaging).
Haryana Punjab
ZT wheat CT wheat ZT wheat CT wheat+ CT rice + CT rice + CT rice + CT rice
(n=76) (n=86) (n=59) (n=57)
Gross revenue 1,486 1,499 1,406 1,436
- rice crop 817 859 826 829
- wheat crop 670 b 640 a 580 607
Total costs: 1,297 a 1,358 b 986 x 1,032 y
- rice crop 720 740 562 558
- wheat crop 577 a 618 b 423 x 474 y
Net revenue 189 141 420 403
- rice crop 96 119 264 270
- wheat crop 93 b 22 a 157 133
Benefit:cost (ratio) 1.15 1.11 1.44 1.40
Note: Data followed by different letters differ significantly – Duncan (.10), within row comparison per site.
TABLE 14.Financial (net revenue) water productivity indicators for paddy crop after ZT and conventional wheat on adopter farmsin Haryana and Punjab study sites.
Haryana Punjab
Rice after ZT Rice after Rice after ZT Rice afterwheat conventional wheat conventional
wheat wheat|(n=76) (n=107) (n=60) (n=71)
$/irrigation 3 4 11 10
$ cents/irrigation m3 0.9 1.1 2.8 3.3
$ cents/gross m3 (rain + irrigation) 0.6 0.7 2.2 2.4
Note: Differences within site not statistically significant – t-test (.10).
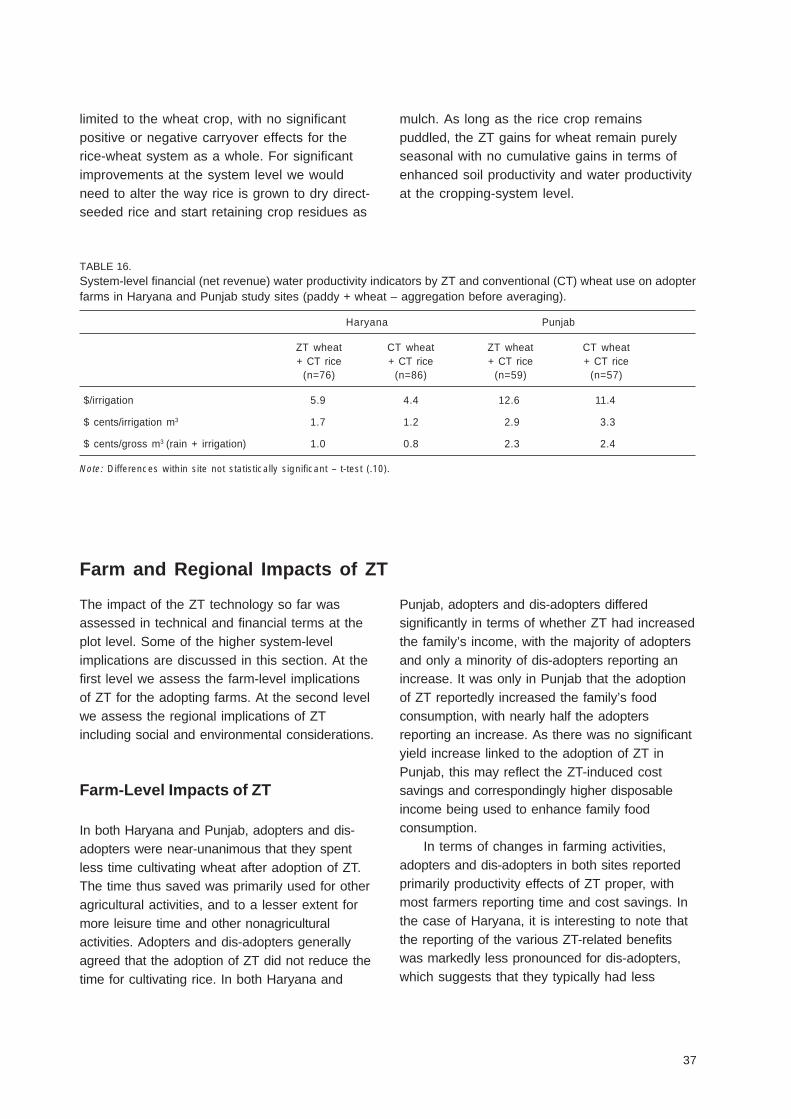
37
TABLE 16.System-level financial (net revenue) water productivity indicators by ZT and conventional (CT) wheat use on adopterfarms in Haryana and Punjab study sites (paddy + wheat – aggregation before averaging).
Haryana Punjab
ZT wheat CT wheat ZT wheat CT wheat+ CT rice + CT rice + CT rice + CT rice
(n=76) (n=86) (n=59) (n=57)
$/irrigation 5.9 4.4 12.6 11.4
$ cents/irrigation m3 1.7 1.2 2.9 3.3
$ cents/gross m3 (rain + irrigation) 1.0 0.8 2.3 2.4
Note: Differences within site not statistically significant – t-test (.10).
limited to the wheat crop, with no significantpositive or negative carryover effects for therice-wheat system as a whole. For significantimprovements at the system level we wouldneed to alter the way rice is grown to dry direct-seeded rice and start retaining crop residues as
mulch. As long as the rice crop remainspuddled, the ZT gains for wheat remain purelyseasonal with no cumulative gains in terms ofenhanced soil productivity and water productivityat the cropping-system level.
Farm and Regional Impacts of ZT
The impact of the ZT technology so far wasassessed in technical and financial terms at theplot level. Some of the higher system-levelimplications are discussed in this section. At thefirst level we assess the farm-level implicationsof ZT for the adopting farms. At the second levelwe assess the regional implications of ZTincluding social and environmental considerations.
Farm-Level Impacts of ZT
In both Haryana and Punjab, adopters and dis-adopters were near-unanimous that they spentless time cultivating wheat after adoption of ZT.The time thus saved was primarily used for otheragricultural activities, and to a lesser extent formore leisure time and other nonagriculturalactivities. Adopters and dis-adopters generallyagreed that the adoption of ZT did not reduce thetime for cultivating rice. In both Haryana and
Punjab, adopters and dis-adopters differedsignificantly in terms of whether ZT had increasedthe family’s income, with the majority of adoptersand only a minority of dis-adopters reporting anincrease. It was only in Punjab that the adoptionof ZT reportedly increased the family’s foodconsumption, with nearly half the adoptersreporting an increase. As there was no significantyield increase linked to the adoption of ZT inPunjab, this may reflect the ZT-induced costsavings and correspondingly higher disposableincome being used to enhance family foodconsumption.
In terms of changes in farming activities,adopters and dis-adopters in both sites reportedprimarily productivity effects of ZT proper, withmost farmers reporting time and cost savings. Inthe case of Haryana, it is interesting to note thatthe reporting of the various ZT-related benefitswas markedly less pronounced for dis-adopters,which suggests that they typically had less
38
successful experiences with ZT, leading to theirdis-adoption with the technology. In the case ofPunjab, adopters and dis-adopters largelyconcurred in terms of the ZT-related benefits.This reiterates that in Punjab, ZT dis-adoptionreflected a complex of factors. For some dis-adopters, the yield considerations reported earlierwere paramount and thereby nullified time andcost-saving considerations. Other dis-adoptersmay have had such favorable perceptions, butunable to act upon them in view of problematicaccess to the ZT drill in the survey year.
This study provides some support to thepostulated water-saving nature of ZT wheat at thefield scale. The water use survey, particularly inHaryana, showed that ZT for wheat savesirrigation time (6.4 hours/ha/season), savesirrigation water (340 m3/ha/season) and enhanceswheat yield (260 kg/ha). The absence of anyreported significant change in farm activities orarea cultivated in both sites suggests that thesewater savings generally did not lead to animmediate alternative use of the water saved onthe farm. Instead, the reduced water applicationsat the field scale seem to have primarily savedirrigation time and irrigation cost and reducedgroundwater extraction for the ZT wheat cropcompared to the CT wheat crop. A different studyin the Punjab rice-wheat area reported that thewater savings from resource-conservingtechnologies actually increased water demandand groundwater depletion through expansion incropped area on medium- and large-scale farms(Ahmad et al. 2007). In Haryana, any significantarea expansion was unlikely, as rabi fallow isuncommon (only 1.8% of households reportedsome rabi fallow, with an average 99% of theoperational area being cultivated during the rabiseason). In Punjab, rabi fallow is more common(18% of households reported some rabi fallow,averaging 0.35 ha/household) and was found tobe positively associated with ZT adoption. Part ofthe incentive to adopt ZT in Punjab may havethus been the potential of ZT to increase the areacultivated in rabi – although we cannotunambiguously make this assertion based on theavailable data. In any case, the eventual increase
in area due to ZT may still be limited by theoverall limited fallow area even in Punjab (with anaverage 97% of the operational area alreadybeing cultivated during the rabi season).
In both Haryana and Punjab, adopterstypically have a more favorable resource baseand tended to variously outperform non-adoptersand dis-adopters, irrespective of their use of ZT.The carryover effects on the rice crop weretypically insignificant, although their inclusiontended to dampen the significance of theobserved effects at the system level. The presentsection therefore limits itself to scaling up of theobserved significant effects between the adopters’ZT plots and CT plots for the wheat crop.
With an average ZT wheat area of 5.0 and8.3 ha per household in Haryana and Punjab,respectively, ZT adopters save an average of 180and 288 liters of diesel, 30 and 57 tractor hoursand $210 and 374 per season at the farm level,respectively. In Haryana, ZT adopters also gain0.9 mt of wheat grain per season at the farmlevel. This implies an increase of $132 in grossreturn that, combined with the cost saving,results in an increase of $342 in net revenue inHaryana.
Most ZT-adopting households have postponedthe investment decision to buy a ZT drill with themajority of adopters (60% and 74% in Haryanaand Punjab, respectively) being service-providerdependent in the survey year. Rental marketsmake the ZT drill divisible and thereforeaccessible irrespective of farm size, but do implyincreased dependence on timely and effectiveservice delivery. The lack or untimely availabilityof drills and the high drill cost, particularly inPunjab, have been raised as issues limiting ZTdiffusion (Jehangir et al. 2007; Tahir and Younas2004). To put the investment in a ZT drill inperspective, we have estimated the ZT drillinvestment recovery indicator – the number ofwheat seasons needed to recap the investment.The cost saving alone implies the average ZTadopter would recover the ZT drill purchase within1.9 and 1.5 wheat seasons in Haryana andPunjab, respectively. In the case where ZTadopters extended ZT to their whole wheat area
39
(i.e., an additional wheat area of 4.0 and 5.8 ha/household, respectively), they could recover aZTD investment within 1.0 and 0.9 wheatseasons. Adding the yield gain, the ZTDinvestment recovery in Haryana would be in 1.2wheat seasons on current ZT area alone and 0.6seasons in case ZT is extended to the wholewheat area. Providing ZT drill rental serviceswould further shorten the time needed to recapthe investment. This suggests that the ZT drillinvestment cost is not prohibitive for an averageZT adopter already owning a tractor.
ZT adopters have the largest farms andwheat areas and therefore potentially benefit moston an aggregate-household basis from a cost-saving technology such as ZT (table 4). In bothHaryana and Punjab, the average dis-adopterhousehold could conceivably recover a ZT drillinvestment within 1.7 wheat seasons based oncost savings alone. The average non-adopterhousehold could conceivably recover a ZT drillinvestment within 1.9 and 3.1 wheat seasons,respectively. Tractor ownership was also leastcommon amongst non-adopters (table 4). Thishighlights that the investment in a ZT drill istypically less attractive for the dis-adopters andparticularly for non-adopters compared toadopters, unless they would be able to benefitfrom providing significant ZT drill rental services.
The diesel and tractor time savings are majorcontributors to the ZT-induced cost savings andapply to tractor-owning and tractor-hiringhouseholds alike. Indeed, the tractor time savingis beneficial to tractor-owning households throughboth extended tractor lifetime and alternative use,tractors being variously used and in muchdemand. The alternative tractor uses areparticularly important for the income security oftractor-service providers, as an eventual increasein income from ZT services is likely to be offsetby a more than proportional decrease in traditionaltillage services.
In both sites, ZT wheat had limited effects onthe subsequent rice crop in the same field. ZTwheat also seems to have had few discernibleeffects on other farm activities of the household,including other crops, livestock and nonfarm
activities. Livestock are dependent on the wheatand rice residues, but ZT wheat has so far hadlimited implications for crop-residue management.This reflects the prevailing harvesting, residue-collection and residue-burning practices for thepreceding rice crop with generally still limitedconsideration for the retention of crop residues asmulch – a necessary component of conservationagriculture. ZT-induced labor savings wererelatively minor in view of the prevailingmechanization levels and crop managementpractices.
With rice still being cultivated in thetraditional way in the subsequent season, ZT-induced enhancement of land quality is relativelyshort-lived. Farm-level impact of ZT therebyprimarily reflects immediate effects on the wheatcrop budget through cost savings and, in thecase of Haryana, additional yield effects. The ZT-induced yield enhancement in the survey year inHaryana seemed, at least in part, attributable tothe less favorable weather for wheat growth, ZTbeing relatively less adversely affected than CTwheat despite similar planting dates. The reducedyield variability has important implications foroverall farm risk management and enhancedincome stability.
Regional Impacts of ZT
According to expert estimates, 0.35 and 0.3 mhaof wheat were planted by ZT drill during 2003-04in Haryana and Punjab (RWC 2004), respectively.Extrapolating our plot-level findings to this area,ZT implied a saving of 12.6 and 10.4 million litersof diesel, 2.1 and 2.1 million tractor hours and$14.6 and 13.5 million in production costs perseason, respectively. In Haryana, ZT also implieda gain of 60,000 mt grain per wheat season. Infinancial terms, Haryana had a net incomeincrease of $23.9 million per season, comprisingthe aforementioned “cost saving effect” of $14.6million and a “yield effect” of $9.2 million. If weassume that ZT can be extended to a third of thetotal rice-wheat area in India and Pakistan (10.4and 2.2 mha, respectively), these aggregate
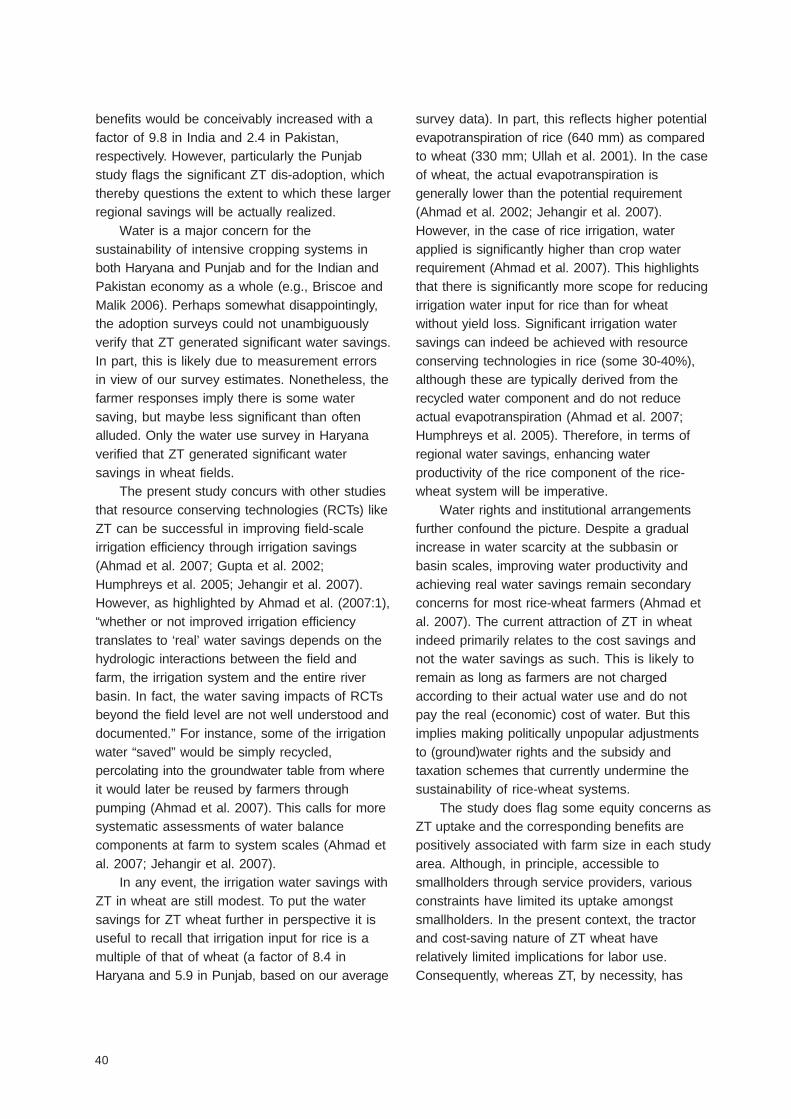
40
benefits would be conceivably increased with afactor of 9.8 in India and 2.4 in Pakistan,respectively. However, particularly the Punjabstudy flags the significant ZT dis-adoption, whichthereby questions the extent to which these largerregional savings will be actually realized.
Water is a major concern for thesustainability of intensive cropping systems inboth Haryana and Punjab and for the Indian andPakistan economy as a whole (e.g., Briscoe andMalik 2006). Perhaps somewhat disappointingly,the adoption surveys could not unambiguouslyverify that ZT generated significant water savings.In part, this is likely due to measurement errorsin view of our survey estimates. Nonetheless, thefarmer responses imply there is some watersaving, but maybe less significant than oftenalluded. Only the water use survey in Haryanaverified that ZT generated significant watersavings in wheat fields.
The present study concurs with other studiesthat resource conserving technologies (RCTs) likeZT can be successful in improving field-scaleirrigation efficiency through irrigation savings(Ahmad et al. 2007; Gupta et al. 2002;Humphreys et al. 2005; Jehangir et al. 2007).However, as highlighted by Ahmad et al. (2007:1),“whether or not improved irrigation efficiencytranslates to ‘real’ water savings depends on thehydrologic interactions between the field andfarm, the irrigation system and the entire riverbasin. In fact, the water saving impacts of RCTsbeyond the field level are not well understood anddocumented.” For instance, some of the irrigationwater “saved” would be simply recycled,percolating into the groundwater table from whereit would later be reused by farmers throughpumping (Ahmad et al. 2007). This calls for moresystematic assessments of water balancecomponents at farm to system scales (Ahmad etal. 2007; Jehangir et al. 2007).
In any event, the irrigation water savings withZT in wheat are still modest. To put the watersavings for ZT wheat further in perspective it isuseful to recall that irrigation input for rice is amultiple of that of wheat (a factor of 8.4 inHaryana and 5.9 in Punjab, based on our average
survey data). In part, this reflects higher potentialevapotranspiration of rice (640 mm) as comparedto wheat (330 mm; Ullah et al. 2001). In the caseof wheat, the actual evapotranspiration isgenerally lower than the potential requirement(Ahmad et al. 2002; Jehangir et al. 2007).However, in the case of rice irrigation, waterapplied is significantly higher than crop waterrequirement (Ahmad et al. 2007). This highlightsthat there is significantly more scope for reducingirrigation water input for rice than for wheatwithout yield loss. Significant irrigation watersavings can indeed be achieved with resourceconserving technologies in rice (some 30-40%),although these are typically derived from therecycled water component and do not reduceactual evapotranspiration (Ahmad et al. 2007;Humphreys et al. 2005). Therefore, in terms ofregional water savings, enhancing waterproductivity of the rice component of the rice-wheat system will be imperative.
Water rights and institutional arrangementsfurther confound the picture. Despite a gradualincrease in water scarcity at the subbasin orbasin scales, improving water productivity andachieving real water savings remain secondaryconcerns for most rice-wheat farmers (Ahmad etal. 2007). The current attraction of ZT in wheatindeed primarily relates to the cost savings andnot the water savings as such. This is likely toremain as long as farmers are not chargedaccording to their actual water use and do notpay the real (economic) cost of water. But thisimplies making politically unpopular adjustmentsto (ground)water rights and the subsidy andtaxation schemes that currently undermine thesustainability of rice-wheat systems.
The study does flag some equity concerns asZT uptake and the corresponding benefits arepositively associated with farm size in each studyarea. Although, in principle, accessible tosmallholders through service providers, variousconstraints have limited its uptake amongstsmallholders. In the present context, the tractorand cost-saving nature of ZT wheat haverelatively limited implications for labor use.Consequently, whereas ZT, by necessity, has
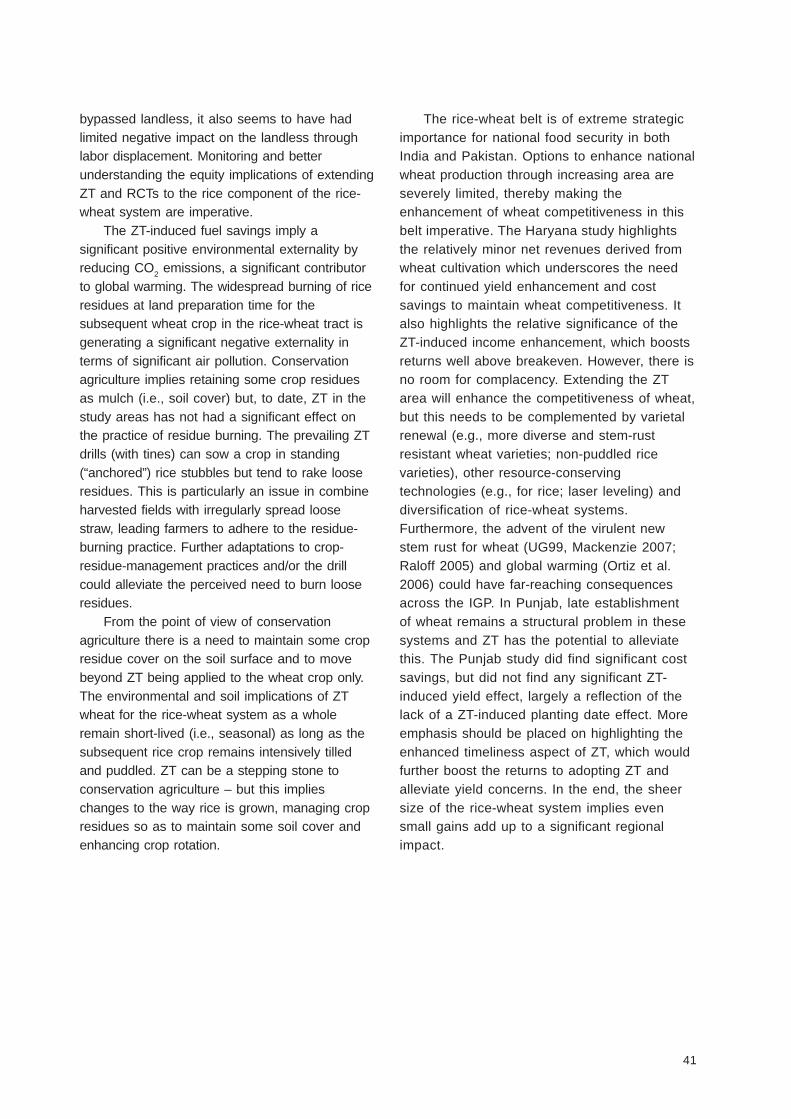
41
bypassed landless, it also seems to have hadlimited negative impact on the landless throughlabor displacement. Monitoring and betterunderstanding the equity implications of extendingZT and RCTs to the rice component of the rice-wheat system are imperative.
The ZT-induced fuel savings imply asignificant positive environmental externality byreducing CO2 emissions, a significant contributorto global warming. The widespread burning of riceresidues at land preparation time for thesubsequent wheat crop in the rice-wheat tract isgenerating a significant negative externality interms of significant air pollution. Conservationagriculture implies retaining some crop residuesas mulch (i.e., soil cover) but, to date, ZT in thestudy areas has not had a significant effect onthe practice of residue burning. The prevailing ZTdrills (with tines) can sow a crop in standing(“anchored”) rice stubbles but tend to rake looseresidues. This is particularly an issue in combineharvested fields with irregularly spread loosestraw, leading farmers to adhere to the residue-burning practice. Further adaptations to crop-residue-management practices and/or the drillcould alleviate the perceived need to burn looseresidues.
From the point of view of conservationagriculture there is a need to maintain some cropresidue cover on the soil surface and to movebeyond ZT being applied to the wheat crop only.The environmental and soil implications of ZTwheat for the rice-wheat system as a wholeremain short-lived (i.e., seasonal) as long as thesubsequent rice crop remains intensively tilledand puddled. ZT can be a stepping stone toconservation agriculture – but this implieschanges to the way rice is grown, managing cropresidues so as to maintain some soil cover andenhancing crop rotation.
The rice-wheat belt is of extreme strategicimportance for national food security in bothIndia and Pakistan. Options to enhance nationalwheat production through increasing area areseverely limited, thereby making theenhancement of wheat competitiveness in thisbelt imperative. The Haryana study highlightsthe relatively minor net revenues derived fromwheat cultivation which underscores the needfor continued yield enhancement and costsavings to maintain wheat competitiveness. Italso highlights the relative significance of theZT-induced income enhancement, which boostsreturns well above breakeven. However, there isno room for complacency. Extending the ZTarea will enhance the competitiveness of wheat,but this needs to be complemented by varietalrenewal (e.g., more diverse and stem-rustresistant wheat varieties; non-puddled ricevarieties), other resource-conservingtechnologies (e.g., for rice; laser leveling) anddiversification of rice-wheat systems.Furthermore, the advent of the virulent newstem rust for wheat (UG99, Mackenzie 2007;Raloff 2005) and global warming (Ortiz et al.2006) could have far-reaching consequencesacross the IGP. In Punjab, late establishmentof wheat remains a structural problem in thesesystems and ZT has the potential to alleviatethis. The Punjab study did find significant costsavings, but did not find any significant ZT-induced yield effect, largely a reflection of thelack of a ZT-induced planting date effect. Moreemphasis should be placed on highlighting theenhanced timeliness aspect of ZT, which wouldfurther boost the returns to adopting ZT andalleviate yield concerns. In the end, the sheersize of the rice-wheat system implies evensmall gains add up to a significant regionalimpact.
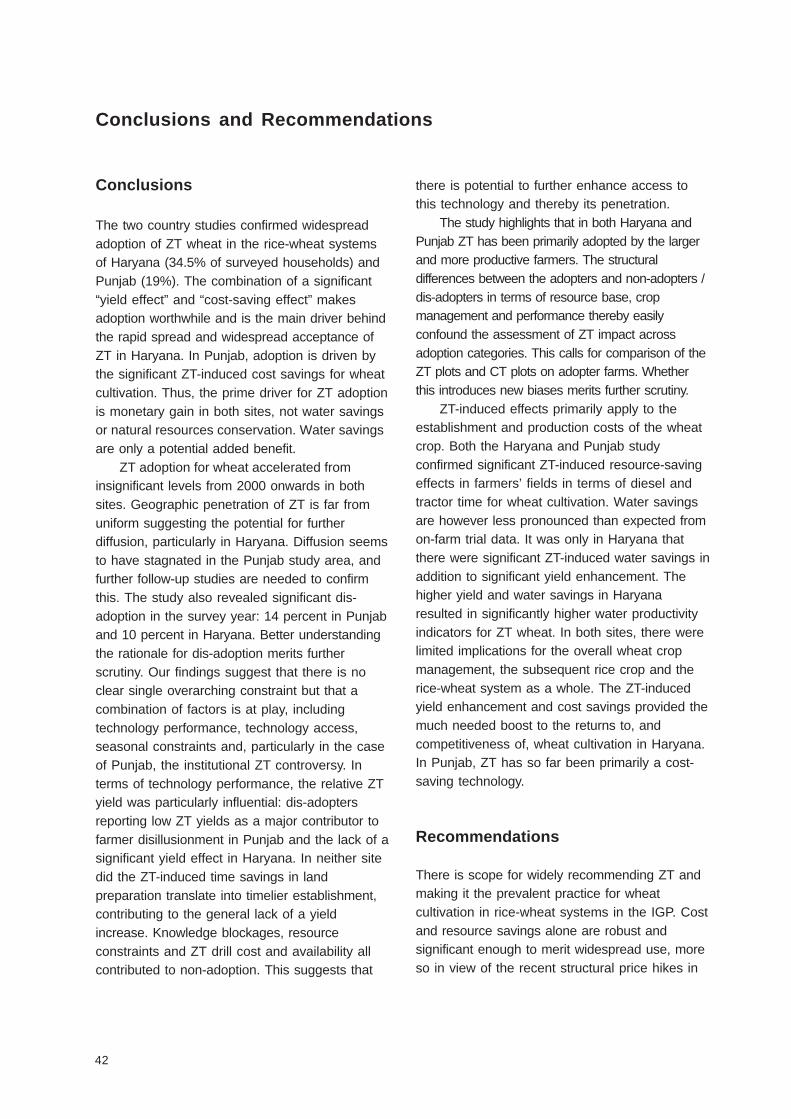
42
Conclusions and Recommendations
Conclusions
The two country studies confirmed widespreadadoption of ZT wheat in the rice-wheat systemsof Haryana (34.5% of surveyed households) andPunjab (19%). The combination of a significant“yield effect” and “cost-saving effect” makesadoption worthwhile and is the main driver behindthe rapid spread and widespread acceptance ofZT in Haryana. In Punjab, adoption is driven bythe significant ZT-induced cost savings for wheatcultivation. Thus, the prime driver for ZT adoptionis monetary gain in both sites, not water savingsor natural resources conservation. Water savingsare only a potential added benefit.
ZT adoption for wheat accelerated frominsignificant levels from 2000 onwards in bothsites. Geographic penetration of ZT is far fromuniform suggesting the potential for furtherdiffusion, particularly in Haryana. Diffusion seemsto have stagnated in the Punjab study area, andfurther follow-up studies are needed to confirmthis. The study also revealed significant dis-adoption in the survey year: 14 percent in Punjaband 10 percent in Haryana. Better understandingthe rationale for dis-adoption merits furtherscrutiny. Our findings suggest that there is noclear single overarching constraint but that acombination of factors is at play, includingtechnology performance, technology access,seasonal constraints and, particularly in the caseof Punjab, the institutional ZT controversy. Interms of technology performance, the relative ZTyield was particularly influential: dis-adoptersreporting low ZT yields as a major contributor tofarmer disillusionment in Punjab and the lack of asignificant yield effect in Haryana. In neither sitedid the ZT-induced time savings in landpreparation translate into timelier establishment,contributing to the general lack of a yieldincrease. Knowledge blockages, resourceconstraints and ZT drill cost and availability allcontributed to non-adoption. This suggests that
there is potential to further enhance access tothis technology and thereby its penetration.
The study highlights that in both Haryana andPunjab ZT has been primarily adopted by the largerand more productive farmers. The structuraldifferences between the adopters and non-adopters /dis-adopters in terms of resource base, cropmanagement and performance thereby easilyconfound the assessment of ZT impact acrossadoption categories. This calls for comparison of theZT plots and CT plots on adopter farms. Whetherthis introduces new biases merits further scrutiny.
ZT-induced effects primarily apply to theestablishment and production costs of the wheatcrop. Both the Haryana and Punjab studyconfirmed significant ZT-induced resource-savingeffects in farmers’ fields in terms of diesel andtractor time for wheat cultivation. Water savingsare however less pronounced than expected fromon-farm trial data. It was only in Haryana thatthere were significant ZT-induced water savings inaddition to significant yield enhancement. Thehigher yield and water savings in Haryanaresulted in significantly higher water productivityindicators for ZT wheat. In both sites, there werelimited implications for the overall wheat cropmanagement, the subsequent rice crop and therice-wheat system as a whole. The ZT-inducedyield enhancement and cost savings provided themuch needed boost to the returns to, andcompetitiveness of, wheat cultivation in Haryana.In Punjab, ZT has so far been primarily a cost-saving technology.
Recommendations
There is scope for widely recommending ZT andmaking it the prevalent practice for wheatcultivation in rice-wheat systems in the IGP. Costand resource savings alone are robust andsignificant enough to merit widespread use, moreso in view of the recent structural price hikes in
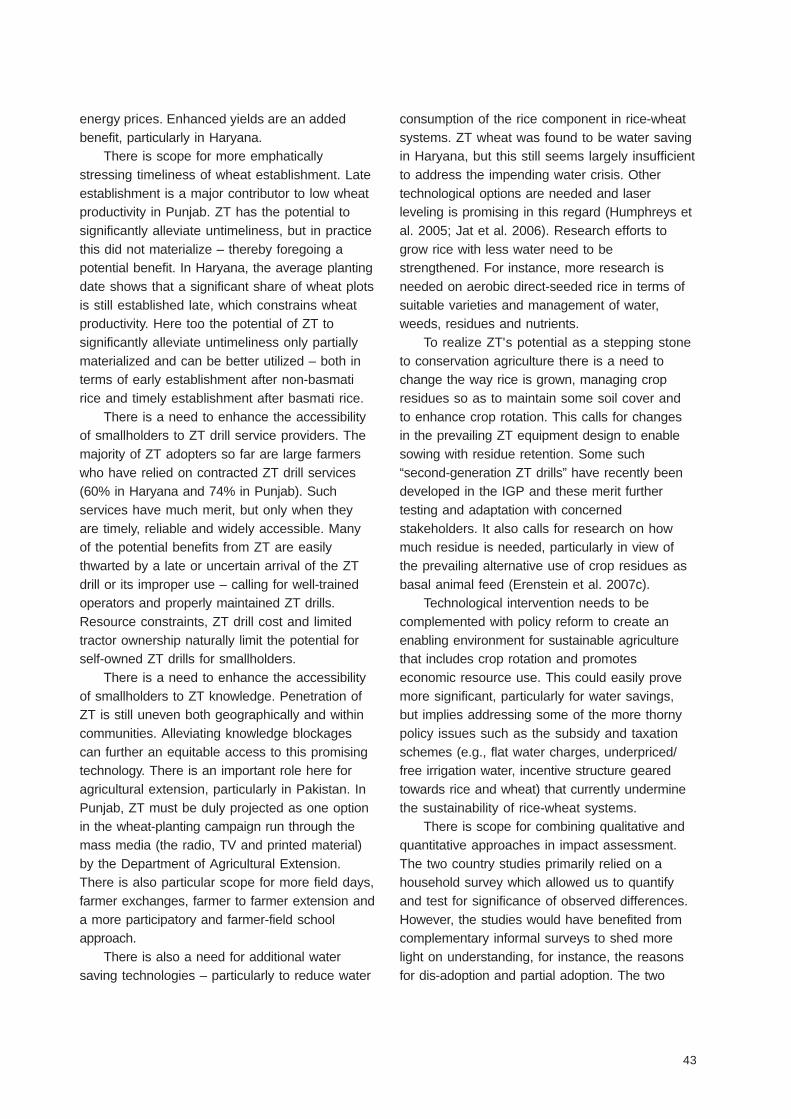
43
energy prices. Enhanced yields are an addedbenefit, particularly in Haryana.
There is scope for more emphaticallystressing timeliness of wheat establishment. Lateestablishment is a major contributor to low wheatproductivity in Punjab. ZT has the potential tosignificantly alleviate untimeliness, but in practicethis did not materialize – thereby foregoing apotential benefit. In Haryana, the average plantingdate shows that a significant share of wheat plotsis still established late, which constrains wheatproductivity. Here too the potential of ZT tosignificantly alleviate untimeliness only partiallymaterialized and can be better utilized – both interms of early establishment after non-basmatirice and timely establishment after basmati rice.
There is a need to enhance the accessibilityof smallholders to ZT drill service providers. Themajority of ZT adopters so far are large farmerswho have relied on contracted ZT drill services(60% in Haryana and 74% in Punjab). Suchservices have much merit, but only when theyare timely, reliable and widely accessible. Manyof the potential benefits from ZT are easilythwarted by a late or uncertain arrival of the ZTdrill or its improper use – calling for well-trainedoperators and properly maintained ZT drills.Resource constraints, ZT drill cost and limitedtractor ownership naturally limit the potential forself-owned ZT drills for smallholders.
There is a need to enhance the accessibilityof smallholders to ZT knowledge. Penetration ofZT is still uneven both geographically and withincommunities. Alleviating knowledge blockagescan further an equitable access to this promisingtechnology. There is an important role here foragricultural extension, particularly in Pakistan. InPunjab, ZT must be duly projected as one optionin the wheat-planting campaign run through themass media (the radio, TV and printed material)by the Department of Agricultural Extension.There is also particular scope for more field days,farmer exchanges, farmer to farmer extension anda more participatory and farmer-field schoolapproach.
There is also a need for additional watersaving technologies – particularly to reduce water
consumption of the rice component in rice-wheatsystems. ZT wheat was found to be water savingin Haryana, but this still seems largely insufficientto address the impending water crisis. Othertechnological options are needed and laserleveling is promising in this regard (Humphreys etal. 2005; Jat et al. 2006). Research efforts togrow rice with less water need to bestrengthened. For instance, more research isneeded on aerobic direct-seeded rice in terms ofsuitable varieties and management of water,weeds, residues and nutrients.
To realize ZT's potential as a stepping stoneto conservation agriculture there is a need tochange the way rice is grown, managing cropresidues so as to maintain some soil cover andto enhance crop rotation. This calls for changesin the prevailing ZT equipment design to enablesowing with residue retention. Some such“second-generation ZT drills” have recently beendeveloped in the IGP and these merit furthertesting and adaptation with concernedstakeholders. It also calls for research on howmuch residue is needed, particularly in view ofthe prevailing alternative use of crop residues asbasal animal feed (Erenstein et al. 2007c).
Technological intervention needs to becomplemented with policy reform to create anenabling environment for sustainable agriculturethat includes crop rotation and promoteseconomic resource use. This could easily provemore significant, particularly for water savings,but implies addressing some of the more thornypolicy issues such as the subsidy and taxationschemes (e.g., flat water charges, underpriced/free irrigation water, incentive structure gearedtowards rice and wheat) that currently underminethe sustainability of rice-wheat systems.
There is scope for combining qualitative andquantitative approaches in impact assessment.The two country studies primarily relied on ahousehold survey which allowed us to quantifyand test for significance of observed differences.However, the studies would have benefited fromcomplementary informal surveys to shed morelight on understanding, for instance, the reasonsfor dis-adoption and partial adoption. The two
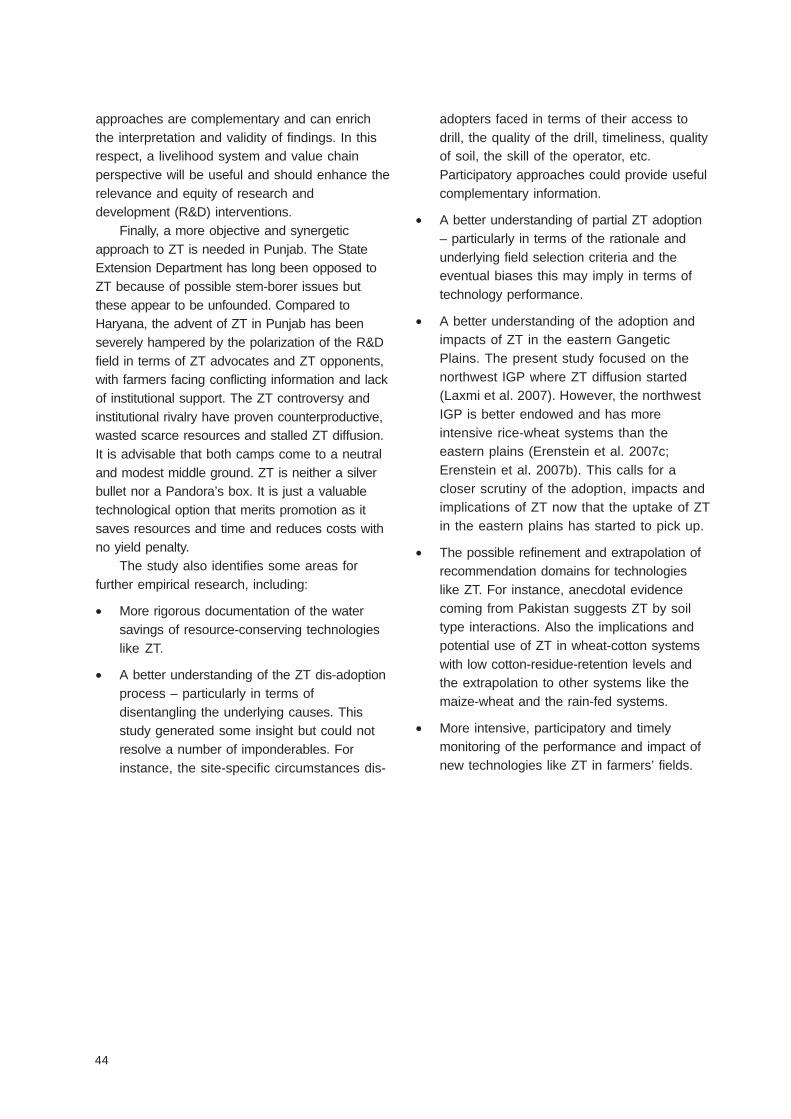
44
approaches are complementary and can enrichthe interpretation and validity of findings. In thisrespect, a livelihood system and value chainperspective will be useful and should enhance therelevance and equity of research anddevelopment (R&D) interventions.
Finally, a more objective and synergeticapproach to ZT is needed in Punjab. The StateExtension Department has long been opposed toZT because of possible stem-borer issues butthese appear to be unfounded. Compared toHaryana, the advent of ZT in Punjab has beenseverely hampered by the polarization of the R&Dfield in terms of ZT advocates and ZT opponents,with farmers facing conflicting information and lackof institutional support. The ZT controversy andinstitutional rivalry have proven counterproductive,wasted scarce resources and stalled ZT diffusion.It is advisable that both camps come to a neutraland modest middle ground. ZT is neither a silverbullet nor a Pandora’s box. It is just a valuabletechnological option that merits promotion as itsaves resources and time and reduces costs withno yield penalty.
The study also identifies some areas forfurther empirical research, including:
• More rigorous documentation of the watersavings of resource-conserving technologieslike ZT.
• A better understanding of the ZT dis-adoptionprocess – particularly in terms ofdisentangling the underlying causes. Thisstudy generated some insight but could notresolve a number of imponderables. Forinstance, the site-specific circumstances dis-
adopters faced in terms of their access todrill, the quality of the drill, timeliness, qualityof soil, the skill of the operator, etc.Participatory approaches could provide usefulcomplementary information.
• A better understanding of partial ZT adoption– particularly in terms of the rationale andunderlying field selection criteria and theeventual biases this may imply in terms oftechnology performance.
• A better understanding of the adoption andimpacts of ZT in the eastern GangeticPlains. The present study focused on thenorthwest IGP where ZT diffusion started(Laxmi et al. 2007). However, the northwestIGP is better endowed and has moreintensive rice-wheat systems than theeastern plains (Erenstein et al. 2007c;Erenstein et al. 2007b). This calls for acloser scrutiny of the adoption, impacts andimplications of ZT now that the uptake of ZTin the eastern plains has started to pick up.
• The possible refinement and extrapolation ofrecommendation domains for technologieslike ZT. For instance, anecdotal evidencecoming from Pakistan suggests ZT by soiltype interactions. Also the implications andpotential use of ZT in wheat-cotton systemswith low cotton-residue-retention levels andthe extrapolation to other systems like themaize-wheat and the rain-fed systems.
• More intensive, participatory and timelymonitoring of the performance and impact ofnew technologies like ZT in farmers’ fields.
45
Literature Cited
Abrol, I. P. 1999. Sustaining rice wheat system productivity in the Indo Gangetic Plain: Water management relatedissues. Agricultural Water Management 40 (1): 31-35.
Ahmad, M. D.; Masih, I.; Turral, H. 2004. Diagnostic analysis of spatial and temporal variations in crop water productivity:A field scale analysis of the rice-wheat cropping system of Punjab, Pakistan. Journal of Applied Irrigation Science39 (1): 43-63.
Ahmad, M. D.; Turral, H.; Masih, I.; Giordano, M.; Masood, Z. 2007. Water saving technologies: Myths and realitiesrevealed in Pakistan’s rice-wheat systems. IWMI Research Report 108. Colombo, Sri Lanka: International WaterManagement Institute.
Ahmad, M. U. D.; Bastiaanssen, W. G. M.; Feddes, R. A. 2002. Sustainable use of groundwater for irrigation: Anumerical analysis of the subsoil water fluxes. Irrigation and Drainage 51 (3): 227-241.
Amir, P.; Aslam, M. 1992. The rice-wheat system of the Punjab: A conflict in crop management. In Farming systems ofPakistan, ed. Byerlee, D., Husain, T., 62-88. Islamabad: Vanguard.
Anwar, M. Z.; Khan, M. A.; Asif Masood, M. 2002. Socioeconomic assessment of wheat technologies tested in the rice-wheat project areas. Socioeconomic Research Studies 2001-2002. Islamabad: Pakistani Agricultural ResearchCouncil, Social Sciences Division, pp. 89-106.
Anwar, M. Z.; Farooq, U.; Sharif, Ch. M.; Akmal, N.; Morris, M. 2004. Diffusion of zero-till seed drills in Punjab Province,Pakistan. Internal report. Islamabad, Pakistan: Social Sciences Institute, National Agricultural Research Center(NARC).
Aslam, M.; Majid, A.; Hashmi, N. I.; Hobbs, P. R. 1993. Improving wheat yield in the rice-wheat cropping system of thePunjab through Zero tillage. Pakistan Journal of Agricultural Research 14 8-11.
Briscoe, J.; Malik, R. P. S. 2006. India’s water economy: Bracing for a turbulent future. New Delhi: Oxford UniversityPress.
Byerlee, D.; Ali, M.; Siddiq, A. 2003. Sustainability of the rice-wheat system in Pakistan’s Punjab: How large is theproblem? In Improving the productivity and sustainability of rice-wheat systems: Issues and impacts, ed. Ladha, J.K., Hill, J. E., Duxbury, J. M., Gupta, R. K., Buresh, R. J., 77-96. ASA Special Publication Number 65. Madison,Wisconsin, USA: ASA-CSSA-SSSA.
Byerlee, D.; Sheikh, A. D.; Aslam, M.; Hobbs, P. R. 1984. Wheat in the rice-based farming system of the Punjab:Implications for research and extension. NARC/CIMMYT Reports Series No. 4. Islamabad: NARC/CIMMYT (NationalAgricultural Research Center [Pakistan]/Centro Internacional de Majoramiento de Maize y Trigo [Mexico].
Cabangon, R. J.; Tuong, T. P.; Abdullah, N. B. 2002. Comparing water input and water productivity of transplanted anddirect-seeded rice production systems. Agricultural Water Management 57 (1): 11-31.
Central Ground Water Board. 2007. Haryana at a glance. Available online at http://cgwbchd.nic.in/haryana.htm(verified 18/4/07),
Chandra, R.; Sikka, A.; Singh, S.; Gupta, R.; Upadhyaya, A. K.; Sakthivadivel, R. 2007. Impact of resource conservingtechnologies on water use and water productivity in Pabnawa minor of Bhakra canal system. RWC TechnicalBulletin No. 10. New Delhi: Rice-Wheat Consortium (RWC).
CIMMYT (Centro Internacional de Majoramiento de Maize y Trigo [Mexico]). 1993. The adoption of agriculturaltechnology: A guide for survey design. Economics Program. Mexico, D.F.: CIMMYT.
Connor, D. J.; Timsina, J.; Humphreys, E. 2003. Prospects for permanent beds for the rice-wheat system. In Improvingthe productivity and sustainability of rice-wheat systems: Issues and impacts, ed. Ladha, J. K., Hill, J. E., Duxbury,J. M., Gupta, R. K., Buresh, R. J., 197-210. ASA Special Publication Number 65. Madison, Wisconsin, USA: ASA-CSSA-SSSA.
Ekboir, J. 2002. Developing no-till packages for small-scale farmers. In CIMMYT 2000-2001 world wheat overviewand outlook, ed. Ekboir, J., 1-38. Mexico: CIMMYT.
46
Erenstein, O.; Malik, R.K.; Singh, S. 2007a. Adoption and impacts of zero tillage in the irrigated rice-wheat systems ofHaryana, India. New Delhi, India: CIMMYT India and RWC.
Erenstein, O.; Hellin, J.; Chandna, P. 2007b. Livelihoods, poverty and targeting in the Indo-Gangetic Plains: A spatialmapping approach. CIMMYT and RWC Research Report. New Delhi, India: CIMMYT and Rice-Wheat Consortiumfor the Indo-Gangetic Plains.
Erenstein, O.; Thorpe, W.; Singh, J.; Varma, A. 2007c. Crop-livestock interactions and livelihoods in the Indo-GangeticPlains, India: A regional synthesis. Crop-livestock Interactions Scoping Study - Synthesis. New Delhi, India:CIMMYT-ILRI (International Livestock Research Institute [Nairobi])-RWC.
Erenstein, O.; Thorpe, W.; Singh, J.; Varma, A. 2007d. Crop-livestock interactions and livelihoods in the Trans-Gangetic Plains, India. Crop-livestock Interactions Scoping Study - Report 1. New Delhi, India: CIMMYT-ILRI-RWC.
FAO (Food and Agriculture Organization of the United Nations). 2007. Conservation Agriculture Website. Availableonline at http://www.fao.org/ag/ca/ (verified 16/4/07).
Farooq, U.; Sharif, M.; Erenstein, O. 2007. Adoption and impacts of zero tillage in the rice-wheat zone of irrigatedPunjab, Pakistan. CIMMYT and RWC Research Report. New Delhi, India: CIMMYT India & RWC.
Feder, G.; Just, R.E.; Zilberman, D. 1985. Adoption of agricultural innovations in developing countries: A survey.Economic Development and Cultural Change 33 (2): 255-298.
Fujisaka, S.; Harrington, L.; Hobbs, P. R. 1994. Rice-wheat in South Asia: Systems and long-term priorities establishedthrough diagnostic research. Agricultural Systems 46: 169-187.
Gupta, R.; Sayre, K. 2007. Conservation agriculture in South Asia. Journal of Agricultural Science 145 (3): 207-214.
Gupta, R. K.; Naresh, R. K.; Hobbs, P. R.; Jiaguo, Z.; Ladha, J. K. 2003. Sustainability of post-green revolutionagriculture: The rice-wheat cropping systems of the Indo-Gangetic Plains and China. In Improving the productivityand sustainability of rice-wheat systems: Issues and impacts, ed. Ladha, J. K.; Hill, J. E.; Duxbury, J. M.; Gupta, R.K.; Buresh, R. J. 1-26. ASA Special Publication Number 65. Madison, Wisconsin, USA: ASA-CSSA-SSSA.
Gupta, R. K.; Naresh, R. K.; Hobbs, P. R.; Ladha, J. K. 2002. Adopting conservation agriculture in the rice-wheatsystem of the Indo-Gangetic Plains: New opportunities for saving water. In Water wise rice production. Proceedingsof the international workshop on water wise rice production, April 8-11, 2002, Los Banos, Philippines, ed. Bouman,B. A. M.; Hengsdijk, H.; Hardy, B.; Bindraban, P. S.; Tuong, T. P.; Ladha, J. K. 207-222. Los Banos, Philippines:International Rice Research Institute.
Gupta, R.; Seth, A. 2007. A review of resource conserving technologies for sustainable management of the rice-wheatcropping systems of the Indo-Gangetic Plains (IGP). Crop Protection 26 (3): 436-447.
Harrington, L.; Erenstein, O. 2005. Conservation agriculture and resource conserving technologies - A globalperspective. In Conservation agriculture - Status and prospects, ed. Abrol, I. P.; Gupta, R.K.; Malik, R. K. 1-12. NewDelhi: Centre for Advancement of Sustainable Agriculture.
Harrington, L. W.; Fujisaka, S.; Hobbs, P. R.; Sharma, H.C.; Singh, R.P.; Chaudhary, M.K.; Dhiman, S.D. 1993. Wheatand rice in Karnal and Kurukshetra districts, Haryana, India: Farmer’s practices, problems and an agenda foraction. Mexico, D. F.: Haryana Agricultural University (HAU), Indian Council of Agricultural Research (ICAR),CIMMYT, IRRI.
Hobbs, P. R. 2007. Conservation agriculture: What is it and why is it important for future sustainable food production?The Journal of Agricultural Science 145 (02): 127-137.
Hobbs, P. R. 2007. Personal communication. Ithaca.
Hobbs, P. R.; Giri, G. S.; Grace, P. 1997. Reduced and zero tillage options for the establishment of wheat after rice inSouth Asia. Rice-Wheat Consortium Paper Series 2. New Delhi, India: RWC.
Hobbs, P. R.; Gupta, R. K. 2003a. Resource-conserving technologies for wheat in the rice-wheat system. In Improvingthe productivity and sustainability of rice-wheat systems: Issues and impacts, ed. Ladha, J. K.; Hill, J. E.; Duxbury,J. M.; Gupta, R. K.; Buresh, R. J. 149-172. ASA Special Publication Number 65. Madison, Wisconsin, USA: ASA-CSSA-SSSA.
47
Hobbs, P. R.; Gupta, R. K. 2003b. Rice-wheat cropping systems in the Indo-Gangetic Plains: Issues of water productivityin relation to new resource-conserving technologies. In Water productivity in agriculture: Limits and opportunitiesfor improvement, ed. Kijne, J. W.; Barker, R.; Molden, D. 239-253. Wallingford, UK: CABI Publication.
Humphreys, E.; Meisner, C.; Gupta, R.; Timsina, J.; Beecher, H. G.; Lu, T. Y.; Yadvinder-Singh; Gill, M. A.; Masih, I.; Guo,Z. J.; Thompson, J. A. 2005. Water saving in rice-wheat systems. Plant Production Science 8 (3): 242-258.
Inayatullah, C.; Ehsan-Ul-Haq; Ata-ul-Mohsin; Rehman, A.; Hobbs, P. R. 1989. Management of rice stem borers andfeasibility of adopting no-tillage in wheat. Islamabad: Entomological Research Laboratories, Pakistan AgriculturalResearch Council.
Iqbal, M.; Khan, M. A.; Anwar, M. Z. 2002. Zero-tillage technology and farm profits: A case study of wheat growers inthe rice zone of Punjab. The Pakistan Development Review 41 (4): 665-682.
Jat, M. L.; Chandna, P.; Gupta, R. K.; Sharma, S. K.; Gill, M. A. 2006. Land leveling: A precursor technology for resourceconservation. Rice-Wheat Consortium Technical Bulletin Series 7. New Delhi, India: Rice-Wheat Consortium forthe Indo-Gangetic Plains.
Jehangir, W. A.; Masih, I.; Ahmed, S.; Gill, M. A.; Ahmad, M.; Mann, R. A.; Chaudhary, M. R.; Turral, H. 2007. Sustainingcrop water productivity in rice-wheat systems of South Asia: A case study from Punjab Pakistan. IWMI WorkingPaper 115. Colombo, Sri Lanka: International Water Management Institute.
Khan, M. A.; Anwar, M. Z.; Aslam Gill, M.; Hashmi, N. I.; Hobbs, P. R. 2002. Impact assessment of zero tillage wheatsowing technologies in the rice-wheat farming system of Punjab. 53-88. Socioeconomic Research Studies 2001- 2002. Islamabad: Pakistan Agricultural Research Council, Social Sciences Division.
Kijne, J. W.; Barker, R.; Molden, D., eds. 2003. Water productivity in agriculture: Limits and opportunities for improvement.Wallingford, UK: CABI Publication.
Kumar, P.; Jha, D.; Kumar, A.; Chaudhary, M. K.; Grover, R. K.; Singh, R. K.; Mitra, A.; Joshi, P. K.; Singh, A.; Badal, P. S.;Mittal, S.; Ali, J. 2002. Economic analysis of total factor productivity of crop sector in Indo-Gangetic Plain of India bydistrict and region. Agricultural Economics Research Report 2. New Delhi, India: Indian Agricultural ResearchInstitute.
Laxmi, V.; Erenstein, O.; Gupta, R. K. 2007. Impact of zero tillage in India’s rice-wheat systems. New Delhi: RWC.Forthcoming RWC Publication.
Mackenzie, D. 2007. Billions at risk from wheat super-blight. New Scientist (2598) 6-7.
Malik, R. K.; Balyan, R. S.; Yadav, A.; Pahwa, S. K., eds. 2002a. Herbicide resistance management and zero tillage inrice-wheat cropping system. Proceedings of International Workshop, 4-6 March, 2002. Hisar, India: ChaudharyCharan Singh Haryana Agricultural University (CCSHAU).
Malik, R. K.; Gupta, R. K.; Singh, C. M.; Yadav, A.; Brar, S. S.; Thakur, T. C.; Singh, S. S.; Singh, A. K.; Singh, R.; Sinha,R. K. 2005a. Accelerating the adoption of resource conservation technologies in rice wheat system of the Indo-Gangetic Plains. Proceedings of the project workshop June 1-2, 2005. Hisar, Haryana, India: Directorate ofExtension Education, Chaudhary Charan Singh Haryana Agricultural University (CCS HAU).
Malik, R. K.; Gupta, R. K.; Yadav, A.; Sardana, P. K.; Singh, C. M. 2005b. Zero tillage - The voice of farmers. TechnicalBulletin No. 9. Hisar, India: Directorate of Extension Education, CCS Haryana Agricultural University.
Malik, R. K.; Yadav, A.; Gupta, R. K.; Singh, S.; Hobbs, P. R.; Bellinder, R. R. 2005c. Introduction and success of zerotillage in wheat under rice-wheat cropping system in Haryana, India-related stories. In Accelerating the adoptionof resource conservation technologies in rice wheat system of the Indo-Gangetic Plains. Proceedings of theproject workshop June 1-2, 2005, ed. Malik, R. K.; Gupta, R. K.; Singh, C. M.; Yadav, A.; Brar, S. S.; Thakur, T. C.;Singh, S. S.; Singh, A. K.; Singh, R.; Sinha, R. K. 1-17. Hisar, Haryana, India: Directorate of Extension Education,CCS HAU.
Malik, R. K.; Yadav, A.; Singh, S.; Malik, R. S.; Balyan, R. S.; Banga, R. S.; Sardana, P. K.; Jaipal, S.; Hobbs, P. R.; Gill,G.; Singh, S.; Gupta, R. K.; Bellinder, R. 2002b. Herbicide resistance management and evolution of zero tillage - Asuccess story. Research Bulletin. Hisar, India: CCS Haryana Agricultural University.
48
Mann, R. A.; Meisner, C. A. 2003. Outcome of the workshop. In Proceedings of the national workshop on rice-wheatsystems in Pakistan, 11-12 December 2002, Islamabad, Pakistan, ed. PARC-RWC, 1-7. Rice-Wheat ConsortiumPaper Series No. 15. New Delhi: Pakistan Agricultural Research Council and Rice-Wheat Consortium for theIndo-Gangetic Plains.
Mehla, R. S.; Verma, J. K.; Gupta, R. K.; Hobbs, P. R. 2000. Stagnation in the productivity of wheat in the Indo-GangeticPlains : Zero-till-seed-cum-fertilizer drill as an integrated solution. Rice-Wheat Consortium Paper Series 8. NewDelhi, India: RWC.
Molden, D. 1997. Accounting for water use and productivity. SWIM Paper 1. Colombo, Sri Lanka: International WaterManagement Institute.
Molden, D. J.; Sakthivadivel, R.; Perry, C. J.; de Fraiture, C.; Kloezen, W. H. 1998. Indicators for comparing performanceof irrigated agricultural systems. Research Report 20. Colombo, Sri Lanka: International Water ManagementInstitute.
Morris, M. 2003. Adoption and impacts of resource conserving technologies in the irrigated plains of South Asia:Inception report. Mexico, D. F.: CIMMYT Economics Program.
Ortiz, R.; Sayre, K. D.; Govaerts, B.; Gupta, R.; Subbarao, G. V.; Bana, T.; Hodson, D.; Dixon, J. M.; Ortiz-Monasterio,J. I.; Reynolds, M. 2006. Climate change: Can wheat beat the heat? Special Issue of Agriculture, Ecosystems andEnvironment. Forthcoming.
Ortiz-Monasterio, J. I.; Dhillon, S. S.; Fischer, R. A. 1994. Date of sowing effects on grain yield and yield componentsof irrigated spring wheat cultivars and relationships with radiation and temperature in Ludhiana, India. Field CropsResearch 37 (3): 169-184.
PARC-RWC (Pakistan Agricultural Research Council-Rice-Wheat Consortium). 2003. Proceedings of the nationalworkshop on rice-wheat systems, Islamabad, Pakistan,11-12 Dec 2002. Rice-Wheat Consortium Paper Series 15.New Delhi, India: PARC and RWC.
Parwez, M. S.; Malik, R. K.; Rai, K. N.; Morris, M. L. 2004. Diffusion of zero-till seed drills in Haryana. Internal report.New Delhi, India: RWC.
Pingali, P. L.; Shah, M. 2001. Policy re-directions for sustainable resource use: The rice-wheat cropping system of theIndo-Gangetic Plains. Journal of Crop Production 3 (2): 103-118.
Qureshi, A. S.; Shah, T.; Akhtar, M. 2003. The groundwater economy of Pakistan. IWMI Working Paper 64. PakistanCountry Series No. 19. Lahore, Pakistan: International Water Management Institute.
Raloff, J. 2005. Wheat warning-new rust could spread like wildfire. Science News Online 168 (13).
RWC (Rice-Wheat Consortium). 2002. Proceedings of the international workshop on developing an action programfor farm-level impact in rice-wheat systems of the Indo-Gangetic Plains, 25-27 September 2000, New Delhi, India.Rice-Wheat Consortium Paper Series 14. New Delhi, India: RWC.
RWC. 2004. Highlights 2003–2004. New Delhi: RWC.
Seckler, D. 1996. New era of water resources management: From dry to wet water savings. Research Report 1.Colombo, Sri Lanka: International Water Management Institute.
Seth, A.; Fischer, K.; Anderson, J.; Jha, D. 2003. The Rice-Wheat Consortium: An institutional innovation in internationalagricultural research on the rice-wheat cropping systems of the Indo-Gangetic Plains (IGP). The Review PanelReport. New Delhi, India: RWC.
Sharif, M.; Longmire, J.; Shafique, M.; Ahmad, Z. 1992. System implications of varietal adoption: Basmati-385 in therice-wheat zone of the Punjab. In Farming systems of Pakistan, ed. Byerlee, D.; Husain, T. 89-104. Islamabad:Vanguard.
Sheikh, A. D.; Khan, M. A.; Aslam, M.; Ahmad, Z.; Ahmad, M. 1993. Zero tillage wheat cultivation technology in the rice-wheat areas of the Punjab, Pakistan. Islamabad: Social Sciences Institute, National Agricultural Research Center(NARC).
49
Sheikh, A. D.; Rehman, T.; Yates, C. M. 2003. Logit models for identifying the factors that influence the uptake of new‘no-tillage’ technologies by farmers in the rice-wheat and the cotton-wheat farming systems of Pakistan’s Punjab.Agricultural Systems 75: 79-95.
Srivastava, S. K.; Biswas, R.; Garg, D. K.; Gyawali, B. K.; Haque, N. M. M.; Ijaj, P.; Jaipal, S.; Kamal, N. Q.; Kumar, P.;Pathak, M.; Pathak, P. K.; Prasad, C. S.; Ramzan, M.; Rehman, A.; Rurmzan, M.; Salim, M.; Singh, A.; Singh, U. S.;Tiwari, S. N. 2005. Management of stem borers of rice and wheat in rice-wheat systems of Pakistan, Nepal, Indiaand Bangladesh. Rice-Wheat Consortium Paper Series 17. New Delhi, India: RWC.
Tahir, M. A.; Younas, M. 2004. Feasibility of dry sowing technology of wheat in cotton growing districts and impactevaluation of zero tillage technology in rice growing districts. Publication No. 364. Lahore: Punjab EconomicResearch Institute (PERI).
Timsina, J.; Connor, D. J. 2001. Productivity and management of rice-wheat cropping systems: Issues and challenges.Field Crops Research 69 (2): 93-132.
Tripathi, J.; Adhikari, C.; Lauren, J. G.; Duxbury, J. M.; Hobbs, P. R. 2006. Assessment of farmer adoption of surfaceseeded wheat in the Nepal terai. Rice-Wheat Consortium Paper Series 19. New Delhi, India: RWC.
Ullah, M. K.; Habib, Z.; Muhammad, S. 2001. Spatial distribution of reference and potential evapotranspiration acrossthe Indus basin irrigation systems. IWMI Working Paper 24. Pakistan Country Series No. 8. Lahore, Pakistan:International Water Management Institute.
Yadav, A.; Malik, R. K. 2005. Herbicide resistant Phalaris minor in wheat - A sustainability issue. Resource Book.Hisar, India: Department of Agronomy and Directorate of Extension Education. CCS Haryana Agricultural University.
Research Reports
5. Evolution of Irrigation in South and Southeast Asia. Randolph Barker and FrançoisMolle. 2004.
6. Macro Policies and Investment Priorities for Irrigated Agriculture in Vietnam.Randolph Barker, Claudia Ringler, Nguyen Minh Tien and Mark Rosegrant. 2004.
7. Impacts of Irrigation on Inland Fisheries: Appraisals in Laos and Sri Lanka. SophieNguyen-Khoa, Laurence Smith and Kai Lorenzen. 2005.
8. Meta-Analysis to Assess Impact of Watershed Program and People’s Participation.P.K. Joshi, A.K. Jha, S.P. Wani, Laxmi Joshi and R.L. Shiyani. 2005.
9. Historical Transformations of the Lower Jordan River Basin (in Jordan): Changesin Water Use and Projections (1950–2025). Rémy Courcier, Jean-Philippe Venotand François Molle. 2005.
10. Cities versus Agriculture: Revisiting Intersectoral Water Transfers, Potential Gainsand Conflicts. François Molle and Jeremy Berkoff. 2006.
11. Prospects for Productive Use of Saline Water in West Asia and North Africa.John Stenhouse and Jacob W. Kijne. 2006.
12. Impact of Land Use on River Basin Water Balance: A Case Study of the ModderRiver Basin, South Africa. Y.E. Woyessa, E. Pretorius, P.S. van Heerden,M. Hensley and L.D. van Rensburg. 2006.
13. Intensifying Agricultural Sustainability: An Analysis of Impacts and Drivers in theDevelopment of ‘Bright Spots’. A. D. Noble, D. A. Bossio, F. W. T. Penning deVries, J. Pretty and T. M. Thiyagarajan. 2006.
14. Multifunctional Agricultural Policy, Reduced Domestic Support and LiberalizedTrade: An Empirical Assessment for Taiwanese Rice. Richard N. Boisvert andHung Hao Chang. 2006.
15. Tropical River Fisheries Valuation: A Global Synthesis and Critical Review.Arthur E. Neiland and Christophe Béné. 2006.
16. Planning and Managing Water Resources at the River-Basin Level: Emergenceand Evolution of a Concept. François Molle. 2006.
17. Water Requirements of Floodplain Rivers and Fisheries: Existing Decision SupportTools and Pathways for Development. A. H. Arthington, E. Baran, C. A. Brown, P.Dugan, A. S. Halls, J. M. King, C. V. Minte-Vera, R. E. Tharme and R. L.Welcomme. 2007.
18. Irrigated Agriculture, Water Pricing and Water Savings in the Lower Jordan RiverBasin (in Jordan). Jean-Philippe Venot, François Molle and Yousef Hassan. 2007.
19. Adoption and Impacts of Zero Tillage as a Resource Conserving Technology in theIrrigated Plains of South Asia. Olaf Erenstein, Umar Farooq, R.K. Malik andMuhammad Sharif. 2007.

ISSN 1391-9407ISBN 978-92-9090-678-0
Postal Address: IWMI, P O Box 2075, Colombo, Sri Lanka Location: 127 Sunil Mawatha, Pelawatte, Battaramulla, Sri LankaTelephone: +94-11 2880000 Fax: +94-11 2786854
Email: [email protected] Website: www.iwmi.org/assessment
Adoption and Impacts of Zero Tillage as a Resource Conserving Technology in the Irrigated Plains of South Asia
Olaf Erenstein, Umar Farooq, R.K. Malik and Muhammad Sharif
Research Report 19