Effectiveness of protected areas in conserving tropical ... - Nature
Upload
khangminh22Category
view
0download
0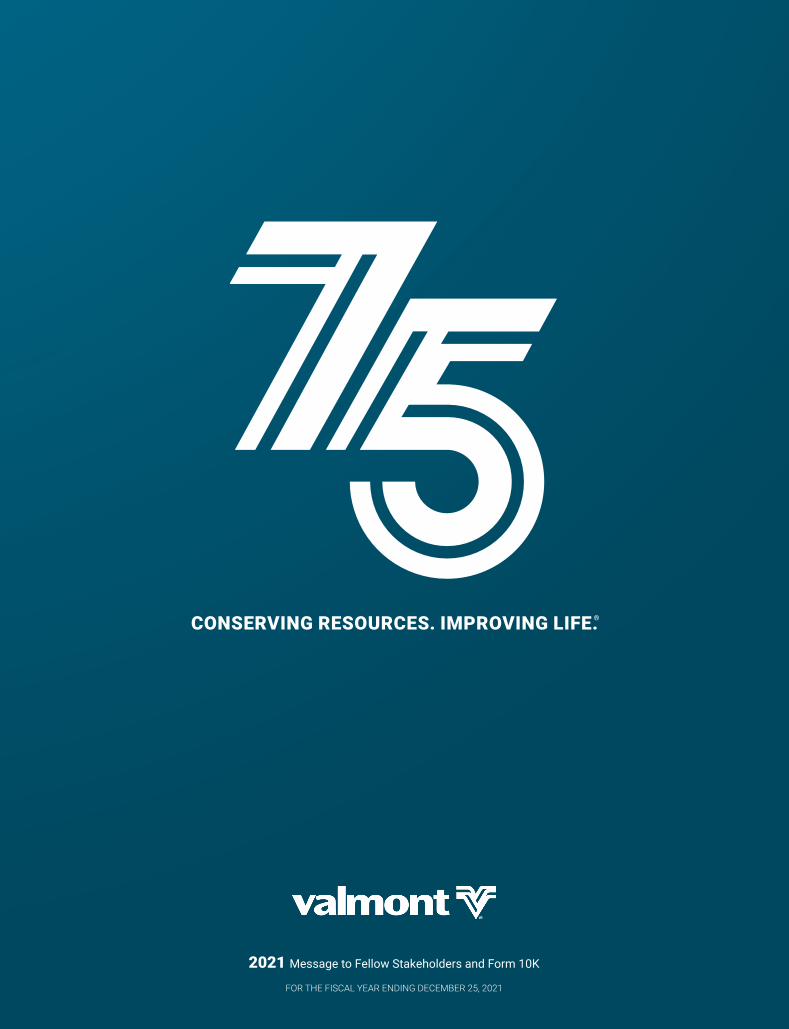
CONSERVING RESOURCES. IMPROVING LIFE.®
2021 Message to Fellow Stakeholders and Form 10K
FOR THE FISCAL YEAR ENDING DECEMBER 25, 2021

A MESSAGE TO OUR
STAKEHOLDERS
his expertise and leadership for over 40 years as a board member. His legacy will continue through Valmont, the individuals who knew him and the entire Omaha community.
Since our founding, we have built a diversified and complementary portfolio of businesses, infused technology across all segments and maintained financial discipline. We stay true to our core values and build upon our proven corporate strategies. As a result, Valmont has grown into a global leader in both infrastructure development and advancing agricultural productivity.
Through the year’s events, we displayed the resiliency critical to remaining a leader in our markets. Our shared vision enabled us to deliver record net sales of $3.5 billion and return on invested capital of 10.1% (11.7% adjusted). Importantly, we continued making growth investments in our businesses, including the transformative acquisition of Prospera Technologies, Ltd. We recognized operating margin improvement and ended the year with positive operating cash flows, despite elevated working capital levels due to rapid inflation and strategic purchasing of raw materials to serve our customers. Global backlog at the end of the year exceeded $1.6 billion, reflecting the strong end-market demand across our businesses. In summary, we executed another very strong financial and operational year in 2021, adding to our five-year history of delivering approximately 13% compounded returns to shareholders.
Stephen G. KaniewskiPresident & Chief Executive Officer
We began 2021 celebrating our 75th anniversary as a company, commemorating our long history of delivering unparalleled service to our customers that improves lives around the world. Valmont was founded by Robert B. Daugherty, an entrepreneur with a vision to bring innovation to agriculture and a dedication to water conservation. Those early roots grew into a lifelong commitment to sustainability for Valmont and shaped the principles of our company to do more with less by innovating through technology, as conveyed in our tagline: Conserving Resources. Improving Life.®
Reflecting on the last twelve months, I am extremely proud of our 11,000 global employees. Often in business we are presented with challenges in which we must come together to surpass and emerge stronger. Guided by our core values of passion, integrity, continuous improvement and delivering results, our strong team was able to minimize the macro-economic impacts throughout the year with strategic initiatives. We implemented work-from-home measures for administrative employees and factory protocols to ensure the health and safety of our employees during the pandemic. We employed disciplined pricing and purchasing actions to combat broad-based inflation. And our global operations and production teams successfully managed through unique supply chain dynamics.
2021 was also the year we said goodbye to a dear friend and influential colleague, Walter Scott Jr. — he guided Valmont with
CONSERVING RESOURCES. IMPROVING LIFE.®

Revenues of $3.5 billion–An increase of 20.9% from fiscal 2020
$3.5B1
Delivering on Our Commitments
2021 FINANCIAL PERFORMANCE
1Segment results are detailed in the 2021 fourth quarter earnings results and the attached 2021 10-K
2Excludes expenses for impairment of long-lived assets, write-off of a receivable, severance and other non-recurring expenses; see reconciliation provided on the financial highlights page.
3 Calculation of average invested capital is on page 31 of the attached Form 10-K. The adjusted after-tax return on invested capital presented is further calculated by using adjusted operating income of $334.0 million, an adjusted tax rate of 23.6% (adjusted to exclude expenses for impairment of long-lived assets, write-off of a receivable, severance and other non-recurring expenses) for an adjusted after-tax return on invested capital of 11.7%.
Operating Income
$286.8M $334.0MGAAP Adjusted2
Operating Margin
8.2% 9.5%GAAP Adjusted2
Earnings per Diluted Share
$9.10 $10.92GAAP Adjusted2
After-Tax Return on Invested Capital
10.1% 11.7%GAAP Adjusted3
One Year Total Shareholder Return for Fiscal Year Ending December 25, 2021 Compounded Annual Total Return to Shareholders of 12.8% Over the Past 5 Years
43.4%

Focusing on Our Businesses:
INFRASTRUCTURE AND AGRICULTURE
ment improved to nearly 11% in 2021, due to favorable pricing, enhanced productivity and improved ship-complete and on-time delivery metrics, as well as improved fixed cost leverage throughout the year.
Coatings: extending the life of metal
Our Coatings segment delivered net sales of $386.3 million, a growth of nearly 11.9% year-over-year, as global economies improved significantly from the COVID-19 induced slowdown in 2020. Favorable pricing and higher volumes, including intersegment sales, contributed to this growth, as we continue to maximize our coatings facilities footprint to support both external customers and internal steel products produced by our other segments. Additionally, during the second quarter, we commenced operations at a new greenfield facility near Pittsburgh, Pennsylvania. This facility has been built with enhanced processes to generate less heat and humidity and provide additional recycling opportunities, aligning well with our ESG principles, while supporting economic development in this region.
The Infrastructure Investment and Jobs Act (IIJA) provides longer-term funding stability resulting in a multi-year tailwind for all of infrastructure. Areas of emphasis include updating aging infrastructure, reducing traffic congestion and carbon emissions, hardening the electrical grid and increasing access to wireless connectivity nationwide. We expect our Coatings segment could benefit near the end of 2022, with Utility Support Structures and Engineered Support Structures segments benefiting for many years ahead. We remain confident in a robust market going forward and in our ability to execute and deliver results.
Infrastructure
Utility: ushering in the grid of the future
Our Utility Support Structures segment achieved nearly 11.9% growth year-over-year, with net sales growing to $1.12 billion, driven by strong underlying demand from utilities’ increasing investments in grid hardening and resiliency. North American utilities have been increasing their planned investments in transmission and distribution projects, exceeding recent years of higher capital spending which is supporting higher demand going forward. We strategically increased capacity with the groundbreaking of a new spun concrete distribution pole plant in Bristol, Indiana. While rapid raw material inflation impacted operating margins, we continued to raise prices throughout the year to offset these impacts. Profitability improvement is expected as contractual pricing mechanisms become more aligned with cost inflation in future quarters. This year, we accelerated growth and new product innovation within our global generation products to support renewable energy markets and were disciplined in our approach of strategically accepting projects that met our profitability targets. In 2021, we built a backlog of both utility scale and distributed generation projects, while investing in a strong team of sales and engineering talent, positioning us well for future growth.
ESS: protecting and connecting people and places
Our Engineered Support Structures segment recognized net sales of $1.06 billion, growth of nearly 6.9% year-over-year from the benefits of favorable pricing and higher volumes. Improvements in commercial lighting markets offset softer transportation sales in North American markets, as pandemic-related delays impacted timing of road and construction projects. Wireless communication product sales grew 26% due to increased capital investments from wireless carriers and favorable pricing. The build-out of 5G will continue to provide a tailwind in 2022 and beyond. Profitability in this seg-

This year, we created a global, cross-functional partnership between our Utility solar team and world-class Valley Irrigation dealer network to deliver integrated solutions. We demonstrated how technology deployment and renewable energy work together by transforming arid land of the Sudan Desert into a prosperous and sustainable region for agricultural production. Our teams made reliable irrigation possible, off-grid, by installing a photovoltaic power plant which provides energy to power center pivot irrigation. Projects like this enhance productivity, empower local communities and support both our own and our customers’ ESG initiatives.

Focusing on Our Businesses:
INFRASTRUCTURE AND AGRICULTURE
Agriculture
Irrigation: increasing ag productivityOur Irrigation segment delivered record net sales of $1.02 billion, driven by strong underlying agriculture fundamentals globally. In North America, demand strengthened as net farm income levels positively impacted farmer sentiment, leading to nearly 60% sales growth year-over-year. International sales also improved significantly, growing more than 80% year-over-year, led by strong demand in Brazil, Europe and Australia and ongoing deliveries of the large project for the Egypt market. Over the past year, we improved our positioning in key growth markets by localizing additional operations in Dubai and increasing our capacity in Brazil. As in our infrastructure businesses, we took decisive pricing actions by implementing multiple price increases to mitigate rising input costs. Additionally, we were pleased with the sales growth of industrial tubing products this year.
We have accelerated our investment in artificial intelligence (AI), machine learning (ML) and connected crop management through both organic and inorganic actions. Our technology sales grew more than 45% year-over-year, and we are very excited about its growth potential.
We acquired Prospera Technologies Ltd. for $300 million, creating the largest global, vertically integrated AI company in agriculture. Building on our successful two-year partnership, we are accelerating adoption of real-time in-season crop management solutions under a recurring revenue model. This highly differentiated solution expands our total addressable market by pursuing opportunities beyond traditional, pivot-based irrigated acres and provides great returns for our growers. Additionally, we acquired PivoTrac, a subscription-based ag tech company that provides remote sensing and monitoring solutions for the Southwest U.S. market. With these acquisitions we have grown our Ag Tech team to over 200, adding substantial talent in machine learning, computer vision, agronomy and data science. We have advanced our strategy of enabling future growth through subscription-based data analytics and insights by providing a solution no one else in the industry can offer. It is this type of competitive advantage, supported by our capital allocation strategy, that positions Valmont to win in the market.

Our approach to capital allocation is to effectively balance capital invested to grow the business with the return of capital to shareholders. This structured and disciplined framework provides more than just a healthy and clean balance sheet. Properly employed, it becomes the backbone supporting strategic growth as the balance sheet is used to reinvest in our business, supporting organic growth projects as well as strategic acquisitions that expand our market presence and bring a high return on invested capital.
Acquisitions are more than just a path to growth. We view them as a means to add capability that is difficult to replicate. This past year we completed two key acquisitions, Prospera and PivoTrac, both providing new technology in addition to expanding our addressable markets. These businesses, now a part of our growing family, expand our earnings power and increase our cash flow, providing more capital with which to fund our growth strategy. And the unique capabilities they contribute establishes a new foothold to innovate and bring new solutions to our customers.
Organic growth is funded primarily through targeted investments in capital expenditures to support strategic initiatives. In addition to growth, we also prioritize investment opportunities to support digital customer experience, Industry 4.0 advanced manufacturing and ESG-related initiatives. These are identified and selected through a robust internal process that instills a disciplined approach to investments, maximizing our returns.
The other objective of our capital allocation strategy is to return cash to shareholders through share repurchases and dividends. In 2021, we returned $67.5 million to shareholders through a combination of opportunistic share repurchases and consistent, growing dividends. For dividends, our goal is to increase them over time as a function of earnings growth, raising our payout ratio to align with our strategy of increasing returns to shareholders. In February 2021, we increased our dividend by 11%, while increasing our payout ratio target from 15% to 22%. In summary, we are maintaining a disciplined and balanced capital allocation driven by increasing ROIC and creating stakeholder value.
Capital Allocation:
A BALANCED APPROACH; ACQUISITION HIGHLIGHTS
Acquisitions
• 2021 included Prospera Technologies and PivoTrac• Strategic fit + market expansion• Returns exceeding cost of capital within three years
Capital Expenditures
• 2021 CapEx of $108M in line with expectations• Investments to support strategic growth initiatives and Industry 4.0 advanced manufacturing
Dividends
• 11% dividend increase announced February 2021• Payout ratio target: 22% of earnings• Year End payout: ~19%
Share Repurchases
• Opportunistic approach, supported by free cash flow• ~$122M remained on current authorization at 12/25/21
Gro
win
g O
ur B
usin
ess
Retu
rnin
g Ca
sh to
Sha
reho
lder
s
$488M of Capital Deployed in 2021
Aquisitions$82M
Share Purchases
$63M
ACQUISITIONS$313M
CAPITAL EXPENDITURES
$108M
DIVIDENDS$41M
SHAREREPURCHASE
$26M
CONSERVING RESOURCES. IMPROVING LIFE.®

Valmont at a Glance:
GLOBAL SECULAR GROWTH DRIVERS
Engineered Support Structures• Ongoing investment in sustainable transportation infrastructure, including lighting systems, long- lasting bridge systems and vibration mitigation technology
• Unprecedented demand for improved wireless network structures and components including rural broadband and urban densification
• Rapid acceleration of 5G network deployment
• Increasing demand for integrated smart technology solutions
Utility Support Structures• Need to replace aging infrastructure resulting from long-term underinvestment in electric grids
• Increasing load growth in developing markets requires enhanced grid resiliency for uninterrupted power
• Heightened demand for renewable energy sources with distributed generation
• Replacement of wood distribution and transmission poles with stronger materials that reduce landfill waste
• Expanded offerings of prefabricated and packaged turnkey substations
• Demand for quicker, safer and more accurate inspection services with unmanned aerial services and drone technology
Irrigation• Increasing customer demand around the globe for sustainable solutions to conserve resources at every level of the value chain
• Growing populations, combined with constrained available farmland, require greater efficiency and crop yields
• Continuing labor shortages in the midst of a global pandemic, as well as rising farm labor and input costs
• Innovation toward predictive, autonomous crop management through technologies including artificial intelligence and machine learning
• Transforming traditional irrigation into fully connected crop management that optimizes water application and conserves inputs such as energy and labor.
Coatings• Protection of critical infrastructure from corrosion and premature obsolescence
• Efficient deployment of tax dollars for low-carbon infrastructure investment
• Developing economies’ need for new infrastructure, as well as mature economies’ responsible replacement of aging infrastructure
• Demand for sustainable, limited-maintenance materials with a low lifecycle cost with 100% recyclability
• Innovative digital transformation for lean processes, focused customer communication and product tracking
• Sophisticated data analytics, enhanced by machine learning and artificial intelligence, help us identify future customer and operational innovations
Valmont has an enduring commitment to conserving resources and improving life. We create vital infrastructure and advance agricultural productivity to meet the increasing demands of an ever-changing world. Our long-term drivers remain intact; shorter term is also opportunistic with each of our businesses trending upward in their cycles, providing market tailwinds heading into 2022.
CONSERVING RESOURCES. IMPROVING LIFE.®

$3.5Billion Dollars in Net Sales
100+Countries
of Operation
22Countries with
Valmont Facilities
85Manufacturing
Facilities Worldwide
4Segments in which
we do Business
11,000+Global
Employees
72%AMERICAS
2021 REVENUE BY GEOGRAPHY
14%EMEA
14%APAC
Valmont Manufacturing Facilities (85)
CONSERVING RESOURCES. IMPROVING LIFE.®

SUSTAINABILITY
Our tagline of Conserving Resources. Improving Life.® is at the core of everything we do, as our products and services align to critical ESG principles such as manufacturing irrigation systems that reduce inputs and enhance food security as well as providing infrastructure solutions that support clean energy, connectivity and longevity. This commitment goes far beyond compliance as our operational excellence is infused with ESG principles. With everything we do, we look through a lens of sustainability to become more efficient, enhance our employees’ experience, and ultimately provide value to our shareholders. We are continuously improving to minimize our environmental impact while providing differentiated and enhanced offerings to our customers.
We are pleased that our efforts are being acknowledged externally. One example is with Institutional Shareholder Services, or ISS. Our environment and social quality scores improved significantly in 2021, from a 6 to a 2 for environment, from a 6 to a 4 for social, and governance has held steady at a solid 2. While this is a continuous journey, we are proud of the progress we have made so far.
I encourage you to read more about our commitment to ESG in our upcoming 2022 Valmont Sustainability Report and at our dedicated sustainability website. The accomplishments and stories we share highlight the innovative ways we are exploiting our footprint to make tangible differences in communities around the globe.
I am proud to have announced our 2025 sustainability goals for carbon intensity, global electricity, global combustion fuel, and diversity.
Our 2025 Goals:
• 10% reduction in Scope I/II carbon intensity
• 12% additional reduction in normalized global electrical usage
• 19% reduction in Scope I mobile source combustion fuel carbon emissions
• 50% increase in people of color representation, double by 2030

• Reduced normalized electricity by ~28% since 2018 baseline, surpassing our Global Electricity Goal of 8% reduction
• Since 2018 Valmont has reduced its Scope 1 and Scope 2 carbon emissions by over 5,900 metric tons. Climate initiatives implemented at the site and enterprise level resulted in a 22.08 MT CO2/$M reduction in carbon emissions for 2021, beating the annual target by 24%
• Of our 85 Green Teams, we recognized our manufacturing facility in Maarheeze, Netherlands, with our annual Sustainability Award for their dramatic improvements in key sustainability and employee engagement metrics
• Completed an electric vehicle program at our largest manufacturing facility in Valley, Nebraska, replacing onsite gas-powered vehicles and removing the onsite gasoline tank
• Our one-megawatt solar field went live in Valley, Nebraska, utilizing our own TRJ solar tracker solution, providing carbon free power that will offset approximately 6% of energy on campus yearly
• Guided by our Inclusion and Diversity Chair, Valmont expanded its Employee Resource Groups this year to include: African American Network Team (AANT), Hispanic Organization for Leadership and Advancement (HOLA), Indian-American Leadership Council (INDUS), Valmont Young Professionals, PRIDE, and SALUTE
• 86% of our employee global workforce completed our bi-annual employee engagement survey, up 3% from 2019; positive results indicated Valmont employees felt: clarity of direction, opportunities in growth and development, ample resources and confidence in direct supervisors
• Completed construction of a new global headquarters in Omaha, Nebraska which was built to achieve LEED silver, WELL and JUST certifications
• Our board is 27% female and 18% ethnically diverse, representing a broad set of professional experiences and backgrounds core to Valmont operations
Sustainability:
OUR 2021 ACCOMPLISHMENTS
CONSERVING RESOURCES. IMPROVING LIFE.®
STRATEGY FOR
SUSTAINABLE, LONG-TERM PROFITABLE GROWTH
Elevating ESG: Operational Excellence with ESG Focus
For years we have focused on doing what we do better, pushing us to deliver higher quality products, meet or exceed customer expectations and become a premium solutions provider. This operational excellence focus is derived from Industry 4.0 principles and Lean methodology supported by Agile project management. We are leveraging our resources around the globe as we continue our digital transformation initiative, which will provide efficiency, savings, and scale for Valmont while enhancing our customer experience.
Over time, ESG has expanded to include productivity and growth, representing a move from simply reporting environmental impacts to enabling resource optimization and empowering our talented team. It drives everything we do, including employee engagement, and provides us with a valuable competitive advantage within our markets. Together, operational excellence with a focus on ESG will elevate our performance and enable us to accomplish more by working with increased discipline around how we best serve our stakeholders long term.
Accelerating Growth: Expanding Markets that We Serve
We have a diversified business with strategic focus areas that provide a clear line of sight to expand market presence and accelerate growth. In our Utility Support Structures segment, we are growing our services and technology while focusing on grid resiliency and renewable generation. Our Engineered Support Structures growth areas are infrastructure renewal to enable economic development, coupled with global 5G deployment and smart city designs. Our Coatings segment protects critical infrastructure and we’re expanding in targeted geographies while differentiating through our customer experience. Finally, our Irrigation segment is expanding through digital crop management solutions which provide food security and resource conservation. Our focus on these areas will expand our addressable markets and accelerate our growth, further differentiating our brand and supporting our leadership position in the markets we serve.
Optimizing Talent and Technology: Accelerating Innovation
Trends in global technology provide the framework for how we think about delivering our solutions to the market. Four trends are essential for our business: Internet of Things, Industry 4.0, Recurring Revenue Services, and Digital Customer Experience. Our leadership team is aligned with using these technology trends to drive creative disruption across our organization. This vision is cascading throughout the organization, supporting initiatives that will help us transform while staying close to our core values.
We recognize that being at the forefront of cutting-edge technologies aids our talent strategy and is a competitive advantage in attracting and retaining the best and brightest. We continue to prioritize promotions within the company, encouraging our talent to expand their skills and develop their careers with new opportunities within the company. By enhancing our talent development process across the organization, we can identify and develop talent early in an employee’s career and align their interests with needs of the business.
We held our most recent Investor Day in May. It is always an honor to represent Valmont to the investment community, outlining our strategy and growth opportunities. During the event, we presented the next evolution of our strategy with a focus on three strategic pillars.
CONSERVING RESOURCES. IMPROVING LIFE.®

The past two years have demonstrated just how rapidly the world can change. At Valmont, we have been learning and adapting for 75 years, and have proven that change is notnew for us. We not only change with the times but change in anticipation for challenges ahead. To stay relevant in the future, we will continue to innovate and adapt faster than ever to help our customers solve their biggest problems.
Our response to recent events has shown the strength and resiliency of our team, our commitment to our customers and our ability to successfully execute and deliver in difficult situations. I want to thank all our team members for their hard
OUR COMMITMENT TO LONG-TERM SHAREHOLDER VALUE CREATION;
NEW 3 TO 5 YEAR FINANCIAL GOALS ANNOUNCED IN 2021
Our 3 to 5 Year Financial Targets:
Revenue Compound Annual Growth Rate (CAGR) of 7 – 12%
EPS CAGR of 13 – 15%
Return on Invested Capital (ROIC) of >11%
Free Cash Flow Conversion of 1 >1.0X
Operating Margin of >12%
1 Long-term, multi-year goal
work. Together, we are delivering on our financial commitments, bringing innovation to our customers and fostering a culture of collaboration that encompasses our core values. I am proud of the results and accomplishments of Valmont.
Based upon the exceptional performance of our entire team and the positive outlook for end market demand, we have defined a new set of 3-to-5-year financial targets (from Base Year 2020).
I am confident in our teams’ ability to meet these targets, once again raising the bar on what we are able to accomplish together.
NET EARNINGS(over the 5-year period)
CONSERVING RESOURCES. IMPROVING LIFE.®

LOOKING AHEAD
We enter 2022 with strong momentum. We made great businesses better, brought solutions to the world’s most critical problems and improved the quality of life for individuals around the world. Our core values continue to guide us and our simplified strategy provides the framework to drive our performance and maximize the positive impact we have for our stakeholders. We are confident in our ability to deliver solid operating results with margin expansion, growing free cash flow, and a higher return on invested capital. As always, we remain committed to a balanced capital allocation approach that grows our business and continues returning cash to shareholders.
We stand beside our colleagues across time, and appreciate their dedication to improving our businesses and overcoming unique challenges to strengthen and carry Valmont forward.
Our core values, dedicated employees, and shared vision of Conserving Resources. Improving Life.® have served us well for 75 years. I am confident that together we can achieve our goals for growth, profits, and capital to shareholders, and are well on our way to serve our customers in even better ways in the next 75 years.
Thank you for your continued support.
Stephen G. Kaniewski President & Chief Executive Officer

OPERATING RESULTSNet sales
Operating income1
Net earnings2,4
Diluted earnings per share4
Dividends per share
2020
$ 2,895.4
225.9
140.7
6.57
1.80
2019
$ 2,767.0
227.9
146.4
6.73
1.50
2021
$ 3,501.6
286.8
195.6
9.10
2.00
FINANCIAL POSITIONTotal shareholders’ equity
Invested capital3
$ 1,207.8
1,974.2
$ 1,189.7
1,977.2
$ 1,413.6
2,379.0
YEAR-END DATAShares outstanding (OOO’s)
Approximate number of shareholders
Number of employees
21,225
17,768
10,844
21,544
21,631
10,398
21,493
25,765
11,041
$ GAAP $ ADJUSTED
Dollars in millions, expect per share amountsNet Sales
$2,895
2021 20192020
$2,767$3,502
Operating Income20192021 2020
$227.9
$225.9
$268.51
$286.8
334.01
Diluted Earnings Per Share2021 20192020
$6.73
$6.57
$8.184
$9.10
$10.924
OPERATING PROFITSGross profit as a % of net sales 26.4% 24.7%25.2%
Operating income as a % of net sales 7.8% 8.2% 8.2%
Net earnings as a % of net sales 4.9% 5.3% 5.6%
Return on invested capital3 8.7% 8.9%10.1%
Adjusted operating income as a % of net sales1 9.3% 8.2% 9.5%
Adjusted net earnings as a % of net sales4 6.1% 5.3%6.7%
1Fiscal 2021 GAAP operating income included impairment costs of long-lived assets for offshore structures of $27.9 million (pre-tax), intangible amortization and stock-based compensation for Prospera of $8.6 million (pre-tax), receivable write-off of $5.5 million (pre-tax), acquisition diligence expense of $1.1 million (pre-tax) and severance expense of $4.1 million (pre-tax). On an adjusted basis operating income was $334.0 million. Fiscal 2020 GAAP operating income included restructuring and asset impairment costs of $25.9 million (pre-tax), goodwill and intangible asset impairments of $16.6 million (pre-tax). On an adjusted basis, operating income was $268.5 million. Adjusted operating income excludes the above amounts for each respective year.2Net earnings attributable to Valmont Industries, Inc. 3See Item 7, Selected Financial Measures, in the company’s Form 10-K for calculation of invested capital and return on invested capital. 4Fiscal 2021 GAAP net earnings included impairment costs of long-lived Offshore structures assets of $21.7 million after-tax ($1.01 per share), intangible amortization and stock-based compensation for Prospera of $6.6 million after-tax ($0.31 per share), receivable write-off of $4.2 million after-tax ($.20 per share), acquisition diligence expense of $0.9 million after-tax ($0.04 per share), severance expense of $3.1 million after-tax ($0.14), impact of UK tax rate change of $2.8 million ($0.13 per share) and valuation allowance against deferred tax asset of $5.1 million ($0.24 per share). Fiscal 2020 included impairments of goodwill and intangible assets of $16.2 million after-tax ($0.76 per share), restructuring and asset impairment costs of $18.2 million ($0.85 per share). Adjusted net earnings excludes the above amounts for each respective year.5Calculation of average invested capital is on page 31 of the attached Form 10-K. The adjusted after-tax return on invested capital presented is further calculated by using the adjusted operating income and adjusted tax rate for each applicable year.
For more information on the footnotes above and the reasons why we believe the non-GAAP measures are useful, please see Item 7 and Item 8 of the attached 2021 form 10-K
Adjusted return on invested capital5 10.3% 8.9% 11.7%

Claudio O. LaterreurSenior Vice PresidentInformation Technology & Chief Information Officer
T. Mitchell ParnellSenior Vice PresidentHuman Resources
Renee L. CampbellSenior Vice PresidentInvestor Relations &Treasurer
Timothy P. FrancisSenior Vice President & Corporate Controller
Aaron M. SchapperGroup President,Infrastructure
Diane LarkinExecutive Vice PresidentGlobal Operations
Conserving Resources. Improving Life.®
OUR LEADERSHIP
Corporate Management
Ellen S. DasherVice PresidentGlobal Taxation
R. Andrew MasseyVice PresidentChief Legal Officer & Corporate Secretary
Avner M. ApplbaumExecutive Vice President& Chief Financial Officer
Stephen G. KaniewskiPresident & Chief Executive Officer
Executive Officers
CONSERVING RESOURCES. IMPROVING LIFE.®

Board of Directors
Catherine J. PagliaLead Director
Enterprise Asset Management
Audit CommitteeHuman Resources
Committee
Ritu FavreEVP & GM
National InstrumentsSemiconductor &
Electronics, Aerospace, Defense & Government
& Transportation Business Units at NI
Chair, ESG Committee Governance &
Nominating Committee
K.R. Den DaasRetired CEO, Quality
Light SourceRetired EVP
Phillips Lighting B.V. of the Netherlands
Chair, Audit Committee ESG Committee Governance &
Nominating Committee
Mogen C. BayChairman
Valmont Industries, Inc.
Dr. Theodor W. FreyeRetired CEO
of CLAAS KgaAESG Committee Governance &
Nominating Committee
Joan Robinson-Berry Retired SVP & Chief
EngineerThe Boeing Company
Human ResourcesCommittee
Stephen G. KaniewskiPresident & CEO
Valmont Industries, Inc.
Richard LanohaPresident & CEO
Kiewit CorporationHuman Resources
Committee
Daniel P. NearyFormer Chairman &
Retired CEOMutual of OmahaAudit CommitteeESG Committee
Chair, Human Resources Committee
James B. MillikenChancellor
University of Texas System
Audit CommitteeESG Committee
Chair, Governance & Nominating Committee
Clark T. Randt, Jr.President,
Randt & Co LLCFormer U.S.
Ambassador to the People’s Republic
of ChinaESG CommitteeGovernance &
Nominating Committee
CONSERVING RESOURCES. IMPROVING LIFE.®

Shareholder and Investor Relations
Valmont’s common stock trades on the New York Stock Exchange (NYSE) under the symbol VMI. We make available, free of charge through our website at valmont.com, our Annual Report on Form 10-K, quarterly reports on Form 10-Q, current reports on Form 8-K, and amendments to those reports filed or furnished pursuant to Section 13(a) or 15(d) of the Securities Exchange Act of 1934, as soon as reasonably practicable after such material is electronically filed with or furnished to the Securities and Exchange Commission. We have also posted on our website our (1) Corporate Governance Principles, (2) Charters for the Audit Committee, ESG Committee, Human Resources Committee and Governance and Nominating Committee of the Board, (3) Code of Business Conduct and (4) Code of Ethics for Senior Officers applicable to the Chief Executive Officer, Chief Financial Officer and Corporate Controller. Valmont shareholders may also obtain copies of these items at no charge by contacting:
Renee L. CampbellSVP Investor Relations & Treasurer
Valmont Industries, Inc.
15000 Valmont Plaza
Omaha, NE 68154 USA
+1 402.963.1000
CONTACT INFORMATION
Corporate Headquarters
Valmont Industries, Inc.
15000 Valmont Plaza
Omaha, NE 68154 USA
+1 402.963.1000
valmont.com
Independent Registered Public Accounting Firm
Deloitte & Touche LLP
Omaha, Nebraska USA
Stock Transfer Agent and RegistrarAddress Inquiries To:
Broadridge Corporate Issuer Solutions, Inc.
PO Box 1342
Brentwood, New York 11717-0718 USA
+1 844.202.5345 or +1 720.414.6878
Annual Meeting
The annual meeting of Valmont® shareholders
will be held at 1:00 p.m. CDT, on Tuesday, April 26, 2022,
at 15000 Valmont Plaza, Omaha, Nebraska USA.
CONSERVING RESOURCES. IMPROVING LIFE.®

UNITED STATESSECURITIES AND EXCHANGE COMMISSION
Washington, D.C. 20549___________________________________
Form 10-K (Mark One)☒ ANNUAL REPORT PURSUANT TO SECTION 13 OR 15(d) OF THE SECURITIES EXCHANGE ACT OF 1934
For the fiscal year ended December 25, 2021
or
☐ TRANSITION REPORT PURSUANT TO SECTION 13 OR 15(d) OF THE SECURITIES EXCHANGE ACT OF 1934
For the transition period from ____________ to Commission file number 1-31429
_____________________________________
Valmont Industries, Inc. Delaware 47-0351813
(State or Other Jurisdiction of Incorporation or Organization)
(I.R.S. Employer Identification No.)
15000 Valmont Plaza, Omaha, Nebraska 68154
(Address of Principal Executive Offices) (Zip Code)
(402) 963-1000 (Registrant’s telephone number, including area code)
Securities registered pursuant to Section 12(b) of the Act:
Title of each class SymbolName of exchange on which
registeredCommon Stock $1.00 par value VMI New York Stock Exchange
Securities registered pursuant to Section 12(g) of the Act: NoneIndicate by check mark whether the registrant is a well-known seasoned issuer, as defined in Rule 405 of the Securities Act. Yes x No oIndicate by check mark whether the registrant is not required to file reports pursuant to Section 13 or 15(d) of the Exchange Act. Yes o No xIndicate by check mark whether the registrant (1) has filed all reports required to be filed by Sections 13 or 15(d) of the Securities Exchange Act of
1934 during the preceding 12 months (or for such shorter period that the registrant was required to file such reports), and (2) has been subject to such filing requirements for the past 90 days. Yes x No o
Indicate by check mark whether the registrant has submitted electronically every Interactive Data File required to be submitted pursuant to Rule 405 of Regulation S-T (§232.405 of this chapter) during the preceding 12 months (or for such shorter period that the registrant was required to submit such files). Yes x No o
Indicate by check mark whether the registrant is a large accelerated filer, an accelerated filer, a non-accelerated filer, or a smaller reporting company, or an emerging growth company. See definitions of “large accelerated filer,” “accelerated filer,” “smaller reporting company,” and "emerging growth company" in Rule 12b-2 of the Exchange Act. (Check one):
Large accelerated filer ☒ Accelerated filer ☐ Non‑accelerated filer ☐ Smaller reporting company ☐Emerging Growth Company ☐
If an emerging growth company, indicate by check mark if the registrant has elected not to use the extended transition period for complying with any new or revised financial accounting standards provided pursuant to Section 13(a) of the Exchange Act. o Indicate by check mark whether the registrant has file a report on and attestation to its management's assessment of the effectiveness of its internal control over financial reporting under Section 404(b) of the Sarbanes-Oxley Act (15 U.S.C. 7262(b)) by the registered public accounting firm that prepared or issued its audit report Yes ☒ No o Indicate by check mark whether the registrant is a shell company (as defined in Rule 12b-2 of the Exchange Act). Yes ☐ No ☒
At February 17, 2022 there were 21,279,858 of the Company’s common shares outstanding. The aggregate market value of the voting stock held by non-affiliates of the Company based on the closing sale price the common shares as reported on the New York Stock Exchange on June 26, 2021 was $4,941,040,230.
DOCUMENTS INCORPORATED BY REFERENCEPortions of the Company’s proxy statement for its annual meeting of shareholders to be held on April 26, 2022 (the “Proxy Statement”), to be filed
within 120 days of the fiscal year ended December 25, 2021, are incorporated by reference in Part III.


VALMONT INDUSTRIES, INC.Annual Report Pursuant to Section 13 or 15(d)
of the Securities Exchange Act of 1934For the fiscal year ended December 25, 2021
TABLE OF CONTENTSPage No.
PART IItem 1 Business ............................................................................................................................ 2Item 1A Risk Factors ....................................................................................................................... 10Item 1B Unresolved Staff Comments ............................................................................................. 18Item 2 Properties .......................................................................................................................... 18Item 3 Legal Proceedings ............................................................................................................. 19Item 4 Mine Safety Disclosures ................................................................................................... 19PART IIItem 5 Market for Registrant's Common Equity, Related Stockholder Matters, and Issuer
Purchases of Equity Securities ...................................................................................... 20Item 6 Reserved ............................................................................................................................ 21Item 7 Management's Discussion and Analysis of Financial Condition and Results of
Operation 21Item 7A Quantitative and Qualitative Disclosures About Market Risk .......................................... 37Item 8 Financial Statements and Supplementary Data ................................................................. 38Item 9 Changes in and Disagreements with Accountants on Accounting and Financial
Disclosure ........................................................................................................................ 82Item 9A Controls and Procedures ................................................................................................... 82Item 9B Other Information .............................................................................................................. 84Item 9C Disclosures Regarding Foreign Jurisdictions that Prevent Inspections ............................ 85Part IIIItem 10 Directors, Executive Officers and Corporate Governance 86Item 11 Executive Compensation ................................................................................................... 86Item 12 Security Ownership of Certain Beneficial Owners and Management and Related
Stockholder Matters ........................................................................................................ 86Item 13 .. Certain Relationships and Related Transactions, and Director Independence .................. 86Item 14 Principal Accountant Fees and Services ........................................................................... 86Part IVItem 15 Exhibits and Financial Statement Schedules ..................................................................... 87Item 16 Form 10-K Summary ........................................................................................................ 90
1

PART IITEM 1. BUSINESS.
General
We are a diversified producer of products and services for infrastructure and agriculture markets. Our Infrastructure products and services are delivered through the Engineered Support Structures segment, the Utility Support Structure segment, and the Coatings segment. Our Irrigation products and services are delivered through the Irrigation segment. In 2021, the Company operated and reported its results in the following four reporting segments:
• Engineered Support Structures (ESS);• Utility Support Structures (Utility); • Coatings; and• Irrigation
Our ESS segment offers solutions to help make roadways safer, infrastructure smarter, and increases connectivity through the following products: outdoor lighting, traffic control, and roadway safety structures, wireless communication structures and components, and engineered access systems. Our Utility segment helps deliver power with products to better harden grids to make infrastructure more resilient by selling structures to support electrical transmission, distribution lines, and substation conversion and storage. Our Irrigation segment produces mechanized irrigation equipment and related services to help deliver water, fertilizers, herbicides, and pesticides to agricultural crops that save time, conserve water, energy, and other input costs while also assisting in increasing yields. This segment also develops technology for better precision application including predictive, autonomous crop management. Our Coatings segment provides coatings services for Valmont and other industrial customers, to assist in extending the lifespan of infrastructure.
Customers and end-users of our products include municipalities and government entities globally, manufacturers of commercial lighting fixtures (OEM), contractors, telecommunications and utility companies, and large farming operations, as well as the general manufacturing sector. In 2021, approximately 34% of our net sales were either sold in markets or produced by our manufacturing plants outside of North America.
We were founded in 1946, went public in 1968 and our shares trade on the New York Stock Exchange (ticker: VMI).
Business Strategy
Our strategy is to pursue growth opportunities that leverage our existing product portfolio, knowledge of our principal end-markets and customers and engineering capability to increase our sales, earnings and cash flow, including:
Increasing the Market Penetration of our Existing Products. Our strategy is to increase our market penetration by differentiating our products from our competitors’ products through superior customer service, engineering proficiency, technological innovation and consistent high quality. Our Irrigation segment experienced sales volume growth in 2021 which we believe was partially due to the continuing importance of our precision agriculture/technology offerings.
Bringing our Existing Products to New Markets. Our strategy is to expand the sales of our existing products into geographic areas where we do not currently serve and where end-users do not currently purchase our type of product. For example, we have expanded our geographic presence in Europe, the Middle East, and North Africa for lighting structures. This strategy led to us building manufacturing presences in China and India to expand our offering of pole structures for lighting, utility and wireless communication to these markets. Our Irrigation segment has a long history of developing new emerging markets for mechanized irrigation around the world. In 2020, we secured a $240 million multi-year order for the Egypt market.
Developing New Products for Markets that We Currently Serve. Our strategy is to grow by developing new products for markets using our comprehensive understanding of end-user requirements and leveraging longstanding relationships with key distributors and end-users. In recent years we developed and sold structures for tramway applications in Europe, spun concrete distribution poles for the Utility markets, and began offering concealment solutions for the wireless communication markets.
2

Developing New Products for New Markets or Leveraging Core Competencies to Further Diversify our Business is a path to increase sales. For example, the establishment and growth of our Coatings segment was based on using our expertise in galvanizing to develop what is now a global business segment. The decorative lighting market has different requirements and preferences than our traditional transportation and commercial markets. In 2021, we acquired Prospera Technologies, Ltd., an artificial intelligence technology company focused on machine learning and computer vision in agriculture providing an opportunity to grow recurring revenue through agronomy monitoring software solutions. In 2020, we acquired Solbras®, a provider of solar energy solutions for agriculture and during 2018, we acquired Convert Italia SpA, a provider of engineered single axis solar tracking solutions. These furthered our commitment to renewable energy which we believe will provide us future growth opportunities through the ability to bring power to underserved regions and transform unproductive land into efficient cropland.
Acquisitions
We have grown internally and by acquisition. Our significant business expansions during the past five years include the following (including the segment where the business reports):
2017
• Acquisition of a highway safety business (Aircon) that manufactures guardrails, structural metal products, and solar structural products in India (ESS)
2018
• Acquisition of an integrator of prepackaged pump stations (Torrent Engineering and Equipment) located in Indiana (Irrigation)
• Acquisition of a worldwide provider of parts for agricultural irrigation equipment, Irrigation Components International (ICI), located in the United States (Irrigation)
• Acquisition of an engineering and manufacturer of overhead sign structures (Walpar) located in Southeast United States (ESS)
• Acquisition of 75% of a provider of engineered solar tracker solutions (Convert Italia SpA) headquartered in Italy (Utility)
• Acquisition of a steel lattice structures producer (Derit) located in India (Utility)
• Acquisition of a galvanizing business (CSP Coating Systems) located in New Zealand (Coatings)
2019
• Acquisition of a wireless communication concealment solutions provider (Larson Camouflage) headquartered in Arizona (ESS)
• Acquisition of the remaining 4.8% not previously owned of Valmont SM (Utility)
• Acquisition of a galvanizing business (United Galvanizing) located in Texas (Coatings)
• Acquisition of a manufacturer and distributor of wireless site components and safety products (Connect-It Wireless, Inc.) located in Florida (ESS)
2020
• Acquisition of the remaining 49% not previously owned of AgSense LLC (Irrigation)
• Acquisition of 55% of a provider of solar solutions for Agriculture (Solbras) located in Brazil (Irrigation)
• Acquisition of KC Utility Packaging, LLC, a utility substation product provider (Utility)
2021
• Acquisition of Prospera Technologies, Ltd, an artificial intelligence company in agriculture located in Israel (Irrigation)
• Acquisition of PivoTrac, a remote monitoring Irrigation service company in Texas (Irrigation)
Divestitures
In 2018, the Company divested of Donhad, a grinding media producer in Australia.
3
Segments
The Company has four reportable segments based on our management structure. Each segment is global in nature with a manager responsible for segment operational performance and allocation of capital within the segment.
Our reportable segments are as follows:
Engineered Support Structures: This segment consists of the manufacture and distribution of engineered poles, towers, and components for lighting, transportation, and wireless communication markets, engineered access systems, integrated structure solutions for smart cities, and highway safety products;
Utility Support Structures: This segment consists of the manufacture of engineered steel and concrete structures for utility markets, including transmission, distribution, substation products, and renewable energy generation equipment;
Coatings: This segment consists of galvanizing, CorroCote, anodizing, and powder coating services to preserve and protect metal products; and
Irrigation: This segment consists of the manufacture of center pivots and linear irrigation equipment for agricultural markets, including parts, services, and tubular products, and advanced technology solutions for water management and precision agriculture.
Information concerning the principal products produced and services rendered, markets, competition and distribution methods for each of our four reportable segments is set forth below.
Engineered Support Structures Segment (ESS)
Products Produced—We design, engineer, and manufacture steel, aluminum, wood, and composite poles and structures for a wide range of lighting and highway transportation applications. The demand for these products is driven by infrastructure, commercial and residential construction and by consumers’ desire for well-lit streets, highways, parking lots and common areas. Valmont structures help keep these areas safer, provide technologically advanced solutions for smart cities, and support 24-hour convenience. Beyond design, technical, and engineering needs, customers also want products that are visually appealing and meet local aesthetic requirements. In Europe, Valmont is a leader in decorative lighting poles, which provide an attractive yet functional solution for our customers. We are leveraging this expertise to expand our decorative product sales in North America, and the Middle East.
Valmont traffic and overhead sign structures contribute to the orderly flow of automobile traffic. These poles, which support traffic signals and overhead signs, are engineered to meet customer specifications to ensure the proper function and safety of the structure. Product engineering takes into account factors such as weather (e.g. wind, ice) and the products loaded on the structure (e.g. lighting fixtures, traffic signals, overhead signs) to determine the design of the pole. Valmont has expanded its capabilities in the traffic market with the development of patented vibration mitigation technology which continuously improves the safety of traffic and roadway structures by reducing the effects of wind and fatigue. Our transportation segment also includes highway safety system products that are designed and engineered to enhance roadway safety. These systems include guard rail barriers, wire rope safety barriers, crash attenuation barriers and other products. Additionally, Valmont has expanded into the bridge market with the development of our Con-Struct Bridge system. These steel systems are effective, long lasting, and can be installed quickly to reduce costs and expand the life of the structure.
We also engineer, manufacture, and distribute a broad range of structures (poles and towers), camouflage concealment solutions, and components serving the wireless communication market supporting expanded 5G customer needs. A wireless communication cell site mainly consists of a steel pole or tower, shelter (enclosure where the radio equipment is located), antennas (devices that receive and transmit data and voice information to and from wireless communication devices) and components (items that are used to mount antennas to a structure and to connect cabling and other parts from the antennas to the shelter). Larger monopole structures are engineered and designed to customer specifications, which include factors such as the number of antennas on the structure and wind and soil conditions. Due to the size of these monopole structures, design is important to ensure each structure meets performance and safety specifications.
We also produce and distribute access systems that allow people to move safely and effectively in an industrial, infrastructure or commercial facility. Products offered in this product line include floor gratings, handrails, barriers and sunscreens. We also produce a line of engineered products which are used in architectural and decorative applications. Examples of these products are perforated metal sun screens and facades that can be used on building structures to improve shading and aesthetics. We do not provide any significant installation services on the structures we sell or manufacture.
4

Markets—The key markets for our products and solutions are the transportation, construction, and industrial
markets. The transportation market includes street and highway lighting, traffic control, and bridges; all of which are supported through both state and federal government spending programs. For example, the U.S. government will fund infrastructure improvement through the newly passed Infrastructure Investment and Jobs Act. This bill will allocate funding to reinforce the nation’s bridges, increase safety for the travelling public, update airport, ports, and waterways, and improve the highway and roads systems. Many products from our transportation product portfolio will be utilized when making these enhancements including traffic structures, bridge systems, roadway and street lighting, highmast lighting, etc. Matching funding from the various states may be required as a condition of federal funding. Additionally, public and private partnerships have recently emerged as an additional funding source. In the United States, there are approximately 4 million miles of public roadways, with approximately 24% carrying over 80% of the traffic. Accordingly, the need to improve traffic flow through traffic controls and lighting is a priority for many communities. Transportation markets in other areas of the world are also heavily funded by local and national governments.
The construction market is mostly funded privately and includes lighting for applications such as parking lots, shopping centers, sports stadiums and business parks. This market is driven by macro-economic factors such as general economic growth rates, interest rates and the commercial construction economy. Valmont has many long-standing relationships with OEM (also manufacture light fixtures and equipment) who also serve this market. Industrial markets for access systems are typically driven by infrastructure, industrial and commercial construction spending. Customers include construction firms or installers who participate in these markets, natural gas and mineral exploration companies, resellers such as steel service centers, and end users.
The market for our communication products is driven by increased demand for wireless communication and data. Customers are wireless network providers and organizations that own cell sites and attach antennas from multiple carriers to the pole or tower structure (build to suit companies). We also sell products to state and federal governments for two-way radio communication, radar, broadcasting and security applications. We believe long-term growth should mainly be driven by increased usage and technologies such as 5G, which demand higher network density. Improved emergency response systems, as part of the U.S. Homeland Security initiatives, creates additional demand.
All of the products that we manufacture in this segment are parts of government or customer investments in basic infrastructure. The total cost of these investments can be substantial, so access to capital is often important to fund infrastructure needs. Demand can be cyclical in these markets due to overall economic conditions. Additionally, projects can sometimes be delayed due to funding or other issues.
Competition—Our competitive strategy in all of the markets we serve is to provide high value to the customer at the appropriate price. We compete on the basis of product quality, high levels of customer service, timely, complete, and accurate delivery of the product and design capability to provide the best solutions to our customers. There are numerous competitors in our markets, most of which are relatively small companies. Companies compete on the basis of price, product quality, reliable delivery, engineering design, and unique product features. Pricing can be very competitive, especially when demand is weak or when strong local currencies result in increased competition from imported products.
Distribution Methods—Sales and distribution activities are handled through a combination of a direct sales force and commissioned agents. Lighting agents represent Valmont as well as lighting fixture and traffic signal lines and sell other related products. Sales are typically to electrical distributors, who provide the pole, fixtures and other equipment to the end user as a complete package. Commercial lighting, wireless communication products and components, access systems and highway safety sales are normally made through Valmont sales employees, who work on a salary plus incentive, although some sales are made through independent, commissioned sales agents.
Utility Support Structures Segment (Utility)
Products Produced—We engineer and manufacture steel, pre-stressed concrete, composite, and hybrid structures (concrete base section and steel upper sections). These products are used to support the lines and equipment that carry power for electrical transmission, substation and distribution applications. Transmission refers to moving power from where it is produced to where it is used. Substations transfer high voltage electricity to low voltage transmission. Electrical distribution carries electricity from the substation to the end-user. These innovative structures are offered to address the growing need for grid hardening across the globe, where fires, storms, and floods have recently occurred with increasing regularity.
5
Utility structures can be very large, so product design engineering is important to the function and safety of the structure. Our engineering process takes into account weather and loading conditions, such as wind speeds, ice loads and the power lines attached to the structure, in order to arrive at the final design. In Northern Europe, we produce utility structures for offshore and onshore wind energy. We also manufacture complex steel structures such as rotor houses for wind turbines.
Our solar single-axis “tracker” product is an integrated system of steel structures, electric motors, and electronic
controllers. Trackers move solar panels throughout the day to maintain an optimal orientation to the sun, which materially increases their energy production. Solar energy projects utilizing trackers generate approximately 20% more energy compared to traditional fixed tilt ground-mounted systems, according to Wood Mackenzie. Our trackers utilize a simple, modular design allowing ease of installation and low operational maintenance. Further, the flexibility of our trackers’ design allows for improved site utilization, which is especially valuable to our customers considering that solar projects are being constructed on increasingly challenging sites today. We sell our products to engineering, procurement and construction firms (“EPCs”) that build solar energy projects as well as solar developers, independent power producers, and utilities.
Markets—Our sales in this segment are mainly in North America, where the key drivers in the utility business are significant upgrades in the electrical grid to support enhanced reliability standards, policy changes encouraging more generation from renewable energy sources, interconnection of regional grids to share more efficient generation to the benefit of the consumer and increased electrical consumption which has outpaced the transmission investment in the past decades. According to the Edison Electric Institute, the electrical transmission grid in the U.S. requires significant investment in the coming years to respond to the compelling industry drivers and lack of investment prior to 2008. In international markets, electrical consumption is expected to increase. This will require substantial investment in new electricity generation capacity and growth in transmission grid development. We expect these factors to result in increased demand for electrical utility structures to transport electricity from source to user, as is used in the U.S. markets today. As utilities increase development of large-scale solar power and micro-grid applications, single axis tracker solutions will be an essential tool for achieving higher energy production. Sales of complex steel structures, wind turbine towers, rotor houses, and utility transmission structures mainly occur within Europe. Approximately 35% of all ground-mounted solar energy projects constructed globally during 2019 utilized trackers according to Wood Mackenzie. Our solar tracker products are used in some of the largest solar projects in the world with over a decade of track record, which is unique in the single-axis solar tracker industry.
Competition—Our competitive strategy in this segment is to provide high value solutions to the customer at the appropriate price. We compete on the basis of product quality, engineering expertise, high levels of customer service, and reliable and timely delivery of the product. There are a number of competitors in North America, but there are many competitors in international markets. Companies compete on the basis of price, quality and service. Utility sales are often made through a competitive bid process, whereby the lowest bidder is awarded the contract, provided the competitor meets all other qualifying criteria. In weak markets, price is a more important criteria in the bid process. We also sell on a preferred-provider basis to certain large utility customers. These contractual arrangements often last between 3 and 5 years and are frequently renewed. For offshore and other complex steel structures, we compete on price based on our ability to co-engineer and design solutions with customers. We are one of a limited number of competitors that can execute advanced order production of complex steel constructions that require a high degree of engineering and complex manufacturing customization.
Distribution Methods—Products are normally sold directly to electrical utilities or energy providers with some sales sold through commissioned sales agents.
Coatings Segment (Coatings)
Services Rendered—We add finishes to metals that inhibit corrosion, extend service lives and enhance the aesthetics of a wide range of materials and products. We take unfinished products from our customers and return them with a galvanized, anodized or painted finish. Hot-dip galvanizing is a process that protects and prolongs the life of steel with a zinc coating that is bonded to the product surface to inhibit rust and corrosion. CorroCote adds a protection to steel for those products that are anchored below ground against the corrosive effects of soil and underground moisture. Anodizing is a process applied to aluminum that oxidizes the surface of the aluminum in a controlled manner, which protects the aluminum from corrosion and allows the material to be dyed a variety of colors. We also paint products using powder coating for a number of industries and markets.
Markets—Markets for our products are varied and our profitability is not substantially dependent on any one industry or external customer. However, a meaningful percentage of demand is internal, driven by Valmont's other segments. Demand for coatings services generally follows the local industrial economies. Galvanizing is used in a wide variety of
6

industrial applications where corrosion protection of steel is desired. While markets are varied, our markets for anodized or painted products are more directly dependent on consumer markets than industrial markets.
Competition—The Coatings markets traditionally have been very fragmented, with a large number of competitors. Most of these competitors are relatively small, privately held companies who compete on the basis of price and personal relationships with their customers. As a result of ongoing industry consolidation, there are also several (public and private) multi-facility competitors. Our strategy is to compete on the basis of quality of the coating finish and timely delivery of the coated product to the customer. We also use the production capacity at our network of plants to ensure that the customer receives quality, timely service.
Distribution Methods—Due to freight costs, a galvanizing location has an effective service area of an approximate 300 to 500 mile radius. While we believe that we are globally one of the largest custom galvanizers, our sales are a small percentage of the total market. Sales and customer service are provided directly to the user by a direct sales force, generally assigned to each specific location.
Irrigation Segment (Irrigation)
Products Produced—We manufacture and distribute mechanical irrigation equipment and related service parts under the “Valley” brand name. A Valley irrigation machine is powered by electricity (via solar, grid, or diesel generator) and propels itself over a farm field and applies water and chemicals to crops. Water and, in some instances, chemicals are applied through sprinklers attached to a pipeline that is supported by a series of towers, each of which is propelled via a drive train and tires. A standard mechanized irrigation machine (also known as a “center pivot”) rotates in a circle, although we also manufacture and distribute center pivot extensions that can irrigate corners of square and rectangular farm fields as well as conform to irregular field boundaries (referred to as a “corner” machine). Our irrigation machines can also irrigate fields by moving up and down the field as opposed to rotating in a circle (referred to as a “linear” machine). Irrigation machines can be configured to irrigate fields in size from 4 acres to over 500 acres, with a standard size in the U.S. configured for a 160-acre tract of ground. The irrigation machine used in international markets is substantially the same as the one produced for the North American market. We also manufacture tubular products for industrial customers primarily in the agriculture industry as well as in the transportation and other industries.
Our remote management capabilities allow control of pivots and a variety of other farm equipment on any web-connected device and our suite of advanced technology solutions offers capabilities to assist in reducing water and energy use. Our crop anomaly detection can alert growers of pivot-related water issues with artificial intelligence and machine learning (in select markets) to help farmers determine where and how much to irrigate. During fiscal 2021, we purchased Prospera Technologies Ltd, a leading global artificial intelligence and machine learning provider of advanced agronomy monitoring solutions. Irrigation net sales in 2021, 2020, and 2019 included technology sales of $97.9 million, $67.1 million, and $56.7 million, respectively. We also sell solar energy solutions for agriculture primarily in international markets.
Other Types of Irrigation — There are other forms of irrigation available to farmers, two of the most prevalent being flood irrigation and drip irrigation. In flood irrigation, water is applied through a pipe or canal at the top of the field and allowed to run down the field by gravity. Drip irrigation involves plastic pipe or tape resting on the surface of the field or buried a few inches below ground level, with water being applied gradually. We estimate that center pivot and linear irrigation comprises 50% of the irrigated acreage in North America. International markets use predominantly flood irrigation.
Markets—Market drivers in North America and international markets are essentially the same. Since the purchase of an irrigation machine is a capital expenditure, the purchase decision is based on the expected return on investment. The benefits a grower may realize through investment in mechanical irrigation include improved yields through better irrigation, cost savings through reduced labor and lower water and energy usage. The purchase decision is also affected by current and expected net farm income, commodity prices, interest rates, the status of government support programs and water regulations in local areas. In many international markets, the relative strength or weakness of local currencies as compared with the U.S. dollar may affect net farm income, since export markets are generally denominated in U.S. dollars. In addition, governments are sponsoring irrigation projects for self-sufficiency in food production.
The demand for mechanized irrigation comes from the following sources:
• conversion from flood irrigation
• replacement of existing mechanized irrigation machines
7

• converting land that is not irrigated to mechanized irrigation
One of the key drivers in our Irrigation segment worldwide is that the usable water supply is limited. We estimate that:
• only 2.5% of total worldwide water supply is freshwater
• of that 2.5%, only 30% of freshwater is available to humans
• the largest user of that freshwater is agriculture
We believe these factors, along with the trends of a growing worldwide population, improving diets, and governments' efforts to address food security, reflect the need to use water more efficiently while increasing food production to feed this growing population. We believe that mechanized irrigation can improve water application efficiency by 40-90% compared with traditional irrigation methods by applying water uniformly near the root zone and reducing water runoff. Furthermore, reduced water runoff improves water quality in nearby rivers, aquifers and streams, thereby providing environmental benefits in addition to conservation of water.
Competition—In North America, there are a number of entities that provide irrigation products and services to agricultural customers. We believe we are the leader of the four main participants in the mechanized irrigation business. Participants compete for sales on the basis of product innovation and features, product durability and reliability, price, quality and service capabilities of the local dealer. Pricing can become very competitive, especially in periods when market demand is low. In international markets, our competitors are a combination of our major U.S. competitors and privately‑owned local companies. Competitive factors are similar to those in North America, although pricing tends to be a more prevalent competitive strategy in international markets. Since competition in international markets is local, we believe local manufacturing capability is important to competing effectively in international markets and we have that capability in key regions.
Distribution Methods—We market our irrigation machines, technology offerings, and service parts through independent dealers. There are approximately 270 dealer locations in North America, with another approximately 400 dealers serving international markets in over 60 countries. The dealer determines the grower’s requirements, designs the configuration of the machine, installs the machine (including providing ancillary products that deliver water and electrical power to the machine) and provides after‑sales service. Our dealer network is supported and trained by our technical and sales teams. Our international dealers are supported through our regional headquarters in South America, South Africa, Western Europe, Australia, China and the United Arab Emirates as well as the home office in Valley, Nebraska.
General
Certain information generally applicable to each of our four reportable segments is set forth below.
Suppliers and Availability of Raw Materials.
Hot rolled steel coil and plate, zinc and other carbon steel products are the primary raw materials utilized in the manufacture of finished products for all segments. We purchase these essential items from steel mills, steel service centers, and zinc producers and these materials are usually readily available. While we may experience increased lead times to acquire materials and volatility in our purchase costs, we do not believe that key raw materials would be unavailable for extended periods. We have not experienced extended or wide-spread shortages of steel in the past several years, due to what we believe are strong relationships with some of the major steel producers. In the past several years, we experienced volatility in zinc and natural gas prices, but we did not experience any disruptions to our operations due to availability.
Patents, Licenses, Franchises and Concessions.
We have a number of patents for our manufacturing machinery, poles, highway guardrail, and irrigation designs. We also have a number of registered trademarks. We do not believe the loss of any individual patent or trademark would have a material adverse effect on our financial condition, results of operations or liquidity.
8

Seasonal Factors in Business.
Sales can be somewhat seasonal based upon the agricultural growing season and the infrastructure construction season. Sales of mechanized irrigation equipment to farmers are traditionally higher during the spring and fall and lower in the summer. Sales of infrastructure products are traditionally higher in the summer and fall and lower in the winter.
Customers.
We are not dependent for a material part of any segment’s business upon a single customer or upon very few customers. The loss of any one customer would not have a material adverse effect on our financial condition, results of operations or liquidity.
Backlog.
The backlog of orders for the principal products manufactured and marketed was $1,621.9 million at the end of the 2021 fiscal year and $1,139.1 million at the end of the 2020 fiscal year. An order is reported in our backlog upon receipt of a purchase order from the customer or execution of a sales order contract. We anticipate that most of the 2021 backlog of orders will be filled during fiscal year 2022. At year-end, the segments with backlog were as follows (dollar amounts in millions):
12/25/2021 12/26/2020Engineered Support Structures $ 376.9 $ 247.1 Utility Support Structures 773.9 563.3 Irrigation 471.0 328.3 Coatings 0.1 0.4
$ 1,621.9 $ 1,139.1
Environmental Disclosure.
We are subject to various federal, state and local laws and regulations pertaining to environmental protection and the discharge of materials into the environment. Although we continually incur expenses and make capital expenditures related to environmental protection, we do not anticipate that future expenditures should materially impact our financial condition, results of operations, or liquidity.
Number of Employees.
At December 25, 2021, we had 11,041 employees.
Human Capital Resources.
Our policies and practices with respect to human capital resources are generally set forth in our Code of Business Conduct, our Human Rights Policy, and the principles described on the “About Us” page on our website www.valmont.com. Essential to our success is a company-wide commitment to customer service and innovation, and the ability to be the best cost producer for all products and services we provide. Our employees are the cornerstone of our accomplishments, we pride ourselves on being people of passion and integrity who excel and deliver results. Our Code of Business Conduct and our culture require each employee to act responsibly and to treat each other fairly and with the utmost respect.
Our businesses require skilled workers and management in order to meet our customer’s needs, grow our sales and maintain competitive advantages. We require employees with skills in engineering, welding, equipment maintenance and the operation of complex manufacturing machinery. Management talent is critical as well, to help grow our businesses and effectively plan for succession of key employees upon retirement.
9

At December 25, 2021 we had approximately 6,080 employees in the United States and 4,959 employees in foreign countries. The Company places a high value on diversity and inclusion, encouraging employees with diverse backgrounds and experiences who share a common interest in profitable development, improving corporate culture, and delivering sustainable business results.
We have adopted a Human Rights Policy which is published on our website. We expect our employees, suppliers, vendors, dealers and distributors to share our commitment to human rights. We prohibit discrimination on the basis of age, race, disability, ethnicity, marital or family status, national origin, religion, gender, sexual orientation, veteran status, gender identity, or any other characteristic protected by law.
We are committed to voluntary employment, and we strictly prohibit all forms of compulsory labor, including child labor, forced labor, slavery and human trafficking. We respect internally recognized human rights standards, and this policy is guided by the U.N. Guiding Principles for Business and Human Rights.
We require full compliance with applicable, wage, work hours, overtime and benefit laws. We are committed to creating a culture where a healthy and safe workplace is recognized by everyone as essential to our success. Any employee can always contact our compliance officer, and confidential reporting of a situation or to ask a question is available on a secure website maintained by a third party. Employees are eligible for health insurance, paid and unpaid leaves, retirement plan and life and disability / accident coverage.
When positions come open at Valmont, we try first to fill them from within. We like to reward the hard-working members of our Valmont family with new opportunities that are not only a chance to expand their worlds, but to also recognize and reward their dedication. We have found them to be our richest talent resource.
Our program for succession and management development has our highest level of attention with our CEO responsible for reporting on the program directly to our board of directors.
For additional information, please see the “About Us” and "Sustainability" pages on our website and section titled “Governance, Human Capital and Sustainability Highlights” in the Company’s 2022 Proxy Statement.
(d) Available Information
We make available, free of charge on the Investors page of our website at www.valmont.com, our annual report on Form 10-K, quarterly reports on Form 10-Q, current reports on Form 8-K, and amendments to those reports filed or furnished pursuant to Section 13(a) or 15(d) of the Securities Exchange Act of 1934, as soon as reasonably practicable after such material is electronically filed with or furnished to the Securities and Exchange Commission.
ITEM 1A. RISK FACTORS.
The following risk factors describe various risks that may affect our business, financial condition and operations.
Economic and Business Risks
The ultimate consumers of our products operate in cyclical industries that have been subject to significant downturns which have adversely impacted our sales in the past and may again in the future.
Our sales are sensitive to the market conditions present in the industries in which the ultimate consumers of our products operate, which in some cases have been highly cyclical and subject to substantial downturns. For example, a significant portion of our sales of support structures is to the electric utility industry. Our sales to the U.S. electric utility industry were over $750 million in 2021. Purchases of our products are deferrable to the extent that utilities may reduce capital expenditures for reasons such as unfavorable regulatory environments, a slow U.S. economy or financing constraints. In the event of weakness in the demand for utility structures due to reduced or delayed spending for electrical generation and transmission projects, our sales and operating income likely will decrease.
The end users of our mechanized irrigation equipment are farmers. Accordingly, economic changes within the agriculture industry, particularly the level of farm income, may affect sales of these products. From time to time, lower levels of farm income resulted in reduced demand for our mechanized irrigation and tubing products. Farm income decreases when
10

commodity prices, acreage planted, crop yields, government subsidies and export levels decrease. In addition, weather conditions, such as extreme drought may result in reduced availability of water for irrigation, and can affect farmers’ buying decisions. Farm income can also decrease as farmers’ operating costs increase. Increases in oil and natural gas prices result in higher costs of energy and nitrogen‑based fertilizer (which uses natural gas as a major ingredient).
Furthermore, uncertainty as to future government agricultural policies may cause indecision on the part of farmers. The status and trend of government farm supports, financing aids and policies regarding the ability to use water for agricultural irrigation can affect the demand for our irrigation equipment. In the United States, certain parts of the country are considering policies that would restrict usage of water for irrigation. All of these factors may cause farmers to delay capital expenditures for farm equipment. Consequently, downturns in the agricultural industry will likely result in a slower, and possibly a negative, rate of growth in irrigation equipment and tubing sales. As of December 2021, the U.S. Department of Agriculture (the “USDA”) estimated U.S. 2021 net farm income to be $116.8 billion, an increase of 23 percent from the USDA’s estimated U.S. 2020 net farm income of $94.8 billion. The increase is primarily related to an increase in cash receipts from crops and livestock that is offsetting a portion of the decrease in government support payments. If estimates hold, U.S. net farm income in 2021 will be the highest level since 2013.
We have also experienced cyclical demand for those of our products that we sell to the wireless communications industry. Sales of wireless structures and components to wireless carriers and build-to-suit companies that serve the wireless communications industry have historically been cyclical. These customers may elect to curtail spending on new capacity to focus on cash flow and capital management. Changes in the competitive structure of the wireless industry, due to industry consolidation or reorganization, may interrupt capital plans of the wireless carriers as they assess their networks.
The engineered access systems product lines are partially dependent on investment spending by our customers in the oil, natural gas, and other mined mineral exploration industries, most specifically in the Asia Pacific region. During periods of continued low oil and natural gas prices, these customers may elect to curtail spending on new exploration sites which will cause us to experience lower demand for these specific product lines.
Due to the cyclical nature of these markets, we have experienced, and in the future we may experience, significant fluctuations in our sales and operating income with respect to a substantial portion of our total product offering, and such fluctuations could be material and adverse to our overall financial condition, results of operations and liquidity.
Changes in prices and reduced availability of key commodities such as steel, aluminum, zinc, natural gas and fuel may increase our operating costs and likely reduce our net sales and profitability.
Hot rolled steel coil and other carbon steel products have historically constituted approximately one-third of the cost of manufacturing our products. We also use large quantities of aluminum for lighting structures and zinc for the galvanization of most of our steel products. Our facilities use large quantities of natural gas for heating and processing tanks in our galvanizing operations. We use gasoline and diesel fuel to transport raw materials to our locations and to deliver finished goods to our customers. The markets for these commodities can be volatile. The following factors increase the cost and reduce the availability of these commodities:
• increased demand, which occurs when we and other industries require greater quantities of these commodities, which can result in higher prices and lengthen the time it takes to receive these commodities from suppliers;
• lower production levels of these commodities, due to reduced production capacities or shortages of materials needed to produce these commodities (such as coke and scrap steel for the production of steel) which could result in reduced supplies of these commodities, higher costs for us and increased lead times;
• increased cost of major inputs, such as scrap steel, coke, iron ore and energy;
• fluctuations in foreign exchange rates can impact the relative cost of these commodities, which may affect the cost effectiveness of imported materials and limit our options in acquiring these commodities; and
• international trade disputes, import duties, tariffs, and quotas, since we import some steel and aluminum finished components/products for various product lines.
11

Increases in the selling prices of our products may not fully recover higher commodity costs and generally lag increases in our costs of these commodities. Consequently, an increase in these commodities will increase our operating costs and likely reduce our profitability.
Rising steel prices in 2021 put pressure on gross profit margins, especially in our Utility Support Structures segment. The elapsed time between the release of a customer's purchase order and the manufacturing of the product ordered can be several months. As some of the sales in the Engineered Support Structures and Utility Support Structures segments are fixed price contracts, rapid increases in steel costs likely will result in lower operating income. Steel prices for both hot rolled coil and plate can also decrease substantially in a given period, which occurred in North America in 2019. Decreases in our product sales pricing and volumes offset the increase in gross profit realized from the lower steel prices. Steel is most significant for our Utility Support Structures segment where the cost of steel has been approximately 50% of the net sales, on average. Assuming a similar sales mix, a hypothetical 20% change in the price of steel would have affected our net sales from our utility support structures segment by approximately $75 million for the year ended December 25, 2021.
We believe the volatility over the past several years was due to significant increases in global steel production and rapid changes in consumption (especially in rapidly growing economies, such as China and India). The speed with which steel suppliers impose price increases on us may prevent us from fully recovering these price increases particularly in our lighting and traffic and utility businesses. In the same respect, rapid decreases in the price of steel can also result in reduced operating margins in our utility businesses due to the long production lead times.
Demand for our infrastructure products including coating services is highly dependent upon the overall level of infrastructure spending.
We manufacture and distribute engineered infrastructure products for lighting and traffic, utility and other specialty applications. Our Coatings segments serve many construction‑related industries. Because these products are used primarily in infrastructure construction, sales in these businesses are highly correlated with the level of construction activity, which historically has been cyclical. Construction activity by our private and government customers is affected by and can decline because of, a number of factors, including (but not limited to):
• weakness in the general economy, which may negatively affect tax revenues, resulting in reduced funds available for construction;
• interest rate increases, which increase the cost of construction financing; and
• adverse weather conditions which slow construction activity.
The current economic uncertainty in the United States and Europe will have some negative effect on our business. In our North American lighting product line, some of our lighting structure sales are for new residential and commercial areas. When residential and commercial construction is weak, we have experienced some negative impact on our light pole sales to these markets. In a broader sense, in the event of an overall downturn in the economies in Europe, Australia or China, we may experience decreased demand if our customers in these countries have difficulty securing credit for their purchases from us.
In addition, sales in our Engineered Support Structures segment, particularly our lighting, traffic and highway safety products, are highly dependent upon federal, state, local and foreign government spending on infrastructure development projects, such as the U.S. federal highway funding. The level of spending on such projects may decline for a number of reasons beyond our control, including, among other things, budgetary constraints affecting government spending generally or transportation agencies in particular, decreases in tax revenues and changes in the political climate, including legislative delays, with respect to infrastructure appropriations.
12

We are subject to currency fluctuations from our international sales, which can negatively impact our reported earnings.
We sell our products in many countries around the world. Approximately 35% of our fiscal 2021 sales were in markets outside the United States and are often made in foreign currencies, mainly the Australian dollar, euro, Brazilian real, Canadian dollar, Chinese renminbi and South African rand. Because our financial statements are denominated in U.S. dollars, fluctuations in currency exchange rates between the U.S. dollar and other currencies have had and will continue to have an impact on our reported earnings. If the U.S. dollar weakens or strengthens versus the foreign currencies mentioned above, the result will be an increase or decrease in our reported sales and earnings, respectively. Currency fluctuations have affected our financial performance in the past and may affect our financial performance in any given period. In cases where local currencies are strong, the relative cost of goods imported from outside our country of operation becomes lower and affects our ability to compete profitably in our home markets.
We also face risks arising from the imposition of foreign exchange controls and currency devaluations. Exchange controls may limit our ability to convert foreign currencies into U.S. dollars or to remit dividends and other payments by our foreign subsidiaries or businesses located in or conducted within a country imposing controls. Currency devaluations result in a diminished value of funds denominated in the currency of the country instituting the devaluation. Actions of this nature could have a material adverse effect on our results of operations and financial condition in any given period.
COVID-19 has impacted and is expected to continue to impact our business, including the supply chain, product demand, logistics, and facility operations and the duration, unknown at this time, of the challenges associated with the virus may result in significant adverse effects on our business, financial condition and results of operations.
COVID-19 impacted and may continue to impact our business, including the normal operations of our facilities, overall demand for our products, changes to supply chain availability and costs, logistics delays, including temporary closures as may be mandated or otherwise made necessary by governmental authorities, and any additional carryover of economic effects. All of our operations may be affected by COVID-19 isolation measures. We have implemented domestic and international travel restrictions for our employees, and thousands of our employees are expected to continue to work remotely through the height of this pandemic.
Our businesses support critical infrastructure sectors as defined by the Department of Homeland Security (CISA.gov) and similar global agencies. These sectors are deemed vital, such that their incapacitation would have a debilitating effect on security, national economic security, national public health or safety or any combination thereof.
The duration of the virus outbreak continues to be evaluated by governments and experts and as a consequence we cannot at this time determine the overall ultimate impact on the Company. The extent of the impact will depend on future developments, which are highly uncertain and cannot be predicted. The duration, unknown at this time, of the challenges associated with the virus may result in significant adverse effects on our business, financial condition, and results of operations.
In addition to the discussion above of Economic and Business Risks, please see our further discussion on interest rates, foreign currency exchange rates and commodity prices included in “MARKET RISK” within "Management's Discussion and Analysis of Financial Conditions and Results of Operations" in Part II, Item 7 in this report.
Legal and Regulatory Risks
We may lose some of our foreign investment or our foreign sales and profits may decline because of risks of doing business in foreign markets, including trade relations and tariffs.
We are an international manufacturing company with operations around the world. At December 25, 2021, we operated over 80 manufacturing plants, located on six continents, and sold our products in more than 100 countries. In 2021, approximately 34% of our net sales were either sold in markets or produced by our manufacturing plants outside of North America (primarily the United States, Canada, and Mexico). We have operations in geographic markets that have recently experienced political instability, such as the Middle East, and economic uncertainty, such as Western Europe, and health issues, such as the outbreak and spread of coronavirus in China. Our geographic diversity also requires that we hire, train and retain competent management for the various local markets.
Demand for our products and our profitability are affected by trade relations between countries. We also have a significant manufacturing presence in Australia, Europe and China. These operations are affected by U.S. trade policies, such
13

as additional tariffs on a broad range of imports, and retaliatory actions by foreign countries, most recently China, which have impacted sales of our products. In addition, there can be a derived indirect impact on demand for our products arising from quotas, restrictions, and retaliatory tariffs (e.g. China tariffs on imported soybeans affects U.S. net farm income).
We expect that international sales will continue to account for a significant percentage of our net sales in the future. Accordingly, our foreign business operations and our foreign sales and profits are subject to the following potential risks:
• political and economic instability, resulting in the reduction of the value of, or the loss of, our investment;
• recessions in economies of countries in which we have business operations, decreasing our international sales;
• natural disasters and public health issues in our geographic markets, negatively impacting our workforce, manufacturing capability, and sales;
• difficulties and costs of staffing and managing our foreign operations, increasing our foreign operating costs and decreasing profits;
• potential violation of local laws or unsanctioned management actions that could affect our profitability or ability to compete in certain markets;
• difficulties in enforcing our rights outside the United States for patents on our manufacturing machinery, poles and irrigation designs;
• increases in tariffs, export controls, taxes and other trade barriers reducing our international sales and our profit on these sales; and
• acts of war or terrorism.
As a result, we may lose some of our foreign investment or our foreign sales and profits may be materially reduced because of risks of doing business in foreign markets.
Design patent litigation related to guardrails could reduce demand for such products and raise litigation risk.
Certain of the Company’s foreign subsidiaries in India, New Zealand, and Australia manufacture highway safety products, primarily for sale in non-U.S. markets, and license certain design patents related to guardrails to third parties. There are currently domestic U.S. product liability lawsuits against some companies that manufacture and install certain guardrail products. Such lawsuits, some of which have at times involved a foreign subsidiary based on its design patent, could lead to a decline in demand for such products or approval for use of such products by government purchasers both domestically and internationally, and potentially raise litigation risk for foreign subsidiaries and negatively impact their sales and license fees.
Failure to comply with any applicable anti-corruption legislation could result in fines, criminal penalties and an adverse effect on our business.
We must comply with all applicable laws, which include the U.S. Foreign Corrupt Practices Act (FCPA), the UK Bribery Act or other anti-corruption laws. These anti-corruption laws generally prohibit companies and their intermediaries from making improper payments or providing anything of value to improperly influence government officials or private individuals for the purpose of obtaining or retaining a business advantage regardless of whether those practices are legal or culturally expected in a particular jurisdiction. Recently, there has been a substantial increase in the global enforcement of anti-corruption laws. Although we have a compliance program in place designed to reduce the likelihood of potential violations of such laws, violations of these laws could result in criminal or civil sanctions and an adverse effect on the company’s reputation, business and results of operations and financial condition.
14

We could incur substantial costs as the result of violations of, or liabilities under, environmental laws.
Our facilities and operations are subject to U.S. and foreign laws and regulations relating to the protection of the environment, including those governing the discharge of pollutants into the air and water, the management and disposal of hazardous substances and wastes, and the cleanup of contamination. Failure to comply with these laws and regulations, or with the permits required for our operations, could result in fines or civil or criminal sanctions, third party claims for property damage or personal injury, and investigation and cleanup costs. Potentially significant expenditures could be required in order to comply with environmental laws that regulators may adopt or impose in the future.
Certain of our facilities have been in operation for many years and, over time, we and other predecessor operators of these facilities have generated, used, handled and disposed of hazardous and other regulated wastes. We detected contaminants at some of our present and former sites, principally in connection with historical operations. In addition, from time to time we have been named as a potentially responsible party under Superfund or similar state laws. While we are not aware of any contaminated sites that are not provided for in our financial statements, including third‑party sites, at which we may have material obligations, the discovery of additional contaminants or the imposition of additional cleanup obligations at these sites could result in significant liability beyond amounts provided for in our financial statements.
Liquidity and Capital Recourses Risk
We have, from time to time, maintained a substantial amount of outstanding indebtedness, which could impair our ability to operate our business and react to changes in our business, remain in compliance with debt covenants and make payments on our debt.
As of December 25, 2021, we had $965.4 million of total indebtedness outstanding. We had $590.5 million of capacity to borrow under our revolving credit facility at December 25, 2021. We normally borrow money to make business acquisitions and major capital expenditures. From time to time, our borrowings have been significant. Our level of indebtedness could have important consequences, including:
• our ability to satisfy our obligations under our debt agreements could be affected and any failure to comply with the requirements, including significant financial and other restrictive covenants, of any of our debt agreements and could result in an event of default under the agreements governing our indebtedness;
• a substantial portion of our cash flow from operations will be required to make interest and principal payments and will not be available for operations, working capital, capital expenditures, expansion, or general corporate and other purposes, including possible future acquisitions that we believe would be beneficial to our business;
• our ability to obtain additional financing in the future may be impaired;
• we may be more highly leveraged than our competitors, which may place us at a competitive disadvantage;
• our flexibility in planning for, or reacting to, changes in our business and industry may be limited; and
• our degree of leverage may make us more vulnerable in the event of a downturn in our business, our industry or the economy in general.
We had $177 million of cash at December 25, 2021. Approximately 96% of our consolidated cash balances are outside the United States and most of our interest‑bearing debt is borrowed by U.S. entities. In the event that we would have to repatriate cash from international operations to meet cash needs in the U.S., we may be subject to legal, contractual or other restrictions. In addition, as we use cash for acquisitions and other purposes, any of these factors could have a material adverse effect on our business, financial condition, results of operations, cash flows and business prospects.
The restrictions and covenants in our debt agreements could limit our ability to obtain future financings, make needed capital expenditures, withstand a future downturn in our business, or the economy in general, or otherwise conduct necessary corporate activities. These covenants may prevent us from taking advantage of business opportunities that arise.
A breach of any of these covenants would result in a default under the applicable debt agreement. A default, if not waived, could result in acceleration of the debt outstanding under the agreement and in a default with respect to, and acceleration of, the debt outstanding under our other debt agreements. The accelerated debt would become immediately due
15

and payable. If that should occur, we may not be able to pay all such debt or to borrow sufficient funds to refinance it. Even if new financing were then available, it may not be on terms that are favorable to us.
We assumed an underfunded pension liability as part of the 2010 Delta acquisition and the combined company may be required to increase funding of the plan and/or be subject to restrictions on the use of excess cash.
Delta is the sponsor of a United Kingdom defined benefit pension plan that, as of December 25, 2021, covered approximately 6,500 inactive or retired former Delta employees. The plan has no active employees as members. At December 25, 2021, this plan was, for accounting purposes, underfunded by approximately £0.3 million ($0.5 million). The current agreement with the trustees of the pension plan for annual funding is approximately £13.1 million ($17.5 million) in respect of the funding shortfall and approximately £1.3 million ($1.7 million) in respect of administrative expenses. Although this funding obligation was considered in the acquisition price for the Delta shares, the underfunded position may adversely affect the combined company as follows:
• Laws and regulations in the United Kingdom normally require the plan trustees and us to agree on a new funding plan every three years. The next funding plan will be developed in 2022. Changes in actuarial assumptions, including future discount, inflation and interest rates, investment returns and mortality rates, may increase the underfunded position of the pension plan and cause the combined company to increase its funding levels in the pension plan to cover underfunded liabilities.
• The United Kingdom regulates the pension plan and the trustees represent the interests of covered workers. Laws and regulations, under certain circumstances, could create an immediate funding obligation to the pension plan which could be significantly greater than the £0.3 million ($0.5 million) assumed for accounting purposes as of December 25, 2021. Such immediate funding is calculated by reference to the cost of buying out liabilities on the insurance market, and could affect our ability to fund the Company’s future growth of the business or finance other obligations.
General Risks
Our businesses require skilled labor and management talent and we may be unable to attract and retain qualified employees. Our businesses require skilled factory workers and management in order to meet our customer’s needs, grow our sales and maintain competitive advantages. Skills such as welding, equipment maintenance and operating complex manufacturing machinery may be in short supply in certain geographic areas, leading to shortages of skilled labor and/or increased labor costs. Management talent is critical as well, to help grow our businesses and effectively plan for succession of key employees upon retirement. In some geographic areas, skilled management talent for certain positions may be difficult to find. To the extent we have difficulty in finding and retaining these skills in the workforce, there may be an adverse effect on our ability to grow profitably in the future.
We face strong competition in our markets.
We face competitive pressures from a variety of companies in each of the markets we serve. Our competitors include companies who provide the technologies that we provide as well as companies who provide competing technologies, such as drip irrigation. Our competitors include international, national, and local manufacturers, some of whom may have greater financial, manufacturing, marketing and technical resources than we do, or greater penetration in or familiarity with a particular geographic market than we have.
In addition, certain of our competitors, particularly with respect to our utility and wireless communication product lines, have sought bankruptcy protection in recent years, and may emerge with reduced debt service obligations, which could allow them to operate at pricing levels that put pressures on our margins. Some of our customers have moved manufacturing operations or product sourcing overseas, which can negatively impact our sales of galvanizing and anodizing services.
To remain competitive, we will need to invest continuously in manufacturing, product development and customer service, and we may need to reduce our prices, particularly with respect to customers in industries that are experiencing downturns. We cannot provide assurance that we will be able to maintain our competitive position in each of the markets that we serve.
16

We may not realize the improved operating results that we anticipate from acquisitions we may make in the future, and we may experience difficulties in integrating the acquired businesses or may inherit significant liabilities related to such businesses.
We explore opportunities to acquire businesses that we believe are related to our core competencies from time to time, some of which may be material to us. We expect such acquisitions will produce operating results better than those historically experienced or presently expected to be experienced in the future by us in the absence of the acquisition. We cannot provide assurance that this assumption will prove correct with respect to any acquisition.
For example, in 2021, we acquired Prospera Technology Ltd, an integrated artificial intelligence (AI) technologies company that provides real-time crop analysis and anomaly detection solutions in agricultural fields. To provide these services, Prospera develops algorithms that can detect, with a high accuracy, field anomalies caused by pests, disease or water issues. We store, process and transmit agricultural field data. A failure to integrate innovative acquisitions such as Prospera could negatively impact future growth in our technology sales.
Any future acquisitions may present significant challenges for our management due to the time and resources required to properly integrate management, employees, information systems, accounting controls, personnel and administrative functions of the acquired business with those of Valmont and to manage the combined company on a going forward basis. We may not be able to completely integrate and streamline overlapping functions or, if such activities are successfully accomplished, such integration may be more costly to accomplish than presently contemplated. We may also have difficulty in successfully integrating the product offerings of Valmont and acquired businesses to improve our collective product offering. Our efforts to integrate acquired businesses could be affected by a number of factors beyond our control, including general economic conditions. In addition, the process of integrating acquired businesses could cause the interruption of, or loss of momentum in, the activities of our existing business. The diversion of management’s attention and any delays or difficulties encountered in connection with the integration of acquired businesses could adversely impact our business, results of operations and liquidity, and the benefits we anticipate may never materialize. These factors are relevant to any acquisition we undertake.
In addition, although we conduct reviews of businesses we acquire, we may be subject to unexpected claims or liabilities, including environmental cleanup costs, as a result of these acquisitions. Such claims or liabilities could be costly to defend or resolve and be material in amount, and thus could materially and adversely affect our business and results of operations and liquidity.
We may incur significant warranty or contract management costs.
In our Utility Support Structures segment, we manufacture large structures for electrical transmission. These products may be highly engineered for very large, complex contracts and subject to terms and conditions that penalize us for late delivery and result in consequential and compensatory damages. From time to time, we may have a product quality issue on a large utility structures order and the costs of curing that issue may be significant. Our products in the Engineered Support Structures segment include structures for a wide range of outdoor lighting, traffic, and wireless communication applications.
Our Irrigation products carry warranty provisions, some of which may span several years. In the event we have wide-spread product reliability issues with certain components, we may be required to incur significant costs to remedy the situation.
Our operations could be adversely affected if our information technology systems are compromised or otherwise subjected to cyber crimes.
Cyber crime continually increases in sophistication and may pose a significant risk to the security of our information technology systems and networks, which if breached could materially adversely affect the confidentiality, availability and integrity of our data. Our operations involve transferring data across national borders, and we must comply with increasingly complex and rigorous standards to protect business and personal data in the U.S. and foreign countries, including members of the European Union. Additionally, our operations also include innovative technologies, such as Prospera Technology Ltd, an integrated AI technologies company. Successful cybersecurity attacks or other security incidents could result in the loss of key innovations in artificial intelligence, internet of things (IoT), or other disruptive technologies; the loss of access to critical data or systems through ransomware, crypto mining, destructive attacks, or other means; and business delays, service or system disruptions or denials of service. We protect our sensitive information and confidential personal data, our facilities
17

and information technology systems, but we may be vulnerable to future security breaches. This could lead to legal risk, fines and penalties, negative publicity, theft, modification or destruction of proprietary information or key information, manufacture of defective products, production downtimes and operational disruptions, which could adversely affect our reputation, competitiveness and results of operations.
Regulatory and business developments regarding climate change could adversely impact our operations and demand for our products.
Regulatory and business developments regarding climate change could adversely impact our operations. We follow the scientific discussion on climate change and related legislative and regulatory enactments, including those under consideration, to deliberate the potential impact on our operations and demand for our products. The scientific discussion on the presence and scope of climate change and the attention that domestic and international legislatures and regulatory authorities have given to enacting or considering laws or rules related to climate change are expected to continue. The production and market for our products are subject to the impact of laws and rules related to climate change. Our customers, and our operating segments, are exposed to risks of increased costs to comply with such laws and rules, including increased costs for raw materials and transportation, as well as exposure to damage to our respective business reputations upon any failure of compliance. Other adverse consequences of climate change could include an increased frequency of severe weather events and rising sea levels that could affect operations at our manufacturing facilities, the price of insuring company assets, or other unforeseen disruptions of the Company’s operations, systems, property, or equipment.
ITEM 1B. UNRESOLVED STAFF COMMENTS.
None.
ITEM 2. PROPERTIES.
In the second quarter of 2021, we moved our corporate headquarters to a new leased facility in Omaha, Nebraska, under a lease expiring in 2046. The Company’s reportable segments are located at the corporate headquarters. We also maintain a management headquarters in Sydney, Australia. Most of our significant manufacturing locations are owned or are subject to long-term renewable leases. Our principal manufacturing locations are in Valley, Nebraska, McCook, Nebraska, Tulsa, Oklahoma, Brenham, Texas, Charmeil, France, Monterrey, Mexico, Siedlce, Poland, and Shanghai, China. All of these facilities are owned by us. We believe that our manufacturing capabilities and capacities are adequate for us to effectively serve our customers. Our capital spending programs consist of investment for replacement, achieving operational efficiencies and expanding capacities where needed. Our principal operating locations by reportable segment are listed below.
Engineered Support Structures segment North America manufacturing locations are in Nebraska, Texas, Alabama, Indiana, Minnesota, Oregon, South Carolina, Washington, Arizona and Canada. The largest of these operations are in Valley, Nebraska and Brenham, Texas, both of which are owned facilities. We have communication components distribution locations in New York, California, Florida, Colorado, Nebraska, Georgia, and Texas. International locations are in France, the Netherlands, Finland, Estonia, England, Germany, Poland, Morocco, Australia, Indonesia, the Philippines, Thailand, Malaysia, India and China. The largest of these operations are in Charmeil, France and Shanghai, China, both of which are owned facilities.
Utility Support Structures segment North America manufacturing locations are in Alabama, Georgia, Florida, California, Texas, Oklahoma, Tennessee, Kansas, Nebraska and Mexico. The largest of these operations are in Tulsa, Oklahoma and Monterrey, Mexico. The Tulsa and Monterrey facilities are owned. The largest principal international manufacturing location is Denmark which is owned and there are also manufacturing locations in China, Italy and India.
Coatings segment North America operations include U.S. operations located in Nebraska, California, Minnesota, Iowa, Pennsylvania, Illinois, Kansas, New Jersey, Oregon, Utah, Oklahoma, Texas, Virginia, Alabama, Florida and South Carolina and two locations near Toronto, Canada. International operations are located in Australia, New Zealand, Malaysia, the Philippines and India.
Irrigation segment North America manufacturing operations are located in Valley, Nebraska, McCook, Nebraska and Indiana. Our principal manufacturing operations serving international markets are located in Uberaba, Brazil, Jebel Ali,
18

United Arab Emirates, Shandong, China and a technology R&D center in Israel. All facilities are owned except for China and Israel, which are leased.
ITEM 3. LEGAL PROCEEDINGS.
We are not a party to, nor are any of our properties subject to, any material legal proceedings. We are, from time to time, engaged in routine litigation incidental to our businesses.
ITEM 4. MINE SAFETY DISCLOSURES.
Not Applicable.
Information about our Executive Officers
Our current executive officers, their ages, positions held, and the business experience of each during the past five years are, as follows:
Stephen G. Kaniewski, age 50, President and Chief Executive Officer since December 31, 2017, previously President and Chief Operating Officer since October 2016. Utility Support Structures Group President, August 2015 to October 2016. Vice President of Global Operations for the Irrigation segment in 2014.
Avner M. Applbaum, age 50, Executive Vice President and Chief Financial Officer since March 2020. Chief Financial Officer and Chief Operating Officer of Double E Company, an equipment manufacturer from 2017 to March 2020. Chief Financial Officer of Aerostar Aerospace, a manufacturer of high-complexity parts from 2016 to 2017.
Diane Larkin, age 57, Executive Vice President Global Operations since June 2020. Senior Vice President of Operations and Global Supply for Pentair from 2017 to 2020. She held other operational leadership roles at Pentair from 2009 to 2017.
Aaron Schapper, age 48, Executive Vice President, Infrastructure since February 2020. Utility Support Structures Group President October 2016 to February 2020. General Manager, International Irrigation, October 2011 to October 2016.
Renee L. Campbell, age 52, Senior Vice President, Investor Relations and Treasurer since February 2022. Vice President, Investor Relations and Corporate Communications 2017 - 2022. Director of Global Treasury, Intrado (formerly West Corporation) 2016-2017.
Timothy P. Francis, age 45, Senior Vice President and Controller since June 2014.
T. Mitchell Parnell, age 56, Senior Vice President Human Resources since January 2019. Vice President Human Resources, Valmont Engineered Support Structures 2016 - 2018.
Claudio O. Laterreur, age 55, Senior Vice President and Chief Information Officer since May 2019. US Industrial Products Partner at IBM and North America Vice President for manufacturing at Neoris, from 2013 to 2019.
R. Andrew Massey, age 52, Vice President and Chief Legal & Compliance Officer since 2006.
Ellen S. Dasher, age 52, Vice President Global Taxation since December 2015, previously Assistant Director of Taxation.
19

PART II
ITEM 5. MARKET FOR REGISTRANT’S COMMON EQUITY, RELATED STOCKHOLDER MATTERS, AND ISSUER PURCHASES OF EQUITY SECURITIES.
Our common stock is traded on the New York Stock Exchange under the symbol “VMI”. We had approximately 25,765 shareholders of common stock at December 25, 2021.
Issuer Purchases of Equity Securities
Period
(a) Total Number
of Shares
Purchased
(b) Average Price paid per share
(c) Total Number
of Shares
Purchased as Part of Publicly
Announced Plans or
Programs
(d) Approximate Dollar Value of Maximum
Number of Shares that May Yet Be Purchased Under
the Plans or Programs
September 26, 2021 to October 23, 2021 ...... — $ — — $ 123,856,000 October 24, 2021 to November 27, 2021 ..... 8,777 227.22 8,777 121,862,000 November 28, 2021 to December 25, 2021 .. — — — 121,862,000 Total .............................................................. 8,777 $ 227.22 8,777 $ 121,862,000
On May 13, 2014, we announced a capital allocation philosophy which covered both the quarterly dividend rate as well as a share repurchase program. The Board of Directors at that time authorized the purchase of up to $500 million of the Company's outstanding common stock from time to time over twelve months at prevailing market prices, through open market or privately-negotiated transactions. On February 24, 2015 and again on October 31, 2018, the Board of Directors authorized additional purchases of up to $250 million of the Company's outstanding common stock with no stated expiration date bringing total authorization to $1.0 billion. As of December 25, 2021, we have acquired 6,475,406 shares for approximately $878.0 million under this share repurchase program.
20

ITEM 6. [RESERVED]
ITEM 7. MANAGEMENT’S DISCUSSION AND ANALYSIS OF FINANCIAL CONDITION AND RESULTS OF OPERATION.
MANAGEMENT’S DISCUSSION AND ANALYSIS
Forward‑Looking Statements
Management’s discussion and analysis, and other sections of this annual report, contain forward‑looking statements within the meaning of the Private Securities Litigation Reform Act of 1995. These forward‑looking statements are based on assumptions that management has made in light of experience in the industries in which the Company operates, as well as management’s perceptions of historical trends, current conditions, expected future developments and other factors believed to be appropriate under the circumstances. These statements are not guarantees of performance or results. They involve risks, uncertainties (some of which are beyond the Company’s control) and assumptions. Management believes that these forward‑looking statements are based on reasonable assumptions. Many factors could affect the Company’s actual financial results and cause them to differ materially from those anticipated in the forward‑looking statements. These factors include, among other things, risk factors described from time to time in the Company’s reports to the Securities and Exchange Commission, as well as future economic and market circumstances, industry conditions, company performance and financial results, operating efficiencies, availability and price of raw materials, availability and market acceptance of new products, product pricing, domestic and international competitive environments, and actions and policy changes of domestic and foreign governments.
The following discussion and analysis provides information which management believes is relevant to an assessment and understanding of our consolidated results of operations and financial position. This discussion should be read in conjunction with the Consolidated Financial Statements and related Notes.
This section of this Form 10-K generally discusses 2021 and 2020 items and year-to-year comparisons between 2021 and 2020. Discussions of 2019 items and year-to-year comparisons between 2020 and 2019 that are not included in this Form 10-K can be found in "Management's Discussion and Analysis of Financial Conditions and Results of Operations" in Part II, Item 7 of the Company's Annual Report on Form 10-K for the fiscal year ended December 31, 2020.
21

General
2021 2020Change
2021 - 2020 2019Change
2020 - 2019
Dollars in millions, except per share amountsConsolidated
Net sales ........................................................................................................... $ 3,501.6 $ 2,895.4 20.9 % $ 2,767.0 4.6 %Gross profit ....................................................................................................... 883.9 765.5 15.5 % 682.7 12.1 %
as a percent of sales ................................................................................. 25.2 % 26.4 % 24.7 %SG&A expense ................................................................................................. 597.1 539.6 10.7 % 454.8 18.6 %
as a percent of sales ................................................................................. 17.1 % 18.6 % 16.4 %Operating income ............................................................................................. 286.8 225.9 27.0 % 227.9 (0.9) %
as a percent of sales ................................................................................. 8.2 % 7.8 % 8.2 %Net interest expense ......................................................................................... 41.4 38.7 7.0 % 36.2 6.9 %Effective tax rate .............................................................................................. 23.6 % 25.7 % 23.9 %Net earnings attributable to Valmont Industries, Inc ....................................... 195.6 140.7 39.0 % 146.4 (3.9) %Diluted earnings per share ................................................................................ $ 9.10 $ 6.57 38.5 % $ 6.73 (2.4) %
Utility Support Structures Segment
Net sales ........................................................................................................... $ 1,121.0 $ 1,002.2 11.9 % $ 885.6 13.2 %Gross profit ....................................................................................................... 197.1 210.4 (6.3) % 187.6 12.2 %SG&A expense ................................................................................................. 129.5 109.6 18.2 % 99.8 9.8 %Operating income ............................................................................................. 67.6 100.8 (32.9) % 87.8 14.8 %
Engineered Support Structures Segment
Net sales ........................................................................................................... $ 1,064.4 $ 983.5 8.2 % $ 1,002.1 (1.9) %Gross profit ....................................................................................................... 296.1 271.4 9.1 % 229.0 18.5 %SG&A expense ................................................................................................. 180.6 206.1 (12.4) % 163.4 26.1 %Operating income ............................................................................................. 115.5 65.3 76.9 % 65.6 (0.5) %
Coatings Segment
Net sales ........................................................................................................... $ 299.1 $ 269.6 10.9 % $ 300.6 (10.3) %Gross profit ....................................................................................................... 92.2 86.4 6.7 % 94.2 (8.3) %SG&A expense ................................................................................................. 41.9 43.4 (3.5) % 43.2 0.5 %Operating income ............................................................................................. 50.3 43.0 17.0 % 51.0 (15.7) %
Irrigation Segment
Net sales ........................................................................................................... $ 1,017.1 $ 640.1 58.9 % $ 578.7 10.6 %Gross profit ....................................................................................................... 297.7 197.3 50.9 % 171.9 14.8 %SG&A expense ................................................................................................. 160.6 114.2 40.6 % 100.2 14.0 %Operating income ............................................................................................. 137.1 83.1 65.0 % 71.7 15.9 %
Net corporate expense
Gross profit ....................................................................................................... $ 0.8 $ — — $ — — %SG&A expense ................................................................................................. 84.5 66.3 27.5 % 48.2 37.6 %Operating loss ................................................................................................... (83.7) (66.3) 26.2 % (48.2) 37.6 %
22
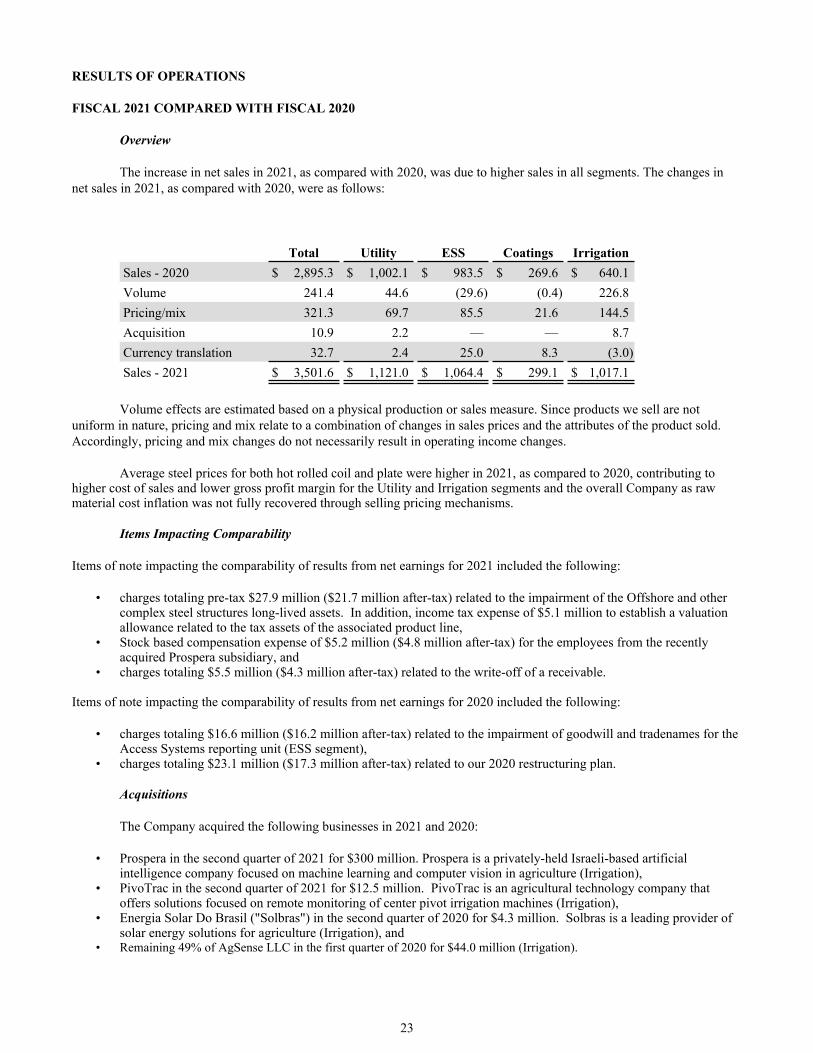
RESULTS OF OPERATIONS
FISCAL 2021 COMPARED WITH FISCAL 2020
Overview
The increase in net sales in 2021, as compared with 2020, was due to higher sales in all segments. The changes in net sales in 2021, as compared with 2020, were as follows:
Total Utility ESS Coatings IrrigationSales - 2020 $ 2,895.3 $ 1,002.1 $ 983.5 $ 269.6 $ 640.1 Volume 241.4 44.6 (29.6) (0.4) 226.8 Pricing/mix 321.3 69.7 85.5 21.6 144.5 Acquisition 10.9 2.2 — — 8.7 Currency translation 32.7 2.4 25.0 8.3 (3.0) Sales - 2021 $ 3,501.6 $ 1,121.0 $ 1,064.4 $ 299.1 $ 1,017.1
Volume effects are estimated based on a physical production or sales measure. Since products we sell are not uniform in nature, pricing and mix relate to a combination of changes in sales prices and the attributes of the product sold. Accordingly, pricing and mix changes do not necessarily result in operating income changes.
Average steel prices for both hot rolled coil and plate were higher in 2021, as compared to 2020, contributing to higher cost of sales and lower gross profit margin for the Utility and Irrigation segments and the overall Company as raw material cost inflation was not fully recovered through selling pricing mechanisms.
Items Impacting Comparability
Items of note impacting the comparability of results from net earnings for 2021 included the following:
• charges totaling pre-tax $27.9 million ($21.7 million after-tax) related to the impairment of the Offshore and other complex steel structures long-lived assets. In addition, income tax expense of $5.1 million to establish a valuation allowance related to the tax assets of the associated product line,
• Stock based compensation expense of $5.2 million ($4.8 million after-tax) for the employees from the recently acquired Prospera subsidiary, and
• charges totaling $5.5 million ($4.3 million after-tax) related to the write-off of a receivable.
Items of note impacting the comparability of results from net earnings for 2020 included the following:
• charges totaling $16.6 million ($16.2 million after-tax) related to the impairment of goodwill and tradenames for the Access Systems reporting unit (ESS segment),
• charges totaling $23.1 million ($17.3 million after-tax) related to our 2020 restructuring plan.
Acquisitions
The Company acquired the following businesses in 2021 and 2020:
• Prospera in the second quarter of 2021 for $300 million. Prospera is a privately-held Israeli-based artificial intelligence company focused on machine learning and computer vision in agriculture (Irrigation),
• PivoTrac in the second quarter of 2021 for $12.5 million. PivoTrac is an agricultural technology company that offers solutions focused on remote monitoring of center pivot irrigation machines (Irrigation),
• Energia Solar Do Brasil ("Solbras") in the second quarter of 2020 for $4.3 million. Solbras is a leading provider of solar energy solutions for agriculture (Irrigation), and
• Remaining 49% of AgSense LLC in the first quarter of 2020 for $44.0 million (Irrigation).
23
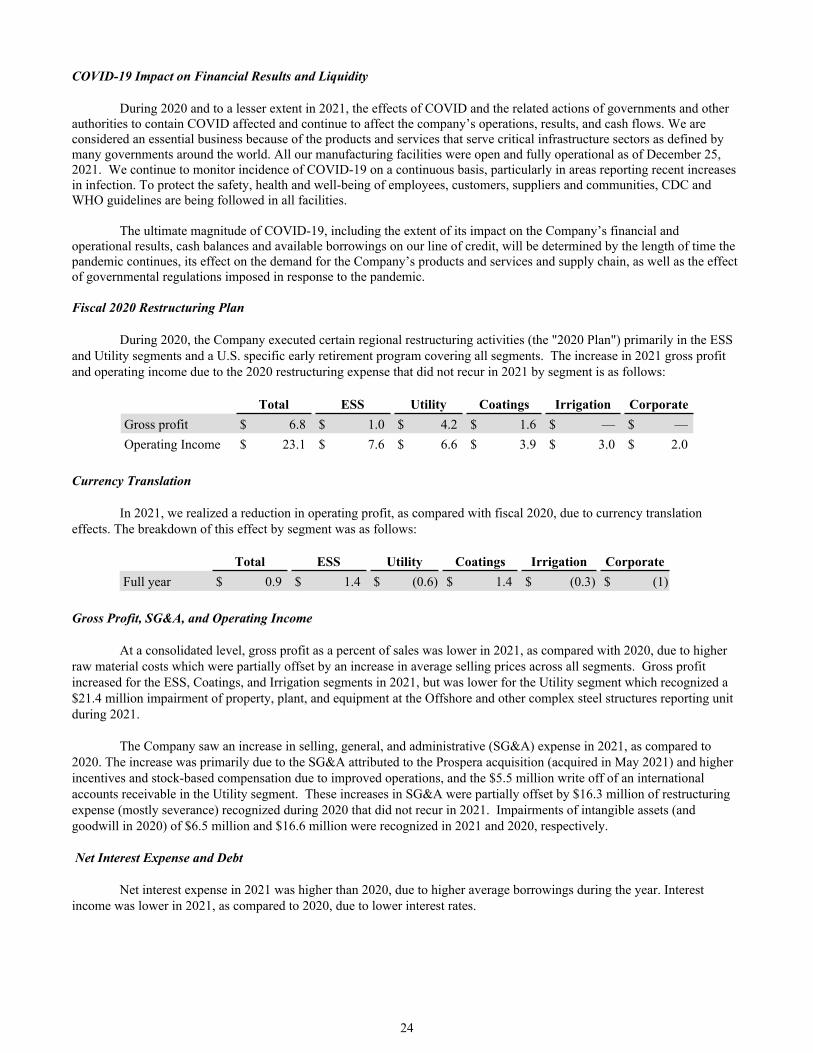
COVID-19 Impact on Financial Results and Liquidity
During 2020 and to a lesser extent in 2021, the effects of COVID and the related actions of governments and other authorities to contain COVID affected and continue to affect the company’s operations, results, and cash flows. We are considered an essential business because of the products and services that serve critical infrastructure sectors as defined by many governments around the world. All our manufacturing facilities were open and fully operational as of December 25, 2021. We continue to monitor incidence of COVID-19 on a continuous basis, particularly in areas reporting recent increases in infection. To protect the safety, health and well-being of employees, customers, suppliers and communities, CDC and WHO guidelines are being followed in all facilities.
The ultimate magnitude of COVID-19, including the extent of its impact on the Company’s financial and operational results, cash balances and available borrowings on our line of credit, will be determined by the length of time the pandemic continues, its effect on the demand for the Company’s products and services and supply chain, as well as the effect of governmental regulations imposed in response to the pandemic.
Fiscal 2020 Restructuring Plan
During 2020, the Company executed certain regional restructuring activities (the "2020 Plan") primarily in the ESS and Utility segments and a U.S. specific early retirement program covering all segments. The increase in 2021 gross profit and operating income due to the 2020 restructuring expense that did not recur in 2021 by segment is as follows:
Total ESS Utility Coatings Irrigation CorporateGross profit $ 6.8 $ 1.0 $ 4.2 $ 1.6 $ — $ — Operating Income $ 23.1 $ 7.6 $ 6.6 $ 3.9 $ 3.0 $ 2.0
Currency Translation
In 2021, we realized a reduction in operating profit, as compared with fiscal 2020, due to currency translation effects. The breakdown of this effect by segment was as follows:
Total ESS Utility Coatings Irrigation CorporateFull year $ 0.9 $ 1.4 $ (0.6) $ 1.4 $ (0.3) $ (1)
Gross Profit, SG&A, and Operating Income
At a consolidated level, gross profit as a percent of sales was lower in 2021, as compared with 2020, due to higher raw material costs which were partially offset by an increase in average selling prices across all segments. Gross profit increased for the ESS, Coatings, and Irrigation segments in 2021, but was lower for the Utility segment which recognized a $21.4 million impairment of property, plant, and equipment at the Offshore and other complex steel structures reporting unit during 2021. The Company saw an increase in selling, general, and administrative (SG&A) expense in 2021, as compared to 2020. The increase was primarily due to the SG&A attributed to the Prospera acquisition (acquired in May 2021) and higher incentives and stock-based compensation due to improved operations, and the $5.5 million write off of an international accounts receivable in the Utility segment. These increases in SG&A were partially offset by $16.3 million of restructuring expense (mostly severance) recognized during 2020 that did not recur in 2021. Impairments of intangible assets (and goodwill in 2020) of $6.5 million and $16.6 million were recognized in 2021 and 2020, respectively.
Net Interest Expense and Debt
Net interest expense in 2021 was higher than 2020, due to higher average borrowings during the year. Interest income was lower in 2021, as compared to 2020, due to lower interest rates.
24

Other Income/Expense
The change in other income/expenses in 2021, as compared to 2020, was due to an increase of approximately $7.3 million of income recognized from the Delta pension plan.
Income Tax Expense
Our effective income tax rate in 2021 and 2020 was 23.6% and 25.7%, respectively. In 2021, the decrease in the effective tax rate was the result of a U.S. tax benefit related to foreign taxes paid which was offset by a valuation allowance recorded against the Offshore and other complex steel structures' deferred tax assets. In 2020, the effective tax rate was impacted by the partial impairment of goodwill and tradename for the Access Systems business that was not fully tax deductible.
Earnings Attributable to Noncontrolling Interests
Earnings attributable to noncontrolling interests was comparable in 2021 with 2020.
Cash Flows from Operations Our cash flows provided by operations was $65.9 million in fiscal 2021, as compared with $316.3 million provided by operations in fiscal 2020. The decrease in operating cash flow in 2021, as compared with 2020, was due to the $289.9 million increase in inventory and the $69.3 million increase in accounts receivable partially offset by the increase in accounts payable and accrued expenses of $119.3 million and the early payment (December 2020) of the required 2021 annual contribution to the Delta pension plan that did not occur in 2021.
Engineered Support Structures (ESS) segment
Net sales were higher in 2021 as compared to 2020, primarily driven by an increase in average selling prices across all product lines, and favorable foreign currency translation effects which offset the decrease in sales volumes for the lighting, traffic, and highway product line. Sales amounts were higher for the communication products and access systems product lines while comparable for lighting, traffic, and highway products' line year over year. Customer pricing actions were taken across all product lines during 2021 to counter the significant inflation seen in materials, most specifically steel.
Lighting, traffic, and highway safety product sales in 2021 were $0.4 million higher, as compared to 2020. In North America, sales decreased slightly as declines in volumes within the transportation markets were partially offset by increased higher average selling pricing year over year. Lighting, traffic, and highway safety product sales in international markets increased in 2021, as compared to 2020, due to favorable foreign currency translation effects of approximately $18 million, slightly higher average selling prices, and slightly lower sales volumes.
Communication product line sales were higher by $50 million in 2021 as compared with 2020. In North America, communication product sales volumes increased due to strong demand from 5G and other connectivity initiatives and an increase in average selling prices. Communication product line sales within international markets increased modestly in 2021 mostly attributed to an increase in volume.
Access Systems product line net sales increased by $17.5 million in 2021, as compared to 2020. Favorable foreign currency translation effects were approximately $6 million in 2021, as compared to 2020, with the majority of the remaining increase in 2021 attributed to improved sales volumes.
Gross profit was higher in 2021, as compared to 2020, primarily from the sales volume increase in the communication product line. SG&A was lower in 2021 versus 2020 due primarily to recording a partial goodwill and tradename impairment for the Access Systems business of $16.6 million during 2020. Operating income increased in 2021 due the gross profit contribution from the increase in sales volumes and the lower SG&A due to the goodwill and tradename impairment of the Access Systems business and other restructuring costs recognized in 2020 that did not recur in 2021.
Utility Support Structures (Utility) segment
In the Utility segment, sales increased in 2021, as compared with 2020, due primarily to an increase in average selling prices for the steel structures product line. A number of our sales contracts in North America contain provisions that
25

tie the sales price to published steel index pricing at the time our customer issues their purchase order. Our average selling prices for the steel structures product line were higher during the second half of 2021, as compared to 2020, reflecting the significant inflation seen in the cost of steel during 2021.
Offshore and other complex steel structures sales was comparable in 2021 to 2020 and solar tracking solutions sales decreased $23.5 million in 2021, as compared to 2020, due to a decrease in sales volumes attributed to less large projects.
Gross profit decreased in 2021, as compared to 2020, due primarily to the $21.4 million impairment of long-lived asset for the offshore steel structures product line. SG&A expense was higher in 2021, as compared with 2020, primarily due to $6.5 million of impairments of Offshore and other complex steel structures intangible assets and a $5.5 million write-off of an account receivable. These increases in SG&A were partially offset by the 2020 restructuring actions, including the early retirement program, which resulted in $2.5 million of expense during 2020 that did not recur in 2021. Operating income decreased in 2021 primarily due to the $27.9 million impairment of long-lived assets for the Offshore and other complex steel structures reporting unit.
Coatings segment
Coatings segment sales increased in 2021, as compared to 2020, due to higher average selling prices and favorable foreign currency translation. In North America, higher average selling prices helped to counteract the higher cost of zinc that incurred throughout the year. North America continued to see decreased industrial production attributed largely to the economic impacts from COVID-19, but not to the severity of 2020. In the Asia-Pacific region, sales volumes improved in all regions, primarily due to an increase in average sales price, higher volumes, and favorable foreign currency translation.
SG&A expense decreased in 2021, as compared to 2020. SG&A expense in 2020 included $2.4 million of non-recurring costs related to closing down a Coatings location in North America and the early retirement program that did not recur in 2021. Operating income was higher in 2021, compared to 2020, due to the higher average selling prices and foreign currency translation in North America and Asia and the lower SG&A expense, partially offset by startup costs incurred in 2021 related to the new Pittsburgh facility.
Irrigation segment
Irrigation segment net sales increased in 2021, as compared to 2020, primarily due to higher sales volumes in almost all markets, as well as higher average selling prices. Net sales also increased slightly due to the continuing increase in sales of technology-related products and services, strengthened by our acquisitions of Prospera and PivoTrac. The sales increase for international irrigation of $215.7 million was primarily due to deliveries on the multi-year Egypt project and higher sales volumes in Brazil. In North America, higher sales volumes for irrigation systems and parts were driven by improved agricultural commodity prices. Average selling prices for the North American tubular product line were up substantially in 2021, versus 2020, to reflect the inflation seen in the cost of steel during 2021.
SG&A was higher in 2021, as compared to 2020, due to approximately $20.0 million of SG&A from recently acquired Prospera and PivoTrac, higher compensation costs, and higher incentives due to improved business performance. These increases were somewhat offset by one-time costs associated with the early retirement program incurred in 2020. Operating income increased in 2021 over 2020, as improved global sales volumes and pricing more than offset increases in the cost of steel.
Net corporate expense
Corporate SG&A expense was higher in 2021 as compared to 2020. The increase can be attributed to higher incentive expenses due to improved business performance, an increase in stock compensation expense, an increase in acquisition diligence expense, as well as an increase in rent expense with the new corporate headquarters lease. The increase was partially offset by $1.7 million of non-recurring severance costs from the 2020 early retirement program and the change in valuation of deferred compensation plan assets which resulted in lower expense in 2021, as compared to 2020. The change in deferred compensation plan assets is offset by the same amount in other income/expenses.
26

LIQUIDITY AND CAPITAL RESOURCES
Capital Allocation Philosophy
We have historically funded our growth, capital spending and acquisitions through a combination of operating cash flows and debt financing. The following are the capital allocation/priorities for cash generated:
• working capital and capital expenditure investments necessary for future sales growth;
• dividends on common stock in the range of 20% of the prior year's fully diluted net earnings;
• acquisitions; and
• return of capital to shareholders through share repurchases.
We also announced our intention to manage our capital structure to maintain our investment grade debt rating. Our most recent ratings were Baa3 by Moody's Investors Services, Inc., BBB- by Fitch Ratings, and BBB+ by Standard and Poor's Rating Services. We would be willing to allow our debt rating to fall to BBB- to finance a special acquisition or other opportunity. We expect to maintain a ratio of debt to invested capital which will support our current investment grade debt rating.
The Board of Directors in May 2014 authorized the purchase of up to $500 million of the Company's outstanding common stock from time to time over twelve months at prevailing market prices, through open market or privately-negotiated transactions. The Board of Directors authorized an additional $250 million of share purchases, without an expiration date in both February 2015 and again in October 2018. The purchases will be funded from available working capital and short-term borrowings and will be made subject to market and economic conditions. We are not obligated to make any repurchases and may discontinue the program at any time. As of December 25, 2021, we have acquired approximately 6.5 million shares for approximately $878.0 million under this share repurchase program.
Sources of Financing
Our debt financing at December 25, 2021 consisted primarily of long‑term debt and borrowings on our revolving credit facility. Our long‑term debt as of December 25, 2021, principally consisted of:
• $450 million face value ($436.9 million carrying value) of senior unsecured notes that bear interest at 5.00% per annum and are due in October 2044.
• $305 million face value ($297.7 million carrying value) of senior unsecured notes that bear interest at 5.25% per annum and are due in October 2054.
We are allowed to repurchase the notes subject to the payment of a make-whole premium. Both tranches of these notes are guaranteed by certain of our subsidiaries.
Our revolving credit facility with JP Morgan Chase Bank, N.A., as Administrative Agent, and the other lenders party thereto, had a maturity date of October 18, 2022. On October 18, 2021, we along with our wholly-owned subsidiaries Valmont Industries Holland B.V. and Valmont Group Pty. Ltd., as borrowers, entered into an amendment and restatement of our revolving credit agreement with our lenders. The term was extended to October 18, 2026.
The revolving credit facility provides for $800 million of committed unsecured revolving credit loans with available borrowings thereunder to $400 million in foreign currencies. We may increase the credit facility by up to an additional $300 million at any time, subject to lenders increasing the amount of their commitments. The Company and our wholly-owned subsidiaries Valmont Industries Holland B.V. and Valmont Group Pty. Ltd., are authorized borrowers under the credit facility. The obligations arising under the revolving credit facility are guaranteed by the Company and its wholly-owned subsidiaries Valmont Telecommunications, Inc., Valmont Coatings, Inc., Valmont Newmark, Inc., and Valmont Queensland Pty. Ltd.
27

The interest rate on our borrowings will be, at our option, either:
(a) term SOFR (based on a 1, 3 or 6 month interest period, as selected by the Company) plus a 10 basis point adjustment plus a spread of 100 to 162.5 basis points, depending on the credit rating of the Company's senior, unsecured, long-term debt published by Standard & Poor's Rating Services and Moody's Investors Service, Inc.;
(b) the higher of
• the prime lending rate,
• the overnight bank rate plus 50 basis points, and
• term SOFR (based on a 1 month interest period) plus 100 basis points,
plus, in each case, 0 to 62.5 basis points, depending on the credit rating of our senior, unsecured, long-term debt published by Standard & Poor's Rating Services and Moody's Investors Service, Inc.; or
(c) daily simple SOFR plus a 10 basis point adjustment plus a spread of 100 to 162.5 basis points, depending on the credit rating of the Company's senior, unsecured, long-term debt published by Standard & Poor's Rating Services and Mood's Investors Service, Inc.
A commitment fee is also required under the revolving credit facility which accrues at 10 to 25 basis points, depending on the credit rating of our senior, unsecured long-term debt published by Standard and Poor's Rating Services and Moody's Investor Services, Inc., on the average daily unused portion of the commitments under the revolving credit agreement.
At December 25, 2021, we had outstanding borrowings of $218.9 million under the revolving credit facility. The revolving credit facility has a maturity date of October 18, 2026 and contains a financial covenant that may limit our additional borrowing capability under the agreement. At December 25, 2021, we had the ability to borrow $590.5 million under this facility, after consideration of standby letters of credit of $0.7 million associated with certain insurance obligations. We also maintain certain short‑term bank lines of credit totaling $137.8 million; $124.4 million of which was unused at December 25, 2021.
Our senior, unsecured notes and revolving credit agreement each contain cross-default provisions which permit the acceleration of our indebtedness to them if we default on other indebtedness that results in, or permits, the acceleration of such other indebtedness.
The revolving credit facility requires maintenance of a financial leverage ratio, measured as of the last day of each of our fiscal quarters, of 3.50:1 or less. The leverage ratio is the ratio of: (a) interest-bearing debt minus unrestricted cash in excess of $50 million (but not exceeding $500 million); to (b) adjusted EBITDA. The debt agreements provide a modification of the definition of “EBITDA” to add-back any non-cash stock-based compensation in any trailing twelve month period and allow for an adjustment to EBITDA, subject to certain limitations, for non-cash charges or gains that are non-recurring in nature. The leverage ratio is permitted to increase from 3.50:1 to 3:75:1 for the four consecutive fiscal quarters after certain material acquisitions.
The amended and restated revolving credit agreement also contains customary affirmative and negative covenants or credit facilities of this type, including, among others, limitations on us and our subsidiaries with respect to indebtedness, liens, mergers and acquisitions, investments, dispositions of assets, restricted payments, transactions with affiliates and prepayments of indebtedness. The amended and restated revolving credit agreement also provides for acceleration of the obligations thereunder and exercise of other enforcement remedies upon the occurrence of customary events of default (subject to customary grace periods, as applicable).
At December 25, 2021, we were in compliance with all covenants related to these debt agreements.
The calculation of Adjusted EBITDA-last four quarters and the Leverage ratio are presented under the column for fiscal 2021 in footnotes (b) and (c) to the tables below in Selected Financial Measures.
28

Cash Uses
Our principal cash requirements include working capital, capital expenditures, payments of principal and interest on our debt, payments of taxes, contributions to pension plan, and, if market conditions warrant, occasional investments in, or acquisitions of, business ventures. In addition, we regularly evaluate our ability to pay dividends or repurchase stock, all consistent with the terms of our debt agreements.
Cash requirements for fiscal 2022 are expected to consist primarily of capital expenditures, Delta pension plan contributions, operating leases, and interest on outstanding debt. The Company also has unconditional purchase commitments that relate to purchase orders for zinc, aluminum and steel, all of which we plan to use in 2022. We believe the quantities under contract are reasonable in light of normal fluctuations in business levels and we expect to use the commodities under contract during the contract period. Total capital expenditures for fiscal 2022 are expected to be approximately $115 million.
The following table summarizes current and long-term material cash requirements as of December 25, 2021 (in millions of dollars):
Contractual Obligations TotalNext 12 months Thereafter
Long‑term debt ........................................ $ 979.6 $ 4.9 $ 974.7 Interest1
.................................................... 1,075.6 41.4 1,034.2 Delta pension plan contributions ............. 175.8 19.5 156.3 Operating leases ....................................... 235.4 23.2 212.2 Total contractual cash obligations ........... $ 2,466.4 $ 89.0 $ 2,377.4
1 Interest expense amount assumes that long-term debt will be held to maturity.
Our businesses are cyclical, but we have diversity in our markets, from a product, customer and a geographical standpoint. We have demonstrated the ability to effectively manage through business cycles and maintain liquidity. We have consistently generated operating cash flows in excess of our capital expenditures. Based on our available credit facilities, recent issuance of senior unsecured notes and our history of positive operational cash flows, we believe that we have adequate liquidity to meet our needs for fiscal 2022 and beyond.
We have cash balances of $177.2 million at December 25, 2021, approximately $169.5 million is held in our non-U.S. subsidiaries. If we distributed our foreign cash balances certain taxes would be applicable. At December 25, 2021, we have a liability for foreign withholding taxes and U.S. state income taxes of $2.7 million and $0.7 million, respectively.
Cash Flows
(Dollars in thousands) 2021 2020 2019Cash flow data:
Net cash flows from operating activities .......................... $ 65,938 $ 316,294 $ 307,614 Net cash flows from investing activities .......................... (417,308) (104,029) (168,150) Net cash flows from financing activities .......................... 133,500 (173,756) (98,950)
Operating Cash Flows and Working Capital- Cash generated from operating activities totaled $65.9 million in 2021, compared with $316.3 million in 2020 and $307.6 million in 2019. Net working capital was $946.9 million at December 25, 2021, as compared with $881.3 million at December 26, 2020. The increase in net working capital in 2021 was attributed to an increase in inventory (primarily driven by the impact of higher steel costs) and receivables (primarily driven by higher sales in the fourth quarter), somewhat offset by increases in accounts payable and accrued compensation and benefits (primarily driven by higher accrual for incentives earned during 2021) and the use of cash to facilitate our investing and financing activities. The decrease in operating cash flow in 2021 was favorably impacted by the required 2021 annual contribution to the Delta pension plan being made early in December 2020.
Investing Cash Flows- Cash used in investing activities totaled $417.3 million in 2021, compared to $104.0 million in 2020. Investing activities in 2021 primarily included capital spending of $107.8 million and the acquisition of two
29

businesses within the Irrigation segment for $312.5 million. In 2020, investing activities primarily included capital spending of $106.7 million, acquisitions of $15.9 million, proceeds from the settlement of a net investment hedge of $12.0 million, and proceeds from the sale of assets of $10.9 million.
Financing Cash Flows- Cash provided by financing activities totaled $133.5 million in 2021, compared to cash used in financing activities of $173.8 million in 2020. Our total interest‑bearing debt increased to $965.4 million at December 25, 2021, from $766.3 million at December 26, 2020. Financing cash inflows in 2021 primarily consisted of proceeds from long-term debt borrowings of $312.5 million, offset by payments on long-term debt of $91.3 million, dividends paid of $41.4 million, net payments on short-term agreements of $20.2 million, and the purchase of treasury shares of $26.1 million. During 2020, the Company had proceeds from long-term debt borrowings of $88.9 million and net proceeds of $13.0 million from short-term agreements. This was reduced primarily by the repayment of long-term debt of $121.7 million, dividends paid of $36.9 million, the purchase of noncontrolling interest of $59.4 million and the purchase of treasury shares of $56.5 million.
Guarantor Summarized Financial Information
We are providing the following information in compliance with Rule 3-10 and Rule 13-01 of Regulation S-X with respect to our two tranches of senior unsecured notes. All of the senior notes are guaranteed, jointly, severally, fully and unconditionally (subject to certain customary release provisions, including sale of the subsidiary guarantor, or sale of all or substantially all of its assets) by certain of the Company’s current and future direct and indirect domestic and foreign subsidiaries (collectively the “Guarantors”). The Parent is the Issuer of the notes and consolidates all Guarantors.
The financial information of Issuer and Guarantors is presented on a combined basis with intercompany balances and transactions between Issuer and Guarantors eliminated. The Issuer’s or Guarantors' amounts due from, amounts due to, and transactions with non-guarantor subsidiaries are separately disclosed.
Combined financial information is as follows:
Supplemental Combined Parent and Guarantors Financial InformationFor the three year period ended December 25, 2021
Dollars in thousands 2021 2020 2019
Net sales .................................................................... $ 2,139,427 $ 1,854,141 $ 1,751.899 Gross Profit ............................................................... 574,128 512,880 454,295Operating income ...................................................... 208,041 180,206 178,990Net earnings .............................................................. 120,655 106,404 109,908
Net earnings attributable to Valmont Industries, Inc. ... 120,458 102,266 109,908
Supplemental Combined Parent and Guarantors Financial InformationDecember 25, 2021 and December 26, 2020
Dollars in thousands 2021 2020
Current assets ............................................................... $ 801,797 $ 738,437 Noncurrent assets ......................................................... 807,294 701,571 Current liabilities .......................................................... 383,394 321,979 Noncurrent liabilities .................................................... 1,305,756 1,100,657 Noncontrolling interest in consolidated subsidiaries .... 1,844 1,738
Included in noncurrent assets is a due from non-guarantor subsidiaries receivable of $93,613 and $88,309 at December 25, 2021 and December 26, 2020. Included in noncurrent liabilities is a due to non-guarantor subsidiaries payable of $236,577 and $262,935 at December 25, 2021 and December 26, 2020
30

Selected Financial Measures
We are including the following financial measures for the company.
Dollars in thousands 2021 2020 2019Total invested capital(a) ................................................... $ 2,378,992 $ 1,974,162 $ 1,977,223 Return on invested capital(a) ............................................ 10.1 % 8.7 % 8.9 %Adjusted EBITDA(b) ....................................................... $ 448,864 $ 368,493 $ 328,165
Leverage ratio (c) ................................................................ 1.87 1.13 1.47
(a) Return on Invested Capital is calculated as Operating Income (after-tax) divided by the average of beginning and ending Invested Capital. Invested Capital represents total assets minus total liabilities (excluding interest-bearing debt). Return on Invested Capital is one of our key operating ratios, as it allows investors to analyze our operating performance in light of the amount of investment required to generate our operating profit. Return on Invested Capital is also a measurement used to determine management incentives. Return on Invested Capital is a non-GAAP measure. Accordingly, Invested Capital and Return on Invested Capital should not be considered in isolation or as a substitute for net earnings, cash flows from operations or other income or cash flow data prepared in accordance with GAAP or as a measure of our operating performance or liquidity. The table below shows how Invested Capital and Return on Invested Capital are calculated from our income statement and balance sheet.
Dollars in thousands 2021 2020 2019Operating income ................................................................... $ 286,785 $ 225,953 $ 227,905 Adjusted effective tax rate1
.................................................... 23.6 % 24.2 % 23.9 %Tax effect on operating income ............................................. (67,681) (54,681) (54,469) After-tax operating income .................................................... 219,104 171,272 173,436 Average invested capital ........................................................ 2,176,577 1,975,693 1,953,120 Return on invested capital ...................................................... 10.1 % 8.7 % 8.9 %Total assets ............................................................................. 3,447,249 2,953,160 2,807,216 Less: Accounts payable .......................................................... (347,841) (268,099) (197,957) Less: Accrued expenses ......................................................... (253,330) (227,735) (167,264) Less: Defined benefit pension liability .................................. (536) (118,523) (140,007) Less: Deferred compensation ................................................. (35,373) (44,519) (45,114) Less: Other noncurrent liabilities ........................................... (89,207) (58,657) (8,904) Less: Dividends payable ........................................................ (10,616) (9,556) (8,079) Less: Lease liability ............................................................... (147,759) (80,202) (85,817)
Less: Contract liability ........................................................... (135,746) (130,018) (117,945) Less: Deferred tax liability ..................................................... (47,849) (41,689) (58,906) Total Invested capital ............................................................. $ 2,378,992 $ 1,974,162 $ 1,977,223 Beginning of year invested capital ......................................... $ 1,974,162 $ 1,977,223 $ 1,929,016 Average invested capital ........................................................ $ 2,176,577 $ 1,975,693 $ 1,953,120
1 The adjusted effective tax rate for 2020 excludes the effects of the $12,575 goodwill impairment which is not deductible for income tax purposes. The effective tax rate in 2020 including the impairments is 25.7%.
Return on invested capital, as presented, may not be comparable to similarly titled measures of other companies.
(b) Earnings before Interest, Taxes, Depreciation and Amortization (Adjusted EBITDA) is one of our key financial ratios in that it is the basis for determining our maximum borrowing capacity at any one time. Our bank credit agreements contain a financial covenant that our total interest‑bearing debt not exceed 3.50x Adjusted EBITDA (or 3.75x Adjusted EBITDA after certain material acquisitions) for the most recent four quarters. These bank credit agreements allow us to add estimated EBITDA from acquired businesses for periods we did not own the acquired businesses. The bank credit agreements also provide for an adjustment to EBITDA, subject to certain specified limitations, for non-cash charges or gains that are non-recurring in nature. If this financial covenant is violated, we may incur additional financing costs or be required to pay the debt before its maturity date. Adjusted EBITDA is non-GAAP measure and, accordingly, should not be considered in isolation or as a substitute for net earnings, cash flows from operations or other income or cash flow data prepared in accordance with GAAP or as a measure of our operating performance or liquidity. The calculation of Adjusted EBITDA is as follows:
31

Dollars in thousands 2021 2020 2019Net cash flows from operations ........................................................................................ $ 65,938 $ 316,294 $ 307,614 Interest expense ................................................................................................................ 42,612 41,075 40,153 Income tax expense .......................................................................................................... 61,414 49,615 47,753 Loss on investment ........................................................................................................... — (39) 172 Impairment of long-lived assets ....................................................................................... (27,911) (20,389) — Deferred income tax (expense) benefit ............................................................................ (71) 1,397 (1,486) Noncontrolling interest ..................................................................................................... (2,095) (1,456) (5,697) Equity in earnings of nonconsolidated subsidiaries ......................................................... — (1,004) — Pension plan expense ....................................................................................................... 14,567 7,311 513 Contribution to pension plan ............................................................................................ 1,924 35,399 18,461 Changes in assets and liabilities, net of acquisitions ........................................................ 264,558 (98,994) (81,831) Other ................................................................................................................................. 17 (60) 2,513 EBITDA ........................................................................................................................... 420,953 329,149 328,165 Impairment of long-lived assets ....................................................................................... 27,911 20,389 — Cash restructuring expenses ............................................................................................. — 18,955 — Adjusted EBITDA ............................................................................................................ $ 448,864 $ 368,493 $ 328,165
2021 20201 20191
Net earnings attributable to Valmont Industries, Inc. ...................................................... $ 195,630 $ 140,693 $ 146,408 Interest expense ................................................................................................................ 42,612 41,075 40,153 Income tax expense .......................................................................................................... 61,414 49,615 47,753 Stock based compensation ............................................................................................... 28,720 14,874 11,587 Depreciation and amortization expense ........................................................................... 92,577 82,892 82,264 EBITDA ........................................................................................................................... 420,953 329,149 328,165 Impairment of long-lived assets ...................................................................................... 27,911 20,389 — Cash restructuring expenses ............................................................................................. — 18,955 — Adjusted EBITDA ............................................................................................................ $ 448,864 $ 368,493 $ 328,165
Adjusted EBITDA, as presented, may not be comparable to similarly titled measures of other companies. In October 2021, our revolving credit facility was amended to allow the Company to add-back any non-cash stock-based compensation in any trailing twelve month period and allow for an adjustment to EBITDA, subject to certain limitations, for non-cash charges or gains that are non-recurring in nature.
(c) Leverage ratio is calculated as the sum of interest-bearing debt minus unrestricted cash in excess of $50 million (but not exceeding $500 million); divided by Adjusted EBITDA. The leverage ratio is one of the key financial ratios in the covenants under our major debt agreements and the ratio cannot exceed 3.5 (or 3.75x after certain material acquisitions) for any reporting period (four quarters). If those covenants are violated, we may incur additional financing costs or be required to pay the debt before its maturity date. Leverage ratio is a non-GAAP measure and, accordingly, should not be considered in isolation or as a substitute for net earnings, cash flows from operations or other income or cash flow data prepared in accordance with GAAP or as a measure of our operating performance or liquidity. The calculation of this ratio is as follows:
Dollars in thousands 2021 20201 20191
Interest-bearing debt .............................................................................. $ 965,395 $ 766,326 $ 787,478 Less: Cash and cash equivalents in excess of $50 million .................... 127,232 350,726 303,542 Net indebtedness .................................................................................... 838,163 415,600 483,936 Adjusted EBITDA ................................................................................. 448,864 368,493 328,165 Leverage Ratio ....................................................................................... 1.87 1.13 1.47
Leverage ratio, as presented, may not be comparable to similarly titled measures of other companies.
1 Calculated in accordance with the terms of the credit facility as in effect on December 25, 2021.
32
MARKET RISK
Changes in Prices
Certain key materials we use are commodities traded in worldwide markets and are subject to fluctuations in price. The most significant materials are steel, aluminum, zinc and natural gas. Over the last several years, prices for these commodities have been volatile. The volatility in these prices was due to such factors as fluctuations in supply and demand conditions, government tariffs and the costs of steel‑making inputs. Steel is most significant for our Utility Support Structures segment where the cost of steel has been approximately 50% of the net sales, on average. In 2018, we began using steel hot rolled coil derivative contracts on a limited basis to mitigate the impact of rising steel prices on operating income. Assuming a similar sales mix, a hypothetical 20% change in the price of steel would have affected our net sales from our Utility Support Structures segment by approximately $75 million for the year ended December 25, 2021.
We have also experienced volatility in natural gas prices in the past several years. Our main strategies in managing these risks are a combination of fixed price purchase contracts with our vendors to reduce the volatility in our purchase prices and sales price increases where possible. We use natural gas swap contracts on a limited basis to mitigate the impact of rising gas prices on our operating income.
Risk Management
Market Risk—The principal market risks affecting us are exposure to interest rates, foreign currency exchange rates and commodity prices. At times, we utilize derivative financial instruments to hedge these exposures, but we do not use derivatives for trading purposes.
Interest Rates—Our interest‑bearing debt at December 25, 2021 was primarily fixed rate debt and borrowings on our revolving credit facility. Our notes payable, revolving credit facility, and a small portion of our long-term debt accrue interest at a variable rate. Assuming average interest rates and borrowings on variable rate debt, a hypothetical 10% change in interest rates would have affected our interest expense in 2021 and 2020 by approximately $0.4 million. Likewise, we have excess cash balances on deposit in interest‑bearing accounts in financial institutions. An increase or decrease in interest rates of ten basis points would have impacted our annual interest earnings in 2021 and 2020 by approximately $0.2 million and $0.3 million, respectively.
Foreign Exchange—Exposures to transactions denominated in a currency other than the entity’s functional currency are not material, and therefore the potential exchange losses in future earnings, fair value and cash flows from these transactions are not material. The Company is also exposed to investment risk related to foreign operations. From time to time, as market conditions indicate, we will enter into foreign currency contracts to manage the risks associated with anticipated future transactions, current balance sheet positions, and foreign subsidiary investments that are in currencies other than the functional currencies of our businesses. At December 25, 2021, the Company had two outstanding fixed-for-fixed cross currency swaps (“CCS”), swapping U.S. dollar principal and interest payments on a portion of its 5.00% senior unsecured notes due 2044 for Danish krone (DKK) and Euro denominated payments. The CCS were entered into in 2019 in order to mitigate foreign currency risk on the Company's Euro and DKK investments and to reduce interest expense. The notional of the Euro and DKK CCS are $80.0 million and $50.0 million, respectively, and mature in 2024. In 2019, the Company had outstanding foreign currency forward contracts which mitigate foreign currency risk of the Company's investment in its Australian denominated businesses. The forward contracts, which qualified as net investment hedges, were settled in 2020 with the Company receiving $12.0 million. Much of our cash in non-U.S. entities is denominated in foreign currencies, where fluctuations in exchange rates will impact our cash balances in U.S. dollar terms. A hypothetical 10% change in the value of the U.S. dollar would impact our reported cash balance by approximately $13.6 million in 2021 and $16.6 million in 2020.
We manage our investment risk in foreign operations by borrowing in the functional currencies of the foreign entities or by utilizing hedging instruments (as discussed above) where appropriate. The following table indicates the change
33
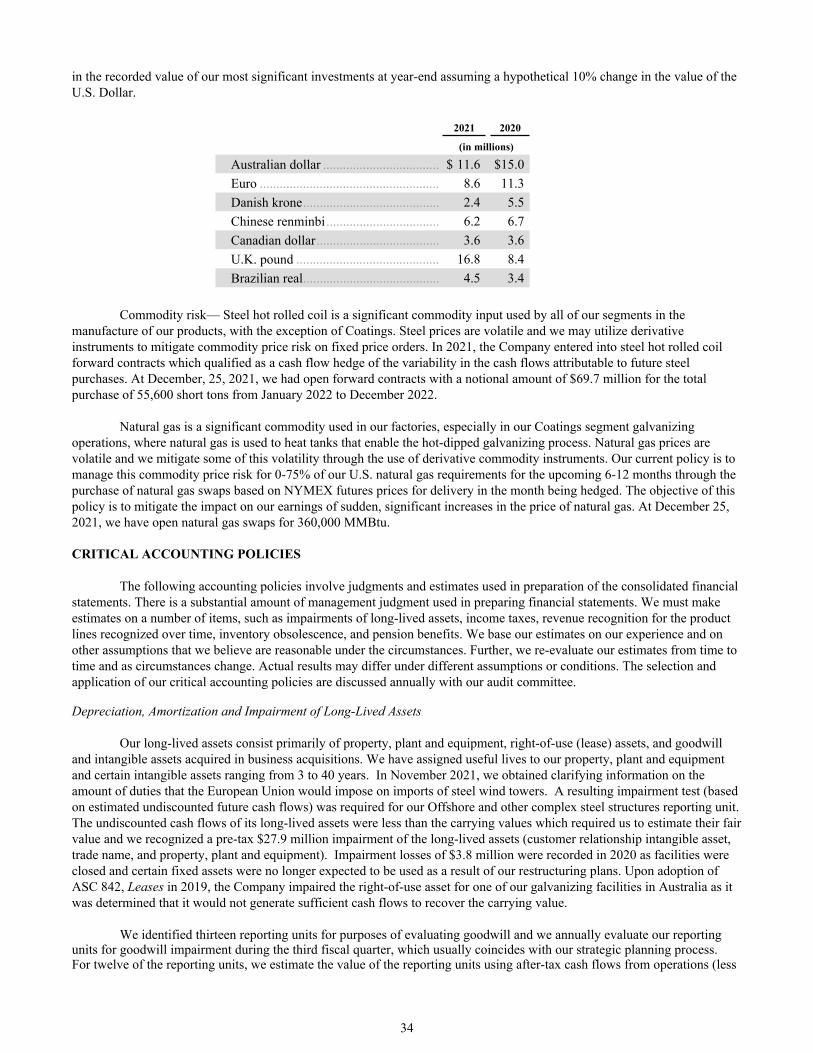
in the recorded value of our most significant investments at year-end assuming a hypothetical 10% change in the value of the U.S. Dollar.
2021 2020
(in millions)
Australian dollar ................................... $ 11.6 $ 15.0 Euro ...................................................... 8.6 11.3 Danish krone ......................................... 2.4 5.5 Chinese renminbi .................................. 6.2 6.7 Canadian dollar ..................................... 3.6 3.6 U.K. pound ........................................... 16.8 8.4 Brazilian real ......................................... 4.5 3.4
Commodity risk— Steel hot rolled coil is a significant commodity input used by all of our segments in the manufacture of our products, with the exception of Coatings. Steel prices are volatile and we may utilize derivative instruments to mitigate commodity price risk on fixed price orders. In 2021, the Company entered into steel hot rolled coil forward contracts which qualified as a cash flow hedge of the variability in the cash flows attributable to future steel purchases. At December, 25, 2021, we had open forward contracts with a notional amount of $69.7 million for the total purchase of 55,600 short tons from January 2022 to December 2022.
Natural gas is a significant commodity used in our factories, especially in our Coatings segment galvanizing operations, where natural gas is used to heat tanks that enable the hot-dipped galvanizing process. Natural gas prices are volatile and we mitigate some of this volatility through the use of derivative commodity instruments. Our current policy is to manage this commodity price risk for 0-75% of our U.S. natural gas requirements for the upcoming 6-12 months through the purchase of natural gas swaps based on NYMEX futures prices for delivery in the month being hedged. The objective of this policy is to mitigate the impact on our earnings of sudden, significant increases in the price of natural gas. At December 25, 2021, we have open natural gas swaps for 360,000 MMBtu.
CRITICAL ACCOUNTING POLICIES
The following accounting policies involve judgments and estimates used in preparation of the consolidated financial statements. There is a substantial amount of management judgment used in preparing financial statements. We must make estimates on a number of items, such as impairments of long-lived assets, income taxes, revenue recognition for the product lines recognized over time, inventory obsolescence, and pension benefits. We base our estimates on our experience and on other assumptions that we believe are reasonable under the circumstances. Further, we re-evaluate our estimates from time to time and as circumstances change. Actual results may differ under different assumptions or conditions. The selection and application of our critical accounting policies are discussed annually with our audit committee.
Depreciation, Amortization and Impairment of Long-Lived Assets
Our long-lived assets consist primarily of property, plant and equipment, right-of-use (lease) assets, and goodwill and intangible assets acquired in business acquisitions. We have assigned useful lives to our property, plant and equipment and certain intangible assets ranging from 3 to 40 years. In November 2021, we obtained clarifying information on the amount of duties that the European Union would impose on imports of steel wind towers. A resulting impairment test (based on estimated undiscounted future cash flows) was required for our Offshore and other complex steel structures reporting unit. The undiscounted cash flows of its long-lived assets were less than the carrying values which required us to estimate their fair value and we recognized a pre-tax $27.9 million impairment of the long-lived assets (customer relationship intangible asset, trade name, and property, plant and equipment). Impairment losses of $3.8 million were recorded in 2020 as facilities were closed and certain fixed assets were no longer expected to be used as a result of our restructuring plans. Upon adoption of ASC 842, Leases in 2019, the Company impaired the right-of-use asset for one of our galvanizing facilities in Australia as it was determined that it would not generate sufficient cash flows to recover the carrying value.
We identified thirteen reporting units for purposes of evaluating goodwill and we annually evaluate our reporting units for goodwill impairment during the third fiscal quarter, which usually coincides with our strategic planning process. For twelve of the reporting units, we estimate the value of the reporting units using after-tax cash flows from operations (less
34

capital expenses) discounted to present value ("discounted cash flows"). The key assumptions in the discounted cash flow analysis are the discount rate and the projected cash flows. We also use sensitivity analysis to determine the impact of changes in discount rates and cash flow forecasts on the valuation of the reporting units. For our solar tracking structure reporting unit, we project meaningful annual revenue growth for the foreseeable future due to strong market conditions. Therefore, we valued this reporting unit using a blend of both the discounted cash flows and a market approach. The market valuation approach estimates the value for this reporting unit using a multiple of earnings before interest, taxes, depreciation and amortization (EBITDA). We analyze EBITDA multiples for other industrial companies with similar product lines in determining what to use in the model. The key assumption in the market approach analysis are the selection of industrial companies with similar product lines and forecasted EBITDA.
For both the 2021 and 2020 annual impairment test, the estimated fair value of all of our reporting units exceeded their respective carrying value, so no goodwill was impaired during our annual impairment test in 2021 or 2020. A $12.6 million impairment of our access systems reporting unit was recognized as a result of an interim impairment test during second quarter of 2020.
If our assumptions on discount rates and future cash flows change as a result of events or circumstances, and we believe these assets may have declined in value, then we may record impairment charges, resulting in lower profits. Our reporting units are all cyclical and their sales and profitability may fluctuate from year to year. The Company continues to monitor changes in the global economy that could impact future operating results of its reporting units. If such conditions arise, the Company will test a given reporting unit for impairment prior to the annual test. In the evaluation of our reporting units, we look at the long-term prospects for the reporting unit and recognize that current performance may not be the best indicator of future prospects or value, which requires management judgment.
Our indefinite‑lived intangible assets consist of trade names. We assess the values of these assets apart from goodwill as part of the annual impairment testing. We use the relief-from-royalty method to evaluate our trade names, under which the value of a trade name is determined based on a royalty that could be charged to a third party for using the trade name in question. The royalty, which is based on a reasonable rate applied against estimated future sales, is tax-effected and discounted to present value. The most significant assumptions in this evaluation include estimated future sales, the royalty rate and the after-tax discount rate.
We performed our annual impairment test of all trade names in the third quarter of 2021 and determined none were impaired. As a result of a fourth quarter 2021 interim impairment test of the long-lived assets of the Offshore and other complex steel structures reporting unit, we recognized an impairment of approximately $2 million.
Inventories
Inventories are valued at the lower of cost, determined on a first-in, first-out basis, or net realizable value. We write down slow-moving and obsolete inventory by the difference between the value of the inventory and our estimate of the reduced value based on potential future uses, the likelihood that overstocked inventory will be sold and the expected selling prices of the inventory. If our ability to realize value on slow-moving or obsolete inventory is less favorable than assumed, additional inventory write downs may be required.
Income Taxes
We record valuation allowances to reduce our deferred tax assets to amounts that are more likely than not to be realized. We consider future taxable income expectations and tax-planning strategies in assessing the need for the valuation allowance. If we estimate a deferred tax asset is not likely to be fully realized in the future, a valuation allowance to decrease the amount of the deferred tax asset would decrease net earnings in the period the determination was made. Likewise, if we subsequently determine that we are able to realize all or part of a net deferred tax asset in the future, an adjustment reducing the valuation allowance would increase net earnings in the period such determination was made.
At December 25, 2021, we had approximately $83.7 million in deferred tax assets relating to tax credits and loss carryforwards, with a valuation allowance of $49.7 million, including $8.4 million in valuation allowances related to capital loss carryforwards, which are unlikely ever to be realized. If circumstances related to our deferred tax assets change in the future, we may be required to increase or decrease the valuation allowance on these assets, resulting in an increase or decrease in income tax expense and a reduction or increase in net income. Also, we consider the earnings in our greater than 50% owned non-U.S. subsidiaries to not be indefinitely reinvested and, accordingly, we have a deferred tax liability of $3.4 million related to these unremitted foreign earnings for future taxes that will be incurred when cash is repatriated.
35

We are subject to examination by taxing authorities in the various countries in which we operate. The tax years subject to examination vary by jurisdiction. We regularly consider the likelihood of additional income tax assessments in each of these taxing jurisdictions based on our experiences related to prior audits and our understanding of the facts and circumstances of the related tax issues. We include in current income tax expense any changes to accruals for potential tax deficiencies. If our judgments related to tax deficiencies differ from our actual experience, our income tax expense could increase or decrease in a given fiscal period.
Pension Benefits
Delta Ltd. maintains a defined benefit pension plan for qualifying employees in the United Kingdom. There are no active employees as members in the plan. Independent actuaries assist in properly measuring the liabilities and expenses associated with accounting for pension benefits to eligible employees. In order to use actuarial methods to value the liabilities and expenses, we must make several assumptions. The critical assumptions used to measure pension obligations and expenses are the discount rate and expected rate of return on pension assets.
We evaluate our critical assumptions at least annually. Key assumptions are based on the following factors:
• Discount rate is based on the yields available on AA-rated corporate bonds with durational periods similar to that of the pension liabilities.
• Expected return on plan assets is based on our asset allocation mix and our historical return, taking into consideration current and expected market conditions. Most of the assets in the pension plan are invested in corporate bonds, the expected return of which are estimated based on the yield available on AA rated corporate bonds. The long-term expected returns on equities are based on historic performance over the long-term.
• Inflation is based on the estimated change in the consumer price index (“CPI”) or the retail price index (“RPI”), depending on the relevant plan provisions.
The discount rate used to measure the defined benefit obligation was 1.9% at December 25, 2020. The following tables present the key assumptions used to measure the pension benefit for 2022 and the estimated impact relative to a change in those assumptions for 2022:
Assumptions PensionDiscount rate .................................................................... 1.90 %Expected return on plan assets ......................................... 3.48 %Inflation - CPI .................................................................. 2.70 %Inflation - RPI .................................................................. 3.30 %
Assumptions In Millions of Dollars
Decrease in Pension
Benefit0.25% increase in discount rate ........................................ $ 1.0 0.25% decrease in expected return on plan assets ............ $ 1.8 0.25% increase in inflation ............................................... $ 0.4
Revenue Recognition
We determine the appropriate revenue recognition for our contracts by analyzing the type, terms and conditions of each contract or arrangement with a customer. We have no contracts with customers, under any product line, where we could earn variable consideration. With the exception of our Utility segment and the wireless communication structures product line, our inventory is interchangeable for a variety of the product line’s customers. There is one performance obligation for revenue recognition. Our Irrigation and Coatings segments recognize revenue at a point in time, which is when the service has been performed or when the goods ship; this is the same time that the customer is billed. Lighting, traffic, highway safety, and access system product lines within the ESS segment recognize revenue and bill customers at a point in time, which is typically when the product ships or when it is delivered, as stipulated in the customer contract.
36
The following provides additional information about our contracts with utility and wireless communication structures customers, where the revenue is recognized over time, the judgments we make in accounting for those contracts, and the resulting amounts recognized in our financial statements.
Accounting for utility structures and wireless communication monopole contracts: Steel and concrete utility and wireless communication monopole structures are engineered to customer specifications resulting in limited ability to sell the structure to a different customer if an order is canceled after production commences. The continuous transfer of control to the customer is evidenced either by contractual termination clauses or by our rights to payment for work performed to-date plus a reasonable profit as the products do not have an alternative use to us. Since control is transferring over time, revenue is recognized based on the extent of progress towards completion of the performance obligation. We have certain wireless communication structures customers' contracts where we do not have the right to payment for work performed. In those instances, we recognize revenue at a point in time which is time of shipment of the structure.
The selection of the method to measure progress towards completion requires judgment. For our steel and concrete utility and wireless communication structure product lines, we recognize revenue on an inputs basis, using total production hours incurred to-date for each order as a percentage of total hours estimated to produce the order. The completion percentage is applied to the order’s total revenue and total estimated costs to determine reported revenue, cost of goods sold and gross profit. Our enterprise resource planning (ERP) system captures the total costs incurred to-date and the total production hours, both incurred to-date and forecast to complete. Revenue from the Offshore and other complex steel structures business is also recognized using an inputs method, based on the cost-to-cost measure of progress. Under the cost-to-cost measure of progress, the extent of progress towards completion is measured based on the ratio of costs incurred to date to the total estimated costs at completion of the performance obligation.
Management must make assumptions and estimates regarding manufacturing labor hours and wages, the usage and cost of materials, and manufacturing burden / overhead recovery rates for each production facility. For our steel, concrete and wireless communication structures, production of an order, once started, is typically completed within three months. Projected profitability on open production orders is reviewed and updated monthly. We elected the practical expedient to not disclose the partially satisfied performance obligation at the end of the period when the contract has an original expected duration of one year or less.
We also have a few steel structure customer orders in a fiscal year that require one or two years to complete, due to the quantity of structures. Burden rates and routed production hours, per structure, will be adjusted if and when actual costs incurred are significantly higher than what had been originally projected. This resets the timing of revenue recognition for future periods so it is better aligned with the new production schedule. For our Offshore and other complex steel structures business, we update the estimates of total costs to complete each order quarterly. Based on these updates, revenue in the current period may reflect adjustments for amounts that had been previously recognized. During fiscal 2021, 2020, and 2019, there were no changes to inputs/estimates which resulted in adjustments to revenue for production that occurred prior to the beginning of the year. A provision for loss on the performance obligation is recognized if and when an order is projected to be at a loss, whether or not production has started.
ITEM 7A. QUANTITATIVE AND QUALITATIVE DISCLOSURES ABOUT MARKET RISK.
The information required is included under the captioned paragraph, “MARKET RISK” on page 33 of this report.
37

ITEM 8. FINANCIAL STATEMENTS AND SUPPLEMENTARY DATA.
The following consolidated financial statements of the Company and its subsidiaries are included herein as listed below:
Page
Consolidated Financial StatementsReport of Independent Registered Public Accounting Firm (PCAOB ID No. 34) ..................................................... 39Consolidated Statements of Earnings—Three-Year Period Ended December 25, 2021 ............................................ 41Consolidated Statements of Comprehensive Income—Three-Year Period Ended December 25, 2021 .................... 42Consolidated Balance Sheets—December 25, 2021 and December 26, 2020 ............................................................ 43Consolidated Statements of Cash Flows—Three-Year Period Ended December 25, 2021 ........................................ 44
Consolidated Statements of Shareholders’ Equity—Three-Year Period Ended December 25, 2021 ......................... 45Notes to Consolidated Financial Statements—Three-Year Period Ended December 25, 2021 ................................. 46
38

REPORT OF INDEPENDENT REGISTERED PUBLIC ACCOUNTING FIRM
To the Shareholders and the Board of Directors of Valmont Industries, Inc.
Opinion on the Financial Statements
We have audited the accompanying consolidated balance sheets of Valmont Industries, Inc. and subsidiaries (the "Company") as of December 25, 2021 and December 26, 2020, the related consolidated statements of earnings, comprehensive income, cash flows, and shareholders' equity, for each of the three years in the period ended December 25, 2021, and the related notes and the schedule listed in the Index at Item 15 (collectively referred to as the "financial statements"). In our opinion, the financial statements present fairly, in all material respects, the financial position of the Company as of December 25, 2021 and December 26, 2020, and the results of its operations and its cash flows for each of the three years in the period ended December 25, 2021, in conformity with the accounting principles generally accepted in the United States of America.
We have also audited, in accordance with the standards of the Public Company Accounting Oversight Board (United States) (PCAOB), the Company's internal control over financial reporting as of December 25, 2021, based on criteria established in Internal Control — Integrated Framework (2013) issued by the Committee of Sponsoring Organizations of the Treadway Commission and our report dated February 23, 2022, expressed an unqualified opinion on the Company's internal control over financial reporting.
Basis for Opinion
These financial statements are the responsibility of the Company's management. Our responsibility is to express an opinion on the Company's financial statements based on our audits. We are a public accounting firm registered with the PCAOB and are required to be independent with respect to the Company in accordance with the U.S. federal securities laws and the applicable rules and regulations of the Securities and Exchange Commission and the PCAOB.
We conducted our audits in accordance with the standards of the PCAOB. Those standards require that we plan and perform the audit to obtain reasonable assurance about whether the financial statements are free of material misstatement, whether due to error or fraud. Our audits included performing procedures to assess the risks of material misstatement of the financial statements, whether due to error or fraud, and performing procedures that respond to those risks. Such procedures included examining, on a test basis, evidence regarding the amounts and disclosures in the financial statements. Our audits also included evaluating the accounting principles used and significant estimates made by management, as well as evaluating the overall presentation of the financial statements. We believe that our audits provide a reasonable basis for our opinion.
Critical Audit Matter
The critical audit matter communicated below is a matter arising from the current-period audit of the financial statements that was communicated or required to be communicated to the audit committee and that (1) relates to accounts or disclosures that are material to the financial statements and (2) involved our especially challenging, subjective, or complex judgments. The communication of critical audit matters does not alter in any way our opinion on the financial statements, taken as a whole, and we are not, by communicating the critical audit matter below, providing a separate opinion on the critical audit matter or on the accounts or disclosures to which it relates.
Goodwill — Refer to Notes 1 and 7 to the consolidated financial statements
Critical Audit Matter Description
The Company has goodwill, which is allocated among thirteen reporting units. The Company evaluates its thirteen reporting units for goodwill impairment during the third fiscal quarter of each year, or when events or changes in circumstances indicate the carrying value may not be recoverable. Twelve reporting units are evaluated using after-tax cash flows from operations (less capital expenses) discounted to present value (“discounted cash flows”). The solar tracking structure reporting unit was valued using a blend of both the discounted cash flows and a market approach. The market valuation approach estimates the value for this reporting unit using a multiple of earnings before interest, taxes, depreciation and amortization (EBITDA). The EBITDA multiples are analyzed against other industrial companies with similar product lines. These valuation methods require management to make significant estimates and assumptions related to projected cash flows, selection of industrial companies with similar product lines and forecasted EBITDA, and discount rates. The estimated fair value of all reporting units exceeded their respective carrying value as of the measurement date and, therefore, no impairment was recognized.
39

We identified goodwill for certain reporting units as a critical audit matter because of the significant estimates and assumptions made by management to estimate fair value and the difference between the fair values and the carrying values of certain reporting units as of August 28, 2021. This required a high degree of auditor judgment and an increased extent of effort, including the need to involve our fair value specialists, when performing audit procedures to evaluate the reasonableness of management’s estimates and assumptions related to certain assumptions within the projected cash flows, selection of industrial companies within similar product lines and forecasted EBITDA, and discount rates.
How the Critical Audit Matter Was Addressed in the Audit
Our audit procedures related to the goodwill impairment assessment for certain reporting units included the following, among others:
• We tested the effectiveness of internal controls over management’s goodwill impairment evaluation, including those over the projected cash flows, selection of industrial companies with similar product lines and forecasted EBITDA, and discount rates.
• We evaluated management’s ability to accurately forecast cash flows by comparing actual results to management’s historical forecasts.
• We evaluated the reasonableness of management’s projected cash flows by comparing to (1) historical results, (2) internal communications to management and the Board of Directors, (3) industry reports and (4) information included in Company press releases to analysts and investors.
• With the assistance of our fair value specialists, we evaluated the discount rates, including testing the underlying source information and the mathematical accuracy of the calculations, and developing a range of independent estimates and comparing those to the discount rates selected by management.
• With the assistance of our fair value specialists, we evaluated the industrial companies with similar product lines and forecasted EBITDA, including testing the underlying source information and mathematical accuracy of the calculations.
/s/ DELOITTE & TOUCHE LLPOmaha, NebraskaFebruary 23, 2022
We have served as the Company's auditor since 1996.
40

Valmont Industries, Inc. and Subsidiaries
CONSOLIDATED STATEMENTS OF EARNINGS
Three-year period ended December 25, 2021
(Dollars in thousands, except per share amounts)2021 2020 2019
Product sales ......................................................................... $ 3,159,605 $ 2,594,855 $ 2,434,190 Services sales ........................................................................ 341,970 300,500 332,786
Net sales ........................................................................... 3,501,575 2,895,355 2,766,976 Product cost of sales ............................................................. 2,395,630 1,936,024 1,863,780 Services cost of sales ............................................................ 222,056 193,817 220,515
Total cost of sales ............................................................. 2,617,686 2,129,841 2,084,295 Gross profit ...................................................................... 883,889 765,514 682,681
Selling, general and administrative expenses ....................... 590,608 522,923 454,776 Impairment of goodwill and intangible assets ....................... 6,496 16,638 —
Operating income ............................................................. 286,785 225,953 227,905 Other income (expenses):
Interest expense ................................................................ (42,612) (41,075) (40,153) Interest income ................................................................. 1,192 2,374 3,942 Gain on investments - unrealized ..................................... 1,920 2,443 5,960 Other ................................................................................ 12,798 3,073 2,204
(26,702) (33,185) (28,047) Earnings before income taxes and equity in earnings of
nonconsolidated subsidiaries ............................................. 260,083 192,768 199,858 Income tax expense (benefit):
Current ............................................................................. 61,343 51,012 46,267 Deferred ........................................................................... 71 (1,397) 1,486
61,414 49,615 47,753 Earnings before equity in earnings of nonconsolidated
subsidiaries ........................................................................ 198,669 143,153 152,105 Equity in loss of nonconsolidated subsidiaries ..................... (944) (1,004) —
Net earnings ..................................................................... 197,725 142,149 152,105 Less: Earnings attributable to noncontrolling interests ........ (2,095) (1,456) (5,697)
Net earnings attributable to Valmont Industries, Inc. ...... $ 195,630 $ 140,693 $ 146,408 Earnings per share:
Basic ................................................................................. $ 9.23 $ 6.60 $ 6.76 Diluted .............................................................................. $ 9.10 $ 6.57 $ 6.73
See accompanying notes to consolidated financial statements.
41

Valmont Industries, Inc. and Subsidiaries
CONSOLIDATED STATEMENTS OF COMPREHENSIVE INCOME
Three-year period ended December 25, 2021
(Dollars in thousands)2021 2020 2019
Net earnings .................................................................................................... $ 197,725 $ 142,149 $ 152,105 Other comprehensive income (loss), net of tax:
Foreign currency translation adjustments:Unrealized translation gains (losses) ................................................. (31,405) 21,483 (2,506)
$ (31,405) $ 21,483 $ (2,506) Gain/(loss) on hedging activities:Commodity hedges 20,019 — (2,130) Realized (gain) loss on commodity hedges recorded in earnings (25,821) — 2,130 Unrealized gain (loss) on cross currency swaps 6,093 (5,751) 1,815 Cash flow hedges — 1,598 — Realized (gain) loss on cash flow hedges recorded in earnings — (1,598) — Amortization cost included in interest expense (64) (64) (64) Unrealized gain on net investment hedges, net of tax expense (benefit) of $— in 2021, $2,428 in 2020, $384 in 2019 ........................................ — 7,289 1,154
227 1,474 2,905 Actuarial gain (loss) on defined benefit pension plan, net of tax expense
(benefit) of $25,736 in 2021, $(4,183) in 2020, $(2,710) in 2019 ............ 76,718 (17,349) (10,828) Other comprehensive income (loss) ............................................................. 45,540 5,608 (10,429)
Comprehensive income ................................................................................... 243,265 147,757 141,676 Comprehensive (income) loss attributable to noncontrolling interests ........ (976) (3,428) (5,505)
Comprehensive income attributable to Valmont Industries, Inc. .................... $ 242,289 $ 144,329 $ 136,171
See accompanying notes to consolidated financial statements.
42

Valmont Industries, Inc. and SubsidiariesCONSOLIDATED BALANCE SHEETS
December 25, 2021 and December 26, 2020 (Dollars in thousands, except shares and per share amounts)
2021 2020ASSETS
Current assets:Cash and cash equivalents .................................................................................................... $ 177,232 $ 400,726 Receivables, less allowance of $18,050 in 2021 and $15,952 in 2020 ................................. 571,593 511,714 Inventories ............................................................................................................................ 728,834 448,941 Contract asset - costs and profits in excess of billings ......................................................... 142,643 123,495 Prepaid expenses and other assets ........................................................................................ 83,646 59,804 Refundable income taxes ...................................................................................................... 8,815 9,945
Total current assets ............................................................................................................ 1,712,763 1,554,625 Property, plant and equipment, at cost ...................................................................................... 1,422,101 1,341,380
Less accumulated depreciation and amortization ................................................................. 823,496 743,653 Net property, plant and equipment .................................................................................... 598,605 597,727
Goodwill .................................................................................................................................... 708,566 430,322 Other intangible assets, net ........................................................................................................ 175,364 167,193 Other assets ............................................................................................................................... 251,951 203,293
Total assets ........................................................................................................................ $ 3,447,249 $ 2,953,160
LIABILITIES AND SHAREHOLDERS’ EQUITYCurrent liabilities:
Current installments of long-term debt ................................................................................. $ 4,884 $ 2,748 Notes payable to banks ......................................................................................................... 13,439 35,147 Accounts payable .................................................................................................................. 347,841 268,099 Accrued employee compensation and benefits ..................................................................... 144,559 137,939 Contract liabilities ................................................................................................................ 135,746 130,018 Other accrued expenses ........................................................................................................ 108,771 89,796 Dividends payable ................................................................................................................ 10,616 9,556
Total current liabilities ...................................................................................................... 765,856 673,303 Deferred income taxes ............................................................................................................... 47,849 41,689 Long-term debt, excluding current installments ....................................................................... 947,072 728,431 Defined benefit pension liability ............................................................................................... 536 118,523 Operating lease liabilities .......................................................................................................... 147,759 80,202 Deferred compensation ............................................................................................................. 35,373 44,519 Other noncurrent liabilities ........................................................................................................ 89,207 58,657 Shareholders’ equity:
Authorized 75,000,000 shares; 27,900,000 issued ............................................................ 27,900 27,900 Additional paid-in capital ..................................................................................................... 1,479 335 Retained earnings .................................................................................................................. 2,394,307 2,245,035 Accumulated other comprehensive loss ............................................................................... (263,127) (309,786) Cost of treasury stock, common shares of 6,619,860 in 2021 and 6,674,866 in 2020 ......... (773,712) (781,422)
Total Valmont Industries, Inc. shareholders’ equity ......................................................... 1,386,847 1,182,062 Noncontrolling interest in consolidated subsidiaries ................................................................ 26,750 25,774
Total shareholders’ equity ................................................................................................. 1,413,597 1,207,836 Total liabilities and shareholders’ equity .......................................................................... $ 3,447,249 $ 2,953,160
See accompanying notes to consolidated financial statements.
43

Valmont Industries, Inc. and Subsidiaries
CONSOLIDATED STATEMENTS OF CASH FLOWS
Three-year period ended December 25, 2021 (Dollars in thousands)2021 2020 2019
Cash flows from operating activities:Net earnings ......................................................................................................... $ 197,725 $ 142,149 $ 152,105 Adjustments to reconcile net earnings to net cash flows from operations:
Depreciation and amortization ......................................................................... 92,577 82,892 82,264 Noncash loss on trading securities .................................................................. — 39 (172) Contribution to defined benefit pension plan ................................................... (1,924) (35,399) (18,461) Impairment of long-lived assets ....................................................................... 27,911 20,389 — Stock-based compensation ............................................................................... 28,720 14,874 11,587 Defined benefit pension plan benefit ................................................................ (14,567) (7,311) (513)
(Gain) loss on sale of property, plant and equipment ........................................ (961) 60 (2,513) Equity in earnings in nonconsolidated subsidiaries ......................................... 944 1,004 — Deferred income taxes ...................................................................................... 71 (1,397) 1,486 Changes in assets and liabilities (net of acquisitions):
Receivables .................................................................................................. (69,275) (24,403) 5,408 Inventories ................................................................................................... (289,942) (21,888) 22,128 Prepaid expenses and other assets (current and non-current) ...................... (36,066) (10,633) 4,413 Contract asset ............................................................................................... (21,579) 19,835 (29,274) Accounts payable ......................................................................................... 89,418 33,044 (21,410) Accrued expenses ........................................................................................ 30,556 52,548 (4,255) Contract liabilities ........................................................................................ 6,589 12,072 113,039 Other noncurrent liabilities .......................................................................... 20,181 46,712 (1,274) Income taxes payable (refundable) .............................................................. 5,560 (8,293) (6,944)
Net cash flows from operating activities .................................................. 65,938 316,294 307,614 Cash flows from investing activities:
Purchase of property, plant and equipment .......................................................... (107,790) (106,700) (97,425) Proceeds from sale of assets ................................................................................ 1,745 10,860 5,556 Acquisitions, net of cash acquired ....................................................................... (312,500) (15,862) (81,841) Settlement of net investment hedge ..................................................................... — 11,983 11,184 Investments in nonconsolidated subsidiaries ....................................................... — (1,283) (6,169) Other, net .............................................................................................................. 1,237 (3,027) 545
Net cash flows used in investing activities ............................................... (417,308) (104,029) (168,150) Cash flows from financing activities:
Proceeds from short-term agreements ................................................................. 5,821 20,990 13,195 Principal payments on short-term agreements ..................................................... (26,062) (7,946) (1,868) Proceeds from long-term borrowings .................................................................. 312,485 88,872 31,000 Principal payments on long-term borrowings ...................................................... (91,313) (121,665) (10,768) Debt issuance costs .............................................................................................. (2,267) — — Dividends paid ..................................................................................................... (41,412) (36,930) (32,642) Dividends to noncontrolling interest .................................................................... — (5,642) (7,737) Purchase of noncontrolling interest .................................................................... — (59,416) (27,845) Proceeds from exercises under stock plans .......................................................... 23,895 18,961 13,619 Purchase of treasury shares .................................................................................. (26,100) (56,491) (62,915) Purchase of common treasury shares—stock plan exercises ............................... (21,547) (14,489) (12,989)
Net cash flows provided by (used) in financing activities ....................... 133,500 (173,756) (98,950) Effect of exchange rate changes on cash and cash equivalents ................................ (5,624) 8,675 (182) Net change in cash and cash equivalents .................................................................. (223,494) 47,184 40,332 Cash, cash equivalents, and restricted cash—beginning of year .............................. 400,726 353,542 313,210 Cash, cash equivalents, and restricted cash—end of year ........................................ $ 177,232 $ 400,726 $ 353,542
See accompanying notes to consolidated financial statements.
44

Valmont Industries, Inc. and SubsidiariesCONSOLIDATED STATEMENTS OF SHAREHOLDERS’ EQUITY
Three-year period ended December 25, 2021 (Dollars in thousands, except shares and per share amounts)
Common stock
Additional paid-in capital
Retained earnings
Accumulated other
comprehensive income (loss)
Treasury stock
Noncontrolling interest in
consolidated subsidiaries
Total shareholders’
equityBalance at December 29, 2018 .......................... $ 27,900 $ — $ 2,067,811 $ (303,185) $ (692,549) $ 75,761 $ 1,175,738
Net earnings ......................................................... 0 0 146,408 — — 5,697 152,105
Other comprehensive income (loss) ..................... — — — (10,237) — (192) (10,429) Cash dividends declared ($1.50 per share)...... — — (32,503) — — (32,503) Dividends to noncontrolling interests ............. — — — — — (7,737) (7,737) Purchase of noncontrolling interest ................. — 277 — — — (28,122) (27,845) Cumulative impact of ASC 606 adoption ....... — — — — — — — Impact of ASU 2016-16 adoption ................... — — (8,886) — — — (8,886) Purchase of treasury shares; 491,045 shares acquired ........................................................... — — — — (62,915) — (62,915) Stock plan exercises, 90,868 shares acquired . — — — — (12,989) — (12,989) Stock options exercised; 119,789 shares issued ...............................................................
— (3,756) 972 — 16,403 — 13,619 Stock option expense ....................................... — 2,772 — — — 2,772 Stock awards; 60,021 shares issued ................ — 707 — — 8,108 — 8,815
Balance at December 28, 2019 .......................... 27,900 0 2,173,802 (313,422) (743,942) 45,407 1,189,745
Net earnings ......................................................... — — 140,693 — — 1,456 142,149
Other comprehensive income (loss) ..................... — — — 3,636 — 1,972 5,608 Cash dividends declared ($1.80 per share)...... — — (38,393) — — — (38,393)
Dividends to noncontrolling interests ............. — — — — — (5,642) (5,642) Purchase of noncontrolling interest ................. — — (31,067) — — (22,544) (53,611) Addition of noncontrolling interest ................. — — — — — 5,125 5,125 Purchase of treasury shares; 441,119 shares acquired ........................................................... — — — — (56,491) — (56,491) Stock plan exercises; 88,411 shares acquired . — — — — (14,489) — (14,489) Stock options exercised; 147,014 shares issued ............................................................... — (6,335) — — 25,296 — 18,961 Stock option expense ....................................... — 2,628 — — — — 2,628 Stock awards; 65,248 shares issued ................ — 4,042 — — 8,204 — 12,246
Balance at December 26, 2020 ......................... 27,900 335 2,245,035 (309,786) (781,422) 25,774 1,207,836 Net earnings ..................................................... — — 195,630 — — 2,095 197,725
Other comprehensive income ............................... — — — 46,659 — (1,119) 45,540
Cash dividends declared ($2.00 per share)...... — — (42,472) — — — (42,472) Purchase of treasury shares; 111,833 shares acquired ........................................................... — — — — (26,100) — (26,100) Stock plan exercises; 90,292 shares issued ..... — — — — (21,547) — (21,547) Stock options exercised; 169,908 shares issued ............................................................... — (15,357) (3,886) — 43,138 — 23,895 Stock option expense ....................................... — 2,538 — — — — 2,538 Stock awards; 88,395 shares issued ............... — 13,963 — — 12,219 — 26,182 Balance at December 25, 2021 ...................... $ 27,900 $ 1,479 $ 2,394,307 $ (263,127) $ (773,712) $ 26,750 $ 1,413,597
See accompanying notes to consolidated financial statements.
45

(1) SUMMARY OF SIGNIFICANT ACCOUNTING POLICIES
Principles of Consolidation
The consolidated financial statements include the accounts of Valmont Industries, Inc. and its wholly and majority‑owned subsidiaries (the Company). Investments in 20% to 50% owned affiliates and joint ventures are accounted for by the equity method. Investments in less than 20% owned affiliates are accounted for by the cost method. All intercompany items have been eliminated.
Cash overdrafts
Cash book overdrafts totaling $19,670 and $16,979 were classified as accounts payable at December 25, 2021 and December 26, 2020, respectively. The Company’s policy is to report the change in book overdrafts as an operating activity in the Consolidated Statements of Cash Flows.
Segments
The Company has four reportable segments based on its management structure. Each segment is global in nature with a manager responsible for segment operational performance and allocation of capital within the segment. Reportable segments are as follows:
ENGINEERED SUPPORT STRUCTURES: This segment consists of the manufacture and distribution of engineered metal and composite poles, towers, and components for lighting, traffic, and wireless communication markets, engineered access systems, integrated structure solutions for smart cities, and highway safety products;
UTILITY SUPPORT STRUCTURES: This segment consists of the manufacture of engineered steel and concrete structures for utility transmission, distribution, substations, and renewable energy generation equipment;
COATINGS: This segment consists of galvanizing, painting, and anodizing services to preserve and protect metal products; and
IRRIGATION: This segment consists of the manufacture of agricultural irrigation equipment, parts, services, tubular products, water management solutions, and technology for precision agriculture.
Fiscal Year
The Company operates on a 52 or 53 week fiscal year with each year ending on the last Saturday in December. Accordingly, the Company’s fiscal years ended December 25, 2021, December 26, 2020 and December 28, 2019 consisted of 52 weeks.
Accounts Receivable
Accounts receivable are reported on the balance sheet net of any allowance for doubtful accounts. Allowances are maintained in amounts considered to be appropriate in relation to the outstanding receivables based on age of the receivable, economic conditions and customer credit quality. As the Company’s international business has grown, the exposure to potential losses in international markets has also increased. These exposures can be difficult to estimate, particularly in areas of political instability, or with governments with which the Company has limited experience, or where there is a lack of transparency as to the current credit condition of governmental units.
VALMONT INDUSTRIES, INC. AND SUBSIDIARIESNOTES TO CONSOLIDATED FINANCIAL STATEMENTS (Continued)
Three-year period ended December 25, 2021 (Dollars in thousands, except per share amounts)
46

The following table details the balances of our allowance for doubtful receivables and changes therein:
For periods ended:
Balance at Beginning of
Period
Charged to Profit and
Loss
Currency Translation Adjustment
Deductions from
Reserves
Balance at Close of Period
December 25, 2021 ......................... $ 15,952 $ 3,379 $ (339) $ (942) $ 18,050 December 26, 2020 ......................... 9,548 7,957 260 (1,813) 15,952 December 28, 2019 ......................... 8,277 2,543 (76) (1,196) 9,548
The Company sells trade accounts receivable at a discount under uncommitted trade accounts receivable sale programs to third party financial institutions without recourse. As these accounts receivable are sold without recourse, the Company does not retain the associated risks following the transfer of such accounts receivable to the financial institutions.
Transfers of accounts receivable are accounted for as sales and, accordingly, accounts receivables sold are excluded from Accounts receivable – net on the Consolidated Balance Sheet and cash proceeds are reflected in Cash flows from operating activities on the Consolidated Statement of Cash Flows. The difference between the carrying amount of the trade accounts receivables sold and the cash received, or discount, is recorded in Other expenses on the Consolidated Statement of Operations.
For the period ended December 31, 2021, the Company sold trade accounts receivable of $25.4 million. The Company did not sell trade accounts receivable in 2020. The fees associated with trade accounts receivables sold are immaterial.
Inventories
Inventory is valued at the lower of cost, determined on the first-in, first-out (FIFO) method or market. Finished goods and manufactured goods inventories include the costs of acquired raw materials and related factory labor and overhead charges required to convert raw materials to manufactured and finished goods.
Long-Lived Assets
Property, plant and equipment are recorded at historical cost. The Company generally uses the straight-line method in computing depreciation and amortization for financial reporting purposes and accelerated methods for income tax purposes. The annual provisions for depreciation and amortization have been computed principally in accordance with the following ranges of asset lives: buildings and improvements 15 to 40 years, machinery and equipment 3 to 12 years, transportation equipment 3 to 24 years, office furniture and equipment 3 to 7 years and intangible assets 5 to 20 years. Depreciation expense in fiscal 2021, 2020 and 2019 was $70,223, $63,890 and $64,177, respectively.
An impairment loss is recognized if the carrying amount of an asset may not be recoverable and exceeds estimated future undiscounted cash flows of the asset. A recognized impairment loss reduces the carrying amount of the asset to its estimated fair value. The Company recognized a pre-tax $27,900 impairment of long-lived assets (property, plant, and equipment, customer relationship intangible asset, and trade name) in 2021 when it determined that its offshore and other complex steel structures reporting unit will not generate sufficient cash flows to recover the carrying values. An impairment test was required in November 2021 when the Company received clarifying information on the competitive environment of this reporting unit in Europe. Impairment losses were recorded in 2020 as facilities were closed and future plans for certain fixed assets changed in connection with the Company's restructuring plans. Upon adoption of ASC 842, Leases in 2019, the Company impaired the right-of-use (lease) asset for one of its galvanizing facilities in Australia as it will not generate sufficient cash flows to recover the carrying value.
VALMONT INDUSTRIES, INC. AND SUBSIDIARIESNOTES TO CONSOLIDATED FINANCIAL STATEMENTS (Continued)
Three-year period ended December 25, 2021 (Dollars in thousands, except per share amounts)
47

The Company evaluates its reporting units for impairment of goodwill during the third fiscal quarter of each year, or when events or changes in circumstances indicate the carrying value may not be recoverable. Reporting units are evaluated using after-tax operating cash flows (less capital expenditures) discounted to present value ("discounted cash flows"). For the solar tracking reporting unit, the Company valued this reporting unit using a blend of the discounted cash flows and multiple of earnings before interest, taxes, depreciation and amortization (EBITDA) approach. Indefinite‑lived intangible assets are assessed separately from goodwill as part of the annual impairment testing, using a relief-from-royalty method. If the underlying assumptions related to the valuation of a reporting unit’s goodwill or an indefinite‑lived intangible asset change materially before or after the annual impairment testing, the reporting unit or asset is evaluated for potential impairment. In these evaluations, management considers recent operating performance, expected future performance, industry conditions and other indicators of potential impairment. See footnote 7 for details of impairments recognized during 2021 and 2020.
Income Taxes
The Company uses the asset and liability method to calculate deferred income taxes. Deferred tax assets and liabilities are recognized on temporary differences between financial statement and tax bases of assets and liabilities using enacted tax rates. The effect of tax rate changes on deferred tax assets and liabilities is recognized in income during the period that includes the enactment date.
Warranties
The Company's provision for product warranty reflects management's best estimate of probable liability under its product warranties. Estimated future warranty costs are recorded at the time a sale is recognized. Future warranty liability is determined based on applying historical claim rate experience to units sold that are still within the warranty period. In addition, the Company records provisions for known warranty claims.
Pension Benefits
Certain expenses are incurred in connection with a defined benefit pension plan. In order to measure expense and the related benefit obligation, various assumptions are made including discount rates used to value the obligation, expected return on plan assets used to fund these expenses and estimated future inflation rates. These assumptions are based on historical experience as well as current facts and circumstances. An actuarial analysis is used to measure the expense and liability associated with pension benefits.
Derivative Instruments
The Company may enter into derivative financial instruments to manage risk associated with fluctuation in interest rates, foreign currency rates or commodities. Where applicable, the Company may elect to account for such derivatives as either a cash flow, fair value, or net investment hedge.
Comprehensive Income (Loss)
Comprehensive income (loss) includes net income, currency translation adjustments, certain derivative-related activity and changes in net actuarial gains/losses from a pension plan. Results of operations for foreign subsidiaries are translated using the average exchange rates during the period. Assets and liabilities are translated at the exchange rates in
VALMONT INDUSTRIES, INC. AND SUBSIDIARIESNOTES TO CONSOLIDATED FINANCIAL STATEMENTS (Continued)
Three-year period ended December 25, 2021 (Dollars in thousands, except per share amounts)
48
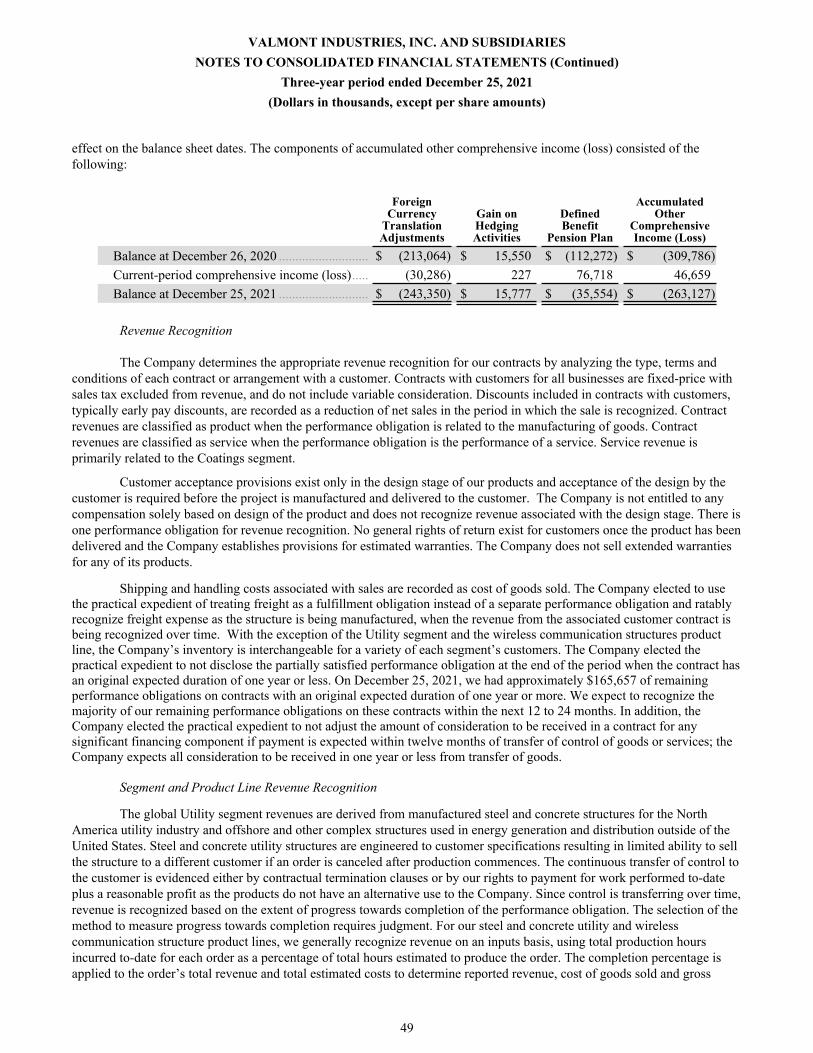
effect on the balance sheet dates. The components of accumulated other comprehensive income (loss) consisted of the following:
Foreign Currency
Translation Adjustments
Gain on Hedging Activities
Defined Benefit
Pension Plan
Accumulated Other
Comprehensive Income (Loss)
Balance at December 26, 2020 ........................... $ (213,064) $ 15,550 $ (112,272) $ (309,786) Current-period comprehensive income (loss) ..... (30,286) 227 76,718 46,659 Balance at December 25, 2021 ........................... $ (243,350) $ 15,777 $ (35,554) $ (263,127)
Revenue Recognition
The Company determines the appropriate revenue recognition for our contracts by analyzing the type, terms and conditions of each contract or arrangement with a customer. Contracts with customers for all businesses are fixed-price with sales tax excluded from revenue, and do not include variable consideration. Discounts included in contracts with customers, typically early pay discounts, are recorded as a reduction of net sales in the period in which the sale is recognized. Contract revenues are classified as product when the performance obligation is related to the manufacturing of goods. Contract revenues are classified as service when the performance obligation is the performance of a service. Service revenue is primarily related to the Coatings segment.
Customer acceptance provisions exist only in the design stage of our products and acceptance of the design by the customer is required before the project is manufactured and delivered to the customer. The Company is not entitled to any compensation solely based on design of the product and does not recognize revenue associated with the design stage. There is one performance obligation for revenue recognition. No general rights of return exist for customers once the product has been delivered and the Company establishes provisions for estimated warranties. The Company does not sell extended warranties for any of its products.
Shipping and handling costs associated with sales are recorded as cost of goods sold. The Company elected to use the practical expedient of treating freight as a fulfillment obligation instead of a separate performance obligation and ratably recognize freight expense as the structure is being manufactured, when the revenue from the associated customer contract is being recognized over time. With the exception of the Utility segment and the wireless communication structures product line, the Company’s inventory is interchangeable for a variety of each segment’s customers. The Company elected the practical expedient to not disclose the partially satisfied performance obligation at the end of the period when the contract has an original expected duration of one year or less. On December 25, 2021, we had approximately $165,657 of remaining performance obligations on contracts with an original expected duration of one year or more. We expect to recognize the majority of our remaining performance obligations on these contracts within the next 12 to 24 months. In addition, the Company elected the practical expedient to not adjust the amount of consideration to be received in a contract for any significant financing component if payment is expected within twelve months of transfer of control of goods or services; the Company expects all consideration to be received in one year or less from transfer of goods.
Segment and Product Line Revenue Recognition
The global Utility segment revenues are derived from manufactured steel and concrete structures for the North America utility industry and offshore and other complex structures used in energy generation and distribution outside of the United States. Steel and concrete utility structures are engineered to customer specifications resulting in limited ability to sell the structure to a different customer if an order is canceled after production commences. The continuous transfer of control to the customer is evidenced either by contractual termination clauses or by our rights to payment for work performed to-date plus a reasonable profit as the products do not have an alternative use to the Company. Since control is transferring over time, revenue is recognized based on the extent of progress towards completion of the performance obligation. The selection of the method to measure progress towards completion requires judgment. For our steel and concrete utility and wireless communication structure product lines, we generally recognize revenue on an inputs basis, using total production hours incurred to-date for each order as a percentage of total hours estimated to produce the order. The completion percentage is applied to the order’s total revenue and total estimated costs to determine reported revenue, cost of goods sold and gross
VALMONT INDUSTRIES, INC. AND SUBSIDIARIESNOTES TO CONSOLIDATED FINANCIAL STATEMENTS (Continued)
Three-year period ended December 25, 2021 (Dollars in thousands, except per share amounts)
49

profit. Production of an order, once started, is typically completed within three months. Revenue from the Offshore and other complex structures business is also recognized using an inputs method, based on the ratio of costs incurred to date to the total estimated costs at completion of the performance obligation. External sales agents are used in certain sales of steel and concrete structures; the Company has chosen to use the practical expedient to expense estimated commissions owed to third parties by recognizing them proportionately as the goods are manufactured.
The global ESS segment revenues are derived from the manufacture and distribution of engineered metal, composite structures and components for lighting and traffic and roadway safety, engineered access systems, and wireless communication. For the lighting and traffic and roadway safety product lines, revenue is recognized upon shipment or delivery of goods to the customer depending on contract terms, which is the same point in time that the customer is billed. For Access Systems, revenue is generally recognized upon delivery of goods to the customer which is the same point in time that the customer is billed. The wireless communication monopole product line has large regional customers who have unique product specifications for these larger communication structures. When the customer contract includes a cancellation clause that would require them to pay for work completed plus a reasonable margin if an order was canceled, revenue is recognized over time based on hours worked as a percent of total estimated hours to complete production. For the remaining wireless communication product line customers which do not provide a contractual right to bill for work completed on a canceled order, revenue is recognized upon shipment or delivery of the goods to the customer which is the same point in time that the customer is billed. For wireless communication towers and components, revenue is recognized upon shipment or delivery of goods to the customer depending on contract terms, which is the same point in time that the customer is billed.
The global Coatings segment revenues are derived by providing coating services to customers’ products, which include galvanizing, anodizing, and powder coating. Revenue is recognized once the coating service has been performed and the goods are ready to be picked up or delivered to the customer which is the same time that the customer is billed.
The global Irrigation segment revenues are derived from the manufacture of agricultural irrigation equipment and related parts and services for the agricultural industry and tubular products for industrial customers. Revenue recognition for the irrigation segment is generally upon shipment of the goods to the customer which is the same point in time that the customer is billed. The remote monitoring subscription services are primarily billed annually and revenue is recognized on a straight-line basis over the subsequent twelve months.
Disaggregation of revenue by product line is disclosed in the Segment footnote. A breakdown by segment of revenue recognized over time and revenue recognized at a point in time for the fiscal years ended December 25, 2021 and December 26, 2020 is as follows:
Fiscal Year 2021 Fiscal Year 2020 Fiscal Year 2019
Point in Time
Over Time
Point in Time
Over Time
Point in Time
Over Time
Utility Support Structures ........... $ 62,904 $ 1,058,100 $ 86,382 $ 915,756 $ 47,450 $ 838,158 Engineered Support Structures .... 1,026,312 38,128 940,513 43,010 952,056 50,020 Coatings ...................................... 299,081 — 269,602 — 300,640 — Irrigation ...................................... 996,278 20,772 624,831 15,261 564,918 13,734
Total ....................................... $ 2,384,575 $ 1,117,000 $ 1,921,328 $ 974,027 $ 1,865,064 $ 901,912
The Company's contract asset as of December 25, 2021 and December 26, 2020 was $142,643 and $123,495, respectively. Both steel and concrete Utility customers in North America are generally invoiced upon shipment or delivery of the goods to the customer's specified location with few customers that make up-front or progress payments. The Offshore and complex steel structures business invoices customers a number of ways including advanced billings, progress billings, and billings upon shipment.
VALMONT INDUSTRIES, INC. AND SUBSIDIARIESNOTES TO CONSOLIDATED FINANCIAL STATEMENTS (Continued)
Three-year period ended December 25, 2021 (Dollars in thousands, except per share amounts)
50
At December 25, 2021 and December 26, 2020, total contract liabilities were $213,203 and $170,919, respectively. At December 25, 2021, $135,746 is recorded as contract liabilities and $77,457 is recorded as other noncurrent liabilities on the condensed consolidated balance sheets. During the fiscal year ended December 25, 2021 and December 26, 2020, the Company recognized $105,406 and $74,319 of revenue that was included in the liability as of December 26, 2020 and December 28, 2019. The revenue recognized was due to applying advance payments received for performance obligations completed during the period. At December 25, 2021, the Company had $165,657 of remaining performance obligations on contracts with an original expected duration of one year or more and expects to complete the remaining performance obligations on these contracts within the next 12 to 24 months.
Use of Estimates
Management of the Company has made a number of estimates and assumptions relating to the reporting of assets and liabilities, the reported amounts of revenue and expenses and the disclosure of contingent assets and liabilities to prepare these financial statements in conformity with generally accepted accounting principles. Actual results could differ from those estimates.
Equity Method Investments
The Company has equity method investments in non-consolidated subsidiaries which are recorded within "Other assets" on the Consolidated Balance Sheets.
Treasury Stock
Repurchased shares are recorded as “Treasury Stock” and result in a reduction of “Shareholders’ Equity.” When treasury shares are reissued, the Company uses the last-in, first-out method, and the difference between the repurchase cost and re-issuance price is charged or credited to “Additional Paid-In Capital.”
In May 2014, the Company announced a capital allocation philosophy which covered a share repurchase program. Specifically, the Board of Directors at that time authorized the purchase of up to $500,000 of the Company's outstanding common stock from time to time over twelve months at prevailing market prices, through open market or privately-negotiated transactions. In February 2015 and again in October 2018, the Board of Directors authorized an additional purchase of up to $250,000 of the Company's outstanding common stock with no stated expiration date. As of December 25, 2021, the Company has acquired 6,475,406 shares for approximately $878,138 under this share repurchase program.
Research and Development
Research and development costs are charged to operations in the year incurred. These costs are a component of “Selling, general and administrative expenses” on the Consolidated Statements of Earnings. Research and development expenses were approximately $37,000 in 2021, $21,400 in 2020, and $13,900 in 2019.
Recently Adopted Accounting Pronouncements
In December 2019, the FASB issued Accounting Standards Update No. 2019-12 (ASU 2019-12), Income Taxes (Topic 740): Simplifying the Accounting for Income Taxes, which simplifies the accounting and disclosure requirements for income taxes by clarifying existing guidance to improve consistency in application of Accounting Standards Codification (ASC) 740. The Company adopted this ASU on the first day of fiscal 2021. The adoption of ASU No. 2019-12 did not have a significant impact on the consolidated financial statements.
Recently Issued Accounting Pronouncements (not yet adopted)
In March 2020, the FASB issued Accounting Standards Update No. 2020-04 (ASU 2020-04), Reference Rate Reform (Topic 848): Facilitation of the Effects of Reference Rate Reform on Financial Reporting, which provides optional expedients and exceptions for applying GAAP principles to contracts, hedging relationships, and other transactions that
VALMONT INDUSTRIES, INC. AND SUBSIDIARIESNOTES TO CONSOLIDATED FINANCIAL STATEMENTS (Continued)
Three-year period ended December 25, 2021 (Dollars in thousands, except per share amounts)
51
reference London Interbank Offered Rate (LIBOR) or another reference rate expected to be discontinued due to reference rate reform. This guidance can be adopted on a prospective basis no later than December 31, 2022, with early adoption permitted. The Company does not expect ASU 2020-04 to have a material impact to our consolidated financial statements and related disclosures.
(2) ACQUISITIONS
Acquisitions of Businesses
On May 12, 2021, the Company acquired the outstanding shares of Prospera Technologies, Ltd. ("Prospera"), an artificial intelligence company focused on machine learning and computer vision in agriculture, for $300,000 in cash (net of cash acquired). The acquisition of Prospera, located in Tel Aviv, Israel, was made to allow the Company to accelerate innovation with machine learning for agronomy and is reported in the Irrigation segment. In the purchase price allocation, goodwill of $273,453, developed technology of $32,900, trade name of $2,850, property, plant, and equipment of $1,063, and a deferred tax liability of $8,223 were recorded with the remainder to net working capital. Goodwill is not deductible for tax purposes, the trade name will be amortized over 7 years, and the developed technology asset will be amortized over 5 years. The amount allocated to goodwill was primarily attributable to anticipated synergies and other intangibles that do not qualify for separate recognition. The Company finalized the purchase price allocation in the fourth quarter of 2021.
On April 20, 2021 the Company acquired the assets of PivoTrac for $12,500 in cash. The agreed upon purchase price was $14,000, with $1,500 being held back for seller representations and warranties that will be settled within 12 months of the acquisition date. The acquisition of PivoTrac, located in Texas, was made to allow the Company to advance its technology strategy and increase its number of connected agricultural devices and is reported in the Irrigation segment. The preliminary fair values assigned were $10,800 for goodwill, $2,627 for customer relationships, and the remainder is net working capital. Goodwill is not deductible for tax purposes and the customer relationship will be amortized over 8 years. The amount allocated to goodwill was primarily attributable to anticipated synergies and other intangibles that do not qualify for separate recognition. The Company expects the purchase price allocation to be finalized in the second quarter of 2022.
On May 29, 2020, the Company acquired 55% of Energia Solar do Brasil ("Solbras") for $4,308. Approximately $646 of the purchase price was contingent on seller representations and warranties and was settled for the full amount in the second quarter of 2021. Solbras is a leading provider of solar energy solutions for agriculture. In the purchase price allocation, goodwill of $3,341 and customer relationships of $3,718 were recorded and the remainder to net working capital. Goodwill is not deductible for tax purposes and the customer relationship will be amortized over 8 years. The acquisition of Solbras, located in Brazil, was made to allow the Company to expand its product offerings in the Irrigation segment to include not only pivots, but also a sustainable and low-cost energy source to provide electricity to the units. The Company finalized the purchase price allocation in the fourth quarter of 2020.
On March 6, 2020, the Company acquired 75% of KC Utility Packaging, LLC for $4,200. Approximately $400 of the purchase price was contingent on seller representations and warranties and was settled for the full amount in the first quarter of 2021. The Company name was subsequently changed to Valmont Substations LLC. The acquisition was made to expand the Company's utility substation product offering. In the purchase price allocation, goodwill of $1,100, customer relationships of $4,000, and other intangibles of $500 were recorded. The Company finalized the purchase price allocation in the fourth quarter of 2020.
On May 13, 2019, the Company acquired the assets of Connect-It Wireless, Inc. ("Connect-It") for $6,034 in cash. Connect-It operates in Florida and is a manufacturer and distributor of wireless site components and safety products. In the purchase price allocation, goodwill of $3,299 and customer relationships of $828 were recorded and the remainder to net working capital. A portion of the goodwill is deductible for tax purposes. The amount allocated to goodwill was primarily attributable to anticipated synergies and other intangibles that do not qualify for separate recognition. Connect-It is included in the ESS segment and was acquired to expand the Company's wireless component distribution network. The purchase price allocation was finalized in the fourth quarter of 2019.
VALMONT INDUSTRIES, INC. AND SUBSIDIARIESNOTES TO CONSOLIDATED FINANCIAL STATEMENTS (Continued)
Three-year period ended December 25, 2021 (Dollars in thousands, except per share amounts)
52

On February 11, 2019, the Company acquired the outstanding shares of United Galvanizing ("United"), a provider of coatings services for $26,000 in cash. The agreed upon purchase price was $28,000, with $2,000 being contingent on seller representations and warranties that was settled in the first quarter of 2020 for $1,522. The acquisition of United, located in Houston, Texas further expanded the Company's galvanizing footprint in North America and is reported in the Coatings segment. The fair values assigned were $12,374 for goodwill, $3,170 for customer relationships, trade name of $894, $10,987 for property, plant, and equipment, and the remainder to net working capital. Goodwill is not deductible for tax purposes and the customer relationship will be amortized over 10 years. The amount allocated to goodwill was primarily attributable to anticipated synergies and other intangibles that do not qualify for separate recognition. The trade name has an indefinite life. The Company finalized the purchase price allocation in the fourth quarter of 2019.
Acquisition-related costs incurred for the above acquisitions were insignificant for all years presented.
Proforma disclosures were omitted for the 2021 and 2020 acquisitions as the 2021 acquisitions of Prospera and PivoTrac and the 2020 acquisitions of Solbras and Valmont Substation do not have a significant impact on the Company's financial results. The proforma effect of 2019 acquisitions on the 2019 Consolidated Statements of Earnings is as follows:
Fifty-two Weeks Ended December 28,
2019Net sales .......................................................... $ 2,772,150 Net earnings ..................................................... 146,941 Earnings per share-diluted ............................... 6.75
Acquisitions of Noncontrolling Interests
In February 2020, the Company acquired the remaining 49% of AgSense that it did not own for $43,983, which includes a holdback payment of $2,200 that was made in the second quarter of 2020. The accounting for owning 100% of AgSense resulted in the recognition of a deferred tax asset of approximately $7,700.
In December 2020, the Company acquired the remaining 40% of Torrent Engineering and Equipment that it did not own for $3,500. In the first quarter of 2020, the Company acquired 16% of the remaining 25% that it did not own of Convert Italia for a cash payment of $11,750. The purchase agreement also settled the escrow funds which the Company had paid at date of acquisition.
VALMONT INDUSTRIES, INC. AND SUBSIDIARIESNOTES TO CONSOLIDATED FINANCIAL STATEMENTS (Continued)
Three-year period ended December 25, 2021 (Dollars in thousands, except per share amounts)
53

(3) RESTRUCTURING ACTIVITIES
During 2020, the Company executed certain regional restructuring activities (the "2020 Plan") primarily in the ESS and Utility segments and a U.S. specific early retirement program covering all segments. The 2020 Plan included the closure of one U.S. Coatings facility. All 2020 restructuring activities were completed by December 26, 2020. The Company recorded the following pre-tax expenses:
ESS Utility Coatings IrrigationOther/
Corporate TOTAL
Severance $ 474 $ 241 $ 424 $ — $ — $ 1,139 Other cash restructuring expenses 181 1,070 596 — — 1,847 Impairments of fixed assets/net loss on disposals 345 2,866 540 — — 3,751
Total cost of sales 1,000 4,177 1,560 — — 6,737
Severance 4,441 2,393 2,231 2,968 1,761 13,794 Other cash restructuring expenses 1,700 71 160 — 244 2,175 Impairments of assets/net loss on disposals 443 — — — — 443 Total selling, general and administrative expenses 6,584 2,464 2,391 2,968 2,005 16,412
Consolidated total $ 7,584 $ 6,641 $ 3,951 $ 2,968 $ 2,005 $ 23,149
Change in the current liabilities recorded for the restructuring plans were as follows:
Balance at December 26,
2020
Recognized Restructuring
Expense
Costs Paid or Otherwise
Settled
Balance at December 25,
2021
Severance $ 12,660 $ (12,660) $ —
VALMONT INDUSTRIES, INC. AND SUBSIDIARIESNOTES TO CONSOLIDATED FINANCIAL STATEMENTS (Continued)
Three-year period ended December 25, 2021 (Dollars in thousands, except per share amounts)
54

(4) CASH FLOW SUPPLEMENTARY INFORMATION
The Company considers all highly liquid temporary cash investments purchased with an original maturity of three months or less at the time of purchase to be cash equivalents. Cash payments for interest and income taxes (net of refunds) for the fifty-two weeks ended December 25, 2021 and December 26, 2020, and December 28, 2019 were as follows:
2021 2020 2019Interest .................................................................. $ 41,159 $ 40,209 $ 39,032 Income taxes ......................................................... 60,366 54,801 43,629
The acquisitions in 2020 and 2019 included hold back payments contingent on seller representations and warranties of $1,046 and $5,456, respectively. The 2020 hold back payments were released from a trust in the first half of 2021 and the 2019 hold back payments were paid in the first quarter of 2020 and are shown as an investing use of cash in the acquisitions line item of the consolidated statements of cash flows.
(5) INVENTORIES
Inventories consisted of the following at December 25, 2021 and December 26, 2020:
2021 2020Raw materials and purchased parts ........................................ $ 278,107 $ 155,512 Work-in-process ..................................................................... 63,628 33,632 Finished goods and manufactured goods ............................... 387,099 259,797
$ 728,834 $ 448,941
(6) PROPERTY, PLANT AND EQUIPMENT
Property, plant and equipment, at cost, consist of the following:
2021 2020Land and improvements ...................................................................... $ 112,236 $ 114,831 Buildings and improvements ............................................................... 413,884 373,271 Machinery and equipment ................................................................... 672,319 616,765 Transportation equipment .................................................................... 27,020 28,610 Office furniture and equipment ........................................................... 117,757 101,487 Construction in progress ...................................................................... 78,885 106,416
$ 1,422,101 $ 1,341,380
VALMONT INDUSTRIES, INC. AND SUBSIDIARIESNOTES TO CONSOLIDATED FINANCIAL STATEMENTS (Continued)
Three-year period ended December 25, 2021 (Dollars in thousands, except per share amounts)
55

(7) GOODWILL AND INTANGIBLE ASSETS
Amortized Intangible Assets
The components of amortized intangible assets at December 25, 2021 and December 26, 2020 were as follows:
December 25, 2021Gross
Carrying Amount
Accumulated Amortization
Weighted Average
LifeCustomer Relationships ...................................................... $ 224,597 $ 160,626 13 yearsPatents & Proprietary Technology ..................................... 58,699 13,955 9 yearsTrade Name ........................................................................ 2,850 183 7 yearsOther ................................................................................... 4,534 3,959 6 years
$ 290,680 $ 178,723
December 26, 2020Gross
Carrying Amount
Accumulated Amortization
Weighted Average
LifeCustomer Relationships ........................................................ $ 237,232 $ 155,760 13 yearsPatents & Proprietary Technology ........................................ 26,208 8,301 14 yearsOther ..................................................................................... 7,602 6,786 4 years
$ 271,042 $ 170,847
Amortization expense for intangible assets was $21,320, $18,147 and $18,087 for the fiscal years ended December 25, 2021, December 26, 2020 and December 28, 2019, respectively. During the fourth quarter of fiscal 2021, an impairment test was required when the Company received clarifying information on the competitive environment of the Valmont SM business in Europe. As a result, an impairment charge of approximately $4,483 was recognized against the remaining net book value of the Valmont SM customer relationship.
Estimated annual amortization expense related to finite‑lived intangible assets is as follows:
Estimated Amortization
Expense2022 .......................................................................................... $ 19,466 2023 .......................................................................................... 17,692 2024 .......................................................................................... 15,768 2025 .......................................................................................... 14,301 2026 .......................................................................................... 10,123
The useful lives assigned to finite‑lived intangible assets included consideration of factors such as the Company’s past and expected experience related to customer retention rates, the remaining legal or contractual life of the underlying arrangement that resulted in the recognition of the intangible asset and the Company’s expected use of the intangible asset.
VALMONT INDUSTRIES, INC. AND SUBSIDIARIESNOTES TO CONSOLIDATED FINANCIAL STATEMENTS (Continued)
Three-year period ended December 25, 2021 (Dollars in thousands, except per share amounts)
56

Non-amortized intangible assets
Intangible assets with indefinite lives are not amortized. The carrying values of these trade names at December 25, 2021 and December 26, 2020 were as follows:
December 25,2021
December 26,2020
Year Acquired
Newmark ........................................................................................................... $ 11,111 $ 11,111 2004Webforge ........................................................................................................... 7,877 7,972 2010Valmont SM ...................................................................................................... 6,082 8,720 2014Ingal EPS/Ingal Civil Products ......................................................................... 7,637 7,730 2010Shakespeare ....................................................................................................... 4,000 4,000 2014Walpar ............................................................................................................... 3,500 3,500 2018Convert .............................................................................................................. 8,479 9,137 2018Other .................................................................................................................. 14,721 14,828
$ 63,407 $ 66,998
In its determination of these intangible assets as indefinite‑lived, the Company considered such factors as its expected future use of the intangible asset, legal, regulatory, technological and competitive factors that may impact the useful life or value of the intangible asset and the expected costs to maintain the value of the intangible asset. The Company expects that these intangible assets will maintain their value indefinitely. Accordingly, these assets are not amortized.
The Company’s trade names were tested for impairment as of August 28, 2021. The values of each trade name were determined using the relief-from-royalty method. Based on this evaluation, no trade names were determined to be impaired. During the fourth quarter of fiscal 2021, an impairment test was required when the Company received clarifying information on the competitive environment of the Valmont SM business in Europe. As a result, an impairment charge of approximately $2,013 was recognized against the Valmont SM trade name. In conjunction with an interim second quarter 2020 goodwill impairment test, impairment indicators were noted for the Webforge and Locker trade names requiring an interim impairment test. As a result, an impairment charge of approximately $3,900 was recognized against these two trade names in fiscal 2020.
Goodwill
The carrying amount of goodwill by segment as of December 25, 2021 and December 26, 2020 was as follows:Engineered
Support Structures Segment
Utility Support
Structures Segment
Coatings Segment
Irrigation Segment Total
Gross balance at December 26, 2020 $ 232,323 $ 135,335 $ 94,309 $ 30,177 $ 492,144 Accumulated impairment losses ....... (31,245) (14,355) (16,222) — (61,822) Balance at December 26, 2020 .......... 201,078 120,980 78,087 30,177 $ 430,322 Acquisitions ...................................... — — — 284,253 284,253 Foreign currency translation ............. (1,632) (3,256) (203) (918) (6,009)
Balance at December 25, 2021 ....... $ 199,446 $ 117,724 $ 77,884 $ 313,512 $ 708,566
VALMONT INDUSTRIES, INC. AND SUBSIDIARIESNOTES TO CONSOLIDATED FINANCIAL STATEMENTS (Continued)
Three-year period ended December 25, 2021 (Dollars in thousands, except per share amounts)
57

Engineered Support
Structures Segment
Utility Support
Structures Segment
Coatings Segment
Irrigation Segment Total
Gross balance at December 28, 2019 $ 228,634 $ 130,594 $ 93,747 $ 25,136 $ 478,111 Accumulated impairment losses ........ (18,670) (14,355) (16,222) — (49,247) Balance at December 28, 2019 ........... 209,964 116,239 77,525 25,136 428,864 Acquisitions ....................................... — 1,100 — 5,038 6,138 Impairment ........................................ (12,575) — — — (12,575) Foreign currency translation .............. 3,689 3,641 562 3 7,895 Balance at December 26, 2020 .......... $ 201,078 $ 120,980 $ 78,087 $ 30,177 $ 430,322
The Company’s annual impairment test of goodwill was performed as of August 28, 2021, using primarily the discounted cash flow method. The solar tracking structure reporting unit projects meaningful annual revenue growth for the foreseeable future due to strong market conditions. Therefore, we valued this reporting unit using a blend of both the discounted cash flows and a market approach. The market valuation approach estimates the terminal value for this reporting unit using a multiple of earnings before interest, taxes, depreciation and amortization (EBITDA). During fiscal 2021, no goodwill impairment was recorded.
In April 2020, the price of a barrel of oil began a large decline and various economic forecasts show the lower price of oil will continue into the next few years. This lower price for oil and a revised assessment of the Australian market performed in conjunction with the executed restructuring activities required the Company to re-assess the financial projections for the Access Systems reporting unit. This resulted in lower projected net sales, operating income, and cash flows for this reporting unit, resulting in the need for an interim impairment test. The results of the test showed that the reporting unit's carrying value was higher than its estimated fair value. Accordingly, the Company recorded a $12,575 impairment of Access System's goodwill in the second quarter of 2020.
(8) BANK CREDIT ARRANGEMENTS
The Company maintains various lines of credit for short-term borrowings totaling $137,818 available at December 25, 2021. As of December 25, 2021 and December 26, 2020, $13,439 and $35,147 was outstanding and recorded as notes payable to banks in the Consolidated Balance Sheets, respectively. The interest rates charged on these lines of credit vary in relation to the banks’ costs of funds. The weighted average interest rate on short-term borrowings was 6.31% at December 25, 2021. The unused and available borrowings under the lines of credit were $124,379 at December 25, 2021. The lines of credit can be modified at any time at the option of the banks. The Company pays no fees in connection with unused lines of credit.
(9) INCOME TAXES
Earnings before income taxes and equity in earnings of nonconsolidated subsidiaries are as follows:
2021 2020 2019United States .......................................... $ 202,051 $ 169,281 $ 166,108 Foreign ................................................... 58,032 23,487 33,750
$ 260,083 $ 192,768 $ 199,858
VALMONT INDUSTRIES, INC. AND SUBSIDIARIESNOTES TO CONSOLIDATED FINANCIAL STATEMENTS (Continued)
Three-year period ended December 25, 2021 (Dollars in thousands, except per share amounts)
58

Income tax expense (benefit) consists of:2021 2020 2019
Current:Federal ........................................... $ 30,031 $ 30,431 $ 27,809 State ............................................... 8,891 8,302 5,568 Foreign .......................................... 20,644 12,730 13,130
59,566 51,463 46,507 Non-current: 1,777 (451) (240) Deferred:
Federal ........................................... 4,587 (6,086) 47 State ............................................... 558 (822) 160 Foreign .......................................... (5,074) 5,511 1,279
71 (1,397) 1,486 $ 61,414 $ 49,615 $ 47,753
The reconciliations of the statutory federal income tax rate and the effective tax rate follows:
2021 2020 2019Statutory federal income tax rate ...................................................... 21.0 % 21.0 % 21.0 %State income taxes, net of federal benefit ......................................... 2.9 3.5 2.5 Carryforwards, credits and changes in valuation allowances ........... 1.5 (1.6) (1.0) Foreign tax rate differences .............................................................. (0.1) (1.7) 0.3 Changes in unrecognized tax benefits .............................................. 0.7 0.2 (0.1) Goodwill and intangible impairment ............................................... — 2.4 — Other ................................................................................................. (2.4) 1.9 1.2
23.6 % 25.7 % 23.9 %
Fiscal 2021 includes $1,894 of U.S. tax benefits related to foreign taxes paid offset by $5,102 of valuation allowance recorded against the Offshore and other complex steel structures deferred tax assets. Fiscal year 2020 includes $4,651 of tax expense related to non-tax deductible impairment of goodwill. Fiscal year 2020 also includes $1,100 of tax expense primarily related to restructuring charges for which no tax benefits have been recorded due to the increase in valuation allowance.
VALMONT INDUSTRIES, INC. AND SUBSIDIARIESNOTES TO CONSOLIDATED FINANCIAL STATEMENTS (Continued)
Three-year period ended December 25, 2021 (Dollars in thousands, except per share amounts)
59

Deferred income taxes reflect the net tax effects of (a) temporary differences between the carrying amounts of assets and liabilities for financial reporting purposes and the amounts used for income tax purposes, and (b) operating loss and tax credit carryforwards. The tax effects of significant items comprising the Company’s net deferred income tax assets/liabilities are as follows:
2021 2020Deferred income tax assets:
Accrued expenses and allowances .......................................... $ 21,241 $ 17,203 Tax credits and loss carryforwards ......................................... 83,690 81,912 Defined benefit pension liability ............................................ 134 30,623 Inventory allowances .............................................................. 2,818 — Accrued compensation and benefits ....................................... 24,302 23,545 Lease liabilities ....................................................................... 41,128 23,715 Deferred compensation ........................................................... 10,893 13,883
Gross deferred income tax assets ........................................ 184,206 190,881 Valuation allowance ............................................................... (54,256) (44,451)
Net deferred income tax assets ........................................... 129,950 146,430 Deferred income tax liabilities:
Property, plant and equipment ................................................ 37,686 35,701 Intangible assets ...................................................................... 48,244 43,699 Inventory allowances .............................................................. — 5,705 Lease assets ............................................................................ 41,128 23,715 Other deferred tax liabilities ................................................... 5,041 5,248
Total deferred income tax liabilities ................................... 132,099 114,068 Net deferred income tax asset (liability) ............................. $ (2,149) $ 32,362
Deferred income tax assets (liabilities) are presented as follows on the Consolidated Balance Sheets: Balance Sheet Caption 2021 2020
Other assets ............................................................................................................... $ 45,700 $ 74,051 Deferred income taxes .............................................................................................. (47,849) (41,689)
Net deferred income tax asset (liability) .............................................................. $ (2,149) $ 32,362
Management of the Company has reviewed recent operating results and projected future operating results. The Company's belief that realization of its net deferred tax assets is more likely than not is based on, among other factors, changes in operations that have occurred in recent years and available tax planning strategies. At December 25, 2021 and December 26, 2020 respectively, there were $83,690 and $81,912 relating to tax credits and loss carryforwards.
Valuation allowances have been established for certain losses that reduce deferred tax assets to an amount that will, more likely than not, be realized. During fiscal 2021, it was determined no longer more likely than not that the Offshore and complex steel structures reporting unit, based in Denmark, would generate future taxable income so a valuation allowance of $5,102 was recognized against their tax loss carryforwards. Also in 2021, the Company recorded a valuation allowance of $6,472 against the tax attributes related to the acquisition of Prospera. The deferred tax assets at December 25, 2021 that are associated with tax loss and tax credit carryforwards not reduced by valuation allowances expire in periods starting in 2023.
Uncertain tax positions included in other non-current liabilities are evaluated in a two-step process, whereby (1) the Company determines whether it is more likely than not that the tax positions will be sustained based on the technical merits of the position and (2) for those tax positions that meet the more likely than not recognition threshold, the Company would
VALMONT INDUSTRIES, INC. AND SUBSIDIARIESNOTES TO CONSOLIDATED FINANCIAL STATEMENTS (Continued)
Three-year period ended December 25, 2021 (Dollars in thousands, except per share amounts)
60
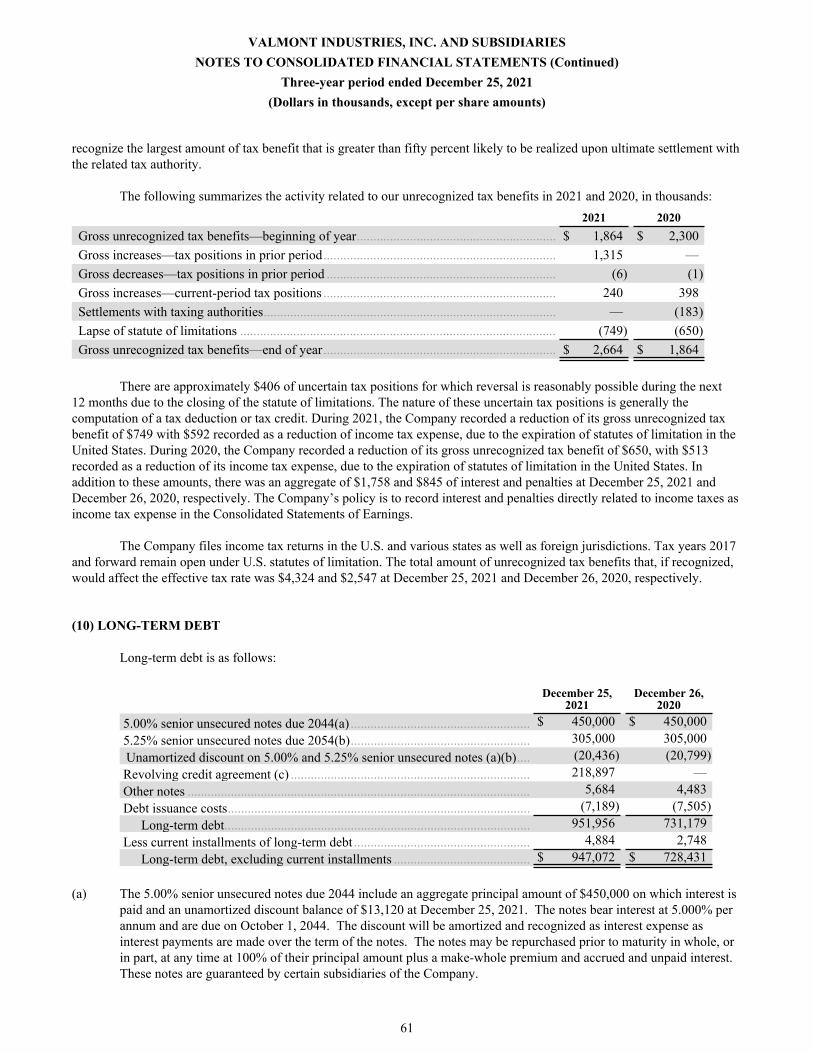
recognize the largest amount of tax benefit that is greater than fifty percent likely to be realized upon ultimate settlement with the related tax authority.
The following summarizes the activity related to our unrecognized tax benefits in 2021 and 2020, in thousands:2021 2020
Gross unrecognized tax benefits—beginning of year ............................................................ $ 1,864 $ 2,300 Gross increases—tax positions in prior period ...................................................................... 1,315 — Gross decreases—tax positions in prior period ..................................................................... (6) (1) Gross increases—current‑period tax positions ...................................................................... 240 398 Settlements with taxing authorities ........................................................................................ — (183) Lapse of statute of limitations ............................................................................................... (749) (650) Gross unrecognized tax benefits—end of year ...................................................................... $ 2,664 $ 1,864
There are approximately $406 of uncertain tax positions for which reversal is reasonably possible during the next 12 months due to the closing of the statute of limitations. The nature of these uncertain tax positions is generally the computation of a tax deduction or tax credit. During 2021, the Company recorded a reduction of its gross unrecognized tax benefit of $749 with $592 recorded as a reduction of income tax expense, due to the expiration of statutes of limitation in the United States. During 2020, the Company recorded a reduction of its gross unrecognized tax benefit of $650, with $513 recorded as a reduction of its income tax expense, due to the expiration of statutes of limitation in the United States. In addition to these amounts, there was an aggregate of $1,758 and $845 of interest and penalties at December 25, 2021 and December 26, 2020, respectively. The Company’s policy is to record interest and penalties directly related to income taxes as income tax expense in the Consolidated Statements of Earnings.
The Company files income tax returns in the U.S. and various states as well as foreign jurisdictions. Tax years 2017 and forward remain open under U.S. statutes of limitation. The total amount of unrecognized tax benefits that, if recognized, would affect the effective tax rate was $4,324 and $2,547 at December 25, 2021 and December 26, 2020, respectively.
(10) LONG-TERM DEBT
Long-term debt is as follows:
December 25,2021
December 26,2020
5.00% senior unsecured notes due 2044(a) ...................................................... $ 450,000 $ 450,000 5.25% senior unsecured notes due 2054(b) ...................................................... 305,000 305,000 Unamortized discount on 5.00% and 5.25% senior unsecured notes (a)(b) .... (20,436) (20,799) Revolving credit agreement (c) ........................................................................ 218,897 — Other notes ....................................................................................................... 5,684 4,483 Debt issuance costs ........................................................................................... (7,189) (7,505)
Long-term debt ............................................................................................ 951,956 731,179 Less current installments of long-term debt ..................................................... 4,884 2,748
Long-term debt, excluding current installments ......................................... $ 947,072 $ 728,431
(a) The 5.00% senior unsecured notes due 2044 include an aggregate principal amount of $450,000 on which interest is paid and an unamortized discount balance of $13,120 at December 25, 2021. The notes bear interest at 5.000% per annum and are due on October 1, 2044. The discount will be amortized and recognized as interest expense as interest payments are made over the term of the notes. The notes may be repurchased prior to maturity in whole, or in part, at any time at 100% of their principal amount plus a make-whole premium and accrued and unpaid interest. These notes are guaranteed by certain subsidiaries of the Company.
VALMONT INDUSTRIES, INC. AND SUBSIDIARIESNOTES TO CONSOLIDATED FINANCIAL STATEMENTS (Continued)
Three-year period ended December 25, 2021 (Dollars in thousands, except per share amounts)
61

(b) The 5.25% senior unsecured notes due 2054 include an aggregate principal amount of $305,000 on which interest is paid and an unamortized discount balance of $7,316 at December 25, 2021. The notes bear interest at 5.250% per annum and are due on October 1, 2054. The discount will be amortized and recognized as interest expense as interest payments are made over the term of the notes. The notes may be repurchased prior to maturity in whole, or in part, at any time at 100% of their principal amount plus a make-whole premium and accrued and unpaid interest. These notes are guaranteed by certain subsidiaries of the Company.
(c) On October 18, 2021, we along with our wholly-owned subsidiaries Valmont Industries Holland B.V. and Valmont Group Pty. Ltd., as borrowers, entered into an amendment and restatement of our revolving credit agreement with our lenders. The maturity date of the revolving credit facility was extended to October 18, 2026. The credit facility provides for $800,000 of committed unsecured revolving credit loans with available borrowings thereunder to $400,000 in foreign currencies. We may increase the credit facility by up to an additional $300,000 at any time, subject to lenders increasing the amount of their commitments. The interest rate on the borrowings will be, at the Company's option, either:
(i) term SOFR (based on a 1, 3 or 6 month interest period, as selected by the Company) plus a 10 basis point adjustment plus a spread of 100 to 162.5 basis points, depending on the credit rating of the Company's senior, unsecured, long-term debt published by Standard & Poor's Rating Services and Moody's Investors Service, Inc.;
(ii) the higher of
• the prime lending rate,
• the overnight bank rate plus 50 basis points, and
• term SOFR (based on a 1 month interest period) plus 110 basis points,
plus, in each case, 0 to 62.5 basis points, depending on the credit rating of the Company's senior, unsecured, debt published by Standard & Poor's Rating Services and Mood's Investors Service, Inc.; or
(iii) daily simple SOFR plus a 10 basis point adjustment plus a spread of 100 to 162.5 basis points, depending on the credit rating of the Company's senior, unsecured, long-term debt published by Standard & Poor's Rating Services and Mood's Investors Service, Inc.
At December 25, 2021, the Company had $218,897 outstanding borrowings under the revolving credit facility. The revolving credit facility has a maturity date of October 18, 2026, and contains a financial covenant that may limit additional borrowing capability under the agreement. At December 25, 2021, the Company had the ability to borrow $590,521 under this facility, after consideration of standby letters of credit of $744 associated with certain insurance obligations. We also maintain certain short-term bank lines of credit totaling $137,818, $124,379 of which was unused at December 25, 2021.
The revolving credit facility includes a financial leverage covenant. The Company was in compliance with this covenant at December 25, 2021. The minimum aggregate maturities of long-term debt for each of the five years following 2021 are: $4,884, $601, $179, $20 and $218,897.
The obligations arising under the 5.00% senior unsecured notes due 2044, the 5.25% senior unsecured notes due 2054, and the revolving credit facility are guaranteed by the Company and its wholly-owned subsidiaries Valmont Telecommunications, Inc., Valmont Coatings, Inc., Valmont Newmark, Inc., and Valmont Queensland Pty. Ltd.
VALMONT INDUSTRIES, INC. AND SUBSIDIARIESNOTES TO CONSOLIDATED FINANCIAL STATEMENTS (Continued)
Three-year period ended December 25, 2021 (Dollars in thousands, except per share amounts)
62

(11) STOCK-BASED COMPENSATION
The Company maintains stock‑based compensation plans approved by the shareholders, which provide that the Human Resource Committee of the Board of Directors may grant incentive stock options, nonqualified stock options, stock appreciation rights, restricted stock awards, restricted stock units, and bonuses of common stock. At December 25, 2021, 266,739 shares of common stock remained available for issuance under the plans. Shares and options issued and available are subject to changes in capitalization. The Company’s policy is to issue shares upon exercise of stock options or vesting of restricted stock units or issuance of restricted stock from treasury shares held by the Company.
Under the stock option plans, the exercise price of each option equals the market price at the time of the grant. Options vest beginning on the first anniversary of the grant in equal amounts over three years or on the fifth anniversary of the grant. Expiration of grants is seven to ten years from the date of grant. Restricted stock units and awards generally vest in equal installments over three years beginning on the first anniversary of the grant. The Company recorded $28,720, $14,874 and $11,587 of compensation expense (included in selling, general and administrative expenses) in the 2021, 2020 and 2019 fiscal years for all share-based compensation programs, respectively. The associated tax benefits recorded in the 2021, 2020 and 2019 fiscal years was $7,180, $3,719 and $2,897, respectively.
At December 25, 2021, the amount of unrecognized stock option compensation expense, to be recognized over a weighted average period of 2.38 years, was approximately $6,028.
The Company uses a binomial option pricing model to value its stock options. The fair value of each option grant made in 2021, 2020 and 2019 was estimated using the following assumptions:
2021 2020 2019Expected volatility ................................................... 33.01 % 33.72 % 33.13 %Risk-free interest rate .............................................. 1.26 % 0.43 % 1.69 %Expected life from vesting date ............................... 4.0 yrs 4.0 yrs 3.0 yrsDividend yield ......................................................... 1.20 % 1.24 % 1.07 %
VALMONT INDUSTRIES, INC. AND SUBSIDIARIESNOTES TO CONSOLIDATED FINANCIAL STATEMENTS (Continued)
Three-year period ended December 25, 2021 (Dollars in thousands, except per share amounts)
63

Following is a summary of the stock option activity during 2019, 2020 and 2021:
Number of Shares
Weighted Average Exercise
Price
Weighted Average
Remaining Contractual
Term
Aggregate Intrinsic
ValueOutstanding at December 29, 2018 ................................................... 578,413 $ 127.74 Granted .............................................................................................. 57,648 147.31 Exercised ........................................................................................... (119,789) 113.02 Forfeited ............................................................................................ (27,712) 137.07 Outstanding at December 28, 2019 ................................................... 488,560 $ 133.13 4.04 $ 9,291 Options vested or expected to vest at December 28, 2019 ................ 478,575 $ 133.21 3.99 9,078 Options exercisable at December 28, 2019 ....................................... 341,828 $ 133.32 3.19 6,470
The weighted average per share fair value of options granted during 2019 was $37.85.
Number of Shares
Weighted Average Exercise
Price
Weighted Average
Remaining Contractual
Term
Aggregate Intrinsic
ValueOutstanding at December 28, 2019 .......................................................... 488,560 $ 133.13 Granted ..................................................................................................... 66,231 168.80 Exercised .................................................................................................. (147,014) 125.43 Forfeited ................................................................................................... (8,212) 137.49 Outstanding at December 26, 2020 .......................................................... 399,565 $ 141.79 4.88 $ 12,103 Options vested or expected to vest at December 26, 2020 ....................... 389,633 $ 141.56 4.81 11,890 Options exercisable at December 26, 2020 .............................................. 254,498 $ 138.64 3.38 8,510
The weighted average per share fair value of options granted during 2020 was $45.49.
Number of Shares
Weighted Average Exercise
Price
Weighted Average
Remaining Contractual
Term
Aggregate Intrinsic
ValueOutstanding at December 26, 2020 .......................................................... 399,565 $ 141.79 Granted ..................................................................................................... 47,223 252.89 Exercised .................................................................................................. (169,908) 135.76 Forfeited ................................................................................................... (416) 132.84 Outstanding at December 25, 2021 .......................................................... 276,464 $ 164.48 5.88 $ 22,586 Options vested or expected to vest at December 25, 2021 ....................... 268,338 $ 163.42 5.80 22,188 Options exercisable at December 25, 2021 .............................................. 154,860 $ 142.15 4.00 15,896
The weighted average per share fair value of options granted during 2021 was $67.81.
VALMONT INDUSTRIES, INC. AND SUBSIDIARIESNOTES TO CONSOLIDATED FINANCIAL STATEMENTS (Continued)
Three-year period ended December 25, 2021 (Dollars in thousands, except per share amounts)
64

In accordance with shareholder-approved plans, the Human Resource Committee of the Board of Directors may grant stock under various stock‑based compensation arrangements, including restricted stock awards, restricted stock units, performance based restricted stock units, and stock issued in lieu of cash bonuses. Under such arrangements, stock or cash (as applicable) is issued without direct cost to the employee. The restricted stock units are settled in Company stock when the restriction period ends. Restricted stock units and awards generally vest in equal installments over three years beginning on the first anniversary of the grant. All cash-settled restricted stock units are marked-to-market and presented within other accrued expenses and noncurrent liabilities in our Consolidated Balance Sheets. During fiscal 2021, 2020 and 2019, the Company granted restricted stock units to directors and certain management employees as follows (which are not included in the above stock plan activity tables):
2021 2020 2019Shares granted ..................................................................................................................... 216,971 85,251 78,318 Weighted‑average per share price on grant date ................................................................. $ 236.28 $ 161.73 $ 145.89 Recognized compensation expense ..................................................................................... $ 16,147 $ 9,081 $ 8,815
During the second half of 2021, the Company granted 159,982 restricted shares, worth $36,916, to certain employees of Prospera. These restricted shares vest in equal installments over four years, and require the employees to continue employment over those four years. As such, the related compensation expense will be incurred over the vesting period.
At December 25, 2021 the amount of deferred stock‑based compensation granted, to be recognized over a weighted‑average period of 3.21 years, was approximately $55,838.
Performance-based restricted stock units (PSU) awards consist of shares of our stock which are payable upon the determination that the Company achieve certain established performance targets and can range from 0% to 200% of the targeted payout based on the actual results. PSU's granted in 2021 have a performance period of three years. The fair value of each PSU granted is equal to the fair market value of our common stock on the date of grant. PSUs granted generally have a three years period cliff vesting schedule; however, according to the grant agreements, if certain conditions are met, the employee (or beneficiary) will receive a prorated amount of the award based on active employment during the service period.
During fiscal 2021, 2020 and 2019, the Company granted PSU awards as follows (which are not included in the above stock plan activity tables):
2021 2020 2019Shares granted ..................................................................................................................... 41,060 35,181 31,344 Weighted‑average per share price on grant date ................................................................. $ 230.40 $ 125.41 $ 136.14 Recognized compensation expense ..................................................................................... $ 10,035 $ 3,165 $ —
VALMONT INDUSTRIES, INC. AND SUBSIDIARIESNOTES TO CONSOLIDATED FINANCIAL STATEMENTS (Continued)
Three-year period ended December 25, 2021 (Dollars in thousands, except per share amounts)
65

(12) EARNINGS PER SHARE
The following table provides a reconciliation between Basic and Diluted earnings per share (EPS):
Basic EPS
Dilutive Effect of
Stock Options
Diluted EPS
2021:Net earnings attributable to Valmont Industries, Inc. ................................................. $ 195,630 $ — $ 195,630 Weighted average shares outstanding (000's) ............................................................. 21,193 300 21,493 Per share amount ........................................................................................................ $ 9.23 $ 0.13 $ 9.10
2020:Net earnings attributable to Valmont Industries, Inc. ................................................. $ 140,693 $ — $ 140,693 Weighted average shares outstanding (000's) ............................................................. 21,315 110 21,425 Per share amount ........................................................................................................ $ 6.60 $ 0.03 $ 6.57
2019: Net earnings attributable to Valmont Industries, Inc. .............................................. $ 146,408 $ — $ 146,408 Weighted average shares outstanding (000's) .......................................................... 21,659 110 21,769 Per share amount ..................................................................................................... $ 6.76 $ 0.03 $ 6.73
Basic and diluted net earnings and earnings per share in fiscal 2021 was impacted by impairments of long-lived assets (customer relationship intangible asset, trade name, and property, plant and equipment) associated with the Offshore and other complex steel structures reporting unit of $21,678 after-tax ($1.01 per share) and a valuation allowance against the deferred tax assets of the Offshore and other complex steel structures reporting unit of $5,076 after-tax ($0.24 per share). Basic and diluted net earnings and earnings per share in fiscal 2020 was impacted by impairments of goodwill and intangible assets in fiscal 2020 of $16,220 after-tax ($0.76 per share) and restructuring expenses of $17,324 after-tax ($0.81 per share).
Earnings per share are computed independently for each of the quarters. Therefore, the sum of the quarterly earnings per share may not equal the total for the year.
At the end of fiscal years 2021, 2020, and 2019 there were 47,223, 0, and 130,704 outstanding stock options, respectively, with exercise prices exceeding the market price of common stock that were excluded from the computation of diluted earnings per share, respectively.
(13) EMPLOYEE RETIREMENT SAVINGS PLAN
Established under Internal Revenue Code Section 401(k), the Valmont Employee Retirement Savings Plan (“VERSP”) is a defined contribution plan available to all eligible employees. Participants can elect to contribute up to 60% of annual pay, on a pretax and/or after-tax basis. The Company also makes contributions to the Plan and a non-qualified deferred compensation plan for certain Company executives. The 2021, 2020 and 2019 Company contributions to these plans amounted to approximately $16,000, $14,800 and $12,600 respectively.
The Company sponsors a fully‑funded, non-qualified deferred compensation plan for certain Company executives who otherwise would be limited in receiving company contributions into VERSP under Internal Revenue Service regulations. The invested assets and related liabilities of these participants were $29,982 and $35,125 at December 25, 2021 and December 26, 2020, respectively. Such amounts are included in “Other assets” and “Deferred compensation” on the Consolidated Balance Sheets. Amounts distributed from the Company’s non-qualified deferred compensation plan to participants under the transition rules of section 409A of the Internal Revenue Code were approximately $8,900 and $5,067 at December 25, 2021 and December 26, 2020, respectively. All distributions were made in cash.
VALMONT INDUSTRIES, INC. AND SUBSIDIARIESNOTES TO CONSOLIDATED FINANCIAL STATEMENTS (Continued)
Three-year period ended December 25, 2021 (Dollars in thousands, except per share amounts)
66

(14) DISCLOSURES ABOUT THE FAIR VALUE OF FINANCIAL INSTRUMENTS
The carrying amount of cash and cash equivalents, receivables, accounts payable, notes payable to banks and accrued expenses approximate fair value because of the short maturity of these instruments. The fair values of each of the Company’s long-term debt instruments are based on the amount of future cash flows associated with each instrument discounted using the Company’s current borrowing rate for similar debt instruments of comparable maturity (Level 2). The fair value estimates are made at a specific point in time and the underlying assumptions are subject to change based on market conditions. At December 25, 2021, the carrying amount of the Company’s long-term debt was $951,956 with an estimated fair value of approximately $1,175,332. At December 26, 2020, the carrying amount of the Company’s long-term debt was $731,179 with an estimated fair value of approximately $884,846.
For financial reporting purposes, a three‑level hierarchy for fair value measurements based upon the transparency of inputs to the valuation of an asset or liability as of the measurement date is used. Inputs refers broadly to the assumptions that market participants would use in pricing the asset or liability, including assumptions about risk. Financial assets and liabilities carried at fair value will be classified and disclosed in one of the following three categories:
• Level 1: Quoted market prices in active markets for identical assets or liabilities.
• Level 2: Observable market based inputs or unobservable inputs that are corroborated by market data.
• Level 3: Unobservable inputs that are not corroborated by market data.
The categorization within the valuation hierarchy is based upon the lowest level of input that is significant to the fair value measurement. Following is a description of the valuation methodologies used for assets and liabilities measured at fair value.
Trading Securities: The assets and liabilities recorded for the investments held in the Valmont Deferred Compensation Plan of $29,982 ($35,125 in 2020) represent mutual funds, invested in debt and equity securities, classified as trading securities, considering the employee’s ability to change investment allocation of their deferred compensation at any time. The Company's remaining ownership in Delta EMD Pty. Ltd. (JSE:DTA) of $94 ($202 in 2020) is recorded at fair value at December 25, 2021. Quoted market prices are available for these securities in an active market and therefore categorized as a Level 1 input. These securities are included in Other Assets on the Consolidated Balance Sheets.
Derivative Financial Instruments: The fair value of foreign currency and commodity forward and cross currency contracts is based on a valuation model that discounts cash flows resulting from the differential between the contract price and the market-based forward rate.
Fair Value Measurement Using:
Carrying Value December 25,
2021
Quoted Prices in Active Markets
for Identical Assets (Level 1)
Significant Other Observable
Inputs (Level 2)
Significant Unobservable
Inputs (Level 3)
Assets:Trading securities ...................................... $ 30,076 $ 30,076 $ — $ — Derivative financial instruments, net ........ $ (4,007) $ — $ (4,007) $ —
Fair Value Measurement Using:
Carrying Value December 26,
2020
Quoted Prices in Active Markets
for Identical Assets (Level 1)
Significant Other Observable
Inputs (Level 2)
Significant Unobservable
Inputs (Level 3)
Assets:Trading securities ...................................... $ 35,327 $ 35,327 $ — $ — Derivative financial instruments, net ........ $ (5,911) $ — $ (5,911) $ —
VALMONT INDUSTRIES, INC. AND SUBSIDIARIESNOTES TO CONSOLIDATED FINANCIAL STATEMENTS (Continued)
Three-year period ended December 25, 2021 (Dollars in thousands, except per share amounts)
67

(15) DERIVATIVE FINANCIAL INSTRUMENTS
The Company manages interest rate risk, commodity price risk, and foreign currency risk related to foreign currency denominated transactions and investments in foreign subsidiaries. Depending on the circumstances, the Company may manage these risks by utilizing derivative financial instruments. Some derivative financial instruments are marked to market and recorded in the Company's consolidated statements of earnings, while others may be accounted for as fair value, cash flow, or net investment hedges. The Company had open foreign currency forward contracts that are marked to market at December 25, 2021 and December 26, 2020, which are insignificant and thus excluded from the tables below. Derivative financial instruments have credit and market risk. The Company manages these risks of derivative instruments by monitoring limits as to the types and degree of risk that can be taken, and by entering into transactions with counterparties who are recognized, stable multinational banks.
Fair value of derivative instruments at December 25, 2021 and December 26, 2020 are as follows:
Derivatives designated as hedging instruments: Balance sheet location
December 25, 2021
December 26, 2020
Commodity forward contracts ............. Accrued expenses ........................................ $ (5,802) $ — Foreign currency forward contracts ..... Prepaid expenses and other assets ............ 149 724 Foreign currency forward contracts ..... Accrued expenses ..................................... (118) — Cross currency swap contracts ............ Prepaid expenses and other assets ............ 1,764 600 Cross currency swap contracts ............ Accrued expenses ..................................... — (7,235)
$ (4,007) $ (5,911)
Gains (losses) on derivatives recognized in the consolidated statements of earnings for the years ended December 25, 2021, December 26, 2020, and December 28, 2019 are as follows:
Derivatives designated as hedging instruments: Statements of earnings location 2021 2020 2019Commodity forward contracts ................ Product cost of sales ..................... $ 25,821 $ — $ (2,130) Foreign currency forward contracts ........ Product Sales ................................ — 1,598 — Foreign currency forward contracts ........ Other income (expense) ............... (40) 187 950 Interest rate contracts .............................. Interest expense ............................ (64) (64) (64) Cross currency swap contracts ................ Interest expense ............................ 2,780 2,738 2,823
$ 28,497 $ 4,459 $ 1,579
Cash Flow Hedges
During 2021, the Company entered into steel hot rolled coil (HRC) forward contracts that qualify as a cash flow hedge of the variability in cash flows attributable to future steel purchases. The forward contracts had a notional amount of $93,498 for the total purchase of 86,100 short tons from May 2021 to December 2022. The gain (loss) realized upon settlement will be recorded in product cost of sales in the condensed consolidated statements of earnings over average inventory turns.
In 2019, the Company entered into steel hot rolled coil (HRC) forward contracts which qualified as a cash flow hedge of the variability in the cash flows attributable to future steel purchases. In 2019, the forward contracts had a notional amount of $12,128 for the purchase of 3,500 short tons for each month from May 2019 to September 2019. The gain (loss)
VALMONT INDUSTRIES, INC. AND SUBSIDIARIESNOTES TO CONSOLIDATED FINANCIAL STATEMENTS (Continued)
Three-year period ended December 25, 2021 (Dollars in thousands, except per share amounts)
68
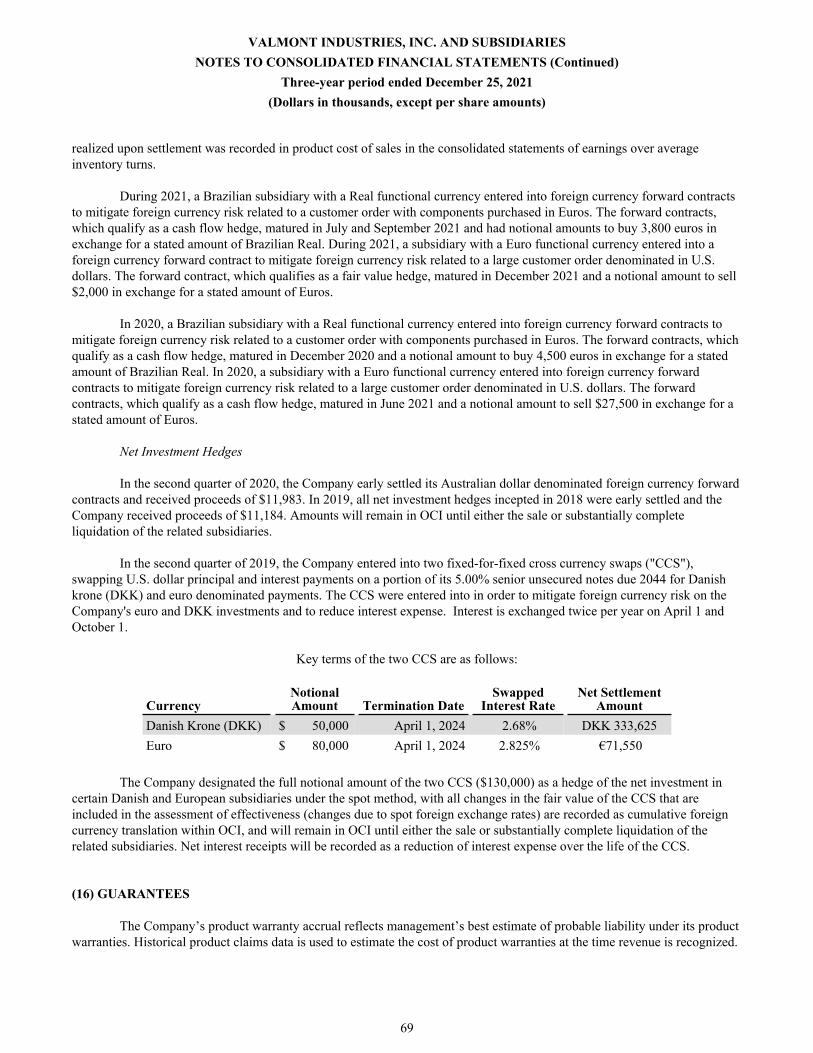
realized upon settlement was recorded in product cost of sales in the consolidated statements of earnings over average inventory turns.
During 2021, a Brazilian subsidiary with a Real functional currency entered into foreign currency forward contracts to mitigate foreign currency risk related to a customer order with components purchased in Euros. The forward contracts, which qualify as a cash flow hedge, matured in July and September 2021 and had notional amounts to buy 3,800 euros in exchange for a stated amount of Brazilian Real. During 2021, a subsidiary with a Euro functional currency entered into a foreign currency forward contract to mitigate foreign currency risk related to a large customer order denominated in U.S. dollars. The forward contract, which qualifies as a fair value hedge, matured in December 2021 and a notional amount to sell $2,000 in exchange for a stated amount of Euros.
In 2020, a Brazilian subsidiary with a Real functional currency entered into foreign currency forward contracts to mitigate foreign currency risk related to a customer order with components purchased in Euros. The forward contracts, which qualify as a cash flow hedge, matured in December 2020 and a notional amount to buy 4,500 euros in exchange for a stated amount of Brazilian Real. In 2020, a subsidiary with a Euro functional currency entered into foreign currency forward contracts to mitigate foreign currency risk related to a large customer order denominated in U.S. dollars. The forward contracts, which qualify as a cash flow hedge, matured in June 2021 and a notional amount to sell $27,500 in exchange for a stated amount of Euros.
Net Investment Hedges
In the second quarter of 2020, the Company early settled its Australian dollar denominated foreign currency forward contracts and received proceeds of $11,983. In 2019, all net investment hedges incepted in 2018 were early settled and the Company received proceeds of $11,184. Amounts will remain in OCI until either the sale or substantially complete liquidation of the related subsidiaries.
In the second quarter of 2019, the Company entered into two fixed-for-fixed cross currency swaps ("CCS"), swapping U.S. dollar principal and interest payments on a portion of its 5.00% senior unsecured notes due 2044 for Danish krone (DKK) and euro denominated payments. The CCS were entered into in order to mitigate foreign currency risk on the Company's euro and DKK investments and to reduce interest expense. Interest is exchanged twice per year on April 1 and October 1.
Key terms of the two CCS are as follows:
CurrencyNotional Amount Termination Date
Swapped Interest Rate
Net Settlement Amount
Danish Krone (DKK) $ 50,000 April 1, 2024 2.68% DKK 333,625Euro $ 80,000 April 1, 2024 2.825% €71,550
The Company designated the full notional amount of the two CCS ($130,000) as a hedge of the net investment in certain Danish and European subsidiaries under the spot method, with all changes in the fair value of the CCS that are included in the assessment of effectiveness (changes due to spot foreign exchange rates) are recorded as cumulative foreign currency translation within OCI, and will remain in OCI until either the sale or substantially complete liquidation of the related subsidiaries. Net interest receipts will be recorded as a reduction of interest expense over the life of the CCS.
(16) GUARANTEES
The Company’s product warranty accrual reflects management’s best estimate of probable liability under its product warranties. Historical product claims data is used to estimate the cost of product warranties at the time revenue is recognized.
VALMONT INDUSTRIES, INC. AND SUBSIDIARIESNOTES TO CONSOLIDATED FINANCIAL STATEMENTS (Continued)
Three-year period ended December 25, 2021 (Dollars in thousands, except per share amounts)
69

Changes in the product warranty accrual, which is recorded in “Accrued expenses”, for the years ended December 25, 2021 and December 26, 2020, were as follows:
2021 2020Balance, beginning of period ........................................................................................................... $ 14,787 $ 13,532 Payments made ................................................................................................................................ (6,444) (10,228) Change in liability for warranties issued during the period ............................................................. 13,534 12,287 Change in liability for pre-existing warranties ................................................................................ (569) (804) Balance, end of period ..................................................................................................................... $ 21,308 $ 14,787
(17) COMMITMENTS & CONTINGENCIES
Various claims and lawsuits are pending against Company and certain of its subsidiaries. The Company cannot fully determine the effect of all asserted and unasserted claims on its consolidated results of operations, financial condition, or liquidity. Where asserted and unasserted claims are considered probable and reasonably estimable, a liability has been recorded. We do not expect that any known lawsuits, claims, environmental costs, commitments, or contingent liabilities will have a material adverse effect on our consolidated results of operations, financial condition, or liquidity.
VALMONT INDUSTRIES, INC. AND SUBSIDIARIESNOTES TO CONSOLIDATED FINANCIAL STATEMENTS (Continued)
Three-year period ended December 25, 2021 (Dollars in thousands, except per share amounts)
70

(18) DEFINED BENEFIT RETIREMENT PLAN
Delta Ltd., a wholly-owned subsidiary of the Company, is the sponsor of the Delta Pension Plan ("Plan"). The Plan provides defined benefit retirement income to eligible employees in the United Kingdom. Pension retirement benefits to qualified employees are 1.67% of final salary per year of service upon reaching the age of 65 years. This Plan has no active employees as members at December 25, 2021.
Funded Status
The Company recognizes the overfunded or underfunded status of the pension plan as an asset or liability. The funded status represents the difference between the projected benefit obligation (PBO) and the fair value of the plan assets. The PBO is the present value of benefits earned to date by plan participants, including the effect of assumed future salary increases (if applicable) and inflation. Plan assets are measured at fair value. Because the pension plan is denominated in British pounds sterling, the Company used exchange rates of $1.356/£ and $1.308/£ to translate the net pension liability into U.S. dollars at December 25, 2021 and December 26, 2020, respectively. The PBO was $761,706 at December 25, 2021. The net funded status of $536 at December 25, 2021 is recorded as a noncurrent liability reflecting, in part, a significant actuarial gain for the period from December 26, 2020 to December 25, 2021 attributed to an increase in the discount rate.
Projected Benefit Obligation and Fair Value of Plan Assets—The accumulated benefit obligation (ABO) is the present value of benefits earned to date, assuming no future compensation growth.
As there are no active employees in the plan, the ABO is equal to the PBO for all years presented. The underfunded ABO represents the difference between the PBO and the fair value of plan assets.
Changes in the PBO and fair value of plan assets for the pension plan for the period from December 28, 2019 to December 26, 2020 were as follows:
Projected Benefit
ObligationPlan
AssetsFunded status
Fair Value at December 28, 2019 .............................................. $ 744,403 $ 604,396 $ (140,007) Employer contributions .............................................................. — 35,399 Interest cost ................................................................................ 12,954 — Prior service costs - GMP equalization ...................................... 949 — Actual return on plan assets ....................................................... — 89,988 Benefits paid .............................................................................. (18,212) (18,212) Actuarial (gain) loss .................................................................. 87,855 — Currency translation ................................................................... 32,224 30,079 Fair Value at December 26, 2020 .............................................. $ 860,173 $ 741,650 $ (118,523)
VALMONT INDUSTRIES, INC. AND SUBSIDIARIESNOTES TO CONSOLIDATED FINANCIAL STATEMENTS (Continued)
Three-year period ended December 25, 2021 (Dollars in thousands, except per share amounts)
71

Changes in the PBO and fair value of plan assets for the pension plan for the period from December 26, 2020 to December 25, 2021 were as follows:
Projected Benefit
ObligationPlan
AssetsFunded status
Fair Value at December 26, 2020 .............................................. $ 860,173 $ 741,650 $ (118,523) Employer contributions .............................................................. — 1,924 Interest cost ................................................................................ 9,896 — Actual return on plan assets ....................................................... — 48,637 Benefits paid .............................................................................. (22,952) (22,952) Actuarial (gain) .......................................................................... (77,379) — Currency translation ................................................................... (8,032) (8,089) Fair Value at December 25, 2021 .............................................. $ 761,706 $ 761,170 $ (536)
Actuarial gain decreased the projected benefit obligation resulted from an increase in the discount rate to 1.90% in 2021 versus 1.40%.
Pre-tax amounts recognized in accumulated other comprehensive income (loss) as of December 25, 2021 and December 26, 2020 consisted of actuarial gains (losses):
Balance December 28, 2019 .................................................... $ (143,726) Actuarial gain (loss) ................................................................. (16,731) Prior service costs - GMP equalization ................................... (814) Currency translation gain (loss) ............................................... (3,987) Balance December 26, 2020 .................................................... (165,258) Actuarial gain .......................................................................... 102,529 Prior service costs amortization ............................................... 550 Currency translation gain ........................................................ 1,239 Balance December 25, 2021 .................................................... $ (60,940)
Assumptions—The weighted-average actuarial assumptions used to determine the benefit obligation at December 25, 2021 and December 26, 2020 were as follows:
Percentages 2021 2020Discount rate ........................................................................... 1.90 % 1.40 %Salary increase ........................................................................ N/A N/ACPI inflation ............................................................................ 2.70 % 2.00 %RPI inflation ............................................................................ 3.30 % 2.90 %
Expense
Pension expense is determined based upon the annual service cost of benefits (the actuarial cost of benefits earned during a period) and the interest cost on those liabilities, less the expected return on plan assets. The expected long-term rate of return on plan assets is applied to the fair value of plan assets. Differences in actual experience in relation to assumptions are not recognized in net earnings immediately, but are deferred and, if necessary, amortized as pension expense.
VALMONT INDUSTRIES, INC. AND SUBSIDIARIESNOTES TO CONSOLIDATED FINANCIAL STATEMENTS (Continued)
Three-year period ended December 25, 2021 (Dollars in thousands, except per share amounts)
72

The components of the net periodic pension expense for the fiscal years ended December 25, 2021 and December 26, 2020 were as follows:
Net Periodic Benefit Cost: 2021 2020Interest cost ............................................................................................. $ 9,896 $ 12,954 Expected return on plan assets ............................................................... (27,763) (23,215) Amortization of prior service cost .......................................................... 550 513 Amortization of actuarial loss ................................................................ 2,750 2,437
Net periodic benefit expense (benefit) ........................................................ $ (14,567) $ (7,311)
Assumptions—The weighted-average actuarial assumptions used to determine expense are as follows for fiscal 2021 and 2020:
Percentages 2021 2020Discount rate ............................................................................................... 1.15 % 2.05 %Expected return on plan assets .................................................................... 3.96 % 4.18 %CPI Inflation ................................................................................................ 2.00 % 2.15 %RPI Inflation ................................................................................................ 2.90 % 3.05 %
The discount rate is based on the yields of AA-rated corporate bonds with durational periods similar to that of the pension liabilities. The expected return on plan assets is based on our asset allocation mix and our historical return, taking into account current and expected market conditions. The expected return of plan assets decreased from 3.96% to 3.48% for 2022 as the projected returns on the corporate bond plan assets is expected to decrease. Inflation is based on expected changes in the consumer price index or the retail price index in the U.K. depending on the relevant plan provisions.
Cash Contributions
The Company completed negotiations with Plan trustees in 2019 regarding annual funding for the Plan. The annual contributions into the Plan are $17,765 (/£13,100) per annum as part of the Plan’s recovery plan, along with a contribution to cover the administrative costs of the Plan of approximately $1,763 (/£1,300) per annum. In December 2020, the Company made its required 2021 annual contribution in addition to the required 2020 annual contribution that was made earlier in fiscal 2020.
Benefit Payments
The following table details expected pension benefit payments for the years 2022 through 2031:
2023 ............................................................................ 23,850 2024 ............................................................................ 24,650 2025 ............................................................................ 25,455 2026 ............................................................................ 26,260
Years 2027 - 2031 ......................................................... 144,400
2022 ............................................................................ $ 23,045
Asset Allocation Strategy
The investment strategy for pension plan assets is to maintain a diversified portfolio consisting of
• Long-term fixed‑income securities that are investment grade or government‑backed in nature;
VALMONT INDUSTRIES, INC. AND SUBSIDIARIESNOTES TO CONSOLIDATED FINANCIAL STATEMENTS (Continued)
Three-year period ended December 25, 2021 (Dollars in thousands, except per share amounts)
73

• Common stock mutual funds in U.K. and non-U.K. companies, and;
• Diversified growth funds, which are invested in a number of investments, including common stock, fixed income funds, properties and commodities.
The Plan, as required by U.K. law, has an independent trustee that sets investment policy. The general strategy is to invest approximately 50% of the assets of the plan in common stock mutual funds and diversified growth funds, with the remainder of the investments in long-term fixed income securities, including corporate bonds and index-linked U.K. gilts. The trustees regularly consult with representatives of the plan sponsor and independent advisors on such matters.
The pension plan investments are held in a trust. The weighted‑average maturity of the corporate bond portfolio was 13 years at December 25, 2021.
Fair Value Measurements
The pension plan assets are valued at fair value. The following is a description of the valuation methodologies used for the investments measured at fair value, including the general classification of such instruments pursuant to the valuation hierarchy.
Leveraged inflation-linked gilts (LDIs)—LDIs are a combination of U.K. government-backed securities (such as bonds or other fixed income securities issued directly by the U.K. Treasury) money market instruments, and derivatives combined to give leveraged exposure to changes in the U.K. long-term interest and inflation rates. These funds are expected to offset a proportion of the impact changes in the long-term interest and inflation rates in the U.K. have on the pension plan's benefit plan obligation liability. The fair value recorded by the Plan is calculated using net asset value (NAV) for each investment.
Temporary Cash Investments– These investments consist of British pound sterling, reported in terms of U.S. dollars based on currency exchange rates readily available in active markets. These temporary cash investments are classified as Level 1 investments.
Corporate Bonds—Corporate bonds and debentures consist of fixed income securities issued by U.K. corporations. The fair value recorded by the Plan is calculated using NAV for each investment.
Corporate Stock—This investment category consists of common and preferred stock, including mutual funds, issued by U.K. and non-U.K. corporations. The fair value recorded by the Plan is calculated using NAV for each investment.
Secured income asset (SIA) funds - This investment category consists of holdings which will have a high level of expected inflation linkage. Examples of underlying assets classes are rental streams and infrastructure debt. Due to the private nature of these investments, pricing inputs are not readily observable. Asset valuations are developed by the fund manager. These valuations are based on the application of public market multiples to private company cash flows, market transactions that provide valuation information for comparable companies, and other methods. The fair value recorded by the Plan is calculated using NAV.
VALMONT INDUSTRIES, INC. AND SUBSIDIARIESNOTES TO CONSOLIDATED FINANCIAL STATEMENTS (Continued)
Three-year period ended December 25, 2021 (Dollars in thousands, except per share amounts)
74

At December 25, 2021 and December 26, 2020, the pension plan assets measured at fair value on a recurring basis were as follows:
December 31, 2021
Quoted Prices in Active Markets
for Identical Inputs (Level 1)
Significant Other Observable
Inputs (Level 2)
Significant Unobservable
Inputs (Level 3) Total
Plan assets at fair value:Temporary cash investments .................................... $ 14,000 $ — $ — $ 14,000 Total plan net assets at fair value ............................. $ 14,000 $ — $ — $ 14,000 Plan assets at NAV:Leveraged inflation-linked gilt funds ....................... 283,288 Corporate bonds ....................................................... 107,945 Corporate stock ......................................................... 212,730 Secured income asset funds ...................................... 143,207 Total plan assets at NAV .......................................... 747,170 Total plan assets ..................................................... $ 761,170
December 31, 2020
Quoted Prices in Active Markets
for Identical Inputs (Level 1)
Significant Other Observable
Inputs (Level 2)
Significant Unobservable
Inputs (Level 3) Total
Plan assets at fair value:Temporary cash investments .................................... $ 31,935 $ — $ — $ 31,935 Total plan net assets at fair value ............................. $ 31,935 $ — $ — $ 31,935 Plan assets at NAV:Leveraged inflation-linked gilt funds ....................... 171,013 Corporate bonds ....................................................... 115,577 Corporate stock ......................................................... 309,987 Secured income asset funds ...................................... 113,138 Total plan assets at NAV .......................................... 709,715 Total plan assets ..................................................... $ 741,650
VALMONT INDUSTRIES, INC. AND SUBSIDIARIESNOTES TO CONSOLIDATED FINANCIAL STATEMENTS (Continued)
Three-year period ended December 25, 2021 (Dollars in thousands, except per share amounts)
75

(19) LEASES
The Company has operating leases for plant locations, corporate offices, sales offices, and certain equipment. Outstanding leases at December 25, 2021 have remaining lease terms of one year to twenty-five years, some of which include options to extend leases for up to ten years. The Company does not have any financing leases. The Company elected practical expedients not to reassess whether existing contracts are or contain leases, to not reassess the lease classification of any existing leases, to not reassess initial direct costs for any existing leases, to use hindsight in determining the lease term and in assessing impairment of the right-of-use asset, and to not separate lease and non-lease components for all classes of underlying assets.
The Company determines if an arrangement is a lease at inception. Operating leases are included in other assets, accrued expenses, and lease liabilities in our consolidated balance sheets. ROU assets represent the right to use an underlying asset for the lease term and lease liabilities represent the obligation to make future lease payments arising from the lease. Operating lease ROU assets and liabilities are recognized at commencement date based on the present value of lease payments over the lease term. The Company used its collateralized incremental borrowing rate in determining the present value of future lease payments. The operating lease ROU asset also includes any lease payments made and excludes any lease incentives and impairments. Some of the Company's facility leases include options to extend the lease when it is reasonably certain that the option will be exercised. Lease expense is recognized on a straight-line basis over the lease term.
The Company commenced on a new corporate headquarters operating lease with straight-line annual expense of approximately $5,100, a 2% annual increase in lease payment, and a 25 year term during 2021. In recognition of this lease, an operating lease asset of $71,853 and an operating long-term liability of $71,196 was recognized.
Lease cost and other information related to the Company's operating leases at December 25, 2021 and December 26, 2020 are as follows:
Fifty-Two weeks ended December 25,
2021
Fifty-Two weeks ended December 26,
2020Operating lease cost .................................................................................... $ 27,421 $ 23,976
Operating cash outflows from operating leases .......................................... $ 27,793 $ 25,390 ROU assets obtained in exchange for lease obligations ............................. $ 86,481 $ 6,131 Weighted average remaining lease term ..................................................... 17 years 11 yearsWeighted average discount rate .................................................................. 4.0 % 3.5 %
Operating lease cost includes approximately $1,500 for short-term lease costs and approximately $3,600 for variable lease payments in 2021.
As part of the adoption of ASC 842 in 2019, the Company evaluated the historical and projected cash flow generation of the operations at each of its long-term leased facilities. It was determined that one of those facilities, a galvanizing operation in Melbourne, Australia, would not generate sufficient cash flows on an undiscounted cash flow basis to recover the carrying value of the right of use asset. The Company then estimated a value for this operation using a discounted cash flow model. The result was an impairment of the right-of-use lease asset of approximately $12,063. The after-tax balance of $8,444 was recorded as a reduction to retained earnings for the transition adjustment of adoption.
VALMONT INDUSTRIES, INC. AND SUBSIDIARIESNOTES TO CONSOLIDATED FINANCIAL STATEMENTS (Continued)
Three-year period ended December 25, 2021 (Dollars in thousands, except per share amounts)
76

Supplemental balance sheet information related to operating leases as of December 25, 2021 and December 26, 2020 is as follows:
ClassificationDecember 25,
2021December 26,
2020Operating lease assets ....................................... Other assets .......................... $ 152,664 $ 77,566
Operating lease short-term liabilities ............... Accrued expenses ................ 16,754 14,658 Operating lease long-term liabilities ................ Operating lease liabilities ..... 147,759 80,202 Total lease liabilities ..................................... $ 164,513 $ 94,860
Minimum lease payments under operating leases expiring subsequent to December 25, 2021 are as follows:
Fiscal year ending:2022 ............................................................................................................................................... $ 23,217 2023 ............................................................................................................................................... 19,087 2024 ............................................................................................................................................... 16,066 2025 ............................................................................................................................................... 15,148 2026 ............................................................................................................................................... 13,531
Subsequent ............................................................................................................................................ 148,326 Total minimum lease payments ............................................................................................................ $ 235,375 Less: Interest ....................................................................................................................................... $ 70,862 Present value of minimum lease payments ........................................................................................... $ 164,513
VALMONT INDUSTRIES, INC. AND SUBSIDIARIESNOTES TO CONSOLIDATED FINANCIAL STATEMENTS (Continued)
Three-year period ended December 25, 2021 (Dollars in thousands, except per share amounts)
77
(20) BUSINESS SEGMENTS
The Company has four reportable segments based on its management structure. Each segment is global in nature with a manager responsible for segment operational performance and the allocation of capital within the segment. Net corporate expense is net of certain service‑related expenses that are allocated to business units generally on the basis of employee headcounts and sales dollars.
Reportable segments are as follows:
ENGINEERED SUPPORT STRUCTURES: This segment consists of the manufacture and distribution of engineered poles, towers, and components for lighting, traffic, and wireless communication markets, engineered access systems, integrated structure solutions for smart cities, and highway safety products;
UTILITY SUPPORT STRUCTURES: This segment consists of the manufacture of engineered steel, concrete and composite structures for utility markets, including transmission, distribution, substations, and renewable energy generation equipment;
COATINGS: This segment consists of galvanizing, painting and anodizing services to preserve and protect metal products; and
IRRIGATION: This segment consists of the manufacture of center pivot and linear irrigation equipment for agricultural markets, including parts, services and tubular products, and advanced technology solutions for water management and precision agriculture.
The accounting policies of the reportable segments are the same as those described in Note 1. The Company evaluates the performance of its business segments based upon operating income and invested capital. The Company's operating income for segment purposes excludes unallocated corporate general and administrative expenses, interest expense, non-operating income and deductions, or income taxes.
VALMONT INDUSTRIES, INC. AND SUBSIDIARIESNOTES TO CONSOLIDATED FINANCIAL STATEMENTS (Continued)
Three-year period ended December 25, 2021 (Dollars in thousands, except per share amounts)
78

Summary by Business
2021 2020 2019SALES:Utility Support Structures segment:
Steel ................................................................................................... $ 770,104 $ 635,220 $ 630,892 Concrete ............................................................................................ 165,501 160,544 122,032 Engineered Solar Tracker Solutions .................................................. 62,904 86,382 47,450 Offshore and Other Complex Steel Structures .................................. 123,001 120,063 90,206
Utility Support Structures segment ................................................ 1,121,510 1,002,209 890,580 Engineered Support Structures segment:
Lighting, Traffic, and Highway Safety Products ............................ 717,650 717,216 708,853 Communication Products ................................................................ 240,171 190,203 188,912
Access Systems ............................................................................... 106,940 88,421 114,525 Engineered Support Structures segment ...................................... 1,064,761 995,840 1,012,290
Coatings segment ................................................................................... 386,313 345,312 367,835 Irrigation segment: .................................................................................
North America ................................................................................... 545,574 378,424 378,613 International ....................................................................................... 483,143 267,407 206,583
Irrigation segment .......................................................................... 1,028,717 645,831 585,196 Total ............................................................................................... 3,601,301 2,989,192 2,855,901
INTERSEGMENT SALES:Utility Support Structures .................................................................. 506 71 4,972 Engineered Support Structures .......................................................... 321 12,317 10,214 Coatings ............................................................................................. 87,232 75,710 67,195 Irrigation ............................................................................................ 11,667 5,739 6,544
Total ............................................................................................... 99,726 93,837 88,925 NET SALES:Utility Support Structures segment ........................................................ 1,121,004 1,002,138 885,608 Engineered Support Structures segment ................................................ 1,064,440 983,523 1,002,076 Coatings segment ................................................................................... 299,081 269,602 300,640 Irrigation segment .................................................................................. 1,017,050 640,092 578,652
Total ............................................................................................... $ 3,501,575 $ 2,895,355 $ 2,766,976
VALMONT INDUSTRIES, INC. AND SUBSIDIARIESNOTES TO CONSOLIDATED FINANCIAL STATEMENTS (Continued)
Three-year period ended December 25, 2021 (Dollars in thousands, except per share amounts)
79

2021 2020 2019OPERATING INCOME (LOSS):
Utility Support Structures .................................................................................... $ 67,624 $ 100,855 $ 87,788 Engineered Support Structures ............................................................................ 115,417 65,342 65,627 Coatings ............................................................................................................... 50,365 42,975 51,008 Irrigation .............................................................................................................. 137,027 83,046 71,687 Corporate .............................................................................................................. (83,648) (66,265) (48,205)
Total ................................................................................................................. 286,785 225,953 227,905 Interest expense, net ................................................................................................. (41,420) (38,701) (36,211) Other ......................................................................................................................... 14,718 5,516 8,164 Earnings before income taxes and equity in earnings of nonconsolidated
subsidiaries ............................................................................................................ $ 260,083 $ 192,768 $ 199,858
TOTAL ASSETS:Utility Support Structures .................................................................................... $ 827,083 $ 778,127 $ 742,194 Engineered Support Structures ............................................................................ 977,334 932,565 944,428 Coatings ............................................................................................................... 366,026 360,594 363,070 Irrigation .............................................................................................................. 1,027,272 465,322 347,887 Corporate .............................................................................................................. 249,534 416,552 409,637
Total ................................................................................................................. $ 3,447,249 $ 2,953,160 $ 2,807,216
CAPITAL EXPENDITURES:Utility Support Structures .................................................................................... 36,718 34,495 26,306 Engineered Support Structures ............................................................................ 16,578 24,447 25,344 Coatings ............................................................................................................... 19,178 22,132 23,610 Irrigation .............................................................................................................. 17,509 16,740 15,644 Corporate .............................................................................................................. 17,807 8,886 6,521
Total ................................................................................................................. $ 107,790 $ 106,700 $ 97,425
VALMONT INDUSTRIES, INC. AND SUBSIDIARIESNOTES TO CONSOLIDATED FINANCIAL STATEMENTS (Continued)
Three-year period ended December 25, 2021 (Dollars in thousands, except per share amounts)
80

2021 2020 2019DEPRECIATION AND AMORTIZATION:
Utility Support Structures.................................................................................. $ 24,075 $ 23,641 $ 23,779 Engineered Support Structures .......................................................................... 24,733 25,399 26,280 Coatings ............................................................................................................. 16,928 15,793 15,907 Irrigation ............................................................................................................ 17,813 12,098 10,943 Corporate ........................................................................................................... 9,028 5,961 5,355
Total ............................................................................................................... $ 92,577 $ 82,892 $ 82,264
Summary by Geographical Area by Location of Valmont Facilities:2021 2020 2019
NET SALES:United States ....................................................................................................... $ 2,260,198 $ 1,919,136 $ 1,872,840 Australia .............................................................................................................. 297,720 252,253 255,271 Brazil ................................................................................................................... 200,402 103,591 77,996 Denmark ............................................................................................................. 123,001 120,063 90,206 Other ................................................................................................................... 620,254 500,312 470,663
Total ................................................................................................................ $ 3,501,575 $ 2,895,355 $ 2,766,976
LONG-LIVED ASSETS:United States ....................................................................................................... $ 1,172,552 $ 748,886 $ 753,545 Australia .............................................................................................................. 173,240 179,673 193,029 Brazil ................................................................................................................... 28,583 17,151 7,963 Denmark ............................................................................................................. 21,232 61,546 58,435 Other ................................................................................................................... 338,879 391,279 362,020
Total ................................................................................................................ $ 1,734,486 $ 1,398,535 $ 1,374,992
No single customer accounted for more than 10% of net sales in 2021, 2020, or 2019. Net sales by geographical area are based on the location of the facility producing the sales and do not include sales to other operating units of the Company. Australia accounted for approximately 9% of the Company's net sales in 2021; no other foreign country accounted for more than 6% of the Company’s net sales.
Operating income by business segment are based on net sales less identifiable operating expenses and allocations and includes profits recorded on sales to other operating units of the Company. Long-lived assets consist of property, plant and equipment, net of depreciation, goodwill, other intangible assets and other assets. Long-lived assets by geographical area are based on location of facilities.
VALMONT INDUSTRIES, INC. AND SUBSIDIARIESNOTES TO CONSOLIDATED FINANCIAL STATEMENTS (Continued)
Three-year period ended December 25, 2021 (Dollars in thousands, except per share amounts)
81

ITEM 9. CHANGES IN AND DISAGREEMENTS WITH ACCOUNTANTS ON ACCOUNTING AND FINANCIAL DISCLOSURE.
None.ITEM 9A. CONTROLS AND PROCEDURES.
The Company carried out an evaluation under the supervision and with the participation of the Company’s management, including the Company’s Chief Executive Officer and Chief Financial Officer, of the effectiveness of the design and operation of the Company’s disclosure controls and procedures pursuant to Securities Exchange Act Rule 13a-15. Based upon that evaluation, the Chief Executive Officer and Chief Financial Officer concluded that, as of the end of the period covered by this report, the Company’s disclosure controls and procedures are effective to provide reasonable assurance that information required to be disclosed by the Company in the reports the Company files or submits under the Securities Exchange Act of 1934 is (1) accumulated and communicated to management, including the Company’s Chief Executive Officer and Chief Financial Officer, to allow timely decisions regarding required disclosures and (2) recorded, processed, summarized and reported, within the time periods specified in the Commission’s rules and forms.
MANAGEMENT’S REPORT ON INTERNAL CONTROL OVER FINANCIAL REPORTING
The Company’s management is responsible for establishing and maintaining adequate internal control over financial reporting as such term is defined in Securities Exchange Act Rule 13a-15(f). The Company carried out an evaluation under the supervision and with the participation of the Company’s management, including the Company’s Chief Executive Officer and Chief Financial Officer, of the effectiveness of the Company’s internal control over financial reporting. The Company’s management used the framework in Internal Control—Integrated Framework (2013) issued by the Committee of Sponsoring Organizations (COSO) to perform this evaluation. Based on that evaluation, the Company’s management concluded that the Company’s internal control over financial reporting was effective as of December 25, 2021.
The effectiveness of the Company’s internal control over financial reporting as of December 25, 2021 has been audited by Deloitte & Touche LLP, an independent registered public accounting firm, as stated in their report, a copy of which is included in this Annual Report on Form 10-K.
82
REPORT OF INDEPENDENT REGISTERED PUBLIC ACCOUNTING FIRM
To the Shareholders and the Board of Directors of Valmont Industries, Inc.
Opinion on Internal Control over Financial Reporting
We have audited the internal control over financial reporting of Valmont Industries, Inc. and subsidiaries (the “Company”) as of December 25, 2021, based on criteria established in Internal Control — Integrated Framework (2013) issued by the Committee of Sponsoring Organizations of the Treadway Commission (COSO). In our opinion, the Company maintained, in all material respects, effective internal control over financial reporting as of December 25, 2021, based on criteria established in Internal Control — Integrated Framework (2013) issued by COSO.
We have also audited, in accordance with the standards of the Public Company Accounting Oversight Board (United States) (PCAOB), the consolidated financial statements as of and for the year ended December 25, 2021, of the Company and our report dated February 23, 2022, expressed an unqualified opinion on those financial statements
Basis for Opinion
The Company’s management is responsible for maintaining effective internal control over financial reporting and for its assessment of the effectiveness of internal control over financial reporting, included in the accompanying Management’s Report on Internal Control Over Financial Reporting. Our responsibility is to express an opinion on the Company’s internal control over financial reporting based on our audit. We are a public accounting firm registered with the PCAOB and are required to be independent with respect to the Company in accordance with the U.S. federal securities laws and the applicable rules and regulations of the Securities and Exchange Commission and the PCAOB.
We conducted our audit in accordance with the standards of the PCAOB. Those standards require that we plan and perform the audit to obtain reasonable assurance about whether effective internal control over financial reporting was maintained in all material respects. Our audit included obtaining an understanding of internal control over financial reporting, assessing the risk that a material weakness exists, testing and evaluating the design and operating effectiveness of internal control based on the assessed risk, and performing such other procedures as we considered necessary in the circumstances. We believe that our audit provides a reasonable basis for our opinion.
Definition and Limitations of Internal Control over Financial Reporting
A company’s internal control over financial reporting is a process designed to provide reasonable assurance regarding the reliability of financial reporting and the preparation of financial statements for external purposes in accordance with generally accepted accounting principles. A company’s internal control over financial reporting includes those policies and procedures that (1) pertain to the maintenance of records that, in reasonable detail, accurately and fairly reflect the transactions and dispositions of the assets of the company; (2) provide reasonable assurance that transactions are recorded as necessary to permit preparation of financial statements in accordance with generally accepted accounting principles, and that receipts and expenditures of the company are being made only in accordance with authorizations of management and directors of the company; and (3) provide reasonable assurance regarding prevention or timely detection of unauthorized acquisition, use, or disposition of the company’s assets that could have a material effect on the financial statements.
Because of its inherent limitations, internal control over financial reporting may not prevent or detect misstatements. Also, projections of any evaluation of effectiveness to future periods are subject to the risk that controls may become inadequate because of changes in conditions, or that the degree of compliance with the policies or procedures may deteriorate.
/s/ Deloitte & Touche LLPOmaha, NebraskaFebruary 23, 2022
83

ITEM 9B. OTHER INFORMATION.
Shareholder Return Performance Graphs
The graphs below compare the yearly change in the cumulative total shareholder return on the Company’s common stock with the cumulative total returns of the S&P Mid Cap 400 Index and the S&P Mid Cap 400 Industrial Machinery Index for the five and ten-year periods ended December 25, 2021. The Company was added to these indexes in 2009 by Standard & Poor’s. The graphs assume that the beginning value of the investment in Valmont Common Stock and each index was $100 and that all dividends were reinvested.
TEN YEAR COMPARISON
Valmont Industries, Inc. S&P MidCap 400 Index S&P 400 Industrial Machinery
Dec 12
Dec 13
Dec 14
Dec 15
Dec 16
Dec 17
Dec 18
Dec 19
Dec 20
Dec 21
$0
$100
$200
$300
$400
FIVE YEAR COMPARISON
Valmont Industries, Inc. S&P MidCap 400 Index S&P 400 Industrial Machinery
Dec 17
Dec 18
Dec 19
Dec 20
Dec 21
$0
$50
$100
$150
$200
$250
$300
84

ITEM 9C. DISCLOSURE REGARDING FOREIGN JURISDICTIONS THAT PREVENT INSPECTIONS.
Not Applicable.
85

PART III
ITEM 10. DIRECTORS, EXECUTIVE OFFICERS AND CORPORATE GOVERNANCE.
Except for the information relating to the executive officers of the Company set forth in Part I of this 10-K Report, the information called for by items 10, 11, and 13 is incorporated by reference to the sections entitled “Certain Shareholders”, “Corporate Governance”, “Board of Directors and Election of Directors”, "Board Committees", “Compensation Discussion and Analysis”, "Compensation Risk Assessment", “Human Resources Committee Report”, "Pay Ratio Information", “Summary Compensation Table”, “Grants of Plan-Based Awards for Fiscal Year 2021”, “Outstanding Equity Awards at Fiscal Year-End”, “Options Exercised and Stock Vested in Fiscal 2021”, “Nonqualified Deferred Compensation”, “Director Compensation”, and “Potential Payments Upon Termination or Change-in-Control” in the Proxy Statement.
The Company has adopted a Code of Ethics for Senior Officers that applies to the Company’s Chief Executive Officer, Chief Financial Officer and Controller and has posted the code on its website at www.valmont.com through the “Investors Relations” link. The Company intends to satisfy the disclosure requirement under Item 5.05 of Form 8-K relating to amendments to or waivers from any provision of the Code of Ethics for Senior Officers applicable to the Company’s Chief Executive Officer, Chief Financial Officer or Controller by posting that information on the Company’s Web site at www.valmont.com through the “Investors Relations” link.ITEM 11. EXECUTIVE COMPENSATION.
See Item 10.ITEM 12. SECURITY OWNERSHIP OF CERTAIN BENEFICIAL OWNERS AND MANAGEMENT AND
RELATED STOCKHOLDER MATTERS.
Incorporated herein by reference to “Certain Shareholders” and “Equity Compensation Plan Information” in the Proxy Statement.ITEM 13. CERTAIN RELATIONSHIPS AND RELATED TRANSACTIONS, AND DIRECTOR INDEPENDENCE.
See Item 10.ITEM 14. PRINCIPAL ACCOUNTANT FEES AND SERVICES.
The information called for by Item 14 is incorporated by reference to the sections titled “Ratification of Appointment of Independent Auditors” in the Proxy Statement.
86

PART IV
ITEM 15. EXHIBITS AND FINANCIAL STATEMENT SCHEDULES.
(a)(1)(2) Financial Statements and Schedules.
The following consolidated financial statements of the Company and its subsidiaries are included herein as listed below:Consolidated Financial Statements
Report of Independent Registered Public Accounting Firm (PCAOB ID No. 34) ............................................. 39Consolidated Statements of Earnings—Three-Year Period Ended December 25, 2021 ..................................... 41Consolidated Statements of Comprehensive Income—Three-Year Period Ended December 25, 2021 ............. 42Consolidated Balance Sheets—December 25, 2021 and December 26, 2020 .................................................... 43Consolidated Statements of Cash Flows—Three-Year Period Ended December 25, 2021 ................................ 44Consolidated Statements of Shareholders’ Equity—Three-Year Period Ended December 25, 2021 ................. 45Notes to Consolidated Financial Statements—Three-Year Period Ended December 25, 2021 .......................... 46
All other schedules have been omitted as the required information is inapplicable or the information is included in the consolidated financial statements or related notes. Separate financial statements of the registrant have been omitted because the registrant meets the requirements which permit omission.
(3) Index to Exhibits See exhibits listed under Part B below.
87

(b) ExhibitsExhibit 3.1 — The Company’s Restated Certificate of Incorporation, as amended. This document was filed as
Exhibit 3.1 to the Company’s Quarterly Report on Form 10-Q (Commission file number 001-31429) for the quarter ended March 28, 2009 and is incorporated herein by this reference.
Exhibit 3.2 — The Company's By-Laws, as amended. This document was filed as Exhibit 3.1 to the Company's Quarterly Report on Form 10-Q for the quarter ended March 29, 2014 and is incorporated herein (Commission file number 001-31429) by reference.
Exhibit 4.1 — Second Amended and Restated Credit Agreement, dated as of October 18, 2021, among the Company, Valmont Industries Holland B.V. and Valmont Group Pty. Ltd., as Borrowers, JPMorgan Chase Bank, N.A., as Administrative Agent, and the other lenders party thereto. This document was filed as Exhibit 10.1 to the Company’s Current Report on Form 8-K (Commission file number 001-31429) dated October 18, 2021 and is incorporated herein by reference.
Exhibit 4.2 — Indenture relating to senior debt, dated as of April 12, 2010, among Valmont Industries, Inc., the Subsidiary Guarantors party thereto and Wells Fargo Bank, National Association., as Trustee. This document was filed as Exhibit 4.1 to the Company’s Current Report on Form 8-K (Commission file number 001-31429) dated April 12, 2010 and is incorporated herein by this reference.
Exhibit 4.3 — First Supplemental Indenture, dated as of April 12, 2010, to indenture relating to senior debt, dated as of April 12, 2010, among Valmont Industries, Inc., the Subsidiary Guarantors party thereto and Wells Fargo Bank, National Association, as Trustee. This document was filed as Exhibit 4.2 to the Company’s Current Report on Form 8-K (Commission file number 001-31429) dated April 12, 2010 and is incorporated herein by this reference.
Exhibit 4.4 — Second Supplemental Indenture, dated as of September 22, 2014, to Indenture relating to senior debt, dated as of April 12, 2010, among Valmont Industries, Inc., the Subsidiary Guarantors party thereto and Wells Fargo Bank, National Association, as Trustee. This document was filed as Exhibit 4.2 to the Company's Current Report on Form 8-K (Commission file number 001-31429) dated September 22, 2014 and is incorporated herein by this reference.
Exhibit 4.5 — Third Supplemental Indenture, dated as of September 22, 2014, to Indenture relating to senior debt, dated as of April 12, 2010, among Valmont Industries, Inc., the Subsidiary Guarantors party thereto and Wells Fargo Bank, National Association, as Trustee. This document was filed as Exhibit 4.3 to the Company's Current Report on Form 8-K (Commission file number 001-31429) dated September 22, 2014 and is incorporated herein by this reference.
Exhibit 4.6 — Description of Registrant's Securities Registered Pursuant to Section 12 of the Securities Exchange Act of 1934. This document was filed as Exhibit 4.9 to the Company’s Annual Report on Form 10-K (Commission file number 001-31429) for the year ended December 28, 2019 and is incorporated herein by this reference.
Exhibit 10.1 — The Company's 2013 Stock Plan. This document was filed as Exhibit 10.1 to the Company’s Current Report on Form 8-K (Commission file number 001-31429) dated April 30, 2013 and is incorporated herein by reference.
Exhibit 10.2 — 2013 Stock Plan Amendment, dated December 17, 2015. This document was filed as Exhibit 10.7 to the Company’s Annual Report on Form 10-K (Commission file number 001-31429) for the year ended December 26, 2015 and is incorporated herein by this reference.
Exhibit 10.3 The Company's 2018 Stock Plan. This document was filed as Exhibit 10.1 to the Company's Current Report on Form 8-K (Commission file number 001-31429) dated March 12, 2018 and is incorporated herein by reference.
Exhibit 10.4* — Form of Stock Option Agreement.
Exhibit 10.5* — Form of Restricted Stock Unit Agreement (Domestic).
88
Exhibit 10.6* — Form of Restricted Stock Unit Agreement (Director).
Exhibit 10.7* — Form of Restricted Stock Unit Agreement (International).
Exhibit 10.8 — The 2013 Valmont Executive Incentive Plan. This document was filed as Exhibit 10.2 to the Company’s Current Report on Form 8-K (Commission file number 001-31429) dated April 30, 2013 and is incorporated herein by reference.
Exhibit 10.9 — The Amended Unfunded Deferred Compensation Plan for Nonemployee Directors. This document was filed as Exhibit 10.15 to the Company's Annual Report on Form 10-K (Commission file number 001-31429) for the fiscal year ended December 28, 2013 and is incorporated herein by this reference.
Exhibit 10.10 — VERSP Deferred Compensation Plan. This document was filed as Exhibit 10.16 to the Company's Annual Report on Form 10-K (Commission file number 001-31429) for the fiscal year ended December 28, 2013 and is incorporated herein by this reference.
Exhibit 21* — Subsidiaries of the Company.
Exhibit 22.1 List of Issuer and Guarantor Subsidiaries. This document was filed as Exhibit 22.1 to the Company’s Quarterly Report on Form 10-Q (Commission file number 001-31429) for the quarter ended September 25, 2021 and is incorporated herein by reference.
Exhibit 23* — Consent of Deloitte & Touche LLP.
Exhibit 24* — Power of Attorney.
Exhibit 31.1* — Section 302 Certification of Chief Executive Officer.
Exhibit 31.2* — Section 302 Certification of Chief Financial Officer.
Exhibit 32.1* — Section 906 Certifications.
Exhibit 101 — The following financial information from the Company’s Annual Report on Form 10-K for the year ended December 25, 2021, formatted in Inline XBRL (eXtensible Business Reporting Language): (i) the Consolidated Statements of Earnings, (ii) the Consolidated Statements of Comprehensive Income,(iii) the Consolidated Balance Sheets, (iv) the Consolidated Statements of Cash Flows, (v) the Consolidated Statements of Shareholders’ Equity, (vi) Notes to Consolidated Financial Statements, and (vii) document and entity information.
Exhibit 104 — Cover Page Interactive File (formatted as Inline XBRL and contained in Exhibit 101)_____________________________________________
* Filed herewith
Pursuant to Item 601(b)(4) of Regulation S-K, certain instruments with respect to the registrant’s long-term debt are not filed with this Form 10-K. Valmont will furnish a copy of such long-term debt agreements to the Securities and Exchange Commission upon request.
Management contracts and compensatory plans are set forth as Exhibits 10.1 through 10.10.
89

ITEM 16. FORM 10-K SUMMARY
Not Applicable.
90

SIGNATURESPursuant to the requirements of Section 13 or 15(d) of the Securities Exchange Act of 1934, the registrant has duly
caused this report to be signed on its behalf by the undersigned, thereunto duly authorized, on the the 23rd day of February, 2022.
Valmont Industries, Inc.
By: /s/ STEPHEN G. KANIEWSKIStephen G. Kaniewski
President and Chief Executive Officer
Pursuant to the requirements of the Securities Exchange Act of 1934, this report has been signed below by the following persons on behalf of the registrant and in the capacities indicated and on the dates indicated.
/s/ STEPHEN G. KANIEWSKIDirector, President and Chief Executive Officer (Principal Executive Officer) 2/23/2022
Stephen G. Kaniewski
/s/ AVNER M. APPLBAUMExecutive Vice President and Chief Financial Officer (Principal Financial Officer) 2/23/2022
Avner M. Applbaum
/s/ TIMOTHY P. FRANCISSenior Vice President and Controller (Principal Accounting Officer) 2/23/2022
Timothy P. Francis
Mogens C. Bay* James B. Milliken* K.R. den Daas* Daniel P. Neary* Ritu C. Favre* Catherine J. Paglia* Theo W. Freye* Clark T. Randt, Jr.* Richard A. Lanoha* Joan Robinson-Berry*
Signature Title Date
______________________________________________
* Stephen G. Kaniewski, by signing his name hereto, signs the Annual Report on behalf of each of the directors indicated on this the 23rd day of February, 2022. A Power of Attorney authorizing Stephen G. Kaniewski to sign the Annual Report on Form 10-K on behalf of each of the indicated directors of Valmont Industries, Inc. has been filed herein as Exhibit 24.
By: /s/ STEPHEN G. KANIEWSKIStephen G. KaniewskiAttorney-in-Fact
91

[This page intentionally left blank]

[This page intentionally left blank]

[This page intentionally left blank]


Copyright © 2022 FDOKUMEN