Climate Change and the Cost of Conserving Species in Madagascar
12
Conservation Focus Climate Change and the Cost of Conserving Species in Madagascar JONAH BUSCH, ∗ ‡ RADHIKA DAVE, ∗ LEE HANNAH, ∗ ALISON CAMERON,† ANDRIAMBOLANTSOA RASOLOHERY,‡ PATRICK ROEHRDANZ,§ AND GEORGE SCHATZ ∗∗ ∗ Science and Knowledge Division, Conservation International, Arlington, VA, 2011 Crystal Drive, Suite 500, Arlington, VA 22202, U.S.A. †School of Biological Sciences, Queen’s University Belfast. 97 Lisburn Road, Belfast BT9 7BL, Northern Ireland ‡Africa and Madagascar Field Division, Conservation International, Explorer Business Park, Batiment C2. Antananarivo 101, Madagascar §Bren School of Environmental Science and Management, University of California, Santa Barbara, CA 93117, U.S.A. ∗∗ Research Division, Missouri Botanical Garden, P.O. Box 299, St. Louis, MO 63166, U.S.A. Abstract: We examined the cost of conserving species as climate changes. We used a Maxent species distribu- tion model to predict the ranges from 2000 to 2080 of 74 plant species endemic to the forests of Madagascar under 3 climate scenarios. We set a conservation target of achieving 10,000 ha of forest cover for each species and calculated the cost of achieving this target under each scenario. We interviewed managers of projects to restore native forests and conducted a literature review to obtain the net present cost per hectare of manage- ment actions to maintain or establish forest cover. For each species, we added hectares of land from lowest to highest cost per additional year of forest cover until the conservation target was achieved throughout the time period. Climate change was predicted to reduce the size of species’ ranges, the overlap between species’ ranges and existing or planned protected areas, and the overlap between species’ ranges and existing forest. As a re- sult, climate change increased the cost of achieving the conservation target by necessitating successively more costly management actions: additional management within existing protected areas (US$0–60/ha); avoid- ance of forest degradation (i.e., loss of biomass) in community-managed areas ($160–576/ha); avoidance of deforestation in unprotected areas ($252–1069/ha); and establishment of forest on nonforested land within protected areas ($802–2710/ha), in community-managed areas ($962–3226/ha), and in unprotected areas ($1054–3719/ha). Our results suggest that although forest restoration may be required for the conservation of some species as climate changes, it is more cost-effective to maintain existing forest wherever possible. Keywords: adaptation, biodiversity conservation, deforestation, forest restoration Cambio Clim´ atico y el Costo de la Conservaci´ on de Especies en Madagascar Resumen: Para examinar el costo de la conservaci´ on de especies a medida que cambia el clima, utilizamos un modelo Maxent de distribuci´ on de especies para predecir los rangos de distribuci´ on 2000–2080 de 74 especies de plantas end´ emicas a los bosques de Madagascar bajo 3 escenarios. Definimos como meta de conservaci´ on alcanzar 10,000 ha de bosque para cada especie y calculamos el costo de alcanzar esta meta en cada escenario. Entrevistamos gestores de proyectos de restauraci´ on de especies nativas en los bosques y revisamos la literatura para obtener el costo neto actual por hect´ area de las acciones de manejo para mantener o establecer la cobertura forestal. Para cada especie, agregamos hect´ areas de terreno desde el costo m´ as bajo al m´ as alto por a˜ no adicional de cobertura forestal hasta que se alcanzaba el objetivo de conservaci´ on en el per´ ıodo de tiempo. Se predijo que el cambio clim´ atico reducir´ ıa la extensi´ on de la distribuci´ on de especies, del traslape de rangos de especies y de las ´ areas protegidas existentes o planificadas, y ‡email [email protected] Paper submitted November 05, 2010; revised manuscript accepted October 09, 2011. 1 Conservation Biology, Volume 00, No. **, ***–*** C 2012 Society for Conservation Biology DOI: 10.1111/j.1523-1739.2012.01838.x
Transcript of Climate Change and the Cost of Conserving Species in Madagascar

Conservation Focus
Climate Change and the Cost of Conserving Species inMadagascarJONAH BUSCH,∗‡ RADHIKA DAVE,∗ LEE HANNAH,∗ ALISON CAMERON,†ANDRIAMBOLANTSOA RASOLOHERY,‡ PATRICK ROEHRDANZ,§ AND GEORGE SCHATZ∗∗∗Science and Knowledge Division, Conservation International, Arlington, VA, 2011 Crystal Drive, Suite 500, Arlington, VA 22202,U.S.A.†School of Biological Sciences, Queen’s University Belfast. 97 Lisburn Road, Belfast BT9 7BL, Northern Ireland‡Africa and Madagascar Field Division, Conservation International, Explorer Business Park, Batiment C2. Antananarivo 101,Madagascar§Bren School of Environmental Science and Management, University of California, Santa Barbara, CA 93117, U.S.A.∗∗Research Division, Missouri Botanical Garden, P.O. Box 299, St. Louis, MO 63166, U.S.A.
Abstract: We examined the cost of conserving species as climate changes. We used a Maxent species distribu-tion model to predict the ranges from 2000 to 2080 of 74 plant species endemic to the forests of Madagascarunder 3 climate scenarios. We set a conservation target of achieving 10,000 ha of forest cover for each speciesand calculated the cost of achieving this target under each scenario. We interviewed managers of projects torestore native forests and conducted a literature review to obtain the net present cost per hectare of manage-ment actions to maintain or establish forest cover. For each species, we added hectares of land from lowest tohighest cost per additional year of forest cover until the conservation target was achieved throughout the timeperiod. Climate change was predicted to reduce the size of species’ ranges, the overlap between species’ rangesand existing or planned protected areas, and the overlap between species’ ranges and existing forest. As a re-sult, climate change increased the cost of achieving the conservation target by necessitating successively morecostly management actions: additional management within existing protected areas (US$0–60/ha); avoid-ance of forest degradation (i.e., loss of biomass) in community-managed areas ($160–576/ha); avoidance ofdeforestation in unprotected areas ($252–1069/ha); and establishment of forest on nonforested land withinprotected areas ($802–2710/ha), in community-managed areas ($962–3226/ha), and in unprotected areas($1054–3719/ha). Our results suggest that although forest restoration may be required for the conservationof some species as climate changes, it is more cost-effective to maintain existing forest wherever possible.
Keywords: adaptation, biodiversity conservation, deforestation, forest restoration
Cambio Climatico y el Costo de la Conservacion de Especies en Madagascar
Resumen: Para examinar el costo de la conservacion de especies a medida que cambia el clima, utilizamosun modelo Maxent de distribucion de especies para predecir los rangos de distribucion 2000–2080 de 74especies de plantas endemicas a los bosques de Madagascar bajo 3 escenarios. Definimos como meta deconservacion alcanzar 10,000 ha de bosque para cada especie y calculamos el costo de alcanzar esta metaen cada escenario. Entrevistamos gestores de proyectos de restauracion de especies nativas en los bosquesy revisamos la literatura para obtener el costo neto actual por hectarea de las acciones de manejo paramantener o establecer la cobertura forestal. Para cada especie, agregamos hectareas de terreno desde elcosto mas bajo al mas alto por ano adicional de cobertura forestal hasta que se alcanzaba el objetivode conservacion en el perıodo de tiempo. Se predijo que el cambio climatico reducirıa la extension de ladistribucion de especies, del traslape de rangos de especies y de las areas protegidas existentes o planificadas, y
‡email [email protected] submitted November 05, 2010; revised manuscript accepted October 09, 2011.
1Conservation Biology, Volume 00, No. **, ***–***C©2012 Society for Conservation BiologyDOI: 10.1111/j.1523-1739.2012.01838.x

2 Climate and Conservation in Madagascar
el traslape entre los rangos de especies y el bosque existente. Como resultado, el cambio climatico incrementoel costo para alcanzar la meta de conservacion al requerir de acciones sucesivas de manejo cada vez mascostosas: manejo adicional dentro de areas protegidas existentes (US$0–60/ha); evitar la deforestacion enareas no protegidas ($252–1069/ha); establecimiento de bosque en terrenos no forestales dentro de areasprotegidas ($802–2710/ha), en areas manejadas por la comunidad ($962–3226/ha), y en areas no protegidas($1054–3719/ha). Nuestros resultados sugieren que, aunque se puede requerir la restauracion de bosquespara la conservacion de algunas especies a medida que cambia el clima, es mas rentable mantener el bosqueexistente donde sea posible.
Palabras Clave: adaptacion, conservacion de la biodiversidad, deforestacion, restauracion de bosques
Introduction
New temperature and precipitation patterns associatedwith climate change are expected to shift species’ ranges(Peters & Darling 1985; Parmesan 1996). Species withcurrent ranges that overlap protected areas may move toareas where their habitat is unprotected (Araujo et al.2004). Species’ survival in future climates (Thomas et al.2004; Sinervo et al. 2010) and strategies for conservingspecies as climate changes (Hannah et al. 2007) havebeen explored previously. Researchers have begun toexamine the cost of conservation in a changing climate(Shaw et al. 2012; Wise et al. 2012).
To protect the many endemic species of Madagascar(Myers et al. 2000; Goodman & Benstead 2005), the gov-ernment committed at the World Parks Congress in 2003to tripling the area covered by the country’s networks ofterrestrial and marine protected areas by 2012. This ex-pansion is underway. Bilateral and multilateral agenciesand conservation groups have provided over US$150 mil-lion to Madagascar for conservation since 1997 (WorldBank 2008a), including funds for the expansion of pro-tected areas.
Although the planned protected-area network encom-passes current habitat for endemic species (Kremen et al.2008), the long-term success of the network depends onthe extent to which it will continue to provide habitatgiven changes in climate and land use. Movements ofmontane endemic amphibians and reptiles to higher el-evations have already been observed in Madagascar andare consistent with predictions of species’ responses toincreasing temperatures (Raxworthy et al. 2008). Somespecies may be unable to move as the distribution of theirhabitat changes, particularly where anthropogenic landuse has created barriers between areas of habitat.
The resilience of Madagascar’s terrestrial species to cli-mate change depends on the maintenance and restora-tion of the forest that serves as their habitat. Recom-mended actions to reduce the effect of climate changeon Madagascar’s terrestrial species include facilitatingneeded changes in species’ ranges by reducing deforesta-tion in remaining natural forests, restoring connectivitybetween isolated forest fragments, and restoring naturalforests along rivers. It is also recommended that forestmanagement provide for human adaptation to climatechange (Hannah et al. 2008).
Conservation in Madagascar takes place in the contextof widespread poverty, which is both a cause and a conse-quence of forest loss. Eighty-five percent of Madagascar’spopulation survives on <US$2/d (World Bank 2008b),and approximately 80% of Madagascar’s population livesin rural areas and relies on subsistence agriculture (Kistler& Spack 2003). Shifting slash-and-burn cultivation of rice,known as tavy, is a main driver of deforestation through-out much of Madagascar (Erdmann 2003). Furthermore,the 17 million Malagasy consume 22 million m3 of woodannually for cooking and construction (Rabenandrasana2007). Due to these and other human activities, forestcover in Madagascar decreased by almost 40% from the1950s to 2000 (Harper et al. 2007) and by 4.3% from 2000to 2010 (FAO 2010). Today 16% of Madagascar is coveredby fragments of natural forest (MEFT et al. 2009), reducedfrom 28% in the 1950s (Harper et al. 2007). Loss of for-est has led to soil erosion and sedimentation of streamsand rivers. Protected areas encompass forests at the head-waters of rivers that provide 8.4 million m3 of drinkingwater and irrigation water for 431,000 ha of cropland(Carret & Loyer 2003). Loss of habitat for charismaticfauna such as lemurs and chameleons affects Madagas-car’s tourism industry, which provides a substantial por-tion of the country’s employment and income (a reported5.1% of jobs and 6.3% of gross domestic product) (WTTC2008).
Given this widespread dependence on natural re-sources, conservation plans in Madagascar generally in-clude a focus on poverty alleviation. Most protectedareas established since 2003 are comanaged by thenational government and local communities and corre-spond to the International Union for Conservation ofNature (IUCN) protected-area categories V and VI (pro-tected landscape and protected area with sustainable useof natural resources, respectively). Conversion of forestsfor agricultural use is prohibited in these areas, but ex-traction of timber and non-timber products for local useis permitted. Many new conservation projects focus onforest restoration, which can provide income and natu-ral resources to communities, or on commodity substitu-tion, which aims to provide communities with a supply ofwood products (e.g., firewood and charcoal) from plan-tation forests rather than native forests.
We estimated the costs associated with conservingplant species endemic to the forests of Madagascar as
Conservation BiologyVolume 00, No. **, 2012

Busch et al. 3
climate changes. We focused on the maintenance andestablishment of forest that serves as habitat for thosespecies. Given the potential for conservation projectsto alleviate poverty, we focused on restoration of na-tive forests, commodity substitution, and managementof the planned protected-area network. A common andrealistic conservation target is to secure the minimumarea of habitat necessary to ensure a species’ persis-tence. We applied this target to 74 plant species en-demic to Madagascar. We calculated the cost of achiev-ing this target for each species for 4 time intervals(2000, 2000–2020, 2000–2050, and 2000–2080) andfor 3 scenarios of greenhouse-gas emissions (no cli-mate change, low greenhouse-gas emission increases,and business-as-usual increases in greenhouse-gasemissions).
Methods
We obtained spatial projections of climate in Madagascarfor 2000 from WorldClim (2011) (30 arc-second resolu-tion [approximately 900 × 900 m]). We obtained climateprojections for 2020, 2050, and 2080 for the A2a scenarioof the Fourth Assessment Report of the Intergovernmen-tal Panel on Climate Change (IPCC), in which annualgreenhouse-gas emissions continue to accelerate alonga “business as usual” pathway, and the B2a scenario,in which annual greenhouse-gas emissions are loweredrelative to the business-as-usual pathway (IPCC 2007),from the Hadley Centre’s HadCM3 Coupled Atmospheric-Oceanic General Circulation Model (Johns et al. 2003).The HadCM3 model of the business-as-usual emissionsscenario projects that decadal mean surface temperaturesin Madagascar will increase by 3.1 ◦C above the preindus-trial level by 2080 and average precipitation will decreaseby 10% overall with regional variation. The HADCM3model of the low-emissions scenario projects that decadalmean surface temperatures in Madagascar will increaseby 2.2 ◦C by 2080 and average precipitation across Mada-gascar will decrease by 4% overall with regional variation.In a counterfactual scenario (no climate change), we helddecadal mean temperature and precipitation from 1950to 2000 constant through 2080. We compared these re-sults with results obtained under 2 alternative general cir-culation models produced by the Commonwealth Scien-tific and Industrial Research Organisation, Australia (Gor-don et al. 2002), and the Canadian Center for ClimateModelling and Analysis (Flato et al. 2000).
We used Maxent (Phillips et al. 2006; Phillips & Dudik2008) to model the distributions of 74 species of plantsendemic to Madagascar in each time period given each cli-mate scenario. All species were woody shrubs or trees as-sociated with primary forest or woody ecosystems; noneregenerate in secondary vegetation. All species occurredin at least 7 locations (G.S. et al., unpublished). We se-
lected species to represent all primary woody vegetationtypes (humid forest, subhumid forest, dry forest, and sub-arid forest, bushland, and thicket), with the exception ofthose in the montane bioclimatic zone. In addition, we se-lected species to maximize representation of endemismat higher taxonomic levels. Sixty of the 74 species aremembers of endemic genera and 42 are members of en-demic families.
We used 9 climate variables to project species ranges(Kremen et al. 2008). We also included as a continu-ous variable percent forest cover in 2000 (30 arc-secondgrid resolution derived from forest cover change maps at28-m resolution) (Harper et al. 2007). We assumed per-cent forest cover remained constant in future periods.Projections of future species ranges were constrained bycurrent values of climate variables across Madagascar, sowe did not make projections for locations where futurevalues of climate variables exceeded current values. Suchlocations represented <2% of land area by 2080 in thelow-emissions scenario and <4% of land area by 2080 inthe business-as-usual emissions scenario.
We divided the land surface of Madagascar into736,280 grid cells with a resolution of 30 arc second.For each cell, we calculated the area of land in each of 6land management classes on the basis of 2 classes of forestcover (forest and nonforest) (Harper et al. 2007) and 3classes of protected status (protected areas managed forbiological diversity; community-managed areas managedjointly by government and communities for extractionof wood by the community; and unprotected land out-side protected areas). We classified the protection statusof existing and proposed protected areas (Governmentof Madagascar 2008) on the basis of these areas’ IUCNprotected-area categories. We classified all proposed pro-tected areas as community managed.
For each of the 6 classes of land management, we es-timated the per-hectare cost of maintaining or establish-ing a stable area of native forest cover on the basis ofinterviews and gray literature (described later). We con-sidered native forest cover stable if it occurred within aprotected area or within a community-managed area inwhich deforestation (the conversion of forest to nonfor-est) and forest degradation (loss of biomass within forestthat is not converted) is avoided through management ac-tions. We assumed that any native forest outside of suchprotected areas or community-managed areas would becleared by 2080 and that nonforested areas would not be-come forest in the absence of human intervention. We as-sumed that native forest established on nonforested landwas equivalent to mature native forest over the temporalextent of analyses. The spatial configuration of forest didnot affect its designation as stable. To account for uncer-tainties in cost estimation, we estimated both a high andlow per-hectare cost for each land management class.We converted all costs to net present 2008 U.S. dollarsto compare the costs of management actions occurring
Conservation BiologyVolume 00, No. **, 2012

4 Climate and Conservation in Madagascar
Table 1. Net present cost per hectare of maintaining or establishing native forest cover with current classes of land management.
Land manage-ment class
Additionalmanagement
within protectedareas ($/ha)a
Wood-productsubstitution
($/ha)b
Establishingcommunity
management($/ha)c
Wood oragricultural
productsubstitution
($/ha)d
Native forestrestoration
($/ha)e Total ($/ha)
Forest inprotected area
0–60 – – – – 0–60
Forest in community-managed arealand acquisition 0–311plantation 160–265total – 160–576 160–576
Forest outsidemanaged area
– – 92–189 160–880 – 252–1069
Nonforest in protected areaf
start-up 105–229recurring 697–2421total 0–60 – – – 802–2650 802–2710
Nonforest in community-managed areaf
land acquisition 0–311plantation 160–265start-up 105–229Recurring 697–2421total – 160–576 – – 802–2650 962–3226
Nonforest outside managed areastart-up 105–229recurring 697–2421total – – 92–189 160–880 802–2650 1,054–3719
aCarret and Loyer (2003).bLopez et al (2007), Rabenandrasana et al. (2007), and authors’ calculations (see Methods).cMeyers et al (2005) and authors’ calculations (see Methods).dLopez et al (2007), B. Minten (unpublished), and authors’ calculations (see Methods).ePrimary survey research conducted for this paper.f Start-up costs: costs of obtaining land rights, community consultation, and scientific research; recurring costs: costs of labor, trees, materials,maintenance, transportation, training, and administration.
at different times (Supporting Information). Dependingon an area’s current land management class, the cost ofmaintaining or establishing native forest cover includedrestoration of native forest, avoided forest degradation,avoided deforestation, or additional management withinprotected areas (Table 1).
On nonforested land, we estimated the per-hectarecost of forest restoration by interviewing the managers of13 projects to restore native forests. We identified restora-tion projects through discussions with more than 30 ex-perts in the government, bilateral aid agencies, and non-governmental organizations. We conducted in-person in-terviews with project managers in July and August 2008.We asked project managers to state total and component(e.g., obtaining land rights, community consultation, andscientific research) costs of initiating the project and totaland component (e.g., labor, trees and materials, mainte-nance, transportation, training, and administration) re-curring costs. When both budgeted and incurred costsper hectare were available for the same project, we used
the incurred costs. The survey instrument is in Support-ing Information.
Per-hectare net present costs of restoration of nativeforest ranged from $291/ha to $20,000/ha (median cost$1,521/ha). The wide variation across projects in the per-hectare cost of restoration can be explained by differ-ences in forest type, soil type, distance between restora-tion site and mature forest, density of trees planted perhectare, use of local labor, and years since project estab-lishment. To account for the range of costs while provid-ing estimates that are insensitive to outlying values, weselected the 25th percentile costs ($802/ha) and 75thpercentile costs ($2650/ha) for the low-cost and high-cost scenarios. Start-up costs and recurring costs were$105–229/ha and $697–2421/ha, respectively.
In community-managed areas, we assumed degradationof native forests could be avoided by substituting woodproducts that local people obtain from native forests(construction materials, firewood, and charcoal) with thesame products from plantation forests. We assumed the
Conservation BiologyVolume 00, No. **, 2012

Busch et al. 5
values of wood products from native forests and plan-tation forests were equal. We calculated the per-hectarecost of avoiding degradation in native forests throughwood-product substitution as
CAD = XNF
XP (C P + CLA), (1)
where CAD is per-hectare cost of avoiding degradationof native forest, CP is the net present cost per hectareof planting and replanting a plantation forest (e.g., at 5-year intervals [Lopez et al. 2007]), CLA is the cost ofacquiring land for plantation forestry, XNF is the annualquantity of usable wood per hectare of native forest, andXP is the annual quantity of usable wood per hectare ofplantation forest. In the low-cost scenario, we derivedplantation costs and wood quantity through analyses of aEucalyptus camaldulensis wood-substitution program inthe Antsiranana (Diego Suarez) dry-forest region (Lopezet al. 2007). We used CP = $1097/ha, CLA = $0/ha, andXNF/XP = 0.146 to calculate the low per-hectare costof avoiding degradation through wood-product substitu-tion: $160/ha.
In the high-cost scenario, we derived plantation costsfrom analyses of a wood-substitution program that usedAcacia mangium, Casuarina equisetifolia, E. camald-ulensis, and Eucalyptus robusta in the Toalagnaro (Ft.Dauphin) wet-forest region (Rabenandrasana 2007). Weused CP = $750/ha, CLA = $880/ha, and XNF/XP = 0.354to calculate the high per-hectare cost of avoiding degrada-tion through wood-product substitution: $265/ha. In thelow-cost scenario, we assumed the cost of land acquisi-tion would be zero due to a sufficient quantity of nonfor-est land available for plantation forestry within market dis-tance, for example from within the community-managedarea itself. In the high-cost scenario we assumed suchland would have to be acquired at a cost of agriculturalproduct substitution (explained later).
In unprotected areas, we assumed deforestation couldbe avoided through the provision of agricultural productsto local communities as a substitute for either gatheringof wood products or production of rice. The low-costestimate of avoided deforestation included only substitu-tion for wood products, as described earlier. The high-cost estimate included only substitution for rice produc-tion. We based the cost of rice substitution on the resultsof a study in the Maraonsetra region that showed a netpresent value of farmers’ median annual stated willing-ness to accept payment in rice in exchange for ceasingtavy practices of $880/ha (B. Minten, unpublished). Inthe absence of comparable studies elsewhere in Mada-gascar, we assumed this figure was representative of theentire country.
The per-hectare cost of maintaining stable native forestin unprotected areas also included the cost of establishingcommunity management. We derived cost estimates forthe establishment of community management in Mada-
gascar from Meyers et al. (2005), who found low and highcosts for management of a medium-sized (2,000–20,000ha) conservation site to be $7.38–15.15/ha annually, cor-responding to net present costs of $92–189/ha.
The per-hectare cost of maintaining a stable area ofnative forest within protected areas was the currentlyunmet, relatively minor, cost of additional managementactivities such as monitoring and enforcement. In thelow-cost scenario, we assumed these costs were zero(all costs currently met). In the high-cost scenario, weassumed an annual cost of $5/ha (net present cost of$60/ha), which we derived from a study of costs ofprotected-area management (Carret & Loyer 2003).
Per-Species Cost of Achieving Stable Area of NativeForest
For each species, we calculated the network of sitesacross which more than 10,000 ha (100 km2) of stablenative forest could be maintained or established withinthe species’ range—during each time step of 4 succes-sively longer time periods 2000, 2000–2020; 2000–2050;2000–2080). Plant species with <10,000 ha of habitatare classified as “very restricted” by IUCN (2011). Weused the 10,000-ha target for all plant species and as-sumed all forest types were equivalent.With millions ofsites, it is analytically intractable to solve for the net-work of sites that provides the minimum area of sta-ble cover of native forest at the lowest cost. Thus, weused a simple (greedy) algorithm that added sites tothe network from lowest to highest cost per additionaltime steps of forest gained until the minimum area ofnative forest was achieved in all time steps. This algo-rithm did not explicitly require that patches of forestincluded in the network be contiguous or have a mini-mum size. That is, sites were rank-ordered for addition tothe network on the basis the following cost-benefit ratio
ci∑t
t=2000 Ai xist pst
, (2)
where ci is the cost of maintaining or establishing na-tive forest cover at site i ($0–60 for forest in protectedareas; $160–576 for forest in community-managed areas;$252–1069 for forest in unprotected areas; $802–2710for nonforest in protected areas; $962–3226 for nonfor-est in community-managed areas; and $1074–3719 fornonforest in unprotected areas); Ai is the area of site i;xist is a binary variable equal to one if site i is within therange of species s in time step t and equal to zero other-wise; pst is a binary variable that is equal to one if species shas <10,000 ha of stable forest in time step t and equal tozero otherwise; and t is the final time step in the analyzedtime period T (where t ∈ {2000, 2020, 2050, 2080} andT ∈{2000, 2000–2020, 2000–2050, 2000–2080}). We
Conservation BiologyVolume 00, No. **, 2012
6 Climate and Conservation in Madagascar
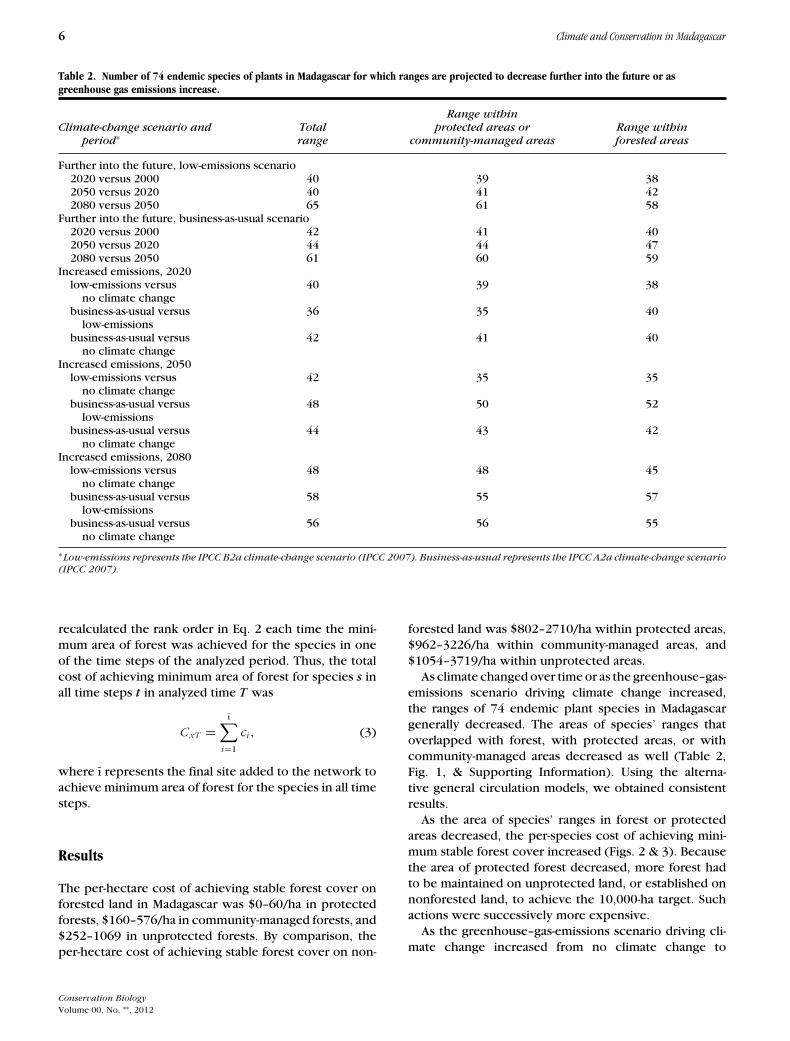
Table 2. Number of 74 endemic species of plants in Madagascar for which ranges are projected to decrease further into the future or asgreenhouse gas emissions increase.
Climate-change scenario andperiod∗
Totalrange
Range withinprotected areas or
community-managed areasRange withinforested areas
Further into the future, low-emissions scenario2020 versus 2000 40 39 382050 versus 2020 40 41 422080 versus 2050 65 61 58
Further into the future, business-as-usual scenario2020 versus 2000 42 41 402050 versus 2020 44 44 472080 versus 2050 61 60 59
Increased emissions, 2020low-emissions versus
no climate change40 39 38
business-as-usual versuslow-emissions
36 35 40
business-as-usual versusno climate change
42 41 40
Increased emissions, 2050low-emissions versus
no climate change42 35 35
business-as-usual versuslow-emissions
48 50 52
business-as-usual versusno climate change
44 43 42
Increased emissions, 2080low-emissions versus
no climate change48 48 45
business-as-usual versuslow-emissions
58 55 57
business-as-usual versusno climate change
56 56 55
∗Low-emissions represents the IPCC B2a climate-change scenario (IPCC 2007). Business-as-usual represents the IPCC A2a climate-change scenario(IPCC 2007).
recalculated the rank order in Eq. 2 each time the mini-mum area of forest was achieved for the species in oneof the time steps of the analyzed period. Thus, the totalcost of achieving minimum area of forest for species s inall time steps t in analyzed time T was
CxT =ı∑
i=1
ci , (3)
where ı represents the final site added to the network toachieve minimum area of forest for the species in all timesteps.
Results
The per-hectare cost of achieving stable forest cover onforested land in Madagascar was $0–60/ha in protectedforests, $160–576/ha in community-managed forests, and$252–1069 in unprotected forests. By comparison, theper-hectare cost of achieving stable forest cover on non-
forested land was $802–2710/ha within protected areas,$962–3226/ha within community-managed areas, and$1054–3719/ha within unprotected areas.
As climate changed over time or as the greenhouse–gas-emissions scenario driving climate change increased,the ranges of 74 endemic plant species in Madagascargenerally decreased. The areas of species’ ranges thatoverlapped with forest, with protected areas, or withcommunity-managed areas decreased as well (Table 2,Fig. 1, & Supporting Information). Using the alterna-tive general circulation models, we obtained consistentresults.
As the area of species’ ranges in forest or protectedareas decreased, the per-species cost of achieving mini-mum stable forest cover increased (Figs. 2 & 3). Becausethe area of protected forest decreased, more forest hadto be maintained on unprotected land, or established onnonforested land, to achieve the 10,000-ha target. Suchactions were successively more expensive.
As the greenhouse–gas-emissions scenario driving cli-mate change increased from no climate change to
Conservation BiologyVolume 00, No. **, 2012

Busch et al. 7
Figure 1. Species’ projected range sizes under 3 climate-change scenarios. Species are rank ordered from smallestto largest area across x-axis. Color indicates the area of range size within each land management class.
low-emissions to business-as-usual emission increases,the cost of achieving the conservation target increased.The median per-species cost of achieving the minimumarea of stable forest cover increased from $0–603,400to $0–604,100 to $0–604,500 for 2000–2020; from$0–603,400 to $0–604,500 to $847,000–3,782,000 for2000–2050; and $0–603,400 to $935,900–4,094,600 to$1,242,000–5,192,300 for 2000–2080 (Figs. 2 & 3). Therange of costs reflected low and high cost assumptions.As the length of time over which minimum area of stableforest cover must be maintained increased (from 2000to 2000–2020 to 2000–2050 to 2000–2080), the cost ofachieving the conservation target increased. The medianper-species cost of securing minimum stable forest coverincreased from $0–603,400 to $0–604,100 to $0–604,500to $935,900–4,094,600 in the low-emissions scenario andfrom $0–603,400 to $0–604,500 to $847,000-$3,782,000to $1,242,000–5,192,300 in the business-as-usual emis-sion increases scenario.
Discussion
We found that maintaining existing forest, for exampleby avoiding forest degradation and deforestation throughthe creation of substitute sources of wood products andagricultural commodities, was considerably cheaper andquicker to apply than restoring forest once it had beencleared.
As climate changed over time, or as thegreenhouse–gas-emissions scenario driving climatechange increased, the ranges of the 74 forest-associatedplant species shifted, the area of range overlap withprotected areas decreased, and the area of range overlapwith existing forest decreased. Thus, the cost of man-agement actions necessary to maintain a minimum areaof stable forest cover increased.
Climate change imposes 5 additional costs on the con-servation of species. First is the cost of planning to designa network of sites that will maintain a stable area of habitat
Conservation BiologyVolume 00, No. **, 2012

8 Climate and Conservation in Madagascar
Figure 2. Cost of achieving a minimum area of native forest with low cost assumptions under 3 climate-changescenarios. Species are rank ordered from smallest to largest cost across x-axis. Color indicates the portion of thecost spent for each class of land management.
for species given future range shifts as climate changes.Planning may change the locations selected for manage-ment actions without increasing the cost of actions. Forthe Za baobab (Adansonia za) (Fig. 4a), a widespreadspecies classified by IUCN (2011) as near threatened, thecost of achieving a minimum area of stable forest coverwith forests in protected areas did not change.
Second is the cost of extending management actionsacross a larger area. Even for species for which rel-atively large portions of their ranges were protectedin every time step, ranges shifted and range overlapwith protected areas decreased. This means managementacross a larger total area would be necessary to achieve10,000 ha of stable forest cover from 2000 through2080. For the octopus tree (Alluaudiopsis marnieri-ana) (Fig. 4b), a spiny succulent of the semiarid to sub-arid spiny forest of southern Madagascar whose tradeis regulated by the Convention on International Trade
in Endangered Species of Wild Fauna and Flora (CITES)(IUCN 2011), costs increased given climate change be-cause larger areas of protected forest are required toachieve a minimum area of stable forest cover throughtime.
Third is the cost of maintaining forest outside currentlyprotected or community-managed areas. Because climatechange decreased the size of species’ ranges within pro-tected or community-managed forest, maintaining forestin unprotected areas became increasingly necessary toachieve the target of 10,000 ha of stable forest cover.Maintaining forest was more expensive in unprotectedareas than in protected or community-managed areas.For the hazompasina (Rhodolaena acutifolia) (Fig. 4c),a flowering species with a restricted range that occurs atrelatively low elevation in evergreen forest (IUCN 2011),costs increased given climate change as forest outsideprotected areas or community-managed areas became
Conservation BiologyVolume 00, No. **, 2012

Busch et al. 9
Figure 3. Cost of achieving a minimum area of native forest with high cost assumptions under 3 climate-changescenarios. Species are rank-ordered from smallest to largest cost across x-axis. Color indicates the portion of thecost spent for each class of land management.
necessary to achieve a minimum area of stable forestcover.
Fourth is the cost of establishing forest on nonforestedland. Because climate change decreased the size ofspecies’ ranges within forest, establishing native forestthrough reforestation or afforestation became increas-ingly necessary to achieve the 10,000-ha target. Establish-ing new forest was more expensive than maintaining ex-isting forest. For the Scott-Elliot capuron (Rhopalocarpuscoriaceus), a tree associated with littoral forest (IUCN2011), costs increased under the low-emissions scenariobecause achieving a minimum area of stable forest coverrequired establishment of new forest in addition to themaintenance of current forest (Fig. 4d).
Fifth is the cost of intensive species management orex situ conservation. When climate change decreasedthe sizes of species’ ranges below 10,000 ha, the tar-get for area of stable forest cover was not met throughforest maintenance or restoration alone at any cost. We
did not calculate the costs of intensive species manage-ment or ex situ conservation, but these costs are likelyto be greater than forest maintenance or restoration. Forthe Scott-Elliot capuron, the target could not be met un-der the business-as-usual increase in emissions scenario(Fig. 4d). For the endra-endra (Humbertia madagas-cariensis), a tree in low-elevation humid forests (IUCN2011), the target could not be met under either the low-emissions or the business-as-usual increase in emissionsclimate-change scenarios (Fig. 4e).
Our results showed that lower greenhouse-gas emis-sions reduce the cost of species conservation. Somelevel of climate change is inevitable. However, concertedglobal efforts to reduce emissions of greenhouse gasescould shift climate change from its current trajectory,which is most similar to the business-as-usual emissionsincreases scenario, to a trajectory more similar to the low-emissions scenario. Our results indicate that such a shiftwould lower the median cost of achieving a minimum
Conservation BiologyVolume 00, No. **, 2012

10 Climate and Conservation in Madagascar
Figure 4. Cost of achieving a minimum area of native forest with high cost assumptions under 3 climate-changescenarios for 5 species (a–e). Color indicates the portion of cost spent within each class of land management.
area of stable forest cover through 2080 for an endemicplant species in Madagascar from $1,242,000–5,192,300to $935,900–4,094,600 and would decrease the num-ber of species for which intensive managementor ex situ conservation may be required from11 to 8.
A number of caveats apply to our estimates of the costof restoration of native forest. The number of restora-tion projects from which we derived cost estimates wassmall (n = 13). Costs were self-reported. Projects werefrequently located at the most suitable or cheapest sitesfor restoration, so may not be representative of projectsat other sites. Many projects were too new for their ef-fectiveness at restoring forest to have been assessed, al-though in most cases short-term plant survival was high.It will be decades before replanted seedlings will be bi-ologically equivalent to mature forest. The effect thatforest restoration ultimately may have on species’ abil-ity to move as climate changes is unknown. We basedestimates of the effectiveness and cost-effectiveness ofavoiding degradation and deforestation through product
substitution on even fewer projects and these estimatesare even more uncertain.
Future work can build on our analyses in at least 3ways. First, estimates of the costs of management actionswould benefit from larger, long-term, forest-restoration,avoided-deforestation and avoided-degradation projectsfrom which to gather primary cost data. These projectsneed not be limited to wood and agricultural prod-uct substitution. Second, a conservation-planning opti-mization exercise for Madagascar species under climatechange could help identify and prioritize units of landthat would provide habitat for multiple species simul-taneously. Our selected species were adequate to illus-trate rising costs of single-species conservation as cli-mate changes; examination of more species is neededto identify priority sites for conservation or to estimateaggregate costs given the returns to scale that would ac-crue from a multiple-species approach. Third, the costof conservation as climate changes could be studied forother species, climate-change scenarios, and geographicregions.
Conservation BiologyVolume 00, No. **, 2012

Busch et al. 11
We believe that our findings apply to other tropi-cal regions with little remaining forest cover and highrates of deforestation (da Fonseca et al. 2007), includingthe Philippines, Western Ghats, Atlantic Forest of Brazil,Mesoamerica, and West Africa (Myers et al. 2000). Inthese regions, as in Madagascar, conservation of somespecies, as climate changes, is likely to require connec-tion of forest patches. The relative difference betweenthe cost of avoided deforestation and avoided forestdegradation and the cost of restoration of native for-est in these regions may be similar. In these regions,as in Madagascar, national economic and poverty allevi-ation priorities likely preclude near-term domestic fund-ing for forest conservation and restoration at the mag-nitude required for conservation of forests as climatechanges.
Forest maintenance and restoration may provide bothmonetary and nonmonetary benefits to local people. Aportion of the cost of avoiding native forest deforesta-tion and degradation might be recovered through inter-national carbon payments (e.g., Reduced Emissions fromDeforestation and Forest Degradation [REDD]). The costof restoring native forests might be partially recoveredthrough afforestation and reforestation mechanisms of aglobal climate agreement (e.g., the Clean DevelopmentMechanism of the Kyoto Protocol or REDD+). Anotherportion of the cost could be justified by the provisionof clean water for drinking and farming (Carret & Loyer2003). Native forests also provide sustainable sources ofmedicine, food, and construction materials and poten-tially revenue from nature-based tourism. However, eventhough forests in Madagascar and similar regions providepotential monetary and nonmonetary benefits, forest pro-tection and restoration appears likely to require contin-ued external support.
International finance for some types of forest main-tenance and restoration might eventually be providedthrough adaptation provisions of the United NationsFramework Convention on Climate Change (UNFCCC).In the UNFCCC Cancun Decisions, developed countriespledged $30 billion from 2010 to 2012 for climate-changeadaptation and mitigation and stated a goal to mobilize$100 billion/year by 2020 (UNFCCC 2010). The termadaptation is used here to refer to human activities toaddress the effects of climate change. Sustainable financ-ing sources are being discussed and might include set-asides of revenues from carbon allowance auctions orfrom levies on the international air or maritime sectors inaddition to official development assistance. Funding forclimate-change adaptation is prioritized for the “most vul-nerable developing countries, such as the least developedcountries, small island developing States, and Africa” (UN-FCCC 2010). Proposals for “ecosystem-based approachesto adaptation,” which include strategies to reduce thevulnerability of people to the effects of climate change,have been formally proposed to the UNFCCC (e.g., IUCN
2008) and compiled (UNFCCC 2011a) and are scheduledto be discussed by the UNFCCC at a workshop in 2012(UNFCCC 2011b). These proposals include some typesof forest maintenance and restoration.
Acknowledgments
This work was partially supported by NSF DEB-0443453to S. Andelman. We thank more than 30 conservationexperts with whom we spoke in the course of this re-search. In particular we thank L.Rajaobelina, J. MacKin-non, J. Randrianarisoa, O. Behra, C. Holmes, J. Rabenan-toandro, and J. Talbot for their assistance in Madagascar.We thank R. Hijmans for supplying future climate layersand E. Ashkenazi, D. Fischman, and J. Hewson for techni-cal support. We thank R. Chacko, H. Campbell, S. Polasky,3 anonymous referees, and E. Fleishman, and E. Main foruseful comments on earlier versions of this manuscript.
Supporting Information
Description of the calculation of net present values (Ap-pendix S1), cost of minimum area for the 74 endemicspecies (Appendix S2), survey instrument (Appendix S3),and distribution maps for 2 example species (AppendixS4) are available online. The authors are responsible forthe content and functionality of these materials. Queries(other than absence of the material) should be directedto the corresponding author.
Literature Cited
Araujo, M. B., M. Cabeza, W. Thuiller, L. Hannah, and P. H. Williams.2004. Would climate change drive species out of reserves? An assess-ment of existing reserve-selection methods. Global Change Biology10:1618–1626.
Carret, J. C., and D. Loyer. 2003. Comment financer durablement lereseau d’aires protegees terrestres a Madagascar? Apport de l’analyseeconomique. World Bank, Washington, D.C., and Agence Francaisede Developpement, Paris.
Erdmann, T. K. 2003. The dilemma of reducing shifting cultivation.Pages 134–139 in S. M. Goodman and J. P. Benstead, editors. Thenatural history of Madagascar. University of Chicago Press, Chicago,Illimois.
FAO. 2010. Global Forest Resources Assessment 2010. Food and Agri-cultural Organization, Rome, Italy.
Flato, G. M., et al. 2000. The Canadian Centre for Climate Modelling andAnalysis global coupled model and its climate. Climate Dynamics 16:451–467.
da Fonseca, G. A. B., C. M. Rodriguez, G. Midgley, J. Busch, L. Hannah,and R. A. Mittermeier. 2007. No forest left behind. Public Library ofScience Biology 5. DOI:10.1371/journal.pbio.0050216.
Goodman, S. M., and J. P. Benstead. 2005. Updated estimates of bioticdiversity and endemism for Madagascar. Oryx 39:73–77.
Gordon, H. B., et al. 2002. CSIRO Mark 3 climate system model. Tech-nical paper 60. CSIRO Atmospheric Research, Aspendale, Australia.
Government of Madagascar. 2008. Map of existing and proposed pro-tected areas’ network in Madagascar. Ministry of Environment,Forests and Tourism, Antananarivo, Madagascar.
Conservation BiologyVolume 00, No. **, 2012

12 Climate and Conservation in Madagascar
Hannah, L., et al. 2007. Protected area needs in a changing climate.Frontiers in Ecology and Environment 5:131–138.
Hannah, L., et al. 2008. Climate change adaptation for conservation inMadagascar. Biology Letters 4:590–594.
Harper, G., M. Steininger, C. Tucker, D. Juhn, and F. Hawkins. 2007.Fifty years of deforestation and forest fragmentation in Madagascar.Environmental Conservation 34:325–333.
IPCC (Intergovernmental Panel on Climate Change) Working GroupI. 2007. The physical science basis of climate change. Sup-plementary information on model projections. IPCC, Geneva.Available from http://ipcc-wg1.ucar.edu/wg1/Report/suppl/Ch10/indiv_maps/spm6/m22/map.gif (accessed January2008).
IUCN (International Union for Conservation of Nature). 2008.Ecosystem-based adaptation: an approach for building resilience andreducing risk for local communities and ecosystems. IUCN, Gland,Switzerland.
IUCN (International Union for Conservation of Nature). 2011. IUCN redlist of threatened species. Version 2011.1. IUCN, Gland, Switzerland.Available from http://www.iucnredlist.org (accessed July 2011).
Johns, T. C., et al. 2003. Anthropogenic climate change for 1860 to2100 simulated with the HadCM3 model under updated emissionsscenarios. Climate Dynamics 20:583–612.
Kistler, P., and S. Spack. 2003. Comparing agricultural systems in twoareas of Madagascar. Pages 123–134 in S. M. Goodman and J. P.Benstead, editors. The natural history of Madagascar. University ofChicago Press, Chicago.
Kremen, C., et al. 2008. Aligning conservation priorities across taxain Madagascar with high-resolution planning tools. Science 320:222–226.
Lopez, P., F. Richter, S. Sepp, and A. Palmantier. 2007. Le reboisementvillageois individual. GTZ (Deutsche Gesellschaft fuer TechnischeZusammenarbeit)/GREEN (Gestion Rationnelle de l’Energie et del’Environnement)-Mad, Antananarivo, Madagascar.
Ministere de l’Environnement des Forets et du Tourisme (MEFT), U.S.Agency for International Development, and Conservation Interna-tional. 2009. Evolution de la couverture de forets naturelles a Mada-gascar. Rapport du MEFT, Antananarivo, Madagascar.
Meyers, D., et al. 2005. Estimating management costs for “site de conser-vation” in Madagascar. U.S. Agency for International Development,Antananarivo, Madagascar.
Myers, N., R. A. Mittermeier, C. G. Mittermeier, G. A. B. da Fonseca,and J. Kent. 2000. Biodiversity hotspots for conservation priorities.Nature 403:853–858.
Parmesan, C. 1996. Climate and species’ range. Nature 382:765–766.
Peters, R. L., and J. D. S. Darling. 1985. The greenhouse effect andnature reserves. BioScience 35:707–717.
Phillips, S. J., and M. Dudik. 2008. Modeling of species distributions withMaxent: new extensions and a comprehensive evaluation. Ecogra-phy 31:161–175.
Phillips, S. J., R. P. Anderson, and R. E. Schapire. 2006. Maximum en-tropy modeling of species geographic distributions. Ecological Mod-elling 190:231–259.
Rabenandrasana, J. C. 2007. Actualisation des donnes de base sur la pro-duction et la consommation en produits forestiers ligneux a Mada-gascar. U.S. Agency for International Development, Antananarivo,Madagascar.
Raxworthy C.J., et al. 2008. Extinction vulnerability of tropical montaneendemism from warming and upslope displacement: a preliminaryappraisal for the highest massif in Madagascar. Global Change Biol-ogy 14:1703–1720.
Shaw, M. R., K. Klausmeyer, D. R. Cameron, J. MacKenzie, and P. R.Roehrdanz. 2012. Economic costs of achieving current conservationgoals in the future as climate changes. Conservation Biology: inPress.
Sinervo, B., et al. 2010. Erosion of lizard diversity by climate changeand altered thermal niches. Science 328: 894–899.
Thomas, C. D., et al. 2004. Extinction risk from climate change. Nature427:145–148.
UNFCCC (United Nations Framework Convention on Climate Change).2010. FCCC/CP/2010/7/Add.1. Decisions adopted by the Confer-ence of the Parties. UNFCCC, Bonn, Germany.
UNFCCC (United Nations Framework Convention on Climate Change).2011a. FCCC/SBSTA/2011/INF.8. Ecosystem-based approachesto adaptation: compilation of information. UNFCCC, Bonn,Germany.
UNFCCC (United Nations Framework Convention on Climate Change).2011b. Draft decision -/CP.17. Nairobi work programme on impacts,vulnerability and adaptation to climate change. UNFCCC, Bonn,Germany.
Wise, R. M., B. Reyers, C. Guo, G. F. Midgley, and W. de Lange. 2012.Costs of expanding the network of protected areas in the CapeFloristic Region. Conservation Biology: in press.
World Bank. 2008a. Madagascar. Second environment programsupport project and third environment program support project.World Bank, Washington, D.C. Available from http://web.worldbank.org/external/projects/main?pagePK=104231&piPK=73230&theSitePK=40941&menuPK=228424&Projectid=P001537(accessed November 2008).
World Bank. 2008b. World development indicators 2008. World Bank,Washington, D.C.
World Travel and Tourism Council (WTTC). 2008. The 2008 travel andtourism economic research: Madagascar. WTTC, London.
WorldClim. 2011. WorldClimglobal climate data. Available fromhttp://www.worldclim.org.
Conservation BiologyVolume 00, No. **, 2012