Effectiveness of protected areas in conserving tropical ... - Nature
8
ARTICLE Effectiveness of protected areas in conserving tropical forest birds Victor Cazalis 1 ✉ , Karine Princé 2,3,4 , Jean-Baptiste Mihoub 2 , Joseph Kelly 1,5 , Stuart H. M. Butchart 6,7 & Ana S. L. Rodrigues 1 Protected areas (PAs) are the cornerstones of global biodiversity conservation efforts, but to fulfil this role they must be effective at conserving the ecosystems and species that occur within their boundaries. Adequate monitoring datasets that allow comparing biodiversity between protected and unprotected sites are lacking in tropical regions. Here we use the largest citizen science biodiversity dataset – eBird – to quantify the extent to which protected areas in eight tropical forest biodiversity hotspots are effective at retaining bird diversity. We find generally positive effects of protection on the diversity of bird species that are forest- dependent, endemic to the hotspots, or threatened or Near Threatened, but not on overall bird species richness. Furthermore, we show that in most of the hotspots examined this benefit is driven by protected areas preventing both forest loss and degradation. Our results provide evidence that, on average, protected areas contribute measurably to conserving bird species in some of the world’s most diverse and threatened terrestrial ecosystems. https://doi.org/10.1038/s41467-020-18230-0 OPEN 1 CEFE, Univ. Montpellier, CNRS, EPHE, IRD, Univ. Paul Valéry Montpellier 3, Montpellier, France. 2 Centre d’Écologie et des Sciences de la Conservation (CESCO), Muséum National d’Histoire Naturelle, Centre National de la Recherche Scientifique, Sorbonne Université, CP 135, 43 rue Buffon, 75005 Paris, France. 3 Université de Lyon, F-69000 Lyon; Université Lyon 1; CNRS, UMR5558, Laboratoire de Biométrie et Biologie Evolutive, F-69622 Villeurbanne, France. 4 Department of Forest and Wildlife Ecology, University of Wisconsin-Madison, Madison, WI 53706, USA. 5 Center for Interdisciplinary Research on Ecology and Sustainability, College of Environmental Studies, National Dong Hwa University, Shoufeng, Hualien 97401, Taiwan. 6 BirdLife International, David Attenborough Building, Pembroke Street, Cambridge CB2 3QZ, UK. 7 Department of Zoology, University of Cambridge, Downing Street, Cambridge CB2 3EJ, UK. ✉ email: [email protected] NATURE COMMUNICATIONS | (2020)11:4461 | https://doi.org/10.1038/s41467-020-18230-0 | www.nature.com/naturecommunications 1 1234567890():,;
-
Upload
khangminh22 -
Category
Documents
-
view
2 -
download
0
Transcript of Effectiveness of protected areas in conserving tropical ... - Nature
ARTICLE
Effectiveness of protected areas in conservingtropical forest birdsVictor Cazalis 1✉, Karine Princé2,3,4, Jean-Baptiste Mihoub2, Joseph Kelly 1,5, Stuart H. M. Butchart 6,7 &
Ana S. L. Rodrigues 1
Protected areas (PAs) are the cornerstones of global biodiversity conservation efforts, but to
fulfil this role they must be effective at conserving the ecosystems and species that occur
within their boundaries. Adequate monitoring datasets that allow comparing biodiversity
between protected and unprotected sites are lacking in tropical regions. Here we use the
largest citizen science biodiversity dataset – eBird – to quantify the extent to which protected
areas in eight tropical forest biodiversity hotspots are effective at retaining bird diversity.
We find generally positive effects of protection on the diversity of bird species that are forest-
dependent, endemic to the hotspots, or threatened or Near Threatened, but not on overall
bird species richness. Furthermore, we show that in most of the hotspots examined this
benefit is driven by protected areas preventing both forest loss and degradation. Our results
provide evidence that, on average, protected areas contribute measurably to conserving bird
species in some of the world’s most diverse and threatened terrestrial ecosystems.
https://doi.org/10.1038/s41467-020-18230-0 OPEN
1 CEFE, Univ. Montpellier, CNRS, EPHE, IRD, Univ. Paul Valéry Montpellier 3, Montpellier, France. 2 Centre d’Écologie et des Sciences de la Conservation(CESCO), Muséum National d’Histoire Naturelle, Centre National de la Recherche Scientifique, Sorbonne Université, CP 135, 43 rue Buffon, 75005Paris, France. 3 Université de Lyon, F-69000 Lyon; Université Lyon 1; CNRS, UMR5558, Laboratoire de Biométrie et Biologie Evolutive, F-69622Villeurbanne, France. 4 Department of Forest and Wildlife Ecology, University of Wisconsin-Madison, Madison, WI 53706, USA. 5 Center for InterdisciplinaryResearch on Ecology and Sustainability, College of Environmental Studies, National Dong Hwa University, Shoufeng, Hualien 97401, Taiwan. 6 BirdLifeInternational, David Attenborough Building, Pembroke Street, Cambridge CB2 3QZ, UK. 7 Department of Zoology, University of Cambridge, Downing Street,Cambridge CB2 3EJ, UK. ✉email: [email protected]
NATURE COMMUNICATIONS | (2020) 11:4461 | https://doi.org/10.1038/s41467-020-18230-0 | www.nature.com/naturecommunications 1
1234
5678
90():,;

Hopes for halting and reversing the ongoing global biodi-versity crisis are largely pinned on protected areas1,2.Defined as geographical spaces that are recognised,
dedicated, and managed to achieve the long-term conservation ofnature1, they are expected to buffer ecosystems and speciespopulations against some of the most destructive impacts ofhuman activities, particularly those resulting in habitat loss ordegradation, or the overexploitation of wildlife. Already coveringnearly 15.2% of the global land surface and 7.4% of the oceans1,signatories to the Convention on Biological Diversity have com-mitted through Aichi Target 11 to expand protected area cover-age to 17% and 10%, respectively, by 20203, and there are calls togo even further4. However, protected areas can only fulfil theirintended role if they are effective.
Protected area effectiveness can be assessed through multiple,complementary approaches, for instance, by evaluating whetherthey cover the diversity of species and ecosystems and the mostimportant sites, or by assessing their management adequacy interms of staff or resources1,5. Here, we focus on effectiveness interms of biodiversity outcomes: the extent to which the estab-lishment of protected areas makes a difference to the trends andthus ultimately to the condition of the species and ecosystemswithin their boundaries.
Evaluating outcomes is not straightforward as it requirescontrasting current state with a counterfactual, i.e. an alter-native scenario of what would have happened if the protectedarea had not existed6. Simply contrasting any protected andunprotected sites would not be an adequate counterfactualanalysis, because it would conflate implementation effects(the difference protected areas have made) with location biases(differences between protected and unprotected sites prior toprotected areas implementation)5,6. Such location biases areinevitable because protected areas tend to be designated inregions of little economic interest (i.e. greater remoteness,higher altitudes, and lower agricultural suitability6,7), which areless likely to have suffered from human pressure both beforeand after protection. These differences can be statisticallycontrolled for in counterfactual analyses of protected areaeffectiveness8–10, but this requires large datasets on the spatialdistribution of the biodiversity features of interest across manyprotected and unprotected sites.
Nowhere are effective protected areas more essential than intropical regions, which host a disproportionately large shareof the world’s biodiversity11 and face rapid habitat loss11 anddegradation12,13, both major threats to biodiversity13–15. Yet,evaluating protected area effectiveness in these regions is parti-cularly challenging, given that the detailed biodiversity datasetsrequired for counterfactual analyses are typically unavailable16.Among the few analyses investigating biodiversity outcomes oftropical protected areas, most focused on protected area effects onland cover, finding that they mitigate both forest loss and forestdegradation10,17–19. While such analyses are possible using ex situremote sensing data, investigating effectiveness in terms of speciesoutcomes requires data collected in situ. Two global meta-analyses reviewed local-scale studies that had contrasted pro-tected versus unprotected sites in terms of species diversity9,20.Both uncovered positive effects at the global scale, but—worry-ingly—weaker or mixed results in tropical regions, contrastingwith reported positive effects of protected areas at reducing forestloss and degradation.
In this study, we investigate the effectiveness of protectedareas in eight tropical forest biodiversity hotspots across threecontinents (Fig. 1), which are the epicentres of the ongoing bio-diversity crisis and therefore regions where effective conservationefforts are the most urgent11,21,22. For this purpose, we takeadvantage of eBird23,24, the world’s largest citizen science
programme that provides fine-scale occurrence data of birdspecies, and we quantify protected areas outcomes for bird speciesdiversity using a counterfactual analysis that controls for locationbiases. For each hotspot, we apply a set of three distinct butinterrelated statistical analyses to investigate the effectiveness ofprotected areas at retaining bird diversity, and to shed light on theunderlying mechanisms (Fig. 2). First (analysis I), we show thatprotected areas do not retain more species than unprotectedcounterfactuals, but that they do retain more species of greaterconservation concern, namely specialists (here, forest-dependentspecies), species with narrow ranges (i.e. endemic to the hotspot),and species classified as threatened (Critically Endangered,Endangered, or Vulnerable) or Near Threatened in the IUCN RedList25. We consider two potential mechanisms through whichprotected areas can potentially affect bird diversity: by retainingforest presence (i.e. mitigating forest loss), and by maintainingforest quality (i.e. mitigating forest degradation). We test thesemechanisms in two complementary analyses (Fig. 2). One (ana-lysis II) shows that protected areas have a positive effect on forestpresence (IIa), by mitigating local deforestation rates (2000–2019;
MES
TUM AND
ATL
EAS
GHA
SUN
IND
Fig. 1 Regions covered by the present study (i.e. intersection betweeneight biodiversity hotspots and the “tropical and subtropical moistbroadleaf forests” biome). Acronyms as in Figs. 3 and 4: ATL (AtlanticForest, N= 6760 checklists), AND (Tropical Andes, N= 17,758), TUM(Tumbes-Chocó-Magdalena, N= 1188), MES (Mesoamerica, N= 32,784),EAS (Eastern Afromontane, N= 1097), GHA (Western Ghats and SriLanka, N= 2646), IND (Indo-Burma, N= 2996), and SUN (Sundaland,N= 1548). More details in Supplementary Fig. 1.
Bird diversity
Forest presence
IIIb
IIIa
IProtectedareas
IIb
Forest qualityCanopy height
Forest contiguity
Wilderness
Protected area residuals
All speciesForest-dependent species
Endemic speciesThreatened and NT species
Bird diversity
*
**
IIa
Deforestation rate
IIa'
Fig. 2 Framework of the analyses performed to investigate theeffectiveness of protected areas at retaining bird diversity. Analysis I:effect of protected areas on bird diversity measured through four indices ofbird species richness (all species, forest-dependent species, endemicspecies, threatened, and near threatened species). The asterisk indicatesspecies of conservation concern. Analysis II: effects of protected areas onforest presence (IIa), local deforestation rates (IIa′), and on three measuresof forest quality (canopy height, forest contiguity, and wilderness; IIb).Analysis III: effects of forest presence (IIIa), and of each of the threemeasures of forest quality and of the residual effect of protected areas (IIIb)on bird diversity.
ARTICLE NATURE COMMUNICATIONS | https://doi.org/10.1038/s41467-020-18230-0
2 NATURE COMMUNICATIONS | (2020) 11:4461 | https://doi.org/10.1038/s41467-020-18230-0 | www.nature.com/naturecommunications
IIa′), but also on forest quality (IIb; measured by canopy height,forest contiguity—the opposite of fragmentation—, and wild-erness—the opposite of the human footprint index26). The other(analysis III) shows the positive effects of either forest presence(IIIa) or forest quality (IIIb) on bird species of conservationconcern.
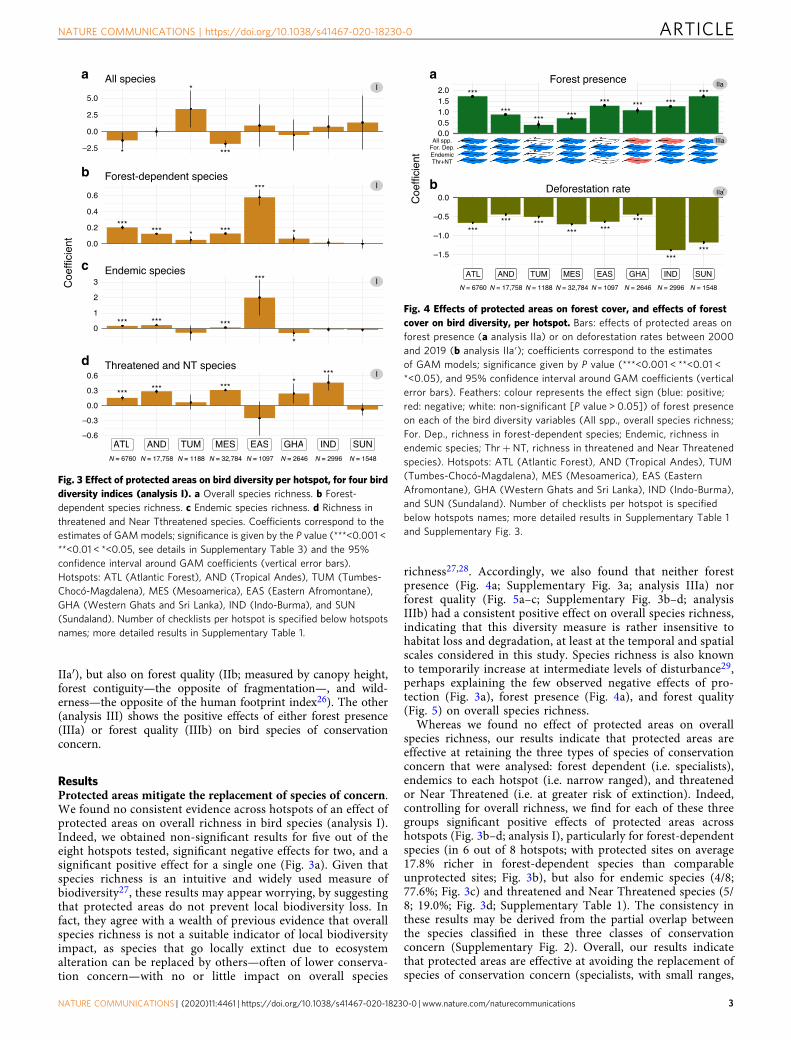
ResultsProtected areas mitigate the replacement of species of concern.We found no consistent evidence across hotspots of an effect ofprotected areas on overall richness in bird species (analysis I).Indeed, we obtained non-significant results for five out of theeight hotspots tested, significant negative effects for two, and asignificant positive effect for a single one (Fig. 3a). Given thatspecies richness is an intuitive and widely used measure ofbiodiversity27, these results may appear worrying, by suggestingthat protected areas do not prevent local biodiversity loss. Infact, they agree with a wealth of previous evidence that overallspecies richness is not a suitable indicator of local biodiversityimpact, as species that go locally extinct due to ecosystemalteration can be replaced by others—often of lower conserva-tion concern—with no or little impact on overall species
richness27,28. Accordingly, we also found that neither forestpresence (Fig. 4a; Supplementary Fig. 3a; analysis IIIa) norforest quality (Fig. 5a–c; Supplementary Fig. 3b–d; analysisIIIb) had a consistent positive effect on overall species richness,indicating that this diversity measure is rather insensitive tohabitat loss and degradation, at least at the temporal and spatialscales considered in this study. Species richness is also knownto temporarily increase at intermediate levels of disturbance29,perhaps explaining the few observed negative effects of pro-tection (Fig. 3a), forest presence (Fig. 4a), and forest quality(Fig. 5) on overall species richness.
Whereas we found no effect of protected areas on overallspecies richness, our results indicate that protected areas areeffective at retaining the three types of species of conservationconcern that were analysed: forest dependent (i.e. specialists),endemics to each hotspot (i.e. narrow ranged), and threatenedor Near Threatened (i.e. at greater risk of extinction). Indeed,controlling for overall richness, we find for each of these threegroups significant positive effects of protected areas acrosshotspots (Fig. 3b–d; analysis I), particularly for forest-dependentspecies (in 6 out of 8 hotspots; with protected sites on average17.8% richer in forest-dependent species than comparableunprotected sites; Fig. 3b), but also for endemic species (4/8;77.6%; Fig. 3c) and threatened and Near Threatened species (5/8; 19.0%; Fig. 3d; Supplementary Table 1). The consistency inthese results may be derived from the partial overlap betweenthe species classified in these three classes of conservationconcern (Supplementary Fig. 2). Overall, our results indicatethat protected areas are effective at avoiding the replacement ofspecies of conservation concern (specialists, with small ranges,
Coe
ffici
ent
* ***
*
***
***
******* *
***
***
*
******
****
***
******
ATL AND TUM MES EAS GHA IND SUN
–2.5
0.0
2.5
5.0
0.0
0.2
0.4
0.6
0
1
2
3
–0.6
–0.3
0.0
0.3
0.6
Forest-dependent species
All speciesa
b
c
d
Endemic species
Threatened and NT species
I
I
I
I
ATL EAS GHA INDMES SUNAND TUM
N = 6760 N = 17,758 N = 1188 N = 32,784 N = 1097 N = 2646 N = 1548N = 2996
Fig. 3 Effect of protected areas on bird diversity per hotspot, for four birddiversity indices (analysis I). a Overall species richness. b Forest-dependent species richness. c Endemic species richness. d Richness inthreatened and Near Tthreatened species. Coefficients correspond to theestimates of GAMmodels; significance is given by the P value (***<0.001 <**<0.01 < *<0.05, see details in Supplementary Table 3) and the 95%confidence interval around GAM coefficients (vertical error bars).Hotspots: ATL (Atlantic Forest), AND (Tropical Andes), TUM (Tumbes-Chocó-Magdalena), MES (Mesoamerica), EAS (Eastern Afromontane),GHA (Western Ghats and Sri Lanka), IND (Indo-Burma), and SUN(Sundaland). Number of checklists per hotspot is specified below hotspotsnames; more detailed results in Supplementary Table 1.
Coe
ffici
ent
*** *** ***
*********
0.00.51.01.52.0 *** ***
–1.5
–1.0
–0.5
0.0
****** ***
*** ******
******
ATL AND TUM MES EAS GHA IND SUNATL EAS GHA INDMES SUNAND TUM
N = 2996N = 2646N = 1097N = 32,784N = 1188N = 17,758N = 6760 N = 1548
IIa
IIIaAll spp.For. Dep.EndemicThr+NT
Forest presencea
b Deforestation rate IIa'
Fig. 4 Effects of protected areas on forest cover, and effects of forestcover on bird diversity, per hotspot. Bars: effects of protected areas onforest presence (a analysis IIa) or on deforestation rates between 2000and 2019 (b analysis IIa′); coefficients correspond to the estimatesof GAM models; significance given by P value (***<0.001 < **<0.01 <*<0.05), and 95% confidence interval around GAM coefficients (verticalerror bars). Feathers: colour represents the effect sign (blue: positive;red: negative; white: non-significant [P value > 0.05]) of forest presenceon each of the bird diversity variables (All spp., overall species richness;For. Dep., richness in forest-dependent species; Endemic, richness inendemic species; Thr+ NT, richness in threatened and Near Threatenedspecies). Hotspots: ATL (Atlantic Forest), AND (Tropical Andes), TUM(Tumbes-Chocó-Magdalena), MES (Mesoamerica), EAS (EasternAfromontane), GHA (Western Ghats and Sri Lanka), IND (Indo-Burma),and SUN (Sundaland). Number of checklists per hotspot is specifiedbelow hotspots names; more detailed results in Supplementary Table 1and Supplementary Fig. 3.
NATURE COMMUNICATIONS | https://doi.org/10.1038/s41467-020-18230-0 ARTICLE
NATURE COMMUNICATIONS | (2020) 11:4461 | https://doi.org/10.1038/s41467-020-18230-0 | www.nature.com/naturecommunications 3
and at higher risk of extinction) by more widespread andgeneralist species.
Our results corroborate studies in temperate regions that foundthat protected areas do not protect all species and thus do notalways affect species richness8,30. However, they contrast withwhat was known in tropical regions from two previous global-scale studies of protected area effectiveness, based on the meta-analysis of local-scale studies contrasting protected versusunprotected sites. One of these studies found higher speciesrichness and abundances within protected areas in Africa andAsia but not in South America20; the other found higher overallrichness within protected areas, but no significant effects on therichness in rare and endemic species, including in the tropics9.Nonetheless, the present study provides a stronger test ofprotected area effectiveness in tropical forests by focusingspecifically on these biomes, using more comparable data (asemerging from a single, coherent dataset), and by exploring theunderlying mechanisms of habitat loss and degradation. We havecontrolled for confounding variables in order to separate the
implementation effects of protected areas from potential locationbiases (see Supplementary Methods 4d), and have also foundthat older protected areas tend to be more effective (in termsof conserving bird diversity; analysis I), consistently with acumulative implementation effect of protected areas (Supple-mentary Methods 4e, Supplementary Fig. 18).
Protected areas retain species of concern by mitigating forestloss. Our results suggest that protected areas effectiveness atretaining species of concern is mainly driven by their effectivenessat mitigating forest loss. First, we found significant positive effectsof protection on forest presence across all hotspots analysed, witha protected site having on average a 17.8% higher probability ofbeing forested than a non-protected counterfactual (Fig. 4a;analysis IIa; Supplementary Table 1). Second, we confirmed thetemporal effect of protected areas on forests, showing across allhotspots that deforestation rates within protected areas werelower (on average 46.7% so) than in non-protected counter-factuals (Fig. 4b; analysis IIa′; Supplementary Table 1). Theseresults confirm and extend previous works showing positiveeffects of protected areas at reducing rates of tropicaldeforestation10,17,31. Third, we found that forested sites havehigher richness in forest-dependent bird species than comparablenon-forested sites (across 8/8 hotspots; on average 74.9% morespecies), as well as in endemic species (7/8; 250.0%) and inthreatened and Near Threatened species (6/8; 122.1%; analysisIIIa; Fig. 4a; Supplementary Table 1; Supplementary Fig. 3a),in accordance with the well-known devastating impact of defor-estation on biodiversity11,13,15. Particularly in line with ourresults, Rutt et al.32, have highlighted the replacement of forest-dependent bird species by generalist species following experi-mental deforestation in the Amazon.
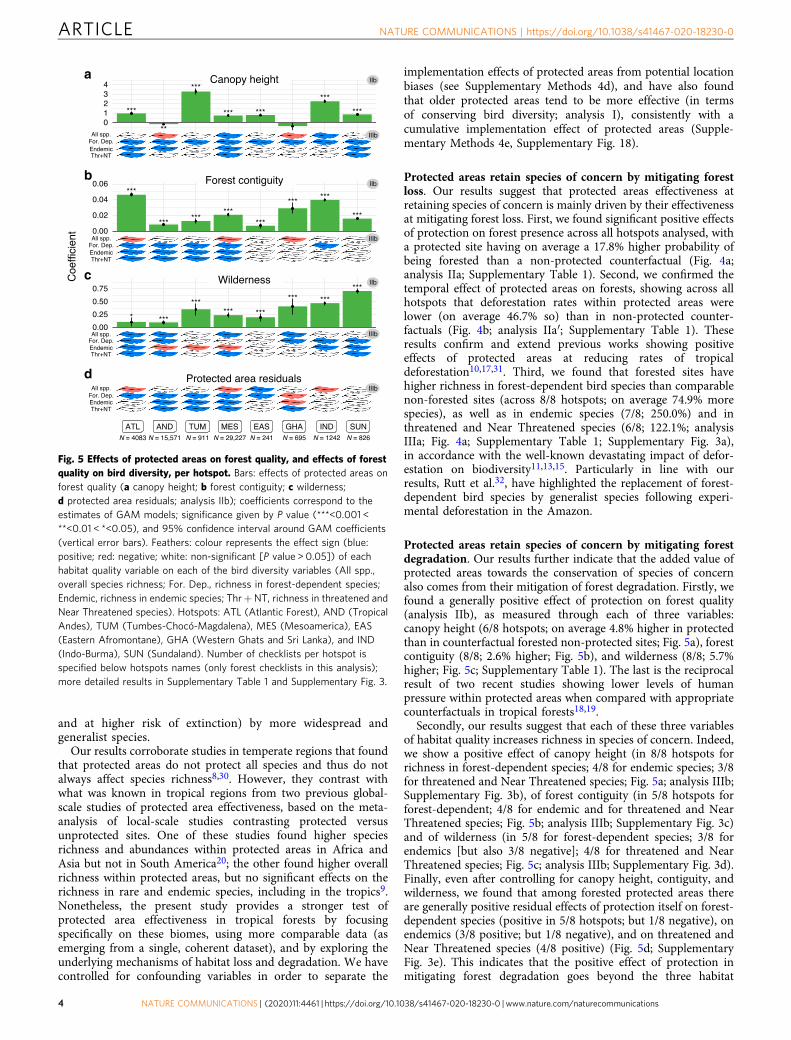
Protected areas retain species of concern by mitigating forestdegradation. Our results further indicate that the added value ofprotected areas towards the conservation of species of concernalso comes from their mitigation of forest degradation. Firstly, wefound a generally positive effect of protection on forest quality(analysis IIb), as measured through each of three variables:canopy height (6/8 hotspots; on average 4.8% higher in protectedthan in counterfactual forested non-protected sites; Fig. 5a), forestcontiguity (8/8; 2.6% higher; Fig. 5b), and wilderness (8/8; 5.7%higher; Fig. 5c; Supplementary Table 1). The last is the reciprocalresult of two recent studies showing lower levels of humanpressure within protected areas when compared with appropriatecounterfactuals in tropical forests18,19.
Secondly, our results suggest that each of these three variablesof habitat quality increases richness in species of concern. Indeed,we show a positive effect of canopy height (in 8/8 hotspots forrichness in forest-dependent species; 4/8 for endemic species; 3/8for threatened and Near Threatened species; Fig. 5a; analysis IIIb;Supplementary Fig. 3b), of forest contiguity (in 5/8 hotspots forforest-dependent; 4/8 for endemic and for threatened and NearThreatened species; Fig. 5b; analysis IIIb; Supplementary Fig. 3c)and of wilderness (in 5/8 for forest-dependent species; 3/8 forendemics [but also 3/8 negative]; 4/8 for threatened and NearThreatened species; Fig. 5c; analysis IIIb; Supplementary Fig. 3d).Finally, even after controlling for canopy height, contiguity, andwilderness, we found that among forested protected areas thereare generally positive residual effects of protection itself on forest-dependent species (positive in 5/8 hotspots; but 1/8 negative), onendemics (3/8 positive; but 1/8 negative), and on threatened andNear Threatened species (4/8 positive) (Fig. 5d; SupplementaryFig. 3e). This indicates that the positive effect of protection inmitigating forest degradation goes beyond the three habitat
Coe
ffici
ent
*** ***
.
***
*** ***
**
***
******
*** ******
***
* ***
*** ******
***
***
01234
0.00
0.02
0.04
0.06
0.00
0.25
0.50
0.75
***
***
***IIb
IIIb
IIb
IIb
IIIb
IIIb
Thr+NT
Thr+NT
ATL EAS GHA INDMES SUNAND TUM
Wilderness
Canopy heighta
b
c
d
Forest contiguity
All spp.For. Dep.Endemic
All spp.For. Dep.Endemic
All spp.For. Dep.Endemic
Protected area residualsAll spp.
For. Dep.Endemic
IIIb
Thr+NT
Thr+NT
N = 826N = 1242N = 695N = 241N = 29,227N = 911N = 15,571N = 4083
Fig. 5 Effects of protected areas on forest quality, and effects of forestquality on bird diversity, per hotspot. Bars: effects of protected areas onforest quality (a canopy height; b forest contiguity; c wilderness;d protected area residuals; analysis IIb); coefficients correspond to theestimates of GAM models; significance given by P value (***<0.001 <**<0.01 < *<0.05), and 95% confidence interval around GAM coefficients(vertical error bars). Feathers: colour represents the effect sign (blue:positive; red: negative; white: non-significant [P value > 0.05]) of eachhabitat quality variable on each of the bird diversity variables (All spp.,overall species richness; For. Dep., richness in forest-dependent species;Endemic, richness in endemic species; Thr+NT, richness in threatened andNear Threatened species). Hotspots: ATL (Atlantic Forest), AND (TropicalAndes), TUM (Tumbes-Chocó-Magdalena), MES (Mesoamerica), EAS(Eastern Afromontane), GHA (Western Ghats and Sri Lanka), and IND(Indo-Burma), SUN (Sundaland). Number of checklists per hotspot isspecified below hotspots names (only forest checklists in this analysis);more detailed results in Supplementary Table 1 and Supplementary Fig. 3.
ARTICLE NATURE COMMUNICATIONS | https://doi.org/10.1038/s41467-020-18230-0
4 NATURE COMMUNICATIONS | (2020) 11:4461 | https://doi.org/10.1038/s41467-020-18230-0 | www.nature.com/naturecommunications

quality variables we have considered, perhaps reflecting reduc-tions of other pressures such as hunting, selective logging, orinvasive species33,34.
Stronger evidence for the effectiveness of South Americanprotected areas. We found substantial variability across hotspotsin the effects of protected areas on the diversity of species ofconcern. Indeed, the most consistent picture emerges for three ofthe American hotspots—Atlantic Forest (ATL), Tropical Andes(AND), and Mesoamerica—for which we found consistentlysignificant positive effects of protection on the three groups ofspecies of concern (Fig. 3), with both forest presence (Fig. 4) andforest quality (Fig. 5) playing seemingly important roles. Resultswere more mixed for the other hotspots. We found significanteffects of protection on the diversity of forest-dependent speciesfor the Tumbes-Chocó-Magdalena hotspot (TUM), of forest-dependent and endemic species for the Eastern Afromontanehotspot (EAS), of forest-dependent species and threatened andnear threatened—as well as a negative effect on endemic species—for the Western Ghats and Sri Lanka (GHA), of species of con-cern for Indo-Burma (IND), and no significant effects on speciesof conservation concern for Sundaland (SUN). This may reflectvariation in the effectiveness of protected area implementationacross the world, or simply differences in statistical power.Indeed, the three American hotspots with the strongest signal ofeffectiveness are those with the most data (6760–32,784 check-lists, contrasted with 1097–2996 for the other hotspots; Supple-mentary Fig. 1; see Supplementary Discussion for furtherdiscussion on heterogeneity in the results and SupplementaryTable 3) and for which data are the most homogeneously dis-tributed with hotspots (Supplementary Figs. 4 and 5).
DiscussionWe provide evidence for the effectiveness of protected areas asbiodiversity conservation tools across eight global biodiversityhotspots, covering some of the planet’s most diverse and threa-tened terrestrial ecosystems21. We used a counterfactual analysisthat controls for location biases in the establishment of protectedareas. Although these controls are necessarily imperfect (seeSupplementary Methods 4d), we aimed to isolate as much aspossible the effects of implementation itself, i.e. the added value ofprotection. We found that this value does not lie in preventingdeclines in overall local species richness, but in avoiding thereplacement of species that are most in need of conservationefforts: the forest specialists that are most at risk from forest lossor degradation; the endemic species that make each hotspotglobally irreplaceable; and threatened or Near Threatened that areat higher risk of global extinction.
Our results contribute to the body of evidence supporting theeffectiveness of protected areas at avoiding forest loss10,17,focusing here on tropical forests of biodiversity hotspots. Fur-thermore, they indicate that this is the main mechanism throughwhich protection has a positive effect on retaining bird species ofconcern. In addition, we provide evidence that it is not the onlymechanism, with protection also having a significant effect onbird diversity by mitigating forest degradation, as measuredthrough canopy height, fragmentation and wilderness levels.Finally, we found evidence for a residual effect of protection (oncecontrolling for the effects on forest presence and quality) thatmay reflect management measures of other pressures such ashunting, small-scale logging, or invasive species.
In this study, we found that protected areas are effective in thesense that they perform better than comparable unprotected sites.We have, however, not demonstrated that they are sufficientlyeffective to halt habitat loss and degradation (which previous
studies found to be ongoing and sometimes increasing withinprotected areas17–19) nor that they halt population declines(which are still ongoing within many protected areas35–37). Fur-thermore, our analysis does not address whether protected areasare sufficient in terms of their extent or representativeness (whileprevious studies attest that they are not38,39). Nonetheless, ourresults indicate that protected areas are already making a mea-surable difference in terms of biodiversity conservation in severalregions of the world where the conservation stakes are thehighest. In this year when Aichi Targets are due to be reached3,yet some governments are announcing protected areas dega-zettement and downsizing40, our results support the key role ofprotected areas as global biodiversity conservation tools. Wetherefore join calls for the strategic expansion of the global pro-tected areas estate and increased investment to ensure that theyare effectively managed41–43.
MethodsStudy areas: biodiversity hotspots. We focused on eight biodiversity hotspots21:those with at least 25% of their extent within the “tropical and subtropical moistbroadleaf forests” biome44 and for which we obtained at least 1000 checklists fromeBird (after applying the data selection procedure described below): Atlantic Forest,Tropical Andes, Tumbes-Chocó-Magdalena, and Mesoamerica (Americas); EasternAfromontane (Africa); Western Ghats and Sri Lanka, Indo-Burma and Sundaland(Asia). Within each hotspot, we analysed only areas overlapping the “tropical andsubtropical moist broadleaf forests” biome44 (Fig. 1, Supplementary Figs. 1, 4, and5), assumed to have been originally forested (see Supplementary Methods 4d).
Data selection: eBird checklists. We obtained bird sightings from the eBirdcitizen science database23. The reporting system is based on checklists, whereby theobserver provides: list of birds detected; GPS location; sampling effort (whether ornot all detected species are reported; sampling duration; sampling protocol, e.g.,stationary point, travel, and banding; and distance travelled in case of travellingprotocol); starting time of the sampling event; and number of observers.
We used the eBird dataset released in December 201845, focusing on recordsfrom 2005 to 2018, as data collected prior to 2005 were too scarce for analysis. Wefiltered this dataset to obtain high-quality checklists comparable in protocol andeffort: we selected complete checklists only (i.e. in which observers explicitlydeclare having reported all bird species detected and identified); following eitherthe “stationary points” or the “travelling counts” protocol; with durations ofcontinuous observation of 0.5–10 h; with observers travelling distances during thechecklist < 5 km; only from experienced observers (≥10 checklists; ≥30 species perchecklist on average; ≥100 different species in total); and removing potentialduplicates (checklists made on the same day at the same place). We applied sometaxonomical transformation to eBird data in order to fit with BirdLife Internationaltaxonomy (Supplementary Methods 1f).
After data filtering (more details in Supplementary Methods 1), we obtained thefinal dataset used in the analyses, consisting of 66,777 checklists, covering5467 species, from 6838 observers, in eight hotspots (Supplementary Figs. 4 and 5;Supplementary Table 2).
Site characteristics. Our analyses included two types of sites: checklist sites,corresponding to the coordinates of each eBird checklist analysed (used in analysesI and III); and background sites, corresponding to the centre points of a regulargrid of 2 × 2 km covering the whole area of each hotspot evenly (used in analysisII). We characterised each site according to six characteristics—calculated in a1-km radius buffer around its coordinates—two binary and four continuous:protected (if coordinates fall within a protected area46; Supplementary Fig. 6)versus non-protected; forest (if >60% of the 1-km buffer around the point isforested47) versus non-forest (<10% forested; sites with intermediate forest coverwere removed from analyses); altitude48; agricultural suitability49; remoteness50;and the proportion of forest loss between 2000 and 201951. In addition, we clas-sified each forest site according to three continuous variables: canopy height52;forest contiguity (proportion of forest cover47, 0.6–1); and wilderness level(opposite of human footprint53).
Finally, checklist sites were also characterised according to four measures oflocal bird diversity: overall species richness (total number of species detected in thechecklist); richness in forest-dependent species (high or medium dependency onforest habitats25); richness in endemic species (at least 90% of their globaldistribution within a hotspot54); and richness in species of concern (classified asNear Threatened or threatened, i.e. Vulnerable, Endangered, or CriticallyEndangered25; more details in Supplementary Methods 2).
Index of observer expertise. Heterogeneity in observers’ birding skills, beha-viours, and equipment increases data variability and potentially introduces biases
NATURE COMMUNICATIONS | https://doi.org/10.1038/s41467-020-18230-0 ARTICLE
NATURE COMMUNICATIONS | (2020) 11:4461 | https://doi.org/10.1038/s41467-020-18230-0 | www.nature.com/naturecommunications 5

to the analyses55,56. Heterogeneity is particularly high in citizen science datasetslike eBird, where volunteers range from those only familiar with a few commonlocal birds to experienced observers capable of detecting rare and cryptic species.As stated above, we only included checklists from relatively experienced observers.To account for the remaining variability in observer expertise, we calculated anobserver expertise score (used as an explanatory variable in the statistical analyses),adapted from Kelling et al.57 and from Johnston et al.56, and calculated separatelyfor each continent. It estimates the variation in the number of species thatobservers are predicted to detect in similar conditions. To do so, we first ran amixed general additive model (function gamm from “mgcv” R package58) mod-elling species richness of checklists against potential confounding variables that areexpected to affect either the number of species detected (sampling protocol;n.observers number of observers; duration of sampling; time of the day) or the truespecies richness (lat latitude; lon longitude; and Julian day), adding observer as arandom effect
gamm richness � protocolþ n:observersþ s durationð Þ þ s timeð Þðþ te lon; lat; dayð Þ þ random ¼ list observer � 1ð ÞÞ: ð1Þ
The notation s() indicates that the variable was used as a smoothed term; and te()indicates that the variables have been used as interacting smooth terms, allowinghere species richness to vary spatially during the year.
After fitting this model to each continental data subset, we used it to predictthe logarithm of species richness that each observer would report for a fictivestationary point with all variables fixed to their median values. This resulted inan observer expertise score that we then assigned to all checklists; assigning theobserver score of the observer with the highest expertise score in cases ofmultiple observers. This index ranged from 2.2 to 4.3 in Africa, from 2.3 to 4.4 inthe Americas, and from 2.8 to 4.5 in Asia (more details in SupplementaryMethods 3).
Statistical analyses of protected area effectiveness. We investigated protectedarea effectiveness at retaining bird diversity through a set of three connected sta-tistical analyses (Fig. 2), undertaken separately for each hotspot, using GAMmodels58. The first analysis (I) directly estimated the effects of protection on birddiversity while the two others (II and III) investigated the underlying mechanismsto explain the results of the first analysis.
Analysis I quantifies the effect of protected areas on bird diversity throughmodels contrasting bird diversity of checklist sites between protected versusunprotected sites, while controlling for protected area location biases (and otherpotential confounding factors)
I: Bird Diversity � protection þ location biasesþ control: ð2ÞAnalysis II quantifies the effectiveness of protected areas at mitigating forest lossand forest degradation, through models controlling for location biases and spatialautocorrelation. To measure the effects of protection on forest loss (IIa), we builtlogistic models contrasting protected versus unprotected background sites in theirprobability of being forested with land cover data
IIa: Forest presence � protection þ location biasesþ te lon; latð Þ: ð3ÞWe have also run an analysis IIa′ comparing forest loss rates (log transformed to fitnormal distribution) between protected and unprotected sites
IIa0 : log 0:001þ Forest lossð Þ � protection þ location biasesþ te lon; latð Þ: ð4ÞTo measure the effects of protected areas on forest degradation (IIb), we builtGaussian models contrasting protected versus unprotected background forestedsites in terms of forest quality (canopy height, forest contiguity, or wilderness)
IIb : Forest quality � protectionþ location biasesþ te lon; latð Þ: ð5ÞAnalysis III quantifies the effects of forest presence (IIIa) or of forest quality
(IIIb) on bird diversity, while controlling for potential confounding factors. In IIIa,we built models contrasting bird diversity in forest versus non-forest checklist sites
IIIa: Bird Diversity � Forest presenceþ control: ð6ÞIn IIIb, we modelled local bird diversity of forested sites against the three forestquality variables, as well as protected status in order to capture other aspects offorest quality that could be increased within protected areas (e.g. enforcement ofhunting regulations; what we call protected area residuals)
IIIb: Bird Diversity � scale canopyð Þ þ scale contiguityð Þþ scale wildernessð Þ þ protectionþ control:
ð7Þ
In analyses I and III, the response variable Bird_Diversity is one of the fourmetrics of local bird diversity. We assumed Gaussian distribution for the overallrichness, and a negative binomial distribution for the richness in forest-dependentspecies, endemic species and threatened and Near Threatened species.
In analysis II, the response variable is either the binary Forest_presence (siteforested or not) or each of three measures of Forest_quality (canopy height, forestcontiguity, or wilderness).
The term location_bias in analyses I and II corresponds to s(altitude)+s(remoteness)+ s(agricultural_suitability), supplemented by a control for spatial
autocorrelation in analysis II with the term+ te(lon, lat). It controls for potentialbiases in protected area location in relation to altitude, remoteness, and agriculturalsuitability6,7 (Supplementary Figs. 7–9).
In analyses I and III, we controlled for other potential confounding factorsthat could affect the bird diversity reported in a checklist (SupplementaryFigs. 10–17). In particular, we controlled for: heterogeneity in sampling effort(sampling duration; observer expertise; number of observers: n.observers);temporal effects (year to account for possible trends; day to account for season);and spatial heterogeneity (lat latitude, lon longitude). Lon, lat, and day were usedas interacting smooth terms, enabling bird diversity variables to vary spatiallyacross seasons (see Supplementary Methods 2 and Supplementary Figs. 10–17).The term control was thus
s duration; k ¼ 4ð Þ þ s expertise; k ¼ 4ð Þ þ s n:observers; k ¼ 4ð Þþ s year; k ¼ 4ð Þ þ te day; lat; lonð Þ:
When the response variable was richness in forest-dependent species, inendemic species or in threatened and Near Threatened species, we also controlledfor overall species richness, thus using as control term
log overall richnessð Þ þ sðduration; k ¼ 4Þ þ sðexpertise; k ¼ 4Þþ sðn:observers; k ¼ 4Þ þ sðyear; k ¼ 4Þ þ te day; lat; lonð Þ:
In analysis I, altitude is already controlled for under the location_bias term;in analysis III, the control term also includes a term controlling for it: s(altitude,k= 6).
Reporting summary. Further information on research design is available in the NatureResearch Reporting Summary linked to this article.
Data availabilityThe data that support the findings of this study are all freely available for researchpurposes, and can either be directly downloaded from the respective websites or areavailable on demand.
Bird species checklists (eBird v. 12/2018), http://ebird.org.Bird species distribution maps (version V7.0), http://datazone.birdlife.org (available on
demand).Bird species IUCN Red List status (IUCN Red List of Threatened Species, version
2017.1), http://iucnredlist.org.Protected area polygons (World Database on Protected Areas, v. 10/2018), https://
www.protectedplanet.net/.Elevation data (GLOBE Digital Elevation Model, v.1, 1999), https://www.ngdc.noaa.
gov/mgg/topo/gltiles.html.Biodiversity hotspots, https://www.cepf.net/our-work/biodiversity-hotspots/hotspots-
defined.Biome boundaries, https://www.worldwildlife.org/publications/terrestrial-ecoregions-
of-the-world;Forest cover (Climate Change Initiative Land cover Data Project Map from 2015
v.2.0.7) http://maps.elie.ucl.ac.be/CCI/viewer/index.php.Agricultural suitability 1981–2010 (version 1.0), https://www.ufz.de/glues/.Remoteness (Accessibility to Cities, version 1.0), https://malariaatlas.org/research-
project/accessibility_to_cities/.Canopy height (version 1.0), https://landscape.jpl.nasa.gov/.Human footprint (version 1.0), https://doi.org/10.5061/dryad.052q5.Forest loss (2000–2019, version 2019-v1.7), http://earthenginepartners.appspot.com/
science-2013-global-forest.
Code availabilityAll R scripts of analyses used in main text are publicly available at: https://doi.org/10.5281/zenodo.3952401.
Received: 9 April 2020; Accepted: 7 August 2020;
References1. UNEP-WCMC, IUCN & NGS Protected Planet Live Report 2020. (UNEP-
WCMC, IUCN & NGS, 2020).2. IPBES. Global Assessment Report on Biodiversity and Ecosystem Services of
the Intergovernmental Science-Policy Platform on Biodiversity and EcosystemServices (eds Brondizio, E. S., Settele, J., Díaz, S. & Ngo, H. T.) (IPBES,2019).
3. SCBD. Aichi biodiversity targets. In: COP 10 Decision X/2: Strategic Plan forBiodiversity 2011-2020 (SCBD, 2010).
4. Pimm, S. L., Jenkins, C. N. & Li, B. V. How to protect half of earth to ensure itprotects sufficient biodiversity. Sci. Adv. 4, eaat2616 (2018).
ARTICLE NATURE COMMUNICATIONS | https://doi.org/10.1038/s41467-020-18230-0
6 NATURE COMMUNICATIONS | (2020) 11:4461 | https://doi.org/10.1038/s41467-020-18230-0 | www.nature.com/naturecommunications

5. Pressey, R. L., Visconti, P. & Ferraro, P. J. Making parks make a difference:poor alignment of policy, planning and management with protected-areaimpact, and ways forward. Philos. Trans. R. Soc. B 370, 20140280 (2015).
6. Joppa, L. N. & Pfaff, A. High and far: biases in the location of protected areas.PLoS ONE 4, e8273 (2009).
7. Venter, O. et al. Bias in protected-area location and its effects on long-termaspirations of biodiversity conventions. Conserv. Biol. 32, 127–134 (2018).
8. Cazalis, V., Belghali, S. & Rodrigues, A. S. L. Using a Large-scale BiodiversityMonitoring Dataset to Test the Effectiveness of Protected Areas at ConservingNorth-American Breeding Birds. bioRxiv 433037, ver.4 peer-reviewed andrecommended by PCI Ecology https://doi.org/10.1101/433037 (2019).
9. Gray, C. L. et al. Local biodiversity is higher inside than outside terrestrialprotected areas worldwide. Nat. Commun. 7, 12306 (2016).
10. Andam, K. S., Ferraro, P. J., Pfaff, A., Sanchez-Azofeifa, G. A. & Robalino, J. A.Measuring the effectiveness of protected area networks in reducingdeforestation. Proc. Natl Acad. Sci. USA 105, 16089–16094 (2008).
11. Barlow, J. et al. The future of hyperdiverse tropical ecosystems. Nature 559,517 (2018).
12. Lewis, S. L., Edwards, D. P. & Galbraith, D. Increasing human dominance oftropical forests. Science 349, 827–832 (2015).
13. Barlow, J. et al. Anthropogenic disturbance in tropical forests can doublebiodiversity loss from deforestation. Nature 535, 144–147 (2016).
14. Newbold, T. et al. Ecological traits affect the response of tropical forest birdspecies to land-use intensity. Proc. R. Soc. Lond. B 280, 20122131 (2013).
15. Peres, C. A., Barlow, J. & Laurance, W. F. Detecting anthropogenicdisturbance in tropical forests. Trends Ecol. Evol. 21, 227–229 (2006).
16. Chandler, M. et al. Contribution of citizen science towards internationalbiodiversity monitoring. Biol. Conserv. 213, 280–294 (2017).
17. Nelson, A. & Chomitz, K. M. Protected area effectiveness in reducing tropicaldeforestation. (Independent Evaluation Group, The World Bank, WashingtonDC, 2009).
18. Anderson, E. & Mammides, C. The role of protected areas in mitigatinghuman impact in the world’s last wilderness areas. Ambio https://doi.org/10.1007/s13280-019-01213-x (2019).
19. Geldmann, J., Manica, A., Burgess, N. D., Coad, L. & Balmford, A. A global-level assessment of the effectiveness of protected areas at resistinganthropogenic pressures. PNAS https://doi.org/10.1073/pnas.1908221116(2019).
20. Coetzee, B. W. T., Gaston, K. J. & Chown, S. L. Local scale comparisons ofbiodiversity as a test for global protected area ecological performance: a meta-analysis. PLoS ONE 9, e105824 (2014).
21. Mittermeier, R. A. et al. Hotspot revisited. pp. 390 (Cemex, Mexico, 2004).22. Laurance, W. F. et al. Averting biodiversity collapse in tropical forest protected
areas. Nature 489, 290–294 (2012).23. Sullivan, B. L. et al. The eBird enterprise: an integrated approach to
development and application of citizen science. Biol. Conserv. 169, 31–40(2014).
24. Sullivan, B. L. et al. eBird: a citizen-based bird observation network in thebiological sciences. Biol. Conserv. 142, 2282–2292 (2009).
25. BirdLife International. IUCN Red List for Birds. Version 2017.1. (BirdLifeInternational, 2017). http://www.birdlife.org.
26. Venter, O. et al. Sixteen years of change in the global terrestrial humanfootprint and implications for biodiversity conservation. Nat. Commun. 7,12558 (2016).
27. Hillebrand, H. et al. Biodiversity change is uncoupled from species richnesstrends: consequences for conservation and monitoring. J. Appl. Ecol. 55,169–184 (2018).
28. Dornelas, M. et al. Assemblage time series reveal biodiversity change but notsystematic loss. Science 344, 296–299 (2014).
29. Roxburgh, S. H., Shea, K. & Wilson, J. B. The intermediate disturbancehypothesis: patch dynamics and mechanisms of species coexistence. Ecology85, 359–371 (2004).
30. Hiley, J. R., Bradbury, R. B. & Thomas, C. D. Impacts of habitat change andprotected areas on alpha and beta diversity of Mexican birds. Diversity Distrib.22, 1245–1254 (2016).
31. Eklund, J. et al. Contrasting spatial and temporal trends of protected areaeffectiveness in mitigating deforestation in Madagascar. Biol. Conserv. 203,290–297 (2016).
32. Rutt, C. L., Jirinec, V., Cohn‐Haft, M., Laurance, W. F. & Stouffer, P. C. Avianecological succession in the Amazon: a long-term case study followingexperimental deforestation. Ecol. Evol. 9, 13850–13861 (2019).
33. Bruner, A. G., Gullison, R. E., Rice, R. E. & Fonseca, G. A. B. Effectiveness ofparks in protecting tropical biodiversity. Science 291, 125–128 (2001).
34. Giakoumi, S. & Pey, A. Assessing the effects of marine protected areas onbiological invasions: a global review. Front. Mar. Sci. 4, 49 (2017).
35. Hallmann, C. A. et al. More than 75 percent decline over 27 years in totalflying insect biomass in protected areas. PLoS ONE 12, e0185809 (2017).
36. Craigie, I. D. et al. Large mammal population declines in Africa’s protectedareas. Biol. Conserv. 143, 2221–2228 (2010).
37. Beaudrot, L. et al. Standardized assessment of biodiversity trends in tropicalforest protected areas: the end is not in sight. PLoS Biol. 14, e1002357 (2016).
38. Watson, J. E. M., Dudley, N., Segan, D. B. & Hockings, M. The performanceand potential of protected areas. Nature 515, 67–73 (2014).
39. Butchart, S. H. M. et al. Shortfalls and solutions for meeting national andglobal conservation area targets. Conserv. Lett. 8, 329–337 (2015).
40. Kroner, R. E. G. et al. The uncertain future of protected lands and waters.Science 364, 881–886 (2019).
41. Barnes, M. D., Glew, L., Wyborn, C. & Craigie, I. D. Prevent perverseoutcomes from global protected area policy. Nat. Ecol. Evol. 2, 759 (2018).
42. Visconti, P. et al. Protected area targets post-2020. Science https://doi.org/10.1126/science.aav6886 (2019).
43. Maxwell, S. L. et al. Area-based conservation in the 21st century. Preprint athttps://www.preprints.org/manuscript/202001.0104/v1 (2020).
44. Olson, D. M. et al. Terrestrial ecoregions of the world: a new map of life onearth: a new global map of terrestrial ecoregions provides an innovative toolfor conserving biodiversity. BioScience 51, 933–938 (2001).
45. eBird. eBird: An Online Database of Bird Distribution and Abundance [webapplication] (eBird, Cornell Lab of Ornithology, Ithaca, New York, 2018).http://www.ebird.org.
46. UNEP-WCMC & IUCN. Protected Planet: [WDPA-Shapefile-polygons; TheWorld Database on Protected Areas (WDPA)/The Global Database onProtected Areas Management Effectiveness (GD-PAME)] (UNEP-WCMC &IUCN, Cambridge, UK, 2018). www.protectedplanet.net.
47. ESA. Climate Change Initiative—Land Cover Project Map v2.0.7. Data FromYear 2015 (ESA, 2015). http://maps.elie.ucl.ac.be/CCI/viewer/index.php.
48. National Geophysical Data Center. Global Land One-kilometer Base Elevation(GLOBE), version 1. (National Geophysical Data Center, 1999). https://www.ngdc.noaa.gov/mgg/topo/gltiles.html.
49. Zabel, F., Putzenlechner, B. & Mauser, W. Global agricultural land resources—a high resolution suitability evaluation and its perspectives until 2100 underclimate change conditions. PLoS ONE 9, e107522 (2014).
50. Weiss, D. J. et al. A global map of travel time to cities to assess inequalities inaccessibility in 2015. Nature 553, 333–336 (2018).
51. Hansen, M. C. et al. High-resolution global maps of 21st-century forest coverchange. Science 342, 850–853 (2013).
52. Simard, M., Pinto, N., Fisher, J. B. & Baccini, A. Mapping forest canopy heightglobally with spaceborne lidar. J. Geophys. Res. 116, G04021 (2011).
53. Venter, O. et al. Global terrestrial human footprint maps for 1993 and 2009.Sci. Data 3, 160067 (2016).
54. BirdLife International & HBW. Bird Species Distribution Maps of the World.Version 7.0 (BirdLife International & HBW, 2017). http://datazone.birdlife.org/species/requestdis.
55. Dickinson, J. L., Zuckerberg, B. & Bonter, D. N. Citizen science as anecological research tool: challenges and benefits. Annu. Rev. Ecol., Evol., Syst.41, 149–172 (2010).
56. Johnston, A., Fink, D., Hochachka, W. M. & Kelling, S. Estimates of observerexpertise improve species distributions from citizen science data. MethodsEcol. Evol. 9, 88–97 (2018).
57. Kelling, S. et al. Can observation skills of citizen scientists be estimated usingspecies accumulation curves? PLoS ONE 10, e0139600 (2015).
58. Wood, S. N. Fast stable restricted maximum likelihood and marginallikelihood estimation of semiparametric generalized linear models: estimationof semiparametric generalized linear models. J. R. Stat. Soc. 73, 3–36 (2011).
AcknowledgementsWe are grateful to the numerous observers who contributed records to eBird, and to theeBird team at Cornell Lab of Ornithology for creating and managing this database. J.K.was funded by the European Union’s Horizon 2020 research and innovation programmeunder the Marie Skłodowska-Curie grant agreement No 766417. This communicationreflects only the authors’ view and the Research Executive Agency of the European Unionis not responsible for any use that may be made of the information it contains. K.P. wasfunded by the French National Research Agency under the grant agreement No ANR-17-CE04-0012.
Author contributionsV.C. and A.S.L.R. conceived the study, in discussion with K.P. and J.-B.M.; V.C. carriedout the statistical analyses, with the support of K.P. and J.-B.M.; V.C. wrote the first draft,supported by A.S.L.R.; J.K. and S.H.M.B. helped interpreting the results and all authorscommented on and revised the manuscript.
Competing interestsThe authors declare no competing interests.
NATURE COMMUNICATIONS | https://doi.org/10.1038/s41467-020-18230-0 ARTICLE
NATURE COMMUNICATIONS | (2020) 11:4461 | https://doi.org/10.1038/s41467-020-18230-0 | www.nature.com/naturecommunications 7

Additional informationSupplementary information is available for this paper at https://doi.org/10.1038/s41467-020-18230-0.
Correspondence and requests for materials should be addressed to V.C.
Peer review information Nature Communications thanks Uri Roll and Richard Schusterfor their contribution to the peer review of this work. Peer reviewer reports are available.
Reprints and permission information is available at http://www.nature.com/reprints
Publisher’s note Springer Nature remains neutral with regard to jurisdictional claims inpublished maps and institutional affiliations.
Open Access This article is licensed under a Creative Commons Attri-bution 4.0 International License, which permits use, sharing, adaptation,
distribution and reproduction in any medium or format, as long as you give appropriatecredit to the original author(s) and the source, provide a link to the Creative Commonslicense, and indicate if changes were made. The images or other third party material in thisarticle are included in the article’s Creative Commons license, unless indicated otherwise ina credit line to the material. If material is not included in the article’s Creative Commonslicense and your intended use is not permitted by statutory regulation or exceeds thepermitted use, you will need to obtain permission directly from the copyright holder.To view a copy of this license, visit http://creativecommons.org/licenses/by/4.0/.
© The Author(s) 2020
ARTICLE NATURE COMMUNICATIONS | https://doi.org/10.1038/s41467-020-18230-0
8 NATURE COMMUNICATIONS | (2020) 11:4461 | https://doi.org/10.1038/s41467-020-18230-0 | www.nature.com/naturecommunications