Mitigating nitrous oxide emission from soil under conventional and no-tillage in wheat using...
7
Mitigating nitrous oxide emission from soil under conventional and no-tillage in wheat using nitrification inhibitors A. Bhatia a, *, S. Sasmal a , N. Jain a , H. Pathak a , R. Kumar b , A. Singh a a Division of Environmental Sciences, Indian Agricultural Research Institute, Pusa Campus, New Delhi 110 012, India b Division of Agricultural Chemicals, Indian Agricultural Research Institute, New Delhi 110 012, India 1. Introduction Nitrous oxide (N 2 O) with its current concentration of 319 ppbv in the atmosphere is an important greenhouse gas (GHG) accounting for 7.9% of the total greenhouse effect (IPCC, 2007) and also responsible for the destruction of the stratospheric ozone. Of global anthropogenic emissions in 2005, agriculture accounts for about 60% of N 2 O emission. Agricultural N 2 O emissions have increased by nearly 17% from 1990 to 2005 (Smith et al., 2007) primarily due to fertilizer N consumption, which has been increasing rapidly in the last few decades. Nitrogen applied through fertilizer, manure and other N sources is used rather inefficiently by crops (Galloway et al., 2003). The surplus N is susceptible to loss as N 2 O emission (McSwiney and Robertson, 2005). Emission of N 2 O can be reduced by practices that deliver added N more efficiently to crops. Practices that improve N-use efficiency include using slow or controlled release fertilizer or nitrification inhibitors which slow the microbial processes leading to N 2 O formation (Robertson, 2004). Adopting reduced or no- tillage (NT) may also affect N 2 O emission but the net effect is inconsistent and not well quantified globally (Smith and Conen, 2004). The effect of reduced tillage on N 2 O emissions may depend on soil and climatic conditions. Higher N 2 O emissions in no-till than in conventionally tilled cropping systems have been frequently reported (Baggs et al., 2003), although some studies have found lower emissions in no-till soils or no difference between tillage systems (Robertson et al., 2000; Elmi et al., 2003), demonstrating the potential for responses to vary across cropping systems and soil types. In some areas, reduced tillage promotes N 2 O emissions, while elsewhere it may reduce emissions or have no measurable influence (Marland et al., 2003). Several studies reporting increased N 2 O emissions following no-till conversion have also been conducted on fine-textured soils including clay and silty clay loam (MacKenzie et al., 1998); imperfectly drained clay loam (Ball et al., 1999); clay loam (Aulakh et al., 1984); and silt loam (Baggs et al., 2003). In contrast, Elmi et al. (2003) found that conventional and no-tillage had similar N 2 O emission in a sandy loam soil in Canada. Worldwide area under no-tillage in 2004 was approximately 95 Mha, representing 7% of total world cropped area (Derpsch, 2005). Area under no-tillage is increasing in the Indo-Gangetic plains (IGP) of south Asia. However there are no studies on the effect of no-tillage practice on N 2 O emission. There are reports on emission of N 2 O from conventionally ploughed rice–wheat fields Agriculture, Ecosystems and Environment xxx (2010) xxx–xxx ARTICLE INFO Article history: Received 24 April 2009 Received in revised form 16 December 2009 Accepted 5 January 2010 Available online xxx Keywords: Global warming potential Nitrous oxide emission No-tillage Wheat Nitrification inhibitor S-benzylisothiouronium derivatives ABSTRACT No-till farming in wheat is being practiced in the rice–wheat system of the Indo-Gangetic plains of south Asia for resource conservation. No-tillage leads to mitigation of carbon dioxide emission, but may emit more nitrous oxide (N 2 O) as compared to conventional tillage reducing mitigation benefit. The aim of this study was assessment of N 2 O emission in wheat grown under conventional and no-tillage and its mitigation using two new nitrification inhibitors, viz. S-benzylisothiouronium butanoate (SBT- butanoate) and S-benzylisothiouronium furoate (SBT-furoate). Cumulative emission of N 2 O-N was higher under no-tillage by 12.2% with urea fertilization and from 4.1 to 4.8% for the inhibitor treatments as compared to the conventional tillage. In no-tillage total emission of N 2 O-N reduced from 0.43% of applied N with urea to 0.29% of applied N with SBT-furoate treatment. The N 2 O-N emissions in SBT- butanoate treatment were at par with the standard dicyandiamide (DCD) inhibitor treatment. Water- filled pore space (WFPS) was higher on most days under no-tillage, with the largest emissions (>1000 mgN 2 O-N m 2 day 1 ) coming with nitrification of ammonium-N present in soil below 60% WFPS. Carbon efficiency ratio was highest (48.1) from SBT-furoate treatment under conventional tillage. The nitrification inhibitors used in the study increased yield of wheat, reduced global warming potential by 8.9–19.5% over urea treatment and may be used to mitigate N 2 O emission. ß 2010 Elsevier B.V. All rights reserved. * Corresponding author. Tel.: +91 11 25841490; fax: +91 11 25841866. E-mail address: [email protected] (A. Bhatia). G Model AGEE-3569; No of Pages 7 Please cite this article in press as: Bhatia, A., et al., Mitigating nitrous oxide emission from soil under conventional and no-tillage in wheat using nitrification inhibitors. Agric. Ecosyst. Environ. (2010), doi:10.1016/j.agee.2010.01.004 Contents lists available at ScienceDirect Agriculture, Ecosystems and Environment journal homepage: www.elsevier.com/locate/agee 0167-8809/$ – see front matter ß 2010 Elsevier B.V. All rights reserved. doi:10.1016/j.agee.2010.01.004
-
Upload
independent -
Category
Documents
-
view
3 -
download
0
Transcript of Mitigating nitrous oxide emission from soil under conventional and no-tillage in wheat using...

Agriculture, Ecosystems and Environment xxx (2010) xxx–xxx
G Model
AGEE-3569; No of Pages 7
Mitigating nitrous oxide emission from soil under conventional and no-tillagein wheat using nitrification inhibitors
A. Bhatia a,*, S. Sasmal a, N. Jain a, H. Pathak a, R. Kumar b, A. Singh a
a Division of Environmental Sciences, Indian Agricultural Research Institute, Pusa Campus, New Delhi 110 012, Indiab Division of Agricultural Chemicals, Indian Agricultural Research Institute, New Delhi 110 012, India
A R T I C L E I N F O
Article history:
Received 24 April 2009
Received in revised form 16 December 2009
Accepted 5 January 2010
Available online xxx
Keywords:
Global warming potential
Nitrous oxide emission
No-tillage
Wheat
Nitrification inhibitor
S-benzylisothiouronium derivatives
A B S T R A C T
No-till farming in wheat is being practiced in the rice–wheat system of the Indo-Gangetic plains of south
Asia for resource conservation. No-tillage leads to mitigation of carbon dioxide emission, but may emit
more nitrous oxide (N2O) as compared to conventional tillage reducing mitigation benefit. The aim of
this study was assessment of N2O emission in wheat grown under conventional and no-tillage and its
mitigation using two new nitrification inhibitors, viz. S-benzylisothiouronium butanoate (SBT-
butanoate) and S-benzylisothiouronium furoate (SBT-furoate). Cumulative emission of N2O-N was
higher under no-tillage by 12.2% with urea fertilization and from 4.1 to 4.8% for the inhibitor treatments
as compared to the conventional tillage. In no-tillage total emission of N2O-N reduced from 0.43% of
applied N with urea to 0.29% of applied N with SBT-furoate treatment. The N2O-N emissions in SBT-
butanoate treatment were at par with the standard dicyandiamide (DCD) inhibitor treatment. Water-
filled pore space (WFPS) was higher on most days under no-tillage, with the largest emissions
(>1000 mg N2O-N m�2 day�1) coming with nitrification of ammonium-N present in soil below 60%
WFPS. Carbon efficiency ratio was highest (48.1) from SBT-furoate treatment under conventional tillage.
The nitrification inhibitors used in the study increased yield of wheat, reduced global warming potential
by 8.9–19.5% over urea treatment and may be used to mitigate N2O emission.
� 2010 Elsevier B.V. All rights reserved.
Contents lists available at ScienceDirect
Agriculture, Ecosystems and Environment
journal homepage: www.e lsev ier .com/ locate /agee
1. Introduction
Nitrous oxide (N2O) with its current concentration of 319 ppbvin the atmosphere is an important greenhouse gas (GHG)accounting for 7.9% of the total greenhouse effect (IPCC, 2007)and also responsible for the destruction of the stratospheric ozone.Of global anthropogenic emissions in 2005, agriculture accountsfor about 60% of N2O emission. Agricultural N2O emissions haveincreased by nearly 17% from 1990 to 2005 (Smith et al., 2007)primarily due to fertilizer N consumption, which has beenincreasing rapidly in the last few decades. Nitrogen appliedthrough fertilizer, manure and other N sources is used ratherinefficiently by crops (Galloway et al., 2003). The surplus N issusceptible to loss as N2O emission (McSwiney and Robertson,2005). Emission of N2O can be reduced by practices that deliveradded N more efficiently to crops. Practices that improve N-useefficiency include using slow or controlled release fertilizer ornitrification inhibitors which slow the microbial processes leadingto N2O formation (Robertson, 2004). Adopting reduced or no-tillage (NT) may also affect N2O emission but the net effect is
* Corresponding author. Tel.: +91 11 25841490; fax: +91 11 25841866.
E-mail address: [email protected] (A. Bhatia).
Please cite this article in press as: Bhatia, A., et al., Mitigating nitrouwheat using nitrification inhibitors. Agric. Ecosyst. Environ. (2010),
0167-8809/$ – see front matter � 2010 Elsevier B.V. All rights reserved.
doi:10.1016/j.agee.2010.01.004
inconsistent and not well quantified globally (Smith and Conen,2004). The effect of reduced tillage on N2O emissions may dependon soil and climatic conditions. Higher N2O emissions in no-tillthan in conventionally tilled cropping systems have beenfrequently reported (Baggs et al., 2003), although some studieshave found lower emissions in no-till soils or no differencebetween tillage systems (Robertson et al., 2000; Elmi et al., 2003),demonstrating the potential for responses to vary across croppingsystems and soil types. In some areas, reduced tillage promotesN2O emissions, while elsewhere it may reduce emissions or haveno measurable influence (Marland et al., 2003). Several studiesreporting increased N2O emissions following no-till conversionhave also been conducted on fine-textured soils including clay andsilty clay loam (MacKenzie et al., 1998); imperfectly drained clayloam (Ball et al., 1999); clay loam (Aulakh et al., 1984); and siltloam (Baggs et al., 2003). In contrast, Elmi et al. (2003) found thatconventional and no-tillage had similar N2O emission in a sandyloam soil in Canada.
Worldwide area under no-tillage in 2004 was approximately95 Mha, representing 7% of total world cropped area (Derpsch,2005). Area under no-tillage is increasing in the Indo-Gangeticplains (IGP) of south Asia. However there are no studies on theeffect of no-tillage practice on N2O emission. There are reports onemission of N2O from conventionally ploughed rice–wheat fields
s oxide emission from soil under conventional and no-tillage indoi:10.1016/j.agee.2010.01.004

A. Bhatia et al. / Agriculture, Ecosystems and Environment xxx (2010) xxx–xxx2
G Model
AGEE-3569; No of Pages 7
and also assessment of various nitrification inhibitors as mitigationoptions (Pathak et al., 2002; Malla et al., 2005). Considering theimportance of N2O in the atmosphere and the lack of informationregarding N2O emission under no-tillage farming from the IGP, inthe present study we quantified N2O emission from no-till farmingpractice in wheat and also explored its mitigation strategies usingsome new nitrification inhibitors. The objectives of the study wereto evaluate the impact of conventional and no-till systems in wheaton emission of N2O and to evaluate the efficacy of some newnitrification inhibitors on N2O emission in wheat.
2. Materials and methods
2.1. Experimental site and soil
A field experiment was conducted on a rice–wheat systemduring 2006–2007 on a Typic Ustochrept at the experimental farmof the Indian Agricultural Research Institute (IARI), New Delhi,India. The site is located in the Indo-Gangetic alluvial tract at288400N and 778120E, at an altitude of 228 m above mean sea level.Climate of the region is subtropical, semi-arid. The area receives anannual rainfall of 750 mm, about 80% of which occurs from June toSeptember. The mean maximum and minimum temperatures fromNovember to March (wheat season) are 22.6 and 6.7 8C,respectively. Alluvial soil of experimental site was loam in texture(46% sand, 33% silt and 21% clay) with bulk density of 1.38 g cm�3,pH (1:2, soil:water) of 8.1, electrical conductivity of 0.48 dS m�1,CEC of 7.3 C mol (p+) kg�1; and organic carbon, total N, Olsen P andammonium acetate extractable K contents of 4.3, 0.30, 0.007 and0.13 g kg�1, respectively.
2.2. Treatments and crop management
Wheat was grown from November 2006 to April 2007. Theexperimental land was under conventional and no-tillage in rice–wheat crop rotation for the past 2 years. The present experimentincluded two tillage practices, viz., conventional tillage and no-tillage with five treatments, each arranged in a randomized blockdesign with three replications in plots of 6 m long and 5 m wide.The land for conventional tillage was prepared by initial use ofmould-board plough to invert the upper soil layers. This wasfollowed by two cross harrowings for cutting and smoothingoperations prior to sowing. In the no-tillage plots there was noploughing and the sowing was carried out using a no-till seed drill(National Agro-Industries, Ludhiana, India). Urea was applied atthe rate of 120 kg N ha�1 in three splits, viz. 60, 30, and30 kg N ha�1 at 20, 40 and 87 days after sowing (DAS). Two newnitrification inhibitors: S-benzylisothiouronium butanoate (SBT-butanoate), S-benzylisothiouronium furoate (SBT-furoate) and astandard nitrification inhibitor dicyandiamide (DCD) were appliedat 10% of N after physically mixing with urea. The SBT compoundsare derivatives of thiourea, which inhibits the activity ofnitrosomanas in pure culture; however, its activity in soil declinesrapidly due to its hydrolysis. The derivatization of thiourea into S-benzyl compounds increased its residence time in soil whileretaining the nitrification inhibition activity comparable tonitrapyrin inhibitor at 4–6 weeks duration (Kumar et al., 2004).The S-benzyl derivatives had a better nitrification inhibition after4–6 weeks than DCD, a cheap nitrification inhibitor which isbacteriostatic in action (Zacherl and Amberger, 1990). Thenitrification inhibitors SBT-butanoate and SBT-furoate weresynthesized in the laboratory of IARI (Kumar et al., 2004).Phosphorus (26.2 kg P ha�1) and K (50 kg K ha�1) were incorpo-rated into the soil at the time of sowing using single superphos-phate (SSP) and muriate of potash (KCl), respectively, in all plots.Wheat (cultivar UP 2338, 100 kg seed ha�1) was sown on 26th
Please cite this article in press as: Bhatia, A., et al., Mitigating nitrouwheat using nitrification inhibitors. Agric. Ecosyst. Environ. (2010),
November 2006 in rows 22.5 cm apart. Irrigation water of 5 � 2 cmeach was applied through a check-basin and five irrigations weregiven in all the treatments.
2.3. Gas sample collection and analysis
Gas samples were collected from each plot at 0, 30 and 60 minusing the closed-chamber technique on different days (Pathaket al., 2002). Nitrous oxide concentration in the gas samples wasestimated by Gas Chromatograph (Hewlett Packard 5890 Series II)fitted with an electron capture detector (ECD) and 60 � 1/800
stainless steel column (Porapak N). Column, injector, and detectortemperatures were 50, 120, and 350 8C, respectively. The carriergas was N2 with a flow rate of 14 ml min�1. The N2O standards (500and 1000 ppbv) were obtained from Spectra Gases, USA. Estima-tion of total N2O emissions during the crop season was done bysuccessive linear interpolation of average emission on thesampling days assuming that emission followed a linear trendduring the periods when no sample was taken.
2.4. Soil sample analysis
Soil samples from the 0–15 cm soil layer at three locations ineach plot were collected on 0, 1, 3, 14, 21, 23, 28, 42, 50, 51, 58, 61,69, 86, 95, 103, 105, 112, 126 DAS using a core sampler of 8-cmdiameter and analyzed for soil available N (Keeney and Nelson,1982) and gravimetric moisture content. The initial soil sampleswere analyzed for soil physico-chemical properties using standardprocedures (Page et al., 1982). Water-filled pore space (WFPS) wascalculated as:
WFPS ¼
gravimetric moisture content� soil bulk density
total soil porosity
Total soil porosity ¼ 1� soil bulk density
soil particle density
� �
Soil particle density was estimated using pycnometer methodand the bulk density was determined by the cylinder method(Blake and Hartge, 1986).
2.5. Estimation of yields of wheat
Wheat yields were determined from the total plot area. Thegrains were separated from the straw, dried, and weighed. Grainmoisture was determined immediately after weighing andsubsamples were dried in an oven at 65 8C for 48 h.
2.6. Carbon equivalent emissions and carbon efficiency ratio
The carbon equivalent emissions (CEE) were calculated as
CEE ¼ N2O emission� 298� 12=44
The global warming potential of N2O was taken as 298 (IPCC,2007). Carbon efficiency ratio (CER) of the treatments wascalculated as
CER ¼ grain yield of the wheat ðin terms of CÞCEE
2.7. Data analysis
Statistical analyses of the data were performed using MSTAT-C(version 1.41), developed by Crop and Soil Science Division,Michigan State University, USA. Duncan’s Multiple Range Test wascarried out to test whether the differences between means werestatistically significant.
s oxide emission from soil under conventional and no-tillage indoi:10.1016/j.agee.2010.01.004
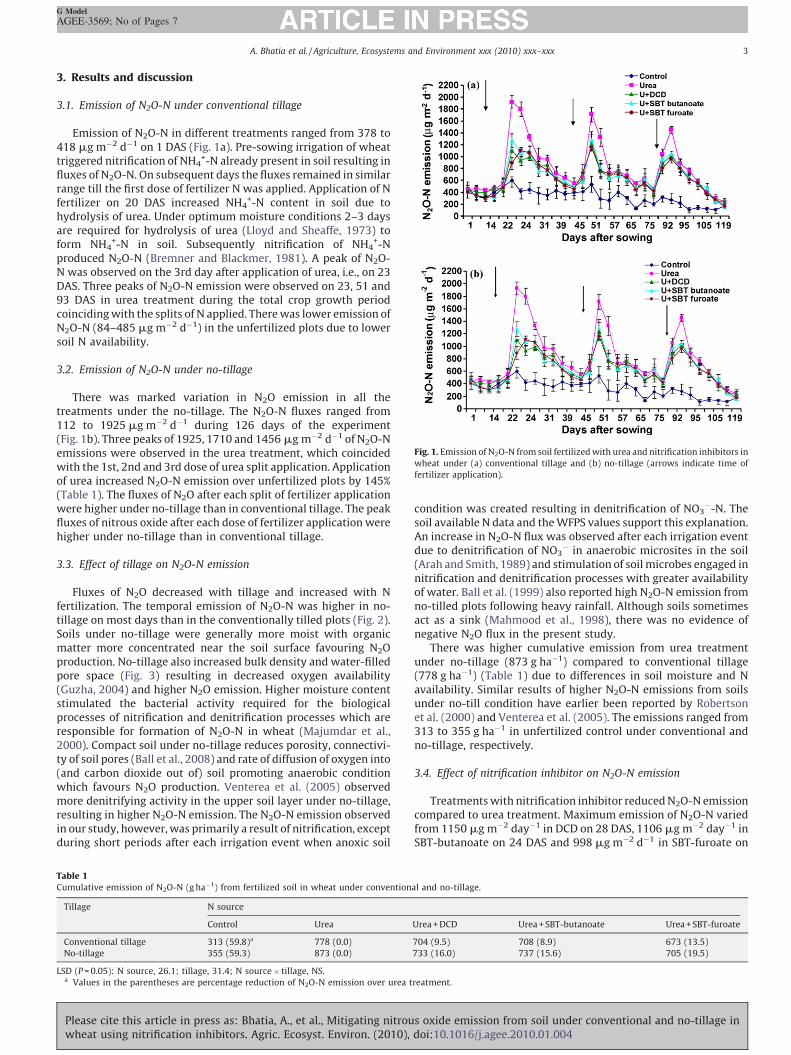
Fig. 1. Emission of N2O-N from soil fertilized with urea and nitrification inhibitors in
wheat under (a) conventional tillage and (b) no-tillage (arrows indicate time of
fertilizer application).
A. Bhatia et al. / Agriculture, Ecosystems and Environment xxx (2010) xxx–xxx 3
G Model
AGEE-3569; No of Pages 7
3. Results and discussion
3.1. Emission of N2O-N under conventional tillage
Emission of N2O-N in different treatments ranged from 378 to418 mg m�2 d�1 on 1 DAS (Fig. 1a). Pre-sowing irrigation of wheattriggered nitrification of NH4
+-N already present in soil resulting influxes of N2O-N. On subsequent days the fluxes remained in similarrange till the first dose of fertilizer N was applied. Application of Nfertilizer on 20 DAS increased NH4
+-N content in soil due tohydrolysis of urea. Under optimum moisture conditions 2–3 daysare required for hydrolysis of urea (Lloyd and Sheaffe, 1973) toform NH4
+-N in soil. Subsequently nitrification of NH4+-N
produced N2O-N (Bremner and Blackmer, 1981). A peak of N2O-N was observed on the 3rd day after application of urea, i.e., on 23DAS. Three peaks of N2O-N emission were observed on 23, 51 and93 DAS in urea treatment during the total crop growth periodcoinciding with the splits of N applied. There was lower emission ofN2O-N (84–485 mg m�2 d�1) in the unfertilized plots due to lowersoil N availability.
3.2. Emission of N2O-N under no-tillage
There was marked variation in N2O emission in all thetreatments under the no-tillage. The N2O-N fluxes ranged from112 to 1925 mg m�2 d�1 during 126 days of the experiment(Fig. 1b). Three peaks of 1925, 1710 and 1456 mg m�2 d�1 of N2O-Nemissions were observed in the urea treatment, which coincidedwith the 1st, 2nd and 3rd dose of urea split application. Applicationof urea increased N2O-N emission over unfertilized plots by 145%(Table 1). The fluxes of N2O after each split of fertilizer applicationwere higher under no-tillage than in conventional tillage. The peakfluxes of nitrous oxide after each dose of fertilizer application werehigher under no-tillage than in conventional tillage.
3.3. Effect of tillage on N2O-N emission
Fluxes of N2O decreased with tillage and increased with Nfertilization. The temporal emission of N2O-N was higher in no-tillage on most days than in the conventionally tilled plots (Fig. 2).Soils under no-tillage were generally more moist with organicmatter more concentrated near the soil surface favouring N2Oproduction. No-tillage also increased bulk density and water-filledpore space (Fig. 3) resulting in decreased oxygen availability(Guzha, 2004) and higher N2O emission. Higher moisture contentstimulated the bacterial activity required for the biologicalprocesses of nitrification and denitrification processes which areresponsible for formation of N2O-N in wheat (Majumdar et al.,2000). Compact soil under no-tillage reduces porosity, connectivi-ty of soil pores (Ball et al., 2008) and rate of diffusion of oxygen into(and carbon dioxide out of) soil promoting anaerobic conditionwhich favours N2O production. Venterea et al. (2005) observedmore denitrifying activity in the upper soil layer under no-tillage,resulting in higher N2O-N emission. The N2O-N emission observedin our study, however, was primarily a result of nitrification, exceptduring short periods after each irrigation event when anoxic soil
Table 1Cumulative emission of N2O-N (g ha�1) from fertilized soil in wheat under convention
Tillage N source
Control Urea
Conventional tillage 313 (59.8)a 778 (0.0)
No-tillage 355 (59.3) 873 (0.0)
LSD (P = 0.05): N source, 26.1; tillage, 31.4; N source� tillage, NS.a Values in the parentheses are percentage reduction of N2O-N emission over urea t
Please cite this article in press as: Bhatia, A., et al., Mitigating nitrouwheat using nitrification inhibitors. Agric. Ecosyst. Environ. (2010),
condition was created resulting in denitrification of NO3�-N. The
soil available N data and the WFPS values support this explanation.An increase in N2O-N flux was observed after each irrigation eventdue to denitrification of NO3
� in anaerobic microsites in the soil(Arah and Smith, 1989) and stimulation of soil microbes engaged innitrification and denitrification processes with greater availabilityof water. Ball et al. (1999) also reported high N2O-N emission fromno-tilled plots following heavy rainfall. Although soils sometimesact as a sink (Mahmood et al., 1998), there was no evidence ofnegative N2O flux in the present study.
There was higher cumulative emission from urea treatmentunder no-tillage (873 g ha�1) compared to conventional tillage(778 g ha�1) (Table 1) due to differences in soil moisture and Navailability. Similar results of higher N2O-N emissions from soilsunder no-till condition have earlier been reported by Robertsonet al. (2000) and Venterea et al. (2005). The emissions ranged from313 to 355 g ha�1 in unfertilized control under conventional andno-tillage, respectively.
3.4. Effect of nitrification inhibitor on N2O-N emission
Treatments with nitrification inhibitor reduced N2O-N emissioncompared to urea treatment. Maximum emission of N2O-N variedfrom 1150 mg m�2 day�1 in DCD on 28 DAS, 1106 mg m�2 day�1 inSBT-butanoate on 24 DAS and 998 mg m�2 d�1 in SBT-furoate on
al and no-tillage.
Urea + DCD Urea + SBT-butanoate Urea + SBT-furoate
704 (9.5) 708 (8.9) 673 (13.5)
733 (16.0) 737 (15.6) 705 (19.5)
reatment.
s oxide emission from soil under conventional and no-tillage indoi:10.1016/j.agee.2010.01.004

Fig. 2. Temporal N2O-N emission from soil fertilized with urea in wheat under
conventional and no-tillage (arrows indicate time of fertilizer application).
Fig. 3. Effect of water-filled pore space (WFPS) on N2O-N emission in urea-fertilized
soil in wheat under conventional and no-tillage (arrows indicate time of irrigation).
Fig. 4. NH4+-N content in soil fertilized with urea and nitrification inhibitor in wheat
under (a) conventional and (b) no-tillage (arrows indicate time of fertilizer
application).
A. Bhatia et al. / Agriculture, Ecosystems and Environment xxx (2010) xxx–xxx4
G Model
AGEE-3569; No of Pages 7
24 DAS under conventional tillage (Fig. 1a). These values werelower than the maximum flux emitted in the urea treatment.Variation in reducing the emission was probably due to thedifferential ability of the N inhibitors in slowing down thenitrification process, the major pathway of N emission in aerobicsoils of wheat. The nitrification inhibitors delay the bacterialoxidation of NH4
+ to NO2� in soil by depressing the activities of
Nitrosomonas bacteria in soil, resulting in lower emission of N2O-Ndue to directly inhibiting the nitrification process and alsoeffecting the denitrification process indirectly by lowering theavailability of NO3
�-N the substrate required for the formation ofN2O-N by the denitrification pathway (Aulakh et al., 1984).
The emission was higher from 23 to 35 DAS in all the treatmentsand subsequently declined till the 2nd split dose of N application.After 1st dose of N application the inhibitors lowered the peak fluxof N2O-N by 32% in DCD, 34% in SBT-butanoate and 41% in SBT-furoate as compared to urea alone in conventional tillagetreatment (Fig. 1a). Out of all inhibitors SBT-furoate was superiorin reducing the cumulative N2O-N emission by 13.5 and 19.5% overthe urea treatment in conventional and no-tillage, respectively(Table 1). In terms of efficacy in reducing the emission theinhibitors followed the sequence of SBT-furoate > DCD = SBT-butanoate. Kumar et al. (2004) found higher nitrification inhibitionin SBT-furoate as compared to DCD based on the concentration ofNH4
+-N and NO3�-N in soil. Application of SBT-furoate reduced
total emission of N2O under no-tillage from 0.43% of applied N inurea to 0.29% of applied N. The amount of applied N that was lost asN2O ranged from 0.30% (SBT-furoate) to 0.39% (urea) in case ofconventional tillage. Thus SBT-furoate reduced N-loss by 32 and
Please cite this article in press as: Bhatia, A., et al., Mitigating nitrouwheat using nitrification inhibitors. Agric. Ecosyst. Environ. (2010),
23% over urea under no-tillage and conventional tillage, respec-tively.
Reduction of cumulative N2O-N emission over urea in the SBT-furoate treatment ranged from 13.5% in conventional tillage to19.5% in no-tillage treatments (Table 1). The reduction of N2O-N inthe SBT-butanoate treatment was at par with DCD treatment underboth the tillage practice. The inhibitors were more effective inreducing N2O-N emission in no-tillage than conventional tillage.
3.5. Effect of tillage on soil N
The concentration of NH4+-N in soil varied in the two tillage
practices (Fig. 4a and b). Under no-tillage NH4+-N concentration
was lower in all treatments as compared to conventional tillage.Higher concentration of NH4
+-N was observed in the control plotsin the conventional tillage as compared to no-tillage during first 28days of the experiment. There were larger fluctuations of NH4
+-Nconcentration in conventional tillage plots over the no-tillageplots. It remained low until the first dose of N fertilizer application.Irrigation on 20 DAS led to mineralization of soil N increasing theNH4
+-N content even in the control plots. On 23 DAS the NH4+-N
concentration increased in all the fertilized plots, due to thehydrolysis of applied urea. Maximum NH4
+-N concentration wasobserved in urea along with SBT-furoate treatment (28.3 kg ha�1)under conventional tillage. All the three inhibitors inhibited thenitrification process as higher NH4
+-N concentrations wereobserved in these treatments even after 25 days of inhibitorapplication. Banerjee et al. (2002) reported higher NH4
+-Nconcentrations in the urea + DCD treated plots in wheat up to 1month after inhibitor application. At 45 DAS NH4
+-N contentdecreased in all the treatments as the result of its conversion toNO3
�-N and also loss of N as N2O during this aerobic conversion.
s oxide emission from soil under conventional and no-tillage indoi:10.1016/j.agee.2010.01.004
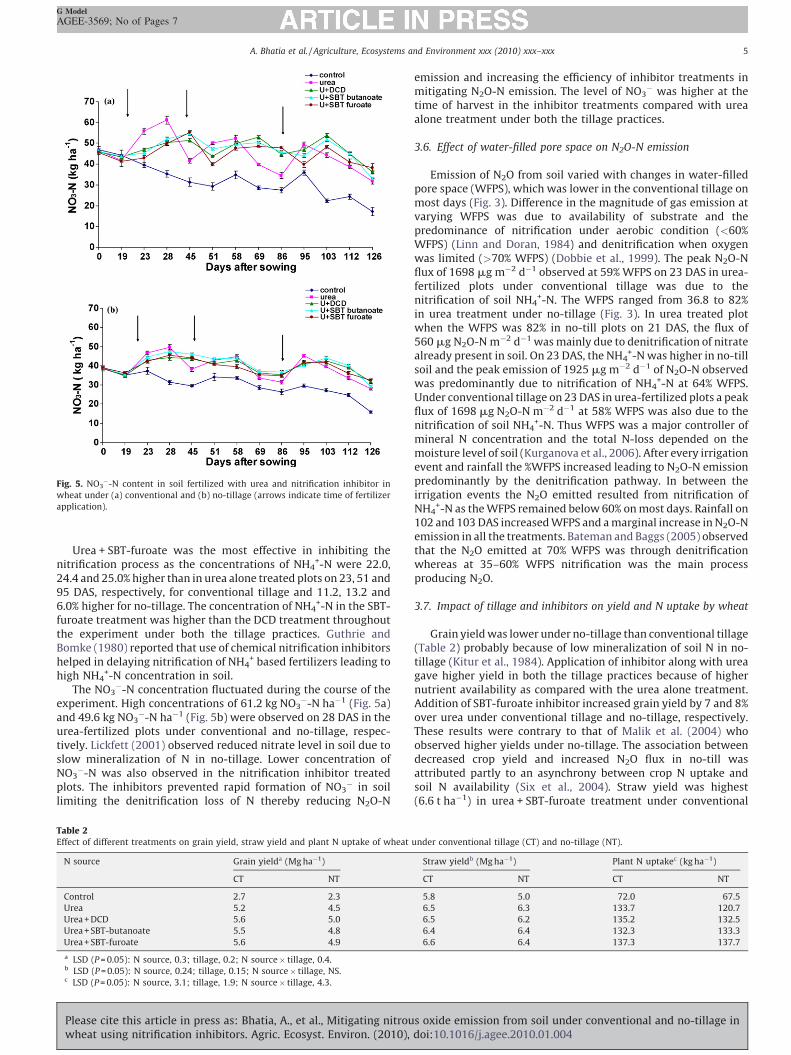
Fig. 5. NO3�-N content in soil fertilized with urea and nitrification inhibitor in
wheat under (a) conventional and (b) no-tillage (arrows indicate time of fertilizer
application).
A. Bhatia et al. / Agriculture, Ecosystems and Environment xxx (2010) xxx–xxx 5
G Model
AGEE-3569; No of Pages 7
Urea + SBT-furoate was the most effective in inhibiting thenitrification process as the concentrations of NH4
+-N were 22.0,24.4 and 25.0% higher than in urea alone treated plots on 23, 51 and95 DAS, respectively, for conventional tillage and 11.2, 13.2 and6.0% higher for no-tillage. The concentration of NH4
+-N in the SBT-furoate treatment was higher than the DCD treatment throughoutthe experiment under both the tillage practices. Guthrie andBomke (1980) reported that use of chemical nitrification inhibitorshelped in delaying nitrification of NH4
+ based fertilizers leading tohigh NH4
+-N concentration in soil.The NO3
�-N concentration fluctuated during the course of theexperiment. High concentrations of 61.2 kg NO3
�-N ha�1 (Fig. 5a)and 49.6 kg NO3
�-N ha�1 (Fig. 5b) were observed on 28 DAS in theurea-fertilized plots under conventional and no-tillage, respec-tively. Lickfett (2001) observed reduced nitrate level in soil due toslow mineralization of N in no-tillage. Lower concentration ofNO3
�-N was also observed in the nitrification inhibitor treatedplots. The inhibitors prevented rapid formation of NO3
� in soillimiting the denitrification loss of N thereby reducing N2O-N
Table 2Effect of different treatments on grain yield, straw yield and plant N uptake of wheat
N source Grain yielda (Mg ha�1)
CT NT
Control 2.7 2.3
Urea 5.2 4.5
Urea + DCD 5.6 5.0
Urea + SBT-butanoate 5.5 4.8
Urea + SBT-furoate 5.6 4.9
a LSD (P = 0.05): N source, 0.3; tillage, 0.2; N source� tillage, 0.4.b LSD (P = 0.05): N source, 0.24; tillage, 0.15; N source� tillage, NS.c LSD (P = 0.05): N source, 3.1; tillage, 1.9; N source� tillage, 4.3.
Please cite this article in press as: Bhatia, A., et al., Mitigating nitrouwheat using nitrification inhibitors. Agric. Ecosyst. Environ. (2010),
emission and increasing the efficiency of inhibitor treatments inmitigating N2O-N emission. The level of NO3
� was higher at thetime of harvest in the inhibitor treatments compared with ureaalone treatment under both the tillage practices.
3.6. Effect of water-filled pore space on N2O-N emission
Emission of N2O from soil varied with changes in water-filledpore space (WFPS), which was lower in the conventional tillage onmost days (Fig. 3). Difference in the magnitude of gas emission atvarying WFPS was due to availability of substrate and thepredominance of nitrification under aerobic condition (<60%WFPS) (Linn and Doran, 1984) and denitrification when oxygenwas limited (>70% WFPS) (Dobbie et al., 1999). The peak N2O-Nflux of 1698 mg m�2 d�1 observed at 59% WFPS on 23 DAS in urea-fertilized plots under conventional tillage was due to thenitrification of soil NH4
+-N. The WFPS ranged from 36.8 to 82%in urea treatment under no-tillage (Fig. 3). In urea treated plotwhen the WFPS was 82% in no-till plots on 21 DAS, the flux of560 mg N2O-N m�2 d�1 was mainly due to denitrification of nitratealready present in soil. On 23 DAS, the NH4
+-N was higher in no-tillsoil and the peak emission of 1925 mg m�2 d�1 of N2O-N observedwas predominantly due to nitrification of NH4
+-N at 64% WFPS.Under conventional tillage on 23 DAS in urea-fertilized plots a peakflux of 1698 mg N2O-N m�2 d�1 at 58% WFPS was also due to thenitrification of soil NH4
+-N. Thus WFPS was a major controller ofmineral N concentration and the total N-loss depended on themoisture level of soil (Kurganova et al., 2006). After every irrigationevent and rainfall the %WFPS increased leading to N2O-N emissionpredominantly by the denitrification pathway. In between theirrigation events the N2O emitted resulted from nitrification ofNH4
+-N as the WFPS remained below 60% on most days. Rainfall on102 and 103 DAS increased WFPS and a marginal increase in N2O-Nemission in all the treatments. Bateman and Baggs (2005) observedthat the N2O emitted at 70% WFPS was through denitrificationwhereas at 35–60% WFPS nitrification was the main processproducing N2O.
3.7. Impact of tillage and inhibitors on yield and N uptake by wheat
Grain yield was lower under no-tillage than conventional tillage(Table 2) probably because of low mineralization of soil N in no-tillage (Kitur et al., 1984). Application of inhibitor along with ureagave higher yield in both the tillage practices because of highernutrient availability as compared with the urea alone treatment.Addition of SBT-furoate inhibitor increased grain yield by 7 and 8%over urea under conventional tillage and no-tillage, respectively.These results were contrary to that of Malik et al. (2004) whoobserved higher yields under no-tillage. The association betweendecreased crop yield and increased N2O flux in no-till wasattributed partly to an asynchrony between crop N uptake andsoil N availability (Six et al., 2004). Straw yield was highest(6.6 t ha�1) in urea + SBT-furoate treatment under conventional
under conventional tillage (CT) and no-tillage (NT).
Straw yieldb (Mg ha�1) Plant N uptakec (kg ha�1)
CT NT CT NT
5.8 5.0 72.0 67.5
6.5 6.3 133.7 120.7
6.5 6.2 135.2 132.5
6.4 6.4 132.3 133.3
6.6 6.4 137.3 137.7
s oxide emission from soil under conventional and no-tillage indoi:10.1016/j.agee.2010.01.004

Table 3Effect of different nitrification inhibitors on carbon efficiency ratio of wheat under
conventional tillage (CT) and no-tillage (NT).
Treatment
Control Urea Urea + DCD Urea + SBT-butanoate Urea + SBT-furoate
CT 49.9 38.7 46.0 44.9 48.1
ZT 37.5 29.8 39.4 37.7 40.2
LSD (P = 0.05): N source, 5.1; tillage, 3.2; N source� tillage, NS.
A. Bhatia et al. / Agriculture, Ecosystems and Environment xxx (2010) xxx–xxx6
G Model
AGEE-3569; No of Pages 7
tillage, however, inhibitors did not affect straw yield over the ureaalone treatment.
Harvest index of wheat under conventional tillage ranged from0.32 (control) to 0.46 (urea + DCD and urea + furoate) whereasunder no-tillage it ranged from 0.31 (control) to 0.45 (urea + DCD).Among the inhibitors there was no significant difference in harvestindex under both the tillage treatments.
Compared with urea treatment, plant N uptake was 9.7% higherwith urea + DCD, 10.4% higher with urea + SBT-butanoate and 14%higher with urea + SBT-furoate under no-tillage practice. Plant Nuptake was 137.3 and 137.7 kg ha�1 under conventional and no-tillage, respectively, in urea + SBT-furoate treatment (Table 2).Kelley and Sweeney (2005) observed that plant N uptake wasprimarily related to greater immobilization of both fertilizer andsoil N under no-tillage.
Plant height in conventional tillage was higher than in no-tillage.The effect of different treatments on plant height followedthe sequence: control< urea + SBT-butanoate = urea + SBT-furoa-te = urea + DCD < urea under conventional and under no-tillage itfollowed the sequence of urea + SBT-butanoate > urea = control >urea + SBT-furoate> urea + DCD. Panicle number per hill rangedfrom 14 to 21 in conventional tillage and from 13 to 18 under no-tillage.
3.8. Reduction in global warming potential with nitrification
inhibitors
Application of inhibitors lowered the global warming potential(GWP) due to N2O emission compared to the urea treatment inboth tillage practices. In conventional tillage the GWP due to N2Oreduced from 231 kg CO2 eq. ha�1 on urea application to200 kg CO2 eq. ha�1 under urea + SBT-furoate treatment. In no-tillage the GWP reduced from 260 kg CO2 eq. ha�1 with urea aloneto 210 kg CO2 eq. ha�1 with SBT-furoate. This amounted toreduction in GWP by 13.5 and 19.5% over the urea treatmentunder conventional and no-tillage, respectively.
3.9. Impact of tillage and inhibitors on carbon equivalent emission
and carbon efficiency ratio
Carbon equivalent emission (CEE) ranged from 25.4 to63.2 kg C ha�1 and 28.6 to 71 kg C ha�1 in conventional and no-tillage, respectively, under the different treatments. CEE reducedfrom 71 kg C ha�1 in urea under no-tillage to 57.3 kg C ha�1 in theSBT-furoate treatment. CEE was at par in the SBT-butanoate andDCD treatments under both the tillage practice. The CEE waslowered from 63.2 kg C ha�1 in urea to 54.7 kg C ha�1 in SBT-furoate under conventional tillage.
The carbon efficiency ratio (CER), i.e., carbon fixed/carbonemitted from soil is an index of the efficiency of C utilization in aparticular treatment. Among the fertilized treatments, CER (29.8)was the lowest in urea treatment under no-tillage and washighest (48.1) in urea + SBT-furoate under conventional tillage(Table 3). The CER of the unfertilized plots was higher asthe carbon equivalent emission was low due to less emission ofN2O-N.
Please cite this article in press as: Bhatia, A., et al., Mitigating nitrouwheat using nitrification inhibitors. Agric. Ecosyst. Environ. (2010),
3.10. Economic assessment of inhibitor application
For wider adoptability by the farmers, use of the inhibitorsshould be economically profitable. In the present study theinhibitors were profitable on three counts: increased yield,increased N-use efficiency and decreased N2O-N emission. Therewas a yield advantage of 0.4 Mg ha�1 with the use of inhibitorsunder both the tillage practices. This would increase farmer’s profitby approximately Rs. 4400 ha�1. Moreover, there was an increasein N uptake in the SBT-furoate treatment under no-tillage. Thisincreased the N-use efficiency by 14% equivalent to 17 kg N ha�1.The N2O-N emission reduction ranged from 778 g ha�1 in urea to673 g ha�1 in the urea + SBT-furoate treatment in conventionaltillage and from 873 g ha�1 in urea to 705 g ha�1 in the SBT-furoatetreatment in no-tillage. Therefore, in terms of GWP there was asmall reduction of 30–50 kg CO2 eq. ha�1 on application ofinhibitors under conventional and no-tillage, respectively. Presentcost of the chemical grade of these inhibitors is high as they are notcommercially available. This would restrict the acceptability ofthese chemicals by the farmers. However, their cost is lower thanother popular inhibitors such as N-serve.
4. Conclusions
The temporal as well as cumulative N2O emission was higherunder no-tillage than conventional tillage. The two new nitrifica-tion inhibitors, i.e., S-benzylisothiouronium butanoate and S-benzylisothiouronium furoate were effective in reducing emissionof N2O from fertilized soil in wheat under both conventional andno-tillage, practices. The inhibitors reduced the GWP in wheat soilsby 8.9–19.5%. The study suggested that though the inhibitorsincreased yield, increased N-use efficiency and reduced GWP, thepresent price of the chemical grade of these inhibitors is quite highas they are not commercially available. Therefore, at their presentprice, these inhibitors are not attractive to the farmers. To makethese inhibitors adopted by the farmers, cheap commercialmethods of their production needs to be developed.
Acknowledgments
The authors thank the Director and Dean, Indian AgriculturalResearch Institute, New Delhi and the Network Project on ClimateChange, Indian Council of Agricultural Research for financialsupport.
References
Arah, J.R.M., Smith, K.A., 1989. Steady state denitrification in aggregated soils: amathematical model. J. Soil Sci. 40, 139–149.
Aulakh, M.S., Rennie, D.A., Paul, E.A., 1984. Gaseous nitrogen losses from soils underzero-till as compared with conventional-till management systems. J. Environ.Qual. 13, 130–136.
Baggs, E.M., Stevenson, M., Pihlatie, M., Regar, A., Cook, H., Cadisch, G., 2003. Nitrousoxide emissions following application of residues and fertilizer under zero andconventional tillage. Plant Soil 254, 361–370.
Ball, B.C., Crichton, I., Horgan, G.W., 2008. Dynamics of upward and downward N2Oand CO2 fluxes in ploughed or no-tilled soils in relation to water-filled porespace, compaction and crop presence. Soil Till. Res. 101, 20–30.
Ball, B.C., Scott, A., Parker, J.P., 1999. Field N2O, CO2 and CH4 fluxes in relation totillage, compaction and soil quality in Scotland. Soil Till. Res. 53, 29–39.
Banerjee, B., Pathak, H., Aggarwal, P.K., 2002. Effect of DCD, farm yard manure andirrigation on crop yields and ammonia volatilization from an alluvial soil undera rice–wheat cropping system. Biol. Fertil. Soils 36, 207–214.
Bateman, E.J., Baggs, E.M., 2005. Contributions of nitrification and denitrification tonitrous oxide emissions from soils at different water-filled pore space. Biol.Fertil. Soils 41, 379–388.
Blake, G.R., Hartge, K.H., 1986. Bulk density. In: Klute, A. (Ed.), Methods of SoilAnalysis. ASA and SSSA, Madison, WI, USA., pp. 363–375.
Bremner, J.M., Blackmer, A.M., 1981. Terrestrial nitrification as a source of atmo-spheric nitrous oxide. In: Delwiche, C.C. (Ed.), Denitrification, Nitrification, andAtmospheric Nitrous Oxide. John Wiley & Sons, Inc., New York, pp. 151–170.
s oxide emission from soil under conventional and no-tillage indoi:10.1016/j.agee.2010.01.004

A. Bhatia et al. / Agriculture, Ecosystems and Environment xxx (2010) xxx–xxx 7
G Model
AGEE-3569; No of Pages 7
Derpsch, R., 2005. The extent of conservation agriculture adoption worldwide:implications and impact. In: Proceedings of the III World Congress on Conser-vation Agriculture, 3–7 October 2005, Nairobi, Kenya.
Dobbie, K.E., McTaggart, I.P., Smith, K.A., 1999. Nitrous oxide emissions from inten-sive agricultural systems: variations between crops and seasons, key drivingvariables, and mean emission factors. J. Geophys. Res. Atmos. 104, 26891–26899.
Elmi, A.A., Madramootoo, C., Hamel, C., Liu, A., 2003. Denitrification and nitrousoxide to nitrous oxide plus dinitrogen ratios in the soil profile under threetillage systems. Biol. Fertil. Soils 38, 340–348.
Galloway, J.N., Aber, J.D., Erisman, J.W., Seitzinger, S.P., Howarth, R.W., Cowling, E.B.,Cosby, B.J., 2003. The nitrogen cascade. BioScience 53, 341–356.
Guthrie, T.F., Bomke, A.A., 1980. N inhibitor by microbial and N changes in poultrymanure. J. Environ. Qual. 4, 275–278.
Guzha, A.C., 2004. Effects of tillage on soil microrelief, surface depression storageand soil water storage. Soil Till. Res. 76, 105–114.
IPCC, 2007. Summary for Policymakers. Climate Change 2007: Synthesis Report ofFourth Assessment Report of the Intergovernmental Panel on Climate Change.Cambridge University Press, Cambridge, United Kingdom, p. 22.
Keeney, D.R., Nelson, D.W., 1982. Nitrogen-inorganic forms. In: Page, A.L., Miller,R.H., Keeney, D.R. (Eds.), Methods of Soil Analysis (Part 2). ASA-SSAC, Madison,WI, USA, pp. 643–698.
Kelley, K.W., Sweeney, D.W., 2005. Tillage and urea ammonium nitrate fertilizerrate and placement affects winter wheat following grain sorghum and soybean.Am. Soc. Agron. 97, 690–697.
Kitur, B.K., Smith, M.S., Blevins, R.L., Frye, W.W., 1984. Fate of 15N-depleted ammo-nium nitrate applied to no-tillage and conventional tillage maize. Agron. J. 76,240–242.
Kumar, R., Anupama, Parmar, B.S., 2004. S-benzylisothiouronium derivatives asnitrification inhibitors. Pesticide Res. J. 16, 48–57.
Kurganova, I.N., Gerenyu, V.L., Well, R., Loftfield, N., Flessa, H., 2006. The effect ofwater-field pore space on N-losses from arable soils. In: Proceedings of the 18thWorld Congress of Soil Science, Philadelphia, PA, USA.
Lickfett, L., 2001. Effects of reduced tillage intensity on soil N dynamics followingoilseed rape cultivation. In: Horst, W.J., Schenk, M.K., Burkert, A., Claassen,N., Flessa, H., Frommer, W.B., Goldbach, H., Olfs, H.W., Romheld, V., Sat-telmacher, B., Schmidhalter, U., Schubert, S., Wiren, N.V., Wittenmayer, L.(Eds.), Plant Nutrition. Springer, Netherlands, pp. 872–873.
Linn, D.M., Doran, J.W., 1984. Effect of water-filled pore space on carbon dioxide andnitrous oxide production in tilled and no-tilled soils. Soil Sci. Soc. Am. J. 48,1267–1272.
Lloyd, A.B., Sheaffe, M.J., 1973. Urease activity in soil. Plant Soil 39, 71–80.MacKenzie, A.F., Fan, M.X., Cadrin, F., 1998. Nitrous oxide emission in three years as
affected by tillage, corn–soybean–alfalfa rotations, and nitrogen fertilization. J.Environ. Qual. 27, 698–703.
Mahmood, T., Ali, R., Malik, K.A., Shamsi, S.R.A., 1998. Nitrous oxide emissionfrom irrigated sandy clay loam cropped to maize and wheat. Biol. Fertil. Soils27, 189–196.
Please cite this article in press as: Bhatia, A., et al., Mitigating nitrouwheat using nitrification inhibitors. Agric. Ecosyst. Environ. (2010),
Majumdar, D., Rastogi, M., Kumar, S., Pathak, H., Jain, M.C., Kumar, U., 2000. Nitrousoxide emissions from an alluvial soil with different nitrogenous fertilizers andnitrogen levels. J. Ind. Soc. Soil Sci. 48, 732–741.
Malik, R.K., Yadav, A., Singh, S., Sardama, P.K., Hobbs, P.R., 2004. No-tillage farmingin the rice–wheat cropping systems in India. In: Lal, P.R., Uphoff, N., Hansen,D.O. (Eds.), Sustainable Agriculture and the Rice–Wheat System. Marcel Dekker,New York, pp. 133–146.
Malla, G., Bhatia, A., Pathak, H., Prasad, S., Jain, N., Singh, J., Kumar, V., 2005.Mitigating nitrous oxide and methane emissions from soil under rice–wheatsystem with nitrification inhibitors. Chemosphere 58, 141–147.
Marland, G., West, T.O., Schlamadinger, B., Canella, L., 2003. Managing soil organiccarbon in agriculture: the net effect on greenhouse gas emissions. Tellus 55,613–621.
McSwiney, C.P., Robertson, G.P., 2005. Non-linear response of N2O flux to incre-mental fertilizer addition in a continuous maize (Zea mays sp.) cropping system.Glob. Change Biol. 11, 1712–1719.
Page, A.L., Miller, R.H., Keeney, D.R., 1982. Methods of Soil Analysis. Part 2, Chemicaland Microbiological Properties, 2nd edition. Agronomy No. 9, ASA-SSSA, Madi-son, WI, USA, p. 1159.
Pathak, H., Bhatia, A., Prasad, S., Jain, M.C., Kumar, S., Singh, S., Kumar, U., 2002.Emission of nitrous oxide from soil in rice–wheat systems of Indo-Gangeticplains of India. Environ. Monit. Assess. 77, 163–178.
Robertson, G.P., Paul, E.A., Harwood, R.R., 2000. Greenhouse gases in intensiveagriculture: contributions of individual gases to the radiative forcing of theatmosphere. Science 289, 1922–1925.
Robertson, G.P., 2004. Abatement of nitrous oxide, methane, and the other non-CO2
greenhouse gases: the need for a systems approach. In: Field, C.B., Raupach,M.R. (Eds.), The Global Carbon Cycle. Island Press, Washington, DC, USA, pp.493–506.
Six, J., Ogle, S.M., Breidt, F.J., Conant, R.T., Mosier, A.R., Paustian, K., 2004.The potential to mitigate global warming with no-tillage managementis only realized when practised in the long term. Glob. Change Biol. 10,155–160.
Smith, K.A., Conen, F., 2004. Impacts of land management on fluxes of tracegreenhouse gases. Soil Use Manage. 20, 255–263.
Smith, P., Martino, D., Cai, Z., Gwary, D., Janzen, H., Kumar, P., McCarl, B., Ogle, S.,O’Mara, F., Rice, C., Scholes, B., Sirotenko, O., 2007. Agriculture. In: Metz, B.,Davidson, O.R., Bosch, P.R., Dave, R., Meyer, L.A. (Eds.), Climate Change 2007:Mitigation. Contribution of Working Group III to the Fourth Assessment Reportof the Intergovernmental Panel on Climate Change. Cambridge University Press,Cambridge, United Kingdom and USA.
Venterea, R.T., Burger, M., Spokas, K.A., 2005. Nitrogen oxide and methane emis-sions under varying tillage and fertilizer management. J. Environ. Qual. 34,1467–1477.
Zacherl, B., Amberger, A., 1990. Effect of the nitrification inhibitors dicyandiamide,nitrapyrin and thiourea on Nitrosomonas europaea. Nutr. Cycl. Agroecosyst. 22,37–44.
s oxide emission from soil under conventional and no-tillage indoi:10.1016/j.agee.2010.01.004