Effect of land cover data on nitrous oxide inventory in fen meadows
11
1209 Landscape representations based on land cover databases differ significantly from the real landscape. Using a land cover database with high uncertainty as input for emission inventory analyses can cause propagation of systematic and random errors. e objective of this study was to analyze how different land cover representations introduce systematic errors into the results of regional N 2 O emission inventories. Surface areas of grassland, ditches, and ditch banks were estimated for two polders in the Dutch fen meadow landscape using five land cover representations: four commonly used databases and a detailed field map, which most closely resembles the real landscape. ese estimated surface areas were scaled up to the Dutch western fen meadow landscape. Based on the estimated surface areas agricultural N 2 O emissions were estimated using different inventory techniques. All four common databases overestimated the grassland area when compared to the field map. is caused a considerable overestimation of agricultural N 2 O emissions, ranging from 9% for more detailed databases to 11% for the coarsest database. e effect of poor land cover representation was larger for an inventory method based on a process model than for inventory methods based on simple emission factors. Although the effect of errors in land cover representations may be small compared to the effect of uncertainties in emission factors, these effects are systematic (i.e., cause bias) and do not cancel out by spatial upscaling. Moreover, bias in land cover representations can be quantified or reduced by careful selection of the land cover database. Effect of Land Cover Data on Nitrous Oxide Inventory in Fen Meadows Linda Nol,* Peter H. Verburg, Gerard B. M. Heuvelink, and Karin Molenaar Wageningen University E very land cover map or database is a simplification of the complexity of a real landscape (Arbia et al., 1998; Regnauld, 2001; Schmit et al., 2006). However, the scale and mapping technique are a source of variation when comparing different land cover maps (Ellis, 2004; Bach et al., 2006; Schmit et al., 2006; Verburg et al., 2006). Differences between a land cover database and a real landscape are a source of error when the database is utilized (Foody, 2002; Fang et al., 2006; Fassnacht et al., 2006). e large dependence of greenhouse gas emissions on land use makes land cover data an essential input in greenhouse gas inventories (Kern et al., 1997; Plant, 1999; Denier van der Gon et al., 2000; Matthews et al., 2000). Recently Huffman et al. (2006) acknowledged the need for highly accurate, high-resolution, and nationally consistent land cover data, while others have argued for statistically rigorous and accurate assessment of thematic maps (Stehman and Czaplewski, 1998; Heuvelink and Burrough, 2002). A lot of research has been performed to improve greenhouse gas inventories (Li et al., 1992; Kroeze, 1994; Denier van der Gon and Bleeker, 2005; Stacey et al., 2006), but careful analysis of how systematic errors in land cover data affect these inventories has received little attention. Often considerable emphasis is given to the provision of the most exact input data possible for soil and climate while little thought is given to the quality and accuracy of land cover or land use data (Jansen, 1998; Bach et al., 2006). Bareth et al. (2001) noted that the accuracy of spatial data should be regarded with more importance in the estimation of N 2 O emissions. Signatories to the Kyoto Protocol (UNFCCC, 1997) must an- nually report emissions of their greenhouse gases CO 2 , CH 4 , and N 2 O. e Intergovernmental Panel on Climate Change (IPCC) has established Good Practice Guidelines for reporting and upscal- ing national greenhouse gas emissions. e inventory methods are divided into three levels of increasing complexity and classified as: Tier 1, Tier 2, and Tier 3 (IPCC, 1997; IPCC, 2000). e Tier 1 and Tier 2 methods are based on the assumption that the total N 2 O emission is a summation of emissions from different sources, which can be estimated by activity data (data on production and consumption of N) multiplied by an emission factor (the fraction of soil N emitted as N 2 O). e Tier 1 method is the most basic method and uses default emission factors and spatially coarse ac- tivity data. e Tier 2 method consists of the same basic relation- ships but is based on emission factors and activity data which are country-specific for the most important land uses and activities. e Tier 3 method on the other hand requires nonlinear process modeling. Examples of frequently used process models, as part of Land Dynamics, Environmental Science Group, Wageningen Univ., P.O. Box 47, 6700 AA Wageningen, The Netherlands. Copyright © 2008 by the American Society of Agronomy, Crop Science Society of America, and Soil Science Society of America. All rights reserved. No part of this periodical may be reproduced or transmitted in any form or by any means, electronic or mechanical, including pho- tocopying, recording, or any information storage and retrieval system, without permission in writing from the publisher. Published in J. Environ. Qual. 37:1209–1219 (2008). doi:10.2134/jeq2007.0438 Received 21 Aug. 2007. *Corresponding author ([email protected]). © ASA, CSSA, SSSA 677 S. Segoe Rd., Madison, WI 53711 USA TECHNICAL REPORTS: LANDSCAPE AND WATERSHED PROCESSES
Transcript of Effect of land cover data on nitrous oxide inventory in fen meadows

1209
Landscape representations based on land cover databases diff er signifi cantly from the real landscape. Using a land cover database with high uncertainty as input for emission inventory analyses can cause propagation of systematic and random errors. Th e objective of this study was to analyze how diff erent land cover representations introduce systematic errors into the results of regional N
2O emission inventories. Surface areas of
grassland, ditches, and ditch banks were estimated for two polders in the Dutch fen meadow landscape using fi ve land cover representations: four commonly used databases and a detailed fi eld map, which most closely resembles the real landscape. Th ese estimated surface areas were scaled up to the Dutch western fen meadow landscape. Based on the estimated surface areas agricultural N
2O emissions were estimated using
diff erent inventory techniques. All four common databases overestimated the grassland area when compared to the fi eld map. Th is caused a considerable overestimation of agricultural N
2O emissions, ranging from 9% for more detailed databases
to 11% for the coarsest database. Th e eff ect of poor land cover representation was larger for an inventory method based on a process model than for inventory methods based on simple emission factors. Although the eff ect of errors in land cover representations may be small compared to the eff ect of uncertainties in emission factors, these eff ects are systematic (i.e., cause bias) and do not cancel out by spatial upscaling. Moreover, bias in land cover representations can be quantifi ed or reduced by careful selection of the land cover database.
Eff ect of Land Cover Data on Nitrous Oxide Inventory in Fen Meadows
Linda Nol,* Peter H. Verburg, Gerard B. M. Heuvelink, and Karin Molenaar Wageningen University
Every land cover map or database is a simplifi cation of the
complexity of a real landscape (Arbia et al., 1998; Regnauld,
2001; Schmit et al., 2006). However, the scale and mapping
technique are a source of variation when comparing diff erent land
cover maps (Ellis, 2004; Bach et al., 2006; Schmit et al., 2006;
Verburg et al., 2006). Diff erences between a land cover database and
a real landscape are a source of error when the database is utilized
(Foody, 2002; Fang et al., 2006; Fassnacht et al., 2006). Th e large
dependence of greenhouse gas emissions on land use makes land
cover data an essential input in greenhouse gas inventories (Kern et
al., 1997; Plant, 1999; Denier van der Gon et al., 2000; Matthews
et al., 2000). Recently Huff man et al. (2006) acknowledged
the need for highly accurate, high-resolution, and nationally
consistent land cover data, while others have argued for statistically
rigorous and accurate assessment of thematic maps (Stehman
and Czaplewski, 1998; Heuvelink and Burrough, 2002). A lot of
research has been performed to improve greenhouse gas inventories
(Li et al., 1992; Kroeze, 1994; Denier van der Gon and Bleeker,
2005; Stacey et al., 2006), but careful analysis of how systematic
errors in land cover data aff ect these inventories has received little
attention. Often considerable emphasis is given to the provision of
the most exact input data possible for soil and climate while little
thought is given to the quality and accuracy of land cover or land
use data (Jansen, 1998; Bach et al., 2006). Bareth et al. (2001)
noted that the accuracy of spatial data should be regarded with more
importance in the estimation of N2O emissions.
Signatories to the Kyoto Protocol (UNFCCC, 1997) must an-
nually report emissions of their greenhouse gases CO2, CH
4, and
N2O. Th e Intergovernmental Panel on Climate Change (IPCC)
has established Good Practice Guidelines for reporting and upscal-
ing national greenhouse gas emissions. Th e inventory methods are
divided into three levels of increasing complexity and classifi ed as:
Tier 1, Tier 2, and Tier 3 (IPCC, 1997; IPCC, 2000). Th e Tier
1 and Tier 2 methods are based on the assumption that the total
N2O emission is a summation of emissions from diff erent sources,
which can be estimated by activity data (data on production and
consumption of N) multiplied by an emission factor (the fraction
of soil N emitted as N2O). Th e Tier 1 method is the most basic
method and uses default emission factors and spatially coarse ac-
tivity data. Th e Tier 2 method consists of the same basic relation-
ships but is based on emission factors and activity data which are
country-specifi c for the most important land uses and activities.
Th e Tier 3 method on the other hand requires nonlinear process
modeling. Examples of frequently used process models, as part of
Land Dynamics, Environmental Science Group, Wageningen Univ., P.O. Box 47, 6700
AA Wageningen, The Netherlands.
Copyright © 2008 by the American Society of Agronomy, Crop Science
Society of America, and Soil Science Society of America. All rights
reserved. No part of this periodical may be reproduced or transmitted
in any form or by any means, electronic or mechanical, including pho-
tocopying, recording, or any information storage and retrieval system,
without permission in writing from the publisher.
Published in J. Environ. Qual. 37:1209–1219 (2008).
doi:10.2134/jeq2007.0438
Received 21 Aug. 2007.
*Corresponding author ([email protected]).
© ASA, CSSA, SSSA
677 S. Segoe Rd., Madison, WI 53711 USA
TECHNICAL REPORTS: LANDSCAPE AND WATERSHED PROCESSES

1210 Journal of Environmental Quality • Volume 37 • May–June 2008
the Tier 3 method, are DNDC (Li et al., 1992; Li, 2000) and
CENTURY (Parton, 1996).
Many countries are still striving to fulfi ll the Kyoto report-
ing requirements (Brown et al., 2002; Bolan et al., 2004; Saggar
et al., 2004). Especially problematic are inventory methods for
N2O emissions from agricultural soils (Lokupitiya and Paustian,
2006). For the Netherlands Kuikman et al. (2004) stated that cur-
rent reporting to the Kyoto protocol is incomplete or inaccurate:
several sources may not have been identifi ed and others may well
be reported incompletely. Accordingly, it is important to focus on
decreasing the uncertainty and improving data quality of N2O
emissions from agricultural soils. An important source of N2O
emissions from agricultural soils is the emission from ‘cultivation
of histosols’, which diff ers from estimation of other agricultural
N2O sources because it requires spatial input data. Cultivation of
histosols leads to oxidation of organic matter from peat soils due to
the lowering of ground water tables in cultivated areas. Emission
of N2O from cultivated histosols in the Netherlands has been esti-
mated to contribute 10% of the direct N2O emissions from soils
and 5% of the total N2O emissions from agriculture (Klein Gold-
ewijk et al., 2005). Histosols cover a signifi cant area (approximately
9% of the land surface) in the Netherlands (Kuikman et al., 2005;
CBS, 2007) and are predominantly situated in the fen meadow
landscape in the western part of the Netherlands. Th e main land-
scape elements of Dutch fen meadow systems are grassland parcels,
ditches, and ditch banks, each with specifi c emission characteristics
(Best and Jacobs, 1997; Van Beek et al., 2004).
Th e estimation of land surface area occupied by histosols and
the main landscape elements depend on the available spatial input
information and associated resolution. Th e scale of analysis or kind
of information an investigator desires also infl uences the outcomes
of the inventory. For example, if an investigator can choose be-
tween diff erent land cover databases, each with a diff erent resolu-
tion, then the choice for a certain database depends on the element
of interest (Woodcock and Strahler, 1987). Th e optimum scale
of analysis is usually the scale at which processes, in this case N2O
emission, occur (Allen et al., 1984). Denitrifi cation and nitrifi ca-
tion are the most important processes in converting N into N2O in
soils (Firestone and Davidson, 1989). Th ese processes take place at
the microbial scale, whereas national inventories require emissions
to be reported on a national scale. Th ese inventories are often based
on emission factors derived from small-scale chamber measure-
ments (0.03–6 m2). Th e chamber measurements in fen meadow
landscapes have mainly taken place on grassland parcels, preferably
not too close to the ditch (Ambus and Christensen, 1994). Since
diff erent landscape elements have diff erent emission characteris-
tics, it is worthwhile estimating the surface area of the diff erent
landscape elements using land cover databases and investigating
the eff ect of using these land cover databases on the N2O emission
inventory. Th e objective of this paper was to analyze how diff erent
land cover representations potentially introduce systematic errors
into the results of regional N2O emission inventories. To this end
fi ve diff erent land cover databases with diff erences in spatial resolu-
tion and accuracy were used in combination with four emission
inventory methods. Understanding the infl uence of land cover
databases on regional emission may help in the further refi nement
of reporting protocols.
Materials and MethodsNitrous oxide emissions were calculated using diff erent
upscaling methods based on alternative land cover databases
for two representative landscapes in the Dutch fen meadow
system. Regional implications of using alternative land cover
databases were analyzed by scaling the results up to the fen
meadow landscape of the western Netherlands.
Study AreaTh e Dutch fen meadow landscape (Fig. 1) was formed in the
Holocene, when the sea level was rising and large areas of the
Netherlands were covered by swamps. In medieval times, this land
was reclaimed for agricultural use. A popular way of reclaiming the
land was by ‘cope agreements’. In these agreements, the length of
the parcel was usually prescribed to be about ten times the width
of the parcel. Th is pattern of parcels with the same shape is still
recognizable in the fen meadows. However, a common strategy
was not applied everywhere resulting in areas with more irregular
reclamations. Between the sixteenth and the nineteenth century
oligotrophic peat was excavated and used as fuel. Today, lakes and
grassland intersected by wide ditches are located in these areas. Th e
western fen meadow landscape exists primarily of grassland on
peat soils and is intensively managed and owned by dairy farmers;
however, more and more grassland is being extensively managed
by nature organizations. We assumed the fen meadow landscape to
be located on peat soils according to the Dutch soil map 1:50,000
(De Vries et al., 2003a). Th e borders of the western fen meadow
landscape, located on peat soils, were assumed to be the ‘IJsselmeer’
at the north eastern boundary and the line dividing land below and
above sea level as the south eastern boundary of the landscape.
Th e Zegveld and Oukoop polders (Fig. 1) were chosen
as case studies of the two most dominant reclamation types
within the Dutch fen meadow landscape: cope (regular) and
irregular reclamation.
Th e Zegveld polder (52°08′ N 4°48′ E) has a surface area
of 670 ha (Fig. 1) and is representative of the ‘cope’ reclama-
tion type. Th e area was reclaimed in the eleventh century. Th e
village of Zegveld (Fig. 1; south corner) was the reclamation
Fig. 1. Location of the research polders in the Netherlands.

Nol et al.: Eff ect of Land Cover Data on Nitrous Oxide Inventory in Fen Meadows 1211
base from where the reclamation of the area started. Th e par-
cels stretch from Zegveld to the peat river Meije bordering the
north of the polder. Many farms have settled in the center of
the parcels. Th e polder was one of the latest reclamations in the
area, which gave the polder its peculiar shape. At the reclama-
tion base in the south the parcels are narrow becoming wider
toward the north. Th e polder is predominantly drained 60-cm
depth but an area of natural vegetation (25 ha) in the northwest
is drained at approximately 30 cm below surface level.
Th e Oukoop polder (52°03′ N 4°43′ E) is smaller than the
Zegveld polder and has a surface area of 168 ha (Fig. 1). Th e
area was reclaimed in the eleventh or twelfth century and is
representative of the reclamation type with wide ditches. Th e
polder was enclosed by reclamations from the Hollandse IJssel
river in the south, the Oude Rijn river in the north, and an old
stream (the ‘Oude Wetering’) in the east. Both peat soils are
classifi ed as Terric Histosol and originate from wood and reeds.
Land Cover DatabasesSurface areas occupied by grassland parcels, ditches, and
ditch banks were estimated for the two research polders and
for the entire western fen meadow landscape based on fi ve
land cover databases. Th e emissions of nitrous oxide from the
Dutch fen meadows diff er with elements in the landscape.
Th erefore, these landscape elements were separately accounted
for in the analysis. Th e fi ve land cover databases used, more
or less ranked in order of decreasing resolution and accuracy,
were: a detailed fi eld map unit of the distinguished landscape
elements, Top10Vector, LGN4, CBS soil use, and CLC2000.
Fang et al. (2006) pinpointed the importance of taking the
uncertainty of land cover databases into consideration when using
these for landscape studies. Th e fi ve databases used in this study
diff er in uncertainty. Uncertainties in vector databases can be
subdivided into geometric uncertainty and thematic uncertainty
(Heuvelink et al., 2007). Geometric or positional uncertainty is
uncertainty about the shape and the location of an object. Th emat-
ic uncertainty is uncertainty about the attribute values of an object
and occurs in both vector and raster data. It is mainly caused by
interpolation errors and wrong classifi cation of pixels or mapping
units (Bolstad and Smith, 1992; Foody, 2002; Steele et al., 1998;
Van Oort, 2005). Th e resolution or minimum mapping unit of the
land cover database is a source of geometric uncertainty (Hengl,
2006). Th is problem, the modifi able areal unit problem, is especial-
ly problematic when there are discrete changes within landscapes.
Depending on the resolution and shape of data elements, almost
any result may be obtained (Openshaw, 1983). In this paper the ef-
fect of the diff erences in geometry and resolution on the estimation
of the prevalence of the diff erent landscape elements, important to
nitrous oxide emission, was evaluated. Details about the used land
cover databases are given in Table 1.
Th e goal of the fi eld map was to accurately delineate ditches
and ditch banks (positional uncertainty < 0.2 m in width), thus
yielding the surface area of these landscape elements with negligible
bias (i.e., much smaller than bias associated with the four com-
monly used databases). Th e aim was to measure all ditch widths
in the polder, but due to inaccessibility a number of ditch widths
had to be estimated. In polder Zegveld 91% of all ditches were
measured, 8% were estimated in the fi eld, and 1% was estimated
using the Top10Vector and aerial photographs. In polder Oukoop
68% of all ditches were measured, 12% were estimated in the
fi eld, and 20% were estimated using the Top10Vector and aerial
photographs. Th e boundary between ditch bank and grassland was
defi ned as the line that separates areas with a clear slope gradient
from those without a slope or with minimal relief (slope < 1°). Th e
surface area of ditches and ditch banks were then calculated using
the widths from the fi eld map and the lengths from the Top10Vec-
tor topographic database. Th is was acceptable because the bias of
the Top10Vector in ditch lengths was small compared to the bias
in ditch widths. Th e Top10Vector was used as the basis for the fi eld
map, the ditches were adjusted to the measured ditch widths and
ditch banks were added. In the database resulting from the fi eld
map, a distinction was made between intensively and extensively
managed grassland. Th e extensively managed grassland was man-
aged by a governmental organization, and was unfertilized and
grazed by sheep and beef cattle. Th e grazing pressure is lower than
on the intensively managed grassland, used for dairy cattle.
Th e Top10Vector database is a detailed topographic database
of the Netherlands made by the Dutch National Mapping Agen-
cy (TDK). Th e Top10Vector is a vector fi le with a closed fi eld
structure; built up from coded lines enabling the user to select
fi elds with certain characteristics. Th e Top10Vector is based on
aerial photograph interpretation in combination with fi eld inves-
tigation. It consists of several point, line, and polygon layers. Th e
database is partly updated every year and the entire Netherlands
is updated each 4 yr. Th e geometric uncertainty of the Top10Vec-
tor database is estimated at 2 m (Van Buren et al., 2003).
Th e CBS soil use database consists of soil use areas and
boundaries. For agricultural land cover the only distinction made
is between horticulture under glass and other agricultural use.
Th e Top10Vector was used for the basic geometry (water, rail-
roads, and roads). Th e geometric uncertainty of the topography
is also 2 m (CBS, 2002). Th e main diff erence is the larger mini-
mum mapping unit of the CBS soil use database (Table 1), which
leads to an additional source of geometric uncertainty. In the
analysis of the results, the linkage between the two databases was
taken into account. Th e CBS soil use database provides insight
into the distribution of diff erent soil use types in the Netherlands
and is used by the Statistics Netherlands (CBS) for deriving sur-
face area and density statistics for regional classifi cations.
Th e LGN4 is a land use database for the Netherlands and is
based on satellite images from 1999 and 2000 (De Wit, 2001).
Th e LGN4 exists of grid data and vector data of crops. Th e grid
data contain the dominant land cover type per 25 by 25 m grid
cell. In total 39 land cover types are distinguished. In this research
only grid data were used, because only surface areas water and
grassland are of interest. Th e main diff erence between LGN4 and
the CBS soil use database is that LGN4 focuses on agricultural land
cover whereas CBS soil use is more focused on urban land cover.
Th e category agriculture is split into ten classes and the category
nature has seventeen classes where a distinction is made between
intensively and extensively managed grassland. Validation of the
LGN4 was estimated by checking 4000 points using aerial photos

1212 Journal of Environmental Quality • Volume 37 • May–June 2008
and the Top10Vector. Th e overall thematic accuracy of the LGN4
was estimated to be 92.2% (GeoDesk, 2006). However, large dif-
ferences exist between classes. Classes with large abundances are
generally more accurate than less abundant classes.
Th e CLC2000 database is produced by the European En-
vironment Agency (EEA). Th e database was made as part of
the project COoRdinate INformation on the Environment
(CORINE). CLC2000 is a raster image, which has a resolution
of 100 m. Th e CLC2000 is based on satellite images, which were
interpreted by national teams. In the Netherlands vector data-
bases of land cover (Hazeu, 2003) were developed for 1986 and
2000 where changes in land cover between these years were also
mapped. Th e minimum mapping unit for these vector databases
is 25 ha and for changes in land cover between 1986 and 2000
the minimum mapping unit is 5 ha. Th ese national databases
were joined together and converted into the raster database
CLC2000 using the majority rule (Büttner et al., 2002). Th is da-
tabase distinguishes 44 land cover classes. Th e thematic accuracy
of the CLC2000 was estimated to be 87.0 ± 0.5% (EEA, 2006).
Nitrous Oxide Emission EstimationFor the Zegveld and Oukoop polders N
2O emissions were
estimated using four methods: IPCC Tier 1, Tier 2a, Tier 2b,
and Tier 3. Th e IPCC Tier 1 method estimates emissions by
multiplying global activity data by default emission factors (Ta-
ble 2). Th e emission factor is the fraction of N emitted as N2O.
Emission factors and activity data from the Good Practice
Guidance (IPCC, 2000) and the IPCC Guidelines (IPCC,
1997) were used. When activity data were not indicated in the
Good Practice Guidance, estimates from CBS (2007) were
used. In the Tier 1 method land cover data are used for the esti-
mation of the emission due to the cultivation of histosols. Th e
estimated surface area of grassland on peat soil from each land
cover database and the default emission factor were used. In the
polder Oukoop, only negligible N2O emissions from ditches
and ditch banks were measured (based on weekly closed cham-
ber measurements by Schrier (personal communication, 2005,
2006, and 2007) see also Table 3). Th e emissions from ditches
and ditch banks in polder Zegveld were also assumed negli-
gible, because the soil, land use, and hydrological conditions in
this polder are very similar to those of polder Oukoop.
Two alternative specifi cations of the IPCC Tier 2 method are
considered in this study hereafter referred to as Tier 2a and Tier
2b. Th e Tier 2a method uses activity data and emission factors as
reported in the most recent Dutch inventory report (Klein Gold-
ewijk et al., 2005) while the Tier 2b method uses polder-specifi c
activity data (i.e., number of animals, amount of fertilizer used)
gathered from door-by-door interviews with farmers. Five of the
twenty farmers in Zegveld were interviewed; together they own
31% of the area in the polder. In Oukoop all eleven farmers were
interviewed. All farmers could give animal numbers, separated into
mature dairy cattle, yearlings, calves, sheep, lambs, goats, and pigs.
Based on these interviews, an estimation of the total amount of
cattle, manure amendment, and fertilizer application was made.
For the Tier 2a method activity data from the municipality or
agricultural region (CBS, 2007) were used. Th is information was
scaled down to the scale of the research polders as follows. Agricul-
tural activity data in the Netherlands, such as the number of cows
and the amount of chemical fertilizers used in an area, are cor-
related to the amount of grassland in that area. Th erefore, activity
data for the polder were estimated by multiplying the activity data
from municipality/agricultural region by the ratio of grassland in
the polder to grassland in the municipality/agricultural region.
For the Tier 3 level inventory the process model INITIA-
TOR (De Vries et al., 2003b) was used. Th e model was devel-
oped to represent the crucial processes in the N chain by simple
process descriptions, calculated in yearly time steps. Input data
were taken from the CBS (2007) concerning animal numbers,
manure management systems, and fertilizer use. Inputs from
the land cover databases were also used. Soil characteristics
from the Dutch Soil map (Stiboka, 1969) and hydrological
characteristics (Wolf et al., 2003) were added. INITIATOR
uses a process model in which N2O emission is a function
of denitrifi cation and nitrifi cation in the soil (De Vries et al.,
2003b). Unlike the IPCC methods, the emission factors and
denitrifi cation and nitrifi cation fractions vary as a function of
soil type and groundwater level in INITIATOR (Table 2).
Analysis of variance (ANOVA) was used to analyze wheth-
er diff erences between land cover databases for the polders are
signifi cant and whether diff erences between inventory meth-
ods are signifi cant.
Regional UpscalingIn addition to comparing the calculated emissions for the two
research polders an assessment of the regional implications of the
use of diff erent databases was made for the entire Dutch western
fen meadow landscape. Th e fi eld map of the research polders
was scaled up to estimate the surface areas of diff erent landscape
Table 1. Characteristics of land cover databases.
Database Type Year of validityMinimum
mapping unit Grid cell size Projection Extent No. of categories Source
Field map Vector 2006 0.2 m (ditch)2 m (roads)
– RD (Dutch)‡ Polder ZegveldPolder Oukoop
12 –
Top10Vector Vector 2000–2004 3 m (ditch)2 m (roads) †
– RD (Dutch)‡ Netherlands 50 TDN (2006)
CBS soil use Vector 2000 10,000 m2 § – RD (Dutch)‡ Netherlands 38 CBS (2002)
LGN4 Raster 1999/2000 5000 m2 25 m RD (Dutch)‡ Netherlands 39 GeoDesk (2006)
CLC2000 Raster 2000 250,000 m2 100 m Lambert Azimuthal Europe 43 EEA (2000)
† Vliegen (2000).
‡ RD = Dutch National Grid.
§ Except for roads and railroads, which are all included in the database.
Nol et al.: Eff ect of Land Cover Data on Nitrous Oxide Inventory in Fen Meadows 1213
elements and derive emission inventories using the
various approaches for the larger region. For upscaling
the fen meadow landscape was subdivided into three
diff erent reclamation landscapes: ‘cope’ reclamations,
reclamations with wide ditches, and irregular reclama-
tions. Th is distinction was made because these three
reclamation landscapes diff er in the prevalence of
landscape elements due to diff erences in the shape of
grassland parcels and open water due to diff erences
in reclamation history. All three reclamation types are
common in the western fen meadow landscape. Th e
Top10Vector database was used to assign the type
of reclamation landscape to each of the 315 polders
in the western fen meadow landscape. Th e surface
areas of landscape elements found in the two research
polders were used to estimate the distribution of
these landscape elements in the fen meadows. Polder
Zegveld was considered to be representative for ‘cope’
reclamation patterns with a regular pattern of predom-
inantly rectangular parcels divided by small ditches.
Th e length/width ratio of the parcels is approximately
10:1. Th e selection procedure for this type of reclama-
tion is therefore based on the length/width ratio of the
parcels. Polders where more than 70% of the parcels
have a length/width ratio equal or greater to 10:1
were considered to be ‘cope’ reclamations. Twenty to
thirty percent of the parcels in ‘cope’ reclamations have
smaller width/length ratio, because these are situated
at the edge of the polder or are dissected by a road.
Th e second reclamation landscape can be described as
polders with signifi cant areas of open water. Usually
these polders have wide ditches in between the parcels.
Polder Oukoop was used as a reference polder for this
reclamation landscape. Th e procedure to distinguish
these polders at the regional level was based on the
occurrence of open water and ditches wider than 3 m
in the polders. Note that the Top10Vector database
represents ditches smaller than 3 m as line elements.
Polders with surface areas of water equal to or larger
than 10% of the grassland surface areas, according to
the Top10Vector, were therefore classifi ed as reclama-
tions with wide ditches. Th is percentage was derived
from the standard width of parcels in this area and the
average ditch width. Th e remaining polders were clas-
sifi ed as irregular reclamations. A representative for this
reclamation landscape is polder Menningweer where
Molenaar (unpublished data, 2006) made a detailed
fi eld map. After classifying the polders based on the
three reclamation landscapes and assignment of the
accompanying surface areas of landscape elements,
the total surface areas of grassland parcels, ditches, and
ditch banks were estimated. Th ese surface areas were
used to estimate the total agricultural N2O emission
from the Dutch western fen meadow landscape. For
each land cover database the amount of grassland on
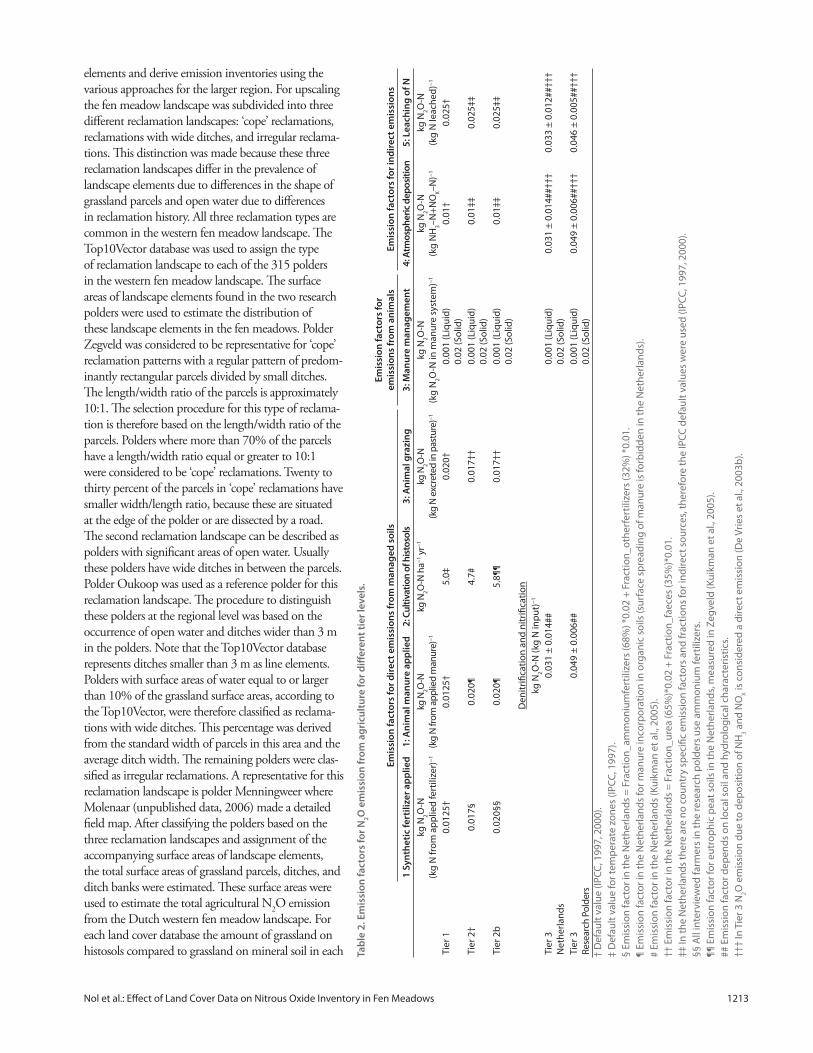
histosols compared to grassland on mineral soil in each Tab
le 2
. Em
issi
on
fa
cto
rs f
or
N2O
em
issi
on
fro
m a
gri
cult
ure
fo
r d
iff e
ren
t ti
er
lev
els
.
Em
issi
on
fa
cto
rs f
or
dir
ect
em
issi
on
s fr
om
ma
na
ge
d s
oil
s
Em
issi
on
fa
cto
rs f
or
em
issi
on
s fr
om
an
ima
lsE
mis
sio
n f
act
ors
fo
r in
dir
ect
em
issi
on
s
1 S
yn
the
tic
fert
iliz
er
ap
pli
ed
1: A
nim
al m
an
ure
ap
pli
ed
2: C
ult
ivat
ion
of h
isto
sols
3: A
nim
al g
razi
ng
3: M
an
ure
ma
na
ge
me
nt
4: A
tmo
sph
eri
c d
ep
osi
tio
n5
: Le
ach
ing
of
N
kg N
2O
-N
(kg
N f
rom
ap
plie
d f
ert
ilize
r)−
1
kg N
2O
-N
(kg
N fr
om
ap
plie
d m
anu
re)−
1
kg N
2O
-N h
a−1 y
r−1
kg N
2O
-N
(kg
N e
xcre
ted
in p
astu
re)−
1
kg N
2O
-N
(kg
N2O
-N in
ma
nu
re s
yste
m)−
1
kg N
2O
-N
(kg
NH
3–
N+
NO
X–
N)−
1
kg N
2O
-N
(kg
N le
ach
ed
)−1
Tie
r 1
0.0
12
5†
0.0
12
5†
5.0
‡0
.02
0†
0.0
01
(Li
qu
id)
0.0
2 (
So
lid)
0.0
1†
0.0
25
†
Tie
r 2
†0
.01
7§
0.0
20
¶4
.7#
0.0
17
††
0.0
01
(Li
qu
id)
0.0
2 (
So
lid)
0.0
1‡
‡0
.02
5‡
‡
Tie
r 2
b0
.02
0§
§0
.02
0¶
5.8
¶¶
0.0
17
††
0.0
01
(Li
qu
id)
0.0
2 (
So
lid)
0.0
1‡
‡0
.02
5‡
‡
De
nit
rifi
cati
on
an
d n
itri
fi ca
tio
n
kg N
2O
-N (
kg N
inp
ut)
−1
Tie
r 3
Ne
the
rla
nd
s
0.0
31
± 0
.01
4#
#0
.00
1 (
Liq
uid
)
0.0
2 (
So
lid)
0.0
31
± 0
.01
4#
#†
††
0.0
33
± 0
.01
2#
#†
††
Tie
r 3
Re
sear
ch P
old
ers
0.0
49
± 0
.00
6#
#0
.00
1 (
Liq
uid
)
0.0
2 (
So
lid)
0.0
49
± 0
.00
6#
#†
††
0.0
46
± 0
.00
5#
#†
††
† D
efa
ult
va
lue
(IP
CC
, 19
97
, 20
00
).
‡ D
efa
ult
va
lue
fo
r te
mp
era
te z
on
es
(IP
CC
, 19
97
).
§ E
mis
sio
n f
act
or
in t
he
Ne
the
rla
nd
s =
Fra
ctio
n_
am
mo
niu
mfe
rtili
zers
(6
8%
) *0
.02
+ F
ract
ion
_o
the
rfe
rtili
zers
(3
2%
) *0
.01
.
¶ E
mis
sio
n f
act
or
in t
he
Ne
the
rla
nd
s fo
r m
an
ure
inco
rpo
rati
on
in o
rga
nic
so
ils (
surf
ace
sp
rea
din
g o
f m
an
ure
is f
orb
idd
en
in t
he
Ne
the
rla
nd
s).
# E
mis
sio
n f
act
or
in t
he
Ne
the
rla
nd
s (K
uik
ma
n e
t a
l., 2
00
5).
††
Em
issi
on
fa
cto
r in
th
e N
eth
erl
an
ds
= F
ract
ion
_u
rea
(6
5%
)*0
.02
+ F
ract
ion
_fa
ece
s (3
5%
)*0
.01
.
‡‡
In t
he
Ne
the
rla
nd
s th
ere
are
no
co
un
try
spe
cifi
c e
mis
sio
n f
act
ors
an
d f
ract
ion
s fo
r in
dir
ect
so
urc
es,
th
ere
fore
th
e IP
CC
de
fau
lt v
alu
es
we
re u
sed
(IP
CC
, 19
97
, 20
00
).
§§
All
inte
rvie
we
d f
arm
ers
in t
he
re
sea
rch
po
lde
rs u
se a
mm
on
ium
fe
rtili
zers
.
¶¶
Em
issi
on
fa
cto
r fo
r e
utr
op
hic
pe
at
soils
in t
he
Ne
the
rla
nd
s, m
ea
sure
d in
Ze
gve
ld (
Ku
ikm
an
et
al.,
20
05
).
##
Em
issi
on
fa
cto
r d
ep
en
ds
on
loca
l so
il a
nd
hyd
rolo
gic
al c
ha
ract
eri
stic
s.
††
† In
Tie
r 3
N2O
em
issi
on
du
e t
o d
ep
osi
tio
n o
f N
H3 a
nd
NO
X is
co
nsi
de
red
a d
ire
ct e
mis
sio
n (
De
Vri
es
et
al.,
20
03
b).

1214 Journal of Environmental Quality • Volume 37 • May–June 2008
agricultural region (CBS, 2007) was calculated to estimate activity
data such as amount of cattle and amount of fertilizer use. When
emission factors derived from the Dutch situation were available
(Klein Goldewijk et al., 2005), these were used. For some N2O
sources, emission factors have not been determined in the Neth-
erlands (i.e., for indirect emissions), and default emission factors
were used.
Th e emission of the western fen meadows was also estimated
using INITIATOR, based on data on soils, hydrology, and land
use data from the STONE database (Wolf et al., 2003).
Results and Discussion
Land Cover RepresentationsRepresentations of landscape structure in the diff erent land
cover databases are shown in Fig. 2 and 3. Th e enlargements in
Fig. 2 and Fig. 3 clarify the diff erence between the fi eld map and
the Top10Vector database. Th e Top10Vector database represented
ditches smaller than 3 m as lines and did not make a distinction
between ditch banks and grassland. Th e fi eld map represented all
ditches as polygons and was the only database that distinguished
between ditch banks and grassland. Th e CBS soil use database
ignored farmyards, farms, and small ditches due to the large
minimum mapping unit compared to the fi eld map and the
Top10Vector. Only the village center of Zegveld was represented
as a residential area. Th e LGN4 and the fi eld map databases distin-
guished between intensively managed grassland and extensive man-
aged nature area. For both polders, the LGN4 database recorded
a considerable surface area of ‘urban in agricultural area’ compared
to the CBS soil use and CLC2000 database. As a result, the LGN4
database recorded a reduced grassland area compared to the other
databases. Raster databases have diffi culties representing point and
line features that are smaller or equal to the pixel size. Th e farms
with farmyard in the polders are features that were represented by
the LGN4 database as square and rectangular shapes, which were
often diff erent from their real shape (i.e., the fi eld map). Th e coarse
CLC2000 raster database showed the entire polder covered with
grassland, except for one pixel in the Zegveld polder and for one
pixel in the Oukoop polder.
Surface areas of (intensively and extensively managed) grassland
parcels, ditches, and ditch banks as calculated using the diff erent
databases are given in Table 4. Except for the fi eld map the land
cover data did not have a separate class for ditch banks. Th ese
were all classifi ed as grassland. Th e fi eld map showed the smallest
surface area of grassland and the largest surface area occupied by
water and ditch banks. Th e grassland surface area increased with
increased minimum mapping unit for vector data and increased
with increased resolution for raster data. Th is can be explained
by the dominance of grassland which, when presented at coarser
Fig. 2. Representations of polder Zegveld using diff erent land cover databases.
Table 3. Nitrous oxide emission from grassland, ditch, and ditch bank. Emissions were non-continuously measured using fl ux chambers.
Treatment N2O loss
kg N2O ha−1 yr−1
Dry grassland parcel
Unfertilized 13.5†
Fertilized 28.4†
Fertilized and grazed 60.5†
Wet grassland parcel
Unfertilized 3.1†
Fertilized 13.8†
Fertilized and grazed 22.9†
Ditch bank negligible‡
Ditch negligible‡
† Velthof (1997).
‡ Schrier (personal communication, 2007). In polder Oukoop, N2O
emissions from ditches and ditch banks were below the detection limit
of the measurement equipment.

Nol et al.: Eff ect of Land Cover Data on Nitrous Oxide Inventory in Fen Meadows 1215
scales, results in a general overestimation of its prevalence (Moody
and Woodcock, 1996; Schmit et al., 2006). In vector data, ditches
are ignored when they are < 3 m (Top10Vector) or have a surface
area < 1 ha (CBS soil use). In raster data, ditches are ignored when
another type of land cover is more abundant within a pixel.
Overestimation of land cover classes with large abundances has
also occurred in other landscapes (Turner et al., 1989; Moody and
Woodcock, 1996; Ellis et al., 2000; Fassnacht et al., 2006; Schmit
et al., 2006). In the fen meadow landscape, grassland has a large
abundance and therefore absorbs the other classes, especially for
the databases with small accuracies and coarse resolutions. Other
landscapes are less sensitive to aggregation errors (e.g., Turner et al.,
1989). Moody and Woodcock (1995) analyzed a mountainous
forested area in California and found an increasing prevalence of
water with increasing resolution due to lakes with a high degree of
aggregation situated sparsely across the landscape. Th e class “coni-
fers” also increased on average by 20% when aggregating from a
resolution of 30 to 100 m. Th ey concluded that the large increase
in this class was due to the spatial structure of moderately large
patches. Th e results found by Moody and Woodcock (1995)
are large compared with the 7 to 8% diff erence in grassland
in our study areas between the LGN4 (25-m resolution) and
CLC2000 (100-m resolution) databases. On the other hand,
Bach et al. (2006) and Fassnacht et al. (2006) found smaller
diff erences between land use classes when aggregating from 25
to 100 m. Van Oort et al. (2004) compared the LGN database
with reference data from randomly chosen areas in the Nether-
lands. Th e reference data were based on cadastral information.
Th e grassland surface area was 2.5% larger for the LGN database
than for the reference data. We found larger diff erences between
the LGN4 and the fi eld map (20–22%). Th is is probably due to
the fact that Van Oort et al. (2004) only estimated areas of grass-
land and crops, where we found a large diff erence due to the
presence of ditches instead of grassland. In research where thematic
errors are small, positional errors can be large (Bach et al., 2006).
Fassnacht et al. (2006) found the class “broadleaf,” which forms
narrow linear features along rivers, to be particularly susceptible to
changes in resolution. Th is is comparable to our fi ndings of ditches
and ditch banks. Ozdogan and Woodcock (2006) also noted that
large landscape elements can support large pixels, but when the
landscape elements of interest are small, fi ne resolution is needed to
correctly estimate surface areas.
Nitrous Oxide Emission EstimatesUsing inventory techniques based on the diff erent IPCC tier
levels we calculated N2O emissions with the calculated surface areas
(Fig. 4). Bias in estimating the area of grassland was propagated in
the calculated emissions. For all Tier levels and for both polders the
most accurate database represented the smallest area of grassland
and accordingly the smallest N2O emission. Th e N
2O emissions
from polder Oukoop are about four times smaller than N2O emis-
sions from polder Zegveld, which is consistent with the diff erence
Fig. 3. Representations of polder Oukoop using diff erent land cover databases.
Table 4. Surface areas land cover types per land cover database.
Database
Total
grassland
Intensively
managed grassland
Extensively
managed grassland Water
Ditch
bank
——————————––——ha——————————––——Polder Zegveld
Field map 513 434 70 70 33
Top10Vector 586 – – 30 –
CBS soil use 640 – – 19 –
LGN4 627 579 47 8 –
CLC2000 669 – – 0 –
Polder Oukoop
Field map 115 86 29 35 10
Top10Vector 142 – – 19 –
CBS soil use 152 – – 15 –
LGN4 155 155 0 8 –
CLC2000 167 – – 1 –

1216 Journal of Environmental Quality • Volume 37 • May–June 2008
in total surface area between the polders. Th e Tier 3 method pro-
duced the highest N2O emissions for both polders and for all land
cover databases (Fig. 4d and 4h). Furthermore, the Tier 3 method
showed the largest diff erences between emission estimates (24% for
polder Zegveld and 33% for polder Oukoop) because this method
was more dependent on spatial data. Estimated N2O emission per
hectare ranged from 20.0 to 47.1 kg N2O ha−1 yr−1, which is com-
parable to the emissions found by Velthof (1997; Table 3).
For polder Zegveld the emissions of N2O estimated with
the Tier 2b method (Fig. 4c), were higher than the emis-
sions estimated with the Tier 1 (Fig. 4a) and Tier 2a (Fig. 4b)
method. From the interviews, it turned out that more cattle
were present in the polder than estimated from the munici-
pality data (Tier 1 and Tier 2a). Another reason is that the
dairy cattle had, according to the local data, spent more time
in the meadow than global and Dutch numbers indicated.
For both polders, the smallest N2O emissions were obtained
from the Tier 1 method (Fig. 4a and 4e). Th e emission factors in
the Tier 2 methods were larger and caused higher emission estima-
tions. In polder Oukoop the diff erence between Tier 2a (Fig. 4f)
and Tier 2b (Fig. 4g) was small, indicating that the activity data
from the CBS database were close to the activity data estimated
from the interviews. Results from the Tier 3 method (Fig. 4d and
4h) were high for both polders compared to the other methods.
Th e INITIATOR estimates for N2O emission are based on the
amount of denitrifi cation and nitrifi cation. Because the peat soils
in the western fen meadows landscape have excellent conditions
for nitrifi cation and denitrifi cation, the emissions estimated by
INITIATOR were much higher than the emissions estimated by
other inventory methods. As shown in Fig. 4, diff erences between
inventory methods were larger than diff erences between land cover
databases, which was also confi rmed by analysis of variance (ANO-
VA). For both polders, the emission estimates diff ered signifi cantly
between all inventory methods, except for polder Oukoop between
methods Tier 2a and Tier 2b. Due to the high emissions estimated
by the Tier 3 (INITIATOR) method, the diff erences between land
cover databases were not signifi cant, except for polder Zegveld be-
tween the LGN4 and CBS soil database.
Regional ExtrapolationTh e surface area distribution of grassland parcels, ditches, and
ditch banks from the research polders were used to scale up to the
entire western fen meadow landscape (Table 5). Th e three polders
(Oukoop, Zegveld, and Menningweer) were assumed to be rep-
resentative for all Dutch fen meadow polders. Th is is assumed to
be correct for the purpose of examining the impact of scale bias
in land cover data for estimating regional N2O emissions.
Th e reclamation landscape with wide ditches contained about
twice as much open water as the other two landscape types. Th e
irregular reclamation landscape had the smallest share in ditch
banks, which can be explained by the large abundance of square
parcels compared to more elongated parcels in the other reclama-
tion landscapes. Figure 5 shows a map of the western fen meadow
including a classifi cation of the polders in reclamation landscapes.
Intersecting rivers and disappearance of peat due to peat
excavation caused fragmentation of the western fen meadow
landscape. In the southern part ‘cope’ reclamations were
abundant. Th e irregular reclamation landscape is common
in the northern part of the western fen meadow landscape,
where there was no common strategy during the reclamation
period. Th e reclamations with wide ditches were most abun-
dant near locations where the peat was excavated for fuel use.
Th e area of grassland based on the fi eld map was considerably
smaller than the other estimated areas of grassland (Table 6).
Th e fi eld map was used to estimate the extent of ditches
in the western fen meadow landscape, where other databases
reported larger areas of grassland. According to the Dutch Soil
map 36% of the Dutch peat soils are situated in the western
fen meadow landscape. In the current national inventory, the
total surface area of grassland on organic soils equals 231,000
ha (Klein Goldewijk et al., 2005). Assuming that there are no
meaningful nationwide diff erences between the proportion
of land on peat soils occupied by grassland, this suggests that
83,000 ha of grassland is located in the western fen meadow
landscape. Th is estimate is smaller than the estimates from the
Table 5. Surface area distribution of landscape elements in research polders used as reference for upscaling.
Landscape elements
Research polderReclamation
landscapeGrassland
parcels DitchesDitch banks
————— %—————Polder Zegveld ‘Cope’ reclamation 76.6 10.5 4.9
Polder Oukoop Reclamation with wide ditches
68.8 20.7 6.0
Polder Menningweer Irregular reclamation 80.6 12.0 2.0
Fig. 4. N2O emission from agriculture using diff erent land cover data
and diff erent inventory methods.

Nol et al.: Eff ect of Land Cover Data on Nitrous Oxide Inventory in Fen Meadows 1217
land cover databases, except for the fi eld map estimate, which
is 11% smaller.
In general, vector data are more suitable in representing
distinct boundaries and clear landscape elements, whereas raster
data are assumed to better represent natural phenomena with
gradual boundaries, such as soils, vegetation types, and slopes
(Star and Estes, 1990). Th e landscape structure of the western
fen meadow landscape with predominantly sharp boundaries
between landscape elements and with long narrow ditches was
therefore best represented by vector data. Poor representation of
line elements—especially ditches—in this landscape was a large
source of bias by both vector and raster data. Note that the bias
would be much smaller for landscapes with fewer line elements
and larger patches of the same land use.
Th e N2O emission estimates for the Dutch western fen mead-
ows are shown in Table 7. Th e largest source of agricultural N2O
emissions was the cultivation of histosols, which demonstrates the
importance of this source. Th e highest emissions from this source
were obtained with the CLC2000 database because of the larger
estimated surface area grassland (Table 6). Th e total emissions were
larger for Tier 2a than for Tier 1 largely due to larger ammonium
losses according to the Tier 1 method. For the western fen meadow
landscape the maximum diff erence between the land cover data-
bases was almost twice as large as between the inventory methods.
Th is diff erence was largely due to two sources of error. Th e fi rst
error was the varying activity data used for the fen meadow land-
scape. For the research polders most activity data were relatively
constant for all land cover databases. Many Dutch activity data
(e.g., number of cows) were reported per agricultural region with-
out information about the distribution (e.g., the amount of cows
grazing on mineral soils vs. grazing on organic soils). To estimate
these activity data for the western fen meadow landscape estimates
about the proportion of organic soils compared to the proportion
of mineral soils in the agricultural regions from the land cover da-
tabases were used. Th ese activity data, which varied between land
cover databases, caused some diff erences in emission estimates. Th e
second source of error was the bias in representation of landscape
elements by the land cover databases.
Th e N2O emission was also calculated using Tier 3 (INITIA-
TOR) and input from the STONE database. Th e estimated emis-
sions were about twice the emissions estimated with the Tier 1 and
2a method (data not shown). Th is was partly due to the high deni-
trifi cation and nitrifi cation estimated by INITIATOR, which was
also identifi ed at polder scale, and partly due to the use of STONE,
which is a very coarse database (with a resolution of 250 m) com-
pared to the other databases used for the Tier 1 and 2a methods.
ConclusionsIn this research the surface area of grassland was overesti-
mated when using the land cover databases. When moving
to a coarser resolution for raster data or to a larger minimum
mapping unit for vector data, classes with large abundances
‘absorbed’ classes with small abundances. Th e choice of a cer-
tain land cover database can have drastic eff ects on N2O in-
ventories, because diff erences between estimated surface areas
Table 6. Surface area of grassland in western fen meadow landscape.
Database Surface area of grassland
ha
Field map 74,049
Top10Vector 86,891
CBS soil use 92,692
LGN4 87,461
CLC2000 96,391
Fig. 5. Reclamation landscapes in the western fen meadow landscape.
Table 7. Emission of N2O estimated for the western fen meadows
using the IPCC Tier 1 and Tier 2a method from diff erent sources.
Cultivation of histosols Total emission from agriculture
Database Tier 1 Tier 2a Tier 1 Tier 2a
––––––———— 103 kg N2O yr−1––––––————
Field map 582 547 1517 1685
Top10Vector 683 642 1725 1910
CBS soil use 728 685 1747 1979
LGN4 687 646 1788 1987
CLC2000 757 712 1902 2106

1218 Journal of Environmental Quality • Volume 37 • May–June 2008
sometimes exceed 20% and diff erent surfaces have diff erent
emissions. Such diff erences do not only apply to our study
sites; at the regional level the amount of diff erence is similar.
For the Zegveld and Oukoop polders, the diff erences in es-
timated N2O emissions were larger between the inventory tech-
niques than between land cover databases. For the western fen
meadow landscape as a whole, the reverse applied because errors
in land cover data were mainly systematic errors (bias) and er-
rors from the inventory techniques were mainly random. Bias is
consistently in the same direction and does not cancel out when
estimates are scaled up to larger regions; therefore, these systematic
errors became more distinct for larger areas compared to random
errors in emission factors. Th e eff ect of using a more detailed land
cover database had the opposite eff ect of using a more detailed in-
ventory method. Highest emissions were estimated using the coars-
est land cover database and the most detailed inventory method
and vice versa. Although focusing on the reduction of uncertainty
by improving emission inventory methods may be effi cient at the
local scale, this study has shown that for large-scale inventories the
careful selection, inventory, and use of land cover data may be as
important in reducing inventory uncertainties. While signifi cant
eff ort has gone into improving emission factors and improving in-
ventory techniques, this research demonstrated that with relatively
little eff ort emission inventories can be improved by improving
land cover data input.
AcknowledgmentsTh is work was funded by the Dutch project “Climate
Changes Spatial Planning (KvR ME1)”. We want to
thank Wim de Vries and Hans Kros for making the model
INITIATOR available for this research and Jan-Cees Voogd
for his help using INITIATOR. We also thank Arina Schrier,
Matheijs Pleijter, and Gerard Velthof for making their valuable
fi eldwork data in the research polders available for this study.
ReferencesAllen, T.F.H., R.V. O’Neill, and T.W. Hoekstra. 1984. Interlevel relations in
ecological research and management: Some working principles from hierarchy theory. Rocky Mountain Forest and Range Experiment Stn., Fort Collins, CO.
Ambus, P., and S. Christensen. 1994. Measurement of N2O emission from
a fertilized grassland: An analysis of spatial variability. J. Geophys. Res. 99:16549–16556.
Arbia, G., D. Griffi th, and R. Haining. 1998. Error propagation modelling in raster GIS: Overlay operations. Int. J. Geogr. Inf. Sci. 12:145–167.
Bach, M., L. Breuer, H.G. Frede, J.A. Huisman, A. Otte, and R. Waldhardt. 2006. Accuracy and congruency of three diff erent digital land-use maps. Landsc. Urban Plan. 78:289–299.
Bareth, G., M. Heincke, and S. Glatzel. 2001. Soil-land-use-system approach to estimate nitrous oxide emissions from agricultural soils. Nutr. Cycling Agroecosyst. 60:219–234.
Best, E.P.H., and F.H.H. Jacobs. 1997. Th e infl uence of raised water table levels on carbon dioxide and methane production in ditch-dissected peat grasslands in the Netherlands. Ecol. Eng. 8:129–144.
Bolan, N.S., S. Saggar, J. Luo, R. Bhandral, J. Singh, and L.S. Donald. 2004. Gaseous emissions of nitrogen from grazed pastures: Processes, measurements and modelling, environmental implications, and mitigation. Adv. Agron. 84:37–120.
Bolstad, P.V., and J.L. Smith. 1992. Errors in GIS. Assessing spatial data accuracy. J. For. 90:21–29.
Brown, J.D., B. Syed, S.C. Jarvis, R.W. Sneath, V.R. Phillips, K.W.T.
Goulding, and C. Li. 2002. Development and application of a mechanistic model to estimate emission of nitrous oxide from UK agriculture. Atmos. Environ. 36:917–928.
Büttner, G., J. Feranec, and G. Jaff rain. 2002. Corine land cover update 2000. ESA, Copenhagen, Denmark.
CBS. 2002. Product description CBS Soil use Version 1.0 (in Dutch). CBS, Voorburg, the Netherlands.
CBS. 2007. CBS Statline. Available at http://statline.cbs.nl (verifi ed 7 Mar. 2008). Voorburg/Heerlen, the Netherlands.
De Vries, F., W.J.M. De Groot, T. Hoogland, and J. Denneboom. 2003a. Th e soil map of the Netherlands digital; Explanation by content, topicality, methodology and short description of additional information (in Dutch) Alterra Rep. 811. Alterra, Wageningen, the Netherlands.
De Vries, W., H. Kros, O. Oenema, and J. De Klein. 2003b. Uncertainties in the fate of nitrogen: II. A quantitative assessment of the uncertainties in major nitrogen fl uxes in the Netherlands. Nutr. Cycling Agroecosyst. 66:71–102.
De Wit, A.J.W. 2001. Th e National Landuse Database Version 4 (LGN 4) (in Dutch). Centre for Geo-Information, Wageningen Univ., Wageningen, Th e Netherlands.
Denier van der Gon, H.A.C., and A. Bleeker. 2005. Indirect N2O emissions
due to atmospheric N deposition for the Netherlands. Atmos. Environ. 39:5827–5838.
Denier van der Gon, H.A.C., P.M. Van Bodegom, S. Houweling, P.H. Verburg, and N. Van Breemen. 2000. Combining upscaling and downscaling of methane emissions from rice fi elds: Methodologies and preliminary results. Nutr. Cycl. Agroecosyst. 58:285–301.
EEA. 2000. Brochure: Corine land cover 2000: Mapping a decade of change. Available at http://www.eea.eu.int (verifi ed 7 Mar. 2008). EEA, Copenhagen, Denmark.
EEA. 2006. Th e thematic accuracy of Corine land cover 2000. Assessment using LUCAS (land use/cover area frame statistical survey). EEA, Copenhagen, Denmark.
Ellis, E.C. 2004. Long-term ecological changes in the densely populated rural landscapes of China. p. 344. In R. DeFries et al. (ed.) Ecosystems and land use change. Vol. 153. American Geophysical Union, Washington, DC.
Ellis, E.C., R.G. Li, L.Z. Yang, and X. Cheng. 2000. Long-term change in village-scale ecosystems in China using landscape and statistical methods. Ecol. Appl. 10:1057–1073.
Fang, S., G.Z. Gertner, G. Wang, and A.B. Anderson. 2006. Th e impact of misclassifi cation in land use maps in the prediction of landscape dynamics. Landsc. Ecol. 21:233–242.
Fassnacht, K.S., W.B. Cohen, and T.A. Spies. 2006. Key issues in making and using satellite-based maps in ecology: A primer. For. Ecol. Manage. 222:167–181.
Firestone, M.K., and E.A. Davidson. 1989. Microbiological basis of NO and N
2O production and consumption in soil. p. 7–21. In M.O. Andreae
and D.S. Schimel (ed.) Exchange of trace gases between terrestrial ecosystems and the atmosphere. Life Sciences Research Rep. 47. John Wiley & Sons, New York.
Foody, G.M. 2002. Status of land cover classifi cation accuracy assessment. Remote Sens. Environ. 80:185–201.
GeoDesk. 2006. LGN4. Alterra, Wageningen, the Netherlands. Available at http://www.lgn.nl (verifi ed 7 Mar. 2008).
Hazeu, G.W. 2003. CLC2000 land cover database of the Netherlands. Monitoring land cover changes between 1986 and 2000 Alterra Rep. 775/CGI Rep. 03-006. Alterra, Green World Research, Wageningen, the Netherlands.
Hengl, T. 2006. Finding the right pixel size. Comp. Geosci. 32:1283–1298.
Heuvelink, G.B.M., J.D. Brown, and E.E. Van Loon. 2007. A probabilistic framework for representing and simulating uncertain environmental variables. Int. J. Geogr. Inf. Sci. 21:497–513.
Heuvelink, G.B.M., and P.A. Burrough. 2002. Developments in statistical approaches to spatial uncertainty and its propagation. Int. J. Geogr. Inf. Sci. 16:111–113.
Huff man, T., R. Ogston, T. Fisette, B. Daneshfar, P.Y. Gasser, L. White, M. Maloley, and R. Chenier. 2006. Canadian agricultural land-use and land management data for Kyoto reporting. Can. J. Soil Sci. 86:431–439.
IPCC. 1997. Revised 1996 IPCC guidelines for national greenhouse gas inventories. IPCC/OECD/IEA.UK Meteorological Offi ce, Bracknell, UK.
IPCC. 2000. Good practice guidance and uncertainty management in

Nol et al.: Eff ect of Land Cover Data on Nitrous Oxide Inventory in Fen Meadows 1219
national greenhouse gas inventories. Institute for Global Environmental Strategies, Hayama, Kanagawa, Japan.
Jansen, M.J.W. 1998. Prediction error through modelling concepts and uncertainty from basic data. Nutr. Cycling Agroecosyst. 50:247–253.
Kern, J.S., G. Zitong, Z. Ganlin, Z. Huizhen, and L. Guobao. 1997. Spatial analysis of methane emissions from paddy soils in China and the potential for emissions reduction. Nutr. Cycling Agroecosyst. V49:181–195.
Klein Goldewijk, K., J.G.J. Olivier, J.A.H.W. Peters, P.W.H.G. Coenen, and H.H.J. Vreuls. 2005. Greenhouse gas emissions in the Netherlands 1990–2003. 773201009/2005. RIVM/MNP, Bilthoven, the Netherlands.
Kroeze, C. 1994. Nitrous oxide (N2O) emission inventory and options for
control in the Netherlands. RIVM, Bilthoven, the Netherlands.
Kuikman, P.J., J.J.H. Van den Akker, and F. De Vries. 2005. Emissie van N
2O en CO
2 uit organische landbouwbodems 1035–2. Alterra,
Wageningen, the Netherlands.
Kuikman, P.J., D.A. Oudendag, A. Smit, and K.W. Van der Hoek. 2004. ROB maatregelen in de landbouw en vermindering van emissies van broeikasgassen 994. Alterra, Wageningen, the Netherlands.
Li, C.S. 2000. Modeling trace gas emissions from agricultural ecosystems. Nutr. Cycling Agroecosyst. 58:259–276.
Li, C., S. Frolking, and T.A. Frolking. 1992. A model of nitrous oxide evolution from soil driven by rainfall events: I. Model structure and sensitivity. J. Geophys. Res. 97:9759–9776.
Lokupitiya, E., and K. Paustian. 2006. Agricultural soil greenhouse gas emissions: A review of National Inventory Methods. J. Environ. Qual. 35:1413–1427.
Matthews, R.B., R. Wassmann, J.W. Knox, and L.V. Buendia. 2000. Using a crop/soil simulation model and GIS techniques to assess methane emissions from rice rields in Asia: IV. Upscaling to national levels. Nutr. Cycling Agroecosyst. 58:201–217.
Moody, A., and C.E. Woodcock. 1995. Th e infl uence of scale and the spatial characteristics of landscapes on land-cover mapping using remote sensing. Landsc. Ecol. 10:363–379.
Moody, A., and C.E. Woodcock. 1996. Calibration-based models for correction of area estimates derived from coarse resolution land-cover data. Remote Sens. Environ. 58:225–241.
Openshaw, S. 1983. Th e modifi able areal unit problem. CATMOG (Concepts and techniques in modern geography) 38. Geo Books, Norwick, Norfolk, UK.
Ozdogan, M., and C.E. Woodcock. 2006. Resolution dependent errors in remote sensing of cultivated areas. Remote Sens. Environ. 103:203–217.
Parton, W.J. 1996. Generalized model for N2 and N
2O production from
nitrifi cation and denitrifi cation. Global Biogeochem. Cycles 10:401–412.
Plant, R.A.J. 1999. Eff ects of land use on regional nitrous oxide emissions in the humid tropics of Costa Rica. WUR, Wageningen, the Netherlands.
Regnauld, N. 2001. Contextual building typifi cation in automated map generalization. Algorithmica 30:312–333.
Saggar, S., R.M. Andrew, K.R. Tate, C.B. Hedley, N.J. Rodda, and J.A. Townsend. 2004. Modelling nitrous oxide emissions from dairy-grazed pastures. Nutr. Cycling Agroecosyst. 68:243–255.
Schmit, C., M. Rounsevell, and I. La Jeunesse. 2006. Th e limitations of spatial land use data in environmental analysis. Environ. Sci. Policy 9:174–188.
Stacey, K.F., R.M. Lark, A.P. Whitmore, and A.E. Milne. 2006. Using a process model and regression kriging to improve predictions of nitrous oxide emissions from soil. Geoderma 135:107–117.
Star, J.T., and J. Estes. 1990. Geographic information systems: An introduction. Prentice Hall, Englewood Cliff s, NJ.
Steele, B.M., J.C. Winne, and R.L. Redmond. 1998. Estimation and mapping of misclassifi cation probabilities for thematic land cover maps. Remote Sens. Environ. 66:192–202.
Stehman, S.V., and R.L. Czaplewski. 1998. Design and analysis for thematic map accuracy assessment: Fundamental principles. Remote Sens. Environ. 64:331–344.
Stiboka. 1969. Soil map of the Netherlands. Instructions (in Dutch) G.W. van de Wiel & Co, Arnhem, the Netherlands.
TDN. 2006. Product information TOP10vector (in Dutch). Topografi sche Dienst Kadaster, Emmen, the Netherlands. Available at http://www.tdn.nl/ (verifi ed 7 Mar. 2008).
Turner, M.G., R.V. O’Neill, R.H. Gardner, and B.T. Milne. 1989. Eff ects of changing spatial scale on the analysis of landscape pattern. Landsc. Ecol. 3:153–162.
UNFCCC. 1997. Kyoto Protocol to the United Nations Framework Convention on Climate Change. Available at http://unfccc.int/resource/docs/convkp/kpeng.pdf (verifi ed 14 Mar. 2008).
Van Beek, C., E.W.J. Hummelink, G.L. Velthof, and O. Oenema. 2004. Denitrifi cation rates in relation to groundwater level in a peat soil under grassland. Biol. Fertil. Soils 39:329–336.
Van Buren, J., A. Westerik, and E.J.H. Olink. 2003. Quality Top10Vector. Th e geometric quality of the database Top10Vector of the Dutch National Mapping Agency (in Dutch). Topografi sche Dienst Kadaster, Emmen, Th e Netherlands.
Van Oort, P.A.J. 2005. Improving land cover change estimates by accounting for classifi cation errors. Int. J. Remote Sens. 26:3009–3024.
Van Oort, P.A.J., A.K. Bregt, S. De Bruin, A.J.W. De Wit, and A. Stein. 2004. Spatial variability in classifi cation accuracy of agricultural crops in the Dutch national land-cover database. Int. J. Geogr. Inf. Sci. 18:611–626.
Velthof, G.L. 1997. Nitrous oxide emission from intensively managed grasslands. Wageningen Univ., Wageningen, the Netherlands.
Verburg, P.H., P.M. Van Bodegom, H.A.C. Denier van der Gon, A. Bergsma, and N. Van Breemen. 2006. Upscaling regional emissions of greenhouse gases from rice cultivation: Methods and sources of uncertainty. Plant Ecol. 182:89–106.
Vliegen, M. (ed.). 2000. Meeting of the working party: Geographical Information Systems for statistics, Luxembourg, Luxembourg. 17–18 Oct. 2000. European Commission, Luxembourg.
Wolf, J., A.H.W. Beusen, P. Groenendijk, T. Kroon, R. Rotter, and H. Van Zeijts. 2003. Th e integrated modelling system STONE for calculating nutrient emissions from agriculture in the Netherlands. Environ. Model. Softw. 18:597–617.
Woodcock, C.E., and A.H. Strahler. 1987. Th e factor of scale in remote sensing. Remote Sens. Environ. 21:311–332.