Examining Arsenic Mitigation Technologies using Process ...
240
Accounting for Sustainability in Bengal: Examining Arsenic Mitigation Technologies using Process Analysis Method Tamara R. Etmannski St Edmund Hall University of Oxford A thesis submitted for the degree of Doctor of Philosophy Department of Engineering Science Hilary 2014
-
Upload
khangminh22 -
Category
Documents
-
view
1 -
download
0
Transcript of Examining Arsenic Mitigation Technologies using Process ...

Accounting for Sustainability in Bengal:
Examining Arsenic Mitigation Technologies
using Process Analysis Method
Tamara R. Etmannski
St Edmund Hall
University of Oxford
A thesis submitted for the degree of
Doctor of Philosophy
Department of Engineering Science
Hilary 2014


ii
Abstract
This thesis shows how the Process Analysis Method (PAM) can be applied to assess
technologies used to mitigate arsenic from drinking water in rural India, using a set of
sustainability indicators. Stakeholder perspectives, gathered from a fieldwork survey of
933 households in West Bengal in 2012, played a significant role in this assessment.
This research found that the ‘Most Important’ issues as specified by the technology
users are cost, trust, distance from their home to the clean water source (an indicator of
convenience), and understanding the health effects of arsenic. It was also found that none
of the ten technologies evaluated are economically viable, as many do not charge user-fees,
which creates reliance upon donations to meet recurring costs. Utilisation of a technology is
strongly related to sociocultural capital, but in many cases, features that contribute to
sociocultural value, like regular testing of the treated water, are not included in the financial
budget. It is suggested that increased awareness might change attitudes to arsenic-rich
waste and its disposal protocols. This waste is often currently discarded in an
uncontrolled manner in the local environment, giving rise to the possibility of point-
source recontamination. All technologies proved to have difficulties in dealing with
waste, except the Tipot and Dug wells which produce no waste. Of the methods
considered, the BESU technology scored highest, but still only with 47-62% of the
maximum scores achievable within each domain. This explains the widespread failure
of mitigation projects across the region. The indicators and metrics show where
improvements can be made. A model scheme based on these findings is outlined which
could be applied with the objective of increasing utilisation and improving
sustainability. It can be concluded that a product stewardship approach should be taken in
regard to design, implementation and operation of the technologies, including the creation of
a regulated toxic waste collection and disposal industry.

iii
Why do you use the filter? Why
did you stop?*
Meet the people…*
“The operator built a new house. Where
did he get the money? It’s wrong for him
to profit when water should be free. I
refuse to pay.”
“The community club is in charge of that
water. I trust them so I use the filter.”
“I have never seen the operator clean it.
He has no boss. So I don’t use it.”
“The filter looks dirty and old.”
“I don’t know who installed it. It’s
broken. It has been broken for years.
There is no number to call for help.”
“The flow is too slow; I don’t have time to
wait.”
“I get loose movements after I drink that
water so I don’t use the filter anymore.”
“It costs too much.”
“The operator washes his cow in that
water. So it must not be drinkable.”
“Dr. Chakraborti from Jadavpur
University in Kolkata told me to use this
filter, so I do.”
“The filter broke.”
“Would you drink water from that? It
looks like a heap of garbage. I don’t trust
it.”
“The Panchayat [village leader] doesn’t
use the filter, so it must not work.”
“The ball inside costs too much to replace,
so after it expired I stopped using the
filter.”
“Now the operator wants money from us.
I thought the NGO was paying him?
Maybe he is corrupt.”
*All of the quotes are translations from Bengla. All of
the people photographed gave verbal consent.

iv
Hand-rolling cigarettes made from leaves for
supplementary family income.
Married women typically wear red saris.
Except her favorite colour is purple.
This woman welcomed me into her home for
tea during a monsoon downpour.
Sewing nets and hamocks to sell at the
market.
White saris are worn by widows.

v

vi
I dedicate this piece of work to:
My Opa (Walter Hoffmann), who understands my soul;
My Mom (Ute Etmannski) who doesn’t, but who is unrelentingly loving regardless;
My big brother (Jonathan Etmannski), for being my best friend.
I would also like to acknowledge:
My Father (Karl Etmannski) and my little brother (Michael Etmannski),
who, despite some misunderstandings, I know love me deeply
and are proud of this achievement.

vii
Acknowledgements
I would like to thank my supervisor Professor Richard C. Darton for the
countless coffees, the constructive use of his red pen and for the freedom to forge my
own research path. Thanks to Dr Alex Lubansky for his mentorship, to Professor Ian
Thompson for caring and taking the time to be an examiner and to Dr Heather
Cruickshank for her insights during the viva.
Financial support from both the Oxford University John Fell Fund and the
National Science and Engineering Research Council of Canada (NSERC) are gratefully
acknowledged. I am also appreciative to all of my Indian staff for their hard work in the
field every day despite scorching temperatures and monsoon rain. I am indebted to the
stakeholders and water-treatment professionals who generously gave their time to this
study, for without them this thesis would not be what it is today. They are all listed by
name on the following page.
I would also like to thank my best friends here in Oxford, Katherine Glover
and Lucy Erickson for their unwavering support, as well as my officemates in
engineering, and college friends and ‘family’ at Teddy Hall for providing me with both
motivation and distraction. Thanks to the decanal team (zoo), for the laughter over
many shared meals and pints. Sincere thanks to my English and Welsh surrogate
families, the Glovers and Watts, for opening their homes and hearts to me.
Finally, a special thank you goes to my friends and family (all the Etmannskis &
the Hoffmanns, Driessens, Loeppkys and Williams) from Canada for the endless supply
of Tim’s and encouragement; And to Desirée & Mike McLeay, Jennifer Wiley,
Franco Mosca, Andrea Ewing, Neeka Mottahedeh, Gennyne McCune and
Stephanie Thomas for believing in me from day one.

viii
Special thanks to all those in India who made this work possible:
I am grateful beyond words to Dr Meera Hira-Smith, Professor Allan Smith and
the Hira family for welcoming me into their Kolkata home for three months; and
especially grateful to Rajashree Hira and Moni Mondol for their friendship during that
time. Thanks to Professor Dipankar Chakraborti and Jadavpur University for donating
the laboratory analysis of my water samples and to Professor Arup SenGupta for
hosting me during my first trip to India. I am indebted to Hiya Bandyopadhyay, my
field assistant, and to Deepanjana Banerjee, Saswati Mondal, Madhumita Adhikari,
Samarpita Debnath, Priyanka Dutta, Paramita Paul, Antara Das, Soumita Biswas,
Chandra Perndham and Ganga P. Roy, the surveyors and driver, for without whom this
work would not have been possible.
Also, thanks to Tuhin Banerji (IIT Bombay), Shyamnarayan Dave (UNICEF),
Ben Lind (Palintest), Paramita Prathama (Project Well NGO), Sibdas Bandyopadhyay
(CGCRI), Arunabha Majumder (Jadavpur/ Presidency), Anirban Gupta (BESU), Tanvir
Ahmed (Harbauer-India), Bhaskar Sengupta (Tipot), Asok Das Gupta (Tipot), Prasun
Sengupta (Tagore Foundation NGO) Abhijit Das (Jadavpur), Somenath Mukherjee
(Behala Sambit), Susan Amrose (UCBerkeley), Aminul Ahsan (WBVHA-Lalgola),
Ashok and Mallicka Bhattacharya (logistics), Tilak Basu (logistics), Anil Chanda
(logistics), Rahit Shaw (logistics), Kshipra Misra (DRDO), Biswanath Pal (Pal
Trockner), Pralay O Basu (Save the Environment NGO), Pratap Chakraborty (Aqua
Welfare Society NGO), Billy Dainja (This Life Cambodia NGO), Subhodip Ghosh
(Bengal Chamber of Commerce), Kumarjyoti Nath (Arsenic Task Force), SP Sinha Ray
(Centre for Groundwater Studies/ Arsenic Task Force), Sayan Banerjee (UCalcutta),
Tapan Saha (Institute of Environmental Studies and Wetland Management, Gov. West
Bengal), Bikash Bhawan (Central Groundwater Board, Gov. India) for all the help.

ix
Table of Contents
List of Abbreviations
1 Introduction, Context and Background 1
1.1 Introduction 1
1.2 Arsenic Pollution 2
1.3 Bengal Basin Background 3
1.3.1 Terminology 3
1.3.2 Tube Wells 3
1.3.3 Diagnosis of Arsenicosis 5
1.3.4 Symptoms and Treatment 6
1.4 Chemistry 7
1.5 Geoscience 7
1.5.1 Geomorphology and Stratigraphy 7
1.5.2 Aquifers and Hydrogeology 8
1.5.3 Geochemistry 9
1.6 Physiochemical Mechanisms used for Arsenic Removal 10
1.6.1 Oxidation 10
1.6.2 Co-precipitation / Coagulation 11
1.6.3 Sorption 13
1.6.4 Activated Alumina 13
1.6.5 Ion Exchange 14
1.6.6 Membranes 14
1.7 Arsenic-Rich Waste 15
1.7.1 Passive Aeration 16
1.7.2 Concrete Stabilization 16
1.7.3 Mixing with Cow Dung 17
1.7.4 Dumping 17
1.8 Aim and Objectives 18
2 Arsenic Mitigation Technologies Profiled 19
2.1 Community Scale Systems 20
2.1.1 Tipot 20
2.1.2 IITB 22
2.1.3 BESU 24
2.1.4 PalT/Harbr 26
2.1.5 AIIH&PH 28
2.1.6 CGCRI 30
2.1.7 Dug 32
2.2 Household Scale Systems 34
2.2.1 SONO45-25 34
2.2.2 UNICEF 35
2.2.3 DRDO 37
2.3 Summary 38
3 Assessment Methodology – PAM 40 3.1 Evaluations 40
3.1.1 ETV-AM Programme – Bangladesh 40
3.1.2 Arsenic Task Force – West Bengal 41

x
3.1.3 Other Assessment Tools 41
3.2 Process Analysis Method (PAM) 42
3.2.1 Design Theory and PAM 44
3.3 The Six Steps of PAM 46
3.3.1 Step 1: Overview of Background 47
3.3.2 Step 2: Define Sustainability 47
3.3.3 Step 3: Define Boundary 49
3.3.4 Step 4: Identify Stakeholders 50
3.3.5 Step 5: Framework 51
3.3.6 Step 6: Verification 52
3.3.7 PAM Summary 52
3.4 Indicators Generated through PAM 52
4 Methodologies: Fieldwork and Data Analysis 56
4.1 Surveyors 56
4.2 Sampling of Population 57
4.3 The Survey 57
4.4 Informal Interviews 58
4.5 Approach and Management of the Interview/Survey 58
4.6 Ethics 59
4.7 Technical Data 59
4.8 Arsenic Testing 60
4.8.1 Field Test Kit 60
4.8.2 Laboratory Analysis 61
4.9 Statistical Analysis 62
4.10 Discussion 64
4.10.1 Gender of Surveyors 64
4.10.2 Interviewer Bias 65
5 Survey Results 67
5.1 Household Income 67
5.2 Household Education 69
5.3 Technology Use 70
5.4 Exposure Profile 72
5.5 Importance of Issues 74
5.6 Summary 80
6 Sociocultural Domain 82
6.1 Scoring of Sub-Indicators 82
6.2 Trust-Confidence Composite Indicator 82
6.3 Convenience Composite Indicator 88
6.4 Awareness Surrogate Indicator 92
6.5 Acceptability of Treated Water Composite Indicator 97
6.6 Compatibility Composite Indicator 99
6.7 Aggregation of Sociocultural Composite Indicators 101
6.8 Summary and Discussion 103
7 Environmental Domain 105
7.1 Product Stewardship 105
7.2 Inputs – Design and Manufacture 106
7.3 Throughputs – Operation and Maintenance 108
7.3.1 Energy 108

xi
7.3.2 Creation of Toxic Waste 109
7.4 Outputs – End of Life 113
7.5 All Environmental Indicators Combined 115
7.6 Discussion 117
8 Economic Domain 119
8.1 Capital Costs 119
8.2 Recurring Costs and Income 120
8.2.1 Wages 120
8.2.2 Ownership and Profit 122
8.2.3 Consumables 122
8.2.4 Tariff and Associated Issues 123
8.2.5 Other Recurring Costs 125
8.3 A Viable Economic Model for Community-Scale Systems 125
8.3.1 Modelled Capital Costs 125
8.3.2 Modelling of Revenue Account 127
8.4 Indicators of Economic Capital 129
8.5 Total Score for Economic Domain and Discussion 131
9 Aggregation and Conclusions 135
9.1 Comparison 135
9.2 Aggregation 136
9.3 Reasons for Failure 139
9.4 Improvements 141
9.4.1 Product Design 141
9.4.2 Implementation 142
9.4.3 Policy Creation 143
9.5 Summary and Conclusions 143
9.6 Future Work 144
Bibliography 146
Appendices 163
Appendix I: Summarized Field Notes 163
Appendix II: English and Bangla Field Surveys and Data Sheet 200
Appendix III: Ethics, Surveyor Training and Safety Documents 211
Digital Appendix: Raw data on a DVD 227

xii
List of Abbreviations
Activated Alumina AA
All Indian Institute of Hygiene & Public Health AIIH&PH
Arsenic Removal Plants ARP
Arsenic-Rich Waste AsRW
Trivalent Arsenic As(III)
Pentavalant Arsenic As(V)
Below Detection Limit BDL
Bangladesh Environmental Technology Verification BETV-SAM
– Support to Arsenic Mitigation
Bengal Engineering and Science University BESU
British Geological Survey BGS
Central Glass & Ceramic Research Institute CGCRI
Composite Iron Matrix CIM
Department of Public Health Engineering DPHE
Driving Forces, Pressures, States, Impacts, Responses DPSIR
Defence Research and Development Organisation DRDO
Energy Alternatives India EAI
Extended Producer Responsibility EPR
Iron Oxyhydroxide FeOOH
Ganges, Brahmaputra and Meghna river system GBM
Global Reporting Initiative GRI
Hydrochloric Acid HCl
Household Deep Tube Well HDTW
Hydrous Ferric Oxide HFO
Household Shallow Tube Well HSTW
Industrial Ecology IE
International Institute of Bengal Basin IIBB
Indian Institute of Technology – Bombay IITB
Indian Power Sector IPS
Mott MacDonald Ltd. MML
Municipal Solid Waste MSW
Nanofiltration NF

xiii
Non-Governmental Organisation NGO
Pal Trockner Envitech Ltd. / Harbauer India Ltd. PalT/Harbr
Process Analysis Method PAM
Public Deep Tube Well PDTW
Public Health Engineering Directorate PHED
Product Stewardship PS
Product Stewardship Institute PSI
Public Shallow Tube Well PSTW
Polyvinyl Chloride PVC
Survey Question Q
Indian Rupees R
Ramakrishna Vivekananda Mission – Institute of Advance Studies RKVM-IAS
Reverse Osmosis RO
Rural Sanitary Mart RSM
Solar Oxidation and Removal of Arsenic SORAS
Toxicity Characteristics Leaching Procedure TCLP
Technology for In-situ Treatment for Potable Groundwater TIPOT
United Nations Development Programme UNDP
United Nations Fund for Population Activities UNFPA
United Nations International Children’s Emergency Fund UNICEF
United States Environmental Protection Agency USEPA
World Bank Development Indicators Database WBDID
World Health Organisation WHO
Wagtech’s Visual Colour Detection Kit WVCD Kit
Zero Valent Iron ZVI

1
1 Introduction, Context and Background
1.1 Introduction
The presence of arsenic in groundwater was recognised as a widespread and significant
challenge to public health in the 1990s and it is now known to be a problem in over 70
countries (Ravenscroft et al., 2009). Consumption of arsenic-contaminated water leads
to a variety of fatal illnesses and is a hazard that primarily affects rural residents due to
their lack of access to municipal scale, potable water resources (Smith et al., 2000).
Many different technologies are available to remove arsenic from local water supplies,
but their particular application may not always be appropriate for local sociocultural,
economic or environmental reasons, particularly in developing nations. In West Bengal,
India, a significantly high percentage of arsenic removal technologies fail within their
first year of use which results in the population remaining at risk. To prevent this from
happening, it is crucial that reasons for failure are recognised, and that only the most
appropriate and sustainable technologies are implemented. The purpose of this research
is to create a transparent sustainability assessment of the ten most widely used arsenic
mitigation options in West Bengal, India. Having a comprehensive and proven method
of assessment should improve the selection of suitable water treatment options and thus
reduce the exposure of this large rural population. The assessment method should also
highlight ways in which the technology and implementation can be better designed to
suit the needs of the users. The most optimistic outcome of this project is improving the
health of Bengali communities. This chapter describes the background and context of
the arsenic problem, explains the geoscience related to arsenic and considers various
general approaches to drinking water and waste treatment. Finally the aims and
objectives of this research programme are given.

2
1.2 Arsenic Pollution/Contamination
Arsenic is a poisonous metalloid which is virtually colourless, odourless and tasteless
when dissolved in water (Meharg 2005). It exists in more than 200 naturally occurring
minerals and thus can be found in small quantities in sediments, soil, rock, air, water,
plant life and organisms across the globe (Appelo and Postma, 1996). In recent history,
arsenic has been utilized in the lumber industry, in herbicides and pesticides, chemicals
and electronics and as an additive in agricultural feed. It is often a by-product in mining
(gold, copper, coal) and in metal production (lead and copper smelters) (Cullen and
Reimer, 1989). As a consequence, many local accounts of arsenic pollution have been
related back to these specific industries. Several review papers cover arsenic
contamination on a global scale, which together have compiled an impressive number of
examples of arsenic pollution dating back as early as 1910 (Mandal and Suzuki, 2002;
Smedley and Kinniburgh, 2002; Mukherjee et al., 2006; Cullen, 2008). Mandal and
Suzuki (2002) include several historical examples of contamination in the food industry,
where arsenic was found in powdered milk in Japan, beer in England and wine in
Germany due to the use of arsenic in pesticides. Some high concentrations of arsenic
were initially attributed to anthropogenic influence, but were later found to be naturally
occurring (Chatterjee et al., 1993; Mazumder et al., 1998).
In the past, arsenic levels in groundwater were not routinely tested for (Clarke,
2001). However, in the last three decades, there has been a re-examination of the factors
which control how arsenic is distributed throughout the environment, resulting in more
arsenic testing and a significant growth of knowledge of the properties and behaviours
of arsenic (Smedley and Kinniburgh, 2002). It has been only since 1990 that naturally-
occurring arsenic contamination in groundwater has been recognised as a global
problem (Ravenscroft et al., 2009). Twelve countries with newly discovered

3
contamination are in Asia, those being Afghanistan, Bangladesh, Cambodia, China,
India, Lao PDR, Mongolia, Myanmar, Nepal, Pakistan, Thailand and Vietnam. The
most severely affected region of the world is in the Bengal basin. The number of people
at risk from arsenic contamination in this region is not known with certainty but a
conservative estimate might be 40 million (Smedley and Kinniburgh, 2005), and as
many as 200 million have been mentioned (Chakraborti et al., 2002). The estimates
depend on the predicted population density, models of hydrogeology and thus predicted
distribution of arsenic, and what concentration of arsenic is used to define the level of
contamination which constitutes a risk.
1.3 Bengal Basin Background
1.3.1 Terminology
The Bengal basin is a geological term which includes the delta of the Ganges,
Brahmaputra and Meghna (GBM) rivers at the Bay of Bengal, situated along the border
between Bangladesh (formally known as East Bengal) and the province of West Bengal,
India (Mukherjee et al., 2009). Though arsenic contamination crosses national borders,
since both sides are geologically, geochemically and culturally very similar, this thesis
will use the term the Bengal basin or simply Bengal for the geographical region where
the arsenic problem is encountered at this locale.
1.3.2 Tube wells
The exposure of the population to arsenic in the Bengal basin began 40 years ago when
there was a rapid increase in the installation of tube wells, which gave people access to
fresh, cool, bacteria-free groundwater. A tube well is a water well, constructed using
low-level technologies of hand-auguring to ‘sink’ it. The tube is usually a polyvinyl
chloride pipe, 25-200mm in diameter targeting either ‘shallow’ groundwater (<100-

4
150m) or ‘deeper’ aquifers (>150m) . It is connected to a cast-iron or steel hand pump at
the surface (Bukhari et al., 1980). In the Bengal basin, the sediments are fairly soft and
the groundwater table is often only approximately 15m below ground level, so tube
wells can be installed relatively easily and at little cost (Mukherjee et al., 2009).
Different reasons have been given for the rapid introduction of tube wells. Some
claim that the West Bengal Government initiated an incentive programme (in 1965) for
farmers to irrigate new strains of rice during the Green Revolution (Ahmad, 1972;
Department of Information and Cultural Affairs, 1986; Beck, 1995; Harvey et al., 2005;
Mukherjee et al., 2007; Cullen, 2008). Other authors claim that in the mid-1970s the
government was promoting the installation of tube wells because they provided
drinking-water free from the pathogens commonly found in rivers and ponds, which
was causing diarrheal disease across the region (Ebi et al., 2005; Ravenscroft et al.,
2009). Focusing on eliminating bacteria-caused waterborne diseases, in 1970 the United
Nations Children’s Fund (UNICEF) began a programme to help provide safe drinking
water throughout the region by repairing broken tube wells and installing new ones
(UNICEF, 2000). Today approximately 97% of the rural population relies on tube wells
as their source of drinking water and it is estimated that over 11 million shallow tubes
wells exist in Bengal (World Bank, 1998; British Geological Survey, 1999). This large
number of wells, 75% of which are privately owned, now poses serious analytical
challenges with regard to accurate and practical water-testing methods (Kinniburgh and
Kosmus, 2002), required to certify water quality. The number of tube wells being
installed is still increasing today (Chakraborti et al., 2009). A very recent comparison of
two blanket surveys conducted 12 years apart within only a 25km2 area in Bangladesh
indicates the total number of tube wells within that area doubled from 5560 to 10,879
wells (Van Geen et al., 2014). Bengal is approximately 230,000km2 in area, and is one

5
of the most densely populated regions on Earth. It has an estimated population of more
than 250 million people and a population density that exceeds 900/km² (WBDID, 2006).
1.3.3 Diagnosis of Arsenicosis
Dr KC Saha, a dermatologist at the School of Tropical Medicine in Calcutta (Kolkata),
diagnosed the first case of chronic arsenical dermatosis in July 1983 (Saha, 1984). After
investigating several rural areas in the vicinity, he identified 1214 additional cases of
arsenicosis (chronic arsenic poisoning or toxicity). He tested water from the tube wells
and determined the arsenic source to be groundwater (Saha, 2003). DNG Mazumder and
AK Chakraborty led a team of doctors to further investigate and found tube wells with
water containing as much as 2000ppb of arsenic, which is 40 times the local drinking
water limit (Gov’t of India) of 50ppb (WHO recommends a maximum concentration of
10ppb). Most natural waters contain less than 1ppb of arsenic (WHO, 2001). The
researchers reported their findings in a WHO Bulletin in 1988 (Mazumder et al., 1988).
The adverse health effects of arsenic have since been studied extensively and it
has been determined that the degree of arsenicosis depends on the dose, duration of
exposure and the current health of the population exposed (Mazumder et al., 1998). A
recent study (Sarkar, 2010) determined that poverty was one of the major determinants
of arsenic exposure level, showing links between degree of exposure and a subject's
occupation, nutritional status (gender) and access to health care. Physical disability and
disfigurement which are symptoms of arsenicosis have made the poor more vulnerable
to economic and social exclusion, so that arsenicosis contributes to worsening social
disparity in the Bengal region (Sarkar, 2010).

6
1.3.4 Symptoms and Treatment
There are many symptoms of arsenicosis, but the most common are skin lesions in the
form of melanosis and keratosis (Rahman et al., 2009). A number of articles have been
published on chronic exposure to arsenic and its health effects (Naqvi et al., 1994;
Rahman et al., 2001; Mandal and Suzuki, 2002; Ng et al., 2003; Duker et al., 2005; Ebi
et al., 2005; Rahman et al., 2005; Wang et al., 2007; Cherry et al., 2008; Vahter, 2009).
Drinking arsenic-contaminated water may lead to skin cancers, cancer of the bladder,
kidneys, lungs, and diseases of the blood vessels of the legs and feet. It may also
contribute to diabetes, high blood pressure and reproductive disorders. Arsenic in
drinking water is absorbed by the intestines from where the bloodstream takes it to
various organs. It contributes to adverse health effects by inhibition of essential
metabolic enzymes, preventing DNA from mending which ultimately leads to death
from multi-system organ failure (Paul and Tinnon Brock, 2006). Approximately 1 in
100 people whose primary source of drinking water contains 50ppb or more will
eventually die from arsenic related cancers (WHO, 2001).
Despite its toxicity, there are few studies on effective therapy or treatment of
arsenic poisoning. Although experimental studies indicate an effect of chelation therapy
in reducing the arsenic stores in the body, no clinical studies have supported the data
(Stenehjem et al., 2007). Arsenicosis is then a disease for which no effective therapy is
yet known (Das and Sengupta, 2008). There is indication that after switching to arsenic-
safe water combined with taking anti-oxidants and eating high amounts of protein,
arsenicosis symptoms may be reversed when the disease is in its early stages (Howard,
2003).

7
1.4 Chemistry
Arsenic has multiple oxidation states (+5, +3, 0 and -3). Trivalent arsenic – As(III) and
pentavalent arsenic – As(V) are the most common inorganic forms in natural
environments. Speciation of arsenic is important for both toxicological studies and
remediation efforts as the mechanism for the removal of arsenic from contaminated
water is highly species dependent. As(III) is 60 times more toxic than As(V) and
inorganic arsenic is 100 times more toxic than organic compounds (Jain and Ali, 2000).
The speciation and solubility of inorganic arsenic is sensitive to both redox conditions
and pH of the environment which affects both the toxicity and mobility of arsenic. In an
anoxic system, the stable form of arsenic is As(III) which has higher toxicity and
mobility than As(V). In aquifers, arsenic frequently adsorbs to iron oxyhydroxide -
FeOOH, and so the behaviour of FeOOH is also an important factor in regulating
arsenic movement and concentration. For example, under aerobic (oxidizing)
conditions, As(V) dominates and FeOOH is insoluble, so this compound acts as a sink
for arsenic (removes arsenic from the water). In contrast, under anaerobic (reducing)
conditions, As(III) dominates and FeOOH readily dissolves, which releases arsenic
from the rock into the groundwater, thereby acting as an arsenic source. These
behaviours are crucial to understanding the chemical and physical mechanisms in the
removal of arsenic from groundwater.
1.5 Geoscience
1.5.1 Geomorphology and Stratigraphy – Understanding the Arsenic Source
The Bengal basin is a classic example of a peripheral foreland basin formed by
continent-continent collision. It is the result of the subduction of the Indian tectonic
plate below the Eurasian (Tibetan) and Burmese plates. The basin is located at the

8
junction of these three plates and is subsiding at a rate of 2-4mm/year (Evans, 1964;
Mukherjee et al., 2007). It is also the largest fluvial-deltaic sedimentary system on earth.
Arsenic-containing sediments erode from the Himalayan Mountains and are carried
down the Ganges, Brahmaputra and Meghna river systems to accumulate in the basin or
disperse out into the Bay of Bengal. The sedimentary sequences found in this basin are
strongly influenced by the meandering character of these rivers and also by sea level
fluctuations during the evolution of the Bengal delta (Umitsu, 1987 and 1993). The
primary sources of arsenic within the Himalayas are thought to be eroding coal seams
and rocks containing sulphide minerals (Acharyya et al., 2000). During transport,
arsenic appears to have adsorbed onto FeOOH-coated sand grains and clay minerals
(Acharyya et al. 2000) which were then deposited across the delta, creating large
sequences of (arsenic-coated) channel sands, the ideal depositional environment in
which aquifers later form.
1.5.2 Aquifers and Hydrogeology – Understanding regional heterogeneity
There are two major physiographical units in this region; Pleistocene (deeper) and
Holocene (shallower) sediments. The extensive occurrences of these alluvial sediments
combined with abundant sources of recharge from rainfall and floodwater during the
monsoon season have resulted in the development of prolific aquifer systems across the
Bengal delta (Bhattacharya et al. 2009). The vast majority of the tube wells providing
water for human consumption are drilled into the shallow Holocene aquifers, as some
are less than 5m from surface. Far fewer wells are drilled into the deep (>200m)
Pleistocene aquifers (Bhattacharya et al., 1997).
The British Geological Survey, Department of Public Health Engineering
(Government of Bangladesh) and Mott MacDonald Ltd (UK) carried out an extensive
hydrogeological study of Bangladesh in 2001 (BGS/DPHE/MML, 2001). Mukherjee et
9
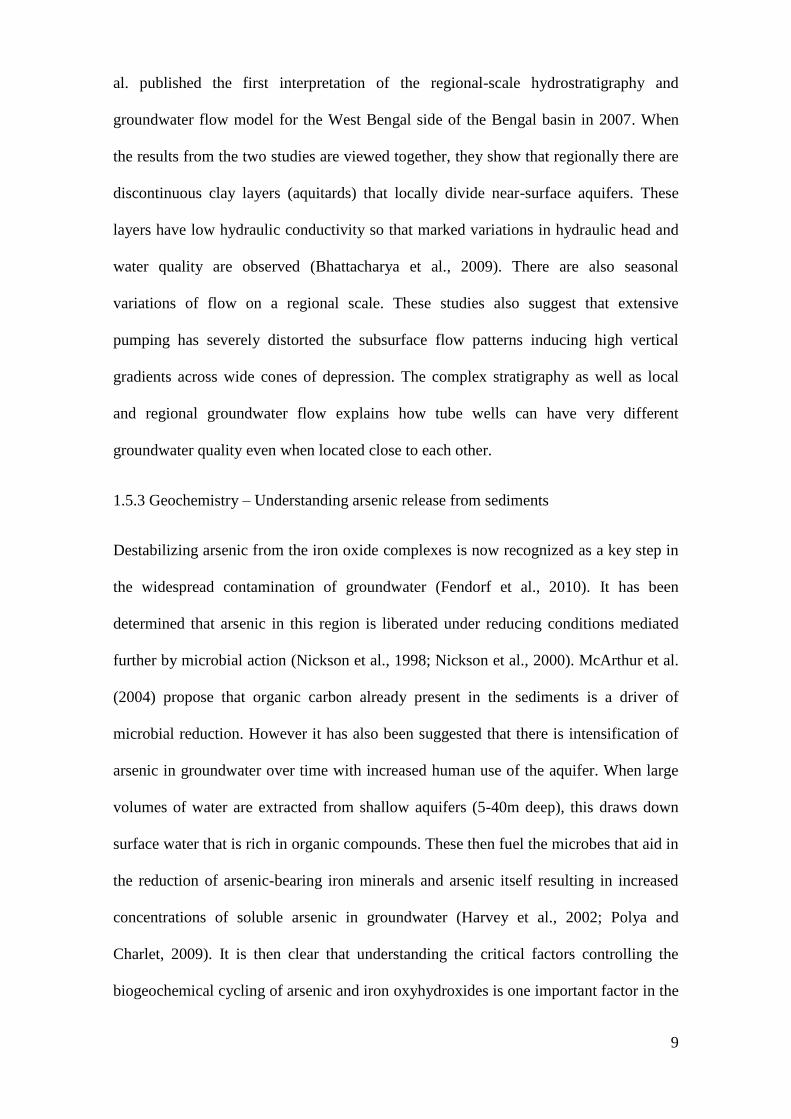
al. published the first interpretation of the regional-scale hydrostratigraphy and
groundwater flow model for the West Bengal side of the Bengal basin in 2007. When
the results from the two studies are viewed together, they show that regionally there are
discontinuous clay layers (aquitards) that locally divide near-surface aquifers. These
layers have low hydraulic conductivity so that marked variations in hydraulic head and
water quality are observed (Bhattacharya et al., 2009). There are also seasonal
variations of flow on a regional scale. These studies also suggest that extensive
pumping has severely distorted the subsurface flow patterns inducing high vertical
gradients across wide cones of depression. The complex stratigraphy as well as local
and regional groundwater flow explains how tube wells can have very different
groundwater quality even when located close to each other.
1.5.3 Geochemistry – Understanding arsenic release from sediments
Destabilizing arsenic from the iron oxide complexes is now recognized as a key step in
the widespread contamination of groundwater (Fendorf et al., 2010). It has been
determined that arsenic in this region is liberated under reducing conditions mediated
further by microbial action (Nickson et al., 1998; Nickson et al., 2000). McArthur et al.
(2004) propose that organic carbon already present in the sediments is a driver of
microbial reduction. However it has also been suggested that there is intensification of
arsenic in groundwater over time with increased human use of the aquifer. When large
volumes of water are extracted from shallow aquifers (5-40m deep), this draws down
surface water that is rich in organic compounds. These then fuel the microbes that aid in
the reduction of arsenic-bearing iron minerals and arsenic itself resulting in increased
concentrations of soluble arsenic in groundwater (Harvey et al., 2002; Polya and
Charlet, 2009). It is then clear that understanding the critical factors controlling the
biogeochemical cycling of arsenic and iron oxyhydroxides is one important factor in the

10
development of effective strategies to manage arsenic-rich groundwater in the Bengal
basin.
1.6 Physiochemical Mechanisms used for Arsenic Removal
In order to remove the arsenic to make the groundwater safe to drink, several
physiochemical techniques have been employed including oxidation/reduction, co-
precipitation/coagulation (often followed by sedimentation and filtration), sorption and
ion exchange (often employing activated alumina), and physical exclusion using
membranes (molecular filtration). There is often a need to control pH and/or other
parameters to achieve optimum removal. Note that the process of boiling does not
remove arsenic from water.1
1.6.1 Oxidation
Most treatment methods are effective in removing As(V), but As(III) is more commonly
found in groundwater, so oxidation is required as a first step to convert As(III) to As(V)
(Chang et al., 2009; Garelick et al., 2005). As(III) can be oxidized by atmospheric
oxygen, ozone, chlorine, permanganate and hydrogen peroxide but atmospheric oxygen,
hypochloride and permanganate are most commonly used in Bengal (equations 1-3).
H3AsO3 + ½O2 = HAsO42-
+ 2H+ (1)
H3AsO3 + HClO = HAsO42-
+ Cl- + 3H
+ (2)
3H3AsO3 + 2KMnO4 = 3HAsO42-
+ 2MnO2+ + 2K
+ + 4H
+ + H2O (3)
Using the method of ‘passive oxidation’ many rural people drink water stored in
pitchers because it is thought that the exposure to atmosphere that occurs during
1 The belief that boiling the water will remove or ‘deactivate’ arsenic was widely encountered during field
work in Bengal.

11
collection and open-air storage may cause a decrease in arsenic concentration. However
Ahmed et al. (2001) showed that using this method, there is zero to 25% reduction of
the initial concentration and the process is highly dependent on alkalinity and iron
content. This method cannot be relied upon to remove arsenic to the required level of
50ppb.
Passive oxidation of arsenic is very slow and can take weeks but chemicals like
chlorine and permanganate can rapidly oxidize As(III) to As(V) under a wider range of
conditions. Several chemical packages are available in the form of sachets (“tea bags”),
powder and tablets that can be used as a ‘chemical induced’ form of oxidation (Meng et
al., 2001). However quality assurance and dose control in rural conditions are extremely
difficult, so this oxidation method is not widely promoted.
SORAS is a simple method using ‘solar oxidation’, which works by placing
drinking water in translucent bottles and letting them sit in the sun (Wegelin et al.,
2000). Ultraviolet radiation catalyses the process of oxidation of As(III), and this can be
followed by precipitation and filtration of As(V) adsorbed on Fe(III)oxides (Wegelin et
al., 2000). This process is also highly dependent on alkalinity and iron content of the
untreated water. Field tests show a removal efficiency average of 67% (to lower the
arsenic concentration to 50ppb) (Young, 1996), which limits the use of this technology
to raw water having an initial arsenic concentration no higher than 100-150ppb. This
method of removal is very uncertain since testing in rural areas is rarely possible.
1.6.2 Co-precipitation / Coagulation
Water treatment with coagulants such as aluminium sulphate - Al2(SO4)3.18H2O, ferric
chloride - FeCl3, and ferric sulphate - Fe2(SO4)3.7H2O are also effective in removing
arsenic from water. The ferric salts have been found to be more effective in removing
arsenic than aluminium over a wider range of pH (Ahmed, 2001). In the coagulation-

12
flocculation process, aluminium sulphate, ferric chloride, or ferric sulphate is dissolved
in the water and stirred for a few minutes. Micro-flocs form rapidly, and as stirring is
continued, agglomeration of micro-flocs into larger particles occurs. During this
flocculation process many different kinds of micro particles and negatively charged ions
are attached to the flocs by electrostatic attachment. Since As(III) occurs in non-ionized
form, it is not subject to significant removal, so that oxidation of As(III) to As(V) is an
essential pre-treatment (equations 1-3). A typical chemical scheme (for aluminium
coagulation) is as follows:
Aluminium dissolution: Al2(SO4)3.18H2O = 2Al3+
+ 3SO42+
+ 18H2O (4)
Aluminium precipitation (acidic): 2Al3+
+ 6H2O = 2Al(OH)3 + 6H+ (5)
Co-precipitation (Non-stoichiometric, non-defined product):
H2AsO4- + Al(OH)3 = Al-As (complex) + Other Products (6)
Arsenic adsorbed on aluminium hydroxide flocculants as Al-As complex is then
removed by sedimentation and filtration. The possible reactions of arsenate with
hydrous iron oxide are shown below where [≡FeOHo] represents oxide surface sites
(Dixit and Hering, 2003).
Fe(OH)3(s) + H3AsO4 → FeAsO4.2H2O + H2O (7)
≡FeOHo + AsO4
3- + 3H
+ → ≡FeH2AsO4 + H2O (8)
≡FeOHo + AsO4
3- + 2H
+ → ≡FeHAsO4
- + H2O (9)
Efficient arsenic removal is dependent on pH. In aluminium coagulation, the
removal is most effective in the pH range 7.2-7.5. In iron coagulation, efficient removal
is achieved in a wider pH range usually between 6.0 and 8.5 (Ahmed and Rahaman,
2000).
13
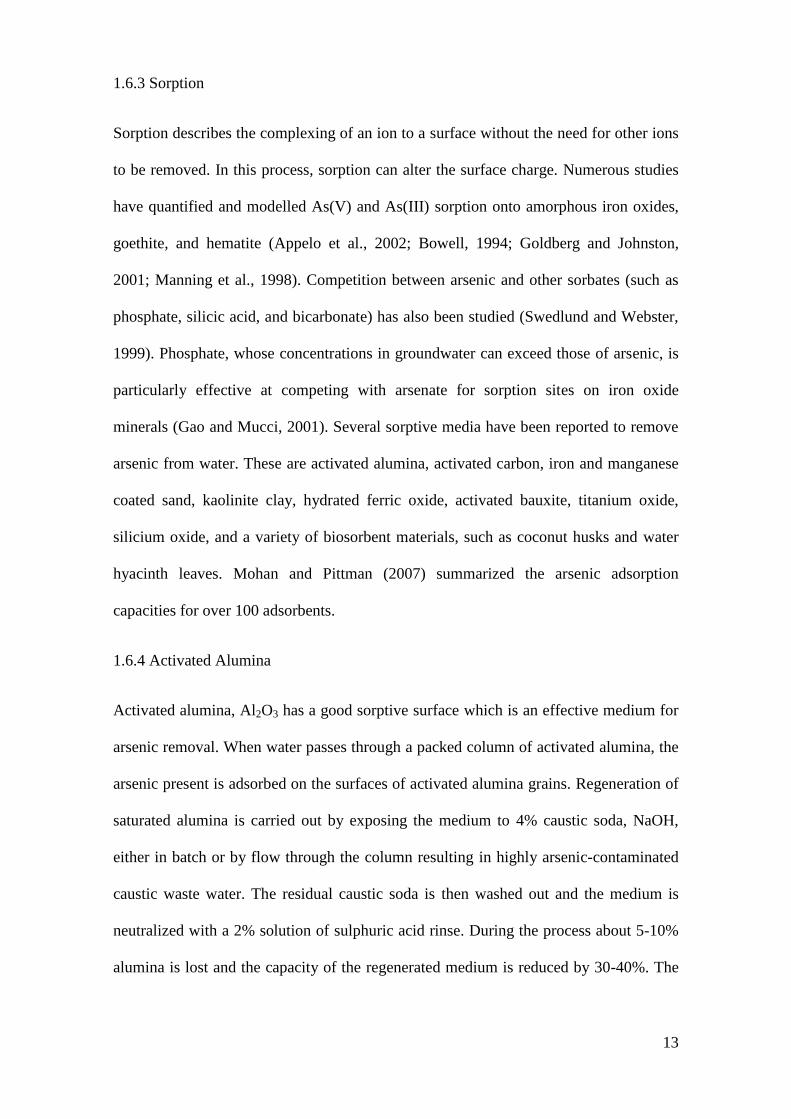
1.6.3 Sorption
Sorption describes the complexing of an ion to a surface without the need for other ions
to be removed. In this process, sorption can alter the surface charge. Numerous studies
have quantified and modelled As(V) and As(III) sorption onto amorphous iron oxides,
goethite, and hematite (Appelo et al., 2002; Bowell, 1994; Goldberg and Johnston,
2001; Manning et al., 1998). Competition between arsenic and other sorbates (such as
phosphate, silicic acid, and bicarbonate) has also been studied (Swedlund and Webster,
1999). Phosphate, whose concentrations in groundwater can exceed those of arsenic, is
particularly effective at competing with arsenate for sorption sites on iron oxide
minerals (Gao and Mucci, 2001). Several sorptive media have been reported to remove
arsenic from water. These are activated alumina, activated carbon, iron and manganese
coated sand, kaolinite clay, hydrated ferric oxide, activated bauxite, titanium oxide,
silicium oxide, and a variety of biosorbent materials, such as coconut husks and water
hyacinth leaves. Mohan and Pittman (2007) summarized the arsenic adsorption
capacities for over 100 adsorbents.
1.6.4 Activated Alumina
Activated alumina, Al2O3 has a good sorptive surface which is an effective medium for
arsenic removal. When water passes through a packed column of activated alumina, the
arsenic present is adsorbed on the surfaces of activated alumina grains. Regeneration of
saturated alumina is carried out by exposing the medium to 4% caustic soda, NaOH,
either in batch or by flow through the column resulting in highly arsenic-contaminated
caustic waste water. The residual caustic soda is then washed out and the medium is
neutralized with a 2% solution of sulphuric acid rinse. During the process about 5-10%
alumina is lost and the capacity of the regenerated medium is reduced by 30-40%. The

14
activated alumina needs replacement after 3-4 regenerations (Sarkar et al., 2005 and
2008).
1.6.5 Ion Exchange
Ion exchange itself is an adsorption reaction. In ion exchange, an ion sorbs to the
surface by removing another ion of the same valence or multiple ions of lower valence.
In this way, ion exchange never changes the surface charge. The process is similar to
that using activated alumina, but the medium is a synthetic resin of well-defined ion
exchange capacity. The process is normally used for removal of specific undesirable
cations or anions from water. As the resin becomes exhausted, it needs to be
regenerated. The arsenic exchange and regeneration equations with common salt
solution as regeneration agent are as follows:
Arsenic exchange: 2R-Cl + HAsO42-
= R2HAsO4 + 2Cl-
(10)
Regeneration: R2HAsO4 + 2Na+ + 2Cl
- = 2R-Cl + HAsO4
2- + 2Na
+ (11)
Where R stands for ion exchange resin.
The arsenic removal capacity is dependent on sulphate and nitrate contents of
raw water as sulphate and nitrate are exchanged before arsenic. The ion exchange
process is less dependent on pH of water than is the process of sorption (Section 1.6.5).
1.6.6 Membranes
Membranes are selectively permeable so that some molecules can pass through them
while others are rejected. Membrane processes have the ability to remove bacteria, salts
and metals including arsenic. There are low-pressure membranes like microfiltration
and ultrafiltration and high pressure membranes such as nanofiltration (NF) and reverse
osmosis (RO). It was shown by Sato et al. (2002) that a nanofiltration membrane

15
removes over 95% of As(V) and 75% of As(III) without the addition of any chemicals
and thus could be used in any type of water. The more recent generation of NF and RO
technologies that have been developed can operate at lower pressures (40-400psi) and
were able to reject 96-99% of both As(V) and As(III) (Ravenscroft et al., 2009).
However membrane filtration requires relatively high quality influent water as the
membranes can be fouled by colloidal matter (organic) which makes this technology
less useful in a rural field setting. The membrane itself does not collect arsenic so
membrane disposal is simple and operation and maintenance is minimal. Maintenance
includes ensuring that there is a reasonably constant pressure and periodically wiping
the membrane clean. However a major disadvantage is the low recovery rate of only
approximately 10-20% of raw water passing through the membrane. Further, membrane
units have a high capital cost which makes this technology less suitable for rural and
poor communities. So, though membrane technologies have been shown to be effective
in removal of arsenic, they are not economically feasible for rural people of the Bengal
basin (Bissen and Frimmel, 2003; Elcik et al., 2013).
1.7 Arsenic-Rich Waste
Given the scale of the arsenic problem and the increased application of arsenic removal
technologies, it can be expected that large quantities of arsenic-rich waste is generated.
The disposal of arsenic-rich waste is a major concern because of the potential for
arsenic release at waste disposal sites and subsequent recontamination of water sources.
Arsenic-bearing solid wastes from drinking water treatment in developed countries are
typically disposed of in municipal solid waste landfills (Cornwall, 2004). Since there
are virtually no engineered landfills in rural India, different disposal options must be
considered. Clancy et al. (2013) critically reviewed the different disposal methods of
arsenic-rich waste produced by the removal processes outlined in section 1.6. They

16
concluded that the disposal strategies with the most potential in developing countries
are the use of passive aeration and concrete stabilization, but also pointed out that more
research is required to better understand how these methods perform in the long term
when exposed to field conditions.
1.7.1 Passive Aeration
In some regions in the Bengal basin, spent iron/aluminium hydroxide adsorbent media
from filters is said to be collected and brought to a central location. This spent adsorbent
is disposed of by burying it in a controlled manner and keeping it exposed to air by way
of vented PVC-piping within a coarse sand filter (Sarkar et al., 2008). This is done to
avoid reductive dissolution and the subsequent release of arsenic from oxidized arsenic-
bearing wastes by keeping it oxidized (Sarkar et al., 2010). Clancy et al. (2013) suggest
that long-term performance of this system, as well as the effects of changing
environmental conditions, including redox and pH, caused by flooding and cycles of
wetting and drying, still need to be assessed. Though this method has potential, it is not
widely used.
1.7.2 Concrete Stabilization
Solidification/stabilization of hazardous waste, whereby the waste is encapsulated and
strengthened (solidification), and the toxicity and mobility are reduced (stabilization), is
a treatment strategy that is often quoted in the literature as a viable option for the Bengal
basin. However it is rarely utilized. This method requires the addition of lime, concrete,
and/or iron containing additives (Raj et al., 2005). Following solidification/stabilization,
arsenic wastes could be disposed of in landfills or used in the making of bricks
(Kameswari and Bhole, 2001). Interactions between waste and concrete can affect
arsenic stability and concrete strength so each type of waste needs to be considered
uniquely when determining waste disposal options (Sullivan et al., 2010). Laboratory
17
and field studies are needed to evaluate long-term arsenic leaching potential. A risk
analysis for humans is also required since the use of arsenic-contaminated bricks could
give rise to repeated exposure of workers during the construction stage and of residents,
due to erosion of the bricks.
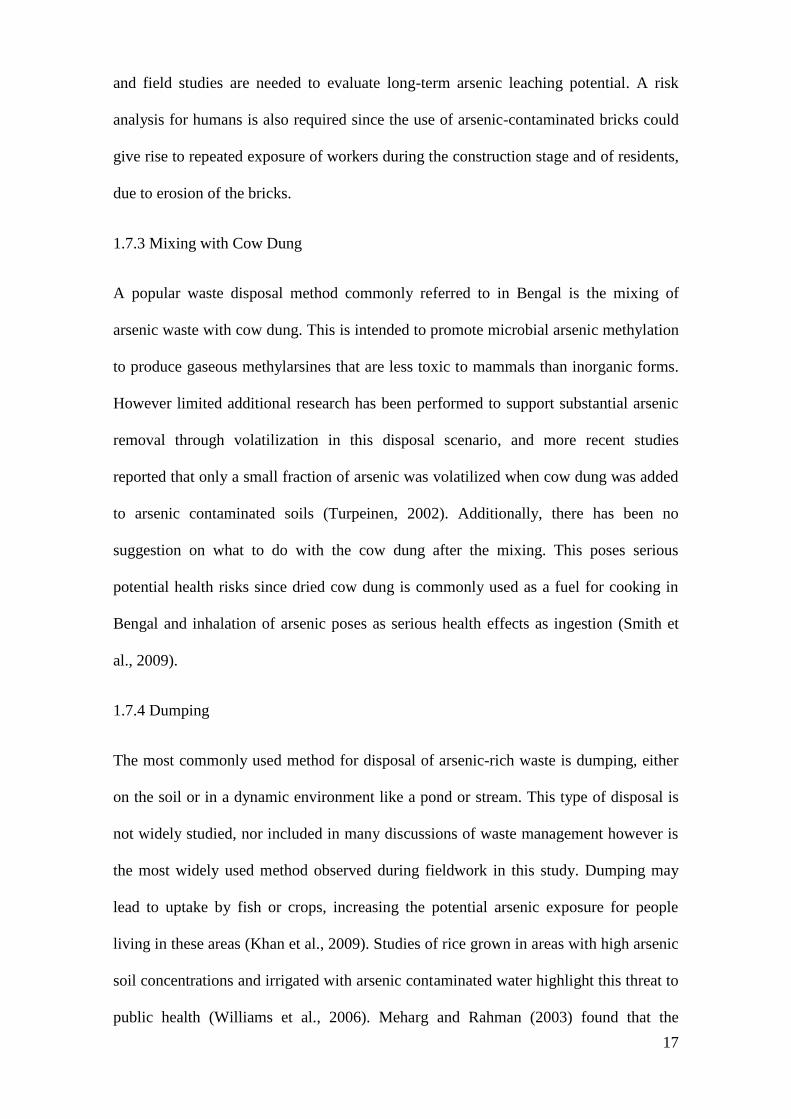
1.7.3 Mixing with Cow Dung
A popular waste disposal method commonly referred to in Bengal is the mixing of
arsenic waste with cow dung. This is intended to promote microbial arsenic methylation
to produce gaseous methylarsines that are less toxic to mammals than inorganic forms.
However limited additional research has been performed to support substantial arsenic
removal through volatilization in this disposal scenario, and more recent studies
reported that only a small fraction of arsenic was volatilized when cow dung was added
to arsenic contaminated soils (Turpeinen, 2002). Additionally, there has been no
suggestion on what to do with the cow dung after the mixing. This poses serious
potential health risks since dried cow dung is commonly used as a fuel for cooking in
Bengal and inhalation of arsenic poses as serious health effects as ingestion (Smith et
al., 2009).
1.7.4 Dumping
The most commonly used method for disposal of arsenic-rich waste is dumping, either
on the soil or in a dynamic environment like a pond or stream. This type of disposal is
not widely studied, nor included in many discussions of waste management however is
the most widely used method observed during fieldwork in this study. Dumping may
lead to uptake by fish or crops, increasing the potential arsenic exposure for people
living in these areas (Khan et al., 2009). Studies of rice grown in areas with high arsenic
soil concentrations and irrigated with arsenic contaminated water highlight this threat to
public health (Williams et al., 2006). Meharg and Rahman (2003) found that the

18
ingestion of rice is a major source of arsenic exposure in Bangladesh and that the
elevated level of arsenic is due to irrigation of the crops with contaminated water. They
also determined that soil previously irrigated with arsenic-contaminated water, and soil
in locations where dumping of arsenic-rich waste occurred, will be contaminated
indefinitely. These findings highlight that dumping arsenic waste poses significant risk
of arsenic exposure to the public, present and future.
1.8 Aim and Objectives
The underlying aim of this thesis is to better understand why so many arsenic mitigation
options fail in Bengal. The first objective is to use the Process Analysis Method to
create a set of indicators for Sociocultural, Environmental and Economic capital, which
together form a triple-bottom-line sustainability assessment. The second objective is to
gather information directly from stakeholders in Bengal concerning their needs,
concerns and experiences; this requires fieldwork. The next objective is to use the data
collected during field work to assess each of the ten most widely utilised technologies in
West Bengal, to better understand its performance within the cultural context. The final
objective is to discuss any issues as they arise from the analysis (user’s perspective) and
draw conclusions which will help improve product-design, implementation and policy-
creation related to arsenic removal schemes.

19
2 Clean-Water Technologies
Clean-water options available to rural households in West Bengal vary widely across
arsenic-affected areas. A village may have access to municipally treated water from a
community shared standpipe (‘time-water’); hand-dug wells which utilize very young,
near-surface water which is commonly free of arsenic; or a village-shared, deep
groundwater well; alternatively, a family may be using a household-scale or a
community-scale arsenic-removal filter. Community-scale filters are more commonly
used than household-scale models and are often referred to as Arsenic Removal Plants
(ARP) in literature (Hossain et al., 2005; Hossain et al., 2006). Designs vary but
typically include sections for oxidation, co-precipitation or sorption, flocculation,
sedimentation and filtration. Unfortunately there are many models of ARPs that do not
work once implemented in a field setting. A major study was done on 577 ARPs in the
Bengal basin which showed that 82.3% of them were not functioning at the time of the
survey (Hossain et al., 2005; Hossain et al., 2006). UNICEF produced an information
pamphlet for an international conference on water quality with special reference to
arsenic which was held in Kolkata in February of 2012. This pamphlet listed the most
widely used arsenic mitigation technologies in West Bengal (Public Health Engineering
Department, 2012), and below are descriptions of ten of those systems which have been
evaluated in this research. Of these, seven are community-scale and three are
household-scale. For additional details about these technologies, specific to every
village visited, see Appendix I.

20
2.1 Community-Scale Technologies
2.1.1 Technology for in-situ treatment for potable groundwater (Tipot)
Photo 1.1 Tipot in one of the villages Figure 1.1 Diagram of the Tipot (modified from
visited during field research. SAR, 2010).
The Tipot was designed by a consortium of select European universities and Indian
research institutes led by Dr Bhaskar Sen Gupta at Queens University Belfast. Under
the guidance of Sen Gupta, an NGO called Ramakrishna Vivekananda Mission -
Institute of Advanced Studies (RKVM-IAS) from Agarpara, India, won the ‘Global
Development Marketplace Competition’ in 2006, under the ‘Water and Sanitation for
the Poor’ category (Sen Gupta et al., 2009). As a result, the World Bank allotted
RKVM-IAS funds to install six plants at six separate locations in rural West Bengal.
These funds paid for all the capital costs and recurring costs for five years. By 2012,
only two remain operational, and were both visited and included in this study.
The Tipot uses subterranean groundwater treatment which is based on the same
principle of oxidation and filtration as used by of conventional surface treatment plants.
In this case, the underground aquifer is used as a natural biochemical reactor and
Top Ground Surface
Recharge Tank Delivery Tank
Tap
Oxygenation
Ground Water Table
Oxygenation Zone
Power
Air Holes

21
adsorber that removes arsenic, iron and magnesium. Water is pumped from the
underground aquifer using a submersible pump. The water is aerated and 15–20% of it
is returned to the aquifer, while the remainder is supplied as arsenic-free water to the
community (Figure 1.1; Photo 1.1). The process of aeration at surface, followed by
recharge of the oxygen-rich water to the aquifer, increases the dissolved oxygen
concentration in the groundwater (Sen Gupta et al., 2009). The iron that is adsorbed to
the surface of the soil grains is oxidized by the oxygen-rich water, into insoluble iron
oxyhydroxide which removes arsenic as a co-precipitation product.
The greatest advantage of this process is there is no arsenic-rich waste produced
above ground, as the source arsenic and iron are trapped in the underground sand. Sen
Gupta claims there is no restriction to the amount of arsenic the aquifer-sands can
handle, as long as proper time is allowed for the oxygen-rich water to create the
adequate oxidizing zone in the aquifer. However no long-term analysis or modelling has
been completed to prove this claim. Other disadvantages include the very long
implementation phase, which can range from several months to over a year to complete
reclamation of an aquifer before the water is safe enough to drink. There has also been
no research published on how irregular activity in usage of the technology may affect
the aquifer’s water quality. For example, during fieldwork many people expressed
concern that the water was too hot to drink in the summer months, as the storage tanks
are black and thus absorbs sunlight. So many people are only inclined to use the system
during the rainy season, leaving the Tipot largely unused for several months. The
consequences of periods of non-use on the oxidation phase in the aquifer are unclear.
Treated water is provided free to all villagers. The operator was appointed and
trained by RKVM-IAS but is not paid. Now that the grant awarded to this project has
expired (after five years), the operator has been left to pay the electricity bill and other
recurring costs himself.

22
2.1.2 Indian Institute of Technology, Bombay (IITB)
Figure 1.2 Diagram of IITB Photo 1.2 IITB with two tanks
Photo 1.3 Arration of raw water before Photo 1.4 Close-up of the ZVI (iron nails)
the adsorption occurs on the iron nails
The IITB model was conceptualised using the results from Berg et al. (2006) and
Roberts et al. (2004) who proved that slow sand filters are robust and effective, and that
multiple additions of Fe(II) into a system lead to improved removal of arsenic by
sorption to Hydrous Ferric Oxide (HFO). The system was designed and built under a
grant from the Department of Science and Technology, Government of India, by Tuhin
Banerji, a doctoral student under the supervision of Professor Sanjeev Chaudhari from
IIT Bombay. IITB systems have been installed in five villages, all of which were
visited, and three were evaluated for this project.
Hand
Pump Tap
Perforated Pipe for
Aeration and Distribution
ZVI Contactor Tray
Course
Media
Fine Media

23
The filter consists of two or three tanks which are similar in design (Figure 1.2;
Photo 1.2). With a direct inlet from the hand pump, water is pumped into the top of the
first tank and sprinkled into the top trays by way of a perforated pipe (Photo 1.3). The
aerated water oxidizes the As(III) to As(V) and then comes into contact with zero valent
iron (ZVI) in the form of iron nails which are held in the top trays (Photo 1.4). ZVI is
used to leach Fe(II) which oxidises to Fe(III) in the presence of dissolved oxygen.
Research has shown that the corrosion of ZVI forms Hydrous Ferric Oxide (HFO)
which acts as an adsorbent for arsenic (Kanel et al., 2005). Sand is not used in this filter
as it would trap all the HFO in the top layers, and cause clogging which would then
require frequent cleaning. Instead, the filter bed is made up of stone chips and gravel
which reduces the head-loss and allows the HFO to penetrate deeper into the filter.
Deeper penetration of the adsorbent increases the contact time of raw water with the
adsorbent, thereby increasing arsenic adsorption capability. A sequence of two or three
identical tanks forms a complete arsenic removal system, with a tap at the bottom of the
last tank used directly by the consumer. The number of tanks depends on the initial
concentration of arsenic in the local aquifer. It was determined that an Fe/As ratio of 10
is needed in field conditions to lower concentrations of arsenic to below 10ppb
(Personal correspondence with Tuhin Banerji).
The waste that is generated is a complex of HFO and As(V), which is considered
to be relatively stable in oxidized solid form. The IITB team believe that as long as the
sludge is exposed to the atmosphere, the bound arsenic will not leach out. They
recommend that the sludge be placed into an open-air containment tank which can
accumulate dry sludge for up to ten years. When the sludge tank is full, the dried sludge
can be used in the construction industry or disposed of in a controlled manner. A sludge
tank is kept beside each filter and has a pipe at the bottom to release any excess water.
One disadvantage of this waste disposal method is that some arsenic may flow out of

24
the discharge tube with the water and be released back into the environment to
contaminate another locale. Additionally, it may be unclear to the villagers what to do
with the waste once the sludge tank is full in ten years, or they may not have the ability
(financially or physically) to transport it to a safe-disposal facility.
The operator of this system is a volunteer who is responsible for maintenance
and repairs. Water is provided free to all villagers.
2.1.3 Bengal Engineering and Science University (BESU)
Photo 1.5 BESU Figure 1.3 Diagram of BESU
(Modified from Sarkar et al., 2010)
In 1997, the Bengal Engineering and Science University in association with Lehigh
University, USA, developed a community-scale ARP that they refer to as ‘AMAL’ but
in this research will be called BESU. Alongside various partnering NGOs, they have
installed approximately 175 systems across India (Sarkar et al., 2005; Sarkar et al.,
2008). Six of these systems were observed in operation, of which three were chosen to
be evaluated in this study.
Hand
Pump
Tap
Vent
HAIX or
Activated
Alumina

25
In the top portion of the column, the dissolved iron present in ground water is
oxidized by atmospheric oxygen and the water then flows through 50L of activated
alumina specific to arsenic binding and/or an arsenic-selective hybrid anion exchanger
(HAIX®) (German et al., 2013) The partially treated water then enters the second
column containing another 50L of activated alumina or HAIX®, which acts as a
polishing unit. Treated water is collected at the bottom of the second column. Both
columns have provisions for backwashing. However, the second column rarely requires
backwash because most oxidation of dissolved iron and subsequent precipitation occurs
in the first column. The general configuration of the sorption column and its operational
features are shown in Figure 1.3 and Photo 1.5. The activated alumina is bought from an
indigenous manufacturer (Oxide India Limited, Durgapur, West Bengal), whereas
HAIX® was developed at Lehigh University and is thus imported. The column is meant
to be backwashed for 10–15 minutes every day to drive off the accumulated HFO
particulates preventing clogging (Sarkar et al., 2010). The backwashing is done in up-
flow mode with the raw water entering from the bottom of the unit. The backwash is
dumped into a brick-lined hole adjacent to the filter or into the local environment.
Once per year, the adsorbent requires regeneration. This is done using a caustic
soda solution followed by an acid wash. Spent alkali, spent acid and spent rinse water
are mixed after each regeneration phase, and the pH is adjusted to around 6.5 by adding
hydrochloric acid. Regeneration of 100L of activated alumina produces 1600L of waste
solution. Approximately 5L of thick brown precipitate forms rapidly following the pH
adjustment and this arsenic laden sludge quickly settles to the bottom of the tank. The
contents of the tank are then dumped into a hole in the ground which is filled with stone
chips and course filter material. The arsenic-rich sludge sits at the top of the hole as it is
the last thing to be poured in, allowing it to dry and to be as exposed to the atmosphere.
Similar to the IITB method, it is thought that as long as the sludge is exposed to the
26
atmosphere, the bound arsenic will not leach out. One central regeneration centre is said
to be in operation, which services the entire region. However it was not possible to visit
this centre in person to confirm the practice of regeneration and waste disposal, despite
several attempts.
A village water committee manages the system. The regular maintenance of the
unit is administered by an operator who is appointed by the water committee. The users
of the filter pay a tariff which is meant to cover all expenditures related to maintenance
of the unit, and annual costs of regeneration.
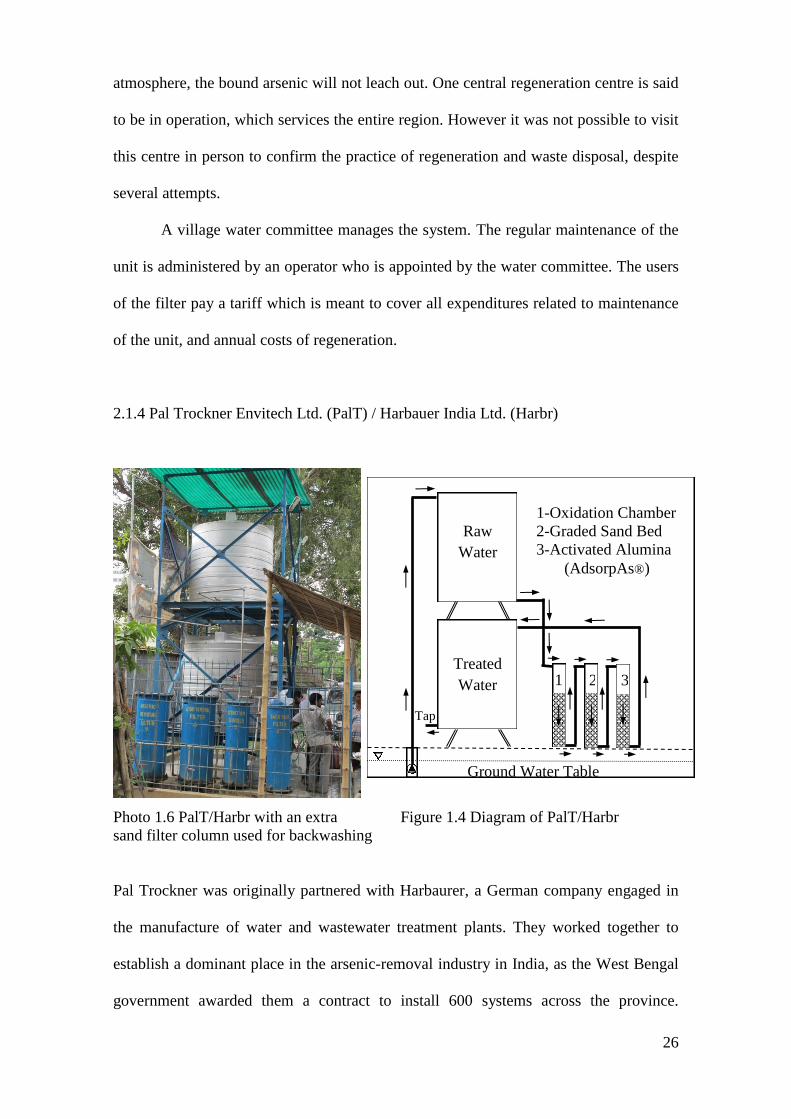
2.1.4 Pal Trockner Envitech Ltd. (PalT) / Harbauer India Ltd. (Harbr)
Photo 1.6 PalT/Harbr with an extra Figure 1.4 Diagram of PalT/Harbr
sand filter column used for backwashing
Pal Trockner was originally partnered with Harbaurer, a German company engaged in
the manufacture of water and wastewater treatment plants. They worked together to
establish a dominant place in the arsenic-removal industry in India, as the West Bengal
government awarded them a contract to install 600 systems across the province.
Raw
Water
Treated
Water
Tap
1 2 3
1-Oxidation Chamber
2-Graded Sand Bed
3-Activated Alumina
(AdsorpAs®)
Ground Water Table

27
However, the partnership ended in 2001 and they now operate independently of each
other. They do however use exactly the same technology. Two filters from each
company were viewed and assessed. In this research, the system both companies use is
referred to as PalT/Harbr.
The filter is designed to remove suspended solids, iron and arsenic. The raw
water from the tube well is first fed to an oxidation chamber filled with manganese
dioxide (MnO2), which is an oxidising agent (Harbauer, 2012). Water from the
oxidation chamber along with the precipitate of ferric hydroxide which was formed in
the oxidation process, then passes through graded sand and gravels. The precipitate
settles in the sand bed and the now iron-free water flows into an adsorption tower filled
with granular ferric hydroxide (otherwise known as AdsorpAs®) which removes arsenic
to permissible levels (Figure 1.4; Photo 1.6).
PalT/Harbr claim that the granular ferric hydroxide (AdsorpAs®) is entirely
resistant to leaching and thus can be dumped anywhere safely. Toxicity Characteristics
Leaching Procedure (TCLP) tests have established that no leaching of arsenic takes
place under normal environmental conditions (Pal, 2001). The TCLP defines ‘normal
environmental conditions’ as those found in regulated American landfills (which are
aerated). No research has been conducted regarding the leaching of this waste when it is
randomly dumped in the Bengal basin, an ecosystem that is very different to an
engineered American landfill.
PalT/Harbr designates and trains operators who are responsible for the
management of the system in their area. Users pay a monthly or per litre tariff for access
to the treated water, which is meant to cover all operational costs of the filter, including
a wage for the operator.
Jadavpur University evaluated the performance and efficacy of 49 PalT/Harbr
filters. The study found that the personnel entrusted with repairing and backwashing of

28
the plants were irregular in attending to their duties, 80% of the systems have
mechanical problems causing them to be non-functional and that 44% have been
installed in areas where the arsenic content in the water is low enough that an arsenic
removal system is not needed (Chakraborti, 2001).
2.1.5 All India Institute of Hygiene & Public Health - Jadavpur University (AIIH&PH)
Photo 1.7 AIIH&PH Figure 1.5 Diagram of AIIH&PH
(Modified from Ahmed et al., 2001)
Photo 1.8 Chemical buckets onto of the filter Photo 1.9 Hole full of liquid waste
Up-flow
Sand
Filter Tap
A
B
C
D
E
A-Chemical Bucket
B-Chemical Mixing Tank
C-Flocculation Tank
D-Baffle Mixer
E-Sedimentation Outlet

29
Professor Arunabha Majumder from Jadavpur University developed an arsenic removal
technology in association with the All India Institute of Hygiene & Public Health. The
Government of India provided the funds for several (5-6) of these units to be installed in
the district of Murshidabad under the direction of the West Bengal Voluntary Health
Association. The AIIH&PH system was given to the family who owned the land it was
installed on, to be used as an entrepreneurial venture. After installation the family was
responsible for purchase of the chemicals, maintenance and repairs as well as collecting
a tariff from the villagers who use the filter. Three AIIH&PH filters were included in
this study.
Sodium hypochlorite (used for oxidation) and aluminium sulphate (used for
coagulation), are kept in buckets which sit on top of the system (Photo 1.7). Raw water
is hand pumped into the top of the filter where both chemicals are mixed in. The
arsenic-rich flocculants settle out of the system in the baffle mixer and during up-flow
sand filtration (Figure 1.5). Majumder determined that the arsenic removal plant is
effective in removing 90 percent of arsenic from tube well water which has initial
arsenic concentrations no higher than 300ppb (Majumder, 2011). One major design flaw
is that the buckets which hold the chemicals on top of the system are open to the
atmosphere allowing for contamination of rainwater, bacteria, and debris (Photo 1.8).
They are also not well-secured, and can be blown off the top of the filter on a windy
day. One operator complained that he was unsure of the quantity of chemicals needed
and how often. Another operator claimed the chemicals were too expensive so decided
not to use them any longer. When the field team explained that not using the chemicals
meant that this system no longer removed arsenic, he did not understand, claiming that
the plant still works because the water still moves through the tanks.
There is very little literature published about the AIIH&PH and no literature on
its waste products or waste disposal methodology. At the time of installation, a

30
concrete-lined hole was dug beside the system, which was to be used for waste disposal.
From field observations, liquid waste formed from backwashing and sludge collected
from the sedimentation outlet were simply dumped into nearby ponds because the
concrete-lined hole was full (Photo 1.9).
2.1.6 Central Glass & Ceramic Research Institute (CGCRI)
Photo 1.10 CGCRI Figure 1.6 Diagram of CGCRI
The CGCRI is part of the Council of Scientific and Industrial Research which is an
industry-based research and development organization in India. It is a private and for-
profit institute that designed an arsenic removal unit using adsorption followed by
filtration using a ceramic membrane. The Public Health Engineering Directorate
(PHED), a department within the Government of West Bengal paid for four CGCRI
filters to be installed. The household whose land was used as a site for building the
system became the CGCRI’s operator and owner. Each household was free to charge a
tariff to community members to cover expenses and to promote it as an entrepreneurial
venture. All four of these systems were visited and three were chosen to be evaluated in
this study
A-Ceramic Membrane
B-Treated Water
C-Waste Water
Tap
Raw
Water
Adsorbent
Ground Water Table
A B
C

31
CGCRI utilizes the principle of adsorption of arsenic by ‘nanocolloidal media’
likely to be comprised of ferric hydroxide (Roy et al., 2005; Bandyopadhyay et al.,
2002). The particulate matter is then removed using a porous ceramic element which
works as a membrane. The ceramic membrane replaces the sand filter component in
other models (Figure 1.6; Photo 1.10). The CGCRI has kept all the details regarding the
arsenic-removal mechanism and arsenic waste disposal as confidential proprietary
information. One challenge when using a membrane is that electricity is required to
maintain operation pressure. This adds to the cost of running the system and exposes the
plant to the unreliable power grid causing the system to be offline very regularly and
sometimes depressurising the system.
Another issue in this design is that membranes produce a large volume of waste
water. The total amount of liquid waste and sludge generated, and how the CGCRI
disposes of this waste, is information that is not publically available. During field
observation, it was determined that waste water was cycled back into the system but the
operators did not know anything about replacing the ‘nanocolloidal arsenic-removal
media’. Operators were told to keep the sludge produced by the membrane in a barrel
for CGCRI to collect at a later time. Operators estimate collecting between 20-50L of
sludge per month. Two operators claimed to keep it in barrels and one admitted to
dumping it into the nearby pond.
Villagers were generally unhappy with this business model. When one family
who owned the CGCRI filter made enough money from it to build an extension onto
their house, their neighbours became disgruntled. The neighbours felt it was wrong that
one family could benefit financially from selling water. As a result, neighbours stopped
using the filter and now the operator cannot make enough money from sales to cover the
electricity costs.

32
2.1.7 Dug Wells through Project Well
Photo 1.11 Top view of a Dug well
Figure 1.7 Cross section of a Dug well
Photo 1.12 Side view of a Dug well
Hand dug wells have been used across the world throughout history. The oldest known
well has been found in an archaeological excavation in Israel dated to 8100-7500 BC. In
India, the use of hand dug wells was mostly abandoned when tube wells became
popular. Project Well and Aqua Welfare Society, are two NGOs that are working
together to raise awareness of the feasibility of this technology as an arsenic mitigation
solution in India. Through private donations, they have been able to construct around
250 dug wells since 2001. All recurring costs are covered by the NGOs allowing for
everyone in the village to have unlimited free access to the water from the dug wells.
Ten dug wells have been visited and three were chosen for inclusion in this study.
Hand dug wells target the shallowest of water from the unconfined aquifer
closest to the ground’s surface. This is the ‘youngest’ water that sits above the aquitard
Shallow Surface
Water Table
A-Coarse Sand
B-Perforated Rings
C-Perforated Pipe
A
B
C
Hand
Pump

33
which below contains the Holocene aged arsenic-rich aquifer. Since arsenic is not
present in this water, removal is not required, meaning no arsenic-rich waste is
produced. However Dug wells can become contaminated with bacteria and debris from
the surface. To minimise this possibility, Project Well has modified the traditional
design to include a well cover and inside pipe that is directly connected to a hand pump
at the surface.
The construction of the well begins with a hole being hand dug approximately
1m in diameter and between 7-10m deep (Figure 1.7; Photos 1.11 and 1.12). Perforated
concrete rings are inserted from the bottom up with coarse sand placed in the annular
space between the formation wall and the concrete rings. The coarse sand creates a
highly permeable zone around the well that can function as a natural filter. The mouth
of the dug well is built up to 45cm above the surface and is surrounded by a brick wall
with a slanting roof, and is covered by a fine nylon net to avoid any external material
from dropping into it. The roof is made of an corrugated tin sheet that is locked to avoid
any tampering. A hand pump is attached to the well to draw out the water, preventing
contamination by human contact. The dug wells are periodically treated with Theoline®
which contains sodium hypochlorite (liquid bleach) that consists of 5% – 10% chlorine,
0.2% free alkali and water. 50g of Theoline® can disinfect 1000L of water (USEPA
standard). In general practice, Theoline® is primarily used to control the odour and taste
of water, and helps control bacteria. Theoline® is available in some medicine shops, is
nontoxic and can be easily handled. Under the Project Well scheme, the family who
owns the land on which the Dug well sits, is responsible for adding the Theoline® once
every few months depending on the weather (Hira Smith et al., 2003).

34
2.2 Household-Scale Technologies
2.2.1 SONO 45-25
Photo 1.13 SONO 45-25 Figure 1.8 Diagram of the SONO 45-25
The SONO 45-25 was developed by a team of researchers at George Mason University
USA, and Manab Sakti Unnayan Kendra, an NGO from Kustria in Bangladesh. It is
widely used there and was verified through the Bangladesh Environmental Technology
Verification – Support to Arsenic Mitigation (BETV-SAM) Programme in 2009. Filters
can be purchased privately however are often given to families for free through NGOs.
It is estimated that over 90,000 of these filters have been distributed in Bangladesh but
only several hundred in West Bengal. In partnership with UNICEF and an NGO called
Behala Sambit, a trial was conducted in one West Bengal village wherein 24 SONO45-
25 units were installed and monitored for one year. The cost of the filter was subsidised
by the programme where each household was only required to pay 100 Rupees for their
filter. This village was visited and these filters were evaluated in this study.
Arsenic removal in this filter is done by running raw water through a composite
iron matrix (CIM) which is made of cast iron. Manganese in the CIM catalyses
Tap
Coarse Sand
CIM
Coarse Sand
Coarse Sand
Fine Sand Wood Charcoal
Bucket 1
Bucket 2
Raw water is
poured in the top
by hand

35
oxidation of As(III) to As(V), and then the arsenic is removed by complexation on the
surface of the iron matrix which is hydrate iron (FeOH). The filter consists of two
plastic buckets (covered) placed one over another in a rack. These contain brick chips,
layers of fine and coarse sand, wood charcoal and CIM (Figure 1.8; Photo 1.13). The
buckets are connected with plastic tubing and have valve controls near the bottom. The
process does not require any pre-treatment of water with oxidizing agents and does not
require any maintenance, including no backwashing or regeneration of media.
The life span of the filter is less than two years. Once expired, the entire filter
requires replacing. After the CIM is ‘saturated’ with arsenic, TCLP leeching tests show
it to be not hazardous when disposed of in a controlled landfill. SONO 45-25 faces the
same problem as the PalT/Harbr filter in that American TCLP leach tests may not apply
in the Bengal setting. The field team observed entire SONO 45-25 filters, including the
CIM randomly dumped in the local environment. Expiry dates were ignored as the
household deemed them to be too expensive to replace.
2.2.2 Nirmal
Photo 1.14 Nirmal filter Figure 1.9 Diagram of the Nirmal filter
Tap
Raw water is
poured in the top
by hand
Porous candle
connects the two
chambers
Activated
alumina
Treated
Water

36
The ‘Nirmal’ filter was designed in collaboration with UNICEF and BESU using the
same regenerable activated alumina as previously described in Section 2.1.3. The filter
is available for purchase in Rural Sanitary Marts (RSM) across West Bengal for the
price of 900 Rupees ($15 USD). RSM is an Indian retail outlet that manufactures and
markets low-cost sanitation hardware. Nirmal was included in the same study as the
SONO 45-25, in which UNICEF and Behala Sambit conducted a trial where 23 Nirmal
filters were installed and monitored for one year. This village was visited by our
research team and these filters were evaluated in this study. Two other villages had the
Nirmal filters distributed by the Panchayat (Bengla word for local village
government/elders). These two villages were also visited and included in this study. The
entire cost of the filters was paid through the NGOs participating, with the expectation
that each household would pay for the regeneration of the media once per year.
The Nirmal filter (Photo 1.14; Figure 1.9) consists of two chambers made of
‘ferro’ cement which are placed one over another with a rubber gasket in the middle to
prevent leakage. Water is poured into the top chamber and moves through a filter candle
which is fitted over the hole that connects the two chambers. The candle, made of
burned soil and rice husk, removes iron from the raw water. The water then moves
through a sachet of activated alumina (AA), which removes arsenic. The treated water
sits in the bottom chamber ready to be poured through the tap (Bengal Engineering
College, 2011).
The regeneration procedure for the AA is the same as in section 2.1.3, where
each family is expected to bring the AA to a central regeneration facility once per year.
However this was not done in any of the villages as people did not know how to contact
the regeneration centre. As a result, households discontinued use of the filter after one

37
year. The expired arsenic-rich adsorbent was dumped by each household in random
locations.
One major complaint users had with the Nirmal was the very slow filtration rate.
Users typically had to filter over night to have 10L of treated water ready for the
morning. Since 10L of drinking water per day is not enough for a family, this raises the
question as to whether the Nirmal is fit for purpose.
2.2.3 Defence Research and Development Organization (DRDO)
Photo 1.15 Pieces of the DRDO filter Figure 1.10 Diagram of the DRDO filter
Save the Environment NGO received funding through the Government of India,
Ministry of Science and Defence to implement filters designed by the Defence Research
and Development Organization (DRDO) to communities within arsenic-affected regions
over three years. 2,100 DRDO filters were said to have been distributed free to each
household during this time. Two villages, which were quoted as having 300 filters
distributed in them, were visited for this survey.
Raw water is poured in
the top by hand
Fine sieves
connect
buckets
Tap
Treated
Water
Fine grained
sand inside a
mesh bag
Porous ZVI
ball inside a
mesh bag
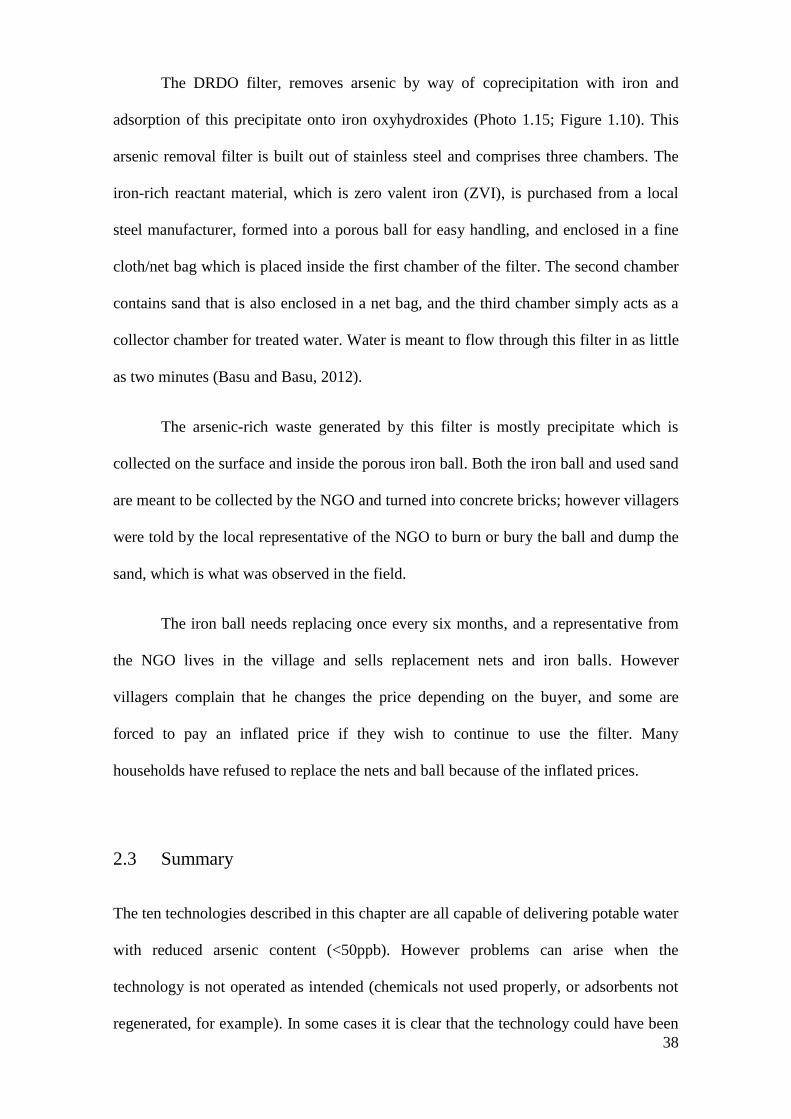
38
The DRDO filter, removes arsenic by way of coprecipitation with iron and
adsorption of this precipitate onto iron oxyhydroxides (Photo 1.15; Figure 1.10). This
arsenic removal filter is built out of stainless steel and comprises three chambers. The
iron-rich reactant material, which is zero valent iron (ZVI), is purchased from a local
steel manufacturer, formed into a porous ball for easy handling, and enclosed in a fine
cloth/net bag which is placed inside the first chamber of the filter. The second chamber
contains sand that is also enclosed in a net bag, and the third chamber simply acts as a
collector chamber for treated water. Water is meant to flow through this filter in as little
as two minutes (Basu and Basu, 2012).
The arsenic-rich waste generated by this filter is mostly precipitate which is
collected on the surface and inside the porous iron ball. Both the iron ball and used sand
are meant to be collected by the NGO and turned into concrete bricks; however villagers
were told by the local representative of the NGO to burn or bury the ball and dump the
sand, which is what was observed in the field.
The iron ball needs replacing once every six months, and a representative from
the NGO lives in the village and sells replacement nets and iron balls. However
villagers complain that he changes the price depending on the buyer, and some are
forced to pay an inflated price if they wish to continue to use the filter. Many
households have refused to replace the nets and ball because of the inflated prices.
2.3 Summary
The ten technologies described in this chapter are all capable of delivering potable water
with reduced arsenic content (<50ppb). However problems can arise when the
technology is not operated as intended (chemicals not used properly, or adsorbents not
regenerated, for example). In some cases it is clear that the technology could have been

39
better designed to make it easier to operate and/or more durable. There may also be
difficulties if the technology is deployed or managed in a way that does not match the
users’ needs or expectation. All the technologies had problems with safe disposal of
arsenic rich waste, except for the Tipot and Dug wells (which produce no waste).
Observations from field work and quotes by the stakeholders illustrate some of these
problems, which are further explored in more detail in the chapters analysing the field
survey.

40
3 Assessment Methodology
3.1 Evaluations
There are several review papers that summarize different remediation technologies
available to rural communities in the Bengal basin (Ahmed, 2001, Saha et al., 2001;
Sharmin 2001, Garelick et al., 2005; Malik et al., 2009). Due to the number of people
being affected by arsenic poisoning, there has been an influx of novel technologies to
the market in the Bengal region. As a result, there is now a need to have the ability to
examine the technologies to determine which fail and why. An evaluation that could
meaningfully compare technologies would be useful to policy-makers, technology
designers, implementers and also for consumers, and both Bangladesh and West Bengal
have created systems of evaluation which are described below.
3.1.1 BETV-SAM Program (Bangladesh)
The Bangladesh Environmental Technology Verification – Support for Arsenic
Mitigation (BETV-SAM) program was collaboration between the Bangladesh and
Canadian governments, funded through the Canadian International Development
Agency. It claims to have developed a process for screening and validating the relative
success of arsenic removal technologies. Certificates of verification were issued if the
following criteria were met (OCETA/ETVCanada/BCSIR, 2009):
1) The technology treats water from each well to under 50ppb of arsenic;
2) The technology does not treat the water by adding any chemical at a
concentration exceeding governmental regulation;
3) The volume of arsenic safe water produced by the technology is at least 70% of
that claimed by the proponent;

41
The system claims that technologies get bonus points for being lightweight, being easy
to use and for being inexpensive however the reports fail to explain the details of how
the point system works and how each technology ranked within that point system. The
criteria BETV-SAM uses to determine whether a technology should be available to use
in the field is based purely on technical, geochemical and performance data. No
environmental or sociocultural aspects of the technology are considered and very few
economic factors are included. Sociocultural norms strongly influence the behaviours of
people in this region (Mosler et al., 2010) and thus need to be considered when framing
a technology from a sustainability view point.
3.1.2 Arsenic Task Force (West Bengal)
The report written by the Arsenic Task Force claims to identify available and
appropriate technologies, discusses operational and maintenance issues, as well as
identifying concerns that surround the monitoring and evaluation of different
technologies (Government of India, Planning Commission, 2007). However this was not
done in a systematic way with clear criteria. The report briefly lists and summarises the
arsenic removal mechanism used by each technology and presents a few comments on it
(maintenance or set-up or arsenic removal capacity). The report is really a summary or
review paper, and cannot be considered a systematic evaluation.
3.1.3 Other Assessment Tools
Various other assessment tools are available, like Life Cycle Assessment, Ecological
Foot-printing and various Impact and Risk assessments. Ness et al. (2007) summarise
and categorise these and many more assessment tools by areas of applicability. These
tools have very specific goals, none of which include a triple-bottom-line approach to
product-scale assessment. The Global Reporting Initiative (GRI) is a network-based
organisation that creates sustainability reporting guidelines for companies and

42
institutions. Its framework is a standardised approach which determines principles and
performance indicators that can be used to measure and report economic, environmental
and social aspects of a specific industry, sector or organisation (GRI Portal, 2002). The
European Environment Agency has adopted the use of a framework which distinguishes
driving forces, pressures, states, impacts and responses (DPSIR) in its environmental
reports. According to this framework, there is a chain that links these elements which
can be used to describe the relationships between the origins and consequences of
environmental problems (Kristensen, 2004). Neither the GRI reporting guidelines nor
the DPSIR are appropriate for the problem outlined in this research. The assessment of
an arsenic mitigation option requires a method that includes consideration of the degree
to which it is designed to facilitate continued-use in a specific community.
3.2 Process Analysis Method (PAM)
The Process Analysis Method (Chee Tahir and Darton, 2010) is a way of analysing a
system to generate a set of indicators which reflects the degree to which the system is
sustainable. The Process Analysis Method (PAM) bears some resemblance to the
DPSIR approach in linking cause to effect, but is simpler in not requiring a model of
this linkage, which PAM achieves by focussing only on identified issues. The PAM is
suitable for assessment of arsenic mitigation options because it describes how to build
up an indicator set for a particular system using a transparent methodology with
stakeholder involvement. Additionally, there is a strong connection between the PAM
used on a product-scale and technology design theory. It has been applied to create a set
of metrics which will describe the sustainability of each technology outlined in Chapter
2.

43
Figure 3.1 Arsenic mitigation as a system of processes (Etmannski and Darton, 2013).
The PAM is rooted in engineering systems theory. The system being considered
(in this case, a technology application) is carefully surveyed and described as a set of
processes (Figure 3.1); each process causes impacts which may be beneficial or
detrimental in terms of sustainability; these impacts give rise to issues which are
important for one or more stakeholders (impact receivers). The PAM creates indicators
characterising issues, within the economic, environmental and sociocultural capital
The technology is designed
Materials are extracted and
processed
Parts are manufactured
The technology is assembled
The technology is purchased
The technology is operated
The technology is maintained
Design and Manufacture
Installation and Operation
The technology is decommissioned
Materials go to waste Materials are recycled, reused or
recovered
End of Life
The technology is installed
Recurring costs paid
Operational waste created and
disposed of

44
domains. Overall then, the set of indicators describes the degree to which the system is
sustainable. Previously PAM has been used to select indicators to quantify the
sustainability performance of business operations related to the palm oil industry (Chee
Tahir and Darton, 2010) and of the UK transport system (Smith et al., 2013). Other
projects in progress relate to the sustainability of large river basin management, and
climate interventions (geoengineering). These are analyses of large complex systems,
however PAM can be used in product assessment, as the framework is simple enough to
allow for this flexibility, while still maintaining all aspects of its holistic approach.
3.2.1 Design Theory and PAM
Due to the emphasis of PAM on stakeholders (users), and it being triple-bottom-line and
holistic analysis, it is easy to see how designers could use the PAM framework as a
guide when engineering a sustainable product, or conversely, how well the PAM fits
into the already pre-existing design theory literature making it a suitable choice in
methodology for a sustainability assessment. The literature states that designing eco-
friendly technology does not automatically lead to sustainable user behaviour (Derijcke
and Uitzinger, 2006), especially if the sociocultural context of the user has not been
considered. Several authors have discussed how product design can positively influence
users. For instance, Jelsma and Knot (2002) applied the idea of ‘scripting’ to product
design, by which they mean to design the product so as to guide the behaviour of the
user to comply with values and intentions defined by the designer. According to this
idea, features that promote sustainability should be built into the design to promote a
change in behaviour. Thus the design of the product takes account of ways in which
people use it, in order to reach a more sustainable result (Rodríguez and Boks, 2005).
Smit (et al., 2002) describe ‘user-centred eco-design’, which is presented as a possible
solution for reduction of environmental impact of products. This design method
recognises that issues of behaviour, acceptance and desirability are rarely addressed in

45
traditional eco-design. ‘User-centred’ design puts the user at the heart of the entire
design process. Instead of focusing on technological possibilities and quality
measurements in terms of components, it takes solutions that fit the user as a starting
point and measures product quality from a user point of view (Vredenburg et al., 2002),
taking into account needs, wishes, characteristics and abilities of the projected user
group. The aim of adopting a user-centred design approach is to improve the quality of
the interaction between the user and the product so as to induce sustainable behaviour.
From the literature it is clear that there are several approaches possible to encourage
more sustainable behaviour through appropriate product design. Such an approach to
design requires a thorough understanding of human-product interaction. There is value
in approaches that are considered to be user-focused, eco-friendly and that include the
process of scripting or user-based design modifications where applicable.
PAM was chosen as a methodology for selecting sustainability indicators
because it includes these qualities in its framework. For example, PAM considers the
perspectives of stakeholders, particularly with regard to identifying issues. In this case,
the user of the arsenic mitigation technology has been identified as the primary
stakeholder (user-centred). Issues which arise from the actions associated with using a
particular technology are recognized and then categorized within the different capital
domains. Product designers can then look to these issues and the set of indicators when
considering scripting or user-based modification and design. PAM was the best choice
for methodology because of the direct connection of the results with product design
theory and therefore will produce an assessment that has utility for policy-makers,
product-designers and customers.

46
3.3 The Six Steps of PAM
The steps in the process analysis method are explained in detail in this section and
illustrated in Figure 3.2.
Figure 3.2 The PAM flow chart (Modified from Chee Tahir and Darton, 2010).
5. Framework
1. Overview / Background
2. Define Sustainability
3. System Boundary
4. Stakeholders
6. Verification
Impact
Impact Receivers
/Stakeholders Issues
Indicators
Metrics
Process
Econ Enviro Socio Causes
Changing
Capital Domains
Creates
Affecting
Described by
Measured by

47
3.3.1 PAM Step 1: Overview of Background
The region of interest is the arsenic affected area in West Bengal, India, largely adjacent
to the Ganges River and its tributaries. In total, 27 villages were visited, all located in
four highly affected districts (Figure 3.3). Villages were chosen based on the presence
of arsenic in the geographic area, mitigation options available in the locale, and the
physical accessibility of a village for the survey team. See Chapters 1 and 2 for more
details on the background of the region, arsenic problem and technologies profiled.
Figure 3.3 Map of West Bengal, India showing the locations of the 27 villages surveyed
across four districts in relation to the capital city, Kolkata (Modified from Dalet, 2012).
3.3.2 PAM Step 2: Define Sustainability
The first step in the process of trying to measure sustainability, is defining the term. The
idea of sustainability stems from the concept of sustainable development which was
defined by the Brundtland commission to be: "Development that meets the needs of the
West Bengal
Murshidabad
Nadia
N24 Parganas
S24 Parganas
Kolkata
India
60km
N

48
present without compromising the ability of future generations to meet their own needs.
It contains within it two key concepts:
the concept of 'needs', in particular the essential needs of the world's poor, to
which overriding priority should be given; and
the idea of limitations imposed by the state of technology and social
organization on the environment's ability to meet present and future needs."
(Brundtland, 1987)
Since then, there have been many variations and extensions to this basic definition and
none are universally agreed on. There are many different views on what it is and how it
can be achieved. The Brundtland definition is sometimes criticized as being too vague
to be useful as it is subject to wide interpretation (Mitcham, 1995; Toman, 2009);
however it is the openness of this definition that allows its widespread use in different
contexts and at different scales. The concept of sustainability is commonly used to
imply responsible and proactive decision-making, innovation that minimizes negative
impact, and maintaining balance between social, environmental, and economic capital
over time. Sustainability also encompasses many scales of time and space ranging for
example, from the total carrying capacity of the planet to the sustainability of local
ecosystems, and time scales from ‘intergenerational’ (meaning hundreds of years) to
immediate impacts. It is therefore vital to define physical and temporal boundaries so
that there is a clear understanding of the context and limits of the sustainability analysis.
Consistent with Brundtland, sustainability is defined in this context as arsenic
mitigation technologies that are economically viable, environmentally responsible and
socioculturally appropriate. Economic viability means that for all stakeholder groups,
their ability to use and/or provide the technology is not affected by financial constraints,
and does not diminish with time. Environmental responsibility requires maximum use
of renewable or replaceable resources and materials, avoids production of waste that

49
systematically degrades the environment, and which utilises a waste disposal
methodology that minimises environmental and human exposure to harmful by-
products. Socioculturally appropriate technologies gain the trust and confidence of
users; they provide treated water acceptable in terms of taste, colour and odour; their
operation is acceptably convenient to the user; in all aspects, the technology deployment
recognises the level of awareness of the arsenic problem in the user community; and
they are easy to use with respect to physical effort and skill level.
This work also considers the four Dublin Principles presented at the World
Summit in Rio de Janeiro in 1992 as valuable to the approach of better understanding
the system.
1. Water is finite and a vulnerable resource, essential to sustain life,
development and the environment.
2. Water development and management should be based on a participatory
approach, involving users, planners and policy-makers at all levels.
3. Women play a central part in the provision, management and the
safeguarding of water.
4. Water is a public good and has both a social and economic values in all
its competing uses.
3.3.3 PAM Step 3: Define Boundary
The system boundary is defined by the geographical extent of the arsenic-affected
community utilizing the particular mitigation option. In most cases, such communities
consist of approximately 100 neighbouring houses and/or the area within 1000m
distance from the technology site (in the case of community systems). The temporal
boundary is more difficult to define. The technologies are often not designed to last for
more than ten years, however the arsenic-waste produced is present in the environment
for much longer than this. Therefore the temporal boundary was chosen to be 50 years,

50
which includes the effects of the dispersal of arsenic-waste across several generations
while still being realistic about technological and design limitations.
3.3.4 PAM Step 4: Identify Stakeholders
The primary stakeholder in this research is the technology user. A questionnaire was
developed (Appendix II) to explore the views of this stakeholder on various issues
identified through literature and using the PAM framework. Following an initial (pilot)
trip to India, the questions were adjusted based on observations and preliminary input
from the technology users. A second programme of more extensive field work was
subsequently carried out to collect the technical and sociocultural data needed to input
into the modified framework. In addition to user-feedback, other stakeholder input was
gathered from meetings and informal interviews with various levels of government,
technology designers and field implementers/facilitators. These included the local
Panchayat (village mayor) in every village visited, and the Bengal Chamber of
Commerce and Industry, the State Water Investigation Directorate and the Institute of
Environment Science and Wetland Management, Government of West Bengal
(provincial level), and Department of Groundwater and Geology, Government of India
(national level) who are the policy-makers and are often involved in developing long-
term water-provision strategy for the West Bengal region. Meetings were also held with
NGOs including UNICEF-Kolkata, Save the Environment, Behala Sambit, Aqua
Welfare Society, West Bengal Voluntary Health Association and the Centre for
Groundwater Studies, who are all involved in the implementation of arsenic mitigation
technologies. Discussions were also held with technology designers from IIT-Bombay,
Jadavpur University, Pal Trockner, Harbauer, Presidency University, and CGCRI.
Obtaining feedback and insights from technology designers, implementers and local,
regional and national level policy-makers was important in framing the problem, and in
obtaining technological and economic-related quantitative data. These groups expressed

51
interest in understanding how this research could aid in modification of design,
implementation practices and/or policy-making for arsenic mitigation.
3.3.5 PAM Step 5: Framework
Following the principles outlined in the PAM, the next step is building a framework of
issues and indicators (Figure 3.2). The capital domains utilised in the chosen definition
of sustainability represent a triple-bottom line perspective. Next, identifying the impacts
within the different domains arising from the actions associated with using a particular
technology is required. These actions can be allocated to ‘design and manufacture’,
‘installation and operation’, and ‘end of life’ stages of use. Each action or impact
generator is systematically examined to identify all the decisions taken, or policies
implemented within the system that cause impacts on the three capital domains. If any
impact generators affect the stakeholders, then they become impact receivers. Impact
receivers are identified in order to ascertain the relevance of a particular impact. If no
impact receiver can be identified then the impact does not warrant further attention. It is
the concern of the impact receiver regarding a particular impact that constitutes an
‘issue’. When the issues related to the impacts have been identified, they must be
characterised in a way that quantifies the magnitude of the effect. This requires an
indicator. It is important that the link between the issue and indicator be as direct as
possible. In the final step, metrics are developed for each indicator to measure the
severity of the impact on each capital domain.
For example, the action of disposal of the arsenic-rich waste product created by
a technology during regular usage (impact generator) raises several issues. One issue,
within the environmental domain, is the possibility of creating a point-source
recontamination from disposal of arsenic-contaminated adsorbent. This could result in
an additional route of exposure to the community (impact receiver) for example by
contaminating soil that will be used for growing food. An indicator for this issue is: the

52
amount of material (mass or volume) disposed of overtime and the expected or usual
concentration (ppb) of arsenic contained within it. The metrics are the actual values
determined for each indicator. It is the creation of the whole set of metrics that is useful,
since it is the whole set, across all capital domains that quantify the sustainability of the
technology. The result is a set of measurable indicators, that when taken together,
directly quantify the issues.
3.3.6 PAM Step 6: Verification
After the framework is completed, it is necessary to verify the indicators and metrics,
through further review and refinement. This iterative stage involved fieldwork,
interviews and consultation with stakeholders to ensure that the analysis was as
complete as possible – so that no important issues were missed out. The verification
process continued until a satisfactory set of indicators and metrics were available for
testing.
3.3.7 PAM Summary
The Process Analysis Method was chosen as a methodology for selecting sustainability
indicators because it considers the perspectives of stakeholders, particularly with regard
to identifying issues. In this case, the user of the arsenic mitigation technology is
identified as the primary stakeholder (user-centred). Issues which arise from the actions
(known as impact generators) associated with using a particular technology are
recognized and characterized with indicators. Product designers can then look to these
issues when considering scripting or user-oriented modification of their technology.
3.4 Indicators Generated through PAM
Tables 3.1, 3.2 and 3.3 show the framework created using the PAM and includes the
verified indicators for all three capital domains used in this sustainability analysis. The
metrics used for economic, environmental and sociocultural capital are a set of codes.

53
Coding refers to an analytical process in which data, in both quantitative form and
qualitative (such as interview transcripts or questionnaire results) are categorised to
facilitate analysis. Coding categories were devised according to the types of response
gained for each metric. More details and the results for Sociocultural, Environmental
and Economic capital are found in Chapters 6, 7 and 8.

54
Table 3.1Impacts and indicators generated for the sociocultural domain.
Process Impact Issue EIR Indicator Metric
Duration of installation
Conducting maintanence
Hours treatment available
Flow rate of technology
Accessibility of replaceable parts
Purchasing made easy
Smell
Installation
and Operation
Installation
and Operation
Design and
Manufacture
Installation
and Operation
Design and
Manufacture
Awareness
Compatibility
Coded
Factors that
encourage or
discourage long-
term use of the
technology
Degree of villagers' awareness of As
in waste
Colour
Distance to As-free water
Store of Value: Sociocultural
Trust
Confidence
Convenience
Acceptability
of Treated
Water
External Appearance of Technology
Diarrhea Experienced after Ingestion
of Treated Water
Transparency of Finances / Costs
Proof of Regular [As] Testing /
Certifications
Presence of Appropriate Signage
Behaviour of Local Leaders
Behaviour of Operator/ Supplier
Accountability of Operator/ Supplier
Durability
Affected by power outages
Taste
Method of Engagement
User/
Community/
Future
Community
Degree of Technical expertise
required to install technology
Degree of Technical expertise
required to operate technology
Degree of Technical expertise
required to conduct maintenance
Level of physical exertion required to
install technology
Level of physical exertion required to
operate technology
Level of physical exertion required to
conduct maintenance
Households' understanding of [As] in
untreated water
Households' understanding of
physical effects of As on health
Presence of Community arsenic
awareness campaign
Presence of arsenic awareness
programme in local schools

55
Table 3.2 Impacts and indicators generated for the environmental domain.
Table 3.3 Impacts and indicators generated for the economic domain.
Process Impact Issue EIR Indicator Metric
End of Life
Coded
Installation
and Operation
Store of Value: Environmental
Design and
Manufacture
Number of disposal locations -
Sludge
Waste creation
Ecotoxicity
Degree of risk
of further human
exposure either
directly or
indirectly
and/or further
point source
environmental
(water, air and
land)
contamination
Use of land for
waste disposal
Resource
depletion
Use of non-
renewable, non-
recyclable and
non-reusable
materials leave
fewer resources
available to
meet future
needs
User/
Community/
Future
Community
Materials and energy used in
construction
Renewable energy used
Number of disposal locations - Back
wash
Location of As-rich waste disposal -
Sludge
Aspect of regeneration, recycling,
reuse
Method of Disposal -
Recontamination - Sludge
Location of waste disposal -
BackwashMethod of Disposal -
Recontamination - Backwash
Process Impact Issue EIR Indicator Metric
Cost of purchase and installation
Provision of future capital for
replacemnt purchase
Monthly tariff per household
Cost for power
Laboratory testing costs
Cost of transport / delivery
Amount operator is paid
Provision for users below local
poverty line
End of Life
User/
Community
Income may not
cover all costs
Design and
Manufacture
CodedInstallation
and Operation
Store of Value: Economic
Affordability
Cost of disposal
Possibly too
expensive for
stakeholders
Cost of replaceable / regenerable
materials

56
4 Methodologies: Fieldwork and Data Analysis
Four months of field work was carried out to collect the data needed to input into the
PAM framework. The methods used for data collection and analysis are described here.
4.1 Surveyors
The qualitative data was gathered by a team of surveyors who conducted household
surveys and informal interviews. Careful consideration was given to facilitating the
participation of all the households approached, and to limit survey bias. More
specifically, the survey team’s gender, ethnicity, language skills, level of expertise in
sociology and survey protocols, and practical experience were all considered. A team of
ten female social anthropologists was formed to carry out the surveys. Each surveyor
had received her master’s degree from the region’s most prestigious university, The
University of Calcutta, and was originally from the local area. The team was
multilingual, each woman being fluent in Hindi, Bangla and English. Additionally, they
each had previous practical experience in surveying and interviewing and attended a
Training and Safety seminar facilitated by the Oxford team. The training seminar
emphasized the need for surveyors to ask the set of questions exactly as written, in the
correct order, in a neutral tone and not to suggest answers to respondents (known as
leading). Once in a village, the surveyors worked in pairs, where one asked all the
questions (in Bangla) and the other wrote down all the answers (in English). This was
done for reasons of efficiency and safety. It also provided accountability by ensuring the
questions were asked correctly and answers translated directly. The teams of two were
mixed up daily to allow each surveyor equal opportunity to work with everyone in the
group and to limit any inherent bias that might form within any one pairing. A few
surveys (<10) were conducted in English entirely, at the request of the interviewee. The

57
field supervisor checked the conduct of randomly selected interviews throughout each
field-day to ensure that interview and sampling protocols were being followed.
4.2 Sampling of Population
The villages varied in both geographic and population size. Occasionally, villages
would run alongside one another unmarked making it difficult to determine by simple
observation where one village (para) begins and one ends. In small villages, the entire
village was used as the sample, as they typically contained less than 100 households. In
the cases of larger more amalgamated villages, the sample area was determined to be
the 100 households nearest by proximity to the mitigation option in all directions. Out
of each population (around 100 households in every case), 33-35 households were
chosen to take part in the survey. This was done by randomly choosing one house in a
cluster of three. To obtain a representative sample of differing economic and social
groups, random sampling was strictly adhered to (United Nations Statistics Division,
2005). A total of 948 households were approached. The response rate was 98.4% with
15 households declining to answer the questionnaire. This resulted in 933 household
surveys completed across the 27 villages, 1-4 villages per technology.
4.3 The Survey
The survey was created in English, translated into Bangla and back-translated into
English to ensure there were no mistakes in the translation. Surveys can contain two
types of questions: closed-format questions, where the respondents must choose from a
choice of given answers and open-format questions, where the respondents are free to
answer in their own words and style. The survey contained 120 questions and took on
average 20 minutes to complete. The first 60 included both open and closed-format
questions about current and past use of the arsenic mitigation option available in the
village. These questions covered issues that fell into three stages of use, ‘design and

58
implementation’, ‘operation and maintenance’, and ‘waste and disposal’. The middle
section of the survey contained 50 closed-format questions gauging the level of
importance of all the various issues identified in the framework (for example, How
important is it to you that..?). A five point Likert Scale (Bryman, 2012) was used to
measure intensity of feelings about the issue in question. The final section consisted of
ten open-format questions that explored the user’s range of willingness (walking
distance, monthly tariff, time spent queuing). Appendix II contains the English version
and the data dvd for the Bangla version.
4.4 Informal Interviews
While questionnaire surveys are relatively easy to organize and prevent the personality
of the interviewer affecting the results, they do have certain limitations. They are not
suitable for questions that require probing to obtain more complex information, as they
should only contain simple, one-stage questions (i.e. questions whose answers do not
lead on to further specific questions). For this reason, surveyors were encouraged to
engage in an unstructured interview after the face-to-face questionnaire was completed.
Unstructured interviews follow a flexible format, allowing the interview to progress
naturally as a comfortable conversation in order to get insights into the attitudes of the
interviewee. These conversations and viewpoints were documented at the bottom of
each survey (or back page).
4.5 Approach and Management of the Interview/Survey
When a house was approached by a survey team, whoever answered the door
(regardless of gender) was asked to represent their household and be a respondent. In
some cases the person who answered the door would suggest a different family member
as a participant, but this was at the household’s discretion. The survey team requested
assurance that the participant was a resident of the household and over the age of 18.

59
There was only one respondent per questionnaire. After the participant was identified
and informed consent was given (Section 4.6; Appendix III), the survey team often
suggested moving to a private area to conduct the survey. This was done to minimise
noise, and any possible distraction or external influence. Despite taking this precaution,
if a survey team felt that an answer given by the participant was influenced by a
particular situation or individual, the survey team indicated this on the survey by
underlining the question, which was later omitted from the analysis to ensure unbiased
responses.
4.6 Ethics
The study protocol was approved by the University of Oxford’s Social Sciences &
Humanities Inter-Divisional Research Ethics Committee on July 9, 2012 (Appendix III).
Informed consent was obtained verbally from all study respondents and by the subjects
in all of the photos included in this study.
4.7 Technical Data
Participant observation is a method of recording conditions, events and activities
through looking and doing rather than asking. Observation can be used to record both
quantitative and qualitative data. Technical information about each system was collected
at each village through participant observation and direct measurement. This included
flow rate, average time spent queuing, average distance walked by the user, system size
and appearance, construction materials, existence of signage, and waste disposal
methods. This information supplemented technical data available from literature
sources. Any measurement involving time was taken using an iPhone stopwatch.
Distance walked was determined by physically walking the distance (and back) and
counting steps. Large steps were taken and estimated to equal 1m. System size was
taken using a tape measure. Photographic evidence was taken for every mitigation
60
option, including photos of all existing signage, which when written in Bangla was
translated by the surveyors.
4.8 Arsenic Testing
4.8.1 Field Test Kit
Onsite arsenic testing of raw and treated water was performed, using Wagtech’s Visual
Colour Detection Kit (WVCD) which has a product code of WAG-WE10600
(Sankararamakrishnan, 2008; UNICEF, 2010). This method uses a reaction of hydride
generation similar to that described in methods 3114B (Eaton et al., 1998). The WVCD
kit requires the addition of zinc dust and sulfamic acid (HOSO2NH2) to the water
sample. This reaction converts the inorganic arsenic present in the solution to arsine gas.
The arsine gas reacts with a mercuric bromide test strip to form a yellow to brown-
coloured compound (AsH2HgBr). The amount of arsine gas (AsH3) generated increases
with the concentration of arsenic in the sample. The mercuric bromide strip intensifies
in colour with the increase of arsine gas, thereby quantifying the arsenic concentration
in the sample. The colour of the reacted test strips are then compared against a specific
incremental chart provided with the kit. The increments (in ppb) coded on the chart
were (from lightest to darkest) 10, 20-40, 50, 60-80, 100, 100-200, 200-300, 300-400,
400-500. Given that the colour coded indicator card only had colour for 10ppb and then
a range for 20-40ppb (missing 11-19ppb), when the colour fell between those shades,
>10ppb was recorded. Any result that was lighter in shade than the colour coded as ‘10’
was recorded as ‘<10’. If no colour appeared, a value of zero was recorded.
In a typical analysis in the field, a glass flask was filled with 50mL of sample
solution, placed on a firm surface, and a sachet of sulfamic acid powder was poured into
the solution. Next, a sodium borohydride tablet was dropped into the flask and a bung
device loaded with filter slides was immediately pushed firmly into the flask mouth.

61
According to the printed protocol, the reaction reaches completion after 20 minutes, at
which point the appropriate filter is removed from the bung device, and its color
matched to the color chart provided (Safarzadeh-Amiria et al., 2011). Van Geen et al.
(2005) compared results obtained with the Hach EZ kit with those based on laboratory
measurements for the analysis of the water from 799 Bangladeshi tube wells. They
found that provided the reaction time was doubled to 40 minutes, the field kit results
were accurate for 88% of the samples. The Hach EZ kit utilizes the same chemical
reaction to obtain results as the Wagtech model except that hydrochloric acid is used
instead of sulfamic acid. Therefore, double the recommended amount of time was
allowed for each arsenic test to proceed to completion (40 minutes), to ensure more
accurate results. The practice of doubling the wait-time to ensure completion when
using these field test kits has been recommended by many researchers (Arora et al.,
2009; Kinniburgh and Kosmus, 2002).
4.8.2 Laboratory Analysis
Ten samples were taken from nine different field locations as duplicates to be double-
checked through laboratory analysis. Each sample was taken from the same source at
the same time as the sample used in the field test. The water sample was poured into a
50ml plastic sample bottle (after being rinsed 3 times by sample water) and 2-3 drops of
hydrochloric acid (HCl) was added immediately. The sample was sealed with a lid and
stored in a dark space until they were all sent to Professor Dipankar Chakraborti’s
laboratory in the School of Environmental Studies in Jadavpur University. The sample
bottles, lids and HCl were provided by the laboratory.
The method used for arsenic analysis is a flow-injection hydride-generation,
atomic absorption spectrometry system for the determination of arsenic in parts per
billion levels in water samples (Samanta et al., 1999). Each sample was injected into a
carrier stream of 5 M HCl by means of a six-port sample-injection valve fitted with a
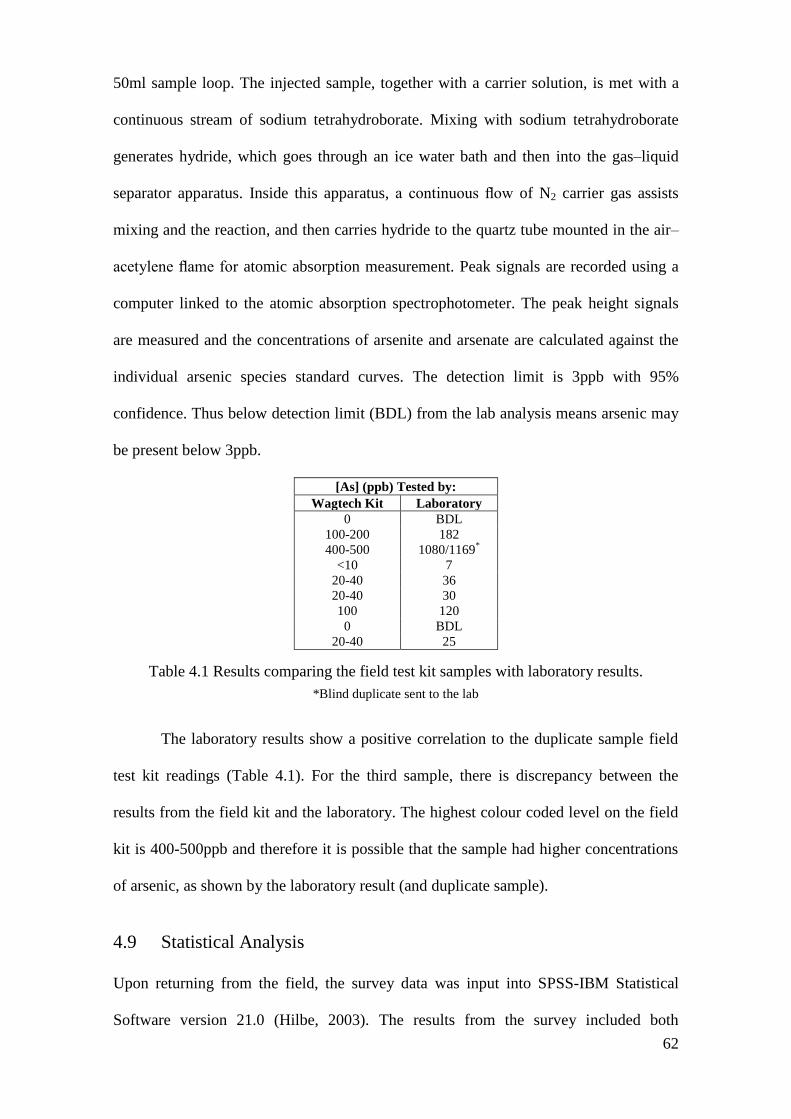
62
50ml sample loop. The injected sample, together with a carrier solution, is met with a
continuous stream of sodium tetrahydroborate. Mixing with sodium tetrahydroborate
generates hydride, which goes through an ice water bath and then into the gas–liquid
separator apparatus. Inside this apparatus, a continuous flow of N2 carrier gas assists
mixing and the reaction, and then carries hydride to the quartz tube mounted in the air–
acetylene flame for atomic absorption measurement. Peak signals are recorded using a
computer linked to the atomic absorption spectrophotometer. The peak height signals
are measured and the concentrations of arsenite and arsenate are calculated against the
individual arsenic species standard curves. The detection limit is 3ppb with 95%
confidence. Thus below detection limit (BDL) from the lab analysis means arsenic may
be present below 3ppb.
[As] (ppb) Tested by:
Wagtech Kit Laboratory
0 BDL
100-200 182
400-500 1080/1169*
<10 7
20-40 36
20-40 30
100 120
0 BDL
20-40 25
Table 4.1 Results comparing the field test kit samples with laboratory results.
*Blind duplicate sent to the lab
The laboratory results show a positive correlation to the duplicate sample field
test kit readings (Table 4.1). For the third sample, there is discrepancy between the
results from the field kit and the laboratory. The highest colour coded level on the field
kit is 400-500ppb and therefore it is possible that the sample had higher concentrations
of arsenic, as shown by the laboratory result (and duplicate sample).
4.9 Statistical Analysis
Upon returning from the field, the survey data was input into SPSS-IBM Statistical
Software version 21.0 (Hilbe, 2003). The results from the survey included both

63
‘continuous’ and ‘categorical’ variables. Continuous results come in the form of a
number (household income, respondent’s age, for example). All continuous results were
input directly into the software. All information which resulted in categorical variables
was coded and then input into SPSS. Coding involves converting all answers into a
numerical value. The three types of categorical variable include: nominal, which are
answers without an intrinsic order (like blue, red or green as options); dichotomous,
which only has two options available (like male or female); and ordinal, which contains
categories of choice that can be ordered (like strongly disagree, disagree, neutral, agree,
strongly agree).
The information for each household was input separately and then categorised
by village and technology targeted. The analysis for continuous and ordinal variables
included mean, median, mode, standard deviation, variance, range, minimum values,
maximum values, missing values, and 95% confidence intervals. Statistical significance
is the probability that an effect is not likely to be due to chance alone. To determine
statistical significance between continuous and nominal variables, a chi square goodness
of fit test was used. When comparing the correlation between two continuous variables,
a Pearson Correlation was conducted when both variables were normally distributed and
a Spearman Correlation was used when one or both variables were not normally
distributed or when comparing continuous and ordinal variables. These tests result in a
P-value, or calculated probability, which always falls between one and zero. The P-
value is the estimated probability of rejecting the null hypothesis of a study question so
when that hypothesis is true, the closer the P-value is to zero and thus the more
significant the result. Conventionally, 5% (less than 1 in 20 chance of being wrong), 1%
and 0.1% (P < 0.05, 0.01 and 0.001) levels have been used to indicate statistical
significance. An Anova Test was used to compare the variance between groups of
continuous variables (like to compare the means of three or more variables). Logistic

64
Regression was utilised when the dependent variable was nominal and the independent
variable continuous. No dichotomous variables were identified and no transformations
were needed.
4.10 Discussion
4.10.1 Gender of Surveyors
Gender is one of the most easily identifiable interviewer characteristics, and several
gender-effects studies have concluded that female interviewers are more likely than
males to result in respondents answering more frankly and honestly (Benney et al.,
1956; Axinn, 1991; Blanc and Croft, 1992; Becker et al., 1995; Bignami-van et al.,
2003; Weinreb, 2006). Benney et al. (1956) analysed combinations of gender and age of
interviewer and respondent in sensitive areas of communication (sex habits). It was
concluded that male interviewers obtain fewer responses than female interviewers.
Similarly, data from a study in Nepal featuring the random assignment of interviewers
to households was used to test several hypotheses regarding the influence of interviewer
gender (for both male and female interviewees) (Axinn, 1991). Economic activity and
fertility within the household were the topics of the questions in the survey. The results
showed that interviewer gender does affect responses, with male interviewers generally
under-reporting. Under-reporting means that respondents were unwilling to answer as
many questions in a survey, compared to the participants interviewed by women. It also
refers to the answers specifically. For example, the respondents interviewed by men
provided significantly more negative responses to questions where positive answers
might be viewed as less socially acceptable, and reported fewer numerical values in
reference to household economics. It was concluded that potentially sensitive questions
may be less threatening when asked by a woman in the Nepali cultural context and thus
the use of female interviewers may help to reduce error in applications of surveys in

65
other less-developed settings similar to Nepal. It is for this reason that the entire survey
team in our research was composed of females.
4.10.2 Interviewer Bias
Religious beliefs of individuals were not considered during the hiring process of the
survey team. All ten women hired happened to be Hindu. The villages surveyed were
often homogenous in religion, with a majority of population being either Muslim or
Hindu. No previous knowledge of religious practice was available before entering any
specific village although it was identified through observation quickly upon arrival, as
Muslim women cover their heads in public with a scarf or sari. When women in public
did not have the heads covered, it was assumed that the village was Hindu which would
be confirmed once teams entered homes and saw religion-specific icons. It is possible
that people in the village could be any religion as it was not a question included on the
survey. One village in particular was identified as following a rare tribal religion. The
most recent Indian census shows that 80.5% of the population is Hindu, 13.4% Muslim,
and 2.3% Christian (Government of India, 2011). In this research, 63% of the villages
visited during the fieldwork were exclusively Hindu, and 30% were exclusively Muslim
(Table 4.2).
Before conducting fieldwork, no consideration was given to the possibility that
religious beliefs might influence survey results, as it is not a common theme in literature
or standard practice. However during the fieldwork period, it became apparent that
prejudices existed in the survey team. It is likely that the religious backgrounds of both
interviewers and respondents will have been evident to both parties. The surveyors were
told to be as neutral as possible in their approach towards villagers, regardless of
religion and a neutral attitude was always observed in the supervisor. No literature could
be found on survey error resulting from religious differences. Given that the topic of
research is arsenic mitigation and does not relate to religion in any way, it seems

66
probable that the survey team was professional and unbiased in administrating the
questionnaires and that the respondents gave answers unaffected by any religious
differences. The very high response rate (98.4%) does not suggest reluctance on the part
of the households to engage with the survey team. Precautions used to avoid interviewer
bias included the significant reliance on scripted questions in the survey, monitoring of
the interviews by the supervisor and regular switching of the surveyor pairs.
Technology Village Code Religion
Tipot 1.1 Hindu
1.2 Muslim
IITB
2.1 Hindu
2.2 Muslim
2.3 "Tribal"
BESU
3.1 Hindu
3.2 Hindu
3.3 Hindu
PalT 4.1 Hindu
4.2 Hindu
Harbr 5.1 Hindu
5.2 Muslim
AIIH&PH
6.1 Hindu
6.2 Muslim
6.3 Muslim
CGCRI
7.1 Hindu
7.2 Mixed
7.3 Muslim
Dug
8.1 Hindu
8.2 Hindu
8.3 Hindu
SONO
45-25 9.1 Hindu
Nirmal
10.1 Hindu
10.2 Muslim
10.3 Muslim
DRDO 11.1 Hindu
11.2 Hindu
Table 4.2 Religious affiliation (by observation) of villages surveyed.

67
5 Survey Results
This chapter presents an overview of the survey results and attitudes to technology
provision, dealing with the major issues of population demographics, technology use,
arsenic exposure and issue ranking.
The respondents comprised 629 women and 304 men (67.4% and 32.6%). The
average number of people per household is 4.8, and average number of children
(younger than 18 years old) per household is 1.1. These family-size values are the same
as another survey conducted in West Bengal in 2012 which found that the average
family had five members (Das, 2013). The median distance households travel to obtain
drinking water is 200m. In 71.8% of responding households, an adult woman is
responsible for water collection and in 24.8% of households, an adult male normally
collects it. In the remaining 3.4% of households, children collect the drinking water.
Collection occurs on average 1.6 times per day with a median of one occurrence per
day. 59.7% of households learned about the mitigation option through word-of-mouth
while 23.4% were informed by a door-to-door announcement from a representative
involved with the technology implementation or operation. 11.2% of households
discovered the mitigation option by observation and self-initiative while the remaining
households heard about the technologies during a community meeting (2.9%), or
through television advertising (2.8%).
5.1 Household Income
The villages which use the mitigation options designed by BESU and PalT/Harbr are
shown in the survey (Figure 5.1) to have household incomes that are overwhelmingly
statistically significantly higher than the other villages (p-value of 1.97E-9; Section
4.8). This result could indicate that those technologies have been targeted at richer

68
communities, or that only the higher income communities could afford those more
expensive technologies. The relationship between success of a mitigation project and
economic factors is explored further in Chapter 8.
Figure 5.1 Mean, median and mode household incomes across villages that use each
mitigation option (n=933).
In every village, the mean household income is higher than the median and
mode which indicates that there are a few households with very high income. For this
reason, the median is a more meaningful measure of village income. The median
household income for the 933 households in this study is 4500 Rupees/month ($75)
which is $2.50/day. Das (2013) reported that 56.5% of 200 rural respondents have an
income of less than 2000 Rupees/month and 41% have an income between 2000-6000
Rupees/month. Das surveyed fewer households and only within the district of
Murshidabad, whereas this study included Murshidabad and three other regional
districts: N24 Parganas, S24 Parganas and Nadia. Other studies from West Bengal have
been criticised for under-reporting incomes (Bakshi, 2008). In these previous studies, it
0.0
1.0
2.0
3.0
4.0
5.0
6.0
7.0
US
Do
llar
per
Day
Household Income Mean
Median
Mode
10,80
9,000
7,200
5,400
3,600
1,800
12,600
0
Ru
pee
s p
er M
on
th

69
is possible that results were biased due to the influence of interviewer gender (Section
4.9).
5.2 Household Education
The level of education within a household is one of the primary determinants of its
income and level of poverty (Naschold, 2012). Individuals with higher level of
education are more likely to obtain full-time jobs than others, resulting in higher
household incomes (Figure 5.1). Villages with the highest median household incomes
thus also have more households containing high school and college graduates (Figure
5.2). Among the 13% of households in the total sample that do not have a single literate
adult, the median income is only 2,500 Rupees/month. In contrast, among the 16% of
households with at least one college graduate, the median income is 10,000
Rupees/month —four times the median income of illiterate households.
Figure 5.2 Average distribution of different education levels across villages that use the
mitigation options.
0%
10%
20%
30%
40%
50%
60%
70%
80%
90%
100%
Highest Level of Education in a Household
College/Uni
High
Middle
Primary
None

70
5.3 Technology Use
Although the majority of households in every village are unsure if their own household
shallow tube well contains arsenic, some households choose not to drink water straight
from their household shallow tube wells, and have found an alternative. This behaviour
is in line with the Health Belief Model (Janz and Becker, 1984) which attempts to
explain why people will take action to prevent a potential health outcome. This model
assumes that if individuals view themselves as susceptible to a health outcome, and
believe that the consequences of having the health outcome are severe, and believe that
there is a course of action available to them to reduce susceptibility or severity of the
health outcome, and believe the benefits of this course of action outweigh the barriers,
they are likely to take this action to reduce their health risk (Glanz et al., 2008).
Figures 5.3 and 5.4 when viewed together give an overview of how the villagers
source their water. All the community-scale arsenic-removal systems are connected to
Public Shallow Tube Wells, so the per cent ‘use’ highlighted in blue in both Figures 5.3
and 5.4 are similar for the first six technologies. There are often shallow tube wells that
are considered to be on public land which are also used, which accounts for small
differences between the two charts. The areas shaded red in Figure 5.3 indicate where
no filter is used but a different arsenic-free alternative is used which is detailed in
Figure 5.4. In the communities where they are used, IITB, BESU, PalT/Harbr and Dug
Wells are used by over 50% of the villagers. Both villages surveyed in which the Tipot
is located have a Public Deep Tube Well that most people use instead of the Tipot
technology even though the Tipot is located more centrally and the villagers have to
walk significantly further to use the deep tube well water. When tested, these deep tube
wells proved to be arsenic-free. The villages in which the AIIH&PH, CGCRI, and
Nirmal technologies are available, are of concern because many households (38-82%)

71
continue to drink untreated water from their (likely contaminated) Household Shallow
Tube Wells.
Figure 5.3 Average distributions of mitigation options used in the villages surveyed
where particular options are targeted.
Figure 5.4 Average distributions of household water source.
0%
10%
20%
30%
40%
50%
60%
70%
80%
90%
100%
Which arsenic-removal filter do you use?
No filter used
Other
community filter
used
Other household
filter used
Targeted
mitigation
option used
0%
10%
20%
30%
40%
50%
60%
70%
80%
90%
100%Where do you get your drinking water from?
Bottled
Municipal treated
stand-pipe/ 'time'
Public deep tube
well
Dug well
Household deep
tubewell
Public shallow
tube well
Household
shallow tubewell

72
Another conclusion drawn from Figure 5.3 is that the majority of villagers will
all use the same filter or no filter at all. This is likely because the systems in place have
been implemented through a government or NGO programme with significant
subsidies. The use of another technology would have to be at the household’s expense.
Given this finding, this thesis will refer to villages by the technology utilised by most of
people (for example, a ‘Tipot village’, or ‘BESU community’).
The two villages that had access to the DRDO household model mostly rely on a
Public Deep Tube Well (PDTW) which was sunk by the Government of West Bengal.
However the government abandoned this large-scale project before completion, without
giving the villagers a reason. The local people have since connected power to the
system to draw water from this well, thinking that it must be safer than their household
shallow tube wells. Field tests showed the arsenic concentration in this PDTW to be
50ppb, which was the same concentration as some of the local household shallow tube
wells. This case demonstrates that it cannot be assumed that a PDTW is an arsenic-safe
option just because the majority of the people use it. Only by testing can one be sure
that a well is safe. Relying heavily on municipal-treated water is also not ideal for
villagers. It is nicknamed ‘time’ water because it flows irregularly throughout the day,
sometimes for several hours at a time, and sometimes for only one. This becomes a
large burden on households who rush to queue up to obtain their daily drinking and
cooking water when ‘time water’ is turned on by a distance municipal government.
5.4 Exposure Profile
Figure 5.4 shows that 26% (N = 933) of households continue to use household shallow
tube wells as their primary source of drinking water despite having access to arsenic-
safe drinking-water options. Johnston et al. reported 62% (N = 1268) of households
surveyed in Bangladesh to not use an arsenic-free water source despite having access to
one (Johnston et al., 2013). Clearly, if more people would use the arsenic-free options

73
which are accessible to them, the exposure would be reduced. Households using an
arsenic mitigation option, buying bottled water, using a municipal water source or a
PDTW thus constitute 74% of the total sample. These sources are widely believed to be
either arsenic-free or containing arsenic below the national limit of 50ppb (Figure 5.5).
They are thus deemed ‘safe’ by local regulatory bodies. This assumes that all mitigation
options used are functioning correctly. However, results from the arsenic field tests
(Table 5.1) show that only three mitigation options (Tipot, PalT/Harbr, Dug) reduce the
arsenic concentration to less than 10ppb which is the international standard. By simply
changing the limit, the results showing the percent of households drinking ‘safe’ water
changes drastically (Figure 5.6). This is an example of how estimates of ‘affected
population’ (Section 1.2) can vary so widely. Using the exposure results from this
sample and extrapolating to the population of the Bengal Basin, which is estimated at
230 million (IIBB, 2010), results in 59.8 million people affected by the problem using
50ppb (26%) and 167.9 million using 10ppb (73%). Analysis in Table 5.1 show that in
many of the villages, drinking water from shallow tube wells without using a properly
operated filter exposes the consumer to a significant risk of arsenic poisoning.
Technology
[As] in
Raw
Water (ppb)
[As] in
Treated
Water (ppb)
TiPOT n/a 0
IITB 100 >10
BESU 200-
300 >10
PalT 20-40 0
Harbr 10 0
AIIH&PH 60-80 >10
CGCRI 100 >10
Dug n/a 0
Sono 50 >10
Nirmal 20-40 >10
DRDO 50 >10
Table 5.1 Analyses of raw and treated water for all mitigation options using the
Wagtech field test kit (Section 4.7.1).

74
Figure 5.5 Distribution of households in the entire sample drinking ‘safe’ water, based
on the local limit of arsenic in drinking water at 50ppb. ‘Arsenic free’ includes all the
users of the mitigation technologies, ‘time water’, bottled water, and deep tube wells
(n=933).
Figure 5.6 Distribution of households in the entire sample drinking ‘safe’ water, based
on the international drinking water limit of 10ppb. In this case, arsenic-free only
includes the mitigation options that tested to below 10ppb, ‘time water’, bottled water,
and tested deep tube wells (n=933).
5.5 Importance of Issues
The issues identified through PAM (Section 3.4) were used to create questions included
on the questionnaire, allowing villagers to choose each issue’s degree of importance.
The mean response to each question with a 95% confidence interval (from the entire
sample; n=933) is ranked in Figure 5.7. The results of this ranking are used to weight
indicators in Chapters 6, 7 and 8. Below is a description of the issues identified in each
question and their degree of importance.
74%
26%
Percent of households that are drinking
water that is:
Arsenic-free
Arsenic exposure
at ≥ 10ppb 50ppb
27%
73%
Percent of households that are drinking
water that is:
Arsenic-free
Arsenic exposure
at ≥ 10ppb

75
A - Issues that were found to be ‘Very Important’:
Cost (Q72, Q93, Q60); trust (Q86); distance to the filter (or home delivery) (Q77, Q57,
Q57); understanding effects of arsenic on health (Q73).
B - Issues that were found to be ‘Important’:
Participation in decision (Q53); proof of regular testing (Q79, Q63); reliability of
arsenic removal (Q61); environmentally friendly design (Q54); clarity of treated water
(Q76).
C - Of the issues ranking between ‘Important’ and ‘Neutral’, the following were more
important:
Process of engagement (Q51, Q52); operator having been trained (Q69); size of unit
(Q55); rate of filtration (Q58); clarity of treated water (Q100); smell of treated water
(Q66); location of arsenic-rich waste disposal (Q81, Q82).
D - Of the issues ranking between ‘Important’ and ‘Neutral’, the following were less
important:
Duration of installation (Q71); materials of construction (Q56); presence of appropriate
signage (Q89); household scale vs. community level (Q88); transparency of financing
and costing (Q92); operator being paid (Q68); ability to hold operator accountable
(Q70, Q74); need for the user to understand the maintenance procedure (Q67); taste of
treated water (Q65, Q75, Q94, Q99); amount of municipal waste generated (Q80, Q83).
E - Issues that were found be ‘Neutral’:
Use of power vs hand-pump (Q96); need for the user to understand the installation
process (Q59); need for the user to understand the operational details (Q64); trust of
outside groups suggesting a technology (Q102).
Issues that were found be between ‘Neutral’ and ‘Unimportant’:
Use of chemicals or medicine in water treatment (Q91).
No issues were deemed ‘Unimportant’ or ‘Very Unimportant’

76
Section 5 of the questionnaire is listed below (Appendix II). The questions are about
clean water technologies/systems in general. The point is to identify how important or
unimportant certain values and criterion are to the stakeholder. The interviewees
responded using the Likert Scale:
Very Unimportant Unimportant Neutral Important Very Important
1 2 3 4 5
How important is (it to you)…
51 to be consulted before the installation process?
52 to actively participate in the decision-making process?
53 for someone in your household to participate in the decision?
54 if the system is designed in an environmentally friendly way?
55 the system’s size or area?
56 the type of materials used in building the system?
57 the distance the system is from your house?
58 the rate (or speed) that the system produces clean water?
59 to understand the installation process?
60 that clean water is affordable?
61 that the system is reliable?
62* to be given several options when choosing a CWT?
63 that the quality of water is tested regularly?
64 to understand how the system operates?
65 if the cleaned water tastes slightly bad?
66 if the water smells odd?
67 to understand the maintenance procedures?
68 that the person doing the testing/maintenance is paid?
69 that the person doing the testing/maintenance is trained?
70 to have the ability to hold the maintenance person accountable?
71 that the system is installed as quickly as possible
72 that clean water is free?
73 that your household understands the physical effects of Arsenic in water?
74 if the maintenance person does not have a boss or supervisor?
75 if the cleaned water has a strong taste?

77
76 that the water is perfectly clear?
77 that the system is very near your house?
78* if you have to conduct small repairs on the system?
79 to know the arsenic concentration in the treated water?
80 the amount of waste or sludge generated by the system?
81 if waste or sludge is dumped near your house?
82 if waste or sludge is dumped near the water source?
83 if there is an aspect of recycling or regeneration in the system?
Strongly Disagree Disagree Neutral Agree Strongly Agree
1 2 3 4 5
84* I prefer the size of the CWT to be as small as possible
85* I prefer the CWT be constructed with recycled materials
86 Trusting the system and those involved with it is important
87* Those who can afford to pay for water should pay a clean water tariff
88 I prefer having a personal CWT inside my home rather than using a comm
89 All systems should have informative signs
90* I do not want to maintain my own water filter
91 Using chemicals or medicine to make water safe is bad and undesirable
92 I want to have access to all the financial details involving the system
93 Water should be free for everyone
94 I am willing to drink water with a slight taste as long as it’s safe and clean
95 Having water delivered or piped to my home is the most ideal option
96 I feel that a CWT that uses power is not reliable
97* I do not care if a CWT creates Arsenic rich sludge or waste
98* I do not worry about where Arsenic rich sludge is dumped
99 Clean water should have no taste
100 I will only drink water that is clear in colour
101* I am willing to walk a short distance to get clean water
102 I would typically trust groups from outside my village who suggest CWT
*omitted from analysis

78
Figure 5.7 Mean scores with 95% confidence interval of every question from the field
survey requiring the households to rank the importance of various impacts (Section 3.4).
Note that questions (Q) 62, 84, 85 and 90 have been omitted in the analysis due
to lack of clarity in the question: the question contained concepts or assumptions that
were not understood, or the phrasing was unclear. Q101, Q78 and Q87 have been
omitted from this list as the questions do not represent an issue listed but rather actions
the user are willing to engage in. Answers to these questions were used to gain
perspective on user’s levels of willingness to have a multi-tiered price for treated water
Mean score with 95% confidence interval
Qu
esti
on
nu
mb
er f
rom
su
rvey
A
Strongly Disagree Strongly Agree Very Unimportant/ Neutral Very Important/
B
C
D
E

79
(Q87), willingness to walk to collect water (Q101) and willingness to conduct repairs
(maintenance) on a system (Q78). Q97 and Q98 are repeats of questions asked earlier
(Q80, Q81) but phrased in a negative way and thus also omitted. Negatively phrased
questions are meant to result in a response opposite in the scale from the positively
phrased questions, which is used to confirm that the respondent is engaged in the
questioning process (and not just answering ‘agree’ or ‘important’ to everything)
(Bryman, 2012). In some cases, there are multiple questions asked about the same issue
(like ‘cost’) but phrased in a different way. This is another tool used to ensure
consistency in response by the participant (Bryman, 2012). In all cases, the duplicate
questions fell into the same level of importance except for the issue of ‘clarity of treated
water (Q76, Q100) which were ranked slightly different, placing it at both ‘B’ and ‘C’
level.
The results presented in Figure 5.7 demonstrate that the villagers determined
the four most important issues to be considered are cost, trust, distance to the filter (or
home delivery) and understanding the effects of arsenic on health. This result is used
later in the analysis to determine relative weighting of indicators. It also highlights
possible differences in priorities between the users and the technology
designer/implementer, as public health and awareness campaigns are not included as
part of the system. Additionally, designers and implementers typically consider
environmental aspects relating to the technology, which is not of significant importance
to the user in this region. Finally, it is not standard practice to engineer a technology in a
manner which might increase trust and confidence in the user, as usually cost and utility
are the main concerns. These results suggest that a different, more user-focused
approach should be used when designing and implementing the system.

80
5.6 Summary
The results from the survey found family sizes in this region similar to those found in
other surveys, with on average, 1.1 child per house and 4 adults. Water collection is
mainly done by women (71.8%). Technology awareness was mainly gained through
word-of-mouth (59.7%) and door-to-door announcements from a representative
involved with the technology implementation or operation (23.4%).
The median income for the entire sample is 4,500 Rupees per month. All
villages’ median incomes are less than the overall median, except for villages using
BESU and PalT/Harbr which are significantly wealthier. The level of household income
is related to the level of education of household members.
The survey revealed that though a water-option may be arsenic-free, it may not
be a sustainable option due to lack of availability, like ‘time’ water (municipally-
treated). Additionally, a water option that is widely believed to be arsenic-free, like deep
tube wells, may in fact contain arsenic, suggesting the need for widespread arsenic
testing. Treated water for the ten arsenic mitigation options were tested and showed
arsenic concentrations of less than 50ppb in all cases. However only three arsenic
mitigation technologies produced arsenic concentrations less than 10ppb: Tipot,
PalT/Harbr and Dug Wells. This suggests that if the limit is lowered to the international
standard (10ppb), many of the technologies included in this thesis would not be suitable
for use. Analyses of raw water show that in many villages, a filter is essential to bring
the arsenic concentration down to acceptable level (<50ppb). Failure to use a filter, for
whatever reason, then puts the household at risk of arsenicosis.
The distribution of water sources and technologies used by each village is
demonstrated. The majority of villagers within one community use the same filter or no
filter at all, due to limited choices and the added costs of not participating in a

81
subsidised project. This result validates classifying a village by the technology used in it
(ie. a ‘BESU’ village). Assuming that the sampled population is representative of the
entire Bengal region, it is estimated that between 59.8 and 167.9 million people are
drinking arsenic-contaminated water.
Stakeholder (users) opinion identified the four most important issues that should
be considered regarding arsenic mitigation technologies as cost, trust, distance to the
filter (or home delivery) and understanding the effects of arsenic on health. Survey data
allows a wide range of other issues to be ranked in importance from a user’s
perspective. The results presented in this chapter provide an overview of the survey and
add context to the results chapters (6, 7 and 8), which deal with defining and utilization
of indicators within the three capital domains.

82
6 Sociocultural Domain
This chapter presents the sustainability impacts of the ten arsenic mitigation
technologies on the human/social capital domain. An explanation of the scoring of the
sub-indicators is followed by a detailed discussion of the composite indicators which
are: Trust-Confidence; Convenience; Awareness; Acceptability; and Compatibility.
Finally, the total scores of the composite indicators are weighted and presented to give
an overview of relative sociocultural scores for the technologies surveyed.
6.1 Scoring of Sub-Indicators
The five indicators identified in the sociocultural capital domain each comprise several
sub-indicators. Most sub-indicators were identified through the PAM (Section 3.4) and
a few were recognised while in the field during stakeholder interviews and observation.
Each sub-indicator is initially assigned a score of 0 (poor), 1 (moderate/neutral), or 2
(good), and averages are calculated for the villages surveyed having the same
technology (1-4 villages per technology). The raw scores are then weighted. The
relative weights are based on the importance assigned to the various issues by
respondents to interviews and questionnaires (Section 5.6).
6.2 Trust-Confidence Composite Indicator1
In the questionnaire, trust was identified as one of the four most important issues by users
which included all the factors which can be characterised as either ‘trust’ or ‘confidence’.
These were issues that caused the primary stakeholder to start, continue or terminate use of
1 The approach is described in Etmannski and Darton, 2013.

83
the technology. According to Earle’s principles of Trust, Confidence and Cooperation (Earle,
2006 and 2009), trust is social and relational, whereas confidence is instrumental and
calculative. Trust is the willingness, in the expectation of specific outcomes, to make one
vulnerable to another based on the assumption of similar intentions or values. Thus, trust is
based on social relations and shared values. Confidence is the belief, based on experience or
evidence that certain future events will occur as expected, and can be promoted by a variety of
factors like regulations, procedures, contracts, record-keeping, experience, control or
standards.
Therefore in Bengal, the level of user-confidence in a mitigation option will depend
on the technology’s design and whether it fulfils specific expectations. The user’s degree of
trust is based on his/her perception of a whole series of interactions with people associated
with the mitigation technology (NGO, implementers, village leaders, operator/supplier). The
power-balance between different stakeholders is unique to each relationship and can also
affect the user’s degree of trust in a system. For example, having the opportunity to influence
change and make complaints about the operation, implementation and/or management of a
system in a space without community judgement increases trust by enhancing accountability.
According to Earle, both trust and confidence, in a range of combinations, can lead to
various forms of cooperation. This is explored in the analysis by quantifying both trust and
confidence separately, then combining them in a single composite indicator for each of
the ten technologies. The considerations underlying the choice of sub-indicators making
up the separate trust and confidence indicators are as follows:
Trust
Method of engagement. Trust in the organisers of a mitigation project is highest
with full community participation. 0= No engagement with community/village,
direct with only an individual/family; 1= Engaged with Panchayat (council of

84
village elders). It is assumed that the Panchayat represents the people and has
their best interest in mind; 2= Contacted a pre-existing (well-established)
group/club within the community, that is run by the community itself.
Behaviour2 of local leaders. How local leaders interact with the technology
influences the wider user community. 0= They do not use (demonstrate
indifference or do not support the technology); 1= Sometimes use (irregularly);
2= Always use (supportive of technology).
Behaviour of operator/supplier. Community-scale technologies have one or
more operators; household-scale technologies are operated by the householder
who is dependent on a supplier who organizes the purchase of the technology,
sells or provides replaceable parts and collects and/or regenerates the waste.
Trust in the operator or supplier influences attitudes to the technology. 0= Bad
(not liked, thought to be a bad person, untrustworthy and/or lazy); village
questions whether proper maintenance or operating procedures are being
adhered to; 1= Neutral (mixed reviews of the person’s good-standing within the
village or people are generally neutral or have no opinion about the matter); 2=
Good (considered to be a respectable/trustworthy person in the village; Most
people trust them to do correct maintenance/operational procedures/sales etc).
Accountability of operator/supplier. Greater accountability of key figures
improves trust in their decisions and actions. 0= No ability for average villager
to express concerns about the system neutrally; or no mechanism for change; 1=
Some ability to ask questions and express concern but no systemic way to
initiate change; 2= Villagers have a way to make complaints, give feedback and
ask questions about every step in the system neutrally and there is a mechanism
incorporated in the system allowing for accountability, change and correction.
2 Behaviour refers to actions observed by the user, and interactions with the user.

85
Confidence
Durability. Faults in the equipment undermine confidence in its efficacy.
0= Breaks/malfunctions very easily or is very sensitive and easily disrupted;
1= Malfunctions on occasion and is affected by moderate condition changes;
2= Breaks down or malfunctions never or only very rarely.
External appearance of technology. A clean, neat, professional set-up inspires
confidence. 0= Unorganised, haphazard, dirty, rusty; 1= Moderately clean neat
and professional; 2= Very clean, neat and professional.
Diarrhoea after ingestion of treated water3. This symptom can undermine
confidence. 0= Regularly; 1= Sometimes; 2= Never.
Transparency of financing / costing. Confidence that costs are fair and
reasonable is promoted by openness. 0= None at all; 1= Some/Limited; 2= All
(total transparency accessible by any and all villagers if desired).
Proof of regular arsenic testing. Confidence is enhanced by regular up-to-date
certification of water quality and publication of results. 0= None, never; 1= Yes,
sometimes; 2= Yes, regularly.
Presence of appropriate signage. Relevant information about the technology
implementation, in a language that can be understood, raises confidence.
0= None; 1= Some signage with minor missing information; 2= All relevant
information present in the local language.
3 Some technologies remove iron, which can cause diarrhoea when users switch to this water source.
Diarrhoea can also be caused by many other factors. Villagers tend to use the occurrence of diarrhoea as
an indicator of “bad” water, so it is used as a negative indicator.

86
The scores and weighting factors were chosen so that the final maximum
weighted score for Trust was 50% higher than that for confidence for several reasons.
First, Earle’s Trust-Confidence-Cooperation model specifies a direct interaction
between trust and confidence, with trust dominating confidence (Earle, 2006). It appears
that confidence is fragile and trust is robust, so that confidence is easily made and
broken while trust takes longer to build and can withstand more stress. Once broken
though, rebuilding trust may require more effort, making it considerably more important
to foster and maintain. Second, since by definition trust is social and interpersonal, it is
weighted more highly than confidence because of the high value placed on social
relationships and interactions by rural Bengali people (Banerjee, 2008). The final scores
in Table 6.2 are therefore related to a maximum possible score of 10.5, but they can be
normalised on any scale, because they are relative. Tables 6.1 and 6.2 reveal aspects in
which particular technology systems may be improved in order to promote trust and
confidence and hence utilisation.
Table 6.1 Confidence sub-indicator scores.
Coded Weighting Coded Weighting Coded Weighting Coded Weighting Coded Weighting Coded Weighting
/2 1.00 /2 0.15 /2 0.15 /2 0.15 /2 0.50 /2 0.15
Tipot 2 2.00 1 0.15 0 0.00 0 0.00 0 0.00 0 0.00 2.15
IITB 2 2.00 1 0.15 1 0.15 1 0.15 0 0.00 1 0.15 2.60
BESU 2 2.00 1.7 0.26 1 0.15 1 0.15 1.7 0.85 1 0.15 3.56
PalT/Harbr 2 2.00 2 0.30 2 0.30 0 0.00 0 0.00 1 0.15 2.75
AIIH&PH 0 0.00 1 0.15 1 0.15 0 0.00 0 0.00 1 0.15 0.45
CGCRI 1 1.00 1 0.15 1 0.15 0 0.00 0 0.00 1 0.15 1.45
Dug 1 1.00 1 0.15 1 0.15 1 0.15 0 0.00 1 0.15 1.60
Sono 45/25 0 0.00 1 0.15 1 0.15 0 0.00 0 0.00 0 0.00 0.30
Nirmal 0 0.00 1 0.15 1 0.15 1 0.15 0 0.00 0 0.00 0.45
DRDO 0 0.00 2 0.30 1 0.15 1 0.15 0 0.00 1 0.15 0.75
Technology
Confidence (weighted maximum = 4.2)
Weighted
Total
/4.2
Durability
External
Appearance
of Tech
Diarrhoea
after Ingestion
of Treated
Water
Transparency
of Financing /
Costing
Proof of
Regular
Arsenic
Testing
Presence of
Appropriate
Signage

87
Tables 6.2 Trust sub-indicator scores and Trust-Confidence Totals for mitigation
options.
Figure 6.1 Total Trust-Confidence score found for each option.
The arsenic mitigation technologies developed by IITB, BESU and PalT/Harbr
obtained the highest values of Trust-Confidence (Figure 6.1). Dug wells scored the
fourth highest. These four arsenic mitigation options showed the highest levels of
community participation, support by local leaders and professional behaviour by
operators/suppliers. The DRDO, Tipot, Sono 45-25, and AIIH&PH scored in the mid-
lower end in Trust-Confidence, with Nirmal and CGCRI scoring the lowest. All three
Coded Weighting Coded Weighting Coded Weighting Coded Weighting
/2 0.59 /2 1.19 /2 1.19 /2 0.18
Tipot 1 0.59 0 0.00 0.5 0.60 0 0.00 1.19 3.34
IITB 1.3 0.77 2 2.38 2 2.38 1.3 0.23 5.76 8.37
BESU 1.7 1.01 1 1.19 2 2.38 1.7 0.31 4.89 8.44
PalT/Harbr 1 0.59 1.8 2.14 2 2.38 2 0.36 5.47 8.22
AIIH&PH 1 0.59 0 0.00 1 1.19 1 0.18 1.96 2.41
CGCRI 0 0.00 0 0.00 0.3 0.36 0 0.00 0.36 1.81
Dug 1 0.59 0.7 0.83 1 1.19 1 0.18 2.79 4.39
Sono 45/25 1 0.59 2 2.38 0 0.00 0 0.00 2.97 3.27
Nirmal 1 0.59 0.7 0.83 0 0.00 0 0.00 1.42 1.87
DRDO 1 0.59 2 2.38 0 0.00 0 0.00 2.97 3.72
Trust-
Confidence
Combined
Weighted
Total
/10.5
Technology
Trust (weighted maximum =6.3)
Weighted
Total
/6.3
Method of
Engagement
Behaviour of
Local
Leaders
Behaviour of
Operator /
Supplier
Accountability
of Operator /
Supplier
0.00
2.00
4.00
6.00
8.00
10.00Trust-Confidence

88
household-scale technologies fell in the lowest range. Interestingly, the one technology
that is implemented for-profit within communities is the CGCRI, which has the lowest
Trust score. In comparison, the four top technologies identified here, have partnered
with local NGOs and/or community groups ensuring that any profit made from the
selling of treated water goes back into the mitigation project itself or another social
project that will directly benefit the community. This suggests that there is probably
also a strong connection with the economic capital domain, which is supported by the
fact that the stakeholders identified ‘Cost’ as also being a very important issue.
Conducting a triple-bottom-line analysis is needed to obtain a complete understanding
of what affects the sustainability of arsenic mitigation options.
6.3 Convenience Composite Indicator
Consistent with the findings of Hoque et al. (2004), another key issue for primary
stakeholders was the distance to the water source. Their research, like this study, found
that users preferred piped water (home tap water). Shafiquzzaman et al. (2009)
conducted a technical and social evaluation of arsenic mitigation technologies in rural
Bangladesh and reported that 56% of respondents choose not to use an arsenic-free
water supply because the source is located too far from their houses. This suggests that
the distance to the water source (home delivery or home tap water) is important because
it influences decisions regarding utilisation. Clearly the level of ‘convenience’ is an
important factor.
The concept of convenience first appeared in academic literature relating to the
design and marketing of products which offered ‘time-saving’ features (Copeland,
1923). Becker (1965) expanded on the concept of ‘time-saving’ by incorporated time
into the classic economic choice model, recognising that time (like income and price)

89
constrains choice. However unlike money, time is a limited and scarce resource because
time cannot be expanded (Jacoby et al., 1976). Therefore, the term ‘time-saving’
actually means reallocating time across activities to achieve greater efficiency (Gross,
1987), and in this context means decreasing the amount of time used to complete
activities related to arsenic mitigation technologies. Time-saving measures are
important to Bengali households because working hours are limited by daylight, as most
villages have no electricity, and because all household duties are very labour-intensive
(cooking from scratch, washing clothes by hand).
Convenience is the value consumers place on goods and services with inherent
time or effort-saving characteristics (Voli, 1998), and researchers agree that
convenience has a major impact on consumer buying decisions (Berry et al., 2002).
Brown et al. (1989) applied the concept of economic utility to analyse convenience (for
the consumer) in terms of the four dimensions: time, place, possession and form. The
most convenient product or service would be available continuously (time), everywhere
(place), and would require no effort to acquire (possession) or use4 (form). Figure 6.2
shows a list of water treatment options ranked in order of convenience.
Figure 6.2 Ranking levels of convenience for water treatment options in rural India
(based on the idea of Brown, 1989).
The four dimensions of Brown et al. (1989) help to clarify and categorise the
issues related to convenience identified through the PAM. These issues can be
4 The action of filling up water containers was not considered as an issue in this context as every
technology requires the user to use a tap; making them equal in convenience in this regard.
LEAST CONVENIENT Self-collection, treatment and maintenance
Centralised treatment and maintenance but self-collection
Centralised treatment, maintenance and delivery
Treated piped water in home (if always available)
MOST CONVENIENT
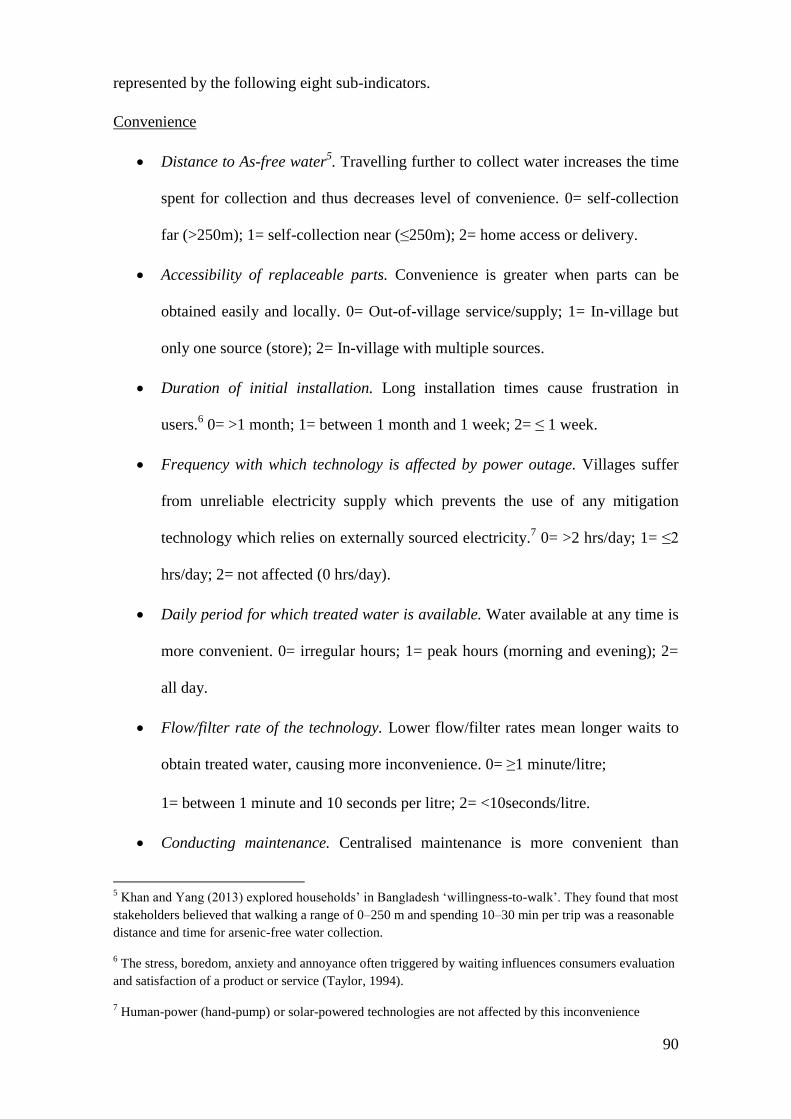
90
represented by the following eight sub-indicators.
Convenience
Distance to As-free water5. Travelling further to collect water increases the time
spent for collection and thus decreases level of convenience. 0= self-collection
far (>250m); 1= self-collection near (≤250m); 2= home access or delivery.
Accessibility of replaceable parts. Convenience is greater when parts can be
obtained easily and locally. 0= Out-of-village service/supply; 1= In-village but
only one source (store); 2= In-village with multiple sources.
Duration of initial installation. Long installation times cause frustration in
users.6 0= >1 month; 1= between 1 month and 1 week; 2= ≤ 1 week.
Frequency with which technology is affected by power outage. Villages suffer
from unreliable electricity supply which prevents the use of any mitigation
technology which relies on externally sourced electricity.7 0= >2 hrs/day; 1= ≤2
hrs/day; 2= not affected (0 hrs/day).
Daily period for which treated water is available. Water available at any time is
more convenient. 0= irregular hours; 1= peak hours (morning and evening); 2=
all day.
Flow/filter rate of the technology. Lower flow/filter rates mean longer waits to
obtain treated water, causing more inconvenience. 0= ≥1 minute/litre;
1= between 1 minute and 10 seconds per litre; 2= <10seconds/litre.
Conducting maintenance. Centralised maintenance is more convenient than
5 Khan and Yang (2013) explored households’ in Bangladesh ‘willingness-to-walk’. They found that most
stakeholders believed that walking a range of 0–250 m and spending 10–30 min per trip was a reasonable
distance and time for arsenic-free water collection.
6 The stress, boredom, anxiety and annoyance often triggered by waiting influences consumers evaluation
and satisfaction of a product or service (Taylor, 1994).
7 Human-power (hand-pump) or solar-powered technologies are not affected by this inconvenience
91
self/household maintenance. Additionally, longer maintenance periods are less
convenient so maintenance is less likely to be done (Kabir and Howard, 2007).
0= self-maintenance; 1= centralised maintenance ≥ once/week; 2= centralised
maintenance < once/week.
Purchasing made easy. A clear understanding of payment procedure enhances
convenience. Typical uncertainties are: the tariff, who to pay, how and when to
pay, what mode of payment is acceptable (cash, pre-paid, future payment
options). 0= both unclear/non-standard pricing and unclear payment mechanism
(knowing who to pay and when); 1= unclear/non-standard pricing or unclear
payment mechanism; 2= clear, stable and competitive prices with prepayment,
payment plan, and/or onsite payment available.
Table 6.3 Convenience sub-indicator results and totals for mitigation options.
The weighting of each Convenience sub-indicator was set at: 1 if the user
encounters inconvenience that cannot be readily accommodated and 0.5 if the
inconvenience is significant but can be accommodated to some extent.
Dimension:
Coded Weight Coded Weight Coded Weight Coded Weight Coded Weight Coded Weight Coded Weight Coded Weight
/2 1 /2 0.5 /2 0.5 /2 0.5 /2 0.5 /2 1 /2 1 /2 1
Tipot 0.5 0.5 1 0.5 0 0 0 0 2 1 2 2 1 1 1 1 6
IITB 0.67 0.67 1 0.5 1 0.5 2 1 2 1 1 1 2 2 1.33 1.33 8
BESU 0.67 0.67 0 0 0 0 0.67 0.34 0.67 0.34 2 2 1 1 1.67 1.67 6.02
PalT/Harbr 0.25 0.25 0 0 1 0.5 1.25 0.63 1.25 0.63 2 2 1 1 1.75 1.75 6.76
AIIH&PH 0.67 0.67 0 0 1 0.5 2 1 1.33 0.67 1 1 1 1 1 1 5.84
CGCRI 1 1 0 0 2 1 1.33 0.67 1 0.5 1 1 1 1 2 2 7.17
Dug 0.67 0.67 1 0.5 1 0.5 2 1 2 1 2 2 2 2 2 2 9.67
Sono 45/25 1 1 0 0 2 1 2 1 1 0.5 0 0 0 0 2 2 5.5
Nirmal 1 1 0 0 2 1 2 1 1 0.5 0 0 0 0 0 0 3.5
DRDO 1 1 1 0.5 2 1 2 1 1 0.5 0 0 0 0 1 1 5
Technology
Weighted
Total
(/12)
Convenience
Place
Affected by
power
outage
PossessionTime Form
Distance to
As-free
water
Accessibility
of replaceable
parts
Hours
treatment
available
Conducting
maintenance
Purchasing
made easy
Duration of
installation
Flow/filter
rate of tech

92
Figure 6.3 Total Convenience score found for each technology.
The mitigation option that scored highest in Convenience is the Dug well,
followed by the IITB. Both these options use local components, are accessible all day
and are very easy to maintain. The CGCRI scored the third highest and received full
scores in the ‘duration of installation’ and ‘purchase made easy’ categories, perhaps
related to the for-profit nature of the CGCRI projects. The other community-scale
technologies fall in the mid-range, similarly scoring around six. The three household
scale technologies prove to be somewhat less convenient for users.
6.4 Awareness Surrogate Indicator
Arsenic contamination of drinking water is a public health problem, and understanding
this aspect is an essential prerequisite to a successful arsenic mitigation programme. The
lack of coordination between public health authorities and drinking water supply
professionals has further complicated the mitigation efforts in the Bengal Basin (Milton
et al., 2012). This is discussed by Brouns et al. (2013) who found that many people in
rural Bihar (a district of West Bengal, India) still do not know about arsenic and the
need for mitigation. These authors comment that for any mitigation programme to work,
overall improved awareness of the arsenic problem is necessary. This suggests that
0
2
4
6
8
10
12
Convenience

93
arsenic mitigation ought to be viewed as a service, which includes awareness
campaigns, not just as the sale or implementation of a product. Similar examples of this
equipment-plus-information model include distribution of mosquito nets in developing
countries alongside malaria-awareness campaigns (Project Mosquito Net, 2014), and
supplying free contraceptives together with family-planning support and HIV/AIDS
awareness (UNFPA, 2012).
Results in Figure 6.4 show that more than 50% of people in the villages we
surveyed state that they do not know whether their household tube well contains arsenic
or not.
Figure 6.4. Average distribution of answers to the question ‘Is there arsenic in your
household tubewell’ for villages using each technology.
The households that answered ‘yes’ or ‘no’ to the question whether arsenic was
present in their tubewell were asked a supplementary question about how they could be
certain. The answers to this supplementary question revealed that their belief about the
purity of their water was often based on whether one or more family member was
suffering or had suffered from arsenic-related ailments (commonly identified by black
0%
10%
20%
30%
40%
50%
60%
70%
80%
90%
100%
Is there arsenic in your household tubewell?
Never heard
of arsenic
before
Do not
know
Yes
No

94
spots on the body). None of the respondents interviewed had had their household tube
well tested.8 Therefore beliefs on ‘yes’ or ‘no’ as shown in Figure 6.4 must be regarded
largely as guesses.
It is sometimes thought that arsenicosis is contagious so any occurrence may be
kept secret to avoid ostracism by family and/or village. Hanchett et al. (2002) reported
that 41% of Bangla women surveyed thought that arsenicosis was a contagious disease.
George et al. (2013) assessed awareness of the arsenic problem in Bangladeshi villages
and demonstrated confusion regarding the health implications of chronic arsenic
exposure. The majority of respondents incorrectly stated that cholera, diarrhoea, and
vomiting could be caused by arsenic and nearly 70% of participants incorrectly stated
that boiling could remove arsenic from drinking water, and that eating or sleeping with
an arsenicosis patient could cause the transmission of the disease. Many other authors
describe similar observations regarding lack of arsenic awareness (Aziz et al., 2006;
Caldwell, 2003; Hanchett et al., 2002; Paul, 2004). An added complexity to the lack of
general understanding and awareness of arsenicosis in Bengal is that there is similarity
of some clinical symptoms of arsenicosis to leprosy, particularly disfigurement of skin.
Leprosy, a familiar infectious illness in Bengal, carries significant negative social
stigma. Our household survey contained no questions exploring the household’s degree
of knowledge surrounding the health effects of arsenic however the literature is clear
that misconceptions are common. The survey revealed a desire by rural residents to
know more about it, as households rated the issue ‘understanding the physical effects of
8 Melamed (2005) reviewed technologies with field measurement potential for monitoring arsenic and
concluded that affordable and accurate measurement of arsenic in the field remained a technical
challenge. It currently costs 2,500 Rupees to have one water sample tested for arsenic at a laboratory, not
including the transportation costs. This is equivalent to 17 days income for the average household in our
survey (income figures are given in Section 5.2). Most families have not had their tube wells tested due to
the cost and logistical difficulties.

95
arsenic’ as one of the four highest in importance relating to arsenic mitigation options
(along with Trust, Distance and Cost) (Section 5.6).
The survey also did not ask whether users were aware of arsenic presence in
waste created by mitigation options. However the survey does show that arsenic-rich
waste is commonly treated in a way that demonstrates poor understanding of the
dangers of this toxic material (Section 7.3.2).
Knowledge of whether arsenic is present in untreated household tube wells,
understanding the health effects of arsenic, and community awareness surrounding
arsenic presence in waste, are all necessary for sustainable implementation of any
mitigation technology. Indicators could be created for these three issues, which together
would represent the degree of awareness composite indicator. However since these
values were not measured during the fieldwork, a surrogate indicator has been
identified, and this takes the place of the awareness composite indicator in this analysis.
Awareness Indicators
Household’s knowledge of arsenic concentration/presence in untreated water.
0= ≤50% of households have knowledge; 1= between 50% and 80% of
households have knowledge; 2= ≥80% of households have knowledge.
Household’s knowledge about physical effects of arsenic on human health.
0= ≤50% of households have knowledge; 1= between 50% and 80% of
households have knowledge; 2= ≥80% of households have knowledge.
Household’s knowledge of arsenic presence in waste.
0= ≤50% of households have knowledge; 1= between 50% and 80% of
households have knowledge; 2= ≥80% of households have knowledge.

96
Surrogate Awareness Indicator
Declaration of community and/or school9 arsenic-awareness campaigns. A
campaign including information on health effects of arsenic, the presence of
arsenic in waste and thus the importance of proper disposal methods and
widespread testing of household tube wells would improve the overall
community awareness surrounding issues related to arsenic in drinking water.
0= Community/school awareness session never held and no on-going campaign;
1= Community/school awareness session held only one time with no tubewell
testing; 2= Community/school awareness campaign on-going, including regular
awareness sessions and household tubewell testing.
Table 6.4 Surrogate-indicator to measure degree of Awareness.
Most of the technologies have not incorporated the promotion of arsenic
awareness into their system and therefore scored zero in the surrogate indicator. The
9 Integrating drinking water safety in the schools’ curriculum would be an important first step in
achieving overall awareness (Brouns et al., 2013).
Coded Weighting
/2 1
Tipot 0 0
IITB 0.33 0.33
BESU 0.33 0.33
PalT/Harbr 0 0
AIIH&PH 0 0
CGCRI 0 0
Dug 0.66 0.66
Sono 45/25 0 0
Nirmal 0 0
DRDO 0 0
Awareness
Technology
Declaration of
community and
school arsenic-
awareness
campaign

97
Dug well, IITB and BESU scored ‘1’ in only a few of the villages visited (not all)
resulting in scores less than one. In these villages, a small amount of awareness-building
had occurred, as households commented either that information about arsenic had been
broadcast through a megaphone in the centre of the village (BESU) or that arsenic-
related information had been conveyed through the field workers/operator (IITB and
Dug).
There is a clear need for public awareness campaigns to be implemented
alongside arsenic mitigation technologies. George et al. (2013) proved that awareness
campaigns do work when they observed a dramatic reduction in urinary arsenic after
promoting household-level arsenic awareness education together with provision of an
arsenic testing service. This programme succeeded in persuading households to use
arsenic-safe drinking water sources. It is also known from the work of Ahmad et al.
(2005) that awareness of arsenic contamination bears a positive relationship to a
household’s ‘willingness to pay’ for arsenic-removal. Increased knowledge and
awareness should therefore make conditions more favourable for successful technology
utilisation over time. Increasing public awareness might also change attitudes to
arsenic-rich waste, and perhaps lead to the development of better disposal options, and
adherence to stricter and safer disposal protocols.
6.5 Acceptability of Treated Water Composite Indicator
An important criterion in determining the sociocultural appropriateness of an arsenic
mitigation option is the degree of acceptability of taste, smell and appearance of the
treated water to the local users. Taste and odour can originate from natural inorganic
and organic chemical contaminants and biological sources or processes, from
contamination by synthetic chemicals, from corrosion or as a result of water treatment
such as chlorination (WHO, 2004). Colour, cloudiness, particulate matter and visible

98
organisms may also be noticed by users and may create concerns about the quality and
acceptability of the drinking water supply. Hossain et al. (2013) performed a statistical
analysis to find out if there is any association between taste and odour of filtered water
and the decision to use an arsenic filter, and found that both significantly influenced the
user’s choice. Appearance of the treated water is also likely to affect the user’s opinion
of acceptability. Therefore taste, smell and appearance together make up the
Acceptability of Treated Water composite indicator, with 0= poor, 1= neutral, 2= good,
as the scoring (Table 6.5 and Figure 6.5).
Table 6.5 Sub-indicator results for the Acceptability of Treated Water composite
indicator.
Figure 6.5 Total Acceptability score found for each technology.
Coded Weighting Coded Weighting Coded Weighting
/2 1 /2 1 /2 1
Tipot 1.25 1.25 1.5 1.5 1.5 1.5 4.25
IITB 2 2 2 2 2 2 6
BESU 2 2 2 2 2 2 6
PalT/Harbr 2 2 2 2 2 2 6
AIIH&PH 0 0 2 2 1 1 3
CGCRI 0.67 0.67 2 2 0.67 0.67 3.34
Dug 1 1 1 1 0.33 0.33 2.33
Sono 45/25 1 1 2 2 1 1 4
Nirmal 1.33 1.33 1.67 1.67 1.33 1.33 4.33
DRDO 1.5 1.5 1.5 1.5 2 2 5
Acceptability of Treated Water
Taste Appearance Smell
TechnologyWeighted
Total (/6)
0
1
2
3
4
5
6
Acceptability of Treated Water

99
The three mitigation options with perfect scores in the Acceptability of Treated
Water indicator are IITB, BESU and PalT/Harbr. The DRDO, Nirmal, Tipot and Sono
45-25 (all three household-scale options) scored in the midrange, showing minor
complaints in all three categories. CGCRI and AIIH&PH scored less well and Dug was
let down by its score for smell. The three poorest scoring mitigation options in
Acceptability are the only three which use chemical additives (either for chlorination, or
oxidation purposes).
6.6 Compatibility Composite Indicator
Certain levels of technical expertise required to install operate or maintain an arsenic
mitigation option may not match the level of expertise available within a rural
community. There might also be a mismatch between levels of physical exertion
required and that which is available (or willing). Requiring high levels of technical
expertise or physical labour may then limit the utility of any particular technology. This
has been the reason behind the failure of many arsenic mitigation projects in this region
(Hossain et al., 2005; Alaerts and Khouri, 2004; Kabir and Howard, 2007), particularly
when people who are already weakened by arsenic poisoning are required to conduct
labour-intensive operation and maintenance activities (Johnston et al., 2010). The
Compatibility composite indicator encapsulates these issues and is comprised of the six
sub-indicators listed below (Table 6.6 and Figure 6.6):
Compatibility
0= maximum/great amount; 1= acceptable/moderate amounts; 2= ideal/minimal amount
Degree of technical expertise required to install technology.
Degree of technical expertise required to operate technology.
Degree of technical expertise required to conduct maintenance.
Level of physical exertion required to install technology.

100
Level of physical exertion required to operate technology.
Level of physical exertion required to conduct maintenance.
The scores for the sub-indicators were determined based on field observations and
comments made by households during the informal interviews. There were no specific
questions included in the survey which measured user opinion on these issues for each
technology.
Table 6.6 Sub-indicator results for the Compatibility composite indicator.
Figure 6.6 Total Compatibility score found for each technology.
Coded Weighting Coded Weighting Coded Weighting Coded Weighting Coded Weighting Coded Weighting
/2 1 /2 1 /2 1 /2 1 /2 1 /2 1
Tipot 0 0 2 2 1 1 1 1 2 2 1 1 7
IITB 0 0 2 2 1 1 1 1 1 1 0 0 5
BESU 0 0 2 2 0 0 1 1 2 2 1 1 6
PalT/Harbr 0 0 2 2 1 1 1 1 2 2 1 1 7
AIIH&PH 0 0 2 2 0 0 1 1 1 1 0 0 4
CGCRI 0 0 2 2 0 0 1 1 2 2 0 0 5
Dug 1 1 2 2 1 1 0 0 1 1 2 2 7
Sono 45/25 2 2 2 2 2 2 2 2 1 1 1 1 10
Nirmal 2 2 2 2 0 0 2 2 1 1 1 1 8
DRDO 2 2 2 2 1 1 2 2 1 1 1 1 9
Technology
Weighted
Total
(/12)
Compatibility
Degree of
technical
expertise
required to
install
technology
Degree of
technical
expertise
required to
operate
technology
Degree of
technical
expertise
required to
conduct
maintenance
Level of
physical
exertion
required to
install
technology
Level of
physical
exertion
required to
conduct
maintenance
Level of
physical
exertion
required to
operate
technology
0
2
4
6
8
10
12
Compatibility

101
The Sono 45-25, DRDO, and Nirmal, scored highest in the Compatibility
indicator. They were all designed to be easy to use because they are at-home systems.
The Dug wells, Tipot and PalT/Harbr ranked a little lower since they require moderate
to high level expertise to install and maintain but are easy to use both technically and
physically. BESU scores slightly less as it is requires significant technical expertise to
conduct the maintenance (adsorbent regeneration). IITB requires more physical energy
to conduct the monthly maintenance (cleaning of the nail beds), while the CGCRI
requires both expertise and energy to conduct maintenance (washing the membrane) and
AIIH&PH makes demands in all categories except it does not require any technical
expertise in general operation.
6.7 Aggregation of Sociocultural Composite Indicators
The weighted totals of all the composite indicators are reported in Table 6.7 and are
normalised so as to produce a total score with a possible maximum of 100. Trust-
Confidence, Convenience and Awareness are weighted twice as much as Acceptability
and Compatibility because they were identified by the users as the most important
issues regarding the arsenic mitigation options (Table 6.7).
Table 6.7 Composite indicator results (weighted and normalised) for sociocultural
capital.
Weighted
Score
Normal-
ised
Weighted
Score
Normal-
ised
Weighted
Score
Normal-
ised
Weighted
Score
Normal-
ised
Weighted
Score
Normal-
ised
/10.5 /25 /12 /25 /2 /25 /6 /12.5 /12 /12.5
Tipot 3.3 8.0 6.0 12.5 0.0 0.0 4.3 8.9 7.0 7.3 36.6
IITB 8.4 19.9 8.0 16.7 0.3 2.1 6.0 12.5 5.0 5.2 56.4
BESU 8.4 20.1 6.0 12.5 0.3 2.1 6.0 12.5 6.0 6.3 53.4
PalT/Harbr 8.2 19.6 6.8 14.1 0.0 0.0 6.0 12.5 7.0 7.3 53.4
AIIH&PH 2.4 5.7 5.8 12.2 0.0 0.0 3.0 6.3 4.0 4.2 28.3
CGCRI 1.8 4.3 7.2 14.9 0.0 0.0 3.3 7.0 5.0 5.2 31.4
Dug 4.4 10.5 9.7 20.1 0.7 4.1 2.3 4.9 7.0 7.3 46.9
Sono 45/25 3.3 7.8 5.5 11.5 0.0 0.0 4.0 8.3 10.0 10.4 38.0
Nirmal 1.9 4.5 3.5 7.3 0.0 0.0 4.3 9.0 8.0 8.3 29.1
DRDO 3.7 8.9 5.0 10.4 0.0 0.0 5.0 10.4 9.0 9.4 39.1
Compatibility
Technology
Normal-
ised
Total
(/100)
Sociocultural Composite Indicators
Trust-
Confidence Convenience Awareness Acceptability

102
Figure 6.7 is a bar graph of the total normalised sociocultural scores from Table
6.7. The graph highlights that even the poorest scored options (AIIH&PH and Nirmal)
offer the user benefit in terms of arsenic removal but the better ranked options (IITB,
BESU and PalT/Harbr) offer some examples of best practice that could be more widely
adopted. However even these top ranked technologies can still be greatly improved in
terms of sociocultural aspects, as they only score around 50% of the maximum score
potential.
Figure 6.7 Total scores for sociocultural aspects for each mitigation option.
Figure 6.8 Utilisation of option in villages surveyed, related to total Sociocultural Score.
0.0
10.0
20.0
30.0
40.0
50.0
60.0
70.0
80.0
90.0
100.0
Ranking of Sociocultural Aspects
0
10
20
30
40
50
60
70
80
90
100
0 10 20 30 40 50 60 70 80 90 100
% h
ouse
ho
lds
usi
ng t
he
tech
no
logy
Sociocultural Score
IITB
BESU
PalT/Harbr Dug
DRDO
Sono45/25
Tipot
AIIH&PH
CGCRI
Nirmal

103
The scoring of sociocultural aspects has relied heavily on the household survey
so it might be expected that the highest ranked mitigation options would prove popular
with users. This expectation is tested in Figure 6.8. The percentage of households in
villages using a particular technology is plotted against the total sociocultural score for
that technology in those villages, normalised to a scale 0-100. As expected, there is a
strong correlation between utilisation and sociocultural indicators. These data suggest
that a technology with a sociocultural score of less than about 25% will prove wholly
unattractive and potential users will prefer some other alternative. Above this threshold
the utilisation increases linearly with sociocultural score. The technology with the
highest score on this analysis (IITB, sociocultural score 56%) was utilised by 70% of
the community.
6.8 Summary and Discussion
According to the household survey of user opinions, three of the four most important
issues associated with arsenic mitigation technologies fall into the sociocultural domain:
trust, distance to the filter (convenience) and understanding the effects of arsenic on
health. The mitigation options that scored the highest in Trust-Confidence are IITB,
BESU and PalT/Harbr. The top-ranked technologies in Convenience are Dug wells,
IITB and CGCRI. At present, no mitigation option approaches implementation as a
service that includes public awareness campaigns of arsenic-related issues, and
therefore all technologies score very low in Awareness. Since these three composite
indicators are of high importance to the users, they were weighted twice as much as the
other two indicators that are also included within the sociocultural domain
(Acceptability and Compatibility). IITB, BESU and PalT/Harbr produce the most
acceptable treated water, and SONO 45-25, Nirmal and DRDO scored highest in
compatibility.
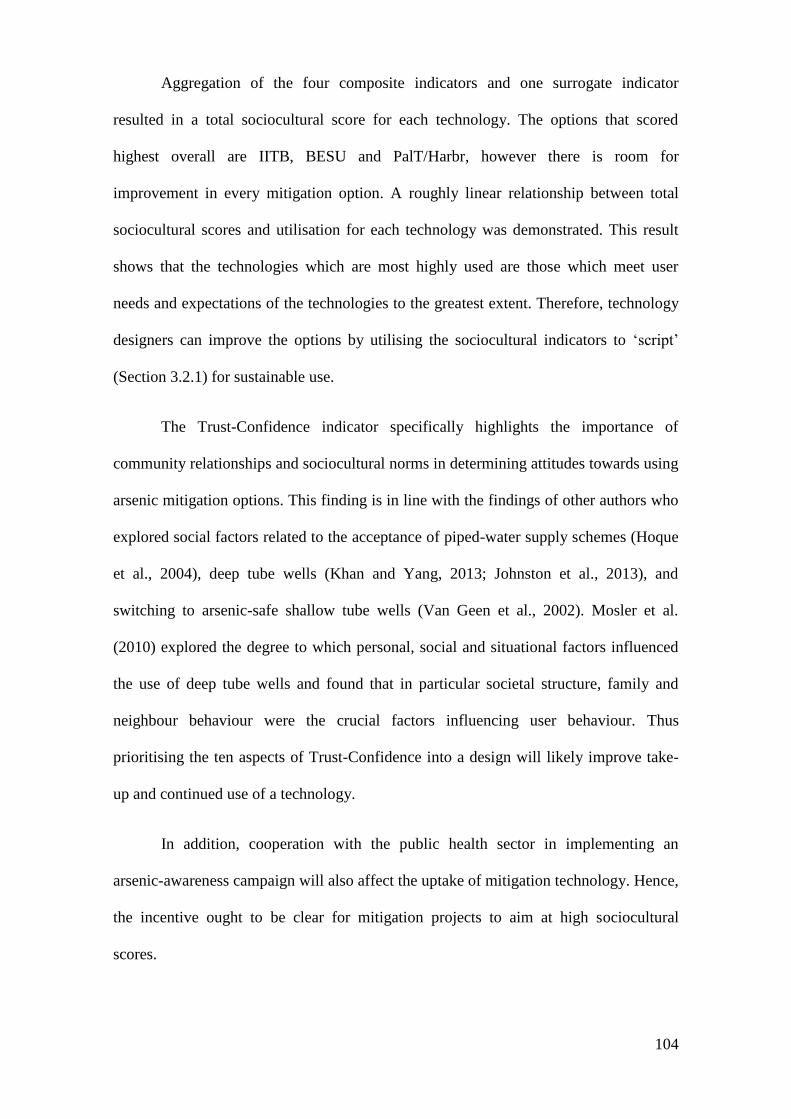
104
Aggregation of the four composite indicators and one surrogate indicator
resulted in a total sociocultural score for each technology. The options that scored
highest overall are IITB, BESU and PalT/Harbr, however there is room for
improvement in every mitigation option. A roughly linear relationship between total
sociocultural scores and utilisation for each technology was demonstrated. This result
shows that the technologies which are most highly used are those which meet user
needs and expectations of the technologies to the greatest extent. Therefore, technology
designers can improve the options by utilising the sociocultural indicators to ‘script’
(Section 3.2.1) for sustainable use.
The Trust-Confidence indicator specifically highlights the importance of
community relationships and sociocultural norms in determining attitudes towards using
arsenic mitigation options. This finding is in line with the findings of other authors who
explored social factors related to the acceptance of piped-water supply schemes (Hoque
et al., 2004), deep tube wells (Khan and Yang, 2013; Johnston et al., 2013), and
switching to arsenic-safe shallow tube wells (Van Geen et al., 2002). Mosler et al.
(2010) explored the degree to which personal, social and situational factors influenced
the use of deep tube wells and found that in particular societal structure, family and
neighbour behaviour were the crucial factors influencing user behaviour. Thus
prioritising the ten aspects of Trust-Confidence into a design will likely improve take-
up and continued use of a technology.
In addition, cooperation with the public health sector in implementing an
arsenic-awareness campaign will also affect the uptake of mitigation technology. Hence,
the incentive ought to be clear for mitigation projects to aim at high sociocultural
scores.

105
7 Environmental Domain
This chapter introduces the concept of ‘product stewardship’ as an approach to exploring
the environmental impacts generated during the three stages of life for each technology:
‘Design and Manufacture’, ‘Installation and Operation’ and ‘End of Life’. Indicators are
generated for each stage, weighted and normalised to create a score for each technology
in the environmental capital domain.
7.1 Product Stewardship
The concept of ‘stewardship’ is a way of framing relations between people and material
resources or goods. Stewardship is often invoked to highlight the responsibilities of
landowners or natural resource managers for maintaining environmental values of the
resources they manage, so that those values may endure into the future. A key dimension
of environmental stewardship generally is the linkage of property with some form of civic
responsibility. The property may be in the land that produces the resources or in the goods
that are produced from it. While discourse on stewardship has had a much stronger
presence in relation to natural resource management, it is also important in the world of
engineered products.
When products are sold, the traditional view has been that property and the
responsibilities that go with it transfer to the consumer at the moment of purchase. In
contrast, ‘product stewardship’ (PS) is the notion that all involved in the lifecycle of a
product share responsibility for reducing its health and environmental impacts, with
producers bearing primary financial responsibility. Ideas about PS developed from societal
concern about responsible management of hazardous industrial waste, towards a broader
focus on resource conservation and recycling which connects strongly with the Industrial
Ecology (IE) school of thought (Huber, 2000). IE emphasises industrial material flows in

106
terms of inputs, throughputs and outputs, each of which have different levels of
environmental impact that can be measured through Life-Cycle Assessment (Graedel and
Allenby, 2003), Ecological Foot-printing (Rees, 1992), or a similar context-relevant,
ecosystem services accounting methodology. Extended Producer Responsibility (EPR), an
extension of PS, is a policy approach in which the producer’s responsibility for their
product extends to the post-consumer management of that product and its waste (PSI,
2013).
In this analysis, a product stewardship approach is used when creating the
sustainability indicators within the environmental-capital domain for arsenic mitigation
technologies. Using the concepts of PS and EPR to frame the environmental domain is
useful because it requires looking at the life cycle of these technologies with new
perspective (Figure 3.1). Under an EPR scheme, waste generation during the operation
phase and end-of-life phase are no longer just the problem of the user and the villages, but
designers and implementers also share responsibility to ensure safe disposal. This is
particularly important in Bengal where most arsenic-mitigation options produce large
quantities of toxic waste. The indicators created in this chapter addresses this issue and
together could aid in the creation of an Extended Producer Responsibility policy in Bengal.
7.2 Inputs – Design and Manufacture
The community scale technologies are constructed on-location using the components list in
Table 7.1. The household-scale technologies are assembled in the factory and
sold/distributed as a complete unit. All materials used in construction of the technologies
are available for purchase within India, with the exception of the SONO 45-25 which is
imported, already assembled, from a neighbouring country, Bangladesh. This means that
the carbon footprint of material transportation is very minimal.

107
General
Components Materials
Pump Submersible pumps; Steel hand pumps.
Filtration container Steel boxes; Cylindrical stainless steel tanks; Plastic, ferro-cement,
stainless steel buckets.
Connection tubes PVC and galvanized steel tubing and joints; Soft plastic and rubber
tubes; Hard plastic and steel spouts and taps.
Filtration media
Iron nails; Activated alumina; HAIX®; AdsorpAs®, Graded sand;
Brick chips; Wood charcoal; Various oxidation and coagulation
chemicals (sodium hypochlorite, aluminium sulphate); Ceramic
membrane®; Fabric nets; Composite Iron Matrix®; Burned soil and
rice husk candle.
Storage container Various sized heavy-duty plastic tanks (Patton®, Polyxon®).
Building Brick; Cement; Wall plaster and paint; Steel caging; Tin and hard-
plastic ribbed roof sheeting; Metal gates; Wooden doors.
Table 7.1 Components used to construct the mitigation options.
The specific compositions of filtration media are largely unknown for most of the
technologies since the media is often proprietary or trademarked and thus kept secret. It is
therefore impossible to calculate a carbon footprint or conduct a cradle-to-grave ecological
assessment on them. This research assumes that all the materials used in the creation of the
filter media are sourced within India, as they are manufactured in India. The one
environmental indicator chosen to represent the design and manufacture stage is:
Source of materials/product. Distant sourcing of materials and components
increases environmental impact through their carbon footprint, for example.
0= Internationally sourced; 1= Nationally/regionally sourced; 2= Found locally
(village).

108
Table 7.2 Coded results for the environmental indicator representing input into the
mitigation options at the manufacture stage of life.
7.3 Throughputs – Operation and Maintenance
7.3.1 Energy
In India, non-renewable power plants constitute 87.55% of the installed electricity
capacity, of which coal-fired plants account for 57% (EAI, 2012). Coal pollutes when it
is mined, transported to the power plant, stored, and burned and thus has a very high
negative environmental impact when used as an energy source. India currently suffers
from a major shortage of electricity generation capacity, with a daily peak-hour power
shortfall of 13% and transmission and distribution losses of 28.4% due to theft (IPS,
2012). In 2011, over 400 million Indian citizens had no access to electricity (EAI,
2012). For these reasons, arsenic mitigation options that rely on off-the-grid, renewable
energy sources would prove more reliable and environmentally responsible. Renewable
energy is typically defined as an energy resource that is replaced by a natural process at
a rate that is equal to or faster than the rate at which that resource is being consumed
(ie. solar, wind, tidal). Some of the mitigation options utilise hand pumps, which for
Stage of
product life:Manufacture
Source of
material/
product
Coded (/2)
Tipot 1
IITB 1
BESU 1
PalT/Harbr 1
AIIH&PH 1
CGCRI 1
Dug 1
Sono 45/25 0
Nirmal 1
DRDO 1
Technology

109
this study will also be classified as renewable energy and therefore will be scored
positively.1
Renewable energy used. The utilization of non-renewable energy increases its
environmental impact and therefore maximum use of renewable options is
desirable. 0= None; 1= Partial or renewable on-grid; 2; All energy used is
renewable and off-grid (including human-power).
Table 7.3 Coded results for the environmental indicator representing energy used during
operation (throughput).
7.3.2 Creation of Toxic Waste
Whilst considerable progress has been achieved in terms of water treatment, the
disposal of arsenic-rich waste (AsRW) generated from water treatment processes is a
major issue that has received relatively little attention (Section 1.6). Arsenic removal
technologies produce several different types of waste, including sludge/spent media and
backwash slurries. Disposal of all hazardous waste requires effective management.
Unfortunately, due to the absence of clear guidelines for the safe disposal of AsRW, it is
often disposed of in an uncontrolled manner (Ashraf et al., 2003). This was also
1 Note that in the Compatibility composite indicator (Section 6.6), the use of hand pumps scored
negatively which is a good example of the existence of trade-offs present throughout the entire analysis.
Stage of
product life:Operation
Renewable
energy used
Coded (/2)
Tipot 0
IITB 2
BESU 0.67
PalT/Harbr 0.5
AIIH&PH 2
CGCRI 0
Dug 2
Sono 45/25 2
Nirmal 2
DRDO 2
Technology

110
witnessed during the field work. A common method for the disposal of sorbent filter
media and regeneration waste is dumping it into brick-lined pits, which are prone to
flooding and thus leaching into the surrounding environment. Incorporation of AsRW
into construction materials is a solution commonly cited by various technology
implementers and designers, but there is little evidence that it is routinely done. Little
research has been conducted on the effects of inhalation of arsenic-rich dust which
would be subsequently caused by erosion. Another management option for AsRW is to
convert the arsenic into a stabilized or less mobile form and isolate it from the
environment using a solidification and encapsulation process (Sullivan et al., 2010).
Such methods may be suitable for treating waste generated by various arsenic removal
technologies in West Bengal, however further research is needed to better understand
the risks. In rural locations, options for disposal are very limited. It was most commonly
observed that untreated arsenic-rich waste was dumped, buried or burned resulting in
further point-source recontamination. Increasing public awareness about the arsenic
problem might change attitudes towards the importance of correct disposal protocols of
arsenic-rich waste, thereby reducing recontamination and the added risk of further
exposure. The environmental indicators chosen to represent the operation and maintenance
stage are:
Number of disposal locations for backwash/sludge. Higher numbers increase the
geographical spread of possible point-source recontamination of arsenic.
0= >1 per village; 1= 1 per village; 2= A centralised location for several villages
(or none required).
Physical location of disposal for backwash/sludge. The degree of public access to
the location and choice of land versus water disposal will also affect the degree of
recontamination of arsenic.

111
0= A totally public space with open access that is widely used and/or disposal into
a dynamic location (typically water: pond, river, aquifer; air: disposal by burning)
or alternatively, non-transparency of disposal details; 1= A limited-access location
that is less commonly used thus minimising contact with the general public and
disposal into a static-site like a lined pit with no access to groundwater or surface
water sources; 2= A controlled-access static-site that is not open to the public or
easily accessible; or alternatively, no disposal is needed.
Method of disposal of backwash/sludge. The species of arsenic will affect the
degree of mobility within the environment and thus likelihood of recontamination.
Therefore the arsenic-rich waste should be chemically treated to reduce this
possibility. 0= No control of arsenic speciation, or disposal ‘as-is’; 1= Arsenic is
chemically converted to a less mobile state; 2= Disposal of arsenic in a
professional manner so that there is no or extremely limited possibility of
recontamination on the scale of 50 years; or alternatively, no disposal is needed.
Transport of waste. Spillage is less likely to occur if the number of movements of
waste is restricted, and when it is handled by trained operators and not untrained
members of the public. 0= Users/operators are meant to transport waste to the
disposal location by their own means; 1= Users/operators transport waste to a
central location and the supplier collects the waste from the central location and
transports it to the disposal site; 2= The supplier comes to collect the waste from
every individual mitigation location and transports it to the disposal site, or no
waste created.
Third party verification of waste disposal method. Self-regulation does not
significantly reduce pollution (Morgenstern and Pizer, 2007) therefore disposal
methods that have been approved by a third party will have fewer negative
environmental impacts.

112
0= No verification; 1= Self-verification completed; 2= All aspects of waste
production, transport, and disposal have been verified by a third party to avoid all
harm to people and the environment over the system’s life cycle (50 years).
Table 7.4 Coded results for the environmental indicator involving toxic waste during the
operation and maintenance stage of life.
There was sometimes a difference between what manufacturers/implementer
claimed to be the procedure for waste management (in literature and/or interview)
compared to what was witnessed during the field work. The scorings in Table 7.4 are
based on what was witnessed. For example, according to the NGO in charge of the DRDO
technology, the arsenic-saturated balls are collected by the NGO and safely disposed of by
converting the waste into bricks. However in actuality, villagers were told to burn or bury
the ball. One villager hung the balls in his tree thinking it was safer up there than buried in
the ground (Photos 7.1 and 7.2). Several trips to the brick factory were planned with the
help of the NGO involved with the implementation of the DRDO, however a different
excuse was given for cancelling at the last minute each time. The final reason given was
Stage of
product life:
Number of
disposal
locations -
Backwash
Location
of waste
disposal -
Backwash
Method of
Disposal -
Backwash
Number of
disposal
locations -
Sludge
Location of
waste
disposal -
Sludge
Method of
Disposal-
Sludge
Transport
of waste
Third party
verification
of waste
disposal
method
Coded (/2) Coded (/2) Coded (/2) Coded (/2) Coded (/2) Coded (/2) Coded (/2) Coded (/2)
Tipot 2 2 2 2 2 2 2 1
IITB 2 2 2 1 0 0 0 1
BESU 1 1 0 2 1 1 0.3 1
PalT/Harbr 1 0 0 1 0 1 0 1
AIIH&PH 1 1 0 1 1 0 0 0
CGCRI 1 0 0 1 1 0 0.3 1
Dug 2 2 2 2 2 2 2 1
Sono 45/25 0 0 0 0 0 1 0 1
Nirmal 0 0 0 0 0 1 0 1
DRDO 0 0 0 0 0 1 0 1
Technology
Operation and Mainanence

113
that the bricks are not made during monsoon season (the period in which the team was
present). Therefore disposal in this manner was not be verified by the field team.
Photo 7.1 The adsorbent of the Photo 7.2 Arsenic-saturated balls placed
DRDO is the ball inside the net. up a tree by the user to prevent any further
contamination.
7.4 Outputs - End of Life
In India, municipal solid waste (MSW) management and resources related to sanitation are
all the responsibility of local (city/village) government. However it is reported that none of
the municipal authorities have been very effective in managing these areas, as widespread
unregulated dumping of waste has become a serious problem across the country (Hazra
and Goel, 2009; Clancy et al., 2013). The collection, transportation and disposal of MSW
lacks appropriate infrastructure and maintenance and what does exist cannot keep up with
India’s growing population (Gupta et al., 1998). Even in large developed cities like
Kolkata, the capital of West Bengal, the city’s waste is not sorted, treated or disposed of at
an engineered landfill. In 2009, it was reported that Kolkata’s MSW was simply dumped
on land just outside the city (in Dhapa) after collection (Hazra and Goel, 2009). In rural
regions, there is often no municipal collection or regulated disposal of MSW so households

114
are responsible for disposal themselves. This explains why piles of rubbish were witnessed
during the fieldwork, in ditches and fields, in every village visited. Disposal of arsenic
mitigation equipment is a particular problem, as very little is collected by manufacturers or
disposed of properly after the installation expires or breaks. For example, 1900 arsenic
removal plants were installed in West Bengal starting in 1998. In 1999 a two year
independent study evaluated 577 installations and found that 145 (25.1%) were already
defunct and had been improperly disposed of (Hossain et al., 2005). Therefore, it is better
to use technologies that have a longer lifespan because they produce less defunct
equipment for disposal. In addition, an enforced extended producer responsibility policy
should require manufacturers/suppliers to collect the systems for recycling at the end-of-
life to reduce municipal waste creation in villages. The environmental indicators chosen to
represent the end-of-life stage are:
Lifespan. The longer the lifespan of the technology, the fewer times it needs to be
replaced, decreasing the quantity of waste generated.
0= <5 years; 1= 5-10 years; 2= >10 years.
Reuse and Recycling. Incorporating reuse and recycling into the design of the
technology will reduce the amount of waste created.
0= None; 1= Some parts are reusable/recyclable; 2= All non-toxic components are
reusable/recyclable.
Provision for end-of-life collection. Creation of a plan for collection of defunct or
expired technology which enables all recyclable and reusable parts to be acquired
and decreases the amount of waste dumped.
0= There is no provision for collection; 1= Provision for collection has been
planned but never implemented. 2= Provision for collection has been planned and
implemented successfully.

115
Table 7.5 Coded results for environmental indicators representing the end-of-life stage.
In cases like the dug wells or Tipot, where there is no above-ground technology,
the ‘reuse and recycling’ and ‘provision for end-of-life collection’ indicators still apply as
in both cases there are materials that could be salvaged at the end-of-life. With failed dug
wells specifically, the sites should also undergo a reclamation process in which the wells
are filled in so as to avoid a safety hazard.
7.5 All Environmental Indicators Combined
All the environmental indicators have been given a weighting of one except the three
indicators involving the disposal of arsenic-rich sludge which were weighted as two.
Sludge contains arsenic in significantly higher concentrations and quantities than the
arsenic-ridden backwash (Sullivan et al., 2010; Clancy et al., 2013) and thus is more of an
environmental concern, justifying the double weighting. All the indicators for the different
stages of product life have been added together to create a total score for the environmental
capital domain (Table 7.6).
Results from the total scores show that the Tipot and dug wells are significantly
more environmentally responsible as neither produces arsenic-rich waste (Figure 7.1).
BESU scores the highest out of all the technologies that actually produce arsenic-ridden
Stage of
product life:
LifespanReuse and
recycling
Provision for
end-of-life
collection
Coded (/2) Coded (/2) Coded (/2)
Tipot 2 0 0
IITB 1 0 0
BESU 2 0 0
PalT/Harbr 1 0 0
AIIH&PH 1 0 0
CGCRI 1 0 0
Dug 1 0 0
Sono 45/25 0 0 0
Nirmal 0 0 0
DRDO 0 0 0
Technology
End of life

116
waste. BESU gains points by having a central disposal centre used by technologies in the
region. It lost points because during the field work, it was observed that untreated
backwash was dumped in the field and ponds adjacent to the technologies, not in the
controlled manner which is described in literature. If BESU practised the waste disposal
procedure it claims to follow it would have scored 65 overall (rather than 46.8), which is
significantly higher than any other arsenic-removal technology. IITB does not require any
backwashing so it scored high in the backwash indicators, increasing its total score. The
other mitigation options all score around 30% or less.
Stage of
product life: Manufacture
Operation
and
maintenance
End of
life Total
Score
(/100) Technology Total /2 Total /24 Total /6
Tipot 1 21 2 75.0
IITB 1 11 1 40.6
BESU 1 11.97 2 46.8
PalT/Harbr 1 6.5 1 26.6
AIIH&PH 1 8 1 31.3
CGCRI 1 6.3 1 25.9
Dug 1 23 1 78.1
Sono 45/25 0 5 0 15.6
Nirmal 1 5 0 18.8
DRDO 1 5 0 18.8
Table 7.6 Total scores for indicators within difference stages of life, normalised out of 100.
Figure 7.1 Total scores for environmental capital across all mitigation options.
0.0
10.0
20.0
30.0
40.0
50.0
60.0
70.0
80.0
90.0
100.0Ranking of Environmental Domain

117
7.6 Discussion
There were mixed results from the questionnaire regarding importance of environmental
issues (Section 5.6). Users classified ‘environmentally friendly design’ as important (high
on the scale) yet ranked ‘amount of municipal waste generated’ low on the scale of
importance. As discussed previously (Section 6.4) awareness campaigns might influence
users’ behaviours towards arsenic-rich waste and municipal solid waste which could
influence product stewardship and help pressure manufacturers and suppliers to adhere to
extended producer responsibility protocols.
This chapter highlights several issues within the product life cycle that fall in the
environmental domain. Firstly, it was shown that India faces regular shortages and
disruptions in supply of electricity. This causes one to rethink using on-grid power in the
design of a mitigation option. Several issues related to arsenic-rich waste production and
municipal waste production were highlighted and shown to be largely unaddressed by
most of the mitigation options. Tipot and Dug wells scored highly overall because they are
arsenic-avoidance options and do not produce AsRW. Based on the literature BESU has a
good waste disposal methodology, it would also score very high (65) however practices
witnessed in the field prove contrary to these assertions resulting in a significantly lower
score (47). Despite this contradiction, it still proves to score the highest among all of the
arsenic-removal options. IITB also scored relatively high. The DRDO also claimed to have
a good disposal methodology however practices witnessed in the field were not in
accordance with this methodology. This underlines the need for all parts of a mitigation
project to be properly designed for sustainability and for supervision to ensure that
prescribed best-practices are followed.
An important question suggested in this chapter is how to drive environmental
improvement when it is not a high priority for users (as demonstrated in the survey). Since

118
self-regulation or voluntary programmes do not significantly reduce pollution
(Morgenstern and Pizer, 2007; Gamper-Rabindran et al., 2013) the involvement of third
party verification has been added to the list of indicators. There is clearly a strong need for
institutional intervention and cooperation (government, local authority, NGOs) to regulate
the arsenic-mitigation sector. First, the creation and enforcement of product
stewardship/extended producer responsibility policies could better control the material
flow throughout a product’s life and reduce environmental impacts. Second, creation of a
separate and parallel waste collection and/or management system could prevent further
widespread point source recontaminations and thus reduce potential future exposure.
Finally, implementation of an arsenic awareness campaign would help influence the
attitudes and behaviours of users both to encourage utilization of the technologies and also
in promoting safe waste disposal practices. It is clear that the governments of India and
Bangladesh need to increase their involvement in this industry through regulation, and
could start by using the indicators defined in this chapter in an EPR scheme.

119
8 Economic Domain
This chapter examines the costs in Rupees (Rupee:USA exchange rate of 60:1)
associated with each technology and issues related to those expenses. A viable
economic model is presented as an alternative to what is being practised in the field,
taking account for impacts examined in Chapters 6 and 7. A set of indicators is
presented and discussed which together provide a total score for the economic domain.
8.1 Capital Costs
Table 8.1 shows the price of purchase and installation for each technology as found in
literature or through interviews with designers and/or implementers.
Table 8.1 Capital costs of all technologies based on one village of 100 households and
ten years of operation.
The cheapest community-scale technology to purchase and install is the dug well
($700/unit) however as it only caters for 20 households (on average), to service an
entire village of 100 households requires five wells, and thus the total multiplied by
five. For the same reason, the purchasing costs of the household-scale technologies
Technologies# of
units
Cost of
Purchase and
Installation
(per village)
Initial
Subsidy
(village pays
difference)
Life
span
(yrs)
Total
Capital Cost
(for 10 yrs)
Tipot 1 420,000 420,000 10 420,000
IITB 1 80,000 80,000 10 80,000
BESU 1 200,000 200,000 10 200,000
PalT/Harbr 1 300,000 300,000 10 300,000
AIIH&PH 1 105,000 105,000 10 105,000
CGCRI 1 350,000 350,000 10 350,000
Dug 5 210,000 210,000 10 210,000
Sono 45/25 100 250,000 240,000 2 1,240,000
Nirmal 100 80,000 77,500 2 397,500
DRDO 100 200,000 190,000 5 390,000

120
were multiplied by 100. Most of the initial capital costs are paid for through NGO
donations and/or government funding, with small amounts paid for by users in the case
of the household-scale technologies. Since the household-scale technologies have an
expected lifetime of less than ten years, replacement is required. As no further subsidy
is expected, the replacement cost is the full price of the technology, which significantly
increases the total cost for the household-scale technologies over ten years. Considering
these high costs and the variability of both NGO and government funds, it is not
realistic to assume that replacements for household-scale or community-scale options
will be paid for in the future.
8.2 Recurring Costs and Income
Table 8.2 presents costs and income related to each arsenic mitigation option.
Table 8.2 Recurring costs and income for all options, per village per year in Rupees.
8.2.1 Wages
All mitigation options require an operator yet only two systems (BESU and PalT/Harbr)
have included provision of payment for their time and efforts. The operators who are
Electricity
[-]
Wage of
operator
[-]
Replaceable
materials
[-]
Total
[-]
Utilisation
(%)
Tariff
charged (for 20L/day)
[+]
Total
(Tariff*Util)
[+]
Tipot 1 3,900 0 120 4,020 22 0 0 -4,020
IITB 1 0 0 1,200 1,200 71 0 0 -1,200
BESU 1 6,000 13,800 10,000 29,800 68 48,000 32,736 2,936
PalT/Harbr 1 11,400 11,350 10,500 33,250 58 60,000 34,920 1,670
AIIH&PH 1 0 0 900 900 18 12,000 2,148 1,248
CGCRI 1 12,000 0 120 12,120 13 120,000 15,120 3,000
Dug 5 0 0 900 900 53 0 0 -900
Sono 45/25 100 0 0 0 0 30 0 0 0
Nirmal 100 0 0 20,000 20,000 8 0 0 -20,000
DRDO 100 0 0 20,000 20,000 37 0 0 -20,000
Net
Income
(/village
/year)
Technologies# of
units
Operating Expenses (Fixed) Income

121
unpaid are potentially losing income (opportunity cost) by spending time working for
free instead of working for money. Making no wage means less incentive to do the job
properly, efficiently or even regularly. The wages that are being paid are only 30-33%
of the median household income (4500 Rupees/mnth; $75/mnth) (Section 5.2). These
particular technologies are located in villages with the highest local median incomes in
the sample, with the operators of BESU being paid 19% of the local median monthly
wage for halftime hours, and PalT/Harbr operators being paid13.5% of the local median
income for fulltime hours. Sustainability requires that workers receive recognition
through wage or some profit-share arrangement, otherwise the system is unstable.
The household-scale technologies are operated by someone from within the
home so an operator is not paid. However the prolonged use of the Nirmal and DRDO
models relies upon the adsorbent being replaced/regenerated, for which a third party is
responsible. The successful long-term use of these options is thus dependent on
someone providing maintenance support reliably, which was not observed to happen in
any of the households visited. The users of the Nirmal were not aware of who they
should contact to get the adsorbent regenerated. It was believed that person had moved
away and nobody else had been trained as a replacement. The users of the DRDO
claimed that the supplier of the adsorbent replacement (one local man in the
community) inflated prices depending on his personal relationship with the buyer. He
apparently received no salary, only profiting from the products sold, thereby creating
incentive for price inflation. Some users of the DRDO were then forced either to pay
higher prices or choose to abandon use of the system, which is what many families have
done. These examples highlight the importance of project management and supervision
(even if informal) to ensure quality control, to provide training and ensure ethical
practice of workers.

122
8.2.2 Ownership and Profit
Operators of the AIIH&PH and CGCRI options were granted ownership over the
technology and encouraged to use it as an entrepreneurial venture, so that any profits
made were theirs to keep. The problem witnessed (while conducting field surveys)
regarding this economic model, is that villagers resent the fact that any one individual
might profit from selling them water, a necessity for survival. In these communities
many individuals were critical of those profiting from sale of water and spoke openly
about rejecting the use of these systems for this reason (Sections 2.1.5 and 2.1.6). In
contrast, the PalT/Harbr systems generate a large profit which is promoted to the
community as offering reinvestment through social programmes. This type of scheme
did not cause such resentment among villagers. Also, PalT/Harbr systems were installed
on the land of a municipal government office and a hospital, not on private
homeowner’s land, which added legitimacy to the venture.
8.2.3 Consumables
The costs of replaceable materials for BESU and PalT/Harbr are high because the
adsorption media require replacement or regeneration at a cost of 10 000 Rupees per
year (BESU) or 42 000 Rupees every two years (PalT/Harbr). The AIIH&PH requires
chemicals to be replaced weekly and dug wells require chemicals to be added monthly
(depending on weather). The Nirmal requires regeneration of media (like BESU) and
DRDO replacement of media, both of which cost 200 Rupees per year. All the other
options should only require minimal (nuts and bolts) level of maintenance with the
SONO 45-25 not requiring any.

123
8.2.4 Tariff and Associated Issues
As there is no monthly tariff charged for treated water from the Tipot or IITB options,
all monthly costs are paid by the operator. In the case of the Tipot, the monthly costs
were originally paid through a five-year grant given to a local NGO. When the funding
stopped the operator went door-to-door to the users to ask for contributions to help
cover the monthly costs but as they had no means by which to contact the NGO to
confirm the operator’s story, they refused to contribute. The NGO in charge of the dug
wells pays all costs, providing water for free to everyone. Having NGOs pay recurring
costs is not economically viable in the long-term, as it is uncertain for how long the
subsidy will be provided. Consumers were found to not understand the time-limited
nature of financial support for NGO water schemes. During field work, those whose
free-water schemes had come to an end displayed resentment or lack of understanding
that money from rich donors was no longer available, and thus refused to pay.
Ahmad et al. (2005) found significant resistance to pay for arsenic-treated water
and commented that this might reflect the long latency period of arsenicosis and the
limited availability of information about the levels and dangers of arsenic
contamination. This finding implies that more costly arsenic mitigation options may
find little acceptance amongst users. Therefore increased knowledge and awareness
might enhance the acceptability of arsenic mitigation options and make conditions more
favourable for successful implementation. Khan and Yang recently surveyed
households in rural Bangladesh and found that 56% of villagers believe that water
should not be provided free of cost, while 44% of households believe that state should
provide water free of cost because access to water is a basic human right (Khan and
Yang, 2013). Therefore it is likely that there is still strong resistance to the idea of
paying across all of Bengal.

124
In the case of the household-scale options, the users themselves are meant to pay
any recurring costs however the majority stopped using the technology when any
replacement part required purchasing. The users of the PalT/Harbr and CGCRI are
spending 1.1% and 3.3% of their median income on treated water and AIIH&PH and
BESU users are spending 0.2-0.3%. Chamberlain et al. surveyed households in
Cambodia and found that villagers were willing to pay between 1.5% and 2.0% of their
monthly household income on arsenic-treated water (Chamberlain et al., 2014). In
America, the average household spends $51 on water utilities each month (Leak Bird,
2009) which equates, on average, to 1.2% of their monthly income1 (Noss, 2013). In the
United Kingdom, a charge of 2% income spent on water is seen as threshold indicating
hardship (UNDP, 2006). During the field work, there were many complaints that the
monthly tariff charged for treated water was too high (even in the cases of AIIH&PH
and BESU). Therefore financial provision should be made for the poorest households in
every community, to ensure they are not priced out of the market.
Roy et al. (2008) determined that reducing arsenic concentration in a family’s
drinking water incurs a saving of R297 per month by reducing sick-days and avoiding
medical bills. This benefit more than covers the estimated monthly tariff shown in Table
8.2 and in the suggested scheme described in Section 8.3.2 (including delivery). The
surplus results in a slight increase in disposable income for every family. As it is
estimated that around 100 million people are affected by arsenic contamination in
Bengal, the savings proposed by Roy et al. would add approximately 57 billion Rupees
to potential spending in the region2 (~$950 million). It is therefore in the best economic
interest of both the household and government to reduce arsenic in drinking water.
1 Median American household income in 2012 was $51,324 (Nos, 2013).
2 R297 Savings/month/family; 100,000,000 people with 5 people/family = 20,000,000 families
Arsenic-free water estimated to cost R60/month/family (Section 8.3.2); Net savings per family per month
= R297 – R60 = R237; R237*12mnths*20,000,000 families = Total Net Savings of R56. 9 billion/yr.

125
8.2.5 Other Recurring Costs
The list of recurring costs in Table 8.2 does not include several other expenses that
would feature in a more sustainable scheme. For example, regular laboratory testing to
ensure the removal of arsenic from treated water would improve confidence in the
system and affect utilization (Section 6.2), but it is not being done regularly at present.
Options for delivery (door-to-door), a feature that would make the treated water more
convenient for the users (Section 6.3) are also not offered. Additionally, there are no
financial provisions made for disposal costs of toxic arsenic-ridden waste created during
operation or any municipal waste created at the end of the technology’s life. This waste
commonly dumped in public spaces presenting a potential future hazard (Section 7.4).
8.3 A Viable Economic Model for Community-Scale Systems
Community-scale systems are more economically viable and environmentally
responsible because they have lower replacement costs and produce less waste than
household-scale technologies. Similarly, Khan and Yang (2013) concluded that
community based systems allow for better water management, provides wider safe
water coverage and also reduces the risk of localized contamination of the aquifer. A
viable economic model for a community-scale system is described below, taking
account of impacts outlined in previous chapters.
8.3.1 Modelled Capital Costs
All initial capital costs are to be paid for by the government or donated by an NGO.
Capital costs include the price of the purchase and installation of the system and an
initial gift (or loan) of R10,000 ($167) as start-up working capital. In addition, all
lifetime costs related to toxic waste disposal are to be considered an additional capital
cost and to be paid for by the government (as it is in the country’s best interest for

126
proper disposal). Proper control of waste is important for the wider community and
future generations. This will require the creation of a toxic waste collection and disposal
industry. As required by extended product responsibility protocols, it will be the
responsibility of manufacture and suppliers to organise and manage a contract for
regular collection and disposal of toxic waste.
The lifespan of any community-scale technology is largely uncertain, however it
can be anticipated that every technology will require upgrading and in the worst case,
replacement after approximately ten years. With this in mind, users will be charged a
yearly fee which will help pay for these expenses when required. This fee is considered
‘future capital’ and is accumulated in a fund which provides for contingencies and for
system replacement at end-of-life. The fee is set at R180 per year for each household
(R15/mnth) and can be considered a type of membership or rental fee, allowing use of
the facility. As shown in Table 8.3 the reserve accumulated in ten years of operation is
R176,600. Reference back to Table 8.1 shows that this sum will purchase a new
installation of some but not all the technologies included in this study. It may however
not be necessary to purchase an entirely new installation. The figures in Table 8.3
should therefore be taken as illustrative. Precise costs will vary according to the
technology chosen. The household-scale technologies would cost significantly more and
thus this modelled scheme only considered community-scale technologies as financially
viable. Due to the involvement of the manufacturer or supplier throughout the system’s
lifetime, access to upgrades and repairs should be made easy. It is also the responsibility
of the manufacturer or suppliers to remove and recycle all defunct parts and materials,
at their expense which needs to be considered in the price of the initial purchase.

127
8.3.2 Modelling of Revenue Account
Table 8.3 shows modelled figures for recurring expenses over a period of ten years for a
community of 100 households. Taking 1% of the median household income as a
realistic figure to charge households on a monthly basis, results in a tariff of 45
Rupees/month3. According to the field survey (Q110), the maximum amount users are
willing to pay (on average) as a monthly tariff for arsenic-free drinking water is R45,
the same figure. Delivery is included as standard in this scheme, but a household can
opt-out of delivery and save R15 per month if they choose to do so. The wage of the
delivery person is R250/mnth with a R15 per house commission (Photo 8.1). The
operator receives a wage of R1150/mnth with a commission of R5 per house. Both
operator and delivery person are hired on a part-time basis. Assuming a minimum of
50% utilisation of a technology within a village for the first year, the tariff would
generate R2250/mnth. Results are based on a 10% increase in utilisation from years 1 to
5 as the technology is promoted by the operator and delivery person. The maximum
village utilisation is 90% as the remaining 10% are likely to be households below the
poverty line who receive treated water delivered for free. If all the employees (operator
and delivery) are women, then no primary breadwinners (typically men) are taken away
from their primary work, thus increasing household wage instead of decreasing it. The
surplus at the end of ten years can accommodate any increase in costs over that time
period.
3 Khan and Yang (2013) determined that the maximum households in Bangladesh are ‘willing-to-pay’ as
a monthly treated-water tariff is 50 BDT which is equal to 41 Indian Rupees.

128
Photo 8.1 Bicycle rickshaw used for door-to-door water delivery.
Using this model, an initial R10,000 gift or loan of seed money is needed to
cover initial operating costs and to be used as a reserve in case any unexpected repairs
are required. The system will break even at 80% utilisation at which point the decision
can be taken to accumulate profit, repay the loan or save money for system replacement.
The initial gift/loan of working capital will be given by the donor of the system and is to
be included in the initial capital costs. All costs (including the potential loan), will be
managed by the operator and overseen by an all-female water committee.4
This model budgets for arsenic testing to be conducted by a laboratory twice per
year (R2,500/test). No costs for power are considered in this model, as the technology
will be designed to use solar energy that is off-grid and renewable. Only a small
financial provision is made for replaceable materials, which assumes the technology
will be robust and not require much repair, and that needed chemicals, adsorbents and
other consumables are inexpensive. If large repairs are needed, product warranty should
be upheld under the extended product responsibility protocols. In the event that a large
scale repair is not covered by warranty, or if some other unforeseen need for
expenditure arises, the accumulated profit offers a contingency fund.
4 It has been shown in field practice that a water committee that is entirely female will prove to be more
successful than a co-ed or all male committee (Ecofiltro, 2012).

129
Table 8.3 Modelled figures for recurring expenses over a period of ten years for 100
households, Rupees.
8.4 Indicators of Economic Capital
The discussions in Sections 8.1 and 8.2 about the actual costs show that though some
technologies are making profits, they may be missing important expenses in their model
through not paying a fair wage to workers or pricing out the poorest in the community.
In this section a set of indicators is described which covers the full range of economic
impacts within the village. Thus we are considering impacts which are a financial
burden for the village community. Indicators which represent capital costs within the
economic store of value are:
Initial Capital: Cost of the purchase and installation of the system and
disposal/recycling of the system at end-of-life, as well as seed money to aid in
the first few years of operating costs, being pay for externally, increases the
likelihood of long term use. 0= Users required to pay all costs; 1= The cost of
purchase and installation is paid for by the government or NGO; 2= Cost of
purchase, installation, removal and seed money is covered by government or
NGO.
Household
Tariff
[+]
Rental/
User Fee
[+]
Total
[+]
Operator's
Wage
[-]
Testing
2x/yr
[-]
Replaceable
Materials
[-]
Delivery
Costs
[-]
Total
[-]
0 0 0 0 0 0 0 0 0 0 0 10000
1 50 27000 9000 36000 16800 5000 300 12000 -34100 1900 11900
2 60 32400 10800 43200 17400 5000 300 13800 -34700 8500 20400
3 70 37800 12600 50400 18000 5000 300 15600 -38900 11500 31900
4 80 43200 14400 57600 18600 5000 300 17400 -39500 18100 50000
5 90 48600 16200 64800 19200 5000 300 19200 -43700 21100 71100
6 90 48600 16200 64800 19200 5000 300 19200 -43700 21100 92200
7 90 48600 16200 64800 19200 5000 300 19200 -43700 21100 113300
8 90 48600 16200 64800 19200 5000 300 19200 -43700 21100 134400
9 90 48600 16200 64800 19200 5000 300 19200 -43700 21100 155500
10 90 48600 16200 64800 19200 5000 300 19200 -43700 21100 176600
Year
Village
Utilisation
(%)
OutgoingsIncomings
Cumulative
Total
Net
Income
(/year)

130
Future Capital: Provision to pay the expenses for end-of-life replacement or
large scale repair is needed for long-term sustainability.
0= No plan; 1= Fees paid by users to cover partial costs, or reliance on external
body for funds; 2= Stipulation of regular fee paid by users which will pay for all
future costs.
The initial capital costs do not form a burden for the community as long as they are not
being paid by the user. However less expensive technologies may be deployed in a
larger number of villages, which increases regional impact when only a set amount of
government or NGO investment is available.
Indicators for recurring income and outgoings are:
Viable Monthly Tariff: A tariff within the economic means of a household aids
in the payment of monthly expenses ensuring a system’s long-term operation.
0= free or households are required to pay >1.5% of median monthly income;
1= 1% to 1.5%; 2= ≤1%.
Users below poverty line: Economic arrangement for free access for people
within the community who are below the national poverty line5 to ensure
availability for all demographics.
0= No arrangement exists; 1= Arrangement exists informally, with the service
available only after private discussion. 2= Arrangement is openly advertised,
widely known and easy to access.
Replaceable Materials: The cost of all replaceable and/or regenerable materials
being accounted for within the budget ensures the continued operation of the
technology.
5 The international poverty line is set at an income level of $1.25 per day (World Bank, 2013). The
national poverty line for rural India is set at R816/mnth ($0.34 per day) per person, which is R3264 per
month for a family of four (Planning Commission, 2009).

131
0= Materials are not accounted for; 1= The cost of materials is partially
accounted for; 2= Costs of materials are wholly accounted for in the budget or
none are required.
Power: Power costs must be accounted for within the budget to enable the
system to remain operable. 0= Costs for power are not accounted for in the
budget; 1= Costs are only partially accounted for in the budget; 2= Costs are
wholly accounted for in the budget or there are no power expenses at all.
Lab Testing: Regular laboratory testing of treated water is included in the
budget. 0= No testing accounted for; 1= One test per year budgeted for; 2= >1
test per year is accounted for in the budget.
Delivery: Affordable delivery will increase the convenience of the system,
encouraging use. 0= Delivery is not an option; 1= Delivery is available but costs
are unaffordable to the average family (≥0.5% of median monthly income);
2= Delivery is free or available at an affordable price (<0.5% of median monthly
income).
Wages: Having everybody in the supply chain (operator, supplier and delivery)
paid a fair wage will increase the chances that all operational and maintenance
procedures are being followed, improving the likelihood the system will
continue to function. 0= No wages; 1= Wages are meant to be paid but are not
explicitly budgeted for so may be infrequent; 2= Every person in the supply
chain is paid fairly (based on local salaries) and the wage is budgeted for,
ensuring the wage is paid regularly.
8.5 Total Scores for Economic Domain and Discussion
The economic indicators for every technology are presented in Table 8.4 and Figure 8.1.
They are all given a weighting of one except monthly tariff which has been weighted

132
double because costs (tariff) was rated ‘very important’ in the household survey, and the
collection of a fair and affordable tariff is essential for long term sustainability.
BESU scored higher in the Economic Domain than the other technologies,
though it still lacks in several important areas. AIIH&PH, PalT/Harbr and CGCRI also
ranked relatively highly and the Tipot scored the lowest. The four highest ranking
technologies are the only options that generate profit, shown under Net Income in
Figure 8.2. Out of the community-scale options in Figure 8.2, the Tipot also generates
the greatest loss. The relative ranking of technologies proves to be similar between the
total score in the Economic Domain and in Net Profit; however the economic indicators
present a more detailed and meaningful contextual understanding of a technology’s
economic advantages and disadvantages.
Table 8.4 Individual and total scores for economic indicators across all technologies.
Initial
Capital
Future
Capital
Viable
Monthly
Tariff
Users
Below
Poverty
Line
Replaceable
MaterialsPower
Lab
Testing Delivery Wages
Coded (/2) Coded (/2) Coded (/2)
Weight: x2 Coded (/2) Coded (/2) Coded (/2) Coded (/2) Coded (/2) Coded (/2)
Tipot 1 0 0 2 0 0 0 0 0 15
IITB 1 0 0 2 0 2 0 0 0 25
BESU 1 0 4 1 2 2 1 1 1 65
PalT/Harbr 1 0 2 0 2 2 0 0 2 45
AIIH&PH 1 0 4 0 2 2 0 0 1 50
CGCRI 1 0 0 1 2 2 0 1 1 40
Dug 1 1 0 2 0 2 0 0 0 30
Sono 45/25 1 0 0 0 2 2 0 0 2 35
Nirmal 1 0 4 0 0 2 0 0 0 35
DRDO 1 0 4 0 0 2 0 0 0 35
Technology
Capital Recurring
Total
Score
(/100)
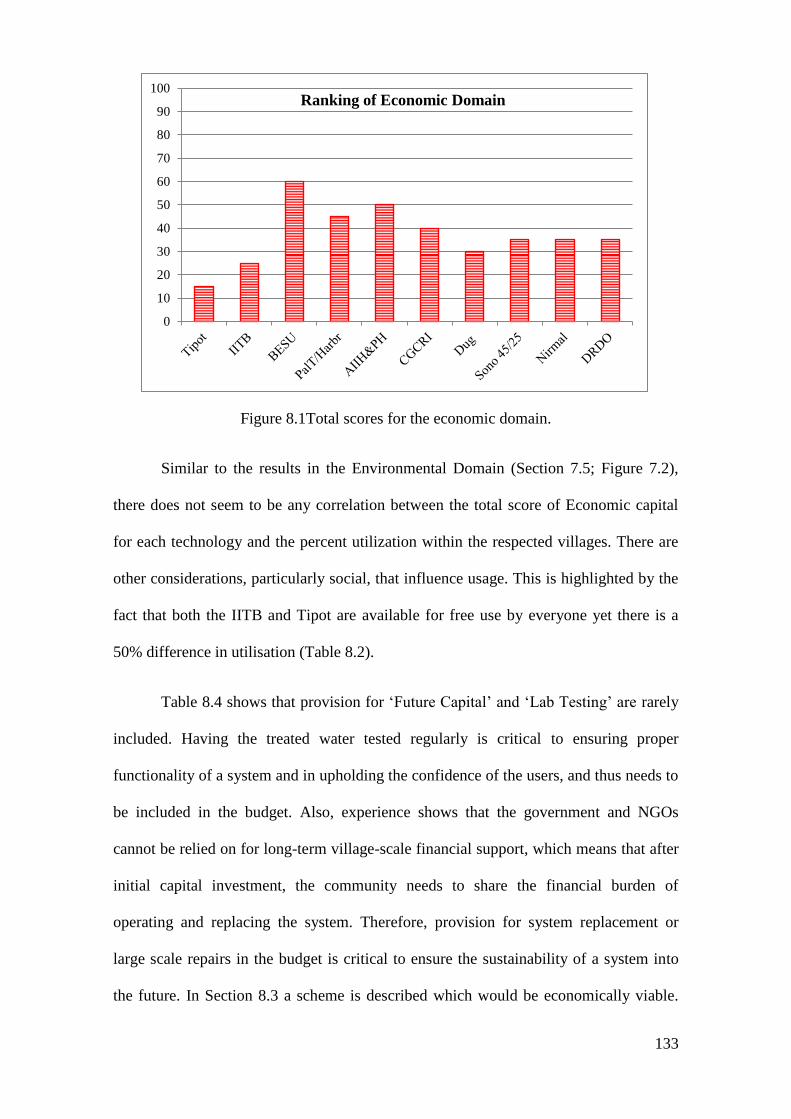
133
Figure 8.1Total scores for the economic domain.
Similar to the results in the Environmental Domain (Section 7.5; Figure 7.2),
there does not seem to be any correlation between the total score of Economic capital
for each technology and the percent utilization within the respected villages. There are
other considerations, particularly social, that influence usage. This is highlighted by the
fact that both the IITB and Tipot are available for free use by everyone yet there is a
50% difference in utilisation (Table 8.2).
Table 8.4 shows that provision for ‘Future Capital’ and ‘Lab Testing’ are rarely
included. Having the treated water tested regularly is critical to ensuring proper
functionality of a system and in upholding the confidence of the users, and thus needs to
be included in the budget. Also, experience shows that the government and NGOs
cannot be relied on for long-term village-scale financial support, which means that after
initial capital investment, the community needs to share the financial burden of
operating and replacing the system. Therefore, provision for system replacement or
large scale repairs in the budget is critical to ensure the sustainability of a system into
the future. In Section 8.3 a scheme is described which would be economically viable.
0
10
20
30
40
50
60
70
80
90
100Ranking of Economic Domain

134
This scheme uses the survey results regarding the users ‘willingness to pay’ as a basis
for determining a viable tariff. It includes provision for testing and delivery, pays wages
where they are needed, and covers all costs. It builds a financial reserve so as to enable
investment in replacement equipment.
Ensuring an arsenic-free water source is sustainable requires an affordable and
context sensitive economic model for system implementation, operation and
replacement. As previously discussed, it will also require significant government
involvement and regulation. In particular, a large-scale arsenic-awareness campaign
would serve to increase utilization of arsenic mitigation technologies. The creation of
extended product responsibility protocols and the development of a toxic waste removal
and disposal industry would ensure no further environmental contaminations, lowering
the risk of future exposure in communities. Large-scale government regulation and
involvement will result in decreased household exposure to arsenic. Decreasing arsenic
exposure was shown to benefit households financially, thereby aiding in improving the
economy of the entire region. Implementing a sustainable solution to the arsenic
problem will not only improve lives through better health but also through the improved
financial position of affected households.

135
9 Aggregation and Conclusions
In this chapter the mitigation options are compared within the context of the triple-
bottom-line sustainability assessment. The construction of an aggregated sustainability
index is discussed, followed by the final conclusions and recommendations for future
work.
9.1 Comparison
Technology Sociocultural
(/100)
Environmental
(/100)
Economic
(/100)
Tipot 36.6 75.0 15.0
IITB 56.4 40.6 25.0
BESU 53.4 46.8 65.0
PalT/Harbr 53.5 26.6 45.0
AIIH&PH 28.3 31.3 50.0
CGCRI 31.4 25.9 40.0
Dug 46.9 78.1 30.0
Sono 45/25 38.0 15.6 35.0
Nirmal 29.1 18.8 35.0
DRDO 39.1 18.8 35.0
Table 9.1 Total scores for all capital domains are normalised.
Figure 9.1 Comparing the normalised total scores of all capital for each technology.
0.0
10.0
20.0
30.0
40.0
50.0
60.0
70.0
80.0
90.0
100.0Sociocultural Domain
Environmental Domain
Economic Domain

136
The total scores for the three capital domains (Chapters 6, 7 and 8) are shown in
Table 9.1. The scores have been normalised each to the scale 0-100, and are presented
for comparison in Figure 9.1. Based on these results it can be concluded that not one
arsenic mitigation option is sustainable, as defined by this research. BESU ranks
relatively highly within all modes of capital, but is only the leader in one domain
(economic). Even BESU scores only within 47-62% of the maximum achievable within
each capital domain and therefore all technologies demonstrate much scope for
improvement. The others score relatively highly in only two of the three capital
domains, with often environmental factors proving to be the least valued, except in the
cases of Tipot, IITB and Dug wells which all show high scores in the environmental
domain, but not in the economic. The AIIH&PH and CGCRI have a clear emphasis on
economics but score less well in the other types of capital.
9.2 Aggregation
The total scores for all the capital domains can be aggregated into a sustainability index
to determine which technology scores the highest overall. Table 9.2 and Figure 9.2
show a sustainability index composed by averaging the total score from the three
domains from Figure 9.1, in other words giving each domain the weighting of 1 and
normalising out of one hundred. However when in this form, significant information is
lost making it less valuable than the results presented in the three-tiered style shown in
Figure 9.1. For example, the sustainability index shows comparable scores between the
Tipot and IITB which at first glance would suggest a similarity between them, however
the distribution shown in Figure 9.1 illustrates otherwise. The results from the triple-
bottom-line breakdown (Table 9.1 and Figure 9.1) can be better used by designers and
implementers to make improvements throughout all three stages-of-life.

137
Technology Aggregated
Total (/100)
Tipot 42.2
IITB 40.7
BESU 55.1
PalT/Harbr 41.7
AIIH&PH 36.5
CGCRI 32.4
Dug 51.7
Sono 45/25 29.5
Nirmal 27.6
DRDO 31.0
Table 9.2 Averaged domain scores to create a sustainability index (all three domains
given a weighting of 1).
Figure 9.2 Averaged sustainability results for each mitigation option.
Our definition of sustainability (3.3.2) specifies that a mitigation option must
meet societal needs, and indeed that is its primary purpose. Fieldwork shows that many
technology deployments fail to meet needs adequately, and are either not utilized are
quickly abandoned. A composite sustainability index for mitigation options should
therefore give a substantial weighting to socio-cultural score. Fieldwork also reveals
that, without a plan for financial continuity, the risk of abandonment is again high.
Financial provision must also be made for the poorest people, who would otherwise be
0.0
10.0
20.0
30.0
40.0
50.0
60.0
70.0
80.0
90.0
100.0Sustainability Index
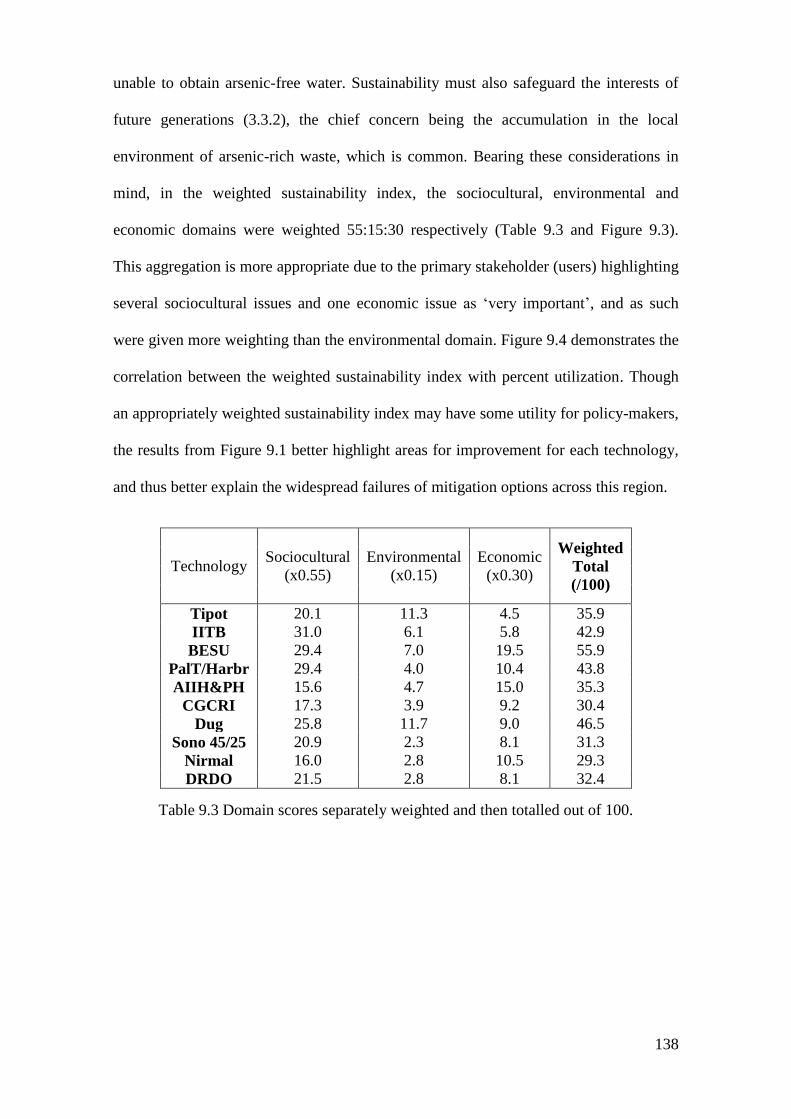
138
unable to obtain arsenic-free water. Sustainability must also safeguard the interests of
future generations (3.3.2), the chief concern being the accumulation in the local
environment of arsenic-rich waste, which is common. Bearing these considerations in
mind, in the weighted sustainability index, the sociocultural, environmental and
economic domains were weighted 55:15:30 respectively (Table 9.3 and Figure 9.3).
This aggregation is more appropriate due to the primary stakeholder (users) highlighting
several sociocultural issues and one economic issue as ‘very important’, and as such
were given more weighting than the environmental domain. Figure 9.4 demonstrates the
correlation between the weighted sustainability index with percent utilization. Though
an appropriately weighted sustainability index may have some utility for policy-makers,
the results from Figure 9.1 better highlight areas for improvement for each technology,
and thus better explain the widespread failures of mitigation options across this region.
Technology Sociocultural
(x0.55)
Environmental
(x0.15)
Economic
(x0.30)
Weighted
Total
(/100)
Tipot 20.1 11.3 4.5 35.9
IITB 31.0 6.1 5.8 42.9
BESU 29.4 7.0 19.5 55.9
PalT/Harbr 29.4 4.0 10.4 43.8
AIIH&PH 15.6 4.7 15.0 35.3
CGCRI 17.3 3.9 9.2 30.4
Dug 25.8 11.7 9.0 46.5
Sono 45/25 20.9 2.3 8.1 31.3
Nirmal 16.0 2.8 10.5 29.3
DRDO 21.5 2.8 8.1 32.4
Table 9.3 Domain scores separately weighted and then totalled out of 100.

139
Figure 9.3 Weighted sustainability results for each mitigation option.
Figure 9.4 Percent utilization plotted against weighted sustainability index.
9.3 Reasons for Failure
The values determined to be ‘very important’ by users were arsenic awareness, trust-
confidence, convenience and cost. Three of these four issues are sociocultural and
therefore understanding the reasons for failure is mainly related to the sociocultural
domain. Technologies which do not score highly in this area tend to be unattractive to
0.00
10.00
20.00
30.00
40.00
50.00
60.00
70.00
80.00
90.00
100.00Weighted Sustainability Index
0.0
10.0
20.0
30.0
40.0
50.0
60.0
70.0
80.0
0.0 20.0 40.0 60.0 80.0
Per
cent
Uti
liza
tion
Weighted Sustainability Index
Tipot
IITB
BESU
PalT/Harbr
AIIH&PH CGCRI
Dug
SONO 45-25
Nirmal
DRDO

140
potential new users; and if something goes wrong, the technologies are more readily
discarded.
Lack of public awareness is one major aspect related to the widespread failure of
arsenic-mitigation options. Improving awareness of the arsenic problem in general
would result in a better understanding of the need to use a mitigation option. Raising
awareness would correct the misconceptions related to the chemical properties of
arsenic (ie. arsenic is removed by boiling; arsenic turns water red), and would improve
the health knowledge associated with chronic arsenic exposure (like dispelling the
confusion with infectious disease). Lastly, awareness programmes would spread a better
understanding of the risks associated with arsenic-rich waste changing attitudes to
uncontrolled dumping.
Many mitigation options encounter technical problems, but as this research
shows, many projects fail despite having the ability to repair or replace because of the
poor way the technology is perceived and deployed at village-scale. Table 6.7 highlights
the indicators that meet the needs and expectations of the users in Bengal. This suggests
the need for community involvement to enhance trust and appropriate product design to
boost confidence.
Mitigation options also fail for reasons related to inconvenience. Time spent
filtering (flow rate) and time spent walking to the collection site (distance) all take away
from the time spent on daily duties. Most stakeholders believed that a range of 0–250 m
and 10–30 minutes per trip was a reasonable distance and time for water collection.
Therefore any design or implementation feature that will improve the convenience to
users will probably improve uptake and continued use of the technology by households.
Cost (tariff) is also a reason for failure, as it is not yet widely accepted that one
must pay for treated water because households can obtain untreated water without

141
payment. There is also a connection between the lack of willingness-to-pay and the long
latency period of arsenic-related ailments. Stakeholders stressed that regular awareness
programs would help to develop the concept of “paying for water” in their rural
community.
9.4 Improvements
This section discusses best practice standards as determined in this study, and makes
suggestions for improvement in areas of product design, implementation and policy
creation.
9.4.1 Product Design
This research concludes that the user-centred approach to design is the most appropriate
framework to help understand reasons for failure of arsenic mitigation technologies.
This approach suggests that several improvements within the Product Design and
Manufacture stage-of-life are required. Designing a product with professional
appearance was highlighted as important by the users. Taste and smell (quality) of the
treated water, and convenient rate of flow was also stressed. The user prefers the system
to have minimal or no maintenance, and to be easy for an untrained person to operate.
The technology needs to be designed using parts that are easily accessible to rural
villages. A system that is designed to be off-the-grid would solve problems associated
with the regular power-outages across the region and be more regularly used. A
technology designed to limit the amount and form of toxic waste produced lowers
potential community exposure. Overall, these results prove that a transparent, holistic,
systematic and user-centred sustainability assessment will provide the information that
technology designers and implementers need when considering improvements to ensure
satisfactory long-term use.

142
9.4.2 Implementation
During the Implementation and Operation stage-of-use, strong community involvement
is required to ensure sustainability. During the field work, it was observed that systems
managed by pre-existing clubs or groups from within the village found general
acceptance within the community and were more likely to be trusted by users. A group
managing the technology also creates a chain for accountability, which was another
issue stakeholders highlighted as important. Households seemed to have less of a
problem with paying for treated water when the community club or water committee
had a mandate to recirculate the profits back into the community for social benefit,
which should be considered best-practice. The sole-proprietor business model was
perceived as unfair, because the proprietor took financial benefit from neighbours who
needed access to clean water. Users expressed a need for transparency in the system, for
operators to be properly trained, for the regular testing of the treated water and public-
posting of the results, which all need to be organised at the time of implementation and
managed by the water committee. Convenience is vital to utilization. As users made
door-to-door delivery or home provision a very high priority, it too must be considered
during the implementation and operation phases. To ensure economic viability the users
should not be charged more than 1% of their monthly household income to pay for a
treated water tariff. The poorest households should not be financial excluded by this
tariff and therefore a multi-tiered payment plan (free) must be considered for those who
fall below the poverty line. Given the relatively high purchasing costs of systems,
having a mitigation option paid for by an external funding body (like the government or
NGO) may be the only option at the moment. Recurring and future capital costs can be
covered by financial support by the collective village over time, if a viable model like
the one outlined in this research is followed. Therefore provision for future system

143
replacement or large repairs must also be considered in the budget and managed by the
committee.
9.4.3 Policy Creation
There is a need for strong government involvement in ensuring the sustainability of
arsenic mitigation options. The creation of an awareness campaign to encourage and
facilitate deployment of mitigation options would improve acceptance amongst users, as
their purpose would be better understood and valued more. It was observed that options
for safe disposal of arsenic-rich waste were very limited in the rural environment, and
that both arsenic-ridden toxic waste and non-toxic municipal waste was often discarded
in an uncontrolled manner. This suggests the need for a government enforced waste
collection and disposal strategy alongside the implementation of enhanced product
responsibility protocols designed to systemically instil product stewardship ideals into
the life cycle of mitigation options. Improved public awareness of the levels and
dangers of arsenic contamination might change stakeholder opinion on the need for
effective disposal protocols, creating public support for such waste regulation. There is
also a need for improved guidelines for NGOs, which enforce a standard of best practice
in design and implementation of mitigation technologies. These results also show how
the sustainability assessment can identify areas where there is a need for increased
policy and regulation.
9.5 Summary and Conclusion
In this thesis, the process analysis method is applied to assess the sustainability of
options to mitigate arsenic in drinking water in rural India. Stakeholder perspectives,
gathered from a fieldwork survey of 933 households in West Bengal in 2012 played a
significant role in this assessment. This research found that the 'most important' issues

144
as specified by the technology users are cost, trust, distance from their home to the clean
water source (an indicator of convenience), and understanding the health effects of
arsenic. It is shown that utilisation of a technology is linearly related to the total
sociocultural score and thus measures to improve the sociocultural scores of mitigation
projects would help to promote successful deployment of appropriate technology.
Attitudes to cost revealed in the surveys are related to the low value placed on arsenic-
free water, as also found by other investigators, consistent with a lack of public
awareness about the arsenic problem. It is suggested that increased awareness might
change attitudes regarding payment of treated water, and towards arsenic-rich waste and
its disposal protocols. This waste is often currently discarded in an uncontrolled manner
in the local environment, giving rise to the possibility of point-source recontamination.
The sustainability assessment includes several trade-offs across the three capital
domains, accurately reflecting the complexity of the system. A model based on these
findings is outlined, which could be applied with the objective of increasing utilisation
and improving sustainability. Of the ten arsenic mitigation systems considered, the
BESU technology scored the highest in the assessment, but still only with 47-62% of
the maximum scores achievable within each capital domain. It can be concluded that
overall, no mitigation technology is deemed to be sustainable and thus explains the
widespread failure of mitigation projects across the region. However all hope is not lost,
as the indicators in the sustainability assessment show the specific areas of
improvement needed for each technology to achieve better scores and to improved long-
term viability.
9.6 Future Work
Several areas can be identified for future work. First, more emphasis needs to be put on
exploring the level of arsenic awareness in the rural community and on ways to improve

145
it; targeting campaigns to change perceptions (ignorance and misconceptions). Second,
more research is needed to create cheaper and more convenient arsenic test kits to allow
for widespread water testing. Also, it is known that a country’s general level of pro-
environmental attitude is directly proportional to economic growth (Owen and Videras,
2006), therefore as standard of living increases in India, so might peoples’ attitudes
towards the environment. This suggests that a more rigorous eco-analysis within a
sustainability assessment might be expected by future users, compared to today. There
also needs to be more research into the disposal of arsenic-rich waste. More specifically,
the effects of erosion on bricks made from arsenic-rich waste and more site-appropriate
leach tests. Additionally, the same sustainability assessment could be completed on
surface water filters. This is an arsenic-free option (different to dug wells) that requires
mainly bacteria-related treatment. Changing to surface water systems would also require
a widespread awareness campaign as using tubewells are rural communities’ choice
source, not ponds, rivers, lakes, etc. More focus needs to be on this area, to determine to
what degree surface water filtration is a sustainable option. Lastly, as naturally-
occurring arsenic has been discovered in groundwater throughout Asia and other
regions of the world, there is a need to conduct a standardised, user-centred, context-
dependant technology assessment, like this one, in these regions also.

146
Bibliography
Acharyya, S.K., Lahiri, S., Raymahashay, B.C., Bhowmik, A., 2000. Arsenic toxicity of
groundwater in parts of the Bengal basin in India and Bangladesh: the role of
Quaternary stratigraphy and Holocene sea-level fluctuation. Environmental
Geology 39(10), 1127-1137.
Ahmad, J., Goldar, B., Misra, S., 2005. Value of arsenic-free drinking water to rural
households in Bangladesh. Journal of Environmental Management 74(2), 173-185.
Ahmad, Z.M., 1972. The social and economic implications of the green revolution in
Asia. International Labour Review 105(9).
Ahmed, M.F., Rahaman, M.M., 2000. Water supply and sanitation - Low income urban
communities. International Training Network (ITN) Centre, BUET.
Ahmed, M.F., 2001. An overview of arsenic removal technologies in Bangladesh and
India. Ahmed, M.F., Ali, M.A., Adeel, Z. (eds), Technologies for Removal of
Arsenic from Drinking Water. Tokyo, Japan: United Nations University. Accessed
on February 12, 2012 from: http://inweh.unu.edu/archive/Health/docs/Ahmed.pdf
Alaerts, G.J., Khouri, N., 2004. Arsenic contamination of groundwater: Mitigation
strategies and policies. Hydrogeology Journal 12, 103–114.
Appelo, C.A.J., Postma, D., 1996. Geochemistry, Groundwater and Pollution, second
edition. Amsterdam: Balkema Publishers.
Appelo, C.A.J., Van der Weiden, M.J.J., Tournassat, C., Charlet, L., 2002. Surface
complexation of ferrous iron and carbonate on ferrihydrite and the mobilization of
arsenic. Environmental Science and Technology 36(14), 3096-3103.
Arora, M., Megharaj, M., Naidu, R., 2009. Arsenic testing field kits: some
considerations and recommendations. Environmental Geochemical Health 31, 45-
48.
Ashraf, A.M., Badruzzaman, A.B.M., Jalil, M.A., Feroze, A.M., Kamruzzaman, M.D.,
Azizur-Rahman, M., Al Masud, A., 2003. Fate of arsenic in wastes generated from
arsenic removal units. Department of Civil Engineering, Bangladesh University of
Engineering and Technology Dhaka. Accessed on March 10, 2013:
http://archive.unu.edu/env/Arsenic/Dhaka2003/12-Ali.pdf.
Axinn, W.G., 1991. The influence of interviewer sex on responses to sensitive questions
in Nepal. Social Science Research 20, 303–318.
147
Aziz, S.N., Boyle, K.J., Rahman, M., 2006. Knowledge of arsenic in drinking-water:
Risks and avoidance in Matlab, Bangladesh. Journal of Health, Population, and
Nutrition 24, 327-335.
Bakshi, A., 2008. A note on household income surveys in India. Indian Statistical
Institute. Accessed on February 14, 2012 from:
http://www.fas.org.in/UserFiles/File/S5_Bakshi_A_Note_on_Rural_Household_In
comes_in_India.pdf
Bandyopadhyay, S., Kundu, D., Roy, S.N., Ghosh, B.P., Maiti, H.S., 2002. Process for
the preparation of arsenic free water, apparatus therefor, method for the
manufacture of porous ceramics for use in pressure filtration to produce arsenic free
water - Patent granted to CSIR in Bangladesh 1003854.
Banerjee, S., 2008. Dimensions of Indian culture, core cultural values and marketing
implications: An analysis. Cross Cultural Management 15(4), 367-378.
Basu, P., Basu, P.O., 2012. Report on the implementation of cost effective house hold
arsenic remediation technology in Bihar, West Bengal and UP. Save the
Environment NGO. Accessed on March 10, 2013 from: www.stenvironment.com.
Beck, T., 1995. The green revolution and poverty in India: A case study of West
Bengal. Applied Geography 15(2), 161-181.
Becker, G.S., 1965. A theory of the allocation of time. The Economic Journal. 75, 493-
517.
Becker, S., Feyistan, K., Makinwa-Adebusoye, P., 1995. The effect of sex of
interviewers on the quality of data in a Nigerian family planning questionnaire.
Studies in Family Planning 26, 233–40.
Bengal Engineering College, 2011. The UNICEF Domestic Filter: Nirmal. Accessed on
February 20, 2013 from: http://cs.becs.ac.in/1/2/7/96/999/nirmal.htm.
Benney, M., Riesman, D., Star, S.A., 1956. Age and sex in the interview. American
Journal of Sociology 62, 143–52.
Berg, M., Luzi, S., Trang, P.T.K., Viet, P.H., Giger, W., Stuben, D., 2006. Arsenic
removal from groundwater by household sand filters: Comparative field study,
model calculations and health benefits. Environmental Science and Technology 40,
5567-5573.
Berry, L.L., Seiders, K., Grewal, D., 2002. Understanding service convenience. Journal
of Marketing 66, 1-17.

148
BETV-SAM - Bangladesh Environmental Technology Verification-Support to Arsenic
Mitigation program, 2009. Performance monitoring and evaluation of SONO 45-25
arsenic removal technology. Department of Public Health Engineering, Accessed
on March 10, 2013 from:
http://www.dphe.gov.bd/index.php?option=com_content&view=article&id=65&Ite
mid=75.
BGS/DPHE/MML, 2001. Arsenic contamination of groundwater in Bangladesh. British
Geologic Survey Technical Report Volume 2: Final Report.
Bhattacharya, P., Chatterjee, D., Jacks, G., 1997. Occurrence of arsenic-contaminated
groundwater in alluvial aquifers from delta plains, eastern India: Options for safe
drinking water supply. International Journal of Water Resources Development
13(1), 79-92.
Bhattacharya, P., Hasan, M.A., Sracek, O., Smith, E., Ahmed, K.M., Bromssen, M.V.,
Hug, S.M.I., Naidu, R., 2009. Groundwater chemistry and arsenic mobilization in
the Holocene flood plains in south-central Bangladesh. Environmental
Geochemical Health 31, 23-43.
Bignami-Van Assche, S., Reniers, G., Weinreb, A.A., 2003. An assessment of the
KDICP and MDICP data quality: Interviewer effects, question reliability and
sample attrition. Demographic Research 1(2), 31–75.
Bissen, M., Frimmel, F.H., 2003. Arsenic - A review. Part II: Oxidation of arsenic and
its removal in water treatment. Acta Hydrochimica et Hydrobiologica 31(2), 97-
107.
Blanc, A.K., Croft, T.N., 1992. The effect of the sex of interviewer on responses in
fertility surveys: The case of Ghana. Population Association of America Annual
Meeting Denver.
Bowell, R.J., 1994. Sorption of arsenic by iron oxides and oxyhydroxides in soils.
Applied Geochemistry 9, 279-286.
British Geological Survey, 1999. Groundwater Studies for Arsenic Contamination in
Bangladesh: Final Report. Mott MacDonald Ltd London, UK.
Brouns, M., Janssen, M., Wong, A., 2013. Dealing with arsenic in rural Bihar, India:
Evaluating the successes and failures of mitigation projects and providing a long-
term mitigation strategy. Report from Delft University of Technology, The
Netherlands.
Brown, L.G., 1989. The strategic and tactical implications of convenience in consumer
marketing strategy. The Journal of Consumer Marketing 6(3), 13.

149
Brundtland G.H., 1987. Our common future: World commission on environment and
development. Oxford: Oxford University Press.
Bryman, A., 2012. Social research methods. Oxford: Oxford University Press.
Bukhari, S.A.S., Koondhar, I.D.M., Devrajani, B.T., 1980. Tubewell irrigation system -
installation, operation and cost of water. Agricultural Mechanization in Asia 11(1),
37-42.
Caldwell, B., 2003. Tubewells and arsenic in Bangladesh: Challenging a public health
success story. International Journal of Population Geography 9, 23-28.
Chakraborti, D., 2001. Fate of three crore rupee arsenic removal plants in Murshidabad.
Research report for Swedish Sustainability Foundation accessed on March 17,
2013: http://www.sustainablefuture.se/arsenic/docs/chakraborti-murshidad.pdf
Chakraborti, D., Rahman, M.M., Paul, K., Chowdhury, U.K., Sengupta, M.K., Lodh,
D., Chanda, C.R., Saha, K.C., Mukherjee, S.C., 2002. Arsenic calamity in the
Indian subcontinent: What lessons have been learned? Talanta 58, 3-22.
Chakraborti, D., Ghorai, S.K., Das, B., Pal, A., Nayak, B., Shah, B.A., 2009. Arsenic
exposure through groundwater to the rural and urban population in the Allahabad-
Kanpur track in the upper Ganga plain. Journal of Environmental Monitoring 11,
1455-1459.
Chamberlain, J.F., Sabatini, D.A., 2014. Water-supply options in arsenic-affected
regions in Cambodia: Targeting the bottom income quintiles, Science of The Total
Environment, Available online 21 January 2014.
Chang, Y., Lee, S., Yang, J., 2009. Removal of As(III) and As(V) by natural and
synthetic metal oxides. Colloids and Surfaces A: Physicochemical and Engineering
Aspects 346(1-3), 202-207.
Chatterjee, A., Das, D., Chakraborti, D., 1993. A study of ground water contamination
by arsenic in the residential area of Behala, Calcutta due to industrial pollution.
Environmental Pollution 80(1), 57-65.
Chee Tahir A., Darton R.C., 2010. The process analysis method of selecting indicators
to quantify the sustainability performance of a business operation. Journal of
Cleaner Production 18, 1598-1607.
Cherry, N., Shaikh, K., McDonald, C., Chowdhury, Z., 2008. Stillbirth in rural
Bangladesh: arsenic exposure and other etiological factors: a report from
Gonoshasthaya Kendra. Bulletin of the World Health Organization 86(3), 172-177.

150
Clancy, T.M., Hayes, K.F., Raskin, L., 2013. Arsenic waste management: A critical
review of testing and disposal of arsenic-bearing solid wastes generated during
arsenic removal from drinking water. Environmental Science and Technology
47(19), 10799-10812.
Clarke, T., 2001. Bangladeshis to sue over arsenic poisoning. Nature 413, 556.
Copeland, M.T., 1923. Relation of consumers' buying habits to marketing methods.
Harvard Business Review I, 282-89.
Cornwall, D., 2004. Disposal of waste resulting from arsenic removal processes.
London: International Water Association.
Cullen, W.R., Reimer, K.J., 1989. Arsenic speciation in the environment. Chemical
Reviews 89, 713-764.
Cullen, W.R., 2008. Is arsenic an aphrodisiac? The sociochemistry of an element. The
Royal Society of Chemistry Cambridge: Thomas Graham House.
Dalet D., 2012. d-maps.com. Accessed on February 20, 2013:
http://d-maps.com/pays.php?lib=west_bengal_maps&num_pay=441&lang=en.
Das, A., 2013. Socio-economic and gender aspects of arsenicosis - A case study in rural
west Bengal (India). IOSR Journal Of Humanities And Social Science 13(1), 74-83.
Das, N.K., Sengupta, S.R., 2008. Arsenicosis: Diagnosis and treatment. Indian Journal
of Dermatology, Venereology and Leprology 74(6), 571-581.
Department of Information and Cultural Affairs, 1986. Left front government in West
Bengal: Nine years. Calcutta: Government of West Bengal.
Derijcke, E., Uitzinger, J., 2006. Residential behaviour in sustainable houses. User
Behaviour and Technology Development: Shaping Sustainable relations between
Consumers and Technologies. P.P. Verbeek and A. Slob (eds.) Dordrecht, the
Netherlands: Springer 119–126.
Dixit, S., Hering, J.G. (2003). Comparison of Arsenic(V) and Arsenic(III) Sorption onto
Iron Oxide Minerals: Implications for Arsenic Mobility. Environmental Science &
Technology 2003 37 (18), 4182-4189.
Dublin Principles, 1992. World Summit Rio de Janeiro. Accessed on April 15, 2014
from : http://www.wmo.int/pages/prog/hwrp/documents/english/icwedece.html
Duker, A.A., Carranza, E.J.M., Hale, M., 2005. Arsenic geochemistry and health.
Environment International 31(5), 631-641.
EAI - Energy Alternatives India: Indian Power Production Scenario, 2012. Accessed on
Dec 19, 2013:
http://www.eai.in/ref/ae/bio/ipps/india_power_production_scenario.html.

151
Earle, T.C., Siegrist, M., 2006. Morality information, performance information, and the
distinction between trust and confidence. Journal of Applied Social Psychology
36(2), 383-416.
Earle, T.C., 2009. Trust, confidence, and the 2008 global financial crisis. Risk Analysis
29(6), 785-792.
Eaton, A.D., Clesceri, L.S., Rice, E.W., Greenberg, A.E., 1998. Standard methods for
the examination of water and wastewater. Washington: American Public Health
Association.
Ebi, K.L., Mills, D., Smith, J.B., 2005. A case study of unintended consequences:
arsenic in drinking water in Bangladesh. Integration of Public Health with
Adaptation to Climate Change. K.L. Ebi, J.B. Smith, and I. Burton (eds.) London:
Taylor & Francis 72.
Ecofiltro NGO, 2013. Implementation procedures discussed with Philip Wilson - CEO
and Co-Owner. Website: http://ecofiltro.org/en/mission-vision.
Elcik, H., Cakmakci, M., Sahinkaya, E., Ozkaya b., 2013. Arsenic removal from
drinking water using low pressure membranes. Industrial & Engineering Chemistry
Research 52(29): 9958-9964.
Etmannski, T.R., Darton, R.C., 2013. A methodology for the sustainability assessment
of arsenic mitigation technology for drinking water. Science of The Total
Environment, Available online 25 November 2013.
Evans, P., 1964. The tectonic framework of Assam. Journal of the Geological Society of
India 5, 80-96.
Fendorf, S., Michael, H.A., Van Geen, A., 2010. Spatial and temporal variations of
groundwater arsenic in south and Southeast Asia. Science 328, 1123.
Gamper-Rabindran, S., Finger, S.R., 2013. Does industry self-regulation reduce
pollution? Responsible care in the chemical industry. Journal of Regulatory
Economics 43, 1–30.
Gao, Y., Mucci, A., 2001. Acid base reactions, phosphate and arsenate complexation,
and their competitive adsorption at the surface of goethite in 0.7 M NaCl solution.
Geochimica et Cosmochimica Acta 65, 2361-2378.
Garelick, H., Dybowska, A., Valsami-Jones, E., Priest, N.D., 2005. Remediation
technologies for arsenic contaminated drinking waters. Soils and Sediments 5(3)
182-190.
George, C.M., Factor-Litvak, P., Khan, K., Islam, T., Singha, A., Moon-Howard, J.,
Van Geen, A., Graziano, J.H., 2013. Approaches to increase arsenic awareness in

152
Bangladesh: An evaluation of an arsenic education program. Health Education and
Behaviour 40(3), 331-338.
German, M., Seingheng, H., SenGupta, A.K., 2013. Mitigating arsenic crisis in the
developing world: Role of robust, reusable and selective hybrid anion exchanger
(HAIX), Science of The Total Environment, Available online 8 December 2013.
Glanz, K., Rimer, B.K., Viswanath, K., (eds.) 2008. Health behaviour and health
education: Theory, research, and practice. San Francisco, CA: Wiley.
GRI Portal - Global Reporting Initiative, 2002. Sustainability reporting guidelines.
Amsterdam, Netherland. Website accessed on July 20, 2013:
https://www.globalreporting.org/Pages/default.aspx.
Goldberg, S., Johnston, C.T.J., 2001. Mechanisms of arsenic adsorption on amorphous
oxides evaluated using macroscopic measurements, vibrational spectroscopy and
surface complexation modelling. Colloid Interface Science 234, 204-216.
Government of India, Census Commissioner, 2011. Website accessed on January 21,
2014 http://censusindia.gov.in/Census_And_You/religion.aspx.
Government of India Planning Commission, 2007. Report of the task force on
formulating action plan for removal of arsenic contamination in West Bengal,
Government of India, New Delhi. Accessed on Dec 19, 2013:
http://planningcommission.nic.in/aboutus/committee/wrkgrp11/tf11_arsenics.pdf.
Graedel, T.E., Allenby, B.R., 2003. Industrial Ecology. Englewood Cliffs, New Jersey:
Prentice Hall.
Gross, B.L., 1987. Time scarcity: Interdisciplinary perspectives and implications for
consumer behaviour. Research in Consumer Behaviour 1-54.
Gupta, S., Mohan, K., Prasad, R., Gupta, S., Kansal, A., 1998. Solid waste management
in India: options and opportunities. Resources Conservation and Recycling 24(2),
137-154.
Hanchett, S., Nahar, Q., Van Agthoven, A., Geers, C., Rezvi, M.D.F.J., 2002.
Increasing awareness of arsenic in Bangladesh: lessons from a public education
programme. Health Policy and Planning 17, 393-401.
Harbauer, 2012. Website accessed on January 5, 2011 from: http://harbauer.in/arsenic-
removal-technology.html.
Harvey, C.F., Swartz, C.H., Badruzzaman, A.B.M., Keon-Blute, N., Yu, W., Ali, M.A.,
Jay, J., Beckie, R., Niedan, V., Brabander, D., Oates, P.M., Ashfaque, K.N., Islam,
S., Hemond, H.F., Ahmed, M.F., 2002. Arsenic mobility and groundwater
extraction in Bangladesh. Science 298(5598), 1602-1606.

153
Harvey, C.F., Swartz, C.H., Badruzzaman, A.B.M., Keon-Blute, N., Yu, W., Ali, M.A.,
Jay, J., Beckie, R., Niedan, V., Brabander, D., Oates, P.M., Ashfaque, K.N., Islam,
S., Hemond, H.F., Ahmed, M.F., 2005. Groundwater arsenic contamination on the
Ganges delta: biogeochemistry, hydrology, human perturbations, and human
suffering on a large scale. Comptes Rendus Geoscience 337(1-2), 285-296.
Hazra, T., Goel, S., 2009. Solid waste management in Kolkata, India: Practices and
challenges. Waste Management 29(1), 470-478.
Hilbe, J.M., 2003. A review of current SPSS products. The American Statistician 57(4),
310-315.
Hira Smith, M.M., Hore, T., Chakraborty, P., Chakraborty, D.K., Savarimunthu, X.,
Smith, A.H., 2003. A dugwell program to provide arsenic-safe water in West
Bengal, India: Preliminary results. Journal of Environmental Science and Health
A38(1), 289-299.
Hoque, B.A., Hoque, M.M., Ahmed, T., Islam, S., Azad, A.K., Ali, N., Hossain, M.,
Hossain, M.S., 2004. Demand-based water options for arsenic mitigation: an
experience from rural Bangladesh. Public Health 118(1), 70-77.
Hossain, M.A., Sengupta, M.K., Ahamed, S., Rahman, M.M., Mondal, D., Lodh, D.,
Das, B., Nayak, B., Roy, B.K., Mukherjee, A., Chakraborti, D., 2005.
Ineffectiveness and poor reliability of arsenic removal plants in West Bengal, India.
Environmental Science and Technology 39, 4300-4306.
Hossain, M.A., Mukherjee, A., Sengupta, M.K., Ahamed, S., Das, B., Nayak, B., Pal,
A., Rahman, M.M., Chakraborti, D., 2006. Million dollar arsenic removal plants in
West Bengal, India: Useful or not? Water Quality Research Journal Canada 41(2),
216-225.
Hossain, M.A., Rahman, M.M., Murrill, M., Das, B., Roy, B., Dey, S., Maity, D.,
Chakraborti, C., 2013. Water consumption patterns and factors contributing to
water consumption in arsenic affected population of rural West Bengal, India.
Science of the Total Environment 463–464, 1217-1224.
Howard, G., 2003. Arsenic, drinking-water and health risk substitution in arsenic
mitigation: A discussion paper. World Health Organisation, Accessed on Feb 20,
2012: http://www.who.int/water_sanitation_health/dwq/WSH03.06fulltext.pdf.
Huber , J., 2000. Towards industrial ecology: Sustainable development as a concept of
ecological modernization. Journal of Environmental Policy and Planning 2, 269-
285.

154
IIBB – International Institute of Bengal Basin, 2010. Accessed on January 10, 2014
from: http://www.nvo.com/ghosh_research.
IPS - Indian Power Sector, 2013. Overview. Accessed on Dec 19, 2013.
http://indianpowersector.com/home/about/.
Jacoby, J., Szybillo, G.J., Berning, C.J., 1976. Time and consumer behaviour: An
interdisciplinary overview. Journal of Consumer Research 2, 320-339.
Jain, C.K., Ali, I., 2000. Arsenic occurrence, toxicity and speciation techniques. Water
Research 34(17), 4304-4312.
Janz, N.K., Becker, M.H., 1984. The health belief model: A decade later. Health
Education and Behaviour 11(1), 1-47.
Jelsma, J., Knot, M., 2002. Designing environmentally efficient services: A script
approach. The Journal of Sustainable Product Design 2, 119–130.
Johnston, R..B., Hug, S.J., Inauen, J., Khan, N.I., Mosler, H-J., Yang, H.,
2013.Enhancing arsenic mitigation in Bangladesh: Findings from institutional,
psychological, and technical investigations. Science of The Total Environment,
Available online 28 December 2013.
Johnston, R.B., Hanchett, S., Khan, M.H., 2010. The socio-economics of arsenic
removal. Nature Geoscience 3, 2-3.
Kabir, A., Howard, G., 2007. Sustainability of arsenic mitigation in Bangladesh: Results
of a functionality survey. International Journal of Environmental Health Research
17(3), 207-218.
Kanel, S.R., Manning, B., Charlet, L., Choi, H., 2005. Removal of arsenic(III) from
groundwater by nanoscale zero-valent iron. Environmental Science and Technology
39(5), 1291-1298.
Kameswari, K.S.B., Bhole, A.G., Paramasivam, R., 2001. Evaluation of
solidification/stabilization process for the disposal of arsenic-bearing sludge in
landfill sites. Environmental Engineering Science 18(3), 167-176.
Khan, N.I., Yang, H., 2013. Arsenic mitigation in Bangladesh: An analysis of
institutional stakeholders' opinions, Science of The Total Environment, Available
online 2 December 2013.
Khan, N.I., Owens, G., Bruce, D., Naidu, R., 2009. Human arsenic exposure and risk
assessment at the landscape level: a review. Environmental Geochemistry and
Health 31, 143-66.
Kinniburgh, D.G., Kosmus, W., 2002. Arsenic contamination in groundwater: some
analytical considerations. Talanta 58(1), 165-180.

155
Kristensen, P., 2004. The DPSIR Framework. National Environmental Research
Institute Denmark, Department of Policy Analysis.
Leak Bird, 2009. The average monthly household water bill. Accessed on Dec 19, 2013:
http://www.leakbird.com/running-toilets/the-average-monthly-household-water-
bill-5100-water-facts-and-running-toilets-leakbirdx.
Majumder, A., 2011. Arsenic problem mitigation - West Bengal experience. Accessed
on February 20, 2013:
http://www.asce.org/uploadedFiles/Regions_Sections_Branches/Region_10/Section
s_and_Branches/India_Section/AM_ASCE_Presentation_22.07.2011.pdf.
Malik, A.H., Khan, Z.M., Mahmood, Q., Nasreen, S., Bhatti, Z.A., 2009. Perspectives
of low cost arsenic remediation of drinking water in Pakistan and other countries.
Journal of hazardous materials 168(1) 1-12.
Mandal, B.K., Suzuki, K.T., 2002. Arsenic round the world: a review. Talanta 58(1),
201-235.
Manning, B.A., Fendorf, S.E., Goldberg, S., 1998. Surface structures and stability of
arsenic (III) on goethite: Spectroscopic evidence for inner-sphere complexes.
Environment Science and Technology 32(16), 2383-2388.
Mazumder, D.N.G., Chakraborty, A.K., Ghose, A., Gupta, J.D., Chakraborty, D.P.,
Dey, S.B., Chattopadhyay, N., 1988. Chronic arsenic toxicity from drinking
tubewell water in rural West Bengal. Bulletin of the World Health Organization
66(4), 499-506.
Mazumder, D.N.G., Haque, R., Ghosh, N., De, B.K., Santra, A., Chakraborti, D., Smith,
A.H., 1998. Arsenic levels in drinking water and the prevalence of skin lesions in
West Bengal, India. International Journal of Epidemiology 27, 871-877.
McArthur, J.M., Banerjee, D.M., Hudson-Edwards, K.A., Mishra, R., Purohit, R.,
Ravenscroft, P., Cronin, A., Howarth, R.J., Chatterjee, A., Talukder, T., Lowry, D.,
Houghton, S., Chadha, D.K., 2004. Natural organic matter in sedimentary basins
and its relation to arsenic in anoxic ground water: the example of West Bengal and
its worldwide implications. Applied Geochemistry 19(8), 1255-1293.
Meharg, A.A., Rahman, M.M., 2003. Arsenic contamination of Bangladesh paddy field
soils: implications for rice contribution to arsenic consumption. Environmental
Science and Technology 37(2), 229-34.
Meharg, A.A., 2005. Venomous Earth: How arsenic caused the world's worst mass
poisoning. Macmillan, Houndmills, Basingstoke, Hampshire, New York.

156
Melamed, D., 2005. Monitoring arsenic in the environment: a review of science and
technologies with the potential for field measurements. Analytica Chimica Acta
532(1), 1-13.
Meng, X., Korfiatis, G.P., Christodoulatos, C., Bang, S., 2001. Treatment of arsenic in
Bangladesh well water using a household co-precipitation and filtration system.
Water Research 35(12), 2805-2810.
Milton, A.H., Hore, S.K., Hossain, M.Z., Rahman, M., 2012. Bangladesh arsenic
mitigation programs: lessons from the past. Emerging Health Threats Journal 5.
Mitcham, C., 1995. The concept of sustainable development: its origins and
ambivalence. Technology in Society 17(3), 31 l-326.
Mohan, D., Pittman, C.U., 2007. Arsenic removal from water/wastewater using
adsorbents-A critical review. Journal of Hazardous Materials 142(1-2), 1-53.
Morgenstern, R.., Pizer, W.A., 2007. Reality check: The nature and performance of
voluntary environmental programs in the United States, Europe, and Japan.
Washington DC: RFF Press.
Mosler, H., Blöchliger, O.R., Inauen, J., 2010. Personal, social, and situational factors
influencing the consumption of drinking water from arsenic-safe deep tubewells in
Bangladesh. Journal of Environmental Management 91(6), 1316-1323.
Mukherjee, A., Sengupta, M.K., Hossain, A.M., Ahamed, S., Das, B., Nayak, B., Lodh,
D., Rahman, M.M., Chakraborti, D., 2006. Arsenic contamination in groundwater:
A global perspective with emphasis on the Asian scenario. Journal of Health
Population and Nutrition 24(2), 142-163.
Mukherjee, A., Fryar, A.E., Howell, P.D., 2007. Regional hydrostratigraphy and
groundwater flow modelling in the arsenic-affected areas of the western Bengal
basin, West Bengal, India. Hydrogeology Journal 15, 1397-1418.
Mukherjee, A., Fryar, A.E., Thomas, W.A., 2009. Geologic, geomorphic and hydrologic
framework and evolution of the Bengal basin, India and Bangladesh. Journal of
Asian Earth Sciences 34(3), 227-244.
Naqvi, S.M., Vaishnavi, C., Singh, H., 1994. Toxicity and metabolism or arsenic in
vertebrates. Arsenic in the environment, Part II: Human health and ecosystem
effects, J.O. Nriagu (ed.) New York: Wiley, 55-92.
Naschold, F., 2012. The poor stay poor: Household asset poverty traps in rural semi-arid
India. World Development 40(10), 2033-2043.
Ness, B., Urbel-Piirsalu, E., Anderberg, S., Olsson, L., 2007. Categorising tools for
sustainability assessment. Ecological Economics 60, 498-508.

157
Ng, J.C., Wang, J., Shraim, A., 2003. A global health problem caused by arsenic from
natural sources. Chemosphere 52, 1353-1359.
Nickson, R.T., McArthur, J.M., Burgess, W., Ahmed, K.M., Ravenscroft, P., Rahman,
M., 1998. Arsenic poisoning of Bangladesh groundwater. Nature 395, 338.
Nickson, R.T., McArthur, J.M., Ravenscroft, P., Burgess, W.G., Ahmed, K.M., 2000.
Mechanism of arsenic release to groundwater, Bangladesh and West Bengal.
Applied Geochemistry 15, 403-413.
Noss, A., 2013. Household income: 2012. Accessed on Dec 19, 2013:
http://www.census.gov/prod/2013pubs/acsbr12-02.pdf.
OCETA/ETV Canada/BCSIR, 2009. Bangladesh environmental technology verification
support to arsenic mitigation performance: Verification reports, Bangladesh
Council of Scientific and Industrial Research/Ontario Center for Environmental
Technology Advancement/ETV Canada/CIDA. Website accessed on Aug 26, 2011:
http://www.verification-unit.org/etv-am_verified_techs.htm.
Owen, A.L., Videras, J., 2006. Civic cooperation, pro-environment attitudes, and
behavioural intentions. Ecological Economics 58(4), 814-829.
Pal, B.N., 2001. Granular ferric hydroxide for elimination of arsenic from drinking
water. Accessed on February 20, 2013: http://archive.unu.edu/env/Arsenic/Pal.pdf.
Paul, B.K., 2004. Arsenic contamination awareness among the rural residents in
Bangladesh. Social Science and Medicine 59, 1741-1755.
Paul, B.K., Tinnon Brock, V.L., 2006. Treatment delay period: The case of arsenicosis
in rural Bangladesh. Health and Place 12(4), 580-593.
Planning Commission of India, 2009. Report of the expert group to review the
methodology for estimation of poverty. Accessed on Dec 20, 2013:
http://planningcommission.nic.in/reports/genrep/rep_pov.pdf.
Polya, D.A., Charlet, L., 2009. Rising arsenic risk? Environmental Science 2, 383-384.
PSI – Product Stewardship Institute, 2013. Assessed on December 19, 2013 from:
http://www.productstewardship.us/displaycommon.cfm?an=1&subarticlenbr=55.
Project Mosquito Net, 2014. Accessed on January 21, 2014 from:
http://www.projectmosquitonet.org/.
Public Health Engineering Department, 2012. Arsenic mitigation experience and
strategy in West Bengal: Status, strategic actions, key learnings and way forward.
Government of West Bengal Booklet from International Conference on Water
Quality, Kolkata, 8-9.

158
Rahman, M.M., Ng, J.C., Naidu, R., 2009. Chronic exposure of arsenic via drinking
water and its adverse health impacts on humans. Environmental Geochemical
Health 31, 189-200.
Rahman, M.M., Sengupta, M.K., Ahamed, S., Chowdhury, U.K., Lodh, D., Hossain, A.,
Das, B., Roy, N., Saha, K.C., Palit, S.K., Chakraborti, D., 2005. Arsenic
contamination of groundwater and its health impact on residents in a village in
West Bengal, India. Bulletin of the World Health Organization 83(1) 49-57.
Rahman, M.M., Chowdhury, U.K., Mukherjee, S.C., Mondal, B.K., Paul, K., Lodh, D.,
Biswas, B.K., Chanda, C.R., Basu, G.K., Saha, K.C., Roy, S., Das, R., Palit, S.K.,
Quamruzzaman, Q., Chakraborti, D., 2001. Chronic arsenic toxicity in Bangladesh
and West Bengal, India—A review and commentary. Clinical Toxicology 39(7),
683-700.
Raj, D.S.S., Aparna, C., Rekha, P., Bindhu, V.H., Anjaneyulu, Y., 2005. Stabilisation
and solidification technologies for the remediation of contaminated soils and
sediments: an overview. Land Contamination and Reclamation 13(1), 23-48.
Ravenscroft, P., Brammer, H., Richards, K., 2009. Arsenic Pollution: A Global
Synthesis. Chichester, West Sussex: Wiley-Blackwell Publishing.
Rees, W.E., 1992. Ecological footprints and appropriate carrying capacity: What urban
economics leaves out. Environment and Urbanization 4(2), 121-137.
Roberts, L.C., Hug, S.J., Ruettimann, T., Billah, M.M., Khan, A.W., Rahman, M.T.,
2004. Arsenic removal with iron (II) and iron (III) in waters with high silicate and
phosphate concentrations. Environmental Science and Technology 38(1), 307-315.
Rodríguez, E., Boks, C., 2005. How design of products affects user behaviour and vice
versa: the environmental implications. Proceedings of EcoDesign Tokyo: Union of
Ecodesigners, 1–8.
Roy, J., 2008. Economic benefits of arsenic removal from ground water — A case study
from West Bengal, India. Science of the Total Environment 397(1–3), 1-12.
Roy, S.N., Dey, T., Majumder, M., Majumder, S., Ghosh, B.P., Bandyopadhyay, S.,
Maiti, H.S., 2005. Ceramic membrane and water purification. Indian Science News
Association Journal of Science and Culture 71(5-6), 159-157.
Safarzadeh-Amiri, A., Fowlie, P., Kazi, A.I., Siraj, S., Ahmed, S., Akbor, A., 2011.
Validation of analysis of arsenic in water samples using Wagtech Digital Arsenator.
Science of the Total Environment 409(13), 2662-2667.

159
Saha, J.C., Dikshit, K., Bandyopadhyay, M., 2001. Comparative studies for selection of
technologies for arsenic removal from drinking water. Technologies for Removal of
Arsenic from Drinking Water. M.F. Ahmed, M.A. Ali, Z. Adeel (eds.), Tokyo,
Japan: United Nations University, 76.
Saha, K.C., 1984. Melanokeratosis from arsenical contamination of tubewell water.
Indian Journal of Dermatology 29(4), 37-46.
Saha, K.C., 2003. Saha's grading of arsenicosis progression and treatment. Arsenic
Exposure and Heath Effects, W.R. Chappell, C.O. Abernathy, R.L. Calderon, D.J.
Thomas, V Edn, (eds.) Amsterdam: Elsevier, 391-414.
Samanta, G., Chowdhury, T.R., Mandal, B.K., Biswas, B.K., Chowdhury, U.K., Basu,
G.K., Chanda, C.R., Lodh, D., Chakraborti, D., 1999. Flow injection hydride
generation absorption spectrometry for determination of arsenic in water and
biological samples from arsenic-affected districts of West Bengal, India, and
Bangladesh. Microchemical Journal 62, 174–191.
Sankararamakrishnan, N., Chauhan, D., Nickson, R.T., Tripathi, R.M., Iyengar, L.,
2008. Evaluation of two commercial field test kits used for screening of
groundwater for arsenic in Northern India. Science of the Total Environment
401(1-3), 162-167.
SAR – Subterranean Arsenic Removal Technology, 2010. Website accessed on
November 15, 2010 from: http://www.insituarsenic.org/principle.html.
Sarkar, A., 2010. Assessing vulnerability of the arsenic exposed population in India.
Asian Journal of Water, Environment and Pollution 7(1), 35-43.
Sarkar, S., Gupta, A., Biswas, R.K., Deb, A.K., Greenleaf, J.E., Sen Gupta, A.K., 2005.
Well-head arsenic removal units in remote villages of Indian subcontinent: Field
results and performance evaluation. Water Research 39(10), 2196-2206.
Sarkar, S., Blaney, L.M., Gupta, A., Ghosh, D., Sengupta, A.K., 2008. Arsenic removal
from groundwater and its safe containment in a rural environment: validation of a
sustainable approach. Environmental Science and Technology 42(12), 4268-4273.
Sarkar, S., Greenleaf, J.E., Gupta, A., Ghosh, D., Blaney, L.M., Bandyopadhyay, P.,
Biswas, R.K., Dutta, A.K., Sengupta, A.K., 2010. Evolution of community-based
arsenic removal systems in remote villages in West Bengal, India: Assessment of
decade-long operation. Water Research 44(19), 5813-5822.
Sato, Y., Kang, M., Kamei, T., Magara, Y., 2002. Performance of nanofiltration for
arsenic removal. Water Research 36, 3371-3377.

160
Sen Gupta, B., Chatterjee, S., Rott, U., Kauffman, H., Bandopadhyay, A., DeGroot, W.,
Nag, N.K., Carbonell-Barrachina, A.A., Mukherjee, S., 2009. A simple chemical
free arsenic removal method for community water supply - A case study from West
Bengal, India. Environmental Pollution 157(12), 3351-3353.
Shafiquzzaman, M., Azam, M.S., Mishima, I., Nakajima, J., 2009. Technical and social
evaluation of arsenic mitigation in rural Bangladesh. Journal of Health, Population
and Nutrition 27, 674–83.
Sharmin, N., 2001. Arsenic removal processes on trial in Bangladesh. Technologies for
Removal of Arsenic from Drinking Water, M.F. Ahmed, M.A. Ali, Z. Adeel (eds.),
Tokyo, Japan: United Nations University.
Smedley, P.L., Kinniburgh, D.G., 2002. A review of the source, behaviour and
distribution of arsenic in natural waters. Applied Geochemistry 17(5), 517-568.
Smedley, P.L., Kinniburgh, D.G., 2005. Arsenic in groundwater and the environment.
Essentials of Medical Geology: Impacts of the Natural Environment on Public
Health, O. Selinus (ed.), Amsterdam: Elsevier, 263.
Smit, E., Stevels, A., Sherwin, C., 2002. User centred ecodesign: Experiences from the
design of a human-powered remote control. Proceedings of Care Innovation,
Vienna: IEEE.
Smith, A.H., Ercumen, A., Yuan, Y., Steinmaus, C.M., 2009. Increased lung cancer
risks are similar whether arsenic is ingested or inhaled. Journal of Exposure Science
and Environmental Epidemiology 19(4), 343-348.
Smith, A.H., Lingas, E.O., Rahman, M., 2000. Bulletin World Health Organization.
Smith, T.W., Axon, C.J., Darton, R.C., 2013. A methodology for measuring the
sustainability of car transport systems. Transport Policy 30, 308–317.
Stenehjem, A., Vahter, M., Nermell, B., Aasen, J., Lierhagen, S., Mørland, J., Jacobsen,
D., 2007. Slow recovery from severe inorganic arsenic poisoning despite treatment
with DMSA (2.3-dimercaptosuccinic acid). Clinical Toxicology 45(4), 424-428.
Sullivan, C., Tyrer, M., Cheeseman, C.R., Graham, N.J.D., 2010. Disposal of water
treatment wastes containing arsenic - a review. The Science of the Total
Environment 408(8), 1770-1778.
Swedlund, P.J., Webster, J.G., 1999. Adsorption and polymerisation of silicic acid on
ferrihydrite, and its effect on arsenic adsorption. Water Resources 33(16), 3413-
3422.
Taylor, S., 1994. Waiting for service: The relationship between delays and evaluations
on service. Journal of Marketing 58, 56-69.

161
Toman, M.A., 2009. The difficulty in defining sustainability. Resources 106, 3-6.
Turpeinen, R., 2002. Interactions between metals, microbes and plants – Bioremediation
of arsenic and lead contaminated soils. Dissertation from University of Helsinki.
Umitsu, M., 1987. Late quaternary sedimentary environment and landform evolution in
the Bengal lowland. Geographical Reviews of Japan B60, 164-178.
Umitsu, M., 1993. Late quaternary sedimentary environments and landforms in the
Ganges Delta. Sedimentary Geology 83, 177-186.
UNDP – United Nations Development Programme, 2006. Human development report
beyond scarcity: power, poverty and the global water crisis. Accessed on Dec 19,
2013: http://hdr.undp.org/sites/default/files/hdr_2006_summary_en.pdf.
UNFPA – United Nations Population Fund, 2012. Preventing HIV/AIDS. Accessed on
January 21, 2014 from : http://www.unfpa.org/hiv/programming.htm.
UNICEF, 2000. Media Brief: Arsenic Mitigation in Bangladesh. Accessed on Feb 20,
2013: http://www.unicef.org/bangladesh/Arsenic.pdf.
UNICEF, 2010. Monitoring arsenic in water: Review of test kits. Technical Bulletin 8.
Accessed on February 20, 2013:
http://www.unicef.org/supply/files/Monitoring_Arsenic_in_Water.pdf.
United Nations Statistics Division, 2005. Designing household survey samples:
practical guidelines. Department of Economic and Social Affairs, New York, Series
F(98).
Vahter, M., 2009. Effects of arsenic on maternal and fetal health. Annual Review of
Nutrition 29, 381-399.
Van Geen, A., Ahmed, E.B., Pitcher, L., Mey, J.L., Ahsan, H., Graziano, J.H., Ahmed,
K.M., 2014. Comparison of two blanket surveys of arsenic in tubewells conducted
12 years apart in a 25km2 area of Bangladesh. Science of The Total Environment,
Available online 16 January 2014.
Van Geen, A., Ahsan, H., Horneman, A.H., Dhar, R.K., Zheng, Y., Hussain, I., 2002.
Promotion or well-switching to mitigate the current arsenic crisis in Bangladesh.
Bulletin of the World Health Organization 80, 732-737.
Van Geen, A., Cheng, Z., Seddique, A.A., Hoque, M.A., Gelman, A., Graziano,J.H.,
Ahsan, H., Parvez, F., Ahmed, K.M., 2005. Reliability of a commercial kit to test
groundwater for arsenic in Bangladesh. Environmental Science and Technology
39(1), 299-303.

162
Voli, P.K., 1998. The convenience orientation of services consumers: An empirical
examination. Doctoral dissertation, College of Business and Public Administration,
Old Dominion University.
Vredenburg, K., Isensee, S., Righi, C., 2002. User-centred design; An integrated
approach. Upper Saddle River, NJ: Prentice-Hall.
Wang, C.H., Hsiao, C.K., Chen, C.L., 2007. A review of the epidemiologic literature on
the role of environmental arsenic exposure and cardiovascular diseases. Toxicology
and Applied Pharmacology 222, 315-326.
WBDID - World Bank Development Indicators Database, 2006. Accessed on January
15, 2014 from : http://data.worldbank.org/indicator.
Wegelin, M., Gechter, D., Hug, S., Mahmud, A., Motaleb, A., 2000. SORAS - A simple
arsenic removal process. Accessed on February 20, 2013:
http://www.sswm.info/sites/default/files/reference_attachments/WEGELIN%20et%
20al%201999%20SORAS%20A%20Simple%20Arsenic%20Removal%20Process.
pdf.
Weinreb, A.A., 2006. The limitations of stranger-interviewers in rural Kenya. American
Sociological Review 71(6), 1014-1039.
WHO, 2001. Arsenic in drinking water: Fact sheet 210. Bulletin of the World Health
Organization 78(9), 1096.
WHO, 2004. Guidelines for drinking-water quality. World Health Organization 3(1).
Williams, P.N., Islam, M.R., Adomako, E.E., Raab, A., Hossain, S.A., Zhu, Y.G.,
Feldmann, J., Meharg, A.A., 2006. Increase in rice grain arsenic for regions of
Bangladesh irrigating paddies with elevated arsenic in groundwaters.
Environmental Science and Technology 40(16), 4903-8.
World Bank, 1998. The Bangladesh Arsenic Mitigation Water Supply Project:
Addressing a massive public health crisis. Accessed on February 20, 2013:
http://web.worldbank.org/external/projects/main?pagePK=104231&piPK=73230&t
heSitePK=40941&menuPK=228424&Projectid=P050745.
World Bank, 2013. Poverty and equity. Accessed on Dec 19, 2013:
http://povertydata.worldbank.org/poverty/country/IND.
Young, E., 1996. Cleaning up arsenic and old waste. New Scientist 22.

163
Appendix I: Summarized Field Notes
TiPOT
Scale: Community
# of Units Visited: 2
As Removal Mechanism: In-situ (Aquifer) ‘Biochemical’ Remediation
Pump: Submersible Electric
Construction Materials: Small building (3m x 3m x 3.5m) with brick and plastered walls, a tin
roof and lockable wooden door houses the power switch (only).
System is comprised of two 4000L high density ‘polyege’ storage
containers (black), pipes are pvc or galvanised and a pump. All
materials purchased new from a local town.
Estimated Lifespan: 10 years? (Aquifer not tested or modelled for long-term use)
Village Code: Tipot1:1 Visited on: July 19 & 20, 2012
Background
Village Name: Merudandi para
Location: Basirhat, North 24 Parganas, West Bengal, India
GPS: N22°41.306’ E088°53.161’
Religion: Hindu
Total Households in Community: <100
Total Household Surveyed: 35
Mean Household Income for Village: 6,600 Rupees (~$110 USD) /month
Mean # People/Household: 4.89
Mean # Children/Household: 0.89
Type of Local Water Sources Used by Villagers: Household shallow tube wells, Ponds
Installation
Date: 2008
Duration: 3 months to construct the system but >1 year for the aquifer
reclamation process to be completed
Process: NGO approached Panchayat who donated land for the building. No
other community members involved in decision through a council,
club or stakeholder meetings
Location: Near the centre of town
Cost: 420,000 Rupees ($7,000 USD), NGO paid entire amount through
World Bank donation
Operation
[As] in Raw Water: Inaccessible to take a sample. Household tube well sample from
<10m away from system showed <10ppb of arsenic (depth
unknown)
[As] in Treated Water: Below Detectable Limit
Flow Rate: High-flow tap with no delay (comes from a storage tank)
Vol of Treated Water Produced/Day: 4000 Litres max
Daily Treatment Time: 1.5 hours/day
Daily Operation Procedure: The operator turns on the power and the pump. He fills the
storage tank full, and the recharge tank half full. Each tank holds
4000L.The water in the recharge tank is blown through a shower
head at the top of the tank before entering the tank. Oxygen also
enters through holes in the side of the tank. Oxygen rich water fills
half the tank and then gets fed back down into the well.
Reoccurring Costs: 250 Rupees ($4 USD)/month (for electricity only)
Details on Operator(s): Only one person was trained; He is the brother of Panchayat and
volunteers his time
Maintenance Procedure: Maintenance includes tightening of bolts and valves regularly,
draining the tanks and cleaning the inside of the tanks with a scrub
brush (no soap or chemicals used).

164
Maintenance Schedule: 1 hour/month for cleaning
Operator Training: Operator was trained informally for 1.5 months by the Queens Uni
Belfast team
Power Outages: 4-5 hours/day at random times, intermittently; totally unpredictable
Frequency of Arsenic Testing: 2 tests/month initially until the concentration stabilized and now is 1
test/month
Arsenic Test Results Posted Publicly: No
Visual Public Notice: Painted on building: “World Bank Project, Subterranean Arsenic
Removal: From Experiment to Delivery. Recipient Organisation:
Ramakrishna Vivekananda Mission, Barrackpore, N24 PGs” No
contact information (phone number); All in English (not Bangla);
No information about the arsenic problem/symptoms or how system
works.
Waste
Volume: No arsenic-ridden waste produced during operation or maintenance.
No disposable or regenerable parts used in system
Feedback/Notes
Accountability: Operator has no boss or committee to oversee that he is doing the maintenance
properly. There is nobody the villagers can contact when they have questions or concerns about the
system.
Corruption: “Operator is now asking for money to pay for power but never did for previous 3 years.
He says the money has run out but we don’t believe him.” (I researched the NGO, called and asked about
this and it is true that the funding from the World Bank has run out so now there is nobody to pay for the
electricity)
Satisfaction: “Water smells and tastes strange”
Awareness: After drinking the arsenic & iron contaminated water for a long time, the villagers may
take some time to adapt to the taste of the good quality As & Fe free water. This will need some
awareness campaign. Also, absence of iron results in loose motion for a few days which can be mistaken
as stomach upset.
Level of understanding: Many people have died or arsenic related cancers here but still many people do
not know what arsenic is and had many questions about how the system actually works
Reliability/Durability: System was operational during visit and has never broken down in villagers
memory
Trust: Many villagers commented on the fact the Panchayat and his family do not use the
filter, so they feel the water must therefore not be drinkable
t1
Photo: Tipot1:1

165
Village Code: Tipot 1:2 Visited on: August 17, 2012
Background
Village Name: Gotra para
Location: Ghetugachi, Chakdah, Nadia, West Bengal, India
GPS: N23°01.295’ E088°34.994’
Religion: Muslim
Total Households in Community: <100
Total Household Surveyed: 40
Mean Household Income for Village: 3,500 Rupees (~$58 USD)/month
Mean # People/Household: 4.53
Mean # Children/Household: 0.85
Type of Local Water Sources Used by Villagers: Household shallow tube wells, Ponds, One public deep
tube well located at one end of town that has a government sign above it saying it is arsenic free (English
& Bengla).
Installation
Date: 2009
Duration: 1 month to construct the system but 8 months for the aquifer
reclamation process to be completed
Process: NGO approached Panchayat to find someone to donate land. No
other community members involved in decision through a council,
club or stakeholder meetings
Location: Along the main road near one end of the village
Cost: 420,000 Rupees (~$7,000 USD) -NGO paid entire amount through
World Bank donation
Operation
[As] in Raw Water: Inaccessible to take a sample. Public tube well 50m away from
system as tested and showed 200ppb of arsenic but depth is
unknown.
[As] in Treated Water: <10ppb
Flow Rate: High-flow tap with no delay (comes from a storage tank)
Vol of Treated Water Produced/Day: 4000 Litres max
Daily Treatment Time: 1.5 hours/day
Daily Operation Procedure: Same as above system: Tipot 1:1
Reoccurring Costs: 400 Rupees ($7 USD)/month (for electricity only)
Operator charging some families 15 Rupees (~$0.25 USD) /month for
use of the water from the system
Details on Operator(s): Operator donated land, so that is how he became in charge of the
system and now he and his family live in the filter building.
Maintenance Procedure: Operator doesn’t feel it’s necessary to wash the storage tanks so
doesn’t
Maintenance Schedule: None
Operator Training: Operator was trained informally for 1 month by the Queens Uni
Belfast team
Power Outages: 4-5 hours/day at random times, intermittently; totally unpredictable
Frequency of Arsenic Testing: Is not currently tested
Arsenic Test Results Posted Publicly: No
Visual Public Notice: Painted on building: “World Bank Project, Subterranean Arsenic
Removal: From Experiment to Delivery. Recipient Organisation:
Ramakrishna Vivekananda Mission, Barrackpore, N24 PGs” No
contact information (phone number); All in English (not Bengla); No
information about the arsenic problem/symptoms or how system
works.
Waste
Volume: No arsenic-ridden waste produced during operation or maintenance.
No disposable or regenerable parts used in system
Feedback/Notes
Accountability: Operator has no boss or committee to oversee that he is doing the maintenance
properly. There is nobody the villagers can contact when they have questions or concerns about the
system.

166
Corruption: The operator is not well liked or respected in the community. He charges some families
to use the water but not all. He also refused to clean the system saying that it’s not needed. He was also
very rude and uncooperative towards myself and my team
Satisfaction: Villagers said that the water has a bad taste and it is often too hot to drink. Villagers
also said the water is iron-rich (because it turns the water red).
Awareness: People seem generally aware of the arsenic problem in their area however some seem to
be mixing up iron (red water) with arsenic
Level of understanding: People have no idea how the system works but were generally uninterested
Reliability/Durability: System was operational during my visit however most of the villagers believe
there to be arsenic in the ‘treated’ water so did not use it for drinking.
Trust: I was told that since the Operator washes his cow using the system’s water, it is
therefore not clean water or drinkable because if it was, he wouldn’t waste it washing his cow. He would
wash it in the pond like everyone else. Also one villager said that they asked to see a report which states
the concentration of arsenic in the treated water and since the operator couldn’t produce one, they use the
deep tube well on the other side of town instead because its certified.
Photo: Tipot 1:2
IITB
Scale: Community (300 families max)
# of Units Visited: 3
As Removal Mechanism: Sorption using iron nails which forms hydrous ferric oxide
Pump: Hand – no power required
Construction Materials: Two (or three) metal tanks (1m x 1m x 1.5m), one on the ground and
the other(s) on concrete legs. Flow pipes are pvc tubing and tap is
metal. Iron nails in a metal tray at the top. All materials purchased
locally
Estimated Lifespan: 5-10 years (uncertain)
Village Code: IITB 2:1 Visited on: July 24, 2012
Background
Village Name: Sonatheli para
Location: Nadia, West Bengal, India
GPS: N22°59.929’ E088°33.251’
Religion: Hindu
Total Households in Community: ~100
Total Household Surveyed: 31

167
Mean Household Income for Village: 4,300 Rupees (~$72 USD) /month
Mean # People/Household: 6.10
Mean # Children/Household: 1.35
Type of Local Water Sources Used by Villagers: Household shallow tube wells, 3 stand pipes of
municipal water scattered across village but people complain of
digestive problems with this water, and ponds are used for non-
drinking purposes
Installation
Date: 2010
Duration: ~1 week to build
Process: Locations chosen by IITB as these systems were initially trials so
they requested permission from the local Panchayat . Unknown
process as to how the land was aquired. No community council, or
stakeholder feedback sought (because it wasn’t a development
project, it was field trials of a technology)
Location: Near the center of town along the main road
Cost: 80,000 Rupees ($1,300 USD) max
Operation
[As] in Raw Water: >100 ppb
[As] in Treated Water: <10 ppb
Flow Rate: ~2 minute delay from pumping to flow out the tap (=100L/hr)
Vol of Treated Water Produced/Day: ~2000 L/day
Daily Treatment Time: Treatment done ‘to-order’ by each individual pumping what they
need
Daily Operation Procedure: User pumps for a few mins, waits, then fills container from tap on
tank
Reoccurring Costs: ~1200 Rupees max ($20 USD) / year for iron nails and hand pump
repair
Details on Operator(s): (Mr Ghosh) is a villager who was trained by IIT Bombay
Maintenance Procedure: Volunteers wash nails once every month and clean the first tank up to
a depth of 40 cm from the top once /3-4 months
Maintenance Schedule: See ‘maintenance procedure’
Operator Training: Informally trained over several months and multiple visits of IIT
Bombay
Frequency of Arsenic Testing: Unknown
Arsenic Test Results Posted Publicly: No
Visual Public Notice: “Arsenic Removal Unit designed & installed by IIT Bombay India on
24/1/2008; Funded by Dept of Science & Technology, Govt of India”
in English with no contact information or explanation of how the
system works.
Waste
Volume: Arsenic-rich sludge dried = 35 kg/year
Type: Arsenic-rich sludge and precipitate from nails
Disposal Location(s): Dumped in a marshy area immediately behind the filter
Disposal Cost: Free (dumped)
Feedback/Notes
Accountability: Operator was paid by IITB for a few years and they checked in with him
regularly however IITB didn’t make their info public so regular villagers could only come to them with
potential concerns while there were visiting the site.
Corruption: Household expressed concern that perhaps the operator was requesting money
for repairs but keeping it instead
Satisfaction: People who own the land that the filter is on want to be paid for their land
because “ they are poor” and it was taken without compensation
Awareness: Variable awareness in community about the local arsenic problem and phys
effects
Level of understanding: Operator very well versed in how system operates, general public very much
less so Reliability/Durability: The system has only required small repairs and has never been offline
since it’s instalment (except during cleaning)
Trust: Operator is widely known and trusted in the community

168
Photos: IITB 2:1 and the pond of waste that sits behind it.
Village Code: IITB 2:2 Visited on: July 25, 2012
Background
Village Name: Sonakhali Biswas para
Location: Nadia, West Bengal, India
GPS: N23°00.266’ E088°33.132’
Religion: Muslim
Total Households in Community: 60-80
Total Household Surveyed: 37
Mean Household Income for Village: 5,000 Rupees (~$83 USD) /month
Mean # People/Household: 4.84
Mean # Children/Household: 1.19
Type of Local Water Sources Used by Villagers: For drinking people mostly use public tube wells that
the Panchayat drilled (2 exist scattered across village) and/or the
filter; Household shallow tube wells, 2 stand pipes of municipal
water and ponds are used for non-drinking purposes
Installation
Date: 2010
Duration: 4-6 weeks to build
Process: Locations chosen by IITB as these systems were initially trials so
they requested permission from the local Panchayat and the land was
donated by one of the wealthier villagers. A local water committee
was formed but was inactive at the time or this survey
Location: At one end of town behind a villager’s house (far off the main road)
beside a stream/river
Cost: 80,000 Rupees (~$1,300 USD) max
Operation
[As] in Raw Water: 100-200 ppb
[As] in Treated Water: <10 ppb
Flow Rate: ~2 minute delay from pumping to flow out the tap (=100L/hr)
Vol of Treated Water Produced/Day: ~2000 L/day
Daily Treatment Time: Treatment done ‘to-order’ by each individual pumping what they need
Daily Operation Procedure: User pumps for a few mins, waits, then fills container from tap on tank
Reoccurring Costs: ~1200 Rupees max (~$20 USD) / year for iron nails and hand pump repair
Some families pay 10 Rupees ($0.17 USD) / month for maintenance costs
Details on Operator(s): Family that own the land unofficially oversee the operation and maintenance
Maintenance Procedure: Men wash nails once every month and clean the first tank up to a
depth of 40 cm from the top once /3-4 months and are paid 50 Rupee
($0.83 USD) per cleaning
Maintenance Schedule: Takes approx. 3 hours to complete washing of tanks, rocks and nails
Operator Training: Family informally trained during multiple visits of IIT Bombay
people and father trained directly by Mr Ghosh
Frequency of Arsenic Testing: Weekly by an unknown group
Arsenic Test Results Posted Publicly: No
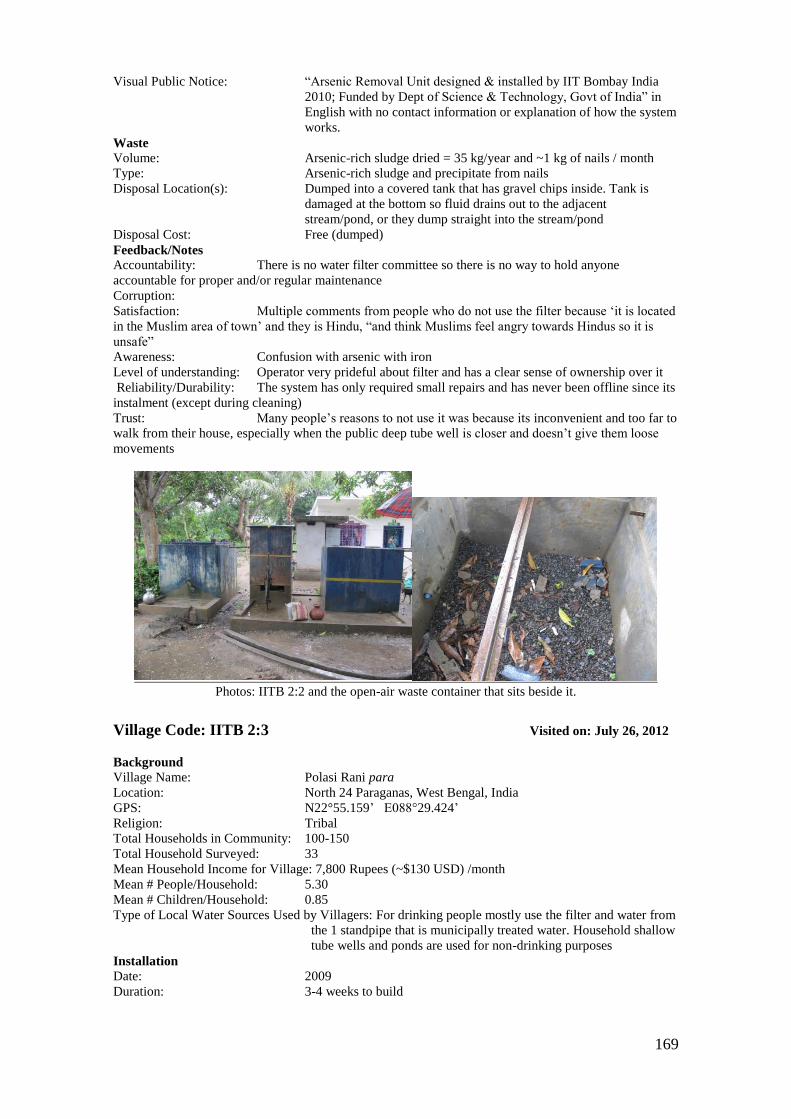
169
Visual Public Notice: “Arsenic Removal Unit designed & installed by IIT Bombay India
2010; Funded by Dept of Science & Technology, Govt of India” in
English with no contact information or explanation of how the system
works.
Waste
Volume: Arsenic-rich sludge dried = 35 kg/year and ~1 kg of nails / month
Type: Arsenic-rich sludge and precipitate from nails
Disposal Location(s): Dumped into a covered tank that has gravel chips inside. Tank is
damaged at the bottom so fluid drains out to the adjacent
stream/pond, or they dump straight into the stream/pond
Disposal Cost: Free (dumped)
Feedback/Notes
Accountability: There is no water filter committee so there is no way to hold anyone
accountable for proper and/or regular maintenance
Corruption:
Satisfaction: Multiple comments from people who do not use the filter because ‘it is located
in the Muslim area of town’ and they is Hindu, “and think Muslims feel angry towards Hindus so it is
unsafe”
Awareness: Confusion with arsenic with iron
Level of understanding: Operator very prideful about filter and has a clear sense of ownership over it
Reliability/Durability: The system has only required small repairs and has never been offline since its
instalment (except during cleaning)
Trust: Many people’s reasons to not use it was because its inconvenient and too far to
walk from their house, especially when the public deep tube well is closer and doesn’t give them loose
movements
Photos: IITB 2:2 and the open-air waste container that sits beside it.
Village Code: IITB 2:3 Visited on: July 26, 2012
Background
Village Name: Polasi Rani para
Location: North 24 Paraganas, West Bengal, India
GPS: N22°55.159’ E088°29.424’
Religion: Tribal
Total Households in Community: 100-150
Total Household Surveyed: 33
Mean Household Income for Village: 7,800 Rupees (~$130 USD) /month
Mean # People/Household: 5.30
Mean # Children/Household: 0.85
Type of Local Water Sources Used by Villagers: For drinking people mostly use the filter and water from
the 1 standpipe that is municipally treated water. Household shallow
tube wells and ponds are used for non-drinking purposes
Installation
Date: 2009
Duration: 3-4 weeks to build

170
Process: Locations chosen by IITB as these systems were initially trials so
they requested permission from the local Panchayat. The land is
owned by a local mens club who look after it.
Location: Near the center of town, along the main road
Cost: 80,000 Rupees (~$1,300 USD) max
Operation
[As] in Raw Water: 20-40 ppb
[As] in Treated Water: <10 ppb
Flow Rate: ~2 minute delay from pumping to flow out the tap (<100L/hr)
Vol of Treated Water Produced/Day: ~1500 L/day
Daily Treatment Time: Treatment done ‘to-order’ by each individual pumping what they
need
Daily Operation Procedure: User pumps for a few mins, waits, then fills container from tap on
tank
Reoccurring Costs: ~1200 R (~$20 USD) / year for iron nails and hand pump repair;
Some families donate 10-25 R ($0.17-0.42 USD) / month for
maintenance costs
Details on Operator(s): The club that own the land officially oversee the operation and
maintenance
Maintenance Procedure: Men from the club volunteer to wash nails once every month and
clean the first tank up to a depth of 40 cm from the top once /3-4
months
Maintenance Schedule: Takes approx. 3 hours to complete washing of tanks, rocks and nails
Operator Training: Club members were trained directly by Mr Ghosh
Frequency of Arsenic Testing: Unknown
Arsenic Test Results Posted Publicly: No
Visual Public Notice: “Arsenic Removal Unit designed & installed by IIT Bombay India
2009; Funded by Dept of Science & Technology, Govt of India” in
English with no contact information or explanation of how the system
works.
Waste
Volume: Arsenic-rich sludge dried = 35 kg/year
Type: Arsenic-rich sludge and precipitate from nails
Disposal Location(s): Dumped into a hole that was dug <1m deep beside the filter
Disposal Cost: Free (dumped)
Feedback/Notes
Accountability: Club members are elected and filter committee is formed through this group
who also keep account of the money donated and used for maintenance, so in principle there should be
accountability
Corruption: Families asked to ‘donate’ variable amounts of money for the filter and some
people complained about this being too much money per month
Satisfaction: Some complaints about the distance to the filter from their homes
Awareness: Confusion between arsenic and iron
Level of understanding: None of the club members seemed interested in understanding the mechanics
Reliability/Durability: The system has only required small repairs and has never been offline since its
instalment (except during cleaning)
Photos: IITB 2:3 and the area behind the filter where waste is dumped.

171
BESU Scale: Community (100-500 families)
# of Units Visited: 3
As Removal Mechanism: Regenerable adsorbent – activated alumina *HAIX media
Pump: Submersible pumps used but not required
Construction Materials: Cylindrical stainless steel tank mounted above a well-head; metal
pipes with metal tap(s) and often protected within a building or cage
(built after by villagers) and several 2500 - 4000 L storage tanks
Estimated Lifespan: Adsorbent needs replacing/ regeneration annually
Village Code: BESU 3:1 Visited on: July 31, 2012
Background
Village Name: Sakti Sadhana Club, Ashoknagar Town
Location: North 24 Paraganas, West Bengal, India
GPS: N22°50.503’ E 088°37.402’
Religion: Hindu
Total Households in Community: ~500 but surveyed nearest 100-150 households to the filter
Total Household Surveyed: 39
Mean Household Income for Village: 18,240 Rupees (~$304 USD) /month
Mean # People/Household: 4.51
Mean # Children/Household: 0.51
Type of Local Water Sources Used by Villagers: Villagers have a choice between paying for the filter
water and using municipal standpipes for drinking, and household
tube wells for non-drinking purposes.
Installation
Date: 2011
Duration: Several months to install in its entirety
Process: Club requested it to be installed after seeing others in the area. Local
gov’t donated the land to the club. The club organised fundraising to
pay 25% the initial capital costs and 75% paid for through the Tagore
Foundation (NGO)
Location: Near the center of town in the main football field beside the club
house
Cost: 300,000 Rupees (~$5,000 USD) for full system and building
Operation
[As] in Raw Water: >100 ppb
[As] in Treated Water: <10 ppb
Flow Rate: ~No delay to tap because water is treated and kept in the storage tank.
Flow from tap is ~200 L/hr but there are 3 that can be used
simultaneously
Vol of Treated Water Produced/Day: ~2500 L/day
Daily Treatment Time: Pumping into 4000L raw tank on the roof of the building takes 3
hours of pumping and then its gravity fed into the system. There are a
few minutes delay at first, as the water runs through the system but
throughout the day treatment is constant so there is no delay
Daily Operation Procedure: Operator pumps to fill up the top storage tank and
Reoccurring Costs: 500-750 R (~$7-11 USD) / month electricity plus repairs; Operator’s
salary of 1500 R ($25 USD) /month; Families pay 30 R ($0.50 USD)
/month for 20L of treated water/day plus a one-time membership fee
to the club of 70 R ($1.17 USD); Delivery sold privately at 100-120 R
($1.67- 2 USD) /month depending on the distance
Details on Operator(s): Local man chosen by the water committee that was formed within the
men’s club who is paid a monthly salary (relatively low compared to
area’s mean)
Maintenance Procedure: Daily backwash of the system and yearly replacement of the HAIX
media
Operator Training: Trained by BESU during installation briefly (~2 hours)
Frequency of Arsenic Testing: Once every 3 months
Arsenic Test Results Posted Publicly: Yes but results are in English

172
Visual Public Notice: In English and Bengla, clearly describe problem and system’s
designers and affiliations but without any contact information
Waste
Volume: Arsenic-rich liquid waste from regeneration process is 1600 kg
Type: Arsenic-rich adsorbent and relatively less arsenic-bearing backwash
Disposal Location(s): Backwash is dumped into a hold dug beside the filter that is filled
with rocks; Adsorbent is brought to central location to be regenerated
and solid sludge is buried there
Disposal Cost: New adsorbent: 18,000R ($300 USD); Regeneration: 10,000R ($167USD)
Feedback/Notes
Accountability: Operator is paid and help accountable to the water committee
Corruption: No complaints or suggestions of corruption
Satisfaction: People who cannot afford delivery complain about having to walk to the filter;
Awareness: Variable awareness in community about the local As problem and phys effects
Level of understanding: Operator aware of how system works mechanically, not chemically
Reliability/Durability: The system has only required small repairs and has never been offline since its
instalment (except during cleaning)
Trust: People trust the Tagore Foundation who helped fund the initial costs, so
therefore trust the system
Photos: Small delivery truck parked beside the building that houses the BESU 3:1 filter. The middle filter
photo is of the filter from the inside of the building, and the backwash exits out the hoses through the
brick wall to a brick-lined hole beside the building.
Village Code: BESU 3:2 Visited on: August 1, 2012
Background
Village Name: Nabarum Sangha Club, Ashoknagar (near Habra)
Location: North 24 Paraganas, West Bengal, India
GPS: N22°50.511’ E 088°37.414’
Religion: Hindu
Total Households in Community: ~100
Total Household Surveyed: 37
Mean Household Income for Village: 11,650 Rupees (~$194 USD) /month
Mean # People/Household: 4.26
Mean # Children/Household: 0.77
Type of Local Water Sources Used by Villagers: Villagers have a choice between paying for the filter
water and using municipal standpipes for drinking (which people
complain is full of iron and thus undrinkable), and use household
shallow tube wells for non-drinking purposes.
Installation
Date: 2004
Duration: One month initially but there have been several upgrades since
Process: The club was approached by Besu/Tagore Foundation (NGO) because
it was widely known that this area is highly contaminated.
Location: In the field beside the club house

173
Cost: 200,000 Rupees (~$3,300 USD) for full system and building but
materials and installation labour was donated by BESU
Operation
[As] in Raw Water: >100 ppb
[As] in Treated Water: 20-40 ppb
Flow Rate: ~No delay to tap because water is treated and kept in the storage tank.
Flow from tap is ~150 L/hr
Vol of Treated Water Produced/Day: ~2000 L/day
Daily Treatment Time: Pumping into 4000L raw tank on the roof of the building takes 3
hours of pumping and then its gravity fed into the system. There are a
few minutes delay at first, as the water runs through the system but
throughout the day treatment is constant so there is no delay
Daily Operation Procedure: Operator pumps to fill up the top storage tank and
Reoccurring Costs: 600 R (~$10 USD) / month electricity plus repairs; Operator’s salary
of 1000 R ($17 USD) /month; Families pay 20 R ($0.33 USD) /month
for 20L of treated water/day plus a one-time membership fee to the
club of 70 R ($1.17 USD); Delivery sold privately at 80-100 R
($1.33-1.67 USD) /month depending on the distance. Treasurer of
water committee estimated that total operation costs are 7,500 R
($125 USD) /month with a profit of 1500 R ($25 USD) /month for
future repairs/regeneration.
Details on Operator(s): Local man chosen by the water committee that was formed within the
men’s club who is paid a monthly salary (relatively low compared to
area’s mean)
Maintenance Procedure: Daily backwash of the system and yearly replacement of the HAIX
media
Operator Training: Trained by BESU during installation briefly (~2 hours)
Frequency of Arsenic Testing: Once per months
Arsenic Test Results Posted Publicly: Yes but results are in English
Visual Public Notice: In English and Bengla, clearly describe problem and system’s
designers and affiliations but without any contact information
Waste
Volume: Arsenic-rich liquid waste from regeneration process is 1600 kg
Type: Arsenic-rich adsorbent and relatively less arsenic-bearing backwash
Disposal Location(s): Backwash is dumped onto the grass of the adjacent field or into the
pond that is 30m away from the filter; Adsorbent is brought to central
location to be regenerated and solid sludge is buried there
Disposal Cost: New adsorbent: 18,000R ($300 USD); Regeneration: 10,000R ($167 USD)
Feedback/Notes
Accountability: One villager said that there are still high amounts of iron in the treated water
which shows that the operator is not doing his job properly and this not being monitored properly by the
committee.
Corruption: The area immediately behind the filter is very poor and most of those people
(within walking distance) say they cannot afford to buy the filter water so it is delivered to families
further away that can afford it; Several people also think that the club mixes ‘chemicals/medicine’ into
the water but say that they don’t.
Satisfaction: Several villagers feel they should not have to pay for the water, that its morally
wrong
Awareness: General awareness in community about the local arsenic problem and phys
effects
Level of understanding: Operator aware of how system works mechanically, not chemically
Reliability/Durability: The system has only required small repairs and has never been offline since its
instalment (except during cleaning and upgrading of system)

174
Photos: BESU 3:2 from the outside and inside.
Village Code: BESU 3:3 Visited on: August 2, 2012
Background
Village Name: Binimay Para, Ashoknagar (near Habra)
Location: North 24 Paraganas, West Bengal, India
GPS: N22°50.942’ E 088°37.057’
Religion: Hindu
Total Households in Community: ~100
Total Household Surveyed: 36
Mean Household Income for Village: 7,279 Rupees (~$121 USD) /month
Mean # People/Household: 4.03
Mean # Children/Household: 0.41
Type of Local Water Sources Used by Villagers: Villagers have a choice between paying for the filter
water and using municipal standpipes for drinking; Household
shallow tube wells are used for non-drinking purposes.
Installation
Date: 2004?
Duration: 5-6 weeks to install the system and construct the building
Process: Besu/Tagore Foundation approached the Panchayat who formed a
water committee to oversee the operation however it was dissolved
soon after.
Location: Near the main road used to exit the semi-isolated community
Cost: 100,000 Rupees (~$1,667USD) for full system and building
Operation
[As] in Raw Water: >200 ppb
[As] in Treated Water: 20-40 ppb
Flow Rate: ~No delay to tap because water is treated and kept in the storage tank.
Flow from tap is ~100 L/hr
Vol of Treated Water Produced/Day: <1000 L/day
Daily Treatment Time: Pumping into 2500L raw tank on the roof of the building takes 2
hours of pumping and then its gravity fed into the system. There are a
few minutes delay at first, as the water runs through the system but
throughout the day treatment is constant so there is no delay
Daily Operation Procedure: Operator pumps to fill up the top storage tank and
Reoccurring Costs: 300 R (~$5 USD) / month electricity plus repairs; Operator’s salary of
1000R ($17 USD) /month; Families pay 15 R ($0.25 USD) /month
for 20L of treated water/day
Details on Operator(s): Local man volunteered but because not many people use this filter he
often doesn’t make any salary so doesn’t feel the need to operate it
every day

175
Maintenance Procedure: Daily backwash of the system and yearly replacement of adsorbent
media
Operator Training: Trained by BESU during installation briefly (~1 hours)
Frequency of Arsenic Testing: Unknown (never?)
Arsenic Test Results Posted Publicly: No
Visual Public Notice: No notice
Waste
Volume: Arsenic-rich liquid waste from regeneration process is 1600 kg
Type: Arsenic-rich adsorbent and relatively less arsenic-bearing backwash
Disposal Location(s): Backwash is supposed to be dumped into a holding tank beside the
filter that however villagers report that it is dumped into the adjacent
pond; Adsorbent is supposed to be brought to central location to be
regenerated and solid sludge is buried there however nobody
remembers this actually occurring
Disposal Cost: New adsorbent: 18,000R ($300 USD); Regeneration: 10,000R ($167 USD)
Feedback/Notes
Accountability: There is no water committee or any form of accountability/over-seeing of the operator
Satisfaction: People generally very unhappy with having to pay since they “are so poor”
Awareness: Variable awareness in community about the local arsenic problem and phys effects
Level of understanding: Operator seems totally disinterested in the system and often sends his 10 year
old son to operate it
Photos: BESU 3:3 from the outside and inside.
PalT/Harbr
Scale: Community (200-500 families)
# of Units Visited: 4
As Removal Mechanism: One-time use arsenic adsorbent – granular ferric hydroxide /
AdsorpAs®
Pump: Submersible pumps used but not required
Construction Materials: Cylindrical stainless steel tanks connected well-head; metal pipes
with metal tap(s) and often protected within a building or cage and
and several 2500 - 4000 L storage tanks
Estimated Lifespan: Adsorbent last 12-18 months before it needs replacing
Village Code: PalT 4:1 Visited on: August 8, 2012
Background
Village Name: Harunghata Hospital, Harin Ghata
Location: Nadia, West Bengal, India
GPS: N22°56.748’ E 088°32.520’

176
Religion: Hindu
Total Households in Community: ~150
Total Household Surveyed: 39
Mean Household Income for Village: 8590 Rupees (~$143 USD) /month
Mean # People/Household: 4.28
Mean # Children/Household: 1.0
Type of Local Water Sources Used by Villagers: Villagers have a choice between paying for the filter
water or using household shallow tube wells
Installation
Date: 2011
Duration: 2-3 months
Process: Funded through the Government of West Bengal, contracted to install
hundreds of systems; Partnered with an NGO called Sajil Dhara in
this case who approached the hospital directly.
Location: Beside the hospital along the main road
Cost: 300,000 Rupees (~$5,000 USD) for full system and building
Operation
[As] in Raw Water: <10 ppb
[As] in Treated Water: Below detectable limit
Flow Rate: ~No delay to tap because water is treated and kept in the storage tank.
Flow from tap is ~200 L/hr but there are 2 that can be used
simultaneously
Vol of Treated Water Produced/Day: ~3,000 L/day
Daily Treatment Time: Pumping into 3,000L raw tank on the roof of the building takes 3
hours of pumping and then its gravity fed into the system into the
treated water storage tank and then out to the user
Daily Operation Procedure: System backwash which takes 15 minutes /day and then pumping of
raw water into the top storage tank is on-going throughout the day
Reoccurring Costs: 1,200 R (~$20 USD) /month electricity plus repairs; Operator’s salary
of 600R ($10 USD) /month; Families pay 0.2R ($0.003 USD) /L
Details on Operator(s): Operator is woman who was chosen by the hospital board (her salary
approx. half of that of male operator’s)
Maintenance Procedure: Daily backwash and yearly replacement of the adsorption media
Operator Training: Trained by Sajil Dhara NGO
Frequency of Arsenic Testing: Unknown
Arsenic Test Results Posted Publicly: No
Visual Public Notice: In English and Bengla, name of company but without any contact
information (of the company or NGO)
Waste
Volume: 10-20L of backwash per day; approx. 200L of spent adsorbent /year
Type: Arsenic-rich adsorbent and relatively less arsenic-bearing backwash
Disposal Location(s): Backwash is dumped onto the grass beside the filter and spent
adsorbent dumped openly anywhere
Disposal Cost: New adsorbent: 22,000R ($367 USD)
Feedback/Notes
Accountability: Operator is paid and held accountable to the hospital and NGO that oversee the
operation of the system
Corruption: System generates a large profit but there is no transparency in accounts
Satisfaction: Local people very unhappy about the price and chose to drink untreated water instead
Awareness: Community generally aware that there is a problem with the water but aren’t totally
clear on what arsenic is or the physical effects of arsenic on the body.
Level of understanding: Operator aware of how system works mechanically, but not open to talk about it
Reliability/Durability: Never offline since it was installed
Trust: Accounts record and villagers given written receipt of daily water purchase.

177
Photos: PalT 4:1 from the outside and the operator
Village Code: PalT 4:2 Visited on: September 9, 2012
Background
Village Name: Srimanta para
Location: Murshidabad, West Bengal, India
GPS: N24°25.483’ E 088°14.836’
Religion: Hindu
Total Households in Community: ~100
Total Household Surveyed: 40
Mean Household Income for Village: 16,560 Rupees (~$276 USD) /month
Mean # People/Household: 5.08
Mean # Children/Household: 1.1
Type of Local Water Sources Used by Villagers: Villagers have a choice between paying for the filter
water or using household shallow tube wells or drinking from
municipal stand pipes
Installation
Date: 2009
Duration: > 1month
Process: Funded through the Government of West Bengal, contracted to install
hundreds of systems; Partnered with an NGO called Sajil Dhara in
this case who approached the Panchayat directly and helped create a
local water committee (all men) to oversee operation.
Location: Beside the main road
Cost: 300,000 Rupees (~$5,000 USD) for full system and building
Operation
[As] in Raw Water: 20-40 ppb
[As] in Treated Water: <10 ppb
Flow Rate: ~No delay to tap because water is treated and kept in the storage tank.
Flow from tap is ~200 L/hr but there are 2 that can be used
simultaneously
Vol of Treated Water Produced/Day: ~1,500 L/day
Daily Treatment Time: Pumping into 3,000L raw tank on the roof of the building takes 3
hours of pumping and then its gravity fed into the system into the
treated water storage tank and then out to the user
Daily Operation Procedure: System backwash which takes 25 minutes /day and then pumping of
raw water into the top storage tank is on-going throughout the day
Reoccurring Costs: 800 R (~$13 USD) /month electricity plus repairs; Operator’s salary
of 1,500R ($25 USD) /month; Families pay 20 R ($0.33 USD) /month
for 15L daily (regardless of the size of family)

178
Details on Operator(s): Operator was chosen by the water committee, there was a formal
application and interview process before he was hired
Maintenance Procedure: Daily backwash and yearly replacement of the adsorption media
Operator Training: Trained by Pal Trockner
Frequency of Arsenic Testing: Unknown
Arsenic Test Results Posted Publicly: No
Visual Public Notice: In Bengla, name of company with contact information and
explanation of operation
Waste
Volume: 20-30L of backwash per day; approx. 200L of spent adsorbent /year
Type: Arsenic-rich adsorbent and relatively less arsenic-bearing backwash
Disposal Location(s): Backwash is dumped onto the grass beside the filter and spent
adsorbent dumped openly anywhere
Disposal Cost: New adsorbent: 22,000R ($367 USD)/ 12-18 months
Feedback/Notes
Accountability: Operator is paid and held accountable by the water committee
Corruption: Accounts record and villagers given written receipt of daily water purchase;
Satisfaction: Located on the edge of the road on one side of the village and people who live
on the other side think it is too far to walk (~800 m); 15L isn’t enough per day for families with large
number of people
Awareness: Community generally aware that there is a problem with the water but aren’t
totally clear on what arsenic is or the physical effects of arsenic on the body
Reliability/Durability: Never offline since it was installed
Trust: The operator was asked for proof of testing or certification for the filtration
process which he couldn’t give so they don’t believe it is safe
Photos: PalT 4:2 and a close-up of the Bangla sign which displays the opening hours and price.
Village Code: Harb 5:1 Visited on: August 29, 2012
Background
Village Name: Block District Office in Phulia
Location: Nadia, West Bengal, India
GPS: N23°14.041’ E 088°29.748’
Religion: Hindu
Total Households in Community: ~500
Total Household Surveyed: 36
Mean Household Income for Village: 12,300 Rupees (~$205 USD) /month
Mean # People/Household: 4.19
Mean # Children/Household: 0.72
Type of Local Water Sources Used by Villagers: Villagers have a choice between paying for the filter
water or using household shallow tube wells. There are also a few
municipal stand pipes throughout the village (have high iron
content)
Installation
Date: 2011
Duration: 4-5 weeks

179
Process: Funded through the Government of West Bengal, contracted to install
hundreds of systems. No villagers/stakeholders consulted
Location: Beside the Block District Office building (Government office) near a
traffic circle in the centre of town
Cost: 330,000 Rupees (~$5,500 USD) for full system and building
Operation
[As] in Raw Water: <10 ppb
[As] in Treated Water: Below detectable limit
Flow Rate: ~No delay to tap because water is treated and kept in the storage tank.
Flow from tap is ~800 L/hr and there are 2 that can be used
simultaneously
Vol of Treated Water Produced/Day: ~10,000-12,000 L/day
Daily Treatment Time: Pumping into 3,000L raw tank on the roof of the building takes 1
hour of pumping and then its gravity fed into the system into the
treated water storage tank and then out to the user
Daily Operation Procedure: System backwash which takes 15 minutes twice /month and then
pumping of raw water into the top storage tank is on-going
throughout the day
Reoccurring Costs: 1,000 R (~$17 USD) /month electricity plus repairs; Operator’s salary
of 1,000 R ($17 USD) /month; Families pay 0.4R ($0.007 USD) /L
Details on Operator(s): Operator was hired by government office
Maintenance Procedure: Daily backwash and yearly replacement of the adsorption media
Operator Training: Trained by Harbauer
Frequency of Arsenic Testing: Unknown
Arsenic Test Results Posted Publicly: No
Visual Public Notice: In English and Bengla, name of company but without any contact
information (of the company or NGO)
Waste
Volume: 20L of backwash twice /month; approx. 200L of spent adsorbent
/year
Type: Arsenic-rich adsorbent and relatively less arsenic-bearing backwash
Disposal Location(s): Backwash is poured into the drain which runs into the nearby pond,
and spent adsorbent dumped openly anywhere
Disposal Cost: New adsorbent: 22,000R ($367 USD)
Feedback/Notes
Accountability: System has a water meter so though no receipt is given too each customer, the
operator must hand in money based on the total amount of treated water produced each day.
Corruption: System generates a large profit (Approx 5,000 R/day) but there is no
transparency in accounts, and is thus assumed it goes to someone in the government office next door
Satisfaction: People travel from as far as 5km away to purchase (caters to more wealthy
villagers) and many complaints about the very high price
Reliability/Durability: Never offline since it was installed
Photos:Harb 5:1 and the sign that that describes who the sponsor and manufacturer are.

180
Village Code: Harb 5:2 Visited on: August 30, 2012
Background
Village Name: Baruipur
Location: S 24 Parganas West Bengal, India
GPS: N22°21.396’ E 088°25.457’
Religion: Muslim
Total Households in Community: ~100
Total Household Surveyed: 42
Mean Household Income for Village: 6,650 Rupees (~$111 USD) /month
Mean # People/Household: 4.69
Mean # Children/Household: 1.07
Type of Local Water Sources Used by Villagers: Villagers have a choice between paying for the filter
water or using household shallow tube wells.
Installation
Date: 2010
Duration: Approx. 6 weeks
Process: Funded through the Government of West Bengal, contracted to install
hundreds of systems. No villagers/stakeholders consulted, organised
through Panchayat. No current active water committee exists.
Location: Beside the main road as you enter town (beside new bridge)
Cost: 400,000 Rupees (~$6,600 USD) for full system
Operation
[As] in Raw Water: Below detectable limit
[As] in Treated Water: Below detectable limit
Flow Rate: ~No delay to tap because water is treated and kept in the storage tank.
Flow from tap is ~500 L/hr
Vol of Treated Water Produced/Day: ~2,000 L/day
Daily Treatment Time: Pumping into 4,000L raw tank on the roof of the building takes 2
hours of pumping and then its gravity fed into the system into the
treated water storage tank and then out to the user
Daily Operation Procedure: System backwash which takes 15 daily and then pumping of raw
water into the top storage tank is on-going throughout the day
Reoccurring Costs: 800 R (~$8 USD) /month electricity plus repairs; Operator’s salary of
1,400R ($23 USD) /month; Families pay 15R ($0.25 USD) /month
for unlimited amount of litres use
Details on Operator(s): Operator was appointed by the Panchayat
Maintenance Procedure: Daily backwash and yearly replacement of the adsorption media
Operator Training: Trained by Harbauer
Frequency of Arsenic Testing: Unknown
Arsenic Test Results Posted Publicly: No
Visual Public Notice: In English and Bengla, name of company but without any contact
information (of the company or NGO)
Waste
Volume: 20L of backwash twice /month; approx. 200L of spent adsorbent /year
Type: Arsenic-rich adsorbent and relatively less arsenic-bearing backwash
Disposal Location(s): Backwash is poured into ground behind the filter (which connects to the local
pond), and spent adsorbent dumped openly anywhere
Disposal Cost: New adsorbent: 22,000R ($367 USD)
Feedback/Notes
Accountability: There doesn’t seem to be much accountability as there the villagers pay
directly to operator who has no objective body or committee overseeing the operation/system
Satisfaction: Villagers not happy with the price. They think it’s far too expensive.
Reliability/Durability: Never offline since it was installed

181
Photos: Harbr 5:2 from the front and a close up of the sign which is the manufacturer info.
AIIH&PH
Scale: Community (100-250 families)
# of Units Visited: 3
As Removal Mechanism: Chemical oxidation and coagulation using sodium hypochloride and
aluminium sulphate
Pump: Hand
Construction Materials: Metal tanks, pipes, metal tap(s) and plastic buckets and tubing
Estimated Lifespan: Months-Years (because of needed on-going chemical replacement)
Village Code: AIIH&PH 6:1 Visited on: September 6, 2012
Background
Village Name: Kouri para, Bahadurpur GP
Location: Murshidabad, West Bengal, India
GPS: N24°25.371’ E 088°13.737’
Religion: Hindu
Total Households in Community: ~100
Total Household Surveyed: 39
Mean Household Income for Village: 5,525 Rupees (~$92 USD) /month
Mean # People/Household: 5.78
Mean # Children/Household: 1.68
Type of Local Water Sources Used by Villagers: Mostly using household/public shallow tube wells for
drinking
Installation
Date: 2010
Duration: < 1 month
Process: Funded through the Government of India. AIIH&PH worked with
West Bengal Volunteer Health Association (WBVHA-Lalgola), to
locate arsenic affected areas. The local Panchayat was contacted
about finding land to donate and about forming a local water
committee.
Location: Along the ring road that goes through the village
Cost: 105,000 Rupees (~$1,750 USD) for full system
Operation
[As] in Raw Water: 20-40 ppb
[As] in Treated Water: <10 ppb
Flow Rate: Hand pump needs to be pumped for 5-10 minutes first (40 pumps to
fill 500ml bottle), then the flow from tap is ~200 L/hr

182
Vol of Treated Water Produced/Day: ~1,000 L/day
Daily Treatment Time: On-going, treatment is done to-order as there is no holding tank for
treated water. Flow through the system takes several minutes
Daily Operation Procedure: Ensures the buckets on the top have proper chemicals in them and
pump
Reoccurring Costs: Operator’s salary is dependent on how many people decide to pay;
Families are asked to pay 10 R ($0.17 USD) /month, but very few do
Details on Operator(s): Operator is the owner of the land
Maintenance Procedure: Backwash which takes 15 minutes /day and empty flocculent
catchment tank.
Operator Training: Trained by AIIH&PH and WBVHA in one session
Frequency of Arsenic Testing: None (supposed to be but isn’t tested)
Arsenic Test Results Posted Publicly: No
Visual Public Notice: Description of how the system works, names of all affiliations are in
English without any contact information. Phone number of the
manufacturer of the equipment is posted publically.
Waste
Volume: 10L of backwash per day; ~1.5kg of dry arsenic-rich sludge /month
Type: Arsenic-rich flocculants relatively less arsenic-bearing backwash
Disposal Location(s): Backwash and flocculants are put into a pit near the filter
Disposal Cost: None
Feedback/Notes
Accountability: There is a water committee established
Satisfaction: “Cost is too high, so we don’t use the filter”
Awareness: many people recognised that putting the waste into the pit is dangerous
Level of understanding: There were no chemicals in the buckets at all (possibly because so few people
use the filter anymore)
Reliability/Durability: The hand pump is broken and the operator has called the plumber and
Jadavpur Uni for help. They someone would come to fix it and nobody has come (it’s been 18 months).
As a consequence of the hand pump squirting water everywhere during pumping, the filter is difficult to
use.
Trust: Villagers feel abandoned
Photos: AIIH&PH 6:1 form the side and a view from the top of the chemical bucket.
183
Village Code: AIIH&PH 6:2 Visited on: September 7, 2012
Background
Village Name: Malatipur para, Bilborapopra GP
Location: Murshidabad, West Bengal, India
GPS: N24°26.041’ E 088°13.417’
Religion: Muslim
Total Households in Community: ~100
Total Household Surveyed: 27 (left village early due to several aggressive villagers)
Mean Household Income for Village: 6,825 Rupees (~$114 USD) /month
Mean # People/Household: 6.11
Mean # Children/Household: 1.44
Type of Local Water Sources Used by Villagers: Using household/public shallow tube wells for drinking
Installation
Date: 2009
Duration: < 1 month
Process: Funded through the Government of India. AIIH&PH worked with
West Bengal Volunteer Health Association (WBVHA-Lalgola), to
locate arsenic affected areas. The local Panchayat was contacted
about finding land to donate and about forming a local water
committee.
Location: Along the ring road that goes through the village
Cost: 105,000 Rupees (~$1,750 USD) for full system
Operation
[As] in Raw Water: 60-80 ppb
[As] in Treated Water: Filter broken – Not functioning so sampling was impossible
Flow Rate: Unknown
Vol of Treated Water Produced/Day: None , as it is broken, but normally around 2,000-3,000 L /day
Daily Treatment Time: On-going, treatment is done to-order as there is no holding tank for
treated water. Flow through the system takes several minutes
Daily Operation Procedure: Ensured the buckets on the top have proper chemicals in them and
pump (6-7 hours of pumping total to provide water for everyone, so
many men are needed to take turns using the pump contantly
Reoccurring Costs: Buying the chemicals (unknown price). Was told by JU that they
would return with free re-fills of chemicals but they never returned.
Unsure as to where to buy them so have never been replaced.
Details on Operator(s): Operator is the owner of the land
Maintenance Procedure: Empty flocculent catchment tank daily. Tanks backwashed 1 time
/month and takes 2 hours of washing
Operator Training: Trained by AIIH&PH-JU and WBVHA in one 2-2.5hour session
Frequency of Arsenic Testing: None (supposed to be but isn’t tested)
Arsenic Test Results Posted Publicly: No
Visual Public Notice: Description of how the system works, names of all affiliations are in
English without any contact information. Phone number of the
manufacturer of the equipment is posted publically.
Waste
Volume: 10L of backwash per day; ~1.5kg of dry arsenic-rich sludge /month
Type: Arsenic-rich flocculants relatively less arsenic-bearing backwash
Disposal Location(s): Backwash and flocculants are put into a the field behind the filter
Disposal Cost: None
Feedback/Notes
Accountability: Panchayat chose the committee which has been dissolved for years
Satisfaction: Several villagers unhappy with the taste of the treated water. “Tasted of
bleaching powder”, “Tastes bad”, “We didn’t like the taste”.
Reliability/Durability: The hand pump broken so a committee member travelled to JU to ask for help
in person and they said that a plumber would come to help but hasn’t.
Trust: Villagers feel frustrated.
Corruption: When the filter was working, the operator charged 10R/month for each family
to use it. After some time he built an addition to his house which upset many neighbours because they
didn’t feel it was ethical that he was personally financially profiting from the sales of clean water. Many

184
feel it should be totally free. Some stopped using the filter even before it broke because of this situation
and didn’t want their money “to go into the pockets of the operator”.
Photo: AIIH&PH 6:2
Village Code: AIIH&PH 6:3 Visited on: September 8, 2012
Background
Village Name: Jiagung
Location: Murshidabad, West Bengal, India
GPS: N24°16.234’ E 088°16.024’
Religion: Muslim
Total Households in Community: ~100
Total Household Surveyed: 39
Mean Household Income for Village: 5,350 Rupees (~$89 USD) /month
Mean # People/Household: 6.05
Mean # Children/Household: 1.72
Type of Local Water Sources Used by Villagers: Mostly using household/public shallow tube wells for
drinking
Installation
Date: 2012
Duration: 1 month to build and 1 month of waiting to get chemicals
Process: Funded through the Government of India. AIIH&PH worked with
West Bengal Volunteer Health Association (WBVHA-Lalgola), to
locate arsenic affected areas. The local Panchayat was contacted
about finding land to donate and about forming a local water
committee. WBVHA has held several information meetings with
village about arsenic awareness
Location: Along the main road into the village
Cost: 105,000 Rupees (~$1,750 USD) for full system
Operation
[As] in Raw Water: 350 ppb
[As] in Treated Water: <10 ppb
Flow Rate: Hand pump needs to be pumped for several hours to have regular
flow (~200L /hour)
Vol of Treated Water Produced/Day: ~1,500 L/day
Daily Treatment Time: On-going, treatment is done to-order as there is no holding tank for
treated water. Flow through the system takes several minutes (delay)
Daily Operation Procedure: Ensures the buckets on the top have proper chemicals in them and pump
Reoccurring Costs: Operator’s salary is 600 R ($10 USD) /month and all other money
goes to repair costs; Families are asked to pay 10-15 R ($0.17-0.25
USD) /month
Details on Operator(s): Operator is the owner of the land
Maintenance Procedure: Backwash and empty flocculent catchment tank once every 3-4
months and takes approximately 8 hours

185
Operator Training: The husband, wife and children were all trained by WBVHA for 3 days
Frequency of Arsenic Testing: None (supposed to be but isn’t tested)
Arsenic Test Results Posted Publicly: No
Visual Public Notice: Description of how the system works, names of all affiliations are in
English without any contact information. Phone number of the
manufacturer of the equipment is posted publically.
Waste
Volume: 100L backwash once every 3-4 months; ~25kg of dry arsenic-rich sludge /yr
Type: Arsenic-rich flocculants relatively less arsenic-bearing backwash
Disposal Location(s): Backwash and flocculants are put into a hole beside the filter
Feedback/Notes
Accountability: There is a water committee established.
Satisfaction: Villagers have a serious problem with the operator. “I never use the filter because I had
a quarrel with the land owner.” “We don’t use the filter because we don’t trust the person whose land the
filter is on. They use the water for all purposes including bathing and when we try to take water they
shout at us.” We don’t use the filter because the land owner is rude.” “The man on whose land the filter is
one doesn’t let anyone use it.”
Awareness: NGO held several (<5) village meetings about arsenic awareness but according to some
villagers, “they still don’t believe.”
Trust: Some villagers are concerned that they have never seen the plant being cleaned.
“Nobody ever maintains the filter.” “We have never seen anyone clean it.”
Photos: AIIH&PH 6:3 and the hole full of waste that is beside the filter.
CGCRI Scale: Community (~100 families)
# of Units Visited: 3
As Removal Mechanism: Adsorption using unspecified colloidal media particles suspended in
water
Pump: Submersible pump (2Kg/cm2
pressure required for membrane
operation)
Construction Materials: Metal tanks, pipes, metal tap(s) and plastic tubing
Estimated Lifespan: 10-15 years?
Village Code: CGCRI 7:1 Visited on: September 14, 2012
Background
Village Name: Nibedita pally, Barasat
Location: North 24 Parganas, West Bengal, India
GPS: N22°44.134’ E 088°29.602’
Religion: Hindu
Total Households in Community: ~100

186
Total Household Surveyed: 43
Mean Household Income for Village: 6,465 Rupees (~$108 USD) /month
Mean # People/Household: 4.33
Mean # Children/Household: 1.02
Type of Local Water Sources Used by Villagers: Mostly using household shallow tube wells or municipal
standpipes for drinking
Installation
Date: 2003
Duration: < 1 week
Process: Funded through the Public Health Engineering Directorate (PHED)
Govt. of West Bengal. A local man was contacted about operating the
system because is family with someone from the government, so he
donated the land and was encouraged to use this as a business
opportunity (selling water).
Location: In the center of the village on the edge of a man’s yard
Cost: 400,000 Rupees (~$6,667 USD) for full system
Operation
[As] in Raw Water: Below the Detectable Limit
[As] in Treated Water: Broken
Flow Rate: Broken
Vol of Treated Water Produced/Day: 2,500 L/day (if working)
Daily Treatment Time: On-going, treatment is done to-order as there is no holding tank for
treated water. Flow through the system takes several minutes
Daily Operation Procedure: Adds media and mixes for 1 hour then waits 12 hours for oxidation to
occur and then filtration through the membrane can occur.
Reoccurring Costs: Replacement of adsorbent media, operator’s wage is paid with profits
(if there are any), electricity which is approximately 1,000 R ($17
USD)/ month
Details on Operator(s): Operator is the owner of the land who seems very defensive with his
answers and goes back to change previous answers in the interview.
(Untrustworthy source?)
Maintenance Procedure: Daily backwashing, washing of membrane and removal of arsenic-
rich sediments from feeder tank once every few months
Operator Training: Trained by CGCRI in one session
Frequency of Arsenic Testing: None (supposed to be but isn’t tested)
Arsenic Test Results Posted Publicly: No
Visual Public Notice: None
Waste
Volume: 150L of liquid arsenic-rich sludge /month
Type: Arsenic-rich flocculants
Disposal Location(s): Backwash is dumped beside the filter and flocculants are put into a
barrel and given back to CGCRI
Feedback/Notes
Accountability: The filter is run as a household business so there is no village input to how it is run
Satisfaction: Many people said the water costed too much and didn’t use it because of that/
Awareness: many people recognised that putting the waste into the pit is dangerous
Reliability/Durability: Broken for 5-6 years and the operator hasn’t bothered to get it fixed.
Trust: “We didn’t use the filter because it was not well-maintained”. Note: Owner/operator
would not let me take ANY photo’s of the system and because it is on his property I couldn’t due to
privacy request.
Not given permission to take photos of CGCRI 7:1 as it sits on private property.
Village Code: CGCRI 7:2 Visited on: September 15, 2012
Background
Village Name: Akrampur Talikhola, Barasat
Location: North 24 Parganas, West Bengal, India
GPS: N22°44.061’ E 088°28.169’
Religion: Hindu/Muslim mixed
Total Households in Community: ~100
Total Household Surveyed: 25

187
Mean Household Income for Village: 4,875 Rupees (~$81 USD) /month
Mean # People/Household: 4.52
Mean # Children/Household: 1.16
Installation Date: 2001
Duration: < 1 month
Process: Funded through the Public Health Engineering Directorate (PHED)
Govt. of West Bengal. A local family was contacted about operating
the system through the Panchayat, so they donated the land and was
encouraged to use this as a business opportunity (selling water).
Location: Near the center of the village, behind their house
Cost: 450,000 Rupees (~$7,500 USD) for full system
Operation
[As] in Raw Water: 100 ppb
[As] in Treated Water: <10 ppb
Flow Rate: Flow rate from the membrane is <100 L/hr however they fill a
holding tank with a tap that flows much faster
Vol of Treated Water Produced/Day: 500 L/day
Daily Treatment Time: 5-6 hours to fill the 500 L holding tank
Daily Operation Procedure: Adds media and mixes for 1 hour then waits 12 hours for oxidation to
occur and then filtration through the membrane can occur.
Reoccurring Costs: Replacement of adsorbent media (500 ml/ 10,000 L of water),
electricity which is approximately 900 R ($15 USD) /month; Users
charged 0.5 R/L
Details on Operator(s): Operator is the family’s oldest son
Maintenance Procedure: Backwashing of system, washing of membrane with water and a
brush, and removal of arsenic-rich sediments from feeder tank every
3-4 months.
Operator Training: Trained by CGCRI irregularly over 3-4 months
Frequency of Arsenic Testing: None (supposed to be but isn’t tested)
Arsenic Test Results Posted Publicly: No
Visual Public Notice: One sign in English stating the funding body and designer but without
contact information (see photo below)
Waste
Volume: 40L of dry arsenic-rich sludge /year
Type: Arsenic-rich flocculants
Disposal Location(s): Backwash is dumped beside the filter and flocculants are put into a
barrel and given back to CGCRI
Disposal Cost: None
Feedback/Notes
Accountability: The filter is run as a household business so there is no village input to how it is run
Satisfaction: Many people said the water costed too much and didn’t use it because of that
Reliability/Durability: The filter has been broken for 5-6 years and the operator hasn’t bothered to get it
fixed. Trust: “We didn’t use the filter because it was not well-maintained”
Photo: CGCRI 7:2

188
Village Code: CGCRI 7:3 Visited on: September 16, 2012
Background
Village Name: Akrampur para, Barasat
Location: North 24 Parganas, West Bengal, India
GPS: N22°43.960’ E 088°28.263’
Religion: Muslim
Total Households in Community: ~100
Total Household Surveyed: 37
Mean Household Income for Village: 7,121 Rupees (~$118 USD) /month
Mean # People/Household: 4.65
Mean # Children/Household: 0.57
Type of Water Sources Used by Villagers: using municipal standpipes or household shallow tube wells
Installation
Date: 2003
Duration: 2 weeks
Location: Near the center of the village, along the main road
Cost: 200,000 Rupees (~$3,333 USD) for full system
Operation
[As] in Raw Water: 60-80 ppb
[As] in Treated Water: <10 ppb
Flow Rate: Flow rate from the membrane is <100 L/hr however they fill a
holding tank with a tap that flows much faster
Vol of Treated Water Produced/Day: 500 L/day
Daily Treatment Time: 3 hours to fill the 2,500 L holding tank
Daily Operation Procedure: Adds media and mixes for 1 hour then waits 12 hours for oxidation to
occur and then filtration through the membrane can occur.
Reoccurring Costs: Replacement of adsorbent media (500 ml/ 10,000 L of water),
electricity which is approximately 1,200 R ($20 USD) /month; Users
charged 1.0 R/L but includes free delivery
Details on Operator(s): Operator was hired by the land/system owner
Maintenance Procedure: Backwashing of system, washing of membrane with water and a
brush, and removal of arsenic-rich sediments from feeder tank every
3-4 months.
Operator Training: Owner was trained by CGCRI in 1 day and operator trained in 1 hr by owner
Frequency of Arsenic Testing: None (supposed to be but isn’t tested)
Arsenic Test Results Posted Publicly: No
Visual Public Notice: One sign in English stating the funding body and designer with phone
number and email information (see photo below)
Waste
Volume: 20L of liquid arsenic-rich sludge /month
Type: Arsenic-rich flocculants
Disposal Location(s): Backwash and flocculants are dumped into the pond behind the filter
Feedback/Notes
Accountability: The filter is run as a household business so there is no village input to how it is run
Satisfaction: Many people said the water costed too much and didn’t use it because of that.
Photos: CGCRI 7:3 and a photo of the sign.

189
Dug Wells
Scale: Community (~30-50 families)
# of Units Visited: 3
As Removal Mechanism: None required because this system uses surface water infiltration to
shallow well and not the arsenic contaminated aquifer lower in the
ground
Pump: Hand
Construction Materials: Cement rings, pvc pipe, netting, tin roof
Estimated Lifespan: Unknown
Village Code: Dug 8:1 Visited on: August 7, 2012
Background
Village Name: Faridkati para, Bishnupur Block
Location: North 24 Parganas, West Bengal, India
GPS: N22°54.506’ E 088°47.465’
Well ID: PW 55
Religion: Hindu
Total Households in Community: <50
Total Household Surveyed: 35
Mean Household Income for Village: 3,994 Rupees (~$67 USD) /month
Mean # People/Household: 3.86
Mean # Children/Household: 0.80
Type of Local Water Sources Used by Villagers: Mostly using household shallow tube wells or the club’s
deep tube well for drinking and dug well water for cooking
Installation
Date: 2007
Duration: < 1 week
Process: Funded through private donations to Project Well and/or Aqua
Welfare Society
Location: In the center of the village beside the main road
Cost: 42,000 Rupees (~$700 USD) for full system
Operation
[As] in Raw Water: 60-100ppb (tube well nearest to dug well)
[As] in Treated Water: <10ppb
Flow Rate: Attached directly to a hand pump so depends on speed of pumping
Vol of Treated Water Produced/Day: Unknown
Daily Treatment Time: None
Daily Operation Procedure: None (Hand pumping)
Reoccurring Costs: Replacement of bleaching agent is 180 R, ($3 USD) /year; Some
households pay 10 R ($0.17 USD) /month to use but is mostly free;
Field worker’s salary is 1,500 R ($25 USD) / month but isn’t the
‘operator’
Details on Operator(s): Field worker is recruited locally (within village) to look after the Dug
Well
Maintenance Procedure: Addition of Theoline (bleaching agent) once /week
Operator Training: Trained by Aqua Welfare Society’s supervisor
Frequency of Arsenic Testing: Yearly testing
Arsenic Test Results Posted Publicly: No
Visual Public Notice: English sign posted; Bengla information pamphlets handed out by
field workers regularly
Waste None.
Feedback/Notes
Accountability: Water committee is formed within each community to hold field worker accountable
Satisfaction: Water smells like pond water /jute so don’t like drinking it;
Awareness: Mostly aware of arsenic problem (due to AWS campaign)
Reliability/Durability: Rumours that there are worms in the water

190
Photos: Dug 8:1 from the side and top
Village Code: Dug 8:2 Visited on: August 14, 2012
Background
Village Name: Naryanpur, Chakda Block
Location: Nadia, West Bengal, India
GPS: N23°01.132’ E 088°36.530’
Well ID: PW 177 & 157
Religion: Hindu
Total Households in Community: <50
Total Household Surveyed: 34
Mean Household Income for Village: 4,520 Rupees (~$75 USD) /month
Mean # People/Household: 5.03
Mean # Children/Household: 0.94
Type of Local Water Sources Used by Villagers: Mostly using household shallow tube wells or dug well
water
Installation
Date: 2011
Duration: < 1 week
Process: Funded through private donations to Project Well and/or Aqua
Welfare Society
Location: In the center of the village, along a road
Cost: 42,000 Rupees (~$700 USD) for full system
Operation
[As] in Raw Water: 50 ppb (tube well nearest to dug well)
[As] in Treated Water: Below Detectable Limit
Flow Rate: Attached directly to a hand pump so depends on speed of pumping
Vol of Treated Water Produced/Day: Unknown
Daily Treatment Time: None
Daily Operation Procedure: None (Hand pumping)
Reoccurring Costs: Replacement of bleaching agent is 180 R, ($3 USD) /year; Field
worker’s salary is 1,500 R ($25 USD) / month
Details on Operator(s): Field worker is recruited locally (within village) to look after the Dug
Well
Maintenance Procedure: Addition of Theoline (bleaching agent) once /week
Operator Training: Trained by Aqua Welfare Society’s supervisor
Frequency of Arsenic Testing: Annual testing
Arsenic Test Results Posted Publicly: No
Visual Public Notice: English sign posted; Bengla information pamphlets handed out by
field workers regularly
Feedback/Notes
Accountability: Water committee is formed within each community to hold field worker accountable
Satisfaction: Still use the water even though it smells ‘muddy’
Awareness: Mostly aware of arsenic problem (due to AWS campaign)
Trust: Stopped using it when the latrine was constructed nearby.

191
Photos: Dug 8:2 being used by a local woman and the sign.
Village Code: Dug 8:3 Visited on: August 15, 2012
Background
Village Name: Pachim para, Dumuria, Chakda Block
Location: Nadia, West Bengal, India
GPS: N23°03.120’ E 088°37.200’
Well ID: PW 153 & 149
Religion: Hindu
Total Households in Community: <50
Total Household Surveyed: 30
Mean Household Income for Village: 4,050 Rupees (~$68 USD) /month
Mean # People/Household: 4.20
Mean # Children/Household: 0.90
Type of Local Water Sources Used by Villagers: Mostly using household shallow tube wells or dug well
water
Installation
Date: 2010
Duration: < 1 week
Process: Funded through private donations to Project Well and/or Aqua
Welfare Society
Location: In the center of the village, along a road
Cost: 42,000 Rupees (~$700 USD) for full system
Operation
[As] in Raw Water: Not tested
[As] in Treated Water: Below Detectable Limit
Flow Rate: Attached directly to a hand pump so depends on speed of pumping
Vol of Treated Water Produced/Day: Unknown
Daily Treatment Time: None
Daily Operation Procedure: None (Hand pumping)
Reoccurring Costs: Replacement of bleaching agent is 180 R, ($3 USD) /year; Field
worker’s salary is 1,500 R ($25 USD) / month
Details on Operator(s): Field worker is recruited locally (within village) to look after the Dug
Well
Maintenance Procedure: Addition of Theoline (bleaching agent) once /week
Operator Training: Trained by Aqua Welfare Society’s supervisor
Frequency of Arsenic Testing: Annual testing
Arsenic Test Results Posted Publicly: No
Visual Public Notice: English sign posted; Bengla information pamphlets handed out by
field workers regularly
Feedback/Notes
Accountability: Water committee is formed within each community to hold field worker accountable

192
Satisfaction: “There is an odd smell to the water but we still use it because it’s near to our house”
Awareness: Mostly aware of arsenic problem (due to AWS campaign).
Photo: Dug 8:3 in use.
SONO 45-25 Scale: Household (one per family)
# of Units Visited: 19 units in 1 village
As Removal Mechanism: Manufactured composite iron matrix (CIM) (one solid mass)
Pump: Hand
Construction Materials: Plastic buckets, brick chips, sand, wood charcoal, CIM
Estimated Lifespan: 2 years
Village Code: SONO 9:1 Visited on: August 9, 2012
Background
Village Name: Pauri para and Math para in Karola village
Location: North 24 Parganas, West Bengal, India
GPS: N22°55.074’ E 088°46.044’
Religion: Hindu
Total Households in Community: 50-100
Total Household Surveyed: 36
Mean Household Income for Village: 5,370 Rupees (~$90 USD) /month
Mean # People/Household: 5.25
Mean # Children/Household: 1.20
Type of Local Water Sources Used by Villagers: Municipal stand pipes are almost exclusively used for
drinking
Installation
Date: 2010
Duration: 1 hour to put together but very heavy to move and set-up
Process: Funded through an NGO called Behala Sambit who paid for the entire
cost of the filters for each family. Approached by the Panchayat to
help with the arsenic problem because as an NGO they were involved
in the community for other reasons so the NGO fundraised and
bought the filters for families who had someone that was affected by
arsenicosis in their family.
Location: In each household
Cost: 2,500 Rupees (~$42 USD) for one system
Operation
[As] in Raw Water: 50ppb
[As] in Treated Water: Below Detectable Limit
Flow Rate: Advertised as 15 L/hr however when observed in the field, 5 L/hr was
the actual mean flow rate
Vol of Treated Water Produced/Day: 57 L maximum per day for each system
Daily Treatment Time: 1-1.5 hours for 10 L (as advertised)

193
Daily Operation Procedure: Collection of raw water from a tube well. Pour water into the top
bucket and allow for the water to sit for at least 15 minutes in the top
bucket. Operator was open the flow from the top bucket to the lower
bucket ensuring it is flowing at the correct rate to ensure proper
contact time with the arsenic removal media.
Reoccurring Costs: None
Details on Operator(s): Operation is done by a member of each household, typically women
Maintenance Procedure: Recommendations by BETV-SAM include: Both buckets should be
washed at least once per week with boiling water to prevent
bacteriological contamination; The top bucket should always be filled
with water and never left to dry out; Treated water should be tested
immediately upon installation and every 6 months after that. None of
these practices were witnessed in the village surveyed.
Operator Training: None
Frequency of Arsenic Testing: None
Arsenic Test Results Posted Publicly: No
Visual Public Notice: Printed on the side of the bucket: SONO Filter (patented) Approved
by: BCSIR Gov’t of Bangladesh (No chemical is added) Made in
Bangladesh (Also written in Bengla with instructions however there
is no contact information included))
Waste
Volume: 3 Kg of CIM per household
Type: CIM that is ‘saturated’ with arsenic, however TCLP (leeching tests)
show it to be none hazardous when disposed up in a controlled
landfill
Disposal Location(s): Landfill or open-dumping
Disposal Cost: None
Feedback/Notes
Accountability: No accountability, as it is up to every individual household to maintain the filter
Satisfaction: Very poor; Many people complained about how slow the flow rate is.
Awareness: The NGO who installed them did conduct an arsenic awareness campaign so most
people were familiar with the concept
Reliability/Durability: 12/19 (63%) of systems observed were abandoned because they were broken.
The tap often broke and in some cases the buckets were leaking.
Photo: SONO 45-25 9:1.

194
Nirmal Scale: Household (one per family)
# of Units Visited: 15 units in Village 1; 28 units in Village 2; 21 units in Village 3
As Removal Mechanism: Activated Alumina (AA) (Same brand that BESU’s ‘Amal’ uses)
Pump: Hand
Construction Materials: ferro cement body, rubber gasket, inner net, plastic valve, filter candle
made of burned soil and rice husk
Estimated Lifespan: 1-2 years with regeneration of AA every 6 months
Village Code: Nirmal 10:1 Visited on: August 9, 2012
Background
Village Name: Pauri para and Math para in Karola village
Location: North 24 Parganas, West Bengal, India
GPS: N22°55.074’ E 088°46.044’
Religion: Hindu
Total Households in Community: 50-100
Total Household Surveyed: 36
Mean Household Income for Village: 4,607 Rupees (~$77 USD) /month
Mean # People/Household: 5.19
Mean # Children/Household: 1.13
Type of Local Water Sources Used by Villagers: Municipal stand pipes are almost exclusively used for
drinking
Installation
Date: 2010
Duration: 1 hour to put together but very heavy to move and set-up
Process: Funded through an NGO called Behala Sambit who paid for the entire
cost of the filters for each family. Approached by the Panchayat to
help with the arsenic problem because as an NGO they were involved
in the community for other reasons so the NGO fundraised and
bought the filters for families who had someone that was affected by
arsenicosis in their family.
Location: In each household
Cost: 800 Rupees (~$13 USD) for one system
Operation
[As] in Raw Water: 20-40ppb
[As] in Treated Water: <10ppb
Flow Rate: 5-10 L/hr
Vol of Treated Water Produced/Day: 23-46 L/day
Daily Treatment Time: 2-4 hours depending on how much water is filtered
Daily Operation Procedure: Collection of raw water from a tube well. Pour water into the top
chamber and allow for the water to seep through the candle. Water is
gravity fed through the AA into the lower chamber. Flow of the
treated water is controlled by the tap out the bottom.
Reoccurring Costs: 100 R ($1.7 USD) every 6 months for regeneration
Details on Operator(s): Operation is done by a member of each household, typically women
Maintenance Procedure: Inside of both chambers should be washed regularly with boiling
water to prevent bacteriological contamination
Operator Training: None
Frequency of Arsenic Testing: None
Arsenic Test Results Posted Publicly: No
Visual Public Notice: No
Waste
Volume: Unknown
Type: Used activated alumina that is arsenic-rich
Disposal Location(s): Supposed to be regenerated and disposed of in a central location
however this was not observed in practice. Households simply
dumped the waste on the ground or into the drain
Disposal Cost: None
Feedback/Notes

195
Accountability: No accountability, as it is up to every individual household to maintain the filter
Satisfaction: Very poor; Many people complained about how slow the flow rate is.
Reliability/Durability: Many systems were abandoned because they were broken.
Photo: Nirmal 10:1 still in use.
Village Code: Nirmal 10:2 Visited on: September 10, 2012
Background
Village Name: Bhat para, Bhadnri Khamar
Location: Murshidabad, West Bengal, India
GPS: N23°54.866’ E 088°12.869’
Religion: Muslim
Total Households in Community: 100-150
Total Household Surveyed: 34
Mean Household Income for Village: 2,845 Rupees (~$47 USD) /month
Mean # People/Household: 5.03
Mean # Children/Household: 1.35
Type of Local Water Sources Used by Villagers: Household shallow tubewells are used for drinking
Installation
Date: 2010
Duration: 1 hour to put together but very heavy to move and set-up
Process: Panchayat was given the filters to distribute to the lowest income
families, but had total digression as to whom he gave them to
Location: In each household
Cost: 800 Rupees (~$13 USD) for one system
Operation
[As] in Raw Water: 100ppb
[As] in Treated Water: No sample available
Flow Rate: 5 L/hr
Vol of Treated Water Produced/Day: 20 L/day
Daily Treatment Time: 2-4 hours depending on how much water is filtered
Daily Operation Procedure: Collection of raw water from a tube well. Pour water into the top
chamber and allow for the water to seep through the candle. Water is
gravity fed through the AA into the lower chamber. Flow of the
treated water is controlled by the tap out the bottom.
Reoccurring Costs: 100 R ($1.7 USD) every 6 months for regeneration
Details on Operator(s): Operation is done by a member of each household, typically women
Maintenance Procedure: Inside of both chambers should be washed regularly with boiling
water to prevent bacteriological contamination
Operator Training: None
Frequency of Arsenic Testing: None
Arsenic Test Results Posted Publicly: No
Visual Public Notice: No

196
Disposal Location(s): Supposed to be regenerated and disposed of in a central location
however this was not observed in practice. Households simply
dumped the waste on the ground or into the drain
Disposal Cost: None
Feedback/Notes
Accountability: No accountability, as it is up to every individual household to maintain the filter
Satisfaction: Very poor; Many people complained about how slow the flow rate is.
Reliability/Durability: 25/28 systems were abandoned because they were broken.
Photo: Nirmal 10:2 discarded by side of the road and Nirmal 10.3 defunct and abandoned beside a hut.
Village Code: Nirmal 10:3 Visited on: September 11, 2012
Background
Village Name: Pin para, Bhadnri Khamar
Location: Murshidabad, West Bengal, India
GPS: N23°54.099’ E 088°12.894’
Religion: Muslim
Total Households in Community: 100
Total Household Surveyed: 38
Mean Household Income for Village: 3,335 Rupees (~$55 USD) /month
Mean # People/Household: 6.05
Mean # Children/Household: 2.13
Type of Local Water Sources Used by Villagers: Household shallow tubewells are used for drinking
Installation
Date: 2010
Duration: 1 hour to put together but very heavy to move and set-up
Process: Panchayat was given the filters to distribute to the lowest income
families, but had total digression as to whom he gave them to
Location: In each household
Cost: 800 Rupees (~$13 USD) for one system
Operation
[As] in Raw Water: 100ppb
[As] in Treated Water: No sample available
Flow Rate: 5 L/hr
Vol of Treated Water Produced/Day: 20 L/day
Daily Treatment Time: 2-4 hours depending on how much water is filtered
Daily Operation Procedure: Collection of raw water from a tube well. Pour water into the top
chamber and allow for the water to seep through the candle. Water is
gravity fed through the AA into the lower chamber. Flow of the
treated water is controlled by the tap out the bottom.
Reoccurring Costs: 100 R ($1.67 USD) every 6 months for regeneration
Details on Operator(s): Operation is done by a member of each household, typically women

197
Maintenance Procedure: Inside of both chambers should be washed regularly with boiling
water to prevent bacteriological contamination
Operator Training: None
Frequency of Arsenic Testing: None
Arsenic Test Results Posted Publicly: No
Waste
Volume: Unknown
Type: Used activated alumina that is arsenic-rich
Disposal Location(s): Supposed to be regenerated and disposed of in a central location
however this was not observed in practice. Households simply
dumped the waste on the ground or into the drain
Feedback/Notes
Accountability: No accountability, as it is up to every individual household to maintain the filter
Satisfaction: Very poor; Many people complained about how slow the flow rate is.
Reliability/Durability: 20/21 systems were abandoned because they were broken.
DRDO Scale: Household (one per family)
# of Units Visited: 38 units in Village 1; 35 units in Village 2
As Removal Mechanism: ZVI ball made of recycled steel
Pump: Hand
Construction Materials: stainless steel body, fabric nets, local sand, manufactured adsorbent
ball
Estimated Lifespan: 1-2 years with replacement of sand and ball every 6 months
Village Code: DRDO 11:1 Visited on: August 20, 2012
Background
Village Name: Paschim para,
Location: Nadia, West Bengal, India
GPS: N23°12.443’ E 088°30.117’
Religion: Hindu
Total Households in Community: 50-100
Total Household Surveyed: 38
Mean Household Income for Village: 4,650 Rupees (~$78 USD) /month
Mean # People/Household: 4.32
Mean # Children/Household: 1.21
Type of Local Water Sources Used by Villagers: Municipal gov’t started to construct a deep tube well
and water tower however abandoned the project. The deep tube though is being used by most of the
village (illegally?). When tested for arsenic, this deep tube well showed concentrations of >50ppb of
arsenic.
Installation
Date: 2010
Duration: <1 hour to put together
Process: Funded through the Gov’t of India but installed through an NGO
called Save the Environment. The filter was sold to villagers at a
subsidised cost of 100R
Location: In each household
Cost: 2,000 Rupees (~$33 USD) for one system
Operation
[As] in Raw Water: 50ppb
[As] in Treated Water: <10ppb
Flow Rate: 10 L/hr
Vol of Treated Water Produced/Day: 20-30 L/day
Daily Treatment Time: 2-3 hours depending on how much water is filtered
Daily Operation Procedure: Collection of raw water from a tube well. Pour water into the top
chamber and allow for the water to seep through the three chambers.
Water is gravity fed through and the flow of the treated water is
controlled by the tap out the bottom.
Reoccurring Costs: 100 R ($1.7 USD) every 6 months for a new iron ball

198
Details on Operator(s): Operation is done by a member of each household, typically women
Maintenance Procedure: Inside the chambers should be washed regularly with boiling water to
prevent bacteriological contamination
Operator Training: None
Frequency of Arsenic Testing: None
Arsenic Test Results Posted Publicly: No
Visual Public Notice: No
Waste
Volume: 1kg iron ball every six months
Type: Adsorbent ball and sand are arsenic-rich
Disposal Location(s): Supposed to be collected by the NGO and disposed of by having
bricks made however villagers were told to burn or bury the ball and
just dump the sand.
Feedback/Notes
Accountability: No accountability, as it is up to every individual household to maintain the filter
Satisfaction: Very poor; Many people complained about how slow the flow rate is.
Awareness: Very aware that the waste is toxic and of the problem because many people have died
in this area due to arsenic related causes. Many people cautious of burning the waste (even though they
were told to) so some have hung the iron balls up in trees so children can’t touch them and so they don’t
contaminate the water more.
Reliability/Durability: Many systems were abandoned because they were broken.
Trust: Complete distrust for the NGO because the local representative inflates the price of the
adsorbent and nets depending on the person buying it. He is the only person they know to buy it from so
are forced to pay the higher price or stop using it.
Photo: DRDO 11:1 Photo: DRDO 11:2
Village Code: DRDO 11:2 Visited on: August 22, 2012
Background
Village Name: Lalmath para,
Location: Nadia, West Bengal, India
GPS: N23°12.273’ E 088°30.320’
Religion: Hindu
Total Households in Community: 50-100
Total Household Surveyed: 35
Mean Household Income for Village: 5,630 Rupees (~$94 USD) /month
Mean # People/Household: 4.03
Mean # Children/Household: 0.83
Type of Local Water Sources Used by Villagers: Municipal gov’t started to construct a deep tube well
and water tower however abandoned the project. The deep tube

199
though is being used by most of the village (illegally?). When tested
for arsenic, this deep tube well showed concentrations of >50ppb of
arsenic.
Installation
Date: 2010
Duration: <1 hour to put together
Process: Funded through the Gov’t of India but installed through an NGO
called Save the Environment. The filter was sold to villagers at a
subsidised cost of 100R
Location: In each household
Cost: 2,000 Rupees (~$33 USD) for one system
Operation
[As] in Raw Water: 50ppb
[As] in Treated Water: <10ppb
Flow Rate: 10 L/hr
Vol of Treated Water Produced/Day: 20-30 L/day
Daily Treatment Time: 2-3 hours depending on how much water is filtered
Daily Operation Procedure: Collection of raw water from a tube well. Pour water into the top
chamber and allow for the water to seep through the three chambers.
Water is gravity fed through and the flow of the treated water is
controlled by the tap out the bottom.
Reoccurring Costs: 100 R ($1.7 USD) every 6 months for a new iron ball
Details on Operator(s): Operation is done by a member of each household, typically women
Maintenance Procedure: Inside the chambers should be washed regularly with boiling water to
prevent bacteriological contamination
Operator Training: None
Frequency of Arsenic Testing: None
Arsenic Test Results Posted Publicly: No
Visual Public Notice: No
Waste
Volume: 1kg iron ball every six months
Type: Adsorbent ball and sand are arsenic-rich
Disposal Location(s): Supposed to be collected by the NGO and disposed of by having
bricks made however villagers were told to burn or bury the ball and
just dump the sand. When washed the ‘red’ water was washed down
the drain.
Feedback/Notes
Accountability: No accountability, as it is up to every individual household to maintain the filter
Satisfaction: Very poor; Many people complained about how slow the flow rate is.
Awareness: Very aware that the waste is toxic and of the problem because many people have died
in this area due to arsenic related causes. Many people cautious of burning the waste (even though they
were told to) so some have hung the iron balls up in trees so children can’t touch them and so they don’t
contaminate the water more.
Reliability/Durability: Many systems were abandoned because they were broken.
Trust: Complete distrust for the NGO because the local representative inflates the price of the
adsorbent and nets depending on the person buying it. He is the only person they know to buy it from so
are forced to pay the higher price or stop using it.

200
Appendix II: English Field Survey
Section 1 Informed Consent Survey Code: __________
Namaste. My name is ______ and this is ______, we are surveyors hired by the University of Oxford in the
UK. Here, please have a business card. We are helping conduct a study on clean-water technologies, like
filters, rain water, tube wells, etc. The reason we would like to speak with you specifically is because we seek
the opinions of residents in this area about the installation, use, maintenance, disposal and cost of the
technology that you use. If you are willing to participate it would be in the form of answering some questions.
The interview should take approximately 20-30 minutes. There are no benefits to participating in this study
other than contributing to developing a broader understanding of sustainable clean-water technologies. If you
choose to participate, we cannot offer any material compensation. If you choose to participate, the records of
this research will be kept private. In any future publications, information that will make it possible to identify
any participants will not be included. Research records will be kept in a locked file. If you do agree to
participate, your participation is completely voluntary. We want to assure you that if you decide to not answer
a particular question or wish to discontinue the interview all together at any point, then that is completely fine.
Do you have any questions about what I have mentioned thus far? If you have any questions about the study
in the future, please feel free to contact Tam, the Oxford researcher in charge of this program. All of her
information is on the card we have given you.
1 Do you agree to participate? (Circle) No / Yes Start Time: __________ End Time: __________
Section 2 Household Information
2 How many people live in this household: ___________ (#)
3 How old are they? What do they do for work? What is their education level?
Gender (Circle) Age (#) Occupation (Write down) Highest Education Level Completed (Circle one)
F/M _____ ________________None / Primary / Middle / High / College / Other____
F/M _____ ________________None / Primary / Middle / High / College / Other____
F/M _____ ________________None / Primary / Middle / High / College / Other ___
F/M _____ ________________None / Primary / Middle / High / College / Other____
Section 3 Water Source and Use
Fill in the table using C or P for current usage or past usage. Also add comments or any other relevant
details into the comment section.
(C=Currently Use, P=Past Use, Hh=Household Scale/Privately Owned, Pb=Publicly Owned/Community Scale) *Clean Water Source (CWS)
Example questions used to fill out the above table:
4 Where do you get your water from? Is that used for drinking/cooking/washing?
In the past, where did your household get water from?
Do you use a filter? (Which model?) Why?
Have you ever used a filter in the past? (Which model?) Why did you stop?
Who owns the tube well(s)?
What is the depth of the tube well(s)? ___________ (Metres)
Does the tube well have arsenic? (Circle) No / Unknown / Yes
How do you know? Has it been tested?
Current and
Past Usage (C,
P) River
Lake/
Pond
TubeWell *Rain *DugWell *Time *Filter Other_______
(buy bottled?)
Comments (Depth of tube
Well, Contain arsenic?
Type of filter) Hh Pb Hh Pb Hh Pb Hh Pb Hh Pb
Drinking/cooking
Bathing/hygiene
Washing dishes/laundry
Irrigating
crops/gardening
Livestock

201
Section 4 Clean Water Source (CWS) used for Drinking/Cooking (see highlighted boxes in above table)
If no Clean Water Source has ever been used, check this box □ and skip to Section 5.
5 The next set of questions are going to focus on your household’s past / present-day (circle one) use of
the_(insert CWS here)_for drinking water. How long have / did you use(d) it for? ___________ (Months)
6 Before you started using the __(insert CWS here)__ explain how you first learned about it _____________________________________________________________________________________________________
_____________________________________________________________________________________________________
_____________________________________________________________________________________________________
7 What were some of the main reasons your household decided to begin use? (Circle all that apply)
Affordable? Near to your home? Convinced by friends? Convinced by leaders? Other?___________
8 How long did it take to install the __(insert CWS here)__? __________ (Hours or days or months)
9 Who installed it? (Circle all that apply)
Members of your household / Community members / NGO / Government / University / Other______
10 Were the workers paid for their work? (Circle) No / Unknown / Yes
11 If yes, How much? __________ (Rupees per hour or day or month)
12 What was the cost of purchasing and installing the __(insert CWS here)__? ___________ (Rupees)
13 How much did your household contribute to those costs? ___________ (Rupees)
14 Do you pay a tariff to have access to this water? ___________ (Rupees per month)
15 What is your average household income? __________________ (Rupees per month)
16 How far away from your house is the __(insert CWS here)__? ___________ (Meters or Minute’s walk)
17 How do you collect the water? (Circle) Walk / Cycle-power / Drive / It is Delivered / Other:________
18 If delivery, What is the cost? ___________ (Rupees per month)
19 If walk/cycle/drive, Who in your household goes? (Circle all that apply) Female / Male, Adult / Child
20 Is this task physically (Circle) Difficult / Not Difficult / Easy for this person?
21 If a filter is used, how long does filtration take? ___________ (Minutes)
22 Is there regularly a queue for water? (Circle) No / Unknown / Yes
23 If yes, on average how long must one have to wait in the queue to collect the water? ______(Minutes)
24 How many times a day does your household collect drinking water? ___________ (Number of times)
25 Is any chemicals or medicine put in the water before you drink it? (Circle) No / Unknown / Yes
26 If yes, do you know which chemicals or medicine and/or the quantity? Explain________________
27 How would you describe the taste (smell) of the drinking water? (Circle)
Perfect / Good / Acceptable / Poor / Very Poor or Bad
28 How would you describe the colour of the drinking water? (Circle)
Perfectly Clear / Good / Neutral / Poor / Very Poor or Bad
29 Does anybody in your household do regular maintenance or testing on the __(insert CWS here)__?
(Circle) No / Unknown / Yes
30 If yes, How often is this done? ___________ (# per month)
Who and were they trained? Explain___________________________________________
31 How many hours did they spend in training? ___________ (Hours)

202
32 Are they paid to do this work? (Circle) No / Unknown / Yes
33 If yes, What is their wage? ___________ (Rupees per month)
How often is this done? ___________ (# per month)
34 Do you trust that they are doing maintenance & testing regularly and properly?
(Circle) No / Unknown / Yes
How often do you…
35 Observe maintenance or testing being done? (Circle) Never / Rarely / Regularly / Often
36 Ask person about regular maintenance or testing? (Circle) Never / Rarely / Reg / Often
37 If no, Does somebody from outside the household do regular maintenance or testing on it?
(Circle) No / Unknown / Yes
38 If yes, Who, and were they trained? Explain____________________________________
39 How many hours did they spend in training? ___________ (Hours)
40 Is the worker paid to do this work? (Circle) No / Unknown / Yes
41 If yes, What is their wage? ___________ (Rupees per month)
How often is this done? ___________ (# per month)
42 Do you trust that they are doing maintenance & testing regularly and properly?
(Circle) No / Unknown / Yes
How often do you…
43 Observe maintenance or testing being done? (Circle) Never / Rarely / Regularly / Often
44 Ask worker about regular maintenance or testing? (Circle) Never / Rarely / Reg / Often
45 Ask worker’s boss about regular maintenance or testing? (Circle) Never / Rare / Reg / Oft
46 Is waste produced by the __(insert CWS here)__? (Circle) No / Unknown / Yes
47 If yes, What is the volume of waste create? ___________ (Litres per day or month)
48 What is the distance between where this waste is dumped and your home? __________ (Meters)
49 What is the cost of disposal? ___________ (Rupees per month)
50 What is the life span of the __(insert CWS here)__? ___________ (Years)
*Note: these questions were at the end of the survey but were only put here to save space in the
appendix.
Section 6 User’s ‘Willingness’
103 What is the maximum distance your household would be willing to walk for clean water? __(Meters)
104 What is the most ideal distance? ___________ (Meters)
105 What is the longest amount of time you are willing to wait to have water filtered (/ bucket)? __(Min)
106 What is the most ideal amount of time? ___________ (Minutes)
107 How many times per week would you be willing to do maintenance on a system? ___________ (#)
108 What is the maximum your household is willing to spend contributing to the initial cost of buying a
system? ___________ (Rupees)
109 What is the most ideal amount? ___________ (Rupees)
110 What is the maximum your household is willing to spend per month on clean water? _____ (Rupees)
111 What is the most ideal amount? ___________ (Rupees)

203
Section 5 User’s Values
These next questions are about clean water technologies/systems in general. The point is to identify how
important or unimportant certain values and criterion are to you and your household. Please answer honestly.
How important is (it to you)… (Circle most representative value) Very Unimportant Unimportant Neutral Important Very Important 51 to be consulted before the installation process? -2 -1 0 +1 +2 X
52 to actively participate in the decision-making process? -2 -1 0 +1 +2 X
53 for someone in your household to participate in the decision? -2 -1 0 +1 +2 X
54 if the system is designed in an environmentally friendly way? -2 -1 0 +1 +2 X
55 the system’s size or area? -2 -1 0 +1 +2 X
56 the type of materials used in building the system? -2 -1 0 +1 +2 X
57 the distance the system is from your house? -2 -1 0 +1 +2 X
58 the rate (or speed) that the system produces clean water? -2 -1 0 +1 +2 X
59 to understand the installation process? -2 -1 0 +1 +2 X
60 that clean water is affordable? -2 -1 0 +1 +2 X
61 that the system is reliable? -2 -1 0 +1 +2 X
62 to be given several options when choosing a CWT? -2 -1 0 +1 +2 X
63 that the quality of water is tested regularly? -2 -1 0 +1 +2 X
64 to understand how the system operates? -2 -1 0 +1 +2 X
65 if the cleaned water tastes slightly bad? -2 -1 0 +1 +2 X
66 if the water smells odd? -2 -1 0 +1 +2 X
67 to understand the maintenance procedures? -2 -1 0 +1 +2 X
68 that the person doing the testing/maintenance is paid? -2 -1 0 +1 +2 X
69 that the person doing the testing/maintenance is trained? -2 -1 0 +1 +2 X
70 to have the ability to hold the maintenance person accountable? -2 -1 0 +1 +2 X
71 that the system is installed as quickly as possible -2 -1 0 +1 +2 X
72 that clean water is free? -2 -1 0 +1 +2 X
73 that your household understands the physical effects of Arsenic in water? -2 -1 0 +1 +2 X
74 if the maintenance person does not have a boss or supervisor? -2 -1 0 +1 +2 X
75 if the cleaned water has a strong taste? -2 -1 0 +1 +2 X
76 that the water is perfectly clear? -2 -1 0 +1 +2 X
77 that the system is very near your house? -2 -1 0 +1 +2 X
78 if you have to conduct small repairs on the system? -2 -1 0 +1 +2 X
79 to know the arsenic concentration in the treated water? -2 -1 0 +1 +2 X
80 the amount of waste or sludge generated by the system? -2 -1 0 +1 +2 X
81 if waste or sludge is dumped near your house? -2 -1 0 +1 +2 X
82 if waste or sludge is dumped near the water source? -2 -1 0 +1 +2 X
83 if there is an aspect of recycling or regeneration in the system? -2 -1 0 +1 +2 X Strongly Disagree Disagree Neutral Agree Strongly Agree 84 I prefer the size of the CWT to be as small as possible -2 -1 0 +1 +2 X
85 I prefer the CWT be constructed with recycled materials -2 -1 0 +1 +2 X
86 Trusting the system and those involved with it is important -2 -1 0 +1 +2 X
87 Those who can afford to pay for water should pay a clean water tariff -2 -1 0 +1 +2 X
88 I prefer having a personal CWT inside my home rather than using a comm system -2 -1 0 +1 +2 X
89 All systems should have informative signs -2 -1 0 +1 +2 X
90 I do not want to maintain my own water filter -2 -1 0 +1 +2 X
91 Using chemicals or medicine to make water safe is bad and undesirable -2 -1 0 +1 +2 X
92 I want to have access to all the financial details involving the system -2 -1 0 +1 +2 X
93 Water should be free for everyone -2 -1 0 +1 +2 X
94 I am willing to drink water with a slight taste as long as it’s safe and clean -2 -1 0 +1 +2 X
95 Having water delivered or piped to my home is the most ideal option -2 -1 0 +1 +2 X
96 I feel that a CWT that uses power is not reliable -2 -1 0 +1 +2 X
97 I do not care if a CWT creates Arsenic rich sludge or waste -2 -1 0 +1 +2 X
98 I do not worry about where Arsenic rich sludge is dumped -2 -1 0 +1 +2 X
99 Clean water should have no taste -2 -1 0 +1 +2 X
100 I will only drink water that is clear in colour -2 -1 0 +1 +2 X
101 I am willing to walk a short distance to get clean water -2 -1 0 +1 +2 X
102 I would typically trust groups from outside my village who suggest CWT -2 -1 0 +1 +2 X

pj£r¡ L¡X : .
¢hi¡N 1: S¡¢eu Ae¤j¢a NËqZ
ejú¡l, Bj¡l e¡j , Bl C¢e z Bjl¡ CwmÉ¡äl A„g¡XÑ ¢hnÄ¢hcÉ¡mul qu LaL…m¡ abÉ pwNËq Ll¢R
HLV¡ pj£r¡l SeÉ; Ae¤NËq Ll HLV¡ L¡XÑ l¡M¤ez Bjl¡ HC pj£r¡V¡ Ll¢R Sm c§oZj¤š² Ll¡l ¢h¢iæ fËk¥¢š²l Efl,
kje ¢gÒV¡l, hª¢øl Sm, HC phz Bjl¡ k L¡lZ ¢hno i¡h Bfe¡l p‰ Lb¡ hma Q¡C¢R, a¡ qm Bjl¡ HC
Hm¡L¡l j¡e¤ol L¡R bL Sm f¢lú¡l Ll¡l k ph fËk¥¢š²l ay¡l¡ hÉhq¡l Lle, pC fËk¥¢š²l …¢ml hÉhq¡l, f¢lQkÑ¡,
f¢laÉ¡N Ll¡l Ef¡u J B¢bÑL j§mÉl ¢hou ay¡cl ja¡ja S¡ea Q¡C¢Rz Bf¢e k¢c HC pj£r¡a Awn ¢ea Q¡e,
a¡qm S¡¢eu l¡¢M, HC pj£r¡V¡ qh Lb¡fLbel j¡dÉjz HC Lb¡fLbel SeÉ pju m¡Nh 20 bL 30 ¢j¢eVz
hªqšl rœ pjÉL i¡h Sm f¢lú¡l Ll¡l ¢h¢iæ fËk¥¢š²ll pðå ¢hoc ‘¡e m¡i R¡s¡ HC pj£r¡l AeÉ L¡e
EfL¡¢la¡ eCz Bf¢e k¢c AwnNËqZ BNË¢q b¡Le, a¡qm Bfe¡L S¡¢eu l¡¢M, Bjl¡ Bfe¡cl L¡e lLj p¡q¡kÉ
- °h¢oL h¡ B¢bÑL - Lla f¡lh e¡z Bf¢e k¢c AwnNËqZ BNË¢q b¡Le, a¡qm Bfe¡L S¡¢eu l¡¢M, HC pj£r¡l
pjÙ¹ lLXÑ N¡fe l¡M¡ qhz i¢hoÉa k¢c HC pj£r¡l L¡e Awn L¡b¡J R¡f¡ qu, a¡qm AwnNËqZL¡l£cl f¢lQu
N¡fe l¡M¡ qhz HC pj£r¡l pjÙ¹ e¢b-fœ hå HLV¡ g¡Cml jdÉ l¡M¡ b¡Lhz Bf¢e k¢c AwnNËqZ BNË¢q b¡Le,
a¡qm a¡ pÇf̈ZÑ pµR¡u, Bjl¡ L¡e i¡h Bfe¡L S¡l¡S¥¢l Llh e¡z Bfe¡L S¡¢eu l¡¢M, Bf¢e k¢c LuLV¡
fËnÀl fl Bl Ešl ¢ca e¡ Q¡e pV¡ pÇf̈ZÑ Bfe¡l CµR, Hhw Bjl¡ a¡ pÇf̈ZÑ lLj i¡h je ehz HC fkÑ¿¹ k¡
hm¢R a¡ ¢eu ¢L L¡e fËnÀ BR? i¢hoÉa k¢c L¡e fËnÀ b¡L, a¡qm A„g¡XÑ ¢hnÄ¢hcÉ¡mul k ju¢V - VÉ¡j -
HC p¡iÑl c¡¢ušÄ luR, a¡l p‰ k¡N¡k¡N Lla f¡le; JC L¡XÑ Jyl pjÙ¹ f¢lQu BRz
Bf¢e ¢L AwnNËqZ BNËq£? (N¡m Ll) qyÉ¡ / e¡ öl¦l pju nol pju
¢hi¡N 2: NªqÙÛ¡¢m pð¢åa abÉ¡h¢m
1. HC Nªq LaSe h¡p Ll? (#)
2. ay¡cl hup La? ¢L L¡S Lle? Lac§¤l mM¡fs¡ LlRe?
3. ¢m‰ hup L¡S phÑ¡µQ mM¡fs¡l Ù¹l
(N¡m Ll) (#) (mM) (N¡m Ll)
Ù»£ / f¤x n§ZÉ / fË¡b¢jL / jdÉ / EµQ / jq¡¢hcÉ¡mu / AeÉ¡eÉ
.
Ù»£ / f¤x n§ZÉ / fË¡b¢jL / jdÉ / EµQ / jq¡¢hcÉ¡mu / AeÉ¡eÉ
.
Ù»£ / f¤x n§ZÉ / fË¡b¢jL / jdÉ / EµQ / jq¡¢hcÉ¡mu / AeÉ¡eÉ
.
Ù»£ / f¤x n§ZÉ / fË¡b¢jL / jdÉ / EµQ / jq¡¢hcÉ¡mu / AeÉ¡eÉ
.
Ù»£ / f¤x n§ZÉ / fË¡b¢jL / jdÉ / EµQ / jq¡¢hcÉ¡mu / AeÉ¡eÉ
.
¢hi¡N 3: Sml Evp J hÉhq¡l
(H h¡ B ¢mMh, H=HMeL¡l, B=BNL¡l hÉhq©a Sml Evp z Nª= NªqÙÛ¡¢ml ¢eSü, p¡= p¡hÑS¢eez fËuS¢eu
abÉ¡¢c j¿¹hÉ l ¢hi¡N ¢mMhz)
HMeL¡l
h¡
BNL¡l
hÉhq©a
(H /
B)
e
c£
f¤
L¥
l
/
q©
c
emLf̈
*hª¢ø
*L¥u¡
*em
h¡¢qa
*¢gÒV¡
l
AeÉ¡eÉ
(h¡a¡
ml
Sm
Le?)
j¿¹hÉ
(emL¨fl Ni£la¡, BpÑ¢eL BR ¢Le¡?
¢L dlZl ¢gÒV¡l hÉhq©a qu?)
Nª
p
¡
Nª
p
¡
Nª
p
¡
Nª
p
¡
Nª
p
¡
M¡h¡l /
l¡æ¡l
• • • • • • • •
pÀ¡el/
f¢lµRæa
¡l
Appendix II: Bangla Survey
204

h¡pe
j¡Sh¡l
/ L¡fs
L¡Qh¡l
nQl
f¡oÉcl
[* = c§oZj¤š² Sml Evp (c§x Sx Ex)]
4. Jf¡ll RL f§ZÑ Lla k pjÙ¹ fËnÀ Ll¡ ka f¡l, a¡l ¢LR¥ ej¤e¡:
- Bf¢e Sm L¡b¡ bL f¡e? pC Sm ¢Lpl L¡S m¡N: M¡h¡l, l¡æ¡l, e¡ h¡pe j¡Sh¡l / L¡fs L¡Qh¡l?
- BN Bf¢e h¡¢sl Sm L¡b¡ bL ¢eae?
- Bf¢e ¢L ¢gÒV¡l hÉhq¡l Lle? (L¡e jXm?)
- Bf¢e ¢L BN L¡e¡ ¢ce ¢gÒV¡l hÉhq¡l LlRe? (L¡e jXm?)
- emL̈fV¡ L¡l? / emL̈fV¡l j¡¢mL L?
- emL̈fV¡l Ni£la¡ La? (¢jV¡l)
- emL̈fl Sm ¢L BpÑ¢eL BR? (N¡m Ll) qyÉ¡ / S¡e¡ eC / e¡
¢hi¡N 4:
l¡æ¡l J M¡h¡l L¡S hÉhq©a c§oZj¤š² Sml Evp (c§x Sx Ex) (Jf¡ll RLl • ¢Q¢q²a M¡f
cM)
k¢c c§oZj¤š² Sml Evp (c§x Sx Ex) L¡e¢ce hÉhq©a qu e¡ b¡L, a¡qm HC M¡f □ ¢WL ¢Qq² ¢cu ¢hi¡N 5 H
Qm k¡Jz
¢ejÀ¢m¢Ma fËnÀ …¢m Bfe¡l NªqÙÛ¡¢ml HMeL¡l (H) h¡ BNL¡l (B) (k L¡e HL¢V L N¡m Ll) M¡h¡l Sml SeÉ
hÉhq©a (c§x Sx Ex ¢V HM¡e hÉhq¡l Llh) ¢V L¢¾cÊLz
5. La¢ce dl Bf¢e H¢V hÉhq¡l Llae / Ll¢Rme? j¡p
6. (c§x Sx Ex ¢V HM¡e hÉhq¡l Llh) ¢V h¡hq¡l Ll¡l BN Bf¢e H¢Vl Lb¡
L¡b¡ bL fËbj öe¢Rme? ¢hoc hmhe?
7. ¢L L¡lZ Bfe¡l h¡¢s bL H¢V hÉhq¡ll ¢pÜ¡¿¹ eJu¡ qu? (p¢WL ¢V N¡m Ll) Bfe¡l p¡jbÑl jdÉ / h¡¢sl
L¡R¡L¡¢R / hå¥cl à¡l¡ fËi¡¢ha qu / ea¡cl à¡l¡ fËi¡¢ha qu / BeÉ¡eÉ
8. LarZ mN¢Rm (fx Sx Ex ¢V HM¡e hÉhq¡l Llh) ¢V m¡N¡a?
(O¾V¡ / ¢ce / j¡p) (Efk¤š² ¢V N¡m Ll)
9. H¢V L m¡¢Nu¢Rme? (p¢WL ¢V N¡m Ll) h¡¢sl m¡L/ fs¢nl¡ / hplL¡¢l pwÙÛ¡ / p¡L¡l/ hnÄ¢hcÉ¡mu/ BeÉ¡eÉ
10. ¢k¢e/ky¡l¡ m¡¢Nu¢Rme, ¢a¢e/ay¡l¡ ¢L HC L¡Sl SeÉ hae ¢eu¢Rme? (N¡m Ll) qyÉ¡ / S¡e¡ eC / e¡
11. k¢c hae ¢eu R¡Le, a¡qm a¡ La? V¡L¡ fË¢a O¾V¡ / ¢ce / j¡p
12. (c§x Sx Ex ¢V HM¡e hÉhq¡l Llh) ¢V ¢Le a¡ m¡N¡a LQ MlQ quR?
V¡L¡
13. HC MlQl LaV¡ Bfe¡cl h¡¢s bL hÉ¡u Ll¡ quR? V¡L¡
14. HC Sm fa Bfe¡cl ¢L L¡e i¡s¡ / öó ¢ca qu? V¡L¡ fË¢a j¡p
15. Bfe¡cl h¡¢sl Ns Ef¡kÑe La? V¡L¡ fË¢a j¡p
16. (c§x Sx Ex ¢V HM¡e hÉhq¡l Llh) ¢V Bfe¡l h¡¢s bL La c§l Ah¢ÙÛa?
¢jV¡l / ¢j¢eV qy¡V¡
17. Bf¢e Sm pwNËq LlZ ¢Li¡h? (p¢WL ¢V N¡m Ll) qyV / p¡CLm/ N¡¢sa / Bfe¡l h¡¢sa Sm pl¡p¢l
fy±R k¡u / BeÉ¡eÉ
18. k¢c Sm pl¡p¢l fy±R k¡u, a¡qm a¡l MlQ La? V¡L¡ fË¢a j¡p
19. k¢c Sm qyV / p¡CLm / N¡¢sa pwNª¢qa qu, a¡qm pC L¡S ¢V Lle? (p¢WL ¢V N¡m Ll) fË¡çhuú j¢qm¡
/ fË¡çhuú f¤l¦o / e¡h¡¢mL¡ ju / e¡h¡mL Rm
20. k¢c Bfe¡l h¡¢sa Sm qyV / p¡CLm/ N¡¢sa pwNª¢qa qu, a¡qm ¢k¢e/ky¡l¡ HC L¡S¢V Lle, ¢a¢e/ay¡cl
fr HC L¡S¢V nl£¢lL i¡h (p¢WL ¢V N¡m Ll) LøLl / LøLl eu / pqS
21. k¢c ¢gÒV¡l h¡hq¡l Ll¡, Qh Sm f¢lú¡l Lla LQ pju m¡N? ¢j¢eV
22. Sm pwNËq Ll¡l SeÉ phpju ¢L m¡Ce fs? (N¡m Ll) qyÉ¡ / S¡e¡ eC / e¡
205

23. k¢c m¡Ce fs, a¡qm HLSeL m¡Ce Ns LarZ Afr¡ Lla qu? ¢j¢eV
24. Bfe¡cl h¡¢sa ¢ce Lah¡l Sm pwNËq Lla qu? (#)
25. M¡Ju¡l BN ¢L Sm L¡elLj l¡p¡u¢eL fc¡bÑ /Jo¤d jn¡e¡ qu? (N¡m Ll) qyÉ¡ / S¡e¡ eC / e¡
26. k¢c jn¡e¡ qu, a¡qm ¢L l¡p¡u¢eL fc¡bÑ /Jo¤d Bl a¡l f¢lj¡f La/ LaM¡¢e l¡p¡u¢eL fc¡bÑ /Jo¤d jn¡e¡
qu? ¢hoc hmhe? .
27. L Sm ¢V Bfe¡l¡ M¡e, p¢Vl ü¡c Bf¢e h¡T¡he ¢Li¡h? (p¢WL ¢V N¡m Ll) M¤h i¡m/ i¡m/ ¢WLW¡L h¡ L¡e
ü¡c ¢h¢qe / M¡l¡f / M¤h M¡l¡f
28. M¡h¡l Sml lP¢V L Bf¢e h¡T¡he ¢Li¡h? (p¢WL ¢V N¡m Ll) HLcj f¢lú¡l / f¢lú¡l / ¢WLW¡L / Af¢lú¡l
/ M¤h f¢lú¡l
29. Bfe¡l h¡¢sl LE¢L ¢hno HL¢V pjul hÉhd¡Z (c§x Sx Ex ¢V HM¡e hÉhq¡l Llh) ¢V ¢WL
ja L¡S LlR ¢Le¡ Q¡ f¢lr¡ Lle? (N¡m Ll) qyÉ¡ / S¡e¡ eC / e¡
30. k¢c Lle, a¡qm :
L Lle?
La¢ce A¿¹l Lle? (#) fË¢a j¡p
¢a¢e/ay¡l¡ ¢L H ¢hou L¡b¡J ¢nr¡ m¡i LlRe? ¢hoc hmhe?
31. ¢a¢e/ay¡l¡ La O¾V¡ H ¢hou ¢nr¡ fu¢Rme? O¾V¡
32. ay¡L/ay¡cl ¢L HC L¡Sl SeÉ f¡¢lnË¢jL cJu¡ qu? (N¡m Ll) qyÉ¡ / S¡e¡ eC / e¡
33. cJu¡ qm a¡ La? V¡L¡ fË¢a j¡p
Lah¡l ay¡L/ay¡cl HC L¡Sl SeÉ f¡¢lnË¢jL cJu¡ qu? (#) fË¢a j¡p
34. Bf¢e ¢L ¢hnÄ¡p Lle k ¢k¢e/ky¡l¡ HC L¡S¢V Lle, ¢a¢e/ay¡l¡ p¢WL i¡h f¢lQkÑ¡ h¡ fl£r¡ Lle?(N¡m Ll) qyÉ¡
/ S¡e¡ eC / e¡
35. Bf¢e La OeOe f¢lQkÑ¡ h¡ fl£r¡ Ll¡V¡ cMe? HLcjC eu / M¤h Lj / ¢hno pju B¿¹l / M¤hC OeOe
36. ¢k¢e/ky¡l¡ f¢lQkÑ¡/fl£r¡ Ll¡V¡ cMe, Bf¢e ay¡L/ay¡cl La OeOe a¡ Ll¡l Lb¡ hme? HLcjC eu/ M¤h Lj/
¢hno pju B¿¹l/M¤hC OeOe
37. k¢c e¡ Lle, a¡qm :
h¡Cll LE ¢L ¢hno pju B¿¹l f¢lQkÑ¡/fl£r¡ Lle?
La¢ce A¿¹l Lle? (#) fË¢a j¡p
38. ¢a¢e/ay¡l¡ ¢L H ¢hou L¡b¡J ¢nr¡ m¡i LlRe? ¢hoc hmhe?
39. ¢a¢e/ay¡l¡ La O¾V¡ H ¢hou ¢nr¡ fu¢Rme? O¾V¡
40. ay¡L/ay¡cl ¢L HC L¡Sl SeÉ f¡¢lnË¢jL cJu¡ qu? (N¡m Ll) qyÉ¡ / S¡e¡ eC / e¡
41. cJu¡ qm a¡ La? V¡L¡ fË¢a j¡p
Lah¡l ay¡L/ay¡cl HC L¡Sl SeÉ f¡¢lnË¢jL cJu¡ qu? (#) fË¢a j¡p
42. Bf¢e ¢L ¢hnÄ¡p Lle k ¢k¢e/ky¡l¡ HC L¡S¢V Lle, ¢a¢e/ay¡l¡ p¢WL i¡h f¢lQkÑ¡ h¡ fl£r¡ Lle?(N¡m Ll) qyÉ¡
/ S¡e¡ eC / e¡
43. Bf¢e La OeOe f¢lQkÑ¡ h¡ fl£r¡ Ll¡V¡ cMe? HLcjC eu / M¤h Lj / ¢hno pju B¿¹l / M¤hC OeOe
44. ¢k¢e/ky¡l¡ f¢lQkÑ¡/fl£r¡ Ll¡V¡ cMe, Bf¢e ay¡L/ay¡cl La OeOe a¡ Ll¡l Lb¡ hme? HLcjC eu/ M¤h
Lj/¢hno pju B¿¹l/ M¤hC OeOe
45. ¢k¢e/ky¡l¡ f¢lQkÑ¡/fl£r¡ Ll¡V¡ cMe, Bf¢e ay¡l/ay¡cl LaÑ«frL La OeOe a¡ Ll¡l Lb¡ hme? HLcjC eu
/ M¤h Lj / ¢hno pju B¿¹l / M¤hC OeOe
46. (c§x Sx Ex ¢V HM¡e hÉhq¡l Llh) ¢V bL hSÑÉ Evfæ qu?(N¡m Ll) qyÉ¡ / S¡e¡ eC / e¡
47. k¢c hSÑÉ Evfæ qu, a¡qm a¡ La M¡¢e? ¢mV¡l fË¢a ¢ce
48. k¢c hSÑÉ Evfæ qu, a¡qm kC ÙÛ¡e HC hSÑÉ f¢laÉ¡N Ll¡ qu, pC ÙÛ¡e¢V Bfe¡l h¡¢s bL Lac§l Ah¢ÙÛa?
¢jV¡l
49. k¢c hSÑÉ Evfæ qu, a¡qm HC hSÑÉ f¢laÉ¡N Ll¡l MlQ La? V¡L¡ fË¢a j¡p
50. (c§x Sx Ex ¢V HM¡e hÉhq¡l Llh) ¢V La¢ce fkÑ¿¹ ¢WLW¡L L¡S Ll?
hRl
¢hi¡N 5: hÉcq¡lL¡l£cl ja¡ja
flhaÑ£ fËnÀ…m¡ p¡d¡lZi¡h c§oZj¤š² fËÙ¹¥¢al fËk¤¢š² ¢houLz Hcl EŸnÉ qm Bfe¡cl ¢eScl L¡R J f¢lh¡l HC
fËk¤¢š²l …l¦aÆ J °h¢nøÉ…m LQV¡ fËu¡Se£u p ¢hou ¢eiÑ̈m Ah¢q¢az Be¤NËq Ll ¢eiÑ̈m Ešl ¢cu pqk¡¢NQ¡
Llhez
206

¢ejÀ¡š² ¢hou…m¡ Bfe¡l L¡R LaV¡ fËu¡Se£u:
HLh¡
lC
AfËu¡
Se£u
AfË
u¡Se
£u
AfËu¡
Se£uJ
eu,
fËu¡Se
£uJ eu
fËu¡
Se£u
M¤hC
fËu¡
Se£u
L¡eJ Ešl eC
51 fËLÒf ÙÛ¡fel BN Bfe¡l p‰
Bm¡Qe¡ Ll¡z -2
-1
0
+1
+2 X
57 ¢pÜ¡¿¹ NËqZl rœ p¢œ²u AwnNËqZz -2
-1
0
+1
+2 X
53 f¢lh¡ll L¡eJ pcpÉl, ¢pÜ¡¿¹l ¢hou
AwnNËqZz
-2
-1
0
+1
+2 X
54 fÜ¢a¢V f¢lhn-pq¡uL ¢qph
f¢lL¢ÒfQ ¢Le¡z
-2
-1
0
+1
+2 X
55 fËLÒf¢V / fÜ¢a¢V BL¡l r¥â S¡uN¡u
¢œ²u¡n£m ¢Le¡z
-2
-1
0
+1
+2 X
56 51. fËLÒf¢Vl ¢ejÑ¡Z k k dlZl
Ef¡c¡e hÉhq©a quRz
-2
-1
0
+1
+2 X
57 fËLÒf¢Vl h¡pÙÛ¡e bL c§lšÄz -2
-1
0
+1
+2 X
58 fËLÒf¢Vl öÜ Sm fËÙ¹¥a Ll¡l hNz -2
-1
0
+1
+2 X
59 fËLÒf ÙÛ¡fe ¢hou¢V pjf§ZÑ h¡T¡ BR
¢Le¡z
-2
-1
0
+1
+2 X
60 fËLÒf bL f¡Ju¡ öÜ Sm Bfe¡l
p¡jbÑl jdÉ ¢Le¡z
-2
-1
0
+1
+2 X
61 fËLÒf¢V ¢hcÉ¥aQ¡¢ma ¢Le¡z -2
-1
0
+1
+2 X
62 fËLÒf¢V ¢eiÑlS¡NÉ ¢Le¡z -2
-1
0
+1
+2 X
63 fËLÒf ÙÛ¡fel BN ¢h¢iæ fËLÒfl
jdÉ bL HL¢V L fR¾cl p¤¤k¡N ¢Rm
¢Le¡z
-2
-1
0
+1
+2 X
64 Sml …Zj¡e ¢eu¢jQ fl£r¡ Ll¡ qu
¢Le¡z
-2
-1
0
+1
+2 X
65 fËLÒf¢Vl L¡SLjÑ ¢WLja S¡e¡ BR
¢Le¡z
-2
-1
0
+1
+2 X
66 c§oZj¤š² Sm - k¡ HC fËLÒf fËÙ¹¥a qu
- a¡l ü¡c i¡m ¢Le¡z
-2
-1
0
+1
+2 X
67 fË¡ç Sm AüµR ¢Le¡z -2
-1
0
+1
+2 X
68 fËLÒfl lrZ¡hrZ fÜ¢a ¢WLja S¡e¡
BR ¢Le¡z
-2
-1
0
+1
+2 X
69 ¢k¢e fË¡ç Sm fl£rZ Hhw fËLÒf
lrZ¡hrZl c¡¢uaÆ luRe, ¢a¢e
AbÑl ¢h¢eju H L¡S Lle ¢Le¡z
-2
-1
0
+1
+2 X
70 ¢k¢e fË¡ç Sm fl£rZ Hhw fËLÒf
lrZ¡hrZl c¡¢uaÆ luRe, ¢a¢e
fË¢nrZ fË¡ç ¢Le¡z
-2
-1
0
+1
+2 X
71 c¡¢uaÆfË¡ç LjÑ£L fËu¡Se£u rœ c¡u£
Ll¡ k¡u ¢Le¡z
-2
-1
0
+1
+2 X
72 c§oZj¤š² Sm fa qh - H¢V ¢eScl
¢pÜ¡¿¹ ¢Rm e¡ h¡Cll L¡eJ fl¡jnÑl
j¡dÉj Nªq£a qu¢Rm?
-2
-1
0
+1
+2 X
73 fËLÒf bL f¡Ju¡ öÜ Sm ¢he¡j§mÉ -2 -1 0 +1 X
207

f¡Ju¡ k¡u ¢Le¡z 74 f¢lh¡ll pLm BpÑ¢eL k¤š² Sm
f¡el n¡l£¢lL fË¢a¢œ²u¡ ¢hnu S¡ee
¢Le¡z
-2
-1
0
+1
+2 X
75 fËLÒfl lrZ¡hrZ ¢ek¤š² LjÑ£l
Ad£rL ¢qph LE BRe?
-2
-1
0
+1
+2 X
76 fËLÒf fËÙ¹¥a Sml L¡eJ ENË ü¡c
BR ¢Le¡?
-2
-1
0
+1
+2 X
77 fËLÒf h¡¢s bL L¡R¡L¡¢R ¢Le¡z -2
-1
0
+1
+2 X
78 fËLÒf R¡VM¡V pwú¡l Lla qu ¢Le¡z -2
-1
0
+1
+2 X
79 fËLÒf bL fË¡çSm LaV¡ BpÑ¢eL
b¡LR, a¡ S¡e¡ BR ¢Le¡z
-2
-1
0
+1
+2 X
80 fËLÒf bL L¢We h¡ Qlm hSÑÉ Evfæ
qu ¢Le¡z
-2
-1
0
+1
+2 X
81 fËLÒf bL k¢c hSÑÉ Evfæ qu, a¡qm
Q¡ h¡pÙÛ¡el L¡R¡L¡¢R gm¡ qu ¢Le¡z
-2
-1
0
+1
+2 X
82 fËLÒf bL k¢c hSÑÉ Evfæ qu, a¡qm
Q¡ fËLÒfl L¡R¡L¡¢R gm¡ qu ¢Le¡z
-2
-1
0
+1
+2 X
83 fËLÒf f¤ehÑÉhqÉl h¡ f¤el¦vf¡cel
hÉhÙÛ¡ BR ¢Le¡z
-2
-1
0
+1
+2 X
HLh
¡lC
e¡
e¡ e¡J
eu,
qyɡJ
eu
qyÉ¡ S¡l
l
p‰
qyɡ
L¡eJ Ešl eC
84 B¢j je L¢l, c§oZj¥š² Sm fËLÒf¢V
BL¡l ka R¡V qu aaC i¡mz
-2
-1
0
+1
+2 X
85 B¢j je L¢l, c§oZj¥š² Sm fËLÒf¢V
ke f§ZlhÉhq©a âhÉ¡¢c ¢cu °al£ quz
-2
-1
0
+1
+2 X
91 B¢j je L¢l, c§oZj¥š² Sm fËLÒf¢V
Bj¡l h¡¢sl ka L¡R qu aaC i¡mz
-2
-1
0
+1
+2 X
86 k¡cl p¡jbÑÉ BR, a¡cl c§oZj¥š² Sml
Ll cJu¡ E¢Qaz
-2
-1
0
+1
+2 X
88 Bj¡l ja p¡hÑS¢ee c§oZj¥š² Sm fËLÒf
hÉhq¡l Ll¡l bL ¢eSl h¡¢sa
c§oZj¥š² Sm fËLÒf b¡L¡V¡ L¡jÉz
-2
-1
0
+1
+2 X
89 p¡hÑS¢ee c§oZj¥š² Sm fËLÒf b¡L¡V¡C
Bj¡l k¥¢š²k¤š² je quz
-2
-1
0
+1
+2 X
90 B¢j ¢eSü Sm f¢lo¡dL (Ju¡V¡l
¢gÒV¡l) cM¡öe¡ Lla fR¾c L¢l e¡z
-2
-1
0
+1
+2 X
91 Sm c§oZj¥š² Llh¡l SeÉ k l¡p¡u¢ZL
k±N hÉhq¡l L¡¢l qu, a¡ L¡jÉ euz
-2
-1
0
+1
+2 X
92 AeÉl L¡R bL c§oZj¥š² Sm fËLÒfl
e¡j e¡ Se, B¢j fR¾c L¢l ¢eS
Seöe a¡ fR¾c Llaz
-2
-1
0
+1
+2 X
93 Sm pLml SeÉ ¢he¡j§mÉ qJu¡ E¢Qaz -2
-1
0
+1
+2 X
94 Sm c§oZj¤š² qm, B¢j AÒf ü¡c pq
Sm f¡e l¡¢Sz
-2
-1
0
+1
+2 X
95 h¡¢s fkÑ¿¹ Sm fy±R k¡Ju¡ ph bL
k¥¢š²k¤š²z
-2
-1
0
+1
+2 X
96 Bj¡l ja k c§oZj¥š² Sm fËLÒf¢V -2 -1 0 +1 +2 X
208

¢hc¤Év Q¡¢ma, a¡ k fËLÒf¢V ¢hc¤Év
Q¡¢ma eu, a¡l bL Lj ¢eiÑlk¡NÉz
97 fËLÒf bL Evfæ L¢We h¡ alm hSÑÉ
BpÑ¢eL b¡Lm B¢j a¡ ¢eu i¡¢ha
eCz
-2
-1
0
+1
+2 X
98 fËLÒf bL Evfæ L¢We h¡ alm hSÑÉ
BpÑ¢eL b¡Lm a¡ L¡b¡u gm¡ qµR,
a¡ ¢eu B¢j i¡¢ha eCz
-2
-1
0
+1
+2 X
99 c§oZj¤š² Sml ü¡c b¡L¡ Ae¤¢Qaz -2
-1
0
+1
+2 X
100 B¢j Lhmj¡œ üµR SmC f¡e L¢lz -2
-1
0
+1
+2 X
101 c§oZj¤š² Sm pwNËq Llh¡l B¢j AÒf
c§laÆ A¢aœ²j Lla l¡¢Sz
-2
-1
0
+1
+2 X
102 h¢ql¡Na L¡e cml hm cJu¡ L¡eJ
c§oZj¤š² Sm fËLÒfl e¡j B¢j ¢hnÄ¡p
Llhz
-2
-1
0
+1
+2 X
103. c§oZj¤š² Sm pwNËq Llh¡l SeÉ LaV¡ c§laÆ A¢aœ²j Lla f¡le?
¢jV¡l
104. c§oZj¤š² Sm pwNËq Llh¡l SeÉ LaV¡ c§laÆ A¢aœ²j Ll¡ k¥¢š²k¤š² je quz
¢jV¡l
105. fË¢a h¡m¢a Sm ¢ndel SeÉ LarZ Afr¡ Lla f¡le? ¢jV¡l
106. fË¢a h¡m¢a Sm ¢ndel SeÉ LarZ Afr¡ Ll¡ k¥¢š²k¤š² je quz
¢jV¡l pç¡q Lah¡l fËLÒf lrZ¡hrZ Bf¢e Awn ¢ea CµR¥L?
107. Sm c§oZfËLÒf œ²ul qeÉ fËu¡ke£u hÉul LaV¡ Bfe¡l f¢lh¡l hqe Lla CµR¥L?
108. HlLj fËLÒf ÙÛ¡fel hÉu La qm Bfe¡l fr k¥¢š²k¤š² je quz
109. ¢höÜ Sml SeÉ Bfe¡l f¢lh¡l j¡p La V¡L¡ hÉu Lla CµR¥L?
110. ¢höÜ Sml SeÉ Bfe¡l f¢lh¡l j¡p La V¡L¡ hÉu Bfe¡l k¥¢š²k¤š² je qu?
Bfe¡l pqk¡¢Na¡l SeÉ deÉh¡cz Bj¡cl p‰ Lb¡ hmh¡l SeÉ Bf¢e k pju ¢cuRe Bjl¡ h¡¢daz ejú¡lz
209

210
Appendix II: Technical Data Check List Per Village
Community Information
Date
Name of village & district
GPS coordinates
Elevation
Number of houses
Estimated population
Number of wells
General location of wells
Sources of water available
Physical distances to
sources
Ownership of wells
Religion
Political Involvement
Well Information
Well depth(s)
GW height
Type of pump (hand or
electric)
Flow rate(s)
[As] of raw water
Number of people
using each well
(Average) Distance to
well
Presence of wellhead
filter unit
CWT Information
Make/Model
Installation date
Removal mechanism
[As] of treated water
Flow rate
Volume of treated water
produced per day
Time spent treating
water
Dimensions (size)
Mass
Materials used in
construction
Replaceable parts
Instructions present
Maintenance guidelines
present
Volume of sludge
produced per day
[As] of sludge
Number of waste
dumping sites
General location(s) of
waste dumping sites

211
Appendix III: Detailed Letter of Explanation
Naturally-occurring arsenic (a well-known poison), is present in the well-water of over 50
million rural residents in the Bengal Basin (India and Bangladesh). It is important for the people
affected by this contamination that the most appropriate and sustainable clean-water
technologies are implemented to ensure safe drinking water. At the present time, this is not
happening, as the vast majority of arsenic-removal or avoidance technologies implemented fail
within the first year. These technologies need to be correctly assessed.
The purpose of this project is to create a transparent and standardised evaluation methodology
which will enable decision-makers to select and promote the best, long-term and appropriate
solutions for the affected communities. This will be done by using the Process Analysis Method
(PAM) to create triple-bottom line, sustainability assessments. This method is rooted in
engineering systems theory which first requires defining both sustainability and the system’s
boundaries. In the case of this project, the boundary is set at a community level. The framework
for the metric is created by identifying economic, sociocultural and environmental impact
generators and receivers, which lead to the characterisation of meaningful indicator sets. These
will highlight the degree to which a technology is environmentally friendly, socio-culturally
appropriate and economically viable which will be used in the creation of a sustainability index
allowing the technologies to be compared to each other numerically.
Most of the technical data is available online allowing me to fill in the values for the
environmental and economic indicators for each technology fairly easily. However since this
project is user-focused, the technology users must be consulted to quantify the reality and
priority of various socio-cultural aspect of the technology. I need to understand the process of
engagement during the installation process, and to know the distance the user is walking to
collect water, the time spent filtering, number of times a day water is collected, the degree to
which the colour and taste are acceptable, whether they are physically and technically able to

212
conduct regular maintenance, if there is an incentive for filter, or accountability for regular
maintenance, and where waste is disposed of. I also need to learn the degree of importance and
priority of these factors to the user. It is not necessary for me to ask the individual’s name or
record their contact details (address and phone number) for my research. However I do need to
record the village name they live in, their gender, age, number of people living in the home,
levels of education, and average monthly income. Please note that this personal data will be
manipulated statistically and never published in its raw form.
Gathering this information requires me to conduct field work so I will be travelling to various
villages around the Kolkata region in West Bengal, India. I will be accompanied by my local
translator and we will conduct door-to-door surveys in these villages. The total sample number
is chosen based upon the number of households that exist within each community, and each
household will be chosen randomly (perhaps every third or fourth house in a row). We will
approach the randomly selected home and ask to speak with an adult. We will then introduce
ourselves and continue using the script (see top of survey) to obtain informed consent verbally.
This will be done in Hindi, Bengali or English. If the individual wishes to participate, we will
ask the questions as listed on the survey verbally to the participant and fill in the survey
ourselves with the participant’s answers. If the individual does not wish to participate then a
business card will still be left, they will be thanked and we will move on to the next house. We
will also be recording the start and finish time for each survey to ensure that on average we are
giving them an accurate time estimate. A technical data check list will be completed for each
village surveyed and given a code which will be recorded at the top of each survey for
organizational purposes. The surveys and technical data will be scanned and saved as pdf files
in a secure folder on my computer. The hard copies will be destroyed.
Verbal informed consent will be obtained for any photos taken inside homes (or any private
location).

213
University of Oxford
Department of Engineering Science
Appendix III: Participant Information Sheet
Name of Research Project: Accounting for Sustainability of Clean-Water Technologies in
Bengal
Principal Investigator: Tamara Etmannski, Doctoral Student; c/o St. Edmund Hall, Queens
Lane, Oxford, United Kingdom, OX1 4AR; +44 (0)775 806 7992;
Purpose of the Study: To gather information related to water filters or clean water strategies
from community members/users, with the purpose of using this information to create a method
of technology evaluation that accurately represents the values and priorities of the
community/user. This user-focused evaluation will enable decision-makers to select and
promote the best, long-term and appropriate solutions for the affected communities.
As a Participant: You are being invited to take part in this study because the clean-water
technology used in your community is being evaluated and your feedback on issues like user-
ability, reliability and economic viability are valuable to the success for this research.
Your participation will involve answering one household survey that will take between 15-20
minutes to complete. Questions will be asked orally in your native tongue (English, Bengali or
Hindi) at your doorstep, at the time of first contact by the door-to-door local surveyors.
Please ask questions about the study before you decide whether to participate. If you agree to
participate, you may withdraw from the study without penalty at any time by advising the
researchers of this decision.

214
This project has been reviewed by, and received ethics clearance through the University of
Oxford Central University Research Ethics Committee.
The University of Oxford is committed to the dissemination of its research for the benefit of
society and the economy and, in support of this commitment, has established an online archive
of research materials. This archive includes digital copies of student theses successfully
submitted as part of a University of Oxford postgraduate degree programme. Holding the
archive online gives easy access for researchers to the full text of freely available theses, thereby
increasing the likely impact and use of that research. If you agree to participate in this project,
the research will be written up as a thesis. On successful submission of the thesis, it will
deposited both in print and online in the University archives, to facilitate its use in future
research. The thesis will be published with open access, meaning available to every internet
user. This research also may be published in peer-reviewed academic journals, and may be used
in research dissemination strategies including all modes of multi and social media, accessible
internationally. All personal data collected will be securely stored by the researcher in hard copy
and electronic copy for potential future use or reference.
No benefit (direct or indirect) may accrue to the participants in the study and there are no risks
involved in participating in this study.
If you have a complaint or concern about any aspect of this project, please speak to the
researcher concerned (Tamara Etmannski, +44 (0)775 806 7992) who will do her best to answer
your query. If you remain unhappy and wish to make a formal complaint, please contact
the Research Ethics Committee at the University of Oxford ([email protected]; +44
(0)1865 614871; Social Sciences & Humanities Inter-Divisional Research Ethics Committee,
Oxford University, Hayes House, 75 George Street, Oxford, OX1 2BQ, UK).
Thank you for your time.

215
University of Oxford
Department of Engineering Science
Appendix III: Consent of a Research Participant
Name of Research Project: Accounting for Sustainability of Clean-Water
Technologies in Bengal
Principal Investigator: Tamara Etmannski, Doctoral Student
Purpose of the Study: To gather information related to water filters or clean water
strategies from community members/users, with the purpose of using this information to
create a method of technology evaluation that accurately represents the values and
priorities of the community/user.
Participant Declaration:
I confirm that I have read the participant information sheet and understand its contents.
I confirm that I had the opportunity to ask questions about the study and have received
satisfactory answers to questions, and any additional details requested.
I acknowledge that any photographs taken of me will not be owned by me.
I understand that any photographs taken of me or any information I provide during my
participation in this research project, may be distributed in any medium in any part of
the world.
[I understand that my photographs may be edited and there is no guarantee that my
photographs will appear in the final write-up documents. I agree that my contribution
may be used to publicize the research.]

216
I understand that I may withdraw my consent at any time during my participation in the
research project and that I do not have to give a reason for my decision. I acknowledge
that such withdrawal of my consent will not prejudice my participation in this research
project.
I understand that this project has been reviewed by, and received ethics clearance
through, the University of Oxford Central University Research Ethics Committee.
I understand how this research will be written up as a student’s thesis, posted online in
the University of Oxford Archive, may be published in peer-reviewed academic
journals, and may be used in research dissemination strategies including all modes of
multi and social media.
I understand how my personal data will be stored by the researcher.
I agree to participate in this study.
I understand how to make a complaint or raise a concern about any aspect of this
project.
Signed…………………….…….….……(Participant)
Print Name………….…………….….…(Participant)
Date………………………………..……(Participant)
Witnessed by……….……………………(Researcher)
Print name………..….…….…………….(Researcher)
Date………………………………….…..(Researcher)

SOCIAL SCIENCES & HUMANITIES INTER-DIVISIONAL RESEARCH ETHICS COMMITTEE Hayes House, 75 George Street, Oxford. OX1 2BQ Tel: +44(0)1865 614871 Fax: +44(0)1865 614855 [email protected] www.socsci.ox.ac.uk Co-ordinator of the IDREC Social Sciences Divisional Office
_
Monday, 9 July 2012 Tamara Etmannski Department of Engineering Science Dear Tamara,
Research Ethics Approval
Ref No.: SSD/CUREC1/12-024
Accounting for Sustainability in Bengal: Examining Arsenic-Removal Technology using Process Analysis Method
The above application has been considered on behalf of the Social Sciences and Humanities Inter-divisional Research Ethics Committee (IDREC) in accordance with the procedures laid down by the University for ethical approval of all research involving human participants.
I am pleased to inform you that, on the basis of the information provided to the IDREC, the proposed research has been judged as meeting appropriate ethical standards, and accordingly approval has been granted.
Should there be any subsequent changes to the project, which raise ethical issues not covered in the original application, you should submit details to the IDREC for consideration.
Yours sincerely,
Kathryn Dally
cc: Prof Richard Darton, Department of Engineering Science Prof Guy Houlsby, Department of Engineering Science
KD/EB

218
University of Oxford
Department of Engineering Science
Appendix III: Itinerary for Training Session
11:15-11:25 Meet and fill out forms
-Emergency Contact Information
-Contract
11:30 Meeting begins
11:30-11:40 Introductions
11:40-12:00 Background on Project
12:00-12:10 Safety
12:10-12:20 Ethics
12:20-1:00 Specifics on Household Survey
-English / Bengla
-Practice, Role Play
-Work through Training Sheet
1:00-1:20 Job Specifics
-Pay (Amount, Pay day, Food Stipend)
-Job Expectations (Hours, Locations, Attitude, Flexibility)
1:20-1:30 Questions / Concerns
1:30-1:45 Determine Morning Meeting Spot
1:45-2:00 Discuss / Modify Schedule

219
University of Oxford
Department of Engineering Science
Appendix III: Training Notes
Part 1: Background
Naturally-occurring arsenic (a well-known poison), is present in the well-water of over
50 million rural residents in the Bengal basin (India and Bangladesh). It is important for
the people affected by this contamination that the most appropriate and sustainable
clean-water technologies (CWT) are implemented to ensure safe drinking water. At the
present time, this is not happening, as the vast majority of arsenic-removal or avoidance
technologies implemented fail within the first year. These technologies need to be
correctly assessed.
The purpose of this project is to create a transparent and standardised evaluation
methodology which will enable decision-makers to select and promote the best, long-
term and appropriate solutions for the affected communities. Since this project is user-
focused, the technology users must be consulted to quantify the reality of various socio-
cultural aspects of the technology. For example, I need to understand the process of
engagement during the installation process, and to know the distance the user is walking
to collect water, the time spent filtering, number of times a day water is collected, the
degree to which the colour and taste are acceptable, whether they are physically and
technically able to conduct regular maintenance, if there is an incentive for filter, or
accountability for regular maintenance, and where waste is disposed of. I also need to
learn the degree of importance and priority of these factors to the user. It is not
necessary for me to ask the individual’s name or record their contact details (address

220
and phone number) for my research. However I do need to record the village name they
live in, their gender, age, number of people living in the home, levels of education, and
average monthly income. Please note that this personal data will be manipulated
statistically and never published in its raw form.
Gathering this information requires conducting door-to-door surveys in villages that use
different CWTs. The total sample number is chosen based upon the number of
households that exist within each community, and each household will be chosen
randomly (perhaps every third or fourth house in a row). We will approach the
randomly selected home and ask to speak with an adult. We will then introduce
ourselves and continue using the script (see top of survey) to obtain informed consent
verbally. This will be done in Hindi, Bengali or English. If the individual wishes to
participate, we will ask the questions as listed on the survey verbally to the participant
and fill in the survey ourselves with the participant’s answers. One surveyor asks
questions and one writes down all the answers. If the individual does not wish to
participate then a business card will still be left, they will be thanked and we will move
on to the next house. We will also be recording the start and finish time for each survey
to ensure that on average we are giving them an accurate time estimate. A technical data
check list will be completed for each village surveyed and given a code which will be
recorded at the top of each survey for organizational purposes. I will be conducting
arsenic testing of the raw water, the tested water and the waste produced in each
location.
Part 2: Survey
Sampling (selecting houses to survey):
Depending on the population of a village or number of houses in a community
we will be trying to survey 30 houses per 100 (1 in every 3). So you walk down
a street and count 3 houses in a row. You approach the third to be surveyed. You

221
do not survey a house upon request unless their house was the 3rd
house picked
randomly.
Section 1
Informed consent means you explain to people who you are and what your intentions
are and after to ask their permission to participate. If they say no, thank them and move
on. Instead of going to the next house, approach the house one behind (the second
house).
Section 2
The point of section 2 is to identify the household demographic and also to build a
rapport by asking easy questions very early on in the survey.
Section 3
The point here is to identify current and past use of water. Here is a detailed explanation
of all the options. You must know these and understand this table in order to understand
how to target the survey correctly.
Water Source Water Type To make Drinkable:
Rain water -Rain/Dew None
-Rainwater harvesting Filter and/or Add chemicals
Surface water -Ponds Filter
-Rivers Filter
Ground water -Dug wells (young) Add chemicals
-Shallow tube wells (old) Arsenic filter
-Deep tube wells (very old) None
Piped -Treated by corp or gov’t -Piped to village or home
This project is primarily interested in the use of Rainwater, Groundwater and Piped
water for drink/cooking purposes. Many people do not use surface water for drinking
because of bad bacteria.
It is also important to distinguish whether the tube well is shallow or deep. The only
way to know this is to ask the household for the actual depth. Do not ask the household
whether it is shallow or deep because they will not understand that I am using a
scientific definition. In their opinion, it may be shallow or deep but I don’t want their

222
opinion. I want actual depth (or estimated) in meters or feet. It would also be useful to
know who owns the tube well (if one is used) or whether the household themselves
drilled it, verses some other community member, government or outside organisation.
Make sure you distinguish between household level technologies and community-
shared technologies, and also, past use versus current use.
Section 4
Using section 3, you need to identify one clean water source (CWS) to focus on and let
the household know that for this next section you are only focusing on this technology.
It can be a CWS that they currently use, or have used in the past. For example, if they
used to use a filter but don’t anymore, it is very interesting to understand why they
stopped.
Section 5
This section is not about a specific technology, which is why you are to ask these
questions even if the household doesn’t use any CWT. These questions are asked to
help identify the community’s values in respect to CWT generally. So please make sure
you tell them before starting this section that these questions are more general in nature
and to respond based upon their personal opinion.
The last section is a continuation of the first part in section 5, in that we are trying to
identify the user’s values, however in this last section we are looking for exact numbers
that express the worst case scenario that is ‘acceptable’ (maximum values) and also
parameters that would exist in an ideal world (ideal values).
Closing:
Make sure you thank them for their time and cooperation. Ask them if they have
any questions before leaving and spend time answering their concerns.

Appendix III: Surveyor Offer Letter
DEPARTMENT OF ENGINEERING SCIENCE Office 13, 14 Parks Road, Oxford, United Kingdom
Tamara R Etmannski
Doctoral Student in Sustainable Water Engineering Sub Dean at St Edmund Hall
223
_
August 10, 2012
Dear Surveyor,
Re: Surveyor Position
This letter describes the duties, expectations and remuneration for the on-call surveyor
positions.
Four surveyors will be expected to accompany the Oxford Researcher to locations
around West Bengal, including day-trips and possible over-night trips. During these
trips, teams of two surveyors will travel door-to-door together conducting household
surveys. Each survey-team will be expected to fill in between 10-12 surveys per day.
The surveyors will be expected to follow all ethical protocols and safety procedures
while in the field. The surveyors are also expected to work well with a team, to be
flexible, professional, and honest. The surveyors are required to travel to and from an
agreed meeting spot by themselves (at their own cost) in the morning before the trip and
in the evening after the trip is over. The meeting time in the morning will likely be
around 6am, and no tardiness is acceptable. Returning times will vary depending on the
day.
Each surveyor may work 0-4 days/week, for the duration of 8-10 weeks beginning the
week of July 15, 2012. The salary will be 500 INR per person per day. Surveyors may
be expected to work on weekends (Saturday and Sunday). Costs for transportation will
be paid for all day-trips (from the central meeting spot). An additional 50 INR per day
will be paid to each surveyor so they can pack and bring food and water for themselves
for the entire day, each day. Payment of the daily wage and daily food stipend will be
made in cash weekly, on the last day of field work for that week. If over-night trips are
planned, the costs for transportation, food and accommodation will be paid for the
duration of the trip.
If the researcher feels that the above stated obligations are not being met by a surveyor
at any time during the 10 week period, the researcher can terminate the term
immediately and without notice.
This letter serves as a contract between the researcher and the surveyor that the above
statements have been agreed upon by both parties.
_______________________ ________________________
Signature of Surveyor Signature of Tamara R Etmannski
Oxford Researcher
_______________________
Printed Name of Surveyor
________________________ ________________________
Date Date

224
University of Oxford
Department of Engineering Science
Appendix III: Emergency Contact Information
Name________________________ Mobile Number______________________
Address (with directions)
_____________________________________________________________________
_____________________________________________________________________
Existing allergies or medical conditions (or religious practices that need to be
accommodated for during the field day)
_____________________________________________________________________
_____________________________________________________________________
Are you currently taking any medication? Yes / No (circle) If yes,
List:_________________________
Next of Kin____________________ Relationship_______________________
Phone________________________ Alt. Phone_________________________
Address______________________________________________________________
_____________________________________________________________________
Please explain what you would or wouldn’t like the survey team to do if you were to get
injured while working in the field (for example, administer any drugs and/or first aid,
drive you to clinic, call an ambulance, call family, etc):
_____________________________________________________________________
_____________________________________________________________________
I acknowledge that while working in this project, I am solely responsible for my own
safety. Therefore, by signing this form I formally acknowledged that neither the team
leader (Oxford Researcher) nor The University of Oxford or my fellow surveyors are
liable for any reason that may result from any situation that may occur during this
project.
_____________________________ ________________________________ Print Name (Surveyor) Print Name (Witness-Oxford Researcher)
_____________________________ ________________________________ Sign Name Sign Name
_____________________________ _________________________________ Date Date

Department of Engineering Science Appendix III: Risk Assessment Form RA01 05/01
225
Risk Assessment Risk Assessment: Conducting household surveys (door-to-door) Page 1 of 2
Location: Villages surrounding Kolkata, India Review Date :
Assessment undertaken by: Tamara Etmannski Signed Date :
Assessment supervisor: Richard Darton Signed Date :
Hazard Persons at Risk Risk Controls In Place Further Action Necessary To Control Risk
1. Sun-stroke (heat stroke) 2. Unhygienic food / water causing digestive problems (parasites, bacterial diarrhoea) 3. Malaria or Dengue Fever from mosquitos 4. Falling due to rough terrain 5. Drowning or injury due to flood waters
Researcher(s) “ “ “ “
-Wear sun cream; Keep hydrated; Wear a hat; limit time spent in direct sunlight -Bring packed lunches; Buy and drink only bottled water; Don’t accept food or drink from anyone -Take malaria pills (Chloroquine & Proguanil) -Carry first aid kit; Carry a mobile phone and GPS; First aid course taken; Medical insurance bought; Ring ambulance or air evacuation if serious (see attached Info Sheet) -Carry first aid kit; Carry a mobile phone and GPS; First aid (CPR) course taken; Medical insurance bought; Ring ambulance or air evacuation if serious (see attached Info Sheet)
-Start day being well-rested -Wash hands regularly -Use bug-repellent and mosquito nets -Wear supportive and appropriate footwear and clothing; Walk carefully -Awareness of local surroundings and avoiding flooded regions; Researcher knows how to swim

Department of Engineering Science Appendix III: Risk Assessment Form RA01 05/01
226
6. Robbery or being pick-pocketed 7. Harassment 8. Vehicle accident during hired-car & driver transport 9. Loss of contact 10. Snake bite (Indian Cobra, Common Krait, Russell’s Viper, Saw-scaled Viper)
“
Researcher(s) “ “ “
-Keep valuables in secure pockets or bags; Never leave bags unattended; Wear a secret money pocket -Work in pairs; Carry a mobile phone and GPS; Be conscious of local norms of attire and behaviour; Travel with local translator -Chose reputable car company; Ensure driver is well-rested prior to trip; Ensure driver abides by road rules -See attached Info Sheet for full India, UK and Canada contact details -Avoid marshy areas, rice paddys, mounds of rubble or trash; Avoid walking at night; If bitten proceed to nearest hospital immediately (1 to 5 hours to live without anti-venom)
-Never carry large sums of cash; Don’t wear flashy jewellery or clothes; Never work after dark; Never enter into obvious unsafe areas -Never work after dark; Never enter into obvious unsafe areas -Note: Cars are not normally equipped with seatbelts in Kolkata, India -Researcher is in contact with the host family daily and the host family is knows the details of the researcher’s daily itinerary; Check in with supervisor once per week through email; Skype with family once per week -Knowledge on recognising local snakes and their typical behaviour


![ACCOUNTANCY EXAMINING BOARD[193A]](https://static.fdokumen.com/doc/165x107/6323acc9be5419ea700eb5e1/accountancy-examining-board193a.jpg)