Scientific Opinion on Arsenic in Food
199
EFSA Journal 2009; 7(10):1351 Suggested citation: EFSA Panel on Contaminants in the Food Chain (CONTAM); Scientific Opinion on Arsenic in Food. EFSA Journal 2009; 7(10):1351. [199 pp.]. doi:10.2903/j.efsa.2009.1351. Available online: www.efsa.europa.eu © European Food Safety Authority, 2009 1 SCIENTIFIC OPINION Scientific Opinion on Arsenic in Food 1 EFSA Panel on Contaminants in the Food Chain (CONTAM) 2, 3 European Food Safety Authority (EFSA), Parma, Italy This scientific output, published on 1 February 2010, replaces the earlier version published on 22 October 2009 4 . This scientific output, published on 27 September 2010, replaces the earlier version published on 1 February 2010 5 . ABSTRACT The EFSA Panel on Contaminants in the Food Chain (CONTAM Panel) assessed the risks to human health related to the presence of arsenic in food. More than 100,000 occurrence data on arsenic in food were considered with approximately 98 % reported as total arsenic. Making a number of assumptions for the contribution of inorganic arsenic to total arsenic, the inorganic arsenic exposure from food and water across 19 European countries, using lower bound and upper bound concentrations, has been estimated to range from 0.13 to 0.56 μg/kg bodyweight (b.w.) per day for average consumers, and from 0.37 to 1.22 μg/kg b.w. per day for 95 th percentile consumers. Dietary exposure to inorganic arsenic for children under three years of age is in general estimated to be from 2 to 3-fold that of adults. The CONTAM Panel concluded that the provisional tolerable weekly intake (PTWI) of 15 μg/kg b.w. established by the Joint FAO/WHO Expert Committee on Food Additives (JECFA) is no longer appropriate as data had shown that inorganic arsenic causes cancer of the lung and urinary bladder in addition to skin, and that a range of adverse effects had been reported at exposures lower than those reviewed by the JECFA. The CONTAM Panel modelled the dose-response data from key 1 On request from the European Commission, Question No EFSA-Q-2008-425, adopted on 12 October 2009. 2 Panel members: Jan Alexander, Diane Benford, Alan Boobis, Sandra Ceccatelli, Jean-Pierre Cravedi, Alessandro Di Domenico, Daniel Doerge, Eugenia Dogliotti, Lutz Edler, Peter Farmer, Metka Filipič, Johanna Fink-Gremmels, Peter Fürst, Thierry Guerin, Helle Katrine Knutsen, Miroslav Machala, Antonio Mutti, Josef Schlatter, Rolaf van Leeuwen and Philippe Verger. Correspondence: [email protected] 3 Acknowledgement: The Panel wishes to thank the members of the Working Group on Arsenic for the preparation of this opinion: Diane Benford, Jean-Pierre Cravedi, Eugenia Dogliotti, Kevin Francesconi, Peter Fürst, Niklas Johansson, Kåre Julshamn, Margaret Karagas, Tanja Schwerdtle, Marie Vahter, Philippe Verger, Bert van der Voet, and EFSA’s staff members Jean Lou Dorne, Mari Eskola, Stefan Fabiansson and Elena Scaravelli, for the support provided to this EFSA scientific output. The Panel acknowledges all the Member States that provided arsenic occurrence data in food and drinking water and supported the consumption data collection for the Concise European Food Consumption Database, Elena Dellatte from the Department of the Environment and Primary Prevention of the Istituto Superiore di Sanità (Italy) for providing consumption information and calculating exposure, the partners of the EFSA project on the “Individual food consumption data and exposure” coordinated by Ghent University (Department of Public Health, University Hospital, Ghent University, Belgium), and RIKILT (Institute of Food Safety, Wageningen, The Netherlands) for the accessibility of the exposure assessment tools. 4 Table of contents shows now the fourth level of subheadings. 5 An error in the interpretation of the total number of the population in the study of Rahman et al. (2006a) was discovered (Table 41). The BMDL was recalculated and as a consequence it was not considered a potential reference point. The text in the opinion, Table 43 and Appendix were revised accordingly. In addition, the header of the “total number of cases” was replaced by “total number of individuals” in Tables 40-42 and the erroneous units were corrected to μg/L in the text below Table 40. The changes do not affect the overall conclusions of the opinion. To avoid confusion, the original version of the opinion has been removed from the website, but is available on the request, as is a version showing all the changes made.
-
Upload
wageningen-ur -
Category
Documents
-
view
0 -
download
0
Transcript of Scientific Opinion on Arsenic in Food

EFSA Journal 2009; 7(10):1351
Suggested citation: EFSA Panel on Contaminants in the Food Chain (CONTAM); Scientific Opinion on Arsenic in Food. EFSA Journal 2009; 7(10):1351. [199 pp.]. doi:10.2903/j.efsa.2009.1351. Available online: www.efsa.europa.eu
© European Food Safety Authority, 2009 1
SCIENTIFIC OPINION
Scientific Opinion on Arsenic in Food1
EFSA Panel on Contaminants in the Food Chain (CONTAM)2, 3
European Food Safety Authority (EFSA), Parma, Italy
This scientific output, published on 1 February 2010, replaces the earlier version published on 22 October 20094. This scientific output, published on 27 September 2010, replaces the earlier version published on 1 February 20105.
ABSTRACT
The EFSA Panel on Contaminants in the Food Chain (CONTAM Panel) assessed the risks to human health related to the presence of arsenic in food. More than 100,000 occurrence data on arsenic in food were considered with approximately 98 % reported as total arsenic. Making a number of assumptions for the contribution of inorganic arsenic to total arsenic, the inorganic arsenic exposure from food and water across 19 European countries, using lower bound and upper bound concentrations, has been estimated to range from 0.13 to 0.56 µg/kg bodyweight (b.w.) per day for average consumers, and from 0.37 to 1.22 µg/kg b.w. per day for 95th percentile consumers. Dietary exposure to inorganic arsenic for children under three years of age is in general estimated to be from 2 to 3-fold that of adults. The CONTAM Panel concluded that the provisional tolerable weekly intake (PTWI) of 15 µg/kg b.w. established by the Joint FAO/WHO Expert Committee on Food Additives (JECFA) is no longer appropriate as data had shown that inorganic arsenic causes cancer of the lung and urinary bladder in addition to skin, and that a range of adverse effects had been reported at exposures lower than those reviewed by the JECFA. The CONTAM Panel modelled the dose-response data from key
1 On request from the European Commission, Question No EFSA-Q-2008-425, adopted on 12 October 2009. 2 Panel members: Jan Alexander, Diane Benford, Alan Boobis, Sandra Ceccatelli, Jean-Pierre Cravedi, Alessandro
Di Domenico, Daniel Doerge, Eugenia Dogliotti, Lutz Edler, Peter Farmer, Metka Filipič, Johanna Fink-Gremmels, Peter Fürst, Thierry Guerin, Helle Katrine Knutsen, Miroslav Machala, Antonio Mutti, Josef Schlatter, Rolaf van Leeuwen and Philippe Verger.
Correspondence: [email protected] 3 Acknowledgement: The Panel wishes to thank the members of the Working Group on Arsenic for the preparation of this
opinion: Diane Benford, Jean-Pierre Cravedi, Eugenia Dogliotti, Kevin Francesconi, Peter Fürst, Niklas Johansson, Kåre Julshamn, Margaret Karagas, Tanja Schwerdtle, Marie Vahter, Philippe Verger, Bert van der Voet, and EFSA’s staff members Jean Lou Dorne, Mari Eskola, Stefan Fabiansson and Elena Scaravelli, for the support provided to this EFSA scientific output. The Panel acknowledges all the Member States that provided arsenic occurrence data in food and drinking water and supported the consumption data collection for the Concise European Food Consumption Database, Elena Dellatte from the Department of the Environment and Primary Prevention of the Istituto Superiore di Sanità (Italy) for providing consumption information and calculating exposure, the partners of the EFSA project on the “Individual food consumption data and exposure” coordinated by Ghent University (Department of Public Health, University Hospital, Ghent University, Belgium), and RIKILT (Institute of Food Safety, Wageningen, The Netherlands) for the accessibility of the exposure assessment tools.
4 Table of contents shows now the fourth level of subheadings. 5 An error in the interpretation of the total number of the population in the study of Rahman et al. (2006a) was discovered
(Table 41). The BMDL was recalculated and as a consequence it was not considered a potential reference point. The text in the opinion, Table 43 and Appendix were revised accordingly. In addition, the header of the “total number of cases” was replaced by “total number of individuals” in Tables 40-42 and the erroneous units were corrected to µg/L in the text below Table 40. The changes do not affect the overall conclusions of the opinion. To avoid confusion, the original version of the opinion has been removed from the website, but is available on the request, as is a version showing all the changes made.

Arsenic in Food
2 EFSA Journal 2009; 7(10):1351
epidemiological studies and selected a benchmark response of 1 % extra risk. A range of benchmark dose lower confidence limit (BMDL01) values between 0.3 and 8 μg/kg b.w. per day was identified for cancers of the lung, skin and bladder, as well as skin lesions. The estimated dietary exposures to inorganic arsenic for average and high level consumers in Europe are within the range of the BMDL01 values identified, and therefore there is little or no margin of exposure and the possibility of a risk to some consumers cannot be excluded.
KEY WORDS total arsenic, inorganic arsenic, organic arsenic, analysis, food, occurrence, dietary exposure, risk assessment, toxicity, bench mark dose (BMD), margin of exposure (MOE)
SUMMARY Arsenic is a metalloid that occurs in different inorganic and organic forms, which are found in the environment both from natural occurrence and from anthropogenic activity. The inorganic forms of arsenic are more toxic as compared to the organic arsenic but so far most of the occurrence data in food collected in the framework of official food control are still reported as total arsenic without differentiating the various arsenic species. The need for speciation data is evident because several investigations have shown that especially in seafood most of the arsenic is present in organic forms that are less toxic. Consequently, a risk assessment not taking into account the different species but considering total arsenic as being present exclusively as inorganic arsenic would lead to a considerable overestimation of the health risk related to dietary arsenic exposure.
Following a call for data, 15 European countries submitted more than 100,000 results on arsenic concentrations in various food commodities. Two thirds of the samples were below the limit of detection. Approximately 98 % of the results were reported as total arsenic, and only a few investigations differentiated between the various arsenic species. The highest total arsenic levels were measured in the following food commodities: fish and seafood, food products or supplements based on algae, especially hijiki, and cereal and cereal products, with particularly high concentrations in rice grains and rice-based products, and bran and germ. Depending on the type of food processing, temperature and time, changes in total arsenic concentration and arsenic species may occur. The arsenic content in cooking water seems to be of special importance because it determines whether the arsenic concentrations in the prepared food may be higher or lower compared to the raw product.
As representative speciation data are scarce, the EFSA Panel on Contaminants in the food chain (CONTAM Panel) was not able to assess the typical ratios between inorganic and organic arsenic in different groups of foodstuffs. Consequently, the CONTAM Panel had to make a number of assumptions for the estimation of the contribution of inorganic arsenic to total arsenic in the exposure assessment based on the few data on inorganic arsenic submitted by the reporting European countries, as well as on key literature data. Thus, the proportion of inorganic arsenic was assumed to vary from 50 to 100 % of the total arsenic reported in food commodities other than fish and seafood, with 70 % considered as best reflecting an overall average. In fish and seafood the relative proportion of inorganic arsenic is small and tends to decrease as the total arsenic content increases, and the ratio may vary depending on the seafood type. Based on the limited data on inorganic arsenic in the present dataset and on published data, fixed values for inorganic arsenic of 0.03 mg/kg in fish and 0.1 mg/kg in seafood were considered realistic for calculating human dietary exposure.
Given the above assumptions, the national inorganic arsenic exposures from food and water across 19 European countries, using lower bound and upper bound concentrations, have been estimated to range from 0.13 to 0.56 µg/kg body weight (b.w.) per day for average consumers, and from 0.37 to 1.22 µg/kg b.w. per day for 95th percentile consumers. The minimum and maximum dietary exposure varied by a factor of 2 to 3 across the 19 European countries, based on different dietary habits rather than different occurrence data. Extrapolating from the main food categories of the EFSA Concise Food Consumption Database the food subclasses of cereal grains and cereal based products, followed by food for special dietary uses, bottled water, coffee and beer, rice grains and rice based products,

Arsenic in Food
3 EFSA Journal 2009; 7(10):1351
fish and vegetables were identified as largely contributing to the inorganic arsenic daily exposure in the general European population.
High consumers of rice in Europe, such as certain ethnic groups, are estimated to have a daily dietary exposure of inorganic arsenic of about 1 µg/kg b.w. per day, and high consumers of algae-based products can have dietary exposure of inorganic arsenic of about 4 µg/kg b.w. per day. The limited available evidence does not indicate a different dietary exposure for vegetarians from that of the general population, unless they consume a large amount of algae-based products.
Children under three years of age are the most exposed to inorganic arsenic. Exposure estimates reported in two different studies show an inorganic arsenic intake ranging from 0.50 to 2.66 µg/kg b.w. per day. Dietary exposure to inorganic arsenic for children under three years old, including from rice-based foods, is in general estimated to be about 2 to 3-fold that of adults. These estimates do not include milk intolerant children substituting rice-drinks for formula or cows’ milk.
Compared to dietary exposure, non-dietary exposure to arsenic is likely to be of minor importance for the general population in the European Union (EU).
High inter-species, inter-population and inter-individual variability was reported for arsenic metabolism and toxicokinetics. Because experimental animals differ considerably from humans with regard to arsenic metabolism and other aspects of toxicokinetics, the results of toxicity studies in animals do not provide a suitable basis for risk characterisation.
In humans, soluble inorganic arsenic is rapidly and nearly completely absorbed after ingestion. Absorption of different organic arsenic compounds is generally greater than 70 %. After being absorbed, arsenic is widely distributed to almost all organs and readily crosses the placental barrier. Biotransformation of inorganic arsenic in mammals includes reduction of pentavalent arsenic to trivalent arsenic and methylation of trivalent arsenic.
The CONTAM Panel noted that, since the provisional tolerable weekly intake (PTWI) of 15 µg/kg b.w. was established by the Joint FAO/WHO Expert Committee on Food Additives (JECFA), new data had established that inorganic arsenic causes cancer of the lung and urinary tract in addition to skin, and that a range of adverse effects had been reported at exposures lower than those reviewed by the JECFA. Therefore the CONTAM Panel concluded that the JECFA PTWI of 15 µg/kg b.w. is no longer appropriate and, in its assessment, focussed on more recent data showing effects at lower doses of inorganic arsenic than those considered by the JECFA.
The main adverse effects reported to be associated with long term ingestion of inorganic arsenic in humans are skin lesions, cancer, developmental toxicity, neurotoxicity, cardiovascular diseases, abnormal glucose metabolism, and diabetes. Neurotoxicity is mainly reported with acute exposure from deliberate poisoning or suicide, or at high concentrations in drinking water. Evidence of cardiovascular disease (Blackfoot disease, peripheral vascular disease, coronary heart disease, myocardial infarction and stroke) and diabetes in areas with relatively low levels of inorganic arsenic exposure is inconclusive. There is emerging evidence of negative impacts on foetal and infant development, particularly reduced birth weight, and there is a need for further evidence regarding the dose-response relationships and critical exposure times for these outcomes.
Therefore the data for cancers of the urinary bladder, lung and skin, which are causally associated with oral exposure to inorganic arsenic, and skin lesions were considered by the CONTAM Panel as possibly providing an appropriate reference point. A limitation in all of the available studies is that total dietary exposure to inorganic arsenic was not measured. In most studies, the concentration of arsenic in drinking water was used as the exposure metric. Urinary or toenail arsenic has been used in a smaller number of studies. In order to provide an opinion on the risks to health related to the presence of inorganic arsenic in foodstuffs, it is necessary to make assumptions about the total dietary exposure of the populations in which the respective health endpoints were studied. The CONTAM

Arsenic in Food
4 EFSA Journal 2009; 7(10):1351
Panel noted that underestimating the total dietary exposure in the study populations will lead to an underestimation of the reference point and, consequently, to an overestimation of the risk when considering the total dietary exposure of EU countries in this opinion, and vice versa, and concluded that it would be appropriate to identify a range of possible total dietary exposures in the key epidemiological studies.
The CONTAM Panel modelled the dose-response data from the key epidemiological studies and also noted other reported dose-response modelling results. A benchmark response of 1 % extra risk was selected because it could be within the range of the observed data. Because of the uncertainties in the exposure in the key epidemiological studies, the CONTAM Panel identified a range of values for the 95 % lower confidence limit of the benchmark dose of 1 % extra risk (BMDL01) for each endpoint. The lowest BMDL01 values are for lung cancer. These data are from a study that is relatively small but has the advantage that the population is likely to have a nutritional and genetic background that is more similar to that of EU populations than those of the rural Asian populations, for which most of the epidemiological data are available. In contrast, the data for skin lesions are from larger populations and show a high degree of consistency between studies. Arsenic exposure is considered to be a necessary but not sufficient cause of dermal lesions and given that the observations of dermal lesions mainly originate from rural Asian communities with high levels of arsenic in the water, it is possible that the findings were influenced by other factors such as nutritional status. The CONTAM Panel therefore concluded that the overall range of BMDL01 values of 0.3 to 8 μg/kg b.w. per day should be used instead of a single reference point in the risk characterisation for inorganic arsenic.
The CONTAM Panel noted that inorganic arsenic is not directly DNA-reactive and there are a number of proposed mechanisms of carcinogenicity such as oxidative damage, epigenetic effects and interference with DNA damage repair, for each of which a threshold mechanism could be postulated. However, taking into account the uncertainty with respect to the shape of the dose-response relationships, it was not considered appropriate to identify from the human data a dose of inorganic arsenic with no appreciable health risk, i.e. a tolerable daily or weekly intake. Therefore an assessment should be made of the margins of exposure (MOEs) between the identified reference points from the human data and the estimated dietary exposure to inorganic arsenic in the EU population.
The estimated dietary exposures to inorganic arsenic for average and high level consumers in Europe are within the range of the BMDL01 values identified by the CONTAM Panel, and therefore there is little or no MOE and the possibility of a risk to some consumers cannot be excluded. Consumer groups with higher exposure levels include high consumers of rice, such as certain ethnic groups, and high consumers of algae-based products. The estimated dietary exposures of these groups are also within the range of the BMDL01 values. Infants below 6 months of age fed on only breast-milk, or on cows’ milk formula reconstituted with water containing arsenic at the average European concentration, have the lowest estimated dietary exposure to inorganic arsenic. The estimated dietary exposures of children are higher than those of adults, due to their greater food consumption relative to their body weight. However, this does not necessarily indicate that children are at greater risk because the effects are due to long term exposure and the exposure estimates are also within the range of BMDL01 values.
Of the organic forms of arsenic, arsenobetaine, which is the major form in fish and most seafood, is widely assumed to be of no toxicological concern. Arsenosugars and arsenolipids are mainly metabolised in humans to dimethylarsinate, but no specific information is available regarding their toxicity. For other organoarsenic compounds no human toxicity data are available. Because of the lack of data, arsenosugars, arsenolipids, methylarsonate and dimethylarsinate could not be considered in the risk characterisation.
The CONTAM Panel recommended that dietary exposure to inorganic arsenic should be reduced. In order to refine risk assessment of inorganic arsenic there is a need to produce speciation data for different food commodities to support dietary exposure assessment and dose-response data for the possible health effects.
Arsenic in Food
5 EFSA Journal 2009; 7(10):1351
TABLE OF CONTENTS Abstract .................................................................................................................................................... 1 Summary .................................................................................................................................................. 2 Table of contents ...................................................................................................................................... 5 Background as provided by the European Commission ........................................................................... 8 Terms of reference as provided by the European Commission ................................................................ 8 Assessment ............................................................................................................................................. 10 1. Introduction ................................................................................................................................... 10
1.1. Chemistry of arsenic relevant to its presence in foods .......................................................... 10 1.2. Arsenic species in food ......................................................................................................... 13
1.2.1. Inorganic arsenic species .................................................................................................. 13 1.2.2. Organic arsenic species..................................................................................................... 13
1.2.2.1. Arsenobetaine .......................................................................................................... 13 1.2.2.2. Arsenosugars ............................................................................................................ 14 1.2.2.3. Arsenolipids ............................................................................................................. 14 1.2.2.4. Other organoarsenic species .................................................................................... 14
1.3. Earlier evaluations ................................................................................................................ 15 2. Legislation ..................................................................................................................................... 17 3. Methods of analysis ....................................................................................................................... 19
3.1. Sample collection and storage ............................................................................................... 19 3.2. Methods of analysis for determining total arsenic content of foods ..................................... 19
3.2.1. Sample preparation for total arsenic measurements in food ............................................. 20 3.2.1.1. Mineralisation .......................................................................................................... 20 3.2.1.2. Hydride generation (vapour generation) .................................................................. 20
3.2.2. Instrumental techniques for total arsenic measurements in food ...................................... 21 3.2.2.1. Atomic absorption spectrometry (AAS) .................................................................. 21 3.2.2.2. Hydride generation atomic fluorescence spectrometry (AFS) ................................. 21 3.2.2.3. Inductively coupled plasma atomic emission spectrometry (ICPAES) ................... 21 3.2.2.4. Inductively coupled plasma mass spectrometry (ICPMS) ....................................... 22 3.2.2.5. Instrumental techniques – concluding comments .................................................... 22
3.3. Methods of analysis for determining arsenic species in foods .............................................. 23 3.3.1. Separation of inorganic arsenic from organic arsenic species .......................................... 23 3.3.2. Chromatography coupled with on-line selective detection of arsenic .............................. 23
3.3.2.1. Sample extraction ..................................................................................................... 23 3.3.2.2. Chromatographic separation .................................................................................... 24 3.3.2.3. Detection and quantification of arsenic species ....................................................... 24
3.4. Analytical quality control for arsenic measurements in food ............................................... 25 3.4.1. Total arsenic ..................................................................................................................... 25 3.4.2. Arsenic species ................................................................................................................. 25
4. Sources, use and environmental fate ............................................................................................. 26 4.1. Soil ........................................................................................................................................ 28 4.2. Water ..................................................................................................................................... 28 4.3. Air ......................................................................................................................................... 29 4.4. Wastes ................................................................................................................................... 29 4.5. Transfer in the environment and bioaccumulation ................................................................ 30
5. Occurrence of arsenic in food ........................................................................................................ 31 5.1. Previously reported occurrence results ................................................................................. 31
5.1.1. Human breast milk ............................................................................................................ 33 5.2. Current occurrence of arsenic in food: first call for data ...................................................... 33
5.2.1. Summary of data collected ............................................................................................... 34 5.2.2. Distribution of samples across food categories ................................................................ 35 5.2.3. Analytical methods used ................................................................................................... 37 5.2.4. Occurrence data by food category .................................................................................... 40

Arsenic in Food
6 EFSA Journal 2009; 7(10):1351
5.2.5. Summary of occurrence .................................................................................................... 52 5.3. Current occurrence of arsenic in food: second call for data .................................................. 54 5.4. Food preparation ................................................................................................................... 54 5.5. Inorganic and total arsenic ratios in food and possible conversion factors ........................... 56
6. Food consumption ......................................................................................................................... 58 6.1. EFSA’s Concise European Food Consumption Database .................................................... 58 6.2. Food consumption data for different age and consumer groups ........................................... 59
6.2.1. Food consumption for vegetarians ................................................................................... 59 7. Human exposure assessment ......................................................................................................... 60
7.1. Previously reported human exposure assessments ................................................................ 60 7.2. Mean and high dietary exposure to total arsenic ................................................................... 61
7.2.1. Contributions of different food groups to total arsenic exposure ..................................... 62 7.3. Mean and high dietary exposure of inorganic arsenic .......................................................... 64
7.3.1. Contributions of different food groups to inorganic arsenic exposure ............................. 66 7.3.2. Dietary exposure to arsenic for specific groups ............................................................... 67
7.3.2.1. Infants ...................................................................................................................... 67 7.3.2.2. Children (0.5-14 years old) ...................................................................................... 68 7.3.2.3. Comparison of exposure in Italian children versus adults ....................................... 71
7.3.3. Vegetarian exposure ......................................................................................................... 72 7.4. Dietary exposure to arsenic for high consumers ................................................................... 73
7.4.1. People following specific diets ......................................................................................... 73 7.5. Estimates of non-dietary exposure to arsenic ....................................................................... 75
7.5.1. Ambient air ....................................................................................................................... 75 7.5.2. Smoking ............................................................................................................................ 75 7.5.3. Soil .................................................................................................................................... 75
7.6. Importance of dietary and non-dietary sources of human exposure to inorganic arsenic ..... 76 8. Hazard identification and characterisation .................................................................................... 77
8.1. Toxicokinetics ....................................................................................................................... 77 8.1.1. Absorption ........................................................................................................................ 77 8.1.2. Distribution ....................................................................................................................... 78 8.1.3. Metabolism ....................................................................................................................... 80 8.1.4. Excretion ........................................................................................................................... 81 8.1.5. Physiologically based pharmacokinetic (PBPK) models .................................................. 83
8.2. Toxicity in experimental animals .......................................................................................... 83 8.2.1. Acute and short term toxicity ........................................................................................... 83
8.2.1.1. Inorganic arsenic ...................................................................................................... 83 8.2.1.2. Organic arsenic ........................................................................................................ 84
8.2.2. Repeat dose toxicity.......................................................................................................... 84 8.2.2.1. Inorganic arsenic ...................................................................................................... 84 8.2.2.2. Organic arsenic ........................................................................................................ 85
8.2.3. Immunotoxicity ................................................................................................................ 85 8.2.3.1. Inorganic arsenic ...................................................................................................... 85 8.2.3.2. Organic arsenic ........................................................................................................ 85
8.2.4. Developmental and reproductive toxicity ......................................................................... 86 8.2.4.1. Inorganic arsenic ...................................................................................................... 86 8.2.4.2. Organic arsenic ........................................................................................................ 86
8.2.5. Neurotoxicity of arsenic ................................................................................................... 87 8.2.5.1. Inorganic arsenic ...................................................................................................... 87 8.2.5.2. Organic arsenic ........................................................................................................ 88
8.2.6. Carcinogenicity ................................................................................................................. 88 8.2.6.1. Inorganic arsenic ...................................................................................................... 88 8.2.6.2. Organic arsenic ........................................................................................................ 89
8.2.7. Molecular mechanisms ..................................................................................................... 89 8.2.7.1. Induction of genetic damage .................................................................................... 89

Arsenic in Food
7 EFSA Journal 2009; 7(10):1351
8.2.7.2. Epigenetic mechanisms and indirect mechanisms ................................................... 91 8.2.7.3. Involvement of reactive oxygen species (ROS) and reactive nitrogen species (RNS) in arsenic response .................................................................................................................... 92 8.2.7.4. Interference with DNA damage response pathways ................................................ 94 8.2.7.5. Effects on cancer related gene proteins .................................................................... 95 8.2.7.6. Potential mechanisms of arsenic-induced neurotoxicity .......................................... 96 8.2.7.7. Interaction of arsenic with other elements ............................................................... 97
8.3. Observations in humans ........................................................................................................ 98 8.3.1. Biomarkers ........................................................................................................................ 98
8.3.1.1. Biomarkers of exposure ........................................................................................... 98 8.3.1.2. Biomarkers of effect .............................................................................................. 100
8.3.2. Short term effects ............................................................................................................ 100 8.3.2.1. Inorganic arsenic .................................................................................................... 100 8.3.2.2. Organic arsenic ...................................................................................................... 101
8.3.3. Chronic effects ................................................................................................................ 101 8.3.3.1. Cancer .................................................................................................................... 101 8.3.3.2. Skin lesions ............................................................................................................ 111 8.3.3.3. Developmental toxicity .......................................................................................... 115 8.3.3.4. Neurotoxicity ......................................................................................................... 127 8.3.3.5. Cardiovascular diseases ......................................................................................... 128 8.3.3.6. Abnormal glucose metabolism and diabetes .......................................................... 129 8.3.3.7. Other effects ........................................................................................................... 130
8.3.4. Susceptible populations .................................................................................................. 131 8.3.4.1. Life stage ................................................................................................................ 131 8.3.4.2. Sex differences ....................................................................................................... 131 8.3.4.3. Nutritional status .................................................................................................... 132 8.3.4.4. Genetic polymorphisms ......................................................................................... 132
8.4. Dose response assessment ................................................................................................... 133 8.4.1. Inorganic arsenic ............................................................................................................. 133
8.4.1.1. Estimated dietary exposure for the study populations ........................................... 134 8.4.1.2. Skin lesions (Table 36) .......................................................................................... 135 8.4.1.3. Skin cancer (Table 33) ........................................................................................... 138 8.4.1.4. Urinary bladder cancer (Table 34) ......................................................................... 139 8.4.1.5. Lung cancer (Table 35) .......................................................................................... 139 8.4.1.6. Selection of critical reference point ....................................................................... 139
8.4.2. Organic arsenic ............................................................................................................... 141 9. Risk characterisation .................................................................................................................... 142 10. Uncertainty analysis ................................................................................................................ 142
10.1. Assessment objectives ......................................................................................................... 142 10.2. Exposure scenario ............................................................................................................... 143 10.3. Exposure model .................................................................................................................. 143 10.4. Model input (parameters) .................................................................................................... 143 10.5. Summary of uncertainties ................................................................................................... 144
Conclusions and recommendations ...................................................................................................... 145 References ............................................................................................................................................ 149 Appendix .............................................................................................................................................. 186 Abbreviations ....................................................................................................................................... 194

Arsenic in Food
8 EFSA Journal 2009; 7(10):1351
BACKGROUND AS PROVIDED BY THE EUROPEAN COMMISSION Arsenic occurs naturally in the environment and is present in soil, ground water and plants. Arsenic occurs in a broad variety of arsenic compounds, of which inorganic arsenic is the most toxic form.
Inorganic arsenic has been classified by the International Agency for Research on Cancer (IARC, 1987) in group 1 as carcinogenic to humans. This was based on the induction of primary skin cancer, as well as the induction of lung and urinary bladder cancer. The Joint FAO/WHO Expert Committee on Food Additives (JECFA) has established a Provisional Tolerable Weekly Intake (PTWI) for inorganic arsenic of 0.015 mg/kg bodyweight/week in 1988.
In 2004 the European Commission carried out an exposure assessment with the data collected in the framework of SCOOP6 task 3.2.11. In this study it was concluded that on the basis of the available data from Member States, fish and other seafood products are the main source of arsenic in the diet of the mean adult population. However, the SCOOP study, as well as many other surveys on arsenic, focussed on total arsenic as methods for discrimination between inorganic and organic forms of arsenic were not yet widely available. In fish and seafood it is known, that arsenic is present mainly in its less toxic organic forms.
More recently, methods for determination of inorganic arsenic have become available. Apart from drinking water, which is well known to significantly contribute to inorganic arsenic exposure, some studies suggest that rice and rice-based products could also contribute significantly to inorganic arsenic exposure. Other possible contributors to inorganic arsenic exposure identified were fish and seafood, cereals, root vegetables, seaweed, food supplements, mushrooms and tea. As rice-based products are often used in weaning foods for infants, exposure of infants to arsenic is of great importance and should be assessed.
On the basis of the requested scientific opinion on arsenic, the Commission will consider whether risk management measures with regard to arsenic in foodstuffs are necessary. Currently, no maximum levels have been set in Regulation (EC) No. 1881/2006 of 19 December 2006 setting maximum levels for certain contaminants in foodstuffs7.
TERMS OF REFERENCE AS PROVIDED BY THE EUROPEAN COMMISSION In accordance with Article 29 (1) (a) of Regulation (EC) No 178/2002 the European Commission asks the European Food Safety Authority for a scientific opinion on the risks to human health related to the presence of arsenic in foodstuffs (incl. drinking water).
In particular, the opinion should
• consider any new scientific information regarding the toxicity of arsenic (inorganic and organic forms) and assess whether the JECFA PTWI of 0.015 mg/kg bodyweight/week for inorganic arsenic is still appropriate,
• assess the typical ratios between inorganic and organic arsenic forms in different groups of foodstuffs,
• assess the contribution of different foodstuffs to human exposure for total arsenic and inorganic arsenic. This should include the contribution from drinking water. An indication of
6 SCOOP Report of task 3.2.11: "Assessment of the dietary exposure to arsenic, cadmium, lead and mercury of the
population of the EU Member States", March 2004, <http://ec.europa.eu/food/food/chemicalsafety/contaminants/scoop_3-2-11_heavy_metals_report_en.pdf>. The SCOOP task was carried out in the framework of scientific cooperation with Member States under Council Directive 93/5/EEC, Official Journal L 52, 4.3.1993, p.18-21.
7 Official Journal L 364, 20.12.2006, p. 5.

Arsenic in Food
9 EFSA Journal 2009; 7(10):1351
the importance of non-dietary sources of exposure (e.g. air, cigarette smoke) should also be given.
In the exposure assessment,
• the situation for specific groups of the population (e.g. high consumers, infants and children, people following specific diets, etc.) should be considered and an indication of the age group in which children would be most exposed to arsenic should be given,
• available biomonitoring data should be taken into account and the results be compared with the calculated exposure.

Arsenic in Food
10 EFSA Journal 2009; 7(10):1351
ASSESSMENT
1. Introduction
Arsenic is a metalloid that occurs in different inorganic and organic forms, of which the inorganic forms are more toxic as compared to the organic arsenic occurring in food. However, so far most of the occurrence data in food collected in the framework of official food control are still reported as total arsenic without differentiating the various arsenic species. The need for speciation data is evident because especially in seafood most of the arsenic is present as organic arsenic and thus is in the less toxic form. Consequently, a risk assessment not taking into account the different species but considering the total arsenic as being present exclusively as inorganic arsenic would lead to a considerable overestimation of the health risk related to dietary arsenic exposure. The European Food Safety Authority (EFSA) Panel on Contaminants in the Food Chain (CONTAM Panel) reviewed the occurrence data submitted by 15 European countries as well as the toxicological and epidemiological data that have been reported since the last evaluation by the Joint FAO/WHO Expert Committee on Food Additives (JECFA) (FAO/WHO, 1989). As representative speciation data are scarce, the CONTAM Panel was not able to assess the typical ratios between inorganic and organic arsenic in different groups of foodstuffs. Furthermore, it had to make a number of assumptions especially for the estimation of the contribution of inorganic arsenic to total arsenic in the exposure assessment based on the occurrence data submitted by the reporting countries as well as on key literature data. The same holds true for the interpretation of the available epidemiological studies which mainly relate to arsenic in drinking water or, in some instances, to biomarkers of exposure, and the dietary exposure to inorganic arsenic was not measured. Thus it was necessary to make certain assumptions about the total dietary exposure of the populations in which the respective health endpoints were studied. The following opinion describes the resulting risk assessment of inorganic arsenic including derivations of benchmark doses for various relevant endpoints and resulting margins of exposure (MOEs).
When detailed data on the different arsenic species are not provided, the generic term “arsenic” is used for “total arsenic” throughout this opinion.
1.1. Chemistry of arsenic relevant to its presence in foods
Arsenic is described as a metalloid because it displays properties intermediate of those typical for metals and non-metals. It occurs in group 15 of the Periodic table along with nitrogen and phosphorus, and, consequently, the chemistry of arsenic is similar in many respects to that of these two essential elements. These chemical similarities may be the reason that arsenic occurs at high levels in many marine organisms, and hence in many seafoods (Francesconi and Edmonds, 1997). For example, the inorganic ion arsenate occurs in seawater together with the structurally similar phosphate. Marine algae appear unable to distinguish between these two oxoanions; in their efforts to take up essential phosphate they inadvertently take up the potentially toxic arsenate. The process of detoxification begins by methylation leading to methylated organoarsenic compounds (see Figure 13). Arsenobetaine is structurally similar to glycine betaine [(CH3)3N+CH2COO-], a nitrogen betaine which is used as an osmolyte by aquatic organisms to maintain osmotic balance under conditions of changing salinity, i.e. when ambient salinity is high, an organism’s glycine betaine level is high. The coincidental structural similarity between arsenobetaine and glycine betaine might explain why arsenobetaine levels are much higher in marine animals than they are in freshwater animals.
Although arsenic forms species under reducing conditions with the arsenic atom in oxidation state -3 and +3, the most stable arsenic species found under normal environmental conditions contain the arsenic atom in oxidation state +5. Consequently, the vast majority of arsenic species found in organisms and in foods also contain arsenic in oxidation state +5 (e.g. arsenate, dimethylarsinate, arsenobetaine, arsenosugars). Table 1 summarises the major arsenic species found in foods, and some relevant human metabolites.

Arsenic in Food
11 EFSA Journal 2009; 7(10):1351
Table 1: Names, abbreviations, and chemical structures for arsenic species referred to in this report
Name Abbreviation Chemical structure(a) Relevance/comment Inorganic arsenic iAs Sum of As(III) and As(V). Arsenite As(III) As(O-)3 Trace to low levels in most foods; highly toxic. Arsenate As(V) O=As(O-)3 Trace to low levels in most foods; a major form in
water; highly toxic. Arsenobetaine AB (CH3)3As+CH2COO- Major arsenic species in most seafoods; non-toxic. Arsenosugars(b)
OAsO
CH3
CH3
OR
OH OH
Major (edible algae) or significant (molluscs) arsenic species in many seafoods.
Arsenolipids(c) e.g.
As
CH3
CH3
O OH
O
Newly discovered arsenic species present in fish oils and fatty fish; likely to be present in other seafoods as well.
Trimethylarsonio propionate
TMAP (CH3)3As+CH2CH2COO- Minor arsenic species present in most seafoods.
Methylarsonate MA CH3AsO(O-)2 Trace arsenic species of some seafoods and terrestrial foods; a significant human urine metabolite of iAs.
Methylarsonite MA(III) CH3As(O-)2 Not usually detected in foods; detected in some human urine samples as a metabolite of iAs; a toxic species thought to be important for arsenic’s mode of toxic action.
Dimethylarsinate DMA (CH3)2AsO(O-) Minor arsenic species in seafoods and some terrestrial foods; the major human urine metabolite of iAs, arsenosugars and arsenolipids.
Thio-dimethylarsinate Thio-DMA (CH3)2AsS(O-) A minor human urine metabolite of inorganic arsenic and arsenosugars.

Arsenic in Food
12 EFSA Journal 2009; 7(10):1351
Table 1: Continued
Name Abbreviation Chemical structure(a) Relevance/comment Dimethylarsinite DMA(III) (CH3)2AsO- Not detected in foods; detected in some human urine
samples as a metabolite of iAs; a very unstable (reactive) species that is very difficult to measure; highly toxic species considered by some researchers to be central to arsenic’s mode of toxic action.
Trimethylarsine oxide TMAO (CH3)3AsO Minor arsenic species common in seafood. Tetramethylarsonium ion
TETRA (CH3)4As+ Minor arsenic species common in seafood.
Arsenocholine AC (CH3)3As+CH2CH2OH Trace arsenic species found in seafood; is readily oxidised to arsenobetaine in biological systems.
Roxarsone NO2
HO As
O
OH
OH
Used in the United States of America as a poultry feed additive to enhance growth; banned in Europe; not usually detected in food.
Arsanilic acid
NH2 As
O
OH
OH
Previously used as a drug and as an animal food additive; also used as its sodium salt (atoxyl).
(a): The simpler arsenic species are also often referred to in their protonated forms such as As(III) arsenous acid, H3AsO3; As(V) arsenic acid, H3AsO4; MA methylarsonic acid, CH3AsO(OH)2; DMA dimethylarsinic acid (CH3)2AsO(OH); MA(III) methylarsonous acid CH3As(OH)2; DMA(III) dimethylarsinous acid (CH3)2AsOH.
(b): Over 20 arsenosugars have been reported as natural products; they differ by having different R groups on the aglycone portion of the molecule, and by replacing the oxygen on the arsenic atom with either a sulfur atom or a third methyl group (see Francesconi and Edmonds (1997)). Most of the arsenic present as arsenosugars, however, is contained in just four compounds based on the structure drawn above and with (i) R=CH2CHOHCH2OH;
(ii) R=CH2CHOHCH2OP(O)(OH)OCH2CHOHCH2OH; (iii) R=CH2CHOHCH2OSO3H; and (iv) R=CH2CHOHCH2SO3H (c): Nine arsenolipids have been reported so far (2009) as natural products, all of which contain the dimethylarsinoyl group [(CH3)2As(0)-] bound to either one of several
long chain fatty acids, or to long chain hydrocarbons. Many more arsenolipids are present in foods – their structures are currently unknown.

Arsenic in food
13 EFSA Journal 2009; 7(10):1351
1.2. Arsenic species in food
Most data reported for arsenic in food describe the content of total arsenic, i.e. the sum of all arsenic species. The total arsenic analyses providing these data can be readily performed in analytical laboratories equipped for trace element determinations. Analyses that provide information about the type of arsenic (i.e. arsenic species) are much more difficult to perform, and relatively few laboratories are able to provide these data. Such data, however, are becoming increasingly important because different foods can contain different types of arsenic species, and because these species have very different toxicities.
1.2.1. Inorganic arsenic species
Inorganic arsenic in the environment comprises species mainly in the +3 or +5 oxidation state, present as thio complexes or, primarily, as the oxoanions arsenite and arsenate. The analytes (i.e. the species that are actually measured) are usually arsenite and arsenate, and hence data are often recorded as these two species. Similarly, in food samples inorganic arsenic is often reported as arsenite and arsenate even though it is likely bound to thio groups in peptides or proteins in the food itself.
Because food products of terrestrial origin generally contain low concentrations of total arsenic their inorganic arsenic content is also low. Rice, however, appears to be an exception because it contains significant amounts of inorganic arsenic with concentrations often between 0.1 to 0.4 mg arsenic/kg dry mass and sometimes considerably higher (Sun et al., 2008; Meharg et al., 2009). Although fish and other seafood have a high total arsenic content (typically 2-60 mg arsenic/kg dry mass, SCOOP, 2004; Julshamn et al., 2004), their levels of inorganic arsenic are typically <0.2 mg arsenic/kg dry mass (Edmonds and Francesconi, 1993; Sloth et al., 2005; Sirot et al., 2009). There are, however, some notable exceptions. For example, the edible marine alga hijiki (Hizikia fusiforme, also called hiziki), can contain inorganic arsenic (present as arsenate) at concentrations of >60 mg/kg (FSA, 2004), and blue mussel (Mytilus edulis) has shown inorganic arsenic concentrations up to 30 mg/kg dry mass (Sloth and Julshamn, 2008). The arsenic content of various food items in Europe is discussed in detail in Chapter 5.
Concentrations of arsenic in groundwater, major sources of drinking water in many parts of the world, are usually less than 10 µg/L but they can reach 5000 µg/L in some areas (Smedley and Kinniburgh, 2002). Surface waters are also used for drinking water, but they generally contain lower arsenic concentrations than do groundwaters. Essentially all the arsenic in drinking water is present as inorganic arsenic. In oxygenated conditions, such as found in most surface waters, the arsenic is present mainly as arsenate. In some groundwaters, however, arsenite can be the dominant species under certain reducing environmental conditions (Postma et al., 2007).
1.2.2. Organic arsenic species
Since the discovery of arsenobetaine in lobster in 1977, over 50 organoarsenic compounds have been reported in marine organisms, many of which are used as food items. Most of these compounds, however, are not commonly reported, or they occur at trace levels only. The following description of organoarsenic compounds will focus on the major compounds found in foods and their significant metabolic products.
1.2.2.1. Arsenobetaine
Arsenobetaine is the major form of arsenic in marine fish and most other seafoods. Arsenobetaine has also been found in some terrestrial foods, in particular in some mushroom species, although generally as a minor compound (Francesconi and Kuehnelt, 2002). More recently, it was shown that

Arsenic in food
14 EFSA Journal 2009; 7(10):1351
arsenobetaine also occurs in marine algae (Nischwitz and Pergantis, 2005); the concentrations are generally low making it difficult to measure in the presence of arsenosugars, the dominant arsenic species in algae. Arsenobetaine has not yet been detected in seawater although it is likely present at trace levels. There have also been several reports of arsenobetaine in freshwater organisms (Slejkovec et al., 2004; Schaeffer et al., 2006), although the levels are generally low (<0.1 mg arsenic/kg dry mass), much lower than those found in marine samples. Farmed freshwater fish (aquaculture products) can contain arsenobetaine at higher concentrations because they are provided with feed containing marine ingredients (Soeroes et al., 2005). The reason for the observed differences in arsenobetaine content between marine and freshwater organisms is still not known although cumulative evidence suggests that it is related to salinity and that arsenobetaine may be serving as an adventitiously acquired osmolyte (Larsen and Francesconi, 2003; Clowes and Francesconi, 2004).
1.2.2.2. Arsenosugars
Arsenosugars are usually the major arsenical constituents of marine algae (typically 2-50 mg arsenic/kg dry mass), and they also are found at significant concentrations in animals feeding on algae (e.g. mussels and oysters; typically 0.5-5 mg/kg dry mass) (Francesconi and Kuehnelt, 2002). They occur in many other marine organisms as well, albeit at lower concentrations. In terrestrial organisms, arsenosugars occur generally at trace levels only, although interesting exceptions have been reported (Geiszinger et al., 1998). More than 20 naturally occurring arsenosugars have been identified, most of which are dimethylarsinoylribosides. However, most of the arsenic bound as arsenosugars is associated with just four compounds, as described in Table 1. Available evidence indicates that these compounds are formed from arsenate, taken up by algae from seawater, in a process that involves S-adenosylmethionine as both the donor of the methyl groups and of the ribosyl (sugar) group (Francesconi and Edmonds, 1997).
1.2.2.3. Arsenolipids
The term lipids is a broad term encompassing all fat-soluble naturally occurring compounds; those lipids that contain arsenic are referred to as arsenolipids. Although the presence of fat-soluble arsenic compounds in fish was first reported in the late 1960s, the structures of some of these arsenolipids have only recently been elucidated. Thus, in 2008 cod liver oil was shown to contain six arsenic-containing fatty acids (Rumpler et al., 2008), and oil from the fish capelin was reported to contain three arsenic-containing hydrocarbons (Taleshi et al., 2008). Many other fat-soluble arsenic compounds were present in these two samples, the structures of which are currently unknown. It seems most likely that arsenolipids also occur in many other fish species (particularly fatty fish such as tuna and mackerel), and in other foods as well, although quantitative data have not yet been reported. In the fish oils examined so far, the arsenolipid content varied between about 4-12 mg arsenic/kg of oil (Schmeisser et al., 2005; Taleshi et al., 2008), which might suggest that the arsenolipid content of edible fatty fish (fish fillets) would generally be somewhat less than 2 mg arsenic/kg dry mass.
1.2.2.4. Other organoarsenic species
Trimethylarsoniopropionate, a compound similar to arsenobetaine, was first identified in 2000 in a fish species (Francesconi et al., 2000), and is now known to be a common minor constituent of marine organisms (typically at concentrations of 0.2-2 mg arsenic/kg dry mass; Kirby et al., 2002). Arsenocholine also occurs commonly, but generally at modest levels in marine organisms (typically <0.2 mg arsenic/kg dry mass). Laboratory experiments have shown that arsenocholine can be rapidly biotransformed to arsenobetaine in fish (Francesconi et al., 1989).
The simple methylated arsenic species (i.e. those without other alkyl substituents), namely methylarsonate, dimethylarsinate, trimethylarsine oxide, and tetramethylarsonium ion are also often found in organisms (and hence in foods) but generally at low concentrations (<0.5 mg arsenic/kg dry

Arsenic in food
15 EFSA Journal 2009; 7(10):1351
mass) (Francesconi and Kuehnelt, 2002). Methylarsonate and dimethylarsinate are also important human metabolites of ingested arsenic species (see Chapter 8).
1.3. Earlier evaluations
The JECFA (FAO/WHO, 1983) derived a provisional maximum tolerable daily intake of 2 µg/kg body weight (b.w.) for ingested inorganic arsenic based on the dose-response data for arsenic toxicity from a study on a small number of Nova Scotians using arsenic-contaminated well water (Grantham and Jones, 1977), as described further in Section 8.4.1. The JECFA also concluded that health effects are most likely to occur through exposure to arsenic from drinking water. JECFA considered arsenic again at its 33rd meeting (FAO/WHO, 1989), and confirmed its earlier evaluation by establishing a provisional tolerable weekly intake (PTWI) of 15 µg/kg b.w. It was noted at the 33rd meeting that the organic forms of arsenic present in seafoods needed different consideration from the inorganic arsenic in water. Based on the low toxicity and rapid metabolism of organoarsenicals, and taking into account the nutritious value of fish despite the presence of organoarsenicals, there was no recommendation to restrict the consumption of fish.
The United States Environmental Protection Agency (US EPA) (1998, 2001a) derived no observed adverse effect levels (NOAELs) for inorganic arsenic from a number of drinking-water studies. The US EPA gave most weight to the Tseng study (Tseng et al., 1968; Tseng, 1977) in view of the large study population and the dose-related incidence of skin lesions. The NOAEL was derived from an estimation of the exposure of the portion of the study population that did not develop skin lesions. “Their drinking water contained arsenic concentrations of 1-17 µg/L. The mid-point of this range (9 µg/L) was taken as the NOAEL.” Assumptions were made regarding inorganic arsenic in food, consumption of water and body weight to derive a NOAEL of 0.8 μg/kg b.w. per day. An uncertainty factor of 3 was then applied “to account for both the lack of data to preclude reproductive toxicity as a critical effect and to account for some uncertainty in whether the NOAEL of the critical study accounts for all sensitive individuals”. The reference dose (RfD) was therefore 0.3 µg/kg b.w. per day. The US EPA expressed “medium confidence” in this RfD and the study on which it was based.
Based on the Taiwan drinking-water studies (Tseng et al., 1968; Tseng, 1977), the US EPA also estimated the lifetime risk of developing skin cancer from a lifetime mean daily intake of 1 µg (that is, unit risk for oral exposure) to be about 3 × 10⁻⁵ (assuming a body weight of 60 kg, and rounded from 2.5 × 10⁻⁵).
The World Health Organization (WHO) has had a stated position on the health risks of arsenic in drinking-water since 1958. Successive editions of International standards for drinking-water (1958, 1963, and 1971) and Guidelines for drinking-water quality (1984, 1993 and 2004) have published reviews of the data which have led to a progressive lowering of the standard or guideline value in response to emerging evidence of significant health concerns. The current WHO guideline value for arsenic in drinking-water is of 10 µg/L, but it is designated as provisional in view of scientific uncertainties. In particular it is recognised that, although there is a substantial database on the association between both internal and skin cancers and the consumption of arsenic in drinking-water, there remains considerable uncertainty over the actual risks at low concentrations, and available data on mode of action do not provide a biological basis for using either linear or non-linear extrapolation. Moreover, the WHO states that 10 µg/L guideline was also based on practical considerations (limit of detection (LOD) and feasibility/cost of arsenic removal). By using a linear extrapolation, it is estimated that for United States (US) populations exposed to 10 μg/L of arsenic in drinking-water the lifetime excess bladder and lung cancer risk is, respectively, 12 and 18 × 10−4 for females and 23 and 14 × 10−4 for males. On the basis of the WHO provisional water guideline value for inorganic arsenic, the consumption of 2 L of water daily by a 70 kg adult would correspond to approximately 0.3 µg/kg b.w. per day. This value is the same as that derived by both the US EPA and the Agency for Toxic Substances and Disease Registry (ATSDR).

Arsenic in food
16 EFSA Journal 2009; 7(10):1351
In 1991 the National Institute of Public Health and the Environment of the Netherlands (RIVM) derived a total daily intake (TDI) of 2.1 µg/kg b.w. per day based on the conclusion by JECFA that marginal effects in humans at this dose level can not be totally excluded (Vermeire et al., 1991). In 2001 the RIVM followed the recommendations of the Health Council of the Netherlands (1993) to derive an oral TDI for inorganic arsenic and applied an additional uncertainty factor of 2 (due to the use of epidemiological data) to this value (Baars et al., 2001). This resulted in an oral TDI of 1 μg/kg b.w. per day. This TDI was proposed for both the trivalent and pentavalent arsenic because they could not be discriminated on the basis of human data.
The National Research Council (NRC) has reviewed studies on the health effects of arsenic in its evaluations of the recommendations of the US EPA (NRC, 1999; NRC, 2001). The Committee estimated ED01 (i.e. 1 % effective dose, which according to NRC is the concentration of arsenic in drinking water that is associated with a 1 % increase in the excess risk, or in other words, the exposure dose at which there is a 1 % increased response in the study population) for various studies using different statistical models. The data from southwestern Taiwan (Chen et al., 1985, 1992; Wu et al., 1989) were selected for use in the quantitative risk assessment. A Chilean study by Ferreccio et al. (2000) was used as support. Under different modelling approaches, the ED01 values for lung cancer estimated for the southwestern Taiwanese study ranged from 33 to 94 μg/L and for the Chilean population from 5 to 27 μg/L (NRC, 2001). For bladder cancer, the ED01 values for the southwestern Taiwanese study ranged from 102 to 443 μg/L based on a 1 % increase relative to the background cancer mortality in US (NRC, 2001), whilst the previous estimations, in which the reference was the background cancer mortality in Taiwan, were 404 to 450 μg/L (NRC, 1999). The estimations of the lifetime excess cancer risks for bladder and lung cancers combined at arsenic concentrations in the drinking water between 3 and 20 µg/L were between 9 and 72 per 10,000 people based on US background cancer incidence data (NRC, 2001).
In 2005, the US EPA refined its risk assessments of inorganic arsenic for lung and bladder cancer based on the Taiwanese data, and noted that skin cancer may be influenced by external exposure through bathing. ED01 values for inorganic arsenic in drinking water were estimated at 79-96 μg/L for lung cancer risk, and at 304-474 μg/L for bladder cancer risk (US EPA, 2005a). Also in 2005, the US EPA made recommendations for dose response extrapolation for dimethylarsinate. Given the lack of human data, the rat bladder tumour data were used to estimate cancer risk. A non-linear approach was adopted with the rate limiting step considered to be cell proliferation for which a benchmark dose lower confidence limit (BMDL01) of 70 µg dimethylarsinate/kg b.w. per day was calculated and uncertainty factors proposed for establishment of a reference dose (US EPA, 2005b). The US EPA Science Advisory Board (US EPA SAB, 2007) was asked to review and comment on these EPA assessments. Given the considerable uncertainties regarding low dose extrapolation, the US EPA SAB Panel supported the use of a linear cancer risk model for inorganic arsenic, and the use of the epidemiological data on the Taiwanese population for estimating human cancer risk. However, the US EPA SAB Panel recognised limitations to these data and asked the EPA to consider other epidemiological studies, and recommended that sensitivity analyses be conducted. The US EPA SAB Panel also agreed with the use of a non-linear approach to the bladder tumour data from dimethylarsinate rat bioassays, but noted that significant uncertainties were associated with the use of animal data for assessing human cancer risk from dimethylarsinate, due to the observed metabolic differences between rats and humans.
Health Canada (Health Canada, 2006) reviewed the health risks associated with inorganic arsenic in drinking water. A guideline for arsenic in drinking water was established at 0.010 mg/L based on achievability by treatment. The unit risks associated with ingestion of 1 μg/L of arsenic in drinking water were estimated to range from 3.06 × 10⁻⁶ (liver cancer unit risk) to 3.85 × 10⁻⁵ (lung cancer unit risk) with 95 % upper bounds ranging from 6.49 × 10⁻⁶to 4.64 × 10⁻⁵. On the basis of the 95 % upper-bound value, an acceptable concentration of arsenic in drinking water was established considering that it would present an “essentially negligible” level of risk (i.e. 10-5 to 10-6). This target concentration, which is based solely on health considerations, was calculated as 0.3 μg/L.

Arsenic in food
17 EFSA Journal 2009; 7(10):1351
EFSA (2005) was asked by the European Commission (EC) to evaluate the potential adverse effects of arsenic to animal (and human) health as an undesirable substance in animal feed. Data from the seafood and fish, which are the major sources of arsenic in animal feed materials, did not indicate arsenic levels of concern. As the carry-over of arsenic in its inorganic form into edible tissue of mammals and poultry is low, EFSA concluded: “food derived from terrestrial animals contributes only insignificantly to human exposure”.
The Committee on Toxicity of Chemicals in Food, Consumer Products and the Environment (COT, 2008) was asked to comment on the 2006 UK total diet study of arsenic and other metals and assess the potential risks to human health. They considered the approach used by the JECFA to establish the PTWI for inorganic arsenic (15 μg/kg b.w.) in 1989 to be inappropriate in view of the evidence of genotoxicity and carcinogenicity, and concluded that exposure to inorganic arsenic should be as low as reasonably practicable (ALARP).
The ATSDR (2007 and previous assessments) established a chronic oral minimal risk to humans (MRL) of 0.3 µg/kg b.w. per day, applying a similar approach to that of the US EPA RfD, based on the NOAEL for skin lesions of 0.8 µg/kg b.w. per day.
ATSDR also derived a chronic oral MRL of 10 µg methylarsonate/kg per day, based on a BMDL10 for progressive glomerulonephropathy in male mice of 1090 µg methylarsonate/kg per day and an uncertainty factor of 100 for inter- and intra-species variability. For dimethylarsinate a chronic oral MRL of 20 µg/kg per day was derived, by dividing the estimated BMDL10 for vacuolisation of the urothelium in the urinary bladder of female mice of 1800 µg/kg per day by an uncertainty factor of 100.
2. Legislation
In order to protect public health, Article 2 of Council Regulation (EEC) No 315/93 of 8 February 19938 laying down Community procedures for contaminants in food stipulates that, where necessary, maximum tolerances for specific contaminants shall be established. Thus a number of maximum tolerances are currently laid down in Commission Regulation (EC) No. 1881/2006 of 19 December 20069 setting maximum levels (MLs) for certain contaminants in foodstuffs. While MLs for the elements lead, cadmium, mercury and inorganic tin were set for a number of food commodities, arsenic is not regulated so far under this Regulation.
Under Article 5 of Regulation (EEC) No 315/938, Member States may maintain their national provisions, subject to compliance with the provisions of the Treaty, in case Community provisions have not been adopted. At least nine Member States have made use of this provision. The MLs for arsenic range from 0.005 mg/L (set in Germany) for commercial table water and rock water with a claim that these products are suitable for preparing baby food, up to 5 mg/kg set mostly for spices, herbs and seasonings in several Member States.
Harmonized requirements for arsenic in drinking water are set by Council Directive 98/83/EC10 on the quality of water intended for human consumption. This Directive stipulates that Member States shall set limit values of 10 μg/L for arsenic in water intended for human consumption.
Commission Directive 2003/40/EC of 16 May 200311 establishing the list, concentration limits and labelling requirements for the constituents of natural mineral waters, and the conditions for using
8 Official Journal L 037, 13.2.1993, p. 1-3. 9 Official Journal L 364, 20.12.2006, p. 5-24. 10 Official Journal L 330, 5.12.1998, p. 32. 11 Official Journal L126, 22.5.2003, p. 34-39.

Arsenic in food
18 EFSA Journal 2009; 7(10):1351
ozone-enriched air for the treatment of natural mineral waters and spring waters, sets a ML for arsenic in natural mineral water of 10 µg/L. Moreover, performance characteristics for the analytical determination of arsenic are set both in Council Directive 98/83/EC10 as well as in Commission Directive 2003/40/EC11.
Specific purity criteria concerning sweeteners, colours and other food additives are laid down in the three Commission Directives 2008/60/EC12, 2008/84/EC13 and 2008/128/EC14. All Directives provide MLs of 3 mg/kg for arsenic as an impurity in several food additives.
More than 30 arsenic containing compounds were used in the past as herbicides, insecticides and rodenticides, and some of them are still registered and applied in some countries, including the USA, especially as wood preservatives. In the EU, the application of arsenic containing pesticides is not allowed. As from 1 September 2008, Regulation (EC) No 396/200515 of the European Parliament and of the Council on maximum residue levels (MRLs) of pesticides in products of plant and animal origin defines a new fully harmonised set of rules for pesticide residues. The Annexes to this Regulation specify the MRLs and the products to which they apply. If a pesticide, such as one of the arsenic containing compounds, is not included in any of the Annexes, the default MRL of 0.01 mg/kg applies according to Art 18(1b) of Regulation (EC) No 396/200515.
Codex Alimentarius has set a number of standards for arsenic, such as maximum permissible concentrations for total arsenic in several food commodities, e.g. 0.01 mg/L for natural mineral water; 0.1 mg/kg for edible fats and oils, fat spreads and blended spreads (including margarine and minarine), certain animal fats (e.g. lard, rendered pork fat edible tallow), olive oils and olive pomace oils, and 21 vegetable oils; and 0.5 mg/kg for food grade salt.
Directive 2002/32/EC of the European Parliament and of the Council of 7 May 200216 on undesirable substances in animal feed sets maximum contents for arsenic in a number of feed commodities (see Table 2). All levels are given as total arsenic and refer to a feedingstuff with a moisture content of 12 %.
12 Official Journal L 158, 18.6.2008, p. 17-40. 13 Official Journal L 253, 20.9.2008, p. 1-175. 14 Official Journal L 6, 10.1.2009, p. 20-63. 15 Official Journal L 70, 16.3.2005, p. 1-16. 16 Official Journal L 140, 30.5.2002, p. 10-21.

Arsenic in food
19 EFSA Journal 2009; 7(10):1351
Table 2: Maximum contents for arsenic in feed
Undesirable substance Products intended for animal feed
Maximum Content in mg/kg relative to a feedingstuff with a moisture content of
12 %
Arsenic
Feed materials with the exception of: 2 — meal made from grass, from dried lucerne and from dried clover, and dried sugar beet pulp and dried molasses sugar beet pulp
4
— palm kernel expeller 4(a) — phosphates and calcareous marine algae 10 — calcium carbonate 15 — magnesium oxide 20 — feedingstuffs obtained from the processing of fish or other marine animals 15(a)
— seaweed meal and feed materials derived from seaweed 40(a)
Complete feedingstuffs with the exception of 2 — complete feedingstuffs for fish and complete feedingstuffs for fur animals 6(a)
Complementary feedingstuffs with the exception of 4 — mineral feedingstuffs 12
(a): Upon request of the competent authorities, the responsible operator must perform an analysis to demonstrate that the content of inorganic arsenic is lower than 2 mg/kg. This analysis is of particular importance for the seaweed species Hizikia fusiforme.
3. Methods of analysis
3.1. Sample collection and storage
Sample collection for total arsenic analysis complies with standard food sampling procedures before analysis, and no specific methods are required over and above those standard procedures. Similarly, the handling of samples once they have arrived at the laboratory follows the normal European guidelines (CEN, 2002) and no additional precautions are necessary for total arsenic analysis. Sampling prior to the determination of arsenic species (arsenic speciation analysis), however, requires greater vigilance to preclude possible transformations of the original arsenic species during collection, storage and sample preparation. These changes are likely to impact most on redox state (e.g. arsenite/arsenate) and the interchange between oxo and thio analogs of arsenic species (Schmeisser et al., 2004).
3.2. Methods of analysis for determining total arsenic content of foods
Modern analytical methods may be considered to comprise two main parts: sample preparation and instrumental technique. For determinations of arsenic content in food, the sample preparation usually involves a mineralisation step and often also a derivatisation step, and the major categories of instrumental techniques are atomic absorption spectrometry (AAS), atomic fluorescence spectrometry (AFS), inductively coupled plasma atomic emission spectrometry (ICPAES), and inductively coupled plasma mass spectrometry (ICPMS).

Arsenic in food
20 EFSA Journal 2009; 7(10):1351
3.2.1. Sample preparation for total arsenic measurements in food
3.2.1.1. Mineralisation
Before quantitative analysis of solid foodstuffs the sample should first be converted to solution form, an analytical process termed mineralization or digestion or decomposition. This is usually performed by heating the sample with an oxidant to decompose the sample’s organic components, which are then expelled as gaseous carbon dioxide leaving behind the inorganic or mineral components (ash) of the sample. The process is called dry-ashing or wet-digestion depending on the oxidant type and conditions. In dry-ashing, the sample is mixed with a solid oxidant (such as MgO/Mg(NO3)2 as an ashing aid and heated to high temperatures (550°C) in a crucible in a muffle furnace; the dry ash residue is then dissolved in an acid solution before analysis. In wet-digestion, the sample is heated with an oxidising acid or mixture of acids; older wet-digestion methods employed hot plates or sand baths as a heat source and were performed at atmospheric pressure.
Although dry-ashing and wet-digestion with hotplate heating might still be used in some laboratories, most modern methods of mineralization for arsenic determinations in foodstuffs use a wet-digestion procedure based on heating the sample with nitric acid (or nitric acid and hydrogen peroxide) in a pressurized microwave heating system. This procedure, termed microwave-assisted acid digestion, efficiently destroys the organic matter, and under forcing conditions can convert all the various arsenic species commonly found in foods to arsenate (Goessler and Pavkov, 2003). However, when the conditions are not forcing enough, some arsenic compounds, arsenobetaine in particular, are not decomposed to arsenate and this can lead to serious errors in quantification when a hydride generation step is additionally used in the analysis scheme (see below).
3.2.1.2. Hydride generation (vapour generation)
An additional sample preparation step involving the formation of a volatile derivative of arsenic is also often used in arsenic determinations. This step, termed vapour generation (VG) or hydride generation (HG), converts inorganic arsenic to arsine (AsH3), a volatile species, which then serves as the analyte. The benefits are twofold: the arsenic is separated as a gas from the sample matrix thereby reducing interference by matrix effects, and the arsenic is much more efficiently transported to the instrument in the gas phase than in the liquid phase. The end-result is that arsenic can be measured at much lower concentrations when a hydride generation step is included in the analytical procedure.
A hydride generation step is usually employed if one wishes to determine arsenic using atomic absorption spectrometry (AAS), atomic fluorescence spectrometry (AFS) or inductively coupled atomic emission spectrometry (ICPAES) because these instrumental methods, in most cases, are not sensitive enough to directly measure arsenic in digests of foods; inductively coupled mass spectrometry (ICPMS), on the other hand, is much more sensitive and can easily measure arsenic directly, without a hydride generation step. Nevertheless, ICPMS is also sometimes used in combination with a hydride generation step to reduce matrix effects and to obtain even lower limits of quntification (LOQs).
An additional sample preparation step often brings with it an additional analytical difficulty, and this is also the case with the hydride generation step. To obtain reliable quantitative total arsenic data, the arsenic in the sample digest solution must all be present as inorganic forms (arsenate is pre-reduced to arsenite as part of the method prior to reduction to arsine), because organoarsenicals give either much-reduced or negligible signals. Thus it is crucial that the mineralization conditions are sufficiently forcing to convert all organoarsenicals to arsenate. When this is not done, too low total arsenic values will be recorded.

Arsenic in food
21 EFSA Journal 2009; 7(10):1351
3.2.2. Instrumental techniques for total arsenic measurements in food
3.2.2.1. Atomic absorption spectrometry (AAS)
In atomic absorption spectrometry (AAS), the element analyte, in either solution or gaseous form, is thermally decomposed to atoms which absorb light at a particular wavelength characteristic of the element. Thermal decomposition is usually performed by a flame or in an electrically heated graphite- or silica tube. In conventional AAS, a liquid sample is aspirated directly into a flame to produce analyte atoms, but this mode is far too insensitive to be used for arsenic determinations. Rather, for arsenic determinations, AAS must be used in combination with a hydride generation step or with electrothermal heating to enhance the degree of atomisation.
Atomic absorption spectrometry, in combination with a hydride generation step, was the most common method for determining of total arsenic levels in foods during the 1970s and 1980s, and is still widely used today. It can be used in continuous- or batch-mode, with the later giving lower LOQs. With hydride generation AAS, arsenic content of foods can be determined down to levels of about 0.02 mg arsenic/kg dry mass or better.
Recently, two methods based on hydride generation AAS have been accepted as European standards for the determination of arsenic in foodstuffs (CEN, 2005; CEN, 2006); the methods differ only in the way the samples are mineralised.
In electrothermal atomic absorption spectrometry (ET-AAS), also termed graphite furnace atomic absorption spectrometry (GFAAS), a small volume (typically 10-20 µL) of the sample solution is heated electrothermally in a graphite tube in order to atomise the analyte prior to its detection by AAS. The method provides sufficiently good sensitivity to be used for the analysis of certain food samples without the use of hydride generation. However, the method suffers from severe sample matrix effects that can only be overcome by using time consuming standard addition procedures. Nevertheless, an ET-AAS method has been used successfully in a collaborative study for the determination of arsenic in eight seafood samples with concentrations ranging from 2.3 to 79 mg/kg dry mass (Julshamn et al., 2000), and this method has been accepted as a European standard for the determination of total arsenic in seafood (CEN, 2004). The method is capable of quantitative measurement down to 0.1 mg arsenic/kg dry mass (Julshamm et al., 2000).
3.2.2.2. Hydride generation atomic fluorescence spectrometry (AFS)
In atomic fluorescence spectrometry (AFS), gas-phase analyte atoms are excited to higher energy levels by absorption of electromagnetic radiation, and their optical emission is measured at a longer specific wavelength. In combination with hydride generation, AFS provides excellent sensitivity for arsenic with reported quantitative measurements down to 0.01 mg arsenic/kg and below (Vilano and Rubio, 2001). The method, however, is less stable than hydride generation AAS, and this significant disadvantage has restricted its usage.
3.2.2.3. Inductively coupled plasma atomic emission spectrometry (ICPAES)
In atomic emission spectrometry, element analytes are thermally excited to a high energy state, and as they return to lower energy states they emit light at a wavelength characteristic of the element. The inductively coupled plasma is a high energy excitation source which converts a high proportion of the analyte element to its excited state. Although inductively coupled plasma atomic emission spectrometry (ICPAES) is a widely used technique for trace element analysis, it is not particularly sensitive for arsenic and cannot generally be used to determine arsenic in foods. When combined with a hydride generation step, however, ICPAES has been reported to provide quantitative data down to about 0.015 mg arsenic/kg dry mass (Boutakhrit et al., 2005).

Arsenic in food
22 EFSA Journal 2009; 7(10):1351
3.2.2.4. Inductively coupled plasma mass spectrometry (ICPMS)
Inductively coupled plasma mass spectrometry (ICPMS) has established itself as a major technique for trace element determination in foodstuffs due to many desirable features such as low LOQs, multi-element capability, and wide linear dynamic range. The technique utilises a high-energy argon plasma (8000 K) to convert the sample constituents to their elemental components which are then ionised and transported to the mass spectrometer for selective detection and quantification. Arsenic, which has only one naturally occurring isotope, is measured at m/z 75 (As+).
ICPMS is widely used for the determination of arsenic in foodstuffs. For example a recent study showed the suitability of ICPMS for the determination of arsenic in foodstuffs with arsenic content ranging from 0.07-22 mg arsenic/kg dry mass (Julshamn et al., 2007). ICPMS is the most sensitive of the instrumental techniques for determining arsenic with the ability to easily and reliably quantify arsenic in food at levels of 0.01 mg arsenic/kg dry mass. When required, lower LOQs are readily achievable with ICPMS. The European standard for the ICPMS method for determing arsenic, cadmium, mercury and lead in foods after pressure digestion (CEN, Pr EN 15763:2008) is foreseen to be published in January 2010 by the European Committee for Standardization (CEN)17.
Interferences and matrix effects are generally not major problems for arsenic measurements by ICPMS. However, sample solutions containing >0.1 % (mass/volume) total dissolved solids are not well tolerated, and chloride ions can cause spectral interference due to the formation of ArCl+ (m/z 75, the same nominal mass as As+) in the argon plasma of the ICPMS. This interference can be overcome by using collision/reaction cell technology, which is now incorporated into all modern ICPMS instruments. Nevertheless, in some cases, new poly-atomic interferences can be formed within the collision cell but a carefully optimisation of the nebuliser gas flow in standard mode usually represents an effective and simple method for reducing analytical bias (Noël et al., 2005 and Dufailly et al., 2008) have studied spectral interference more in detail. Hydride generation may also be used in combination with ICPMS to overcome possible chloride interference. In addition, hydride generation-ICPMS (HG-ICPMS) provides lower LOQs compared with conventional ICPMS, although the improvement is not dramatic (in contrast to the case for hydride generation-AAS (HG-AAS) compared with conventional AAS).
3.2.2.5. Instrumental techniques – concluding comments
There are several analytical methods suitable for determining total arsenic content in foods which vary widely in cost, ease of operation and analytical performance such as LOQ, dynamic linear range, stability and robustness. The LOQs reported for each of the instrumental methods will vary depending on the sample preparation steps and the application.The three instrumental methods most commonly reported for the data compiled in Section 5.2.4 were ICPMS, HG-AAS, and ET-AAS, and the relative strengths of these methods are briefly discussed here. ICPMS is clearly the best technique in terms of analytical performance because it is a stable and robust technique that provides low LOQs and a wide dynamic linear range. Although the instrumentation is expensive to purchase, and to operate, the ability of ICPMS to measure many elements simultaneously can offset these cost factors. The most commonly used method reported by the member states that submitted occurrence data was HG-AAS, which is a well-established and proven method for determining arsenic content in foods. Although not as sensitive as ICPMS, the technique has the advantages of lower purchase price and running costs, and it is simpler to use and maintain. ET-AAS is a method suitable for determining the arsenic content in simple sample matrices (e.g. water). It is, however, subject to severe matrix effects which may restrict its use for some food samples.
17http://www.cen.eu

Arsenic in food
23 EFSA Journal 2009; 7(10):1351
3.3. Methods of analysis for determining arsenic species in foods
Although many methods have been reported over the years for quantitative measurement of arsenic species in food, most of the work is covered by two categories of analysis: (i) chemical separation of inorganic arsenic from organic arsenic species followed by quantification of arsenic in the two separated phases; and (ii) chromatographic separation of arsenic species with on-line detection and quantification by an arsenic-selective detector. Although arsenic speciation methods based on vapour generation followed by cold-trapping or gas chromatography and arsenic-selective detection are often used in environmental and clinical analysis, they are generally not appropriate for food analyses. Such methods are suitable for determining inorganic arsenic and simple methylated arsenic species found in water and urine, but they are not suitable for the more complex arsenic species (e.g. arsenobetaine and arsenosugars) found in food.
3.3.1. Separation of inorganic arsenic from organic arsenic species
When a sample containing arsenic is treated with strong aqueous HCl, the inorganic arsenic component is converted to arsenic trichloride (AsCl3). Arsenic trichloride is volatile (boiling point 130°C) and soluble in organic solvents, and hence can be separated from any organoarsenicals in the original sample by either distillation or solvent extraction. A total arsenic determination on this separated fraction provides the inorganic arsenic content in the original sample. The method, first reported in the mid-1970s, was used widely for several years, particularly for seafood samples; a summary of the data obtained by this method has been published (Edmonds and Francesconi, 1993). The method seemed to lose favour from the mid-1980s, coinciding with the development of more sophisticated arsenic speciation analysis based on high performance liquid chromatography/inductively coupled mass spectrometry (HPLC/ICPMS). Although no longer in common usage, there have been several applications of the method over the last 10 years (Muñoz et al., 2000; Almela et al., 2002).
The method has the clear advantage of converting all the inorganic arsenic, protein-bound or otherwise, to a soluble form. The method, however, may not be selective for inorganic arsenic for all types of samples (and all types of organoarsenicals). In addition, the requirement for potentially harmful organic solvents such as chloroform has limited the method’s application.
3.3.2. Chromatography coupled with on-line selective detection of arsenic
This second, more comprehensive, approach to determining arsenic species will be discussed in three parts: extraction, chromatography, and detection/quantification.
3.3.2.1. Sample extraction
For chromatographic separations, the arsenic species must first be transferred to solution form. Unlike the mineralisation techniques described for total arsenic analysis, the dissolution or extraction of arsenic species must be performed under mild conditions in order to maintain the original chemical properties of the species. Herein lies a major problem of techniques based on chromatography – the conditions used to prepare the solution on which the analysis will be performed must be sufficiently forcing to extract the majority of the arsenic in the sample without degrading the arsenic species. The difficulties of overcoming this problem have been discussed (Francesconi and Kuehnelt, 2004). In addition, the multitude of arsenic species present in food, and the range of physical properties that they possess, precludes the possibility of using a single extraction method for all arsenic species in all foodstuffs (Francesconi, 2003).
Mixtures of methanol/water are commonly used for extracting arsenic species from food. Usually, gentle mixing is sufficient and more forcing conditions such as sonication provide no significant

Arsenic in food
24 EFSA Journal 2009; 7(10):1351
advantage. The method is mild and often results in good extraction efficiencies (>80 %) particularly for seafood products with a high content of arsenobetaine. For some samples, however, methanol/water mixtures extract <50 % of the arsenic and hence the method can at best provide only a part-picture of the arsenic species in the original sample. The arsenic left behind is often referred to as protein-bound or lipid-soluble arsenic. Techniques to handle this lipid-soluble arsenic are now being developed following the identification of arsenolipids in fish oils (Rumpler et al., 2008; Taleshi et al., 2008), but the identity of so-called protein-bound arsenic remains unknown.
Because toxicological interest is currently focussed on inorganic arsenic, forcing extraction methods have been developed to maximise the extraction of this arsenic form. For example, trifluoroacetic acid has been used in several studies to extract inorganic arsenic species from rice (Heitkemper et al., 2001; Williams et al., 2005; Williams et al., 2006a). This treatment can at least partially reduce arsenate to arsenite, so a combined inorganic arsenic value has been reported in those studies. Similarly, an extraction procedure based on microwave-assisted alkaline solubilisation of the sample with a mixture of sodium hydroxide and ethanol has been reported (Larsen et al., 2005). The reagent solubilised both arsenite and arsenate from the sample, and at the same time converted arsenite to arsenate allowing subsequent determination of (combined) inorganic arsenic as arsenate by anion exchange HPLC/ICPMS (see below). Many of the organoarsenic species present in the sample would have been degraded to simpler methylated species under these conditions but this does not impact on what the method aims to achieve. This extraction method has been successfully applied to provide inorganic arsenic data for a range of marine organisms (Sloth et al., 2005). The procedure, however, is not suitable for carbohydrate-rich samples because an intractable jelly is produced.
3.3.2.2. Chromatographic separation
Much of the arsenic in food consists of charged water-soluble species, and hence HPLC with ion-exchange or ion-pairing conditions are most commonly reported for their separation (Francesconi and Kuehnelt, 2004). These HPLC separations generally result in good column recoveries, i.e. the quantity of arsenic injected onto the HPLC column is accounted for by the sum of arsenic species eluting from the column. There are several examples, however, where 50 % or more of the arsenic is “lost” on the HPLC column, and hence in these cases the arsenic speciation picture provided by HPLC is incomplete (Francesconi and Kuehnelt, 2004).
Despite the general utility of ion-exchange HPLC for arsenic speciation analysis, there are nevertheless many arsenic species that require different HPLC conditions. For example, the newly reported arsenolipids require reversed-phase HPLC (Rumpler et al., 2008); the column recovery of arsenolipids under these conditions has not been determined.
3.3.2.3. Detection and quantification of arsenic species
The detection of arsenic species following their chromatographic separation is most often performed with arsenic selective detectors such as AAS, AFS (both in combination with a hydride generation step), or ICPMS. The identification of arsenic species by these methods is performed by matching chromatographic retention times with standards run under identical conditions. Further support for the species identification is provided by spiking (addition) experiments whereby the authentic compound, an arsenic standard, is added to the sample and the chromatography repeated with the expectation of obtaining a single homogeneous peak at the assigned retention time. Arsenic speciation analyses performed with a mass spectrometer as detector can provide greater confidence in species identifications; these methods, however, usually cannot provide quantitative data on arsenic species in crude extracts of food samples.
When either AAS or AFS is used, in combination with hydride generation as the detector, additional steps (and equipment) are required in order to convert the arsenic species to a form suitable for derivatisation and detection. This requirement severely limits the usefulness of those methods. ICPMS,

Arsenic in food
25 EFSA Journal 2009; 7(10):1351
on the other hand, can be coupled directly to the HPLC, and this easy coupling, together with the many inherent advantages of ICPMS in terms of sensitivity and robustness, make HPLC/ICPMS by far the most common and useful of the methods for the determination of arsenic species in foodstuffs. The method can provide quantitative data on many of the arsenic species occurring in food at levels down to about 0.03 mg arsenic/kg dry mass (Schaeffer et al., 2006).
3.4. Analytical quality control for arsenic measurements in food
3.4.1. Total arsenic
The steps necessary to demonstrate the trueness (i.e. systematic error) and precision (i.e. random error) of trace element data have recently been discussed in terms of analytical quality criteria (Jorhem, 2008). These criteria are applicable to total arsenic measurements and should be followed whenever possible. One of the important criteria is the reporting of correct (and precise) data for the arsenic content of certified reference materials that closely match the matrix of the samples under investigation. Table 3 lists some certified reference materials that might serve to establish the validity of a particular laboratory’s analytical method for determining arsenic in foodstuffs. Most of these materials, however, contain high concentrations of arsenic (because they are from marine sources), and there is a lack of reference materials with low arsenic content. Such materials might better test a laboratory’s ability to provide reliable data for arsenic in terrestrial samples.
Table 3: Some reference materials relevant to food analysis certified for total arsenic content
Food type Descriptor and supplier(a) Certified total arsenic content mg arsenic/kg dry mass
Rice flour SRM 1568a (NIST) 0.290 ± 0.030(b) Tomato Leaves SRM 1573 (NIST) 0.27 ± 0.05 Oyster Tissue SRM 1566b (NIST) 7.65 ± 0.65 Lobster hepatopancreas CRM TORT-2 (NRCC) 21.6 ± 1.8 Dogfish muscle CRM Dorm-3 (NRCC) 6.88 ± 0.30 Dogfish liver CRM Dolt-4 (NRCC) 9.66 ± 0.62 Cod muscle CRM BCR-422 (IRMM) 21.1 ± 0.5 Tuna Fish CRM BCR-627 (IRMM) 4.8 ± 0.3 Mussel tissue ERM-CE278 (IRMM) 6.07 ± 0.13 SRM: Standard reference material; CRM: Certified reference material; ERM: European reference material; (a): NIST: National Institute of Standards and Technology (USA); NRCC: National Research Council of Canada (Canada);
IRMM: Institute for Reference Materials and Measurements (Belgium) (b): The uncertainty usually given as 95 % confidence interval.
3.4.2. Arsenic species
The determination of arsenic species is still not a routine procedure, and hence clear quality criteria are not yet established. Nevertheless, necessary steps have been suggested, at least in terms of speciation analysis with HPLC/ICPMS, to improve the quality of speciation data (Francesconi and Sperling, 2005). An important criterion is the testing of the method on a reference material certified for arsenic species. Table 4 lists the few reference materials that might serve this purpose. There are no reference materials for foodstuffs that have been certified for inorganic arsenic.
Table 4: Reference materials relevant to food analysis certified for arsenic species content
Food type Descriptor and supplier(a) Certified arsenic species content mg arsenic/kg dry mass
Dogfish muscle DORM-2 (NRCC) Arsenobetaine (16.4 ± 1.1)(b); Tetramethylarsonium ion (0.248 ± 0.054)

Arsenic in food
26 EFSA Journal 2009; 7(10):1351
Tuna fish CRM BCR-627 (IRMM) Arsenobetaine (3.9 ± 0.2); Dimethylarsinate (0.15 ± 0.01)
SRM: Standard reference material; CRM: Certified reference material; (a): NRCC: National Research Council of Canada (Canada); IRMM: Institute for Reference Materials and Measurements
(Belgium) (b): The uncertainty usually given as 95 % confidence interval.
4. Sources, use and environmental fate
Being an element, arsenic occurs naturally in the earth’s crust and it is a constituent of more than 200 mineral species, especially those including sulfide (Boyle and Jonasson, 1973). Arsenic occurs as arsenate in about 60 % of the minerals and 20 % are sulfide and sulfo-salts whereas the remaining 20 % include arsenides, arsenites and oxides but also elemental arsenic (Onishi, 1969). The most common arsenic mineral is mispickel (arsenopyrite, FeSAs) which is found in e.g. France, Germany, Italy, and Romania as well as in Siberia and North America. Arsenic is also found in other minerals such as realgar (As4S4).
Concentrations of arsenic in various types of igneous rocks range from <1 to 15 mg/kg, with a mean value of 2 mg/kg. Similar concentrations (<1 to 20 mg/kg) are found in sandstone and limestone. Significantly higher concentrations of arsenic, of up to 900 mg/kg, are found in argillaceous sedimentary rocks including shale, mudstone and slates.
As arsenic is found in many metal rich geological materials, it is obtained as a by-product of the production of e.g. copper, lead, cobalt and gold. Anthropogenic sources of arsenic releases to the environment include both industrial emissions, mainly non-ferrous mining and smelting and metal using industry and the production of energy from fossil fuels. Improvements of industrial processes have led to substantial decreases of the emissions of arsenic from the metal industry. As an example, in the United Kingdom, the estimated arsenic releases (Hutton and Symon, 1986) were 650 tonnes/year from the non-ferrous metal industry, 9 tonnes/year into the atmosphere and 179 tonnes/year to landfill from iron and steel production, and 297 tonnes/year into the atmosphere and 838 tonnes/year to landfill from fossil fuel combustion. In 1996, the estimated total releases of arsenic to the air in the UK were 50 tonnes (DG Environment, 2000).
World arsenic production in the year 2008 was estimated to be 53,500 tonnes expressed as arsenic trioxide As2O3, whereof less than 1,500 tonnes was estimated to be produced within the EU18.
Elemental arsenic has been, and is sometimes still, used as an alloying element in ammunition and solders, as an anti-friction additive to metals used for bearings, and to strengthen lead-acid storage battery grids. High-purity arsenic is used by the electronics industry for gallium-arsenide semiconductors for telecommunications, solar cells, and space research (USGS, 2006).
The main use of arsenic is for the production of wood preservatives, herbicides, and insecticides. In 2003, the USA was the world's largest consumer of arsenic, with an apparent demand of 21,600 tonnes. In 2008 this was estimated to be reduced to 7,200 tonnes. In the US, the production of wood preservatives, primarily chromated copper arsenate (CrO3 CuO As2O5) (CCA) accounted for >90 % of domestic consumption of arsenic prior to 2004. There are a number of different mixtures of CCA which contain different proportions of chromium, copper, and arsenic oxides. The most common type contains 34.0 % of As2O5. Over the years, CCA has been the most widely used wood preservative in the world.
In 2003, US manufacturers of arsenical wood preservatives began a voluntary transition from CCA to other wood preservatives for certain residential uses. This phase-out was completed on December 31,
18http://minerals.usgs.gov

Arsenic in food
27 EFSA Journal 2009; 7(10):1351
2003. Wood treated prior to this date could still be used and structures made with CCA-treated wood would not be affected. CCA-treated wood products continue to be used in industrial applications (US EPA, 2003a).
In the EU, the use of arsenic substances and constituents in preparations intended to prevent the fouling by microorganisms, plants or animals was regulated in 1976 (Council Directive 76/769/EEC)19. Today arsenic compounds are regulated in Regulation (EC) No 1907/2006 of the European Parliament and of the Council on the Registration, Evaluation, Authorisation and Restriction of Chemicals (REACH)20. In Annex XVII, amended on June 22nd 2009, it is stated that arsenic compounds shall not be placed on the market, or used, as substances or in mixtures where the substance or mixture is intended for use to prevent the fouling by micro-organisms, plants or animals. Furthermore, arsenic compounds shall not be placed on the market, or used, as substances or in mixtures where the substance or mixture is intended for use in the treatment of industrial waters, irrespective of their use. Nor shall it be used in the preservation of wood and such wood shall not be placed on the market.
There are, however, a number of derogations from these conditions of restriction. Substances and mixtures for the preservation of wood may be used in certain industrial installations using vacuum or pressure to impregnate wood if they are solutions of inorganic compounds of the copper, chromium, arsenic (CCA) type C and if they are authorised (in accordance with Article 5(1) of Directive 98/8/EC of the European Parliament and of the Council)21. Such wood may be placed on the market for professional and industrial use provided that the structural integrity of the wood is required for human or livestock safety, and skin contact by the general public during its service life is unlikely and treated wood shall not be used in residential or domestic constructions, in any application where there is a risk of repeated skin contact, in marine waters, for agricultural purposes other than for livestock fence posts and structural uses, or in any application where the treated wood may come into contact with intermediate or finished products intended for human and/or animal consumption. However, wood treated with arsenic compounds that was in use in the Community before 30 September 2007, or that was placed on the market in accordance with the derogations above, may remain in place and continue to be used until it reaches the end of its service life.
Member States may allow wood treated with other types of CCA solutions that were in use in the Community before 30 September 2007 to be used or reused subject to specific conditions.
Arsenic and arsenic containing compounds have been used as herbicides. The most important are dimethylarsinate (cacodylic acid or hydroxydimethyl-arsine oxide), MSMA (sodium methanearsonate), DSMA (disodium methanearsonate), CAMA (calcium acid methanearsonate). Moreover, arsenate and arsenic trioxide are currently registered as pesticides in the United States National Pesticide Information Retrieval System (NPIRS, 2009). Other arsenic containing compounds have been used as feed additives e.g. arsanilic acid ((4-aminophenyl)arsenic acid, atoxylic acid), sodium arsanilate ((4-Aminophenyl)arsenic acid sodium salt), arsanilic acid (arsamin, atoxyl) and roxarsone (3-nitro-4-hydroxy-phenylarsonic acid, 3-Nitro-10). However, these compounds are not allowed in the EU.
Arsenic compounds have a long history in medicine. Organic arsenic antibiotics were extensively used in the treatment of diseases caused by spirochetes and protozoans (NRC, 1999). Eventually, the use of
19 Official Journal L 262, 27.9.1976, p. 201-203. 20 Official Journal L 396, 30.12.2006, p. 1-849; (Regulation (EC) No 1907/2006 of The European Parliament and of the
Council of 18 December 2006 concerning the Registration, Evaluation, Authorisation and Restriction of Chemicals (REACH), establishing a European Chemicals Agency, amending Directive 1999/45/EC and repealing Council Regulation (EEC) No 793/93 and Commission Regulation (EC) No 1488/94 as well as Council Directive 76/769/EEC and Commission Directives 91/155/EEC, 93/67/EEC, 93/105/EC and 2000/21/EC).
21 Official Journal L 123, 24.4.1998, 1-63.

Arsenic in food
28 EFSA Journal 2009; 7(10):1351
inorganic arsenicals in Western medicines ended in the 1970s, although they may still be encountered in non-Western, traditional medicines. By the 1980s, the only remaining medicinal organic arsenical was melarsoprol for the treatment of the meningo-encephalitic stage of African trypanosomiasis. There has, however, been renewed interest in arsenic as a therapeutic agent, namely the use of arsenic trioxide in the treatment of acute promyelocytic leukaemia (Gallagher, 1998; Kroemer and de Thé, 1999; Miller, 1998; Wang, 2001) and in 2000, the US Food and Drug Administration (FDA) approved arsenic trioxide for this use (FDA, 2000).
4.1. Soil
Arsenic in soil could be derived from both natural and anthropogenic sources. Atmospheric pollution and application of phosphate fertilisers appear to be major contributors to the anthropogenic arsenic deposition in agricultural soils. Atmospheric deposition of arsenic onto soil has generally decreased over the last 20 years in Europe (DG Environment, 2000). Background arsenic levels in surface soils range from 0.1 to 55 mg/kg (Matschullat, 2000).
The arsenic content of fertilisers depends on its concentration in the raw material used for the production. Rock phosphate, used for the manufacturing of fertilizers and detergents, can contain up to 200 mg arsenic/kg (O’Neill, 1990). Elevated concentrations of arsenic in soils (compared to background values) have also been reported following the application of sewage sludge. O’Neill (1990) estimated that in the UK, as a whole, about 2.5 tonnes of arsenic is added to the agricultural land per year by use of sludge, compared to the 6.1 tonnes that were estimated to come from phosphate fertilizers. Since arsenic can be taken up by some plants such as rice (Oryza sativa) and ferns (Ma et al., 2001 and Abedin et al., 2002), an increased soil concentration can result in increased levels in food and feeds.
Komárek et al. (2007) reported concentrations in forest soil influenced by industrial activities, mainly lead smelters. The concentration of arsenic in soil samples were reported to range from 120 to 252 mg/kg dry mass. Mushrooms collected in the same area show that arsenic does not seem to be accumulated by fungi as the bioaccumulation factors (BAFs) ranged from 0.01 to 0.06. Mushrooms collected in areas with “normal” arsenic concentrations in soil are usually around 1.2-2.5 mg/kg, indicating BAFs from 0.02 to 25 but variation within and between species is reported to be high (Vetter, 2004). As the calculated BAFs from background areas were higher than those from contaminated areas, it is likely that mushrooms in general do not bioaccumulate arsenic.
4.2. Water
In water, arsenic can be found dissolved as arsenate, arsenite as well as traces of methylarsonate and dimethylarsinate (Braman and Foreback, 1973). Arsenite and arsenate can interchange oxidation states depending on redox potential, pH and biological processes (Ferguson and Gavis, 1972). Also, methylation and demethylation reactions are important for the mobilization and subsequent distribution of arsenicals (Mok and Wai, 1994). Transport and partitioning of arsenic in water depends on the chemical form of the arsenic and on interactions with other materials present. Arsenic may be adsorbed from water on to clays, iron oxides, aluminium hydroxides, manganese minerals and organic material (Callahan et al., 1979; Welch et al., 1988). The distribution and transport of arsenic in sediment is a complex process that depends on water quality, native biota and sediment type. There is a potential for arsenic release when there is a fluctuation in redox potential, pH and sediment organic content (Abdelghani et al., 1981).
Other major sources of arsenic in the hydrosphere include domestic wastewater, non-ferrous metal smelting and refining, and manufacturing of chemicals and metals. The average arsenic content of seawater is about 1.5-1.7 µg/L (Donat and Bruland, 1995) but increased concentrations have been

Arsenic in food
29 EFSA Journal 2009; 7(10):1351
reported in some coastal zones. Concentrations measured in European rivers vary between 0.1 and 1.7 µg/L (Chester, 1993; Brügmann and Matschullat, 1997).
Arsenic concentrations in groundwater average about 0.1-2 μg/L, but in areas with volcanic rock or sulfide mineral deposits the concentrations can range up to 3,400 μg/L (Page, 1981; Welch et al., 1988; Robertson, 1989). In some mining areas arsenic concentrations up to 48, 000 μg/L have been reported.
Enhanced concentrations of arsenic in groundwater emanating from arsenic-rich sediment have been reported in both India and Bangladesh. Mean total arsenic levels in an investigation in West Bengal ranged from 193 to 737 μg/L, with an overall maximum of 3,700 μg/L (Chatterjee et al., 1995). Mean arsenite levels in the groundwater were around 50 % of the total arsenic. Mandal et al. (1996) reported that 44 % of groundwater samples collected in West Bengal (India) contained total arsenic levels >50 μg/L. Dhar et al. (1997) found that 38 % of groundwater samples collected from 27 districts of Bangladesh contained total arsenic levels >50 μg/L.
4.3. Air
Industrial activities such as high temperature processes like coal-fired power generation and smelting are main anthropogenic sources of arsenic release to the air. Forest fires and volcanoes, as well as natural low-temperature bio-methylation and microbial reduction, also release arsenic into the atmosphere. Arsenic is mainly released to air as particles or bound to particulate matter (Coles et al., 1979). Background concentrations in air range from <1 to 3 ng/m3, but concentrations in cities may range up to 100 ng/m3. Considerably higher concentrations, >1000 ng/m3, have been reported from measurements in the vicinity of industrial sources.
Microorganisms can form volatile methylated derivatives of arsenic under both aerobic and anaerobic conditions, and can reduce arsenic compounds to release arsine gas (Cheng and Focht, 1979; Tamaki and Frankenberger, 1992). Arsines that are released from microbial sources in soils or sediments can undergo oxidation in the air, converting the arsenic back into less volatile forms (Wood, 1974; Parris and Brinckman, 1976). Scudlark and Church (1988) measured arsenic in acid precipitation on the mid-Atlantic coast of the USA during 1985 and 1986 and calculated that the total annual arsenic deposition rate ranged from 38 to 266 μg/m2. The dry deposition was estimated to comprise 29-55 % of the total deposition.
There are only a few studies of arsenic in rainwater and they report concentrations of 0.0001-0.5 μg/L (Andreae, 1980; Welch et al., 1988).
4.4. Wastes
Global anthropogenic input to the pedosphere (the outermost layer of the earth that is composed of soil and subject to soil formation processes) has been estimated to 24 400-94 000 tonnes per year. As cited by Matschullat (2000), Nriagu (1990) calculated that atmospheric deposition, coal ashes and discarded products contributed to the total input with 13 000, 22 000 and 38 000 tonnes respectively. The input from natural sources has been calculated to be 1.5 times that from anthropogenic sources. The long-term fate of arsenic accumulated in landfills is uncertain and may represent a future source of releases. The handling of wastes may lead to elevated local and regional releases, especially in developing countries (United Nations Development Programme - UNEP, 2002). Considerable quantities of dredged material contain heavy metals that eventually are deposited in the marine environment. However, much of the trace metal content is of geological origin and many operations simply relocate the material rather than constituting a new addition to the environment. Information in The Convention for the Protection of the Marine Environment of the North-East Atlantic (OSPAR) (1997)

Arsenic in food
30 EFSA Journal 2009; 7(10):1351
indicates that the anthropogenic contribution is very low for chromium, copper and nickel (0-2 %), medium for mercury, arsenic, lead and zinc (30-50 %) but predominant for cadmium (70 %).
Arsenic occurs in different types of inorganic waste material from mining and metal industry. This material is mainly deposited at controlled landfills. Previous waste handling techniques included dumping at open dump sites as well as dumping at sea. Common arsenic containing waste material also originates from CCA treated wood. If such waste is incinerated, part of the arsenic will be emitted to the air whereas the rest will follow the ash fraction which eventually will be dumped.
4.5. Transfer in the environment and bioaccumulation
Arsenic occurs naturally in the environment as a constituent of many minerals species, especially those including sulfide mineralisation (Boyle and Jonasson, 1973). As indicated above, many of these minerals are more or less rapidly weathered and arsenic does therefore naturally occur in soil, water and air.
Bioaccumulation of arsenic in the aquatic environment is dependent on e.g. environmental conditions, species involved, trophic status within the food chain and route of uptake (Williams et al., 2006b). Bioaccumulation refers to the net accumulation of a chemical by aquatic organisms as a result of uptake from all environmental sources, such as water, food, and sediment, whereas bioconcentration refers to the uptake through water only (US EPA, 2003b). In aquatic food chains bioaccumulation does not appear to be significant (Mason et al., 2000; Williams et al., 2006b). Bioconcentration of arsenic occurs primarily in algae and lower aquatic invertebrates. Bottom-feeding fish are exposed to the greater quantities of metals including arsenic. Arsenic is mainly accumulated in the exoskeleton of invertebrates and in the livers of fish. No differences were found in the arsenic levels in different species of fish, which included herbivorous, insectivorous, and carnivorous species (Mason et al., 2000), whereas great differences in arsenic concentration are reported in fillets of oily fish (i.e. herring) and lean fish (i.e. cod). However, in the same study by Mason et al. (2000) of the factors affecting bioaccumulation of arsenic, no evidence of biomagnification was found since arsenic concentrations in organisms tended to decrease with increasing tropic level.
The bioconcentration factors (BCFs) of arsenic by bryophytes, invertebrates, and fish (liver) in Swedish lakes and brooks impacted by smelter emissions were 8,700, 1,900-2,200, and 200-800, respectively (Lithner et al., 1995). US EPA (2003b) assessed a large dataset of bioaccumulation data for various fish and invertebrate species. BCF values in this dataset ranged from 0.048 to 1,390. Williams et al. (2006b) reviewed 12 studies of arsenic bioaccumulation in freshwater fish, and proposed that BCF and BAF values depended on the arsenic concentration in water. BCF and BAF values from these 12 studies ranged from 0.1 to 3,091. The same study reported that BCF and BAF values appear to be the highest within the range of ambient arsenic concentrations, and decline steeply to relatively low levels as the arsenic concentrations in water increase. This is further supported by a report from US EPA (2007) which states that for many non-essential metals, including arsenic, accumulation is nonlinear with respect to exposure concentration.
In marine waters, algae take up arsenate, presumably because it resembles the essential ion phosphate, and, as part of what is thought to be a detoxification process, they transform it into a group of arsenic-containing sugars, termed arsenosugars. This process represents the most significant bioaccumulation step for arsenic in the environment whereby inorganic arsenic in seawater, present at about 1.5 µg/L is converted to organoarsenicals in algae present at typically 2-50 mg arsenic/kg dry mass. There is no further increase in arsenic concentration along food chains.
Terrestrial plants may accumulate arsenic by root uptake from the soil and by absorption of deposited arsenic, and certain species may accumulate substantial levels (US EPA, 1982a). This is especially important for rice.

Arsenic in food
31 EFSA Journal 2009; 7(10):1351
Kale (Brassica oleracea var. acephala), lettuce (Lactuca sativa), carrot (Daucus carota), and potato (Solanum tuberosum) were grown in experimental plots close to a wood preservation factory in Denmark where waste wood was incinerated (Larsen et al., 1992). Elevated levels of inorganic arsenic were found in both test plants soil. The dominating pathway for arsenic to the leafy vegetables was by direct atmospheric deposition, while arsenic in the root crops was a result of both soil uptake and atmospheric deposition.
Arsenic accumulation by plants is affected by arsenic speciation. Uptake of four arsenic species (arsenite, arsenate, methylarsonate, and dimethylarsinate) by turnip (Brassica napus ssp. rapifera) grown under soilless conditions showed that while uptake increased with increasing arsenic concentration in the nutrient solutions, the organic arsenic species showed higher upward translocation compared to the inorganic (Carbonell-Barrachina et al., 1999). The total amount of arsenic taken up by the turnip plants (roots and shoots) followed the trend methylarsonate < dimethylarsinate < arsenite < arsenate. In a similar experiment conducted on tomato plants, arsenic was mainly accumulated in the root system (85 %) with only trace amounts translocating to the fruit (1 %). However, plants treated with methylarsonate and dimethylarsinate had higher arsenic concentrations in the shoots and fruit than those treated with arsenite or arsenate (Burlo et al., 1999).
5. Occurrence of arsenic in food
5.1. Previously reported occurrence results
Drinking water can be a significant source of arsenic exposure, particularly in areas where arsenic is naturally present in groundwater. Drinking water in Germany contained 0.004 mg/L of arsenic, as an average, in close to 4,000 samples tested in 1997-2002 (SCOOP, 2004), while in an earlier study arsenic levels in groundwater were found to exceed 0.010 mg/L in no more than 6-10 % of samples collected during the period 1992-1994 (Umweltbundesamt, 1997). Similarly, in a study of drinking water in Romania, the Slovak Republic and Hungary, the Romanian and Slovakian study areas had relatively low arsenic concentrations with, at the most, 8 % of the drinking water concentrations exceeding 0.010 mg/L, whereas in the Hungarian study area nearly 70 % of the individuals drank water with arsenic concentrations exceeding 0.010 mg/L, with a maximum of 0.088 mg/L recorded (Lindberg et al., 2006). Varsanyi (1989) found arsenic concentrations in deep groundwater in Hungary to range from 0.001 to 0.174 mg/L, with an average value of 0.068 mg/L. High arsenic levels originating from arsenic-rich bedrock were found in drilled wells in south-west Finland, with concentrations ranging from 0.02 to 0.98 mg/L (Kurttio et al., 1998). Previous data have established that essentially all arsenic in drinking water is inorganic (NRC, 1999).
Reported data on total arsenic content in food commodities indicate that fish and fish products carry the highest concentrations. Uneyama and co-workers produced a meta-analysis of the published data on arsenic concentrations found in food. The data showed that fish and seafood, including seaweed, are the major worldwide food sources of total arsenic. Finfish, species that mainly live at the bottom of the sea, such as flat fish and angler fish, contained relatively high arsenic levels. The same was true for shellfish that live in some cases in the sand of the ocean floor (Uneyama et al., 2007).
The European Commission Scientific Cooperation project (SCOOP, 2004) found that total arsenic concentrations in most foods other than fish, seafood and rice were in the low range of 0.0005 to 0.020 mg/kg; exceptions were dry tea and coffee powder (0.144 mg/kg), salt and spices (0.097-0.219 mg/kg) and food supplements such as algae preparations (2-42 mg/kg) (all expressed on a dry mass basis). The average total arsenic concentrations in a mix of marine and freshwater fish and other seafood ranged from 0.100 to 1.8 mg/kg.
In Poland, higher mean total arsenic concentrations were found in cocoa powder at 0.123 mg/kg, dry tea at 0.153 mg/kg and salt at 0.172 mg/kg (Pavlovičá and Šalgovičová, 2008). In contrast, they found

Arsenic in food
32 EFSA Journal 2009; 7(10):1351
a mean of only 0.020 mg/kg in poultry and poultry products, 0.022 mg/kg for vegetables and vegetable products (with mushrooms at 0.084 mg/kg), and low values also in meat and meat products.
Since 1994, Norway has carried out a monitoring programme on fish and other seafood products caught in the Barents Sea, the Norwegian Sea and the North Sea, to check for arsenic and other organic and inorganic contaminants. More than 8,000 fish specimens from 25 fish and shellfish species were analysed in the period from 1994 to 2008. The highest concentrations of total arsenic in the species analysed were found in shrimp (Pandalus borealis) with a concentration range from 13 to 96 mg/kg. The high concentration of arsenic in shrimp has been recognised since the beginning of the 20th century (Chapman, 1926). The arsenic concentration in 200 samples of Atlantic cod (Gadus morhua) varied between 0.5 and 52 mg/kg, while other cod fish such as haddock (Melanogrammus aeglefinus) showed less variation but still high concentrations with values between 3 to 23 mg/kg in 25 samples. Most other fish species showed arsenic concentrations in individual specimens of less than approximately 5 mg/kg (Julshamn et al., 2004). Inorganic arsenic was included in the programme from 2004. Concentrations of inorganic arsenic were low in all the Atlantic cod analysed (<0.001 mg/kg), even in fish with high concentrations of total arsenic (Sloth et al., 2005). Tuna was the only fish species with concentration of inorganic arsenic higher than 0.001 mg/kg (i.e. 0.008 mg/kg, total arsenic 0.9 mg/kg). The concentrations of inorganic arsenic in shrimp were <0.001 mg/kg for all samples analysed. The highest levels of inorganic arsenic were found in crustaceans and bivalves (Sloth et al., 2005; Sloth and Julshamn, 2008) with concentrations in blue mussels (Mytilus edulis) ranging from 0.001 to 4.5 mg/kg (Sloth and Julshamn, 2008). The percentage of inorganic arsenic to total arsenic in fish fillets for about 20 species caught in the open sea off the Norwegian coast was 0.1 % (except for tuna fish which was about 9 %), and for blue mussels the percentage was on average 1 %.
A recent French study looked not only at dietary arsenic exposure to arsenic from fish and shellfish, but also at arsenic speciation level (Sirot et al., 2009). The highest total arsenic concentrations of 12 to 34 mg/kg were found in bottom dwelling fish species, with the highest concentrations of inorganic arsenic varying from 0.068 to 0.073 mg/kg. On average, the inorganic arsenic comprised 0.1 % to 3.5 %. Shellfish had similar high concentrations of total arsenic with a slightly higher proportion of inorganic arsenic varying from 0.1 % to 6 %. The Slovak Republic reported a mean value of total arsenic of 0.277 mg/kg in fish and fish products, with a range of 0.010 mg/kg and 1.222 mg/kg for different categories (Pavlovičá and Šalgovičová, 2008). A study in the Netherlands reported that inorganic arsenic comprised 0.1-41 % of the total arsenic in seafood (Vaessen and van Ooik, 1989). Buchet et al. (1994) found that, on average, 3 % of the total arsenic in mussels was inorganic.
In contrast, terrestrial foods often have a higher proportion of inorganic arsenic. In a UK study, total arsenic concentrations in pure baby rice ranged from 0.120 to 0.470 mg/kg with a median of 0.220 mg/kg while inorganic arsenic levels ranged from 0.060 to 0.160 mg/kg, with a median of 0.110 mg/kg. The percentage of inorganic to total arsenic ranged from 33 % to 68 % with a median of 57 % (Meharg et al., 2008).
In a Swedish study, the mean concentration of total arsenic in long grain brown rice of 0.240 mg/kg was similar to that of parboiled white rice at 0.210 mg/kg, whereas white rice contained considerably less arsenic (0.100 mg/kg). The concentration of inorganic arsenic averaged 0.110 mg/kg, or 64 % of the total arsenic (Jorhem et al., 2008).
Arsenic content in rice has also been analysed in a Spanish study (Torres-Escribano et al., 2008), where the mean concentration in the 31 samples of European origin was 0.197 mg/kg. This value was close to the mean value of 0.18 mg/kg found in 7 samples of European rice in a UK study (Williams et al., 2005). Torres-Escribano and colleagues also evaluated the inorganic arsenic level in raw rice originating from either Europe or Asian countries and found that it ranged from 0.027 to 0.253 mg/kg. The percentage of inorganic arsenic over the total arsenic varied between 27 and 93 %. Williams et al. (2005) analysed 51 samples of raw rice produced in Europe, Asia and the USA and showed a variation
Arsenic in food
33 EFSA Journal 2009; 7(10):1351
of inorganic arsenic ranging from 10 to 86 %. Both studies also observed that the mean concentration of inorganic arsenic is 1.7 or 1.8 times higher in brown rice than in white rice.
Some common food items (bread, rice, milk, pork meat, chicken meat, cabbage and potatoes) from the Slovak Republic were collected and analysed for total arsenic concentrations. Rice contained the highest average concentration of arsenic of 0.158 mg/kg. The major proportion of the arsenic in rice seemed to be inorganic. Also, potatoes at 0.033 mg/kg and poultry meat at 0.028 mg/kg contributed to arsenic exposure, although arsenobetaine accounted for more than 80 % in the poultry meat. When the potatoes were peeled the concentrations of arsenic were lowered to 0.0023 mg/kg (Lindberg et al., 2006).
Schoof et al. (1999) reported on the analysis of 40 commodities expected to account for 90 % of dietary inorganic arsenic intake by measuring the amount of inorganic arsenic in the foods. Consistent with earlier studies, total arsenic concentrations were highest in the seafood ranging from 0.160 mg/kg in freshwater fish to 2.360 mg/kg in marine fish, with average inorganic arsenic from less than 0.001 to 0.002 mg/kg. The highest inorganic arsenic concentrations were found in raw rice at 0.074 mg/kg, followed by flour at 0.011 mg/kg, grape juice at 0.009 mg/kg, and cooked spinach at 0.006 mg/kg.
Some commercially available seaweeds, especially brown algae varieties, may have high percentages of the total arsenic present as inorganic arsenic (>50 %) (Almela et al., 2002; Laparra et al., 2003). Total arsenic concentrations ranging from 17 to 88 mg/kg dry mass were found in commercially available seaweeds (van Netten et al., 2000). The hijiki seaweed has been associated with particularly high concentrations of arsenic. The UK Food Standards Agency (FSA) analysed nine samples of hijiki and found on average total and inorganic arsenic concentrations of 110 and 77 mg/kg, respectively, in the dried product as sold (FSA, 2004). Arsenic has also been detected in several homeopathic medicines at concentrations up to 650 mg/kg (Kerr and Saryan, 1986) and in seaweed tablets and concentrates containing Spirulina and Fucus spp. at concentrations between 0.231 and 37.4 mg/kg dry mass with up to 60 % inorganic arsenic in the Spirulina tablets and up to 5 % in the Fucus tablets (Almela et al., 2006).
5.1.1. Human breast milk
The arsenic concentration in breast milk of 35 women in Izmir, Turkey, a volcanic area with high thermal activity ranged from 0.0032 to 0.0054 mg/L, with a median of 0.0042 mg/L (Ulman et al., 1998). Sternowsky et al. (2002) analysed breast milk from 36 women from three different regions in Germany on days 2, 5, 15, 30, 45, 60, 75 and 90 post partum. The sampling regions included the city of Hamburg, the rural area of Soltau, and Munster, where chemical weapons were dumped after World War II and increased concentrations of arsenic were found in soil and ground water from a military training area. While arsenic was not detected (<0.0003 mg/L) in 154 of 187 samples, the highest concentration of 0.0028 mg/L was found in a sample from the rural area of Soltau.
5.2. Current occurrence of arsenic in food: first call for data
The Data Collection and Exposure Unit (DATEX) call for data on arsenic DATEX-2008-001222 was issued by EFSA in July 2008 with a closing date of November 2008. EFSA received a total of 100,867 results from food testing representing 14 Member States and Norway. The results reported covered the period from 1995 to 2008, although the call for data was limited to the period 2003 to 2008.
22 http://www.efsa.europa.eu/EFSA/efsa_locale-1178620753812_1211902010663.htm

Arsenic in food
34 EFSA Journal 2009; 7(10):1351
5.2.1. Summary of data collected
The source of the 100,867 results reported from the 14 EU Member States and Norway is illustrated in Figure 1.
Germany provided 55 % of the data followed by the Slovak Republic (16 %) and the Czech Republic (10 %).
AT: Austria, BE: Belgium, CZ: Czech Republic, DE: Germany, DK: Denmark, EE: Estonia, ES: Spain, FI: Finland, FR: France, GB: Great Britain, HU: Hungary, NO: Norway, PL: Poland, SE: Sweden, SK: Slovak Republic
Figure 1: Distribution of samples across EU Member States and Norway
Since the last EU-wide data collection on arsenic was undertaken in 2002 (SCOOP, 2004), it was decided that the new data collection should cover the years 2003-2008. The distribution of results over the years of sampling is illustrated in Figure 2.

Arsenic in food
35 EFSA Journal 2009; 7(10):1351
Figure 2: Distribution of samples over years of sampling (note that 2008 was not a complete year of sampling)
There were 289 results reported covering the period prior to year 2000 and 19,462 samples covering the period of 2000-2002. Samples from the years prior to 2003 were excluded from further analysis, as were 3,841 samples identified during the data cleaning steps with incomplete or incorrect description of food type or value unit, or showing insufficient sensitivity of the analytical method (an LOD of more than 0.1 mg/kg, or with an LOQ of more than 0.3 mg/kg). A total of 77,275 sample results were described with sufficient detail to be included in the calculation of arsenic concentrations in the relevant food categories.
5.2.2. Distribution of samples across food categories
The food samples were classified using the aggregated food categories specified in the EFSA Concise European Food Consumption Database (EFSA concise food categories). The distribution of samples across the aggregated food categories is shown in Figure 3.

Arsenic in food
36 EFSA Journal 2009; 7(10):1351
0 4000 8000 12000 16000
01A. Cereal-based mixed dishes01B. Cereals & cereal products except 01A
02. Sugar & sugar products including chocolate03. Fats (vegetable and animal)
04A. Vegetable soups04B. Vegetables, nuts, pulses except 04A
05. Starchy roots or potatoes06. Fruits
07A. Fruit and vegetable juices07B. Soft drinks
07C. Bottled water08. Coffee, tea, cocoa
09A. Beer and substitutes09B. Wine and substitutes
09C. Other alcoholic beverages and substitutes10A. Meat and meat products and substitutes
10B. Edible offal and offal products10C. Meat based preparations
11A. Seafood and seafood products11B. Fish and fish products
11C. Fish based preparations12. Eggs
13A. Milk and dairy based drinks13B. Dairy based products
13C. Cheese14A. Miscellaneous
14B. Food for special dietary uses15. Tap water
Number of samples
Figure 3: Distribution of samples in the EFSA concise food categories
“Tap water” and “bottled water” dominated the product coverage with 20 % of the total samples. These were followed by “meat and meat products and substitutes” and “edible offal and offal products”, at 13 % and 11 % respectively, and “vegetables, nuts and pulses” at 10 %. There were fewer than 200 samples submitted covering the food categories “cereal-based mixed dishes” and “vegetable soups”.
The analysis of total arsenic was carried out for all the samples reported in Figure 3, but analysis of inorganic and organic arsenic was performed on only 919 (1.2 % of total samples) and 174 (0.2 %) of the samples, respectively.
Inorganic arsenic analysis was carried out on 221 samples from the miscellaneous food range of products, 219 samples from “seafood and seafood products”, 208 samples of “cereals and cereal products excluding cereal-based mixed dishes”, 178 samples of “fish and fish products”, and 43 samples from “fish-based preparations”, 26 samples from the “vegetables, nuts, pulses (except vegetable soup)” category, and fewer than 20 samples from the “food for special dietary uses” category, “fruits”, “dairy based products”, “meat and meat products and substitutes”, “meat based preparations” and “cereal-based mixed dishes”.
Arsenic in food
37 EFSA Journal 2009; 7(10):1351
Organic arsenic analyses were mainly reported for “fish and fish products”, and “seafood and seafood products”.
More detailed speciation analysis (i.e. analyses providing additional information about the arsenic species) was carried out on only 158 of the samples tested for inorganic and organic arsenic, resulting in different arsenic species being reported (arsenite, arsenate, arsenobetaine, dimethylarsinate, methylarsonate). Those samples belonged to the food categories of “fish and fish products”, “fish based preparations” and “seafood and seafood products”. These speciation data were included in a recently published French study (Sirot et al., 2009).
Because of the lack of organic and inorganic arsenic data for most of the food categories, the exposure assessment will be based on the data collected on total arsenic, and all the statistical analyses which follow refer to measurements of total arsenic levels. The inorganic arsenic contents have been estimated, in most cases, by multiplying the known total arsenic levels by a conversion factor derived from literature data and the available results present in the occurrence dataset on inorganic arsenic/total arsenic ratios.
5.2.3. Analytical methods used
The 77,275 original results were reported in mg/kg (87 %), in µg/kg (3.5 %), in mg/L (6 %) and in µg/L (4 %). All the measurements have been converted to mg/kg. For the measurements expressed as a volume unit, the approximate equivalence of 1 kg = 1 L has been used. Several analytical methods have been used to perform the analyses of total arsenic (Figure 4). The most common method was hydride generation atomic absorption spectrometry (HG-AAS) with 39 %, followed by electrothermal atomic absorption spectrometry (ET-AAS) with 12 % and inductively coupled plasma spectrometry (ICPMS) with 10 %. Hydride generation atomic fluorescence spectrometry (HG-AFS) and hydride generation inductively coupled plasma atomic emission spectrometry (HG-ICPAES) covered less then 1 % of the reported data. However, it should be noted that for 39 % of the samples, no analytical method was specified, i.e. no instrumental details were provided. Since so many of the results lacked a description of the analytical method, it was decided not to cross-tabulate the food matrix results with the analytical method.

Arsenic in food
38 EFSA Journal 2009; 7(10):1351
ET-AAS: Electrothermal atomic absorption spectrometry (9,628 samples analysed); HG-AAS: Hydride generation atomic absorption spectrometry (29,936 samples analysed); HG-AFS: Hydride generation atomic fluorescence spectrometry (23 samples analysed); HG-ICP-AES: Hydride generation inductively coupled plasma atomic emission spectrometry (55 samples analysed; ICPMS: Inductively coupled plasma mass spectrometry (7,706 samples analysed); XX: analytical method not specified (29,927 samples analysed).
Figure 4: Distribution of analytical methods used
The LOD and LOQ for the analyses varied with the analytical technique (Figure 5), the food matrix (Figure 6) and the laboratory. In the figures, the box indicates 25th and 75th percentile with a line at the median, and the ends of the whiskers represent the 5th and 95th percentiles.
0 0.01 0.02 0.03 0.04 0.05 0.06 0.07
ET-AAS
HG-AAS
HG-AFS
ICPMS
XX
Limit of detection (mg/kg)
ET-AAS: Electrothermal atomic absorption spectrometry; HG-AAS: Hydride generation atomic absorption spectrometry; HG-AFS: Hydride generation atomic fluorescence spectrometry; ICPMS: Inductively coupled plasma mass spectrometry; XX: analytical method not specified. Limit of detection (mg/kg) expressed as fresh mass.
Figure 5: Distribution of the limit of detection according to the analytical method used as reported by the laboratories.

Arsenic in food
39 EFSA Journal 2009; 7(10):1351
The lowest LODs were reported by the laboratories using HG-AAS and ET-AAS with a median of 0.003 mg/kg. ICPMS also shows very low LODs with a median of 0.006 mg/kg. Although the AAS techniques reported the lowest LODs, ICPMS is certainly the most sensitive of the three techniques. It should be noted that LOD and LOQ varied with the analytical technique, the sample weight, the laboratory and the food matrix. However, performance characteristics for the analytical determination of total arsenic are set by legislation only for the analysis of water for human consumption. There is no current legislation defining the performance characteristics for analytical methods applied to any other food groups; laboratories are therefore free to modify the analytical methods to be fit for purpose for the particular set of samples tested, which might explain some of the differences seen. The LOD variation for HG-ICPAES is not presented in Figure 5 because of the few data reported (55 sample analysis) with the median and 95th percentile values for LOD overlapping at 0.1 mg/kg.
Performance characteristics for the analytical determination of total arsenic are set by legislation only in the case of the analysis of water for human consumption. There is no current legislation defining performance characteristics for analytical methods applied to any other food groups; this lack of guidelines probably contributes to the wide spread of LOD values reported in the current data set.
Figure 6: Distribution of the limit of detection according to the aggregated EFSA concise food categories
Most of the aggregated food categories show a considerable spread in the LODs reported. The lowest LODs were for the liquid products (tap and bottled water, wine and other alcoholic beverages) with a median from 0.0003 to 0.001 mg/kg, compared to between 0.003 and 0.01 mg/kg for solid food. This reflects the additional matrix problems experienced with solid samples. With regard to fish and seafood products, cereal and cereal products and food for special dietary uses, high LODs can be noted, with medians of 0.01, 0.008 and 0.007 mg/kg; these samples generally contain high arsenic levels and presumably low LODs for these food categories were not considered necessary by the contributing laboratories.
The results reported are not only food matrix dependent but are influenced by the analytical method used as well as differences in individual laboratory protocols. The target LOD of the method is often
0 0.01 0.02 0.03 0.04 0.05 0.06 0.07
01. Cereals & cereal products
02. Sugar, sugar products and chocolate
03. Fats (vegetable and animal)
04. Vegetables, nuts, pulses
05. Starchy roots or potatoes
06. Fruits
07. Juices, soft drinks and bottled water
08. Coffee, tea , cocoa
09. Alcoholic beverages
10. Meat, meat products and offals
11. Fish and seafood
12. Eggs
13. Milk and dairy based products
14. Miscellaneous/Food for special use
15. Tap water
Limit of detection (mg/kg)

Arsenic in food
40 EFSA Journal 2009; 7(10):1351
set by a laboratory to fulfil particular legislative requirements. Consequently, the extra cost and time to fine-tune the method to achieve optimally low LODs may not be warranted, and hence is not pursued. This is perfectly satisfactory for routine monitoring purposes. It does, however, present problems when results are used to calculate human exposure because much of the data is reported as less than the LOD (even though the technique would be capable of providing quantitative data).
As previously mentioned, samples were excluded during the data cleaning steps if the laboratory reported an unacceptably high LOD for their method. Thus, 877 samples analysed by laboratories reporting an LOD of more than 0.1 mg/kg (or an LOQ of more than 0.3 mg/kg) were excluded from the data set.
5.2.4. Occurrence data by food category
In total, the number of samples reported with quantified results was 34 % out of 77,275 total samples, ranging from 16 % for fruits to 93 % for fish and seafood products (Figure 7). When quantified results are below 40 % the World Health Organization Global Environment Monitoring System - Food Contamination Monitoring and Assessment Programme (GEMS/Food) recommends that the lower and upper bounds be calculated (WHO, 2003). The Lower Bound (LB) is obtained by assigning a value of zero (minimum possible value) to all the samples reported as <LOD or <LOQ. The Upper Bound (UB) is obtained by assigning the value of LOD to values reported as <LOD and LOQ to values reported as <LOQ (maximum possible value), depending on whether LOD or LOQ is reported by the laboratory.
0 20 40 60 80 100
01.Cereals and cereal products02.Sugar and sugar products, chocolate
03.Fats (vegetable and animal)04.Vegetables, nuts and pulses
05.Starchy roots or potatoes06.Fruits
07.Juices, soft drinks and bottled water08.Coffee, tea, cocoa
09.Alcoholic beverages10.Meat and meat products, offal
11.Fish and seafood12.Eggs
13.Milk and dairy based products14.Miscellaneous and special dietary foods
15.Tap water
Proportion of samples %Non detected (<LOD) Non quantified (<LOQ) Numerical value
LOD: limit of detection; LOQ: limit of quantification
Figure 7: Proportion of samples with non detected, non quantified and quantified results in broad food categories
In Figure 7 there is not always a distinction between the use of the LOD or the LOQ. Some laboratories always report results other than quantified as being less than LOQ even if they are below the LOD.

Arsenic in food
41 EFSA Journal 2009; 7(10):1351
Sampling adjustment factors (SAF) calculated from the German Nutrition Survey (Mensink and Beitz., 2004) were applied when aggregating food sub-category averages to category averages in order to fit the information structure of the Concise European Food Consumption database (EFSA, 2008a). The relative consumption of food sub-classes in the respective food sub-category was used to calculate a percentage for the respective SAF to correct for the unbalanced proportion of samples analysed in food subcategories in relation to their actual dietary contribution. In addition, a low arbitrary SAF was assigned to some rarely consumed food sub-categories not captured by the methodology used in the German survey.
The GEMS/Food Consumption Cluster Diet information (FAO/WHO, 2006) also provides equivalent SAFs. Those values were checked previously for some food groups against the calculated SAFs from the German survey and they were found to be of similar magnitude (EFSA, 2009a). Nevertheless, the GEMS/Food database is based on the Codex Alimentarius standardised food classification system and therefore refers primarily to raw food commodities. For this reason the data cannot be used to adjust means for all EFSA categories.
SAFs as reported in the respective occurrence tables (from Table 6 to Table 20), were applied at sub-class and sub-category level as described in detail in Table 5a and 5b, respectively.
Adjusted mean was calculated when a food sub-category comprised any sub-classes; in that case the SAF of each sub-class was corrected by the relative contribution of the subcategory to the overall food category (Table 5a). At food category level, SAFs, as reported in the occurrence tables (from Table 6 to Table 20), were applied to the adjusted or unadjusted means of the food sub-categories to derive the overall adjusted mean of the food category to which they belonged.
Table 5a: An example of the use of sampling adjustment factors (SAFs) for deriving adjusted mean values (mg/kg) for food sub-categories
Food description N SAF Mean Calculation Adjusted Mean
Sub classes
Fruit juices 962 10% 0.0101 (0.10/ 0.15)× 0.0101 0.0067+ Vegetables juices 123 1% 0.01 (0.01/0.15) × 0.01 0.0007+ Fruit & vegetable juices 37 4% 0.0207 (0.04/0.15) × 0.0207 0.0055=
Sub category 07.A Fruit & vegetable juices 1122 15% 0.0104 0.0129
N: number of samples; SAF: sampling adjustment factor Note that italics and the different grey colours refer to sub category/food category.
Table 5b: An example of the use of sampling adjustment factors for deriving adjusted mean (mg/kg) for food categories
Food description N SAF Mean Calculation Adjusted Mean
Sub categories
07.A Fruit & vegetable juices 1122 15% 0.0129(a) 0.15×0.0129 0.0019+ 07.B Soft drinks 349 15% 0.0132 0.15×0.0132 0.0020+
07.C Bottled water 6723 70% 0.0041 0.7×0.0041 0.0029= Food category
07. Total for Juices, soft drinksand bottled water 8194 100% 0.0068
N: number of samples; SAF: sampling adjustment factor (a): Adjusted mean derived from sub food groups calculation (Table 5a). Note that italics and the different grey colours refer to sub category/food category.
Tables 6 to 20 report the data for aggregated and detailed food categories. Statistical descriptors include median, mean and maximum concentrations as well as the 5th and 95th percentile concentrations (abbreviated as P5 and P95, respectively). N is the number of results reported. If the

Arsenic in food
42 EFSA Journal 2009; 7(10):1351
number of results is below 130 (N<130), the statistical descriptor P95 should only be considered indicative due to the limited number of data (EFSA, 2008a). The column <LOD indicates the percentage of results below the LOD or the LOQ. The SAF was applied only when calculating the adjusted aggregated category means in Table 21. The unadjusted means are shown in the respective tables with results for category totals. For ease of reading and comparing data, the number of figures shown after the decimal point in the following tables is the same for each food category. They do not represent significant figures and hence should not be interpreted as reflecting the precision of the data.
A special analysis of the very high values was carried out because in some food categories they heavily influenced the estimated mean value. Those very high reported results did not show a uniform trend and were spread across reporting countries and food groups. Where the arsenic concentration of a sample within a food category was 10 times higher than any other reported value, the result was considered as an outlier and excluded from the data set. Nine samples have been excluded from the data set following this criterion and they will be described in detail for each food category.
The “cereals and cereal products” category (5,133 samples) comprises two major sub-categories, of which one is split into six food sub-classes (Table 6). Very few results were reported covering the cereal-based mixed dishes category, typically including products like pizza and lasagne.
Table 6: Statistical description of concentrations of arsenic for food category “01. Cereal and cereal products” in mg/kg
Food Subgroup N <LOD(a) Type P5 Median Mean P95 Max SAF Cereal-based mixed dishes 86 38% LB
UB 0.0000 0.0014
0.0029 0.0096
0.0157 0.0283
0.0960 0.1133
0.1640 0.2300
23%
Cereal grains excluding rice 2215 77% LB UB
0.0000 0.0060
0.0000 0.0262
0.0147 0.0405
0.0600 0.0700
5.6620 5.6620
22%
Rice grains 1122 9.8% LB UB
0.0000 0.0240
0.1100 0.1100
0.1362 0.1424
0.3600 0.3600
1.1800 1.1800
4.5%
Cereal products (not specified type)
379 58% LB UB
0.0000 0.0050
0.0000 0.0200
0.0133 0.0284
0.0750 0.0750
0.1800 0.1800
15%
Cereal products, excluding rice based products
1004 60% LB UB
0.0000 0.0030
0.0000 0.0120
0.0107 0.0297
0.0528 0.0750
0.8900 0.8900
29%
Rice based products 314 28% LB UB
0.0000 0.0200
0.1000 0.1000
0.1422 0.1659
0.3900 0.3900
1.9800 1.9800
4.5%
Bran and germ 13 - LB UB
0.7100 0.7100
1.6300 1.6300
2.1338 2.1338
6.2400 6.2400
6.2400 6.2400
2.0%
Cereals and cereal products excluding dishes
5047 54% LB UB
0.0000 0.0050
0.0000 0.0400
0.0542 0.0733
0.2200 0.2250
6.2400 6.2400
77%
Total for Cereals and cereal products
5133 54% LB UB
0.0000 0.0047
0.0000 0.0400
0.0536 0.0725
0.2200 0.2200
6.2400 6.2400
100%
N: number of samples; LOD: limit of detection; LB: lower bound; UB: upper bound; P5: 5th percentile; P95: 95th percentile; Max: maximum; SAF: sampling adjustment factor The number of figures after the decimal point is the same for all food categories and does not reflect significant figures for each reported value. If N<130 than the calculated P95 should be considered only as an indicative value due to limited number of data (EFSA, 2008a). (a): <LOD: indicates the percentage of results below the LOD or the limit of quantification.
As also shown in previous studies (Sun et al., 2008, 2009), “rice grains” and “rice based products” contain very high mean levels of arsenic with upper bound means of 0.1424 and 0.1659 mg/kg respectively. The maximum concentration of arsenic was found in bran with a value of 6.24 mg/kg. Samples classified in this category did not contain any details on their cereal of origin, and it is possible that the high-arsenic bran products were actually obtained from rice.

Arsenic in food
43 EFSA Journal 2009; 7(10):1351
Two samples from this category were identified as outliers: one sample of bread and one of wheat flour from the category of “cereal products excluding rice based products” with arsenic contents of 12.73 and 5.77 mg/kg, respectively. They exceeded any other sample by more than ten times, and, if included in the data set, would have doubled the current reported mean for the whole sub-group.
The “sugar and sugar products” category (1,961 samples) comprises two sub-classes (Table 7).
Table 7: Statistical description of concentrations of arsenic for food category “02. Sugar and sugar products” in mg/kg
Food Subgroup N <LOD(a) Type P5 Median Mean P95 Max SAF Chocolate and chocolate based products
558 66% LB UB
0.0000 0.0085
0.0000 0.0200
0.0125 0.0313
0.0400 0.0700
0.3850 0.3850
33%
Other sugar and sugar products
1403 79% LB UB
0.0000 0.0007
0.0000 0.0120
0.0140 0.0324
0.0500 0.0800
1.0700 1.0700
67%
Total for Sugar, sugar products and chocolate
1961 75% LB UB
0.0000 0.0020
0.0000 0.0200
0.0135 0.0321
0.0497 0.0800
1.0700 1.0700
100%
N: number of samples; LOD: limit of detection; LB: lower bound; UB: upper bound; P5: 5th percentile; P95: 95th percentile; Max: maximum; SAF: sampling adjustment factor The number of figures after the decimal point is the same for all food categories and does not reflect significant figures for each reported value. If N<130 than the calculated P95 should be considered only as an indicative value due to limited number of data (EFSA, 2008a). (a): <LOD: indicates the percentage of results below the LOD or the limit of quantification.
The maximum value recorded was for a honey sample which contained 1.07 mg/kg of total arsenic.
The “fats” category consists of three sub-classes with a total of 628 analytical results reported (Table 8). “Butter” has been listed separately from other animal fats and oils to make it clear that this sub-category should be reported under fats and not under dairy products.
Table 8: Statistical description of concentrations of arsenic for food category “03. Fats (animal and vegetable)” in mg/kg
Food Subgroup N <LOD(a) Type P5 Median Mean P95 Max SSAF Animal fats and oils 142 69% LB
UB 0.0000 0.0020
0.0000 0.0100
0.0075 0.0147
0.0400 0.0400
0.1200 0.1200
23%
Vegetable fats and oils 232 78% LB UB
0.0000 0.0050
0.0000 0.0135
0.0062 0.0337
0.0400 0.1000
0.0990 0.2000
55%
Butter 254 71% LB UB
0.0000 0.0020
0.0000 0.0080
0.0055 0.0116
0.0380 0.0400
0.0970 0.0970
22%
Total for Fats (vegetable and animal)
628 73% LB UB
0.0000 0.0030
0.0000 0.0100
0.0062 0.0205
0.0400 0.1000
0.1200 0.2000
100%
N: number of samples; LOD: limit of detection; LB: lower bound; UB: upper bound; P5: 5th percentile; P95: 95th percentile; Max: maximum; SAF: sampling adjustment factor The number of figures after the decimal point is the same for all food categories and does not reflect significant figures for each reported value. If N<130 than the calculated P95 should be considered only as an indicative value due to limited number of data (EFSA, 2008a). (a): <LOD: indicates the percentage of results below the LOD or the limit of quantification.
It should be noted that in the “Vegetable fats and oil” food category, the two different maximum levels are shown. This is because, in the upper bound maximum the values refer to the LOQ of the reporting laboratory’s method used for the analysis and the value was reported as a non quantified measurement; the maximum for the lower bound, however, refers to a measured value.

Arsenic in food
44 EFSA Journal 2009; 7(10):1351
The “vegetable, nuts and pulses” category, with a total of 7,577 analytical results, includes two major sub-categories, of which one is split into eleven sub-classes (Table 9).
Table 9: Statistical description of concentrations of arsenic for food category “04. Vegetables, nuts and pulses” in mg/kg
Food Subgroup N <LOD(a)Type P5 Median Mean P95 Max SAF Vegetable soups 22 59% LB
UB 0.0000 0.0007
0.0000 0.0045
0.0050 0.0110
0.0220 0.0500
0.0260 0.0500
1.0%
Leafy vegetables 1232 58% LB UB
0.0000 0.0030
0.0000 0.0100
0.0162 0.0235
0.0560 0.0580
1.0000 1.0000
21%
Mushrooms 710 57% LB UB
0.0000 0.0030
0.0000 0.0145
0.0611 0.0699
0.1200 0.1200
19.200 19.200
2.0%
Fresh herbs 367 41% LB UB
0.0000 0.0039
0.0070 0.0130
0.0254 0.0310
0.1300 0.1300
0.5375 0.5375
1.0%
Brassica vegetables 849 74% LB UB
0.0000 0.0009
0.0000 0.0070
0.0029 0.0108
0.0220 0.0300
0.1530 0.1530
13%
Pulses (Legumes) 523 73% LB UB
0.0000 0.0011
0.0000 0.0100
0.0062 0.0153
0.0200 0.0500
0.3430 0.3430
13%
Nuts 572 86% LB UB
0.0000 0.0070
0.0000 0.0200
0.0079 0.0363
0.0400 0.1140
0.4440 0.4440
1.0%
Other vegetables and vegetable products
1643 70% LB UB
0.0000 0.0010
0.0000 0.0100
0.0106 0.0192
0.0300 0.0500
0.5600 0.5600
22%
Root vegetables 656 74% LB UB
0.0000 0.0030
0.0000 0.0100
0.0044 0.0145
0.0210 0.0400
0.1280 0.1280
16%
Stem vegetables 272 89% LB UB
0.0000 0.0030
0.0000 0.0100
0.0103 0.0211
0.0500 0.1000
0.4000 0.4000
4.0%
Oilseeds 528 57% LB UB
0.0000 0.0076
0.0000 0.0295
0.0450 0.0643
0.1480 0.1500
5.7000 5.7000
4.0%
Dried vegetables 203 5.4% LB UB
0.0000 0.0300
0.2600 0.2600
0.3347 0.3363
0.7840 0.7840
4.9000 4.9000
2.0%
Vegetables, nuts, pulses except soups
7555 66% LB UB
0.0000 0.0015
0.0000 0.0100
0.0262 0.0367
0.1050 0.1140
19.200 19.200
99%
Total for Vegetables, nuts, pulses
7577 66% LB UB
0.0000 0.0015
0.0000 0.0100
0.0261 0.0366
0.1050 0.1140
19.200 19.200
100%
N: number of samples; LOD: limit of detection; LB: lower bound; UB: upper bound; P5: 5th percentile; P95: 95th percentile; Max: maximum; SAF: sampling adjustment factor The number of figures after the decimal point is the same for all food categories and does not reflect significant figures for each reported value. If N<130 than the calculated P95 should be considered only as an indicative value due to limited number of data (EFSA, 2008a). (a): <LOD: indicates the percentage of results below the LOD or the limit of quantification.
The “dried vegetable” arsenic concentrations are shown as such in Table 9, but were converted to a fresh mass basis before including in Table 21 by assuming a dried/fresh mass ratio of 10 %.
Most of the samples included in this sub-group were dried mushrooms, which further explains the high mean arsenic level of 0.3363 mg/kg. Wild edible mushrooms can contain elevated arsenic levels (e.g. Pelkonen et al., 2006) which could explain the presence of around 50 samples with a measured arsenic level higher than 0.1 mg/kg.
The “starchy roots and potatoes” category includes two sub-classes, with a total of 690 analytical results reported (Table 10).

Arsenic in food
45 EFSA Journal 2009; 7(10):1351
Table 10: Statistical description of concentrations of arsenic for food category “05. Starchy roots and potatoes” in mg/kg
Food Subgroup N <LOD(a) Type P5 Median Mean P95 Max SAF Peeled potatoes 72 17% LB
UB 0.0000 0.0006
0.0015 0.0015
0.0019 0.0020
0.0053 0.0053
0.0073 0.0073
58.3%
Other potatoes 618 85% LB UB
0.0000 0.0017
0.0000 0.0100
0.0033 0.0156
0.0160 0.0500
0.2270 0.2270
41.7%
Total for Starchy roots and potatoes
690 78% LB UB
0.0000 0.0011
0.0000 0.0100
0.0031 0.0142
0.0121 0.0500
0.2270 0.2270
100%
N: number of samples; LOD: limit of detection; LB: lower bound; UB: upper bound; P5: 5th percentile; P95: 95th percentile; Max: maximum; SAF: sampling adjustment factor The number of figures after the decimal point is the same for all food categories and does not reflect significant figures for each reported value. If N<130 than the calculated P95 should be considered only as an indicative value due to limited number of data (EFSA, 2008a). (a): <LOD: indicates the percentage of results below the LOD or the limit of quantification.
The maximum value in the sub-class of “other potatoes” (unpeeled potatoes only) is 0.227 mg/kg while the maximum reported value is 0.0073 mg/kg in the case of peeled potatoes.
The “fruit” category was split into three sub-classes comprising a total of 2,478 samples (Table 11).
Table 11: Statistical description of concentrations of arsenic for food category “06. Fruits” in mg/kg
Food Subgroup N <LOD(a) Type P5 Median Mean P95 Max SAF Berries and small fruits 571 84% LB
UB 0.0000 0.0020
0.0000 0.0100
0.0025 0.0129
0.0110 0.0250
0.2900 0.2900
26%
Other fruits 1763 85% LB UB
0.0000 0.0012
0.0000 0.0100
0.0063 0.0172
0.0290 0.0412
2.1950 2.1950
70%
Dried fruits 144 71% LB UB
0.0000 0.0070
0.0000 0.0210
0.0132 0.0269
0.0550 0.0650
0.2200 0.2200
4.0%
Total for Fruits 2478 84% LB UB
0.0000 0.0013
0.0000 0.0100
0.0058 0.0168
0.0300 0.0400
2.1950 2.1950
100%
N: number of samples; LOD: limit of detection; LB: lower bound; UB: upper bound; P5: 5th percentile; P95: 95th percentile; Max: maximum; SAF: sampling adjustment factor The number of figures after the decimal point is the same for all food categories and does not reflect significant figures for each reported value. If N<130 than the calculated P95 should be considered only as an indicative value due to limited number of data (EFSA, 2008a). (a): <LOD: indicates the percentage of results below the LOD or the limit of quantification.
The “dried fruit” arsenic concentrations are shown as such in Table 11, but were converted to a fresh mass basis before inclusion in Table 21 by assuming a dried/fresh mass ratio of 10 %. The highest concentration of 2.195 mg/kg was recorded for an apricot (fresh mass) sample.
The “juices, soft drinks and bottled water” category includes three sub-categories of which one is split to three sub-classes, with a total of 8,194 samples analysed (Table 12).

Arsenic in food
46 EFSA Journal 2009; 7(10):1351
Table 12: Statistical description of concentrations of arsenic for food category “07. Juices, soft drinks and bottled water” in mg/kg
Food Subgroup N <LOD(a) Type P5 Median Mean P95 Max SAF Fruit juices 962 80% LB
UB 0.0000 0.0009
0.0000 0.0070
0.0024 0.0101
0.0130 0.0200
0.0790 0.1000
10%
Vegetables juices 123 82% LB UB
0.0000 0.0014
0.0000 0.0070
0.0013 0.0100
0.0038 0.0200
0.0800 0.0800
1.0%
Fruit and vegetable juices 37 70% LB UB
0.0000 0.0020
0.0000 0.0100
0.0116 0.0207
0.0860 0.0860
0.1250 0.1250
4.0%
Fruit and vegetable juices 1122 80% LB UB
0.0000 0.0010
0.0000 0.0070
0.0025 0.0104
0.0130 0.0230
0.1250 0.1250
15%
Soft drinks 349 74% LB UB
0.0000 0.0005
0.0000 0.0050
0.0044 0.0132
0.0200 0.1000
0.1500 0.1500
15%
Bottled water 6723 67% LB UB
0.0000 0.0005
0.0000 0.0010
0.0023 0.0041
0.0080 0.0100
0.2700 0.2700
70%
Total for Juices, soft drinks and bottled water
8194 69% LB UB
0.0000 0.0005
0.0000 0.0015
0.0024 0.0053
0.0090 0.0200
0.2700 0.2700
100%
N: number of samples; LOD: limit of detection; LB: lower bound; UB: upper bound; P5: 5th percentile; P95: 95th percentile; Max: maximum; SAF: sampling adjustment factor The number of figures after the decimal point is the same for all food categories and does not reflect significant figures for each reported value. If N<130 than the calculated P95 should be considered only as an indicative value due to limited number of data (EFSA, 2008a). (a): <LOD: indicates the percentage of results below the LOD or the limit of quantification.
In the case of natural mineral water only, a ML of 0.010 mg/L of arsenic is specified in the legislation. Only 0.04 % of the bottled water samples exceeded this ML.
The “coffee, tea and cocoa” category is split into four sub-classes comprising a total of 951 samples (Table 13).
Table 13: Statistical description of concentrations of arsenic for food category “08. Coffee, tea and cocoa” in mg/kg
Food Subgroup N <LOD(a) Type P5 Median Mean P95 Max SAF Coffee (Powder) 103 67% LB
UB 0.0000 0.0050
0.0000 0.0120
0.0157 0.0235
0.0740 0.0740
0.2400 0.2400
60%
Tea and other infusions (Powder or dry leaves)
586 54% LB UB
0.0000 0.0005
0.0000 0.0105
0.0595 0.0666
0.2700 0.2700
1.4400 1.4400
26%
Cocoa (Powder or cocoa bean)
245 50% LB UB
0.0000 0.0100
0.0100 0.0500
0.0409 0.0683
0.1550 0.1550
0.8300 0.8300
14%
Coffee, tea, cocoa expressed as liquid
17 5.9% LB UB
0.0000 0.0005
0.0013 0.0013
0.0044 0.0044
0.0400 0.0400
0.0400 0.0400
-%
Total for Coffee, tea, cocoa
951 54% LB UB
0.0000 0.0006
0.0000 0.0260
0.0490 0.0613
0.2150 0.2150
1.4400 1.4400
100%
N: number of samples; LOD: limit of detection; LB: lower bound; UB: upper bound; P5: 5th percentile; P95: 95th percentile; Max: maximum; SAF: sampling adjustment factor The number of figures after the decimal point is the same for all food categories and does not reflect significant figures for each reported value. If N<130 than the calculated P95 should be considered only as an indicative value due to limited number of data (EFSA, 2008a). (a): <LOD: indicates the percentage of results below the LOD or the limit of quantification.
The results are expressed on a dry mass basis in Table 13, but the total amount of arsenic ending up in a cup of tea, coffee or cocoa is the sum of contributions of arsenic from the powder (dry mass of the respective food) and the liquid used to prepare it. For example, in the case of a cup of warm chocolate, the arsenic contribution comes from the 20 g of cocoa powder and the 180 mL of milk. The same

Arsenic in food
47 EFSA Journal 2009; 7(10):1351
calculation was applied for a cup of tea, where the arsenic contribution derives from 2 g of tea leaves and 120 mL of water; and in the case of a cup of coffee where arsenic comes from 7 g of coffee powder and 120 mL of water. To account for the contribution of arsenic from water and milk, the values reported in the database for the arsenic mean (upper and lower bound) from “milk and dairy drinks” (Table 18) and “tap water” (Table 20) were used. The dilutions used here for tea and coffee were the same as those used in the previous scientific opinion of CONTAM Panel on polycyclic aromatic hydrocarbons in food (EFSA, 2008b), while the cocoa dilution is estimated from the manufacturers’ recommendations. Although somewhat arbitrary, with large individual and country-by-country variations, the dilutions at least give an indication of consumer behaviour and resultant arsenic exposure from these drinks.
Seventeen samples were already reported as liquids (from category “Coffee, tea, cocoa expressed as liquid”) and described as “coffee and tea infusion” but with no further details about the amount of coffee or tea powder and water used for preparation. Therefore, in order to have a homogeneous set of samples and to be consistent with the above mentioned dilutions for tea, coffee and cocoa, those samples have been excluded from the further calculations for the exposure assessment.
The maximum value of arsenic content reported is 1.440 mg/kg and refers to a tea sample in a form of powder or dry leaves.
The “alcoholic beverages” category (1,857 samples) is split into three sub-classes (Table 14).
Table 14: Statistical description of concentrations of arsenic for food category “09. Alcoholic beverages” in mg/kg
Food Subgroup N <LOD(a)Type P5 Median Mean P95 Max SAF Beer and substitutes 602 72% LB
UB 0.0000 0.0010
0.0000 0.0080
0.0054 0.0161
0.0180 0.0780
0.4500 0.4500
79%
Wine and substitutes 1006 50% LB UB
0.0000 0.0023
0.0010 0.0083
0.0061 0.0110
0.0220 0.0240
0.1110 0.1110
20%
Other alcoholic beverages and substitutes
249 49% LB UB
0.0000 0.0002
0.0002 0.0050
0.0085 0.0115
0.0200 0.0300
0.6860 0.6860
1.0%
Total for Alcoholic beverages
1857 57% LB UB
0.0000 0.0010
0.0000 0.0075
0.0062 0.0127
0.0220 0.0300
0.6860 0.6860
100%
N: number of samples; LOD: limit of detection; LB: lower bound; UB: upper bound; P5: 5th percentile; P95: 95th percentile; Max: maximum; SAF: sampling adjustment factor. The number of figures after the decimal point is the same for all food categories and does not reflect significant figures for each reported value. If N<130 than the calculated P95 should be considered only as an indicative value due to limited number of data (EFSA, 2008a). (a): <LOD: indicates the percentage of results below the LOD or the limit of quantification.
The highest arsenic concentration of 0.686 mg/kg was reported for a sample of sparkling wine produced with fermented fruits.
The “meat, meat products and offal” category comprises a total of 19,024 results in three sub-categories, of which two are sub-divided into a further six and four sub-classes (Table 15).

Arsenic in food
48 EFSA Journal 2009; 7(10):1351
Table 15: Statistical description of concentrations of arsenic for food category “10. Meat, meat products and offal” in mg/kg
Food Subgroup N <LOD(a) Type P5 Median Mean P95 Max SAF Bovine, sheep and goat meat
2102 77% LB UB
0.0000 0.0020
0.0000 0.0100
0.0039 0.0137
0.0220 0.0300
0.0990 0.2000
20%
Pig meat 2013 81% LB UB
0.0000 0.0030
0.0000 0.0090
0.0037 0.0128
0.0200 0.0500
0.1000 0.1000
42%
Poultry meat 2099 73% LB UB
0.0000 0.0030
0.0000 0.0100
0.0050 0.0137
0.0240 0.0400
0.9800 0.9800
12%
Game meat 1451 69% LB UB
0.0000 0.0030
0.0000 0.0100
0.0075 0.0174
0.0310 0.0470
0.8000 0.8000
0.20%
Other meat 504 58% LB UB
0.0000 0.0028
0.0000 0.0080
0.0077 0.0141
0.0420 0.0450
0.1600 0.2000
0.20%
Processed meat products 1721 68% LB UB
0.0000 0.0030
0.0000 0.0100
0.0051 0.0162
0.0230 0.0600
0.1510 0.1510
16%
Meat, meat products and substitutes
9890 73% LB UB
0.0000 0.0030
0.0000 0.0100
0.0050 0.0145
0.0250 0.0400
0.9800 0.9800
91%
Liver bovine, sheep, pig, poultry, horse
4256 80% LB UB
0.0000 0.0030
0.0000 0.0100
0.0036 0.0129
0.0200 0.0400
0.4000 0.4000
5.0%
Kidney bovine, sheep, pig, poultry, horse
3964 76% LB UB
0.0000 0.0020
0.0000 0.0150
0.0060 0.0177
0.0350 0.0500
0.9630 0.9630
0.20%
Liver and kidney of game animals
284 71% LB UB
0.0000 0.0010
0.0000 0.0120
0.0085 0.0206
0.0400 0.0700
0.1600 0.1600
0.10%
Other offal products 252 71% LB UB
0.0000 0.0032
0.0000 0.0100
0.0061 0.0156
0.0400 0.0400
0.1300 0.1300
2.0%
Edible offal and offal products
8756 78% LB UB
0.0000 0.0020
0.0000 0.0100
0.0049 0.0154
0.0260 0.0400
0.9630 0.9630
7.3%
Meat based preparations 378 46% LB UB
0.0000 0.0020
0.0036 0.0100
0.0121 0.0185
0.0390 0.0480
1.0500 1.0500
2.0%
Total for Meat and meat products, offal
19024 75% LB UB
0.0000 0.0030
0.0000 0.0100
0.0051 0.0150
0.0260 0.0400
1.0500 1.0500
100%
N: number of samples; LOD: limit of detection; LB: lower bound; UB: upper bound; P5: 5th percentile; P95: 95th percentile; Max: maximum; SAF: sampling adjustment factor The number of figures after the decimal point is the same for all food categories and does not reflect significant figures for each reported value. If N<130 than the calculated P95 should be considered only as an indicative value due to limited number of data (EFSA, 2008a). (a): <LOD: indicates the percentage of results below the LOD or the limit of quantification.
Three samples were excluded from the data set because they exceeded by ten times any other sample in their respective sub-class: (i) a sample of pig meat reported to contain 3.01 mg/kg of arsenic; (ii) a sample of frog meat (from the category “other meat”) reported to contain 2.31 mg/kg of arsenic; and (iii) a sample of pig liver (from the sub-class “liver bovine, sheep, pig, poultry, horse”) with a reported arsenic content of 3.09 mg/kg.
The maximum value recorded in the category “meat, meat products and offal” was for a product based on meat, with a total arsenic concentration of 1.05 mg/kg.
The “fish and seafood” category consists of a total of 5,083 results in three sub-categories, of which the one on “seafood and seafood products” is sub-divided into a further four sub-classes (Table 16).

Arsenic in food
49 EFSA Journal 2009; 7(10):1351
Table 16: Statistical description of concentrations of arsenic for food category “11. Fish and seafood” in mg/kg
Food Subgroup N <LOD(a) Type P5 Median Mean P95 Max SAF Bivalve molluscs 664 0.30% LB
UB 0.8800 0.8800
2.4044 2.4044
3.4075 3.4078
7.7610 7.7610
150.00 150.00
0.10%
Cephalopods 189 1.1% LB UB
0.0540 0.0560
1.1000 1.1000
3.9223 3.9232
14.600 14.600
66.800 66.800
3.0%
Crustaceans 344 2.0% LB UB
0.1180 0.1180
2.0290 2.0290
5.6907 5.6910
26.000 26.000
100.40 100.40
0.10%
Other seafood and seafood products
150 11% LB UB
0.0000 0.0030
1.5950 1.5950
11.922 11.923
45.300 45.300
68.797 68.797
0.80%
Seafood and seafood products
1347 2.0% LB UB
0.0540 0.0590
2.2000 2.2000
5.0111 5.0115
21.270 21.270
150.00 150.00
4.0%
Fish and fish products 3503 8.3% LB UB
0.0000 0.0100
0.5800 0.5800
1.4526 1.4549
5.0275 5.0275
195.00 195.00
95%
Fish based preparations 233 9.9% LB UB
0.0000 0.0230
0.5810 0.5810
1.1524 1.1573
4.0700 4.0700
20.170 20.170
1.0%
Total for Fish and seafood 5083 6.7% LB UB
0.0000 0.0120
0.8400 0.8400
2.3818 2.3837
9.8880 9.8880
195.00 195.00
100%
N: number of samples; LOD: limit of detection; LB: lower bound; UB: upper bound; P5: 5th percentile; P95: 95th percentile; Max: maximum; SAF: sampling adjustment factor
The number of figures after the decimal point is the same for all food categories and does not reflect significant figures for each reported value. If N<130 than the calculated P95 should be considered only as an indicative value due to limited number of data (EFSA, 2008a).
(a): <LOD: indicates the percentage of results below the LOD or the limit of quantification.
As expected, the “fish and seafood” category is the one that reports high values of total arsenic (Table 16). The highest arsenic concentration recorded of 195 mg/kg, was from a skate (fish belonging to the family Rajidae). The next two highest arsenic containing samples from this category were a gastropod (whelk, Buccinum undatum) with 150 mg/kg, and a crustacean (prawn, Penaeus kerathurus) with 100 mg/kg.
For the egg category 1,404 results were reported (Table 17).
Table 17: Statistical description of concentrations of arsenic for food category “12. Eggs” in mg/kg
Food Subgroup N <LOD(a) Type P5 Median Mean P95 Max SAF Total for Eggs 1404 76% LB
UB 0.0000 0.0020
0.0000 0.0100
0.0042 0.0117
0.0240 0.0300
0.1820 0.1820
100%
N: number of samples; LOD: limit of detection; LB: lower bound; UB: upper bound; P5: 5th percentile; P95: 95th percentile; Max: maximum; SAF: sampling adjustment factor The number of figures after the decimal point is the same for all food categories and does not reflect significant figures for each reported value. If N<130 than the calculated P95 should be considered only as an indicative value due to limited number of data (EFSA, 2008a). (a): <LOD: indicates the percentage of results below the LOD or the limit of quantification
The “milk and dairy-based products” category includes three sub-classes, with a total of 3,896 results submitted (Table 18).

Arsenic in food
50 EFSA Journal 2009; 7(10):1351
Table 18: Statistical description of concentrations of arsenic for food category “13. Milk and dairy-based products” in mg/kg
Food Subgroup N <LOD(a) Type P5 Median Mean P95 Max SAF Milk and dairy drinks 2366 84% LB
UB 0.0000 0.0013
0.0000 0.0080
0.0026 0.0104
0.0150 0.0300
0.1660 0.1660
57%
Dairy based products 693 77% LB UB
0.0000 0.0025
0.0000 0.0090
0.0068 0.0184
0.0120 0.0600
0.6600 0.6600
30%
Cheese 837 78% LB UB
0.0000 0.0030
0.0000 0.0100
0.0065 0.0188
0.0400 0.0600
0.2400 0.2400
13%
Total for Milk and dairy based products
3896 81% LB UB
0.0000 0.0020
0.0000 0.0100
0.0042 0.0136
0.0190 0.0490
0.6600 0.6600
100%
N: number of samples; LOD: limit of detection; LB: lower bound; UB: upper bound; P5: 5th percentile; P95: 95th percentile; Max: maximum; SAF: sampling adjustment factor The number of figures after the decimal point is the same for all food categories and does not reflect significant figures for each reported value. If N<130 than the calculated P95 should be considered only as an indicative value due to limited number of data (EFSA, 2008a). (a): <LOD: indicates the percentage of results below the LOD or the limit of quantification
The highest reported value of 0.66 mg arsenic/kg was obtained for a yogurt sample.
The “miscellaneous food” category comprises two sub-categories, one including five sub-classes, and the other one seven sub-classes. For the whole category, a total of 3,034 results were submitted (Table 19).

Arsenic in food
51 EFSA Journal 2009; 7(10):1351
Table 19: Statistical description of concentrations of arsenic for food category “14. Miscellaneous products and products for special dietary use” in mg/kg
Food subbgroup N <LOD(a) Type P5 Median Mean P95 Max SAF Algae as food 448 2.9% LB
UB 0.0620 0.0620
24.000 24.000
30.871 30.871
102.24 102.24
236.00 236.00
0.1%
Spices 616 47% LB UB
0.0000 0.0100
0.0200 0.0695
0.0893 0.1151
0.3160 0.3160
2.4200 2.4200
3.0%
Dry herbs 20 45% LB UB
0.0000 0.0010
0.0020 0.0062
0.1301 0.1399
0.9500 0.9500
1.5000 1.5000
3.0%
Salt 57 72% LB UB
0.0000 0.0010
0.0000 0.0270
0.0428 0.0772
0.3440 0.3440
0.8470 0.8470
2.0%
Other miscellaneus products
371 42% LB UB
0.0000 0.0050
0.0077 0.0300
0.0905 0.1109
0.4000 0.4000
3.1100 3.1100
12%
Total for Miscellaneous
1512 34% LB UB
0.0000 0.0060
0.0700 0.1000
9.2088 9.2260
49.170 49.170
236.00 236.00
20%
Infant formulae and follow-on formulae
11 81% LB UB
0.0000 0.0030
0.0000 0.0500
0.0175 0.0435
0.1400 0.1400
0.1400 0.1400
-
Infant and follow-on formulae excluding cereal products
506 80% LB UB
0.0000 0.0005
0.0000 0.0100
0.0023 0.0291
0.0120 0.1000
0.1440 0.1440
-
Rice based infant food
19 21% LB UB
0.0000 0.0109
0.1610 0.1610
0.1496 0.1575
0.2760 0.2760
0.2760 0.2760
-
Cereal based infant and follow-on formulae excluding rice
31 42% LB UB
0.0000 0.0040
0.0050 0.0200
0.0332 0.0507
0.1920 0.1920
0.2340 0.2340
-
Algae based supplements
9 - LB UB
0.0340 0.0340
2.9000 2.9000
19.497 19.497
116.00 116.00
116.00 116.00
0.1%
Non-algae based supplements
772 35% LB UB
0.0000 0.0060
0.0500 0.0615
1.2052 1.2148
4.3700 4.3700
126.00 126.00
0.4%
Other food for special dietary uses
174 52% LB UB
0.0000 0.0010
0.0000 0.0160
0.4103 0.4294
2.4949 2.4949
24.800 24.800
79%
Total for Food for special dietary uses
1522 52% LB UB
0.0000 0.0030
0.0000 0.0340
0.7771 0.7937
1.5300 1.5300
126.00 126.00
79%
Total for Miscellaneous / Food for special dietary uses
3034 43% LB UB
0.0000 0.0045
0.0120 0.0600
4.9791 4.9959
33.000 33.000
236.00 236.00
100%
N: number of samples; LOD: limit of detection; LB: lower bound; UB: upper bound; P5: 5th percentile; P95: 95th percentile; Max: maximum; SAF: sampling adjustment factor The number of figures after the decimal point is the same for all food categories and does not reflect significant figures for each reported value. If N<130 than the calculated P95 should be considered only as an indicative value due to limited number of data (EFSA, 2008a). (a): <LOD: indicates the percentage of results below the LOD or the limit of quantification
The arsenic content in two samples exceeded any other sample by more than ten times and were excluded: one was a food colour at about 45 mg/kg (from the category “other miscellaneous products”) and the other was a product for intense muscular effort at 555 mg/kg (from the category “other food for special dietary uses”).
The maximum value recorded in the sub-group of “algae as food” represents the highest arsenic value of the whole data set. It was a sample of flour algae containing 236 mg/kg of arsenic.
High arsenic levels were also reported for a food supplement based on algae (Fucus lyophilisis, 116 mg/kg), and a food supplement rich in calcium (126 mg/kg).

Arsenic in food
52 EFSA Journal 2009; 7(10):1351
Although not specified in the present food classification, within the categories related to infant food, 19 % of the samples were found to be reported as dry powder. In order to express the values in the table on a wet mass basis (to be consistent with the other tables), a dilution factor of 1 part powder to 9 parts of water has been applied. The dilution 1:9 is common in preparing the ready-to-eat product from the dry form. In addition, it should be noted that no SAFs have been reported for any of these food categories. These food groups relate to infant food, therefore they are not used in the exposure assessment for the adult population and a separate exposure assessment has been carried out for children as described in Chapter 7.2.2.1 and 7.2.2.2.
There were 15,365 results reported in the “tap water” category (Table 20).
Table 20: Statistical description of concentrations of arsenic for food category “15. Tap water” in mg/kg
Food Subgroup N <LOD(a) Type P5 Median Mean P95 Max SAF Total for Tap water 15365 75% LB
UB 0.0000 0.0002
0.0000 0.0010
0.0013 0.0022
0.0060 0.0062
0.4700 0.4700
100%
N: number of samples; LOD: limit of detection; LB: lower bound; UB: upper bound; P5: 5th percentile; P95: 95th percentile; Max: maximum; SAF: sampling adjustment factor The number of figures after the decimal point is the same for all food categories and does not reflect significant figures for each reported value. If N<130 than the calculated P95 should be considered only as an indicative value due to limited number of data (EFSA, 2008a). (a): <LOD: indicates the percentage of results below the LOD or the limit of quantification
One sample of tap water (arsenic level of 8 mg/kg) was considered as an outlier because it exceeded by more than ten times that of any other water sample. Only three tap water samples exceeded the ML of arsenic defined by the legislation (0.010 mg/L).
5.2.5. Summary of occurrence
To correct the unbalanced sampling frequency, and to reflect product as consumed more accurately when aggregating the results into the concise food categories, SAFs were based on detailed food consumption information, or, in some cases, on food production as described in Section 5.2.4.
Table 21 shows the unadjusted and adjusted means for the occurrence of arsenic in food categories and sub-categories that are used for the exposure assessment. The occurrence values as reported in Tables 6 to 20 are shown in the two first data columns.

Arsenic in food
53 EFSA Journal 2009; 7(10):1351
Table 21: Original arsenic occurrence means as reported in the data set and adjusted means for food categories and sub food categories as used for the exposure assessment. Lower (LB) and upper bound (UB) mean values are shown.
EFSA Concise food category
Occurrence values as reported
Occurrence values as used for exposure assessment
Mean (mg/kg)
as reported
Sub-categories Mean (mg/kg)
Food categories Adjusted mean
(mg/kg)(c) LB UB LB UB LB UB 01. All cereals and cereal products 0.0536 0.0725 0.0671 0.0848
01.A Cereal-based mixed dishes 0.0157 0.0283 0.0157 0.0283 01.B Cereals and cereal products 0.0542 0.0733 0.0825(a) 0.1017(a)
02. Sugar, products and chocolate 0.0135 0.0321 0.0135 0.0320 03. Fats (vegetable and animal) 0.0062 0.0205 0.0063 0.0245 04. All vegetables, nuts and pulses 0.0261 0.0366 0.0121(b) 0.0212(b)
04.A Vegetable soups 0.0050 0.0110 0.0050 0.0110 04.B Vegetables, nuts and pulses 0.0262 0.0367 0.0122(a)(b) 0.0213(a)(b)
05. Starchy roots or potatoes 0.0031 0.0142 0.0025 0.0077 06. Fruits 0.0058 0.0168 0.0051(b) 0.0155(b) 07. Juices, soft drinks and bottled water 0.0024 0.0053 0.0030 0.0068
07.A Fruit and vegetable juices 0.0025 0.0104 0.0048(a) 0.0129(a) 07.B Soft drinks 0.0044 0.0132 0.0044 0.0132 07.C Bottled water 0.0023 0.0041 0.0023 0.0041
08. Coffee, tea, cocoa 0.0490 0.0613 0.0035(b) 0.0051(b) 09. Alcoholic beverages 0.0062 0.0127 0.0055 0.0151
09.A Beer and substitutes 0.0054 0.0161 0.0054 0.0161 09.B Wine and substitutes 0.0061 0.0110 0.0061 0.0110 09.C Other alcoholic beverages 0.0085 0.0115 0.0085 0.0115
10. All meat and meat products, offal 0.0051 0.0150 0.0044 0.0138 10.A Meat and meat products 0.0050 0.0145 0.0042(a) 0.0137(a) 10.B Edible offal and offal products 0.0049 0.0154 0.0044(a) 0.0139(a) 10.C Meat based preparations 0.0121 0.0185 0.0121 0.0185
11. All fish and seafood 2.3818 2.3837 1.6136 1.6159 11.A Seafood and seafood products 5.0111 5.0115 5.5537(a) 5.5545(a) 11.B Fish and fish products 1.4526 1.4549 1.4526 1.4549 11.C Fish-based preparations 1.1524 1.1573 1.1524 1.1573
12. Eggs 0.0042 0.0117 0.0042(d) 0.0117(d) 13. Milk and dairy based products 0.0042 0.0136 0.0044 0.0139
13.A Milk and dairy-based drinks 0.0026 0.0104 0.0026 0.0104 13.B Dairy-based products 0.0068 0.0184 0.0068 0.0184 13.C Cheese 0.0065 0.0188 0.0065 0.0188
14. Miscellaneous/special dietary products 4.9791 4.9959 0.3993 0.4187
14.A Miscellaneous products 9.2088 9.2260 0.2449(a) 0.2658(a) 14.B Food for special dietary uses 0.7771 0.7937 0.4383(a) 0.4573(a)
15. Tap water 0.0013 0.0022 0.0013(d) 0.0022(d) LB: lower bound: UB: upper bound (a): The reported mean value include the adjustment with the respective SAFs for the food sub-groups. (b): The calculated mean value include conversion in fresh mass by applying their respective dilution factors. (c): Adjusted mean for food categories is calculated by applying the respective SAFs to the sub-categories mean values
reported in the middle columns. (d): Unadjusted mean values because this food category did not include any sub categories.

Arsenic in food
54 EFSA Journal 2009; 7(10):1351
5.3. Current occurrence of arsenic in food: second call for data
A new deadline for DATEX-2008-001222 call for data was given in order to further collect data on arsenic at speciation level; the new deadline was set to July 2009. At the time of writing (September 2009), EFSA had not received any additional results from the Member States in response to this second deadline. Consequently, the present opinion will be issued on the basis of the results reported from the first call for data (DATEX-2008-0012)22 with a closing date of November 2008. As previously mentioned, only a small number of samples have been analysed at speciation level. Therefore, the exposure assessment presented on inorganic arsenic will be based on the 919 inorganic arsenic results collected in the first call for data (DATEX-2008-001222) and from the inorganic arsenic proportions reported in the literature.
5.4. Food preparation
Changes to the total arsenic content and to arsenic species might take place during the preparation of food for human consumption. The various processes may cause a considerable increase or decrease in the concentrations of arsenic in food commodities and thus in the actual dietary exposure to arsenic. For example, traditional washing and soaking of Hizikia fusiforme, an edible alga that has a very high inorganic arsenic content, may reduce the arsenic levels by up to 60 %. On the other hand, almost all the arsenic present in contaminated cooking water may be retained during boiling of rice. Devesa et al. (2008) recently summarised the effects of thermal treatments on the concentrations of total arsenic and arsenic species in food in a comprehensive review. Changes to total arsenic content of the food can occur due to losses (solubilisation) to the cooking medium or preservation solution. Additionally, arsenic species can be converted to other arsenicals during food preparation. In general, these changes are not great, but they can be significant after cooking at high temperatures, such as might be reached on the surface of the food during frying or grilling (Hanaoka et al., 2001; Torres-Escribano et al., 2008).
Several studies have focussed on how cooking rice in contaminated water affects the contents of arsenic in the processed product as this was found to be of special importance in arsenic-endemic areas where rice plays a vital role as the main source of energy and protein intake for the people living there. Laparra et al. (2005) investigated the changes of total and inorganic arsenic contents in rice as a result of cooking. Deionized water and deionised water spiked with arsenate at 0.5 mg/L were employed for cooking purposes. In raw rice, total arsenic ranged from 0.29 to 0.41 mg/kg (dry mass) and inorganic arsenic ranged from 0.10 to 0.20 mg/kg dry mass. Cooking the samples with deionised water produced no considerable modifications in the total arsenic and inorganic arsenic contents. However, cooking with spiked contaminated water resulted in a 5-17-fold increase in the inorganic arsenic content of raw rice. Similar results were found by Torres-Escribano et al. (2008) who investigated the effect of cooking on total and inorganic arsenic concentrations in various brands of rice. They found a higher inorganic arsenic concentration in brown rice compared to white rice which might indicate that part of the arsenic is attached to components of the bran. Consequently, polishing brown rice to obtain white rice may lead to a substantial decrease in arsenic concentration. In their study, the cooking process mimicked one of the processes normally applied in Spanish households: boiling in water with an initial rice to water ratio of 1:4 until all the liquid has evaporated. Prior to cooking the water was spiked with various concentrations of arsenate ranging from 0.1 to 1 mg/L to emulate the concentrations in water from arsenic-endemic areas. After cooking the inorganic arsenic concentration in the analysed rice samples increased between 3 and 99 times with a mean rice retention of 89±13 % of the arsenic in the cooking water. Comparable results were also reported by Ackerman et al. (2005) who found an absorption of arsenic by rice from the total volume of water used in cooking between 89 and 105 % (rice to water ratio 1:1 to 1:4).
While the aforementioned studies mainly focused on the retention of arsenic by rice from contaminated water, other investigations tested the effects of cooking rice in non contaminated water.

Arsenic in food
55 EFSA Journal 2009; 7(10):1351
Sengupta et al. (2006) tested the three major rice cooking procedures followed globally. Using low-arsenic water (arsenic <0.003 mg/L), the traditional method of the Indian subcontinent (wash until clear; cook with rice to water ratio of 1:6; discard excess water) removed up to 57 % of the arsenic from rice containing arsenic at 0.20-0.54 mg/kg. Approximately half of the arsenic that had been removed was associated with the wash water and half was found in the discard water. With low-arsenic water, the contemporary method of cooking unwashed rice at a rice to water ratio of 1:1.5-2.0 until no water remains did not modify the arsenic content. Preliminary washing until clear did remove 28 % of the rice arsenic. The results were not influenced by water source (tubewell, dug well, pond or rain), cooking vessel (aluminium, steel, glass or earthenware), or the absolute weight of rice or volume of water.
Raab et al. (2009) systematically investigated total arsenic and inorganic arsenic in different rice types (basmati, long-grain, polished (white) and wholegrain (brown) that had undergone various forms of cooking in non-contaminated water. The effects of rinse washing, low water volume (rice to water ratio 1:2.5) and high water volume (rice to water ratio 1:6) cooking, as well as steaming, were investigated. Rinse washing was effective at removing about 10 % of the total and inorganic arsenic from basmati rice, but was less effective for other rice types. While steaming reduced total and inorganic arsenic rice content, it did not do so consistently across all rice types investigated. Low volume water cooking did not remove arsenic. High volume water cooking did effectively remove both total and inorganic arsenic for the long-grain and basmati rice by 35 % and 45 % for total and inorganic arsenic content, respectively, compared to uncooked (raw) rice. This study indicates that rinse washing and a high volume of non-contaminated cooking water are effective in reducing the arsenic content of cooked rice, specifically the inorganic component (Raab et al., 2009).
The situation for vegetables seems to be similar to that for rice. Cooking vegetables in water with high levels of inorganic arsenic leads to an increase in the arsenic concentration in the vegetables compared to the raw product. On the other hand, cooking in distilled water resulted in lower levels compared to those detected in the products prior to cooking (Diaz et al., 2004). Some further studies with uncontaminated water substantiate the decrease of arsenic after cooking. She and Kheng, (1992) reported arsenic losses of up to 60 % after subjecting various kinds of vegetables to boiling. Cubadda et al. (2003) also showed a significant decrease in arsenic (about 60 %) in all pasta samples after a cooking process.
Dahl et al. (2009) examined the stability of arsenic compounds in fresh and frozen samples of raw, boiled and fried Atlantic cod, Atlantic salmon and blue mussels. The results show that the total arsenic concentration of the fresh seafood samples was not different from the frozen samples within the same seafood type. Inorganic arsenic was only found above LOQ in blue mussels and, importantly, no change in the levels of inorganic arsenic was observed after processing or after storage by freezing. Neither processing nor freezing resulted in measurable amounts of inorganic arsenic in the Atlantic cod and Atlantic salmon samples. The processing of the samples caused a limited loss of water resulting in increased arsenic concentration on a fresh mass basis, which is in line with other studies. In general, processing or storage by freezing did not change the total arsenic concentration or alter the speciation pattern greatly. Dahl et al. (2009) also observed that the concentrations of tetramethylarsonium ion increased from their initial low values when samples of both fresh and frozen seafood were fried. This result supported the earlier work of Hanaoka et al., 2001 who showed that when seafood is cooked at high temperatures, a portion of the arsenobetaine present can convert to tetramethylarsonium ion.
Perelló et al. (2008) evaluated the effects of traditional cooking processes (frying, grilling, roasting and boiling) on the concentration of total arsenic and several other elements in a number of food samples, especially of animal origin. Although some differences in the total arsenic levels between raw and cooked fish were observed, these were not statistically significant (p>0.05). In contrast, arsenic concentrations in a few meat samples (veal steak, loin pork, chicken and lamb) showed statistically significant (p<0.05) decreases in the processed product after frying and grilling. In one case, the

Arsenic in food
56 EFSA Journal 2009; 7(10):1351
decrease reached almost 50 %. The study indicated that the decreases depended upon cooking conditions, such as time, temperature and cooking medium.
Devesa et al. (2005) determined several organic arsenic species in 64 cooked seafood products and compared the results with the raw products. The results showed that in cooked seafood arsenobetaine is the major arsenic species followed by dimethylarsinate and tetramethylarsonium ion. After cooking there was an increase in dimethylarsinate for sardines and bivalves and an increase or appearance of tetramethylarsonium ion for meagrim, anchovy, Atlantic horse mackerel, and sardine. As mentioned above, this is because arsenobetaine decarboxylates during heat treatment and produces tetramethylarsonium ion. This process takes place at temperatures above 150°C, and can be significant in some cooking treatments in which the surface of the food is in direct contact with the heat source and reaches temperatures close to 250°C, such as roasting, grilling or baking. Hanaoka et al. (2001) were the first to observe this conversion in roasted shark and crayfish. In contrast, cooking seafood in water (stewing, boiling, or steaming) does not convert arsenobetaine to tetramethylarsonium ion (Devesa et al., 2005).
In summary, the effects of food processing on the concentrations of arsenic in prepared food depend on the type of food processing, time, temperature and especially cooking medium. Of special importance seems to be the arsenic content in water because it determines whether the concentrations in the prepared food may be considerably higher or lower compared to the raw product. For this reason, it is desirable that all relevant information is provided about the food, including how it is prepared/presented as a meal, to enable a realistic toxicological assessment of dietary exposure to arsenic.
5.5. Inorganic and total arsenic ratios in food and possible conversion factors
Because the current call for data produced many results for total arsenic, but relatively few for inorganic arsenic, the CONTAM Panel considered the possibility of using a conversion factor which might provide an estimate of inorganic arsenic content from the total arsenic data.
Attention has been given to food categories that could substantially contribute to the exposure of inorganic arsenic.
Among the most frequently analysed and discussed food products contributing to the exposure of total arsenic, the category of “fish and seafood products” poses a particular problem in trying to calculate the inorganic component. A conversion factor was applied to inorganic arsenic in seafood in an earlier assessment (The Group of Experts on Scientific Aspects of Marine Environmental Protection - GESAMP, 1986). On that occasion the percentage of inorganic arsenic was assumed to be between 5 and 10 % of total arsenic, values that were later shown to be gross overestimates (Edmonds and Francesconi, 1993). A problem with this sort of approach is that the relative proportion of inorganic arsenic tends to decrease as the total arsenic content increases, and the ratio may vary depending on the seafood type. Figure 8, which contains some of the data reported by Sirot et al. (2009), shows some of the difficulties: fish with 20 mg arsenic/kg contain only marginally more inorganic arsenic than do fish with 1-2 mg arsenic/kg. Moreover, generally shellfish (crustaceans and molluscs) have higher concentrations of inorganic arsenic than fish fillet. A more practical approach may be to assume a constant contribution of inorganic arsenic from fish (0.03 or 0.015 mg arsenic/kg fresh mass) and from seafood (0.10 or 0.05 mg arsenic/kg fresh mass).
Comparing the reported data in the current data set from the Member States (from food category 11), 0.03 mg inorganic arsenic/kg set for “fish and fish products”, and 0.1 mg inorganic arsenic/kg for “seafood and seafood products” represent 2 % and 3.5 % of the measured mean total arsenic, respectively.

Arsenic in food
57 EFSA Journal 2009; 7(10):1351
When considering the current data set of 219 seafood samples and 170 fish samples reporting inorganic arsenic results, the adjusted means for the calculated lower and upper bound are 0.014 mg inorganic arsenic/kg and 0.029 mg inorganic arsenic/kg for “fish and fish products” and 0.037 mg inorganic arsenic/kg and 0.064 mg inorganic arsenic/kg for “seafood and seafood products”, respectively. Those inorganic arsenic values represent on average 2 % of the total arsenic reported in the current data set in “fish and fish products” and 1.2 % in “seafood and seafood products”.
0.00
0.05
0.10
0.15
0.20
0.25
0.30
0 5 10 15 20 25 30 35 40 45
Inor
gani
c Ars
enic
(mg/
kg w
et w
eigh
t)
Total Arsenic (mg/kg wet mass)
Fish & frozen fish
Molluscs & crustaceans
Linear (Fish & frozen fish)
Linear (Molluscs & crustaceans)
Figure 8: Data from Sirot et al. (2009) showing the variation of inorganic arsenic and total arsenic content in fish and shellfish
The situation with terrestrial foods is perhaps simpler. Most terrestrial foods contain low total arsenic levels, and a high percentage of this arsenic is inorganic arsenic.
In addition to “fish and seafood” the following food categories from the EFSA Concise food classification need to be considered as possible significant contributors of inorganic arsenic (even though they have relatively low total arsenic levels): “cereal and cereal products” (food category .01), “all vegetables, nuts and pulses” (food category .04), “fruit and vegetable juices, soft drinks and bottled water” (food category .07), “coffee, tea and cocoa” (food category .08), “alcoholic beverages” (food category .09), “miscellaneous food and food for special dietary uses” (food category .14) and “tap water” (food category .15).
Cereal and cereal products and vegetables have been reported to contain on average from 30 to 100 % inorganic arsenic (Muñoz et al., 2002, Diaz et al., 2004; Schoof et al., 1999). Even rice, which typically contains between 0.1 to 0.4 mg total arsenic/kg, has a relatively high percentage of inorganic arsenic (ca. 30-90 %). Those observations from literature data are supported by the results reported for rice grain samples and rice-based products in the current data set (around 200 samples) showing that the inorganic arsenic content varied between 50 and 60 % of the total arsenic content.
Coffee and tea are two of the most common non-alcoholic drinks consumed in the world and due to the contribution of inorganic arsenic from the tea leaves or from the coffee powder combined with the contribution coming from water, the “coffee, tea and cocoa” food category (food category .08) has also been considered as relevant for the daily dietary exposure of inorganic arsenic. A recently

Arsenic in food
58 EFSA Journal 2009; 7(10):1351
published study reported that inorganic arsenic derived from tea infusions can vary from 29 to 88 % of the total arsenic (Yuan et al., 2007).
Drinking water can be the major contributor of inorganic arsenic in the diet especially in areas with high natural levels. Because of the high percentage of water used to prepare “fruit and vegetable juices, soft drinks and alcoholic beverages” all those categories have also been included in the list of the major contributors to inorganic arsenic exposure.
“Miscellaneous food and food for special dietary uses” (food category .14) from the EFSA Concise food classification, includes spices, salt, additives, food colours, algae as food and food supplements which can be derived from algae. Of the 220 samples from the current data set reporting inorganic arsenic results, the average inorganic arsenic content varied between 36 and 76 % of the total arsenic content. Moreover, it is known that some edible algae such as hijiki can contain up to 60 % inorganic arsenic, and therefore this category has been added to the list of possible significant inorganic arsenic contributors.
Because of the observed variability in the reported inorganic arsenic levels, it was not realistic to apply specific conversion factors to the total arsenic data. Rather, a simplified approach was investigated whereby it was assumed that inorganic arsenic constituted 50 %, 70 % or 100 % of the reported total arsenic contents. These percentages were applied to all the categories mentioned above which are considered the most relevant contributors to the inorganic arsenic daily intake. In this way, best case (50 % inorganic arsenic) and worst case (100 % inorganic arsenic) scenarios could be estimated based on the total arsenic data for these foods.
6. Food consumption
6.1. EFSA’s Concise European Food Consumption Database
The EFSA Concise European Food Consumption database23 was established by EFSA to support exposure assessments carried out in the EU. So far 19 countries have provided national data to EFSA for the database. To obtain comparable results, data were aggregated into 15 broad food groups, although some Member States provided data also for certain subgroups providing up to a total of 28 separate food class entries. The consumption figures for the food groups are linked to individual data on sex, age and body weight. The main statistics of the data are available on the EFSA website and contain mean consumption, median and standard deviation as well as several low and high percentiles of consumption for the general population and for consumers only.
The concise database is intended to be used as a screening tool for exposure assessment as well as a first step towards generating a more comprehensive database. It allows assessment of the overall exposure of population groups to a wide variety of substances. Limitations arise from the broad food categories defined and from the different methodologies of data collection applied in different countries. The use of this database may be sufficient when the exposure calculation, based on conservative assumptions for concentrations, is below the level of concern. If this is not the case, further refinements might be necessary, particularly when defining sub-categories of interest and adjusting means using the appropriate SAF. A guidance document for the use of the data has been published on the EFSA website (see Annex 3 to EFSA, 2008a)23.
For calculating arsenic exposure, data at the individual level were accessed in the database. In this way, the 95th percentile exposure in particular can be calculated more accurately than by using the
23http://www.efsa.europa.eu/EFSA/ScientificPanels/datex/efsa_locale-1178620753812_ConciseEuropeanConsumptionDatabase.htm

Arsenic in food
59 EFSA Journal 2009; 7(10):1351
method described in the guidance document. It is also possible to use the individual weight as recorded rather than a standard weight of 60 kg.
6.2. Food consumption data for different age and consumer groups
Infants and young children are often more highly exposed to toxic chemicals than adults when considering the food intake in relation to their body weight.
According to the Institute of Medicine (IOM) average breast milk consumption is about 750-800 g/day (range, 450-1,200 g/day) for the first 4-5 months of life (IOM, 1991). Infant birthweight and nursing frequency have been shown to influence the rate of intake (IOM, 1991). The German DONALD study looked at consumption of infant formula and found that a 3 months old child weighing on average 6.1 kg consumed a mean of 780 mL/day with a 95th percentile consumption of 1,060 mL/day (Kersting et al., 1998).
To estimate the exposure to certain food contaminants in children, EFSA contracted a consortium with members across 11 European countries with access to detailed food consumption information for different age groups. Food categories shown in the occurrence section were therefore matched with the food consumption information collected from the 11 European countries. For the arsenic exposure in children, consumption data from this consortium and its related calculation model were applied24.
A special comparison between child and adult consumption patterns was also undertaken using Italian food consumption information. For this purpose, the food groups and subgroups used in the occurrence section were matched with the food consumption information available from the 1994-1996 national survey of 1940 Italian subjects carried out by the Italian Istituto Nazionale di Ricerca per gli Alimenti e la Nutrizione (INRAN) (Turrini et al., 2001; Turrini and Lombardi-Boccia, 2002). The INRAN database contains consumption data and other relevant information (e.g. body weight and age) expressed for each individual. The 64 food categories of interest (including drinking water and other non-alcoholic drinks) of the INRAN database were clustered by the Istituto Superiore di Sanità (ISS) into groups to match the Concise European Food Consumption database23 as described in the Scientific opinion of the CONTAM Panel on Cadmium in Food (EFSA, 2009a).
6.2.1. Food consumption for vegetarians
In order to use food consumption information from the Concise European Food Consumption Database for estimating the dietary arsenic exposure of vegetarians, only countries that used a 7-day dietary record method were retained. Data from the following six countries were retained for further analysis: Great Britain, Sweden, Italy, Ireland, France and Denmark. From an initial database of 37,599 consumers, 10,074 were retained for further analysis. Since vegetarians eat no meat or fish, but commonly consume dairy products and eggs, i.e. a lacto-ovo vegetarian diet, consumers who did not report any consumption in the meat category or fish category on any of the 7 days surveyed were selected for the final analysis. This included only 65 subjects from five countries, with no subject with such dietary pattern identified in Denmark. The food consumption pattern is shown in Table 22.
24 EFSA, 2008. Individual food consumption data and exposure assessment studies for children. CFP/EFSA/DATEX/
2008/01. For more information contact EFSA/Data collection and exposure Unit: [email protected], <http://www.efsa.europa.eu/cs/BlobServer/resource_EFSA/partners/art36/art36status.pdf?ssbinary=true>

Arsenic in food
60 EFSA Journal 2009; 7(10):1351
Table 22: Food consumption pattern among 65 subjects consuming a lacto-ovo vegetarian diet identified from the EFSA Concise European Food Consumption Database
Category Food consumption g/day
Mean Standard deviation
P95 Maximum
Cereals and cereal products 283 128 510 749 Cereal-based mixed dishes 149 115 304 510 Cereals and cereal products excluding mixed dishes 122 103 353 371 Sugar, sugar products and chocolate 25 25 66 131 Fats (vegetable and animal) 24 25 67 144 Vegetables, nuts and pulses 318 222 747 1254 Vegetable soups 24 40 114 169 Vegetables, nuts and pulses excluding soup 293 219 747 1254 Starchy roots or potatoes 94 93 296 487 Fruits 144 166 494 912 Juices, soft drinks and bottled water 322 422 888 2750 Fruit and vegetable juices 57 88 226 414 Soft drinks 144 228 731 897 Bottled water 149 399 825 2571 Coffee, tea, cocoa expressed as liquid 483 395 1117 1728 Alcoholic beverages 191 347 977 1393 Beer and substitutes 158 342 925 1371 Wine and substitutes 30 57 159 273 Other alcoholic beverages 3 9 21 51 Eggs 17 27 84 114 Milk and dairy based products 221 173 468 956 Milk and dairy-based drinks 171 163 449 854 Dairy-based products 32 41 112 176 Cheese 23 22 57 98 Miscellaneous /Special dietary uses 14 30 52 220 Miscellaneous products 11 15 50 57 Food for special dietary uses 4 27 2 214 Tap water 316 390 1143 1671 P95: 95th percentile
7. Human exposure assessment
7.1. Previously reported human exposure assessments
The European Commission Scientific Cooperation project calculated a mean daily dietary exposure to total arsenic in the adult population in three European countries with complete dietary studies of between 37 and 66 µg with an estimated seafood contribution in excess of 50 % (SCOOP, 2004). In the United States, daily exposure to arsenic has been estimated to range from 2 μg in infants to 92 μg in 60-65-year-old men (Tao and Bolger, 1999). The greatest dietary contribution to total arsenic was seafood (76-96 %) for all age groups, except infants. For infants, seafood and rice products contributed 42 and 31 %, respectively. Adult daily dietary arsenic exposure reported for other countries range from 12 to 280 μg (Tao and Bolger, 1999).
As with adults, most children are exposed to arsenic largely through their diet. Sternowsky et al. (2002) analysed breast milk from 36 women from three different regions in Germany. Calculated daily exposure of arsenic was between 0.12 and 0.37 μg for an infant at 3 months of age and weighing 6 kg.

Arsenic in food
61 EFSA Journal 2009; 7(10):1351
Even when mothers consume large amounts of seafood, there does not appear to be any major transfer of arsenobetaine, the major form of arsenic in seafood, from seafood to milk (Grandjean et al., 1995).
According to an FDA study of 1986-1991, the mean daily exposure of arsenic was 0.5 and 0.81 μg/kg b.w. for a 6-11-month-old infant and 2-year-old child, respectively (Gunderson, 1995). This can be compared to a mean daily intake of 0.51 μg/kg b.w. for a 25-30-year-old male.
From a toxicological point of view the amount of inorganic arsenic is considered the most important. Tao and Bolger (1999) assumed that 10 % of the total arsenic in seafood was inorganic and that 100 % of the arsenic in all other foods was inorganic. The average daily exposure of inorganic arsenic was thus estimated to range from 1.3 μg in infants to 12.5 μg in 60-65-year-old men. Yost et al. (1998) reported that the estimated daily dietary exposure of inorganic arsenic for various age groups ranged from 8.3 to 14 μg and from 4.8 to 12.7 μg in the United States and Canada, respectively, with 21-40 % of the total dietary arsenic occurring in inorganic forms. Schoof et al. (1999) estimated that daily exposure of inorganic arsenic in the U.S. diet ranges from 1 to 20 μg, with a mean of 3.2 μg.
The UK Committee on Toxicity of Chemicals in Food, Consumer Products and the Environment (COT) looked at the time trend of total arsenic exposure since 1976 in the United Kingdom and concluded that it had fluctuated with the general trend appearing to be downwards. Recently, analysis of inorganic arsenic had been added to the range of analyses. In 2006, the estimated population dietary exposure to total arsenic was 61-64 µg/day, which compares with an inorganic arsenic dietary exposure of 1.4-7 µg/day (COT, 2008).
Drinking water may be a significant source of inorganic arsenic exposure in areas where arsenic is naturally present in groundwater. While estimates of daily arsenic exposure for typical adults drinking 2 L of water per day average about 5 μg (US EPA, 1982b), exposure can be much higher (10-100 μg) in areas with high levels of arsenic in soil or groundwater. It is assumed that nearly all arsenic in drinking water is inorganic (US EPA, 2001b).
For populations not exposed through elevated drinking water arsenic, rice is a primary dietary source of inorganic arsenic (Meacher et al., 2002; Meliker et al., 2006; Tsuji et al., 2007). Dietary exposure to inorganic arsenic from rice was calculated for typical adult European and South-East Asian diets. In Sweden, rice was estimated to contribute 1.3 % of the PTWI of 0.015 mg/kg b.w. (2 µg/kg b.w. per day) while in the European and South-East Asian diets rice contributed on average 0.8 % and 24 % of the PTWI, respectively (Jorhem et al., 2007).
Yost et al. (2004) estimated the mean daily dietary exposure for inorganic arsenic for children (1-6 years of age) to be 3.2 μg, with a range of 1.6-6.2 μg for the 10th and 95th percentiles, respectively. Inorganic arsenic exposure was predominantly contributed by grain and grain products, fruits and fruit juices, rice and rice products, and milk. Rice for babies is often packaged in single serve 20 g sachets. Assuming consumption of a single-portion sachet per day, median and 95th percentile exposure was estimated at 4 µg and 7 µg for a 1-year old child (9.25 kg) or 0.5 and 0.8 µg/kg b.w., respectively, for rice alone (Meharg et al., 2008).
7.2. Mean and high dietary exposure to total arsenic
For this opinion the mean and the 95th percentile arsenic dietary exposure were calculated separately for each country for the whole population using consumption data recorded at the individual level (Table 23). The mean of the upper and lower bound of each food category adjusted according to the respective SAFs, as reported in Table 21, were used as occurrence figures for the calculation of the exposure assessment.
Mean total arsenic dietary exposure ranged from 0.45 to 4.31 µg/kg b.w. per day between the countries for the lower bound with a median of 0.94 µg/kg b.w. per day, and from 0.65 to 4.6

Arsenic in food
62 EFSA Journal 2009; 7(10):1351
µg/kg b.w. per day between the countries for the upper bound with a median of 1.22 µg/kg b.w. per day. The 95th percentile total arsenic dietary exposure ranged from 1.75 to 10.96 µg/kg b.w. per day for the lower bound with a median of 3.16 µg/kg b.w. per day, and from 1.97 to 11.2 µg/kg b.w. per day between the countries for the upper bound, with a median of 3.38 µg/kg b.w. per day. The variation in exposure between countries is influenced by different consumption patterns only, since arsenic concentrations in food categories were calculated at a European level.
Table 23: Total dietary exposure to total arsenic (µg/kg b.w. per day) for average (mean) and 95th percentile consumers (P95) across a number of subjects (N) in European countries (MS) using the lower (LB) and upper (UB) bound arsenic concentrations
European Country N
Mean (µg/kg b.w. per day)
P95 (µg/kg b.w. per day)
LB UB LB UB AT 2123 0.8813 1.1536 4.1494 4.4004 BE 1723 0.9083 1.1880 2.7836 3.1091 BG 853 0.8595 1.0765 3.8918 4.1599 CZ 1751 0.8702 1.1586 2.7438 3.0126 DE 3550 1.0474 1.3649 2.4068 2.7835 DK 3150 0.9356 1.2242 2.1021 2.4379 EE 2010 0.8597 1.0956 3.9656 4.2046 FI 2007 0.9807 1.2084 3.1555 3.3846 FR 1195 1.6076 1.8838 3.9678 4.2462 GB 1724 1.0673 1.3132 2.8949 3.1825 HU 927 0.5976 0.8447 1.7530 1.9735 IE 1373 0.9804 1.2742 2.2536 2.6544 IS 1075 1.4572 1.7532 4.7385 5.1715 IT 1544 2.1134 2.3721 6.5413 6.7354 NL 4285 0.7924 1.0722 2.4167 2.6940 NO 2321 4.3060 4.5773 10.9625 11.2241 PL 2692 0.9308 1.2507 3.5847 3.9110 SE 1088 2.5347 2.8188 6.4598 6.8009 SK 2208 0.4490 0.6482 2.1501 2.4764 Minimum 0.4490 0.6482 1.7530 1.9735 Median 0.9356 1.2242 3.1555 3.3846 Maximum 4.3060 4.5773 10.9625 11.2241 N: Number of samples; b.w.: body weight; LB: Lower bound; UB: Upper bound, P95: 95th percentile; AT: Austria; BE: Belgium; BG: Bulgaria; CZ: Czech Republic; DE: Germany; DK: Denmark; EE: Estonia; FI: Finland; FR: France; GB: Great Britain; HU: Hungary; IE: Ireland; IS: Iceland; IT: Italy; NL: The Netherlands; NO: Norway; PL: Poland; SE: Sweden; SK: Slovak Republic
7.2.1. Contributions of different food groups to total arsenic exposure
The contribution of each broad food category to total arsenic exposure was calculated from the median value expressed in g/day of the average consumption in the whole population in each country multiplied by the corresponding mean arsenic concentrations expressed in mg/kg.
Figure 9 describes the contribution of each food category, expressed in µg/kg b.w. per day, to the overall total arsenic exposure, by using the adjusted upper and lower bound mean values from the occurrence data (Table 21). When values were reported for dried food categories, dilution factors have also been included in the exposure calculation. The largest contributors to overall total arsenic exposure seem to be “fish and seafood” and “cereals and cereal products”. It should be noted that within the “cereal and cereal products” food category, due to its high total arsenic amount, rice is one of the major contributors to the inorganic arsenic forms. Looking at its consumption in different diets,

Arsenic in food
63 EFSA Journal 2009; 7(10):1351
rice represents 4 % in a general European diet, while for Asian diets rice can reach 67 % of the diet (data obtained from GEMS/Food Consumption Cluster Diet).
0.000 0.100 0.200 0.300 0.400 0.500 0.600
01.Cereals & cereal products
02.Sugar & sugar products including chocolate
03.Fats (vegetable and animal)
04.Vegetables, nuts, pulses including carrots, tomato and leafy vegetables
05.Starchy roots or potatoes
06.Fruits
07.Fruit and vegetable juices, soft drinks and bottled water
08.Coffee, tea, cocoa (expressed as liquid)
09.Alcoholic beverages
10.Meat and meat products, offal
11.Fish and seafood
12.Eggs
13.Milk and dairy based products
14.Miscellaneous / Food for special dietary uses
15.Tap water
µg/kg b.w. per day
LB median
UB median
b.w.: body weight; LB: lower bound; UB: upper bound
Figure 9: Estimated median country consumer exposure to total arsenic by different food groups using adjusted upper and lower bound mean values for occurrence and individual food consumption
Figure 9 reflects the assumptions made on the selection of the food categories considered as the main contributors to the inorganic arsenic daily intake. Apart “from cereal and cereal products”, and “fish and seafood” already mentioned, on the basis of the EFSA Concise Food Consumption Database the food categories of “all vegetables, nuts and pulses” (food category .0425), “fruit and vegetable juices, soft drinks and bottled water” (food category .0725), “coffee, tea and cocoa” (food category .0825), “alcoholic beverages” (food category .0925), “miscellaneous food and food for special dietary uses” (food category .1425) are major contributors to the overall exposure to total arsenic. Although “tap water” (food category .15) does not highly contribute to the total arsenic intake, its arsenic content is mainly represented by inorganic arsenic and therefore considered important for a possible exposure assessment. The remaining food categories do not significantly contribute to the overall total arsenic exposure, and therefore their contribution to the inorganic arsenic exposure could be considered as negligible.
25 Within one food category the contribution to the total arsenic intake of single food items varies according to the respective
occurrence levels and the SAFs applied.

Arsenic in food
64 EFSA Journal 2009; 7(10):1351
7.3. Mean and high dietary exposure of inorganic arsenic
As previously mentioned, from the current call for data many results have been reported for total arsenic, but relatively few for inorganic arsenic. Therefore in view of the need for dietary exposure assessment for inorganic arsenic, several assumptions were made to estimate the inorganic arsenic content from the total arsenic reported.
In section 5.5, possible conversion factors have been discussed for fish and seafood and for other specific food groups. Through the combination of the three different assumptions established for fish and seafood, and the other three assumptions defined for the remaining food categories, nine possible scenarios of exposure to inorganic arsenic have been defined, as listed in Table 24.
Table 24: Cross combinations of different assumptions on the proportion of inorganic arsenic for fish and seafood (food category .11) and for all the other food categories (.01, .04, .07, .08, .09, .14, .15), in order to describe 9 possible scenarios for exposure to inorganic arsenic
Exposure Scenarios
Inorganic arsenic in selected food categories (.01, .04, .07, .08, .09, .14, .15)
100 % of total arsenic
70 % of total arsenic
50 % of total arsenic
Inorganic arsenic in fish and seafood (.11)
Real data: Fish: LB: 0.0141 mg/kg UB: 0.0291 mg/kg Seafood: LB: 0.0368 mg/kg UB: 0.0639 mg/kg
Scenario 1 Scenario 2 Scenario 3
Estimated fixed values: Fish: 0.03 mg/kg Seafood: 0.1 mg/kg
Scenario 4 Scenario 5 Scenario 6
Estimated fixed values: Fish: 0.015 mg/kg Seafood: 0.05 mg/kg
Scenario 7 Scenario 8 Scenario 9
LB: lower bound; UB: upper bound; food category .01: cereal and cereal products; food category .04: all vegetables, nuts and pulses; food category .07: fruit and vegetable juices, soft drinks and bottled water; food category .08: coffee, tea and cocoa; food category .09: alcoholic beverages; food category .11: fish and seafood products; food category .14: miscellaneous food and food for special dietary uses; food category .15: tap water.
When those assumptions were applied to the exposure assessment calculation for average and 95th percentile consumers in the total population of the 19 European countries included in the EFSA Concise European Food Consumption Database, the total dietary exposures to total and inorganic arsenic (expressed in µg/kg b.w. per day) were estimated as reported in Table 25.
The listed values in Table 25 of arsenic daily exposure represent the median of the mean intake figures calculated for the 19 European countries respectively, for average and 95th percentile consumers.

Arsenic in food
65 EFSA Journal 2009; 7(10):1351
Table 25: Total dietary exposure to total and inorganic arsenic (µg/kg b.w. per day) for average (Mean) and 95th percentile consumers (P95) across European countries using the lower (LB) and upper (UB) bound arsenic concentrations. The values reported represent the median of the dietary exposure estimated in 19 European countries from the EFSA Concise European Food Consumption Database.
Exposure scenarios (see Table 24)
Mean (µg/kg b.w. per day)
P95 (µg/kg b.w. per day)
LB UB LB UB Total arsenic Inorganic arsenic scenario 1 Inorganic arsenic scenario 2 Inorganic arsenic scenario 3 Inorganic arsenic scenario 4 Inorganic arsenic scenario 5 Inorganic arsenic scenario 6 Inorganic arsenic scenario 7 Inorganic arsenic scenario 8 Inorganic arsenic scenario 9
0.936 0.413 0.290 0.209 0.419 0.296 0.215 0.413 0.291 0.209
1.224 0.605 0.426 0.307 0.606 0.427 0.308 0.600 0.422 0.303
3.156 0.720 0.504 0.362 0.725 0.514 0.372 0.720 0.504 0.363
3.385 0.987 0.691 0.509 0.987 0.692 0.517 0.973 0.684 0.494
b.w.: body weight; LB: lower bound; UB: upper bound; P95: 95th percentile
Table 25 shows the possible variation in inorganic arsenic exposure estimates resulting from the different assumptions made for the mean occurrence values of total arsenic in food.
The highest estimated median country exposure of inorganic arsenic for average and 95th percentile consumers are 0.61 and 0.99 µg/kg b.w. per day in scenario 4, respectively (when upper bound of occurrence is applied). In scenario 4, fixed values for inorganic arsenic content in fish and seafood of 0.03 mg/kg and 0.1 mg/kg are assumed, and all arsenic in the the seven main food categories is assumed to be inorganic arsenic.
The median of exposure to inorganic arsenic among the 9 different scenarios was estimated by applying the assumptions for scenario 5: fixed values for inorganic arsenic content of 0.03 mg/kg and 0.1 mg/kg in fish and seafood, respectively, and the seven main food categories were considered to provide 70 % of inorganic arsenic from the reported total arsenic content.
As reported in Table 26, the mean inorganic arsenic dietary exposure ranged from 0.13 to 0.42 µg/kg b.w. per day between the countries for the lower bound, with a median of 0.30 µg/kg b.w. per day, and from 0.2 to 0.56 µg/kg b.w. per day between the countries for the upper bound, with a median of 0.43 µg/kg b.w. per day. The 95th percentile inorganic arsenic dietary exposure ranged from 0.37 to 1.03 µg/kg b.w. per day for the lower bound, with a median of 0.514 µg/kg b.w. per day, and from 0.54 to 1.22 µg/kg b.w. per day between the countries for the upper bound, with a median of 0.69 µg/kg b.w. per day.

Arsenic in food
66 EFSA Journal 2009; 7(10):1351
Table 26: Statistical descriptors (minimum, median and maximum) for the mean and 95th percentile (P95) daily inorganic arsenic exposure estimates for 19 European countries, based on scenario 5
Statistical descriptors
Inorganic arsenic exposure from scenario 5 (µg/kg b.w. per day)
Mean P95
LB UB LB UB Minimum 0.1260 0.2003 0.3705 0.5443 Median 0.2962 0.4271 0.5144 0.6920 Maximum 0.4162 0.5569 1.0253 1.2157 b.w.: body weight; P95: 95th percentile; LB: lower bound; UB: upper bound
No major differences can be observed from varying the assumptions on the concentration of inorganic arsenic in fish and seafood. Although this category represents one of the main contributors to total arsenic, the percentage of inorganic arsenic is too low to influence the overall dietary exposure in any of the scenarios presented.
The main variation in inorganic arsenic exposure was largely due to the assumptions made on the proportion of inorganic arsenic in the other selected food categories. When 50, 70 or 100 % of the total arsenic was assumed to be in the inorganic form in those food categories, the proportion of inorganic arsenic over total arsenic exposure was 25, 35 and 49 % for average consumers and 15, 20 and 29 % for 95th percentile consumers respectively.
7.3.1. Contributions of different food groups to inorganic arsenic exposure
“Cereal and cereal products” showed one of the highest contributions to total arsenic and the highest to inorganic arsenic daily exposure, as shown both in Figure 9 and in Figure 10. The inorganic arsenic input from this food category varies from 0.18 µg/kg b.w. per day (LB) to 0.22 µg/kg b.w. per day (UB), followed by “miscellaneous food and food for special dietary uses” contributing with 0.031 µg/kg b.w. per day (LB) to 0.034 µg/kg b.w. per day (UB), and finally “vegetables, nuts and pulses” with a contribution ranging from 0.022 µg/kg b.w. per day (LB) to 0.040 µg/kg b.w. per day (UB). Importantly, the category of “fish and seafood”, which contributed the highest levels of total arsenic, adds only 0.010 µg/kg b.w. of inorganic arsenic to the daily exposure. Despite the high occurrence levels of total arsenic in certain food items (from Table 6 to Table 20), the contribution of each food subcategory or subclasses to the inorganic arsenic daily exposure is influenced by the SAFs applied within the main food category and the consumption data used for the exposure assessment calculation. Extrapolating from the main food categories of the EFSA Concise Food Consumption Database the following food subclasses were identified as largely contributing to the inorganic arsenic daily exposure in the general European population: four subclasses from the food category of “cereal and cereal products” (e.g. cereal grains and cereal based products excluding rice), followed by “food for special dietary uses”, “bottled water”, “coffee” and “beer and substitutes”, “rice grains” and “rice based products”, “fish and fish products” and “other vegetables and vegetable products”.

Arsenic in food
67 EFSA Journal 2009; 7(10):1351
b.w.: body weight; LB: lower bound: UB: upper bound
Figure 10: Estimated country median consumer exposure to inorganic arsenic by different food groups (as estimated from scenario 5) using adjusted upper and lower bound mean values occurrence and individual food consumption
7.3.2. Dietary exposure to arsenic for specific groups
7.3.2.1. Infants
For infants below six months of age, an average body weight of 6.1 kg was assumed together with an average breast milk consumption of 800 g/day (see Section 6.2). A total arsenic concentration in breast milk of 0.3 µg/L is derived from the upper bound occurrence value reported by Sternowsky et al. (2002).
Assuming that arsenic in breast milk is essentially all inorganic (Fängström et al., 2008), the daily intake for an exclusively breast-fed baby amounts to <0.04 µg/kg b.w. per day at the upper bound occurrence level. Whereas, assuming that also in breast milk the 70 % of total arsenic is inorganic, as described for scenario 5, the daily intake of inorganic arsenic for a breast-fed baby is 0.03 µg/kg b.w. per day at the upper bound occurrence level.
A selection of 126 samples defined as “milk based infant formula” have been extracted from the food category “Infant and follow-on formula” of which 60 % were reported as <LOQ. An occasionally high LOQ led to an upper bound level of 0.025 mg/kg arsenic. However, when arsenic was detectable and quantifiable, the measured level was on average only 0.001 mg/kg. When addressing this discrepancy, the measured arsenic levels were considered to be more realistic, and therefore these values were used for the exposure assessment for children fed with milk-based formula. Since the preparation of ready-to-eat product from dry formula commonly includes the addition of water (1 part powder to 9 parts of water), the occurrence values, where appropriate, have also been adjusted to account for the arsenic contribution from water to the exposure assessment. “Tap water” has been assumed to be used for the preparation of “milk based infant formula”, with a total arsenic level of 0.002 mg/L, as calculated based on the results reported by the European countries.
As summarised in Table 27, the exposure to inorganic arsenic from milk-based formula (0.117 µg/kg b.w. per day) can be estimated to be more than three times higher than with breast feeding. When

Arsenic in food
68 EFSA Journal 2009; 7(10):1351
children suffer from milk intolerance, rice drinks or rice based products might potentially substitute any breast milk, infant formula or cow’s milk. Rice has higher arsenic levels than other investigated cereals (wheat and barley) (Williams et al. 2007).
Pre-cooked, milled rice is a dominant carbohydrate source to weaning babies up to one year of age due to its blandness, material properties, low allergen potential and nutritional value (Mennella et al., 2006). According to a recent study, one rice-based food portion can vary from 20 g to 30 g (Meharg et al, 2008).
Assuming average intakes of rice-based infant food of 30 g per portion, consumption on average for three meals per day would lead to a daily inorganic arsenic intake of 1.63 µg/kg b.w., as shown in Table 27. Exposure calculations are based on occurrence figures for rice-based infant food derived from only 19 samples, where detailed information was not given on the solid or liquid form of the products. Therefore, if assumed that the recipe for preparation of the rice-based food includes 200 mL water per portion, then an additional intake of 0.14 µg/kg b.w. of inorganic arsenic has to be considered (assuming a total arsenic level in water equal to the 0.002 mg/L reported for “tap water” in the occurrence dataset).
Table 27. Average inorganic arsenic exposure for infants (6 months, 6.1 kg body weight), consuming breast milk, milk based infant formula or rice-based food (estimation of inorganic arsenic is based on scenario 5, where 70 % of the total arsenic is assumed to be in the inorganic form)
Food item
Total arsenic level
Inorganic arsenic
Scenario 5
Consumption Exposure scenario 5
mg/kg mg/kg g/day µg/kg b.w. per day
Breast milk 0.0003 0.0002 800 0.0275 Milk based infant formula 0.0013 0.0009 800 0.1166 Rice-based infant food 0.158 0.110 90 1.627 Tap water 0.002 0.001 600 0.138 b.w.: body weight When children suffer from milk intolerance, rice drinks or rice based products might potentially substitute any infant formula or cow’s milk. However, data on rice-based infant formula were not submitted to EFSA and therefore no exposure assessment has been made.
7.3.2.2. Children (0.5-14 years old)
The exposure assessments for infants and children are based on the assumptions defined for scenario 5 as described in Table 24.
In a project funded by EFSA and coordinated by the University of Ghent, long-term dietary exposure to arsenic was calculated for children living in up to 11 different European countries, including Belgium, Cyprus, Czech Republic, Denmark, Finland, France, Germany, Greece, Italy, Netherlands and Spain. Food consumption data were collected from 15 different studies covering children aged from 1 to 14 years. Consumption data were combined with the inorganic arsenic concentration data, derived from scenario 5. The beta binomial-normal (BBN) model in the Monte Carlo Risk Assessment (MCRA) software was used to estimate long-term dietary exposures (De Boer and Van der Voet, 2007). In this approach all daily consumption patterns are multiplied with the average level of inorganic arsenic per food, and summed over foods per day. This results in a set of daily mean exposure levels, which are then analysed using the statistical BBN model to assess the long-term exposure. With this model the exposure can be calculated as a function of age.

Arsenic in food
69 EFSA Journal 2009; 7(10):1351
Not all Member States provided consumption information for all age groups; details are given in Table 28 on the number of Members States included in the exposure assessment divided according to the age group. For 11 to 14 years old children only 3 Members States provided data, while for 4 to 6 years old children consumption information from up to 10 countries was available.
By this model, the median (50th percentile) and the high (95th percentile) exposures to inorganic arsenic were estimated per age group and per country. Thus the results reported in Table 28, summarise the minimum, median and maximum level of exposure per age groups within the set of countries providing the consumption data. The detailed information is included in a report to be published on the EFSA website, and in a further publication (EFSA, 200924).
The 50th and 95th percentiles for inorganic arsenic exposure by age groups are also shown in Figure 11 and Figure 12 respectively. For comparison, the exposure figures for the adult population based on scenario 5 have been also reported in Figures 11-12 and Table 28 (indicated as “>14”).
Table 28: Minimum, median and maximum estimates, across three to ten Member States, of arsenic exposure in children at different ages as calculated using the beta binomial-normal model in the Monte Carlo Risk Assessment software
Number of Member States 4 6 7 10 10 10 6 6 6 6 3 3 3 3
Age in years 1 2 3 4 5 6 7 8 9 10 11 12 13 14 >14(a)
Arsenic exposure µg/kg b.w. per day for median (P50) lower bound Minimum 0.79 0.72 0.68 0.64 0.59 0.55 0.57 0.54 0.51 0.48 0.41 0.38 0.35 0.29 0.07 Median 0.83 0.78 0.74 0.71 0.67 0.63 0.61 0.57 0.52 0.49 0.47 0.44 0.42 0.40 0.27 Maximum 1.02 0.97 0.92 0.88 0.83 0.79 0.75 0.71 0.68 0.64 0.51 0.48 0.45 0.43 0.33
Arsenic exposure µg/kg b.w. per day for median (P50) upper bound Minimum 1.07 1.00 0.94 0.84 0.83 0.77 0.74 0.70 0.66 0.62 0.52 0.49 0.44 0.37 0.13 Median 1.39 1.23 1.05 0.96 0.89 0.85 0.83 0.78 0.73 0.71 0.60 0.57 0.53 0.51 0.39 Maximum 1.50 1.33 1.22 1.12 1.06 1.00 0.94 0.89 0.84 0.79 0.67 0.64 0.60 0.57 0.45
Arsenic exposure µg/kg b.w. per day for P95 lower bound Minimum 1.39 1.01 0.96 0.92 0.88 0.84 0.91 0.85 0.80 0.74 0.62 0.58 0.52 0.44 0.37 Median 1.78 1.57 1.40 1.23 1.13 1.06 1.13 1.08 1.03 0.99 0.75 0.70 0.67 0.63 0.51 Maximum 1.92 1.82 1.71 1.63 1.54 1.47 1.40 1.33 1.26 1.19 0.81 0.76 0.73 0.69 1.03
Arsenic exposure µg/kg b.w. per day for P95 upper bound Minimum 1.81 1.42 1.35 1.29 1.23 1.16 1.20 1.11 1.03 0.95 0.80 0.75 0.67 0.57 0.54 Median 2.66 2.17 1.94 1.69 1.58 1.44 1.46 1.39 1.32 1.27 0.94 0.88 0.83 0.79 0.69 Maximum 3.21 2.70 2.31 2.04 1.92 1.81 1.72 1.67 1.62 1.58 1.09 1.03 0.97 0.92 1.22 b.w.: body weight; P50: 50th percentile, median; P95: 95th percentile (a): The exposure figures for the adult population based on scenario 5.

Arsenic in food
70 EFSA Journal 2009; 7(10):1351
0.00
0.50
1.00
1.50
2.00
2.50
3.00
3.50
1 2 3 4 5 6 7 8 9 10 11 12 13 14 >14
Ars
enic
µg/
kg b
.w.
per
day
Age years
50th percentile exposure
Minimum LB Median LB Maximum LB
Minimum UB Median UB Maximum UB
b.w.: body weight; LB: lower bound; UB upper bound; The exposure figures for the adult population based on scenario 5 (indicated as “>14”).
Figure 11: Lower and upper bound minimum, median and maximum estimates across European countries of the 50th percentile inorganic arsenic exposure in children at different ages as calculated using the beta binomial-normal model in the Monte Carlo Risk Assessment software
0.00
0.50
1.00
1.50
2.00
2.50
3.00
3.50
1 2 3 4 5 6 7 8 9 10 11 12 13 14 >14
Ars
enic
µg/
kg b
.w.
per
day
Age years
95th percentile exposure
Minimum LB Median LB Maximum LB
Minimum UB Median UB Maximum UB
b.w.: body weight; LB: lower bound; UB upper bound; The exposure figures for the adult population based on scenario 5 (indicated as “>14”).
Figure 12: Lower and upper bound minimum, median and maximum estimates across European countries of the 95th percentile inorganic arsenic exposure in children at different ages as calculated using the beta binomial-normal model in the Monte Carlo Risk Assessment software
As a trend, the daily intake of inorganic arsenic diminishes with increasing age as the food intake per kg b.w decreases. The median of the 50th percentile (P50) intake of arsenic across Europe, calculated by applying the upper occurrence values, ranged from 0.51 µg/kg b.w. per day for a 14 year old child

Arsenic in food
71 EFSA Journal 2009; 7(10):1351
to 1.4 µg/kg b.w. per day for a one year old baby. In the latter case, the intake of inorganic arsenic is more than three times higher than the corresponding figure of exposure for adult populations (>14, Table 28 and Figure 11).
The median of arsenic exposure for high consumers can reach up to 2.66 µg/kg b.w. per day for a one year old baby, and 0.79 µg/kg b.w. per day for a 14 year old child. According to this exposure model, the dietary exposure of inorganic arsenic for high consumers in 14 year old children is still higher than the corresponding exposure figures for adults (from 0.51 to 0.69 µg/kg b.w. per day for 95th percentile consumers).
7.3.2.3. Comparison of exposure in Italian children versus adults
Consumption data from the 64 food categories from the INRAN database were grouped by the Istituto Superiore di Sanità (ISS) to match the Concise European Food Consumption database23. Four food consumption datasets were obtained according to the following age ranges (years): 0.5-3 (toddlers, breastfed not included; N = 52); 4-7 (children; N = 53); 8-12 (children; N = 88); 13-94 (adults; N =1747).
These consumption data were matched with occurrence data of inorganic arsenic. Scenario 5 estimating the proportion of inorganic arsenic has been taken as representative for the analysed 9 scenarios, and it has been applied also for the comparison of the exposure of Italian children and adults.
Preliminary results on the exposure assessments to inorganic arsenic are summarised in Table 29.
Table 29: Summary of exposure descriptors (µg/kg b.w. per day) to inorganic arsenic (scenario 5) for subjects of the Italian general population stratified by age ranges (95 % confidence intervals in brackets)
Exposure descriptor 0.5-3 years 4-7 years 8-12 years 13-94 years Number of subjects 52 53 88 1747
Minimum LB 0.00563 0.218 0.155 0.0846 UB 0.00953 0.312 0.203 0.114
Median LB 0.485 0.516 0.428 0.272 UB 0.774 0.709 0.584 0.371
Mean
LB
0.504 (0.446–0.562)
0.521 (0.469–0.572)
0.427 (0.397–0.457)
0.299 (0.291–0.307)
UB 0.757 (0.680–0.834)
0.705 (0.639–0.771)
0.573 (0.534–0.612)
0.400 (0.391–0.409)
P95
LB
0.844(a) 0.827(a) 0.679(a) 0.487 (0.463-0.512)
UB 1.24(a) 1.10(a) 0.901(a) 0. 631 (0.612-0.663)
Maximum LB 0.954 1.25 0.893 3.24 UB 1.32 1.66 1.08 3.51
P95: 95th percentile; LB: lower bound; UB: upper bound (a): Indicative value due to limited number of data. From Table 29, the mean dietary inorganic arsenic exposure in Italian adults appears to be 0.3-0.4 µg/kg b.w. per day (based on lower bound and upper bound arsenic occurrence means),

Arsenic in food
72 EFSA Journal 2009; 7(10):1351
whereas children’s exposure can be up to about 2 times greater than that of adults. The difference is particularly evident when splitting 0.5-3 year old toddlers from other children, although the number of subjects is low in these groups.
It should be noted that the specific Italian exposure assessment figures for children are lower than the ones obtained from the BBN model in the MCRA software. Nevertheless, when comparing the exposure figures for children up to three years of age with the corresponding figures for adults, the dietary exposure of inorganic arsenic is between two and three times greater when applying either model for exposure assessment. The discrepancies could be due to the different consumption data used for the exposure or to the clustering of the food categories to match the food groups of the EFSA Concise European Food Consumption database23. In some cases, food categories of the EFSA Concise European Food Consumption database were not included in the calculation because the relative consumption data were not available whereas in a very few cases, consumption subgroups were excluded because they did not match any of the food categories of the Concise European Food Consumption data.
7.3.3. Vegetarian exposure
Vegetarian exposure was calculated using a typical lacto-ovo vegetarian diet as identified in the EFSA Concise European Food Consumption Database.
In Table 30 only the means of exposure to total arsenic and inorganic arsenic estimated from scenario 5 as described in Table 24 are shown. As mentioned before the lacto-ovo vegetarian population selected from the EFSA Concise European Food Consumption Database is represented by only 65 individuals who did not eat meat or fish during the survey period, and 45 of them are from Great Britain. Since Great Britain is the most representative country for the vegetarian population, a comparison was made of the exposure to arsenic in the general population of Great Britain (1724 individuals) excluding the 46 vegetarians. The mean of exposure to total arsenic and the estimated exposure to inorganic arsenic as described in three different scenarios are reported in Table 30, with regard to the vegetarian population of the 5 selected countries from the EFSA Concise European Food Consumption Database, the vegetarians only from Great Britain and the population from Great Britain, excluding the 46 vegetarians.
Table 30: Mean arsenic exposure in consumers of a lacto-ovo-vegetarian diet from the EFSA Concise European Food Consumption Database and comparison with non vegetarian population from Great Britain. Values reported refer to exposure to total arsenic and to inorganic arsenic as estimated from Scenario 5.
Population group N
Arsenic exposure (µg/kg b.w. per day)
Total arsenic Scenario 5
Mean LB Mean UB Mean LB Mean UB Vegetarians 65 0.425 0.694 0.271 0.404 Vegetarians from GB only 46 0.341 0.580 0.216 0.331 Population from GB excluding vegetarians 1678 1.087 1.334 0.215 0.329 GB: Great Britain; N: number of individuals; b.w.: body weight; LB: lower bound; UB: upper bound
It should be noted that because only 65 subjects in the EFSA Concise European Food Consumption Database were identified with vegetarian dietary habits, the exposure estimates have considerable uncertainty. Inorganic arsenic mean exposure (using upper bound means of occurrence in food) was 0.29, 0.40 and 0.58 µg/kg b.w. per day when assuming 50, 70 and 100 %, respectively, of inorganic arsenic in relation to total arsenic in the seven selected food categories and a fixed value of inorganic

Arsenic in food
73 EFSA Journal 2009; 7(10):1351
arsenic in fish and seafood of 0.03 and 0.1 mg/kg, respectively. Inorganic arsenic exposure from the three reported scenarios represents from 42 to 83 % of the total arsenic exposure of a vegetarian diet.
No major differences in exposure between the vegetarian and non vegetarian population could be observed in Great Britain. However, extrapolating this result to the overall European population is not possible.
7.4. Dietary exposure to arsenic for high consumers
7.4.1. People following specific diets
For some regions in the world, rice is a dominating staple food. According to the GEMS/Food Regional Diets the average per-capita daily consumption of raw polished rice varies between 9 g/day
in Europe to 278 g/day in South-East Asia (WHO, 2003).
From other previous studies, the data for consumption of cooked rice indicate very different amounts: 225 g/day in Taiwan (Schoof et al., 1998), 750 g/day in Indian West Bengal (Roychowdhury et al., 2003), and 1500 g/day in Bangladesh (Bae et al., 2002). Although there is no detailed information available, it is assumed that some ethnic population groups in Europe could approach these examples of South-East Asian rice consumption.
With regard to high consumers of rice, a daily meal of 9 g and 300 g of raw rice is considered to represent the European diet and the rice-based diet of some ethnic population groups in Europe, respectively. In addition, the case of 9 g of rice boiled in 23 mL water (1 part of rice and 2.5 part of water, as assumed to be a common practice) and 300 g of rice cooked with 750 mL water will also be included. Water is assumed to be contaminated with 0.002 mg total arsenic/L as reported for “tap water” in the occurrence dataset, and to be completely absorbed by the rice grains.
High consumption of seafood and fish could also be considered as a special diet. In the recent study from Sirot and coworkers (Sirot et al., 2009), it was concluded that high consumers of fish can eat 600 g per week compared with 200 g for the general adult French population.
With regard to “seafood and seafood products”, previous opinions of the CONTAM Panel have has been assumed that high seafood consumers can eat up to 400 g of mussels in a single meal, although only on an occasional basis (Scientific opinions on marine biotoxins26). The influence of those special diets with a high consumption of foods containing elevated arsenic levels was tested assuming a weekly meal of 600 g of fish or 400 g of seafood.
Additional intake of inorganic arsenic could also result from high consumption of water assuming a total arsenic content of 0.002 mg/L as reported for tap water in the occurrence dataset. The CONTAM Panel considered the case of consumption of 2 L of water an additional to the base diet containing total arsenic at the reported level.
Also, the impact of a daily intake of 10 g of “algae as food” and 2 g of “bran and germ” were assessed.
The additional inorganic arsenic intake was added to the upper bound base diet for the average population, estimated from scenario 5 of 0.43 µg/kg b.w. per day without any adjustments (from Table 24). Estimated upper bound exposure with such diets calculated assuming 60 kg as body weight for adult population is shown in Table 31.
26 www.efsa.europa.eu

Arsenic in food
74 EFSA Journal 2009; 7(10):1351
Exposure scenario 5 is only taken as an example to estimate the inorganic arsenic dietary exposure in the case of special diets. As already mentioned, in scenario 5, fixed values for inorganic arsenic of 0.03 mg/kg in fish and 0.1 mg/kg in seafood are assumed, and the seven main food categories are considered to provide 70 % of inorganic arsenic from the reported total arsenic values. This scenario resulted in the median value of dietary exposure of inorganic arsenic among the 9 scenarios tested for adult populations and it was therefore chosen as representative also for special population groups.
Table 31: Changes to inorganic arsenic exposure (scenario 5) by the addition of special dietary components to the base diet
Food item Total arsenic
level
Inorganic arsenic
Scenario 5
Consumption Exposure scenario 5
Additional exposure from
specific diet
Specific diet + exposure scenario 5
mg/kg mg/kg g or mL/day µg/kg b.w. per day
(A)
µg/kg b.w. per day (B)
µg/kg b.w. per day
(A+B) Fish and fish products ‐ 0.030 86
0.43 0.043 0.47
Seafood and seafood products ‐ 0.100 57 0.095 0.52
Rice grains(a) 0.142 0.100 300
0.43
0.498 - Tap water(a) 0.002 0.001 750 0.018 - Rice grains boiled in water-ethnic diet(a)
0.95
Rice grains(b) 0.142 0.100 9
0.43
0.015 - Tap water(b) 0.002 0.001 23 0.001 Rice grains boiled in water-European diet(b)
0.45
Tap water 0.002 0.001 2000 0.43 0.047 0.48 Bran and germ 2.134 1.494 2 0.43 0.050 0.48 Algae as food(c) 30.871 21.610 10 0.43 3.602 4.03 b.w.: body weight; (a): Rice consumption assumed for ethnic diets; inorganic arsenic intake for the boiled rice is due to the arsenic contribution
from rice grains and from water. (b): Rice high consumption assumed for European diets; inorganic arsenic intake for the boiled rice is due to the arsenic
contribution from rice grains and from water. (c): 70 % inorganic arsenic content is used as a worst case scenario for algae, since the algae species was not specified in
most of the cases. This proportion applies mainly to hijiki, most edible algae can contain less inorganic arsenic than this.
The impact of the special diets on dietary exposure was high especially for people that regularly consume algae as food, whereby the exposure to inorganic arsenic can be 4 µg/kg b.w. per day. Seaweeds are known to contain high levels of arsenic and for some species such as hijiki, the arsenic is mainly inorganic. Taking into account that most edible algae less than 70 % of the reported total arsenic is inorganic, the case of hijiki was considered as the worst case scenario due to the fact that the algae species was not specified for most of the reported samples.
Some ethnic diets are characterised by a relevant dietary exposure of inorganic arsenic of 0.95 µg/kg b.w. per day. In this case, the contribution of inorganic arsenic to the base diet of scenario 5 (0.43 µg/kg b.w. per day) is mainly coming from rice (0.498 µg/kg b.w.) and assuming water to be completely absorbed by the rice grains, an additional contribution of 0.018 µg/kg b.w. derives from the cooking water (total arsenic level in water of 0.002 mg/L as reported in the current dataset for “tap

Arsenic in food
75 EFSA Journal 2009; 7(10):1351
water”). Little additional exposure (when compared to ethnic diets) of inorganic arsenic was estimated for high rice consumers following a European diet.
For high consumers of fish or seafood, the estimated inorganic arsenic exposure was 0.47 and 0.52 µg/kg b.w. per day, respectively. These figures are supported by the recent French exposure assessment (Sirot et al., 2009) reporting a weekly exposure to inorganic arsenic in females of 3.34±2.06 µg/kg b.w. and in males of 3.04±1.86 µg/kg b.w.
Consumption of two additional litres of water contaminated with arsenic at 0.002 mg/L, as reported in the current dataset for “tap water”, results in exposure of 0.48 µg/kg b.w. per day of inorganic arsenic.
7.5. Estimates of non-dietary exposure to arsenic
The general population is exposed to arsenic from non-dietary sources such as ambient air, smoking and soil. Inhalation and dermal exposure are of importance in certain occupational scenarios.
7.5.1. Ambient air
Arsenic exists in the atmosphere primarily as As2O3 particles or bound to particulate matter. Traces of volatile organoarsenic compounds may also be present. Background concentrations in air are variable but generally they range from <0.001 to 0.003 µg/m3 although concentrations in cities may range up to 0.10 µg/m3 (Davidson et al., 1985). Considering 60 kg b.w. and a daily ventilation volume of 20 m3, the inhaled amount of arsenic would be around 0.001 µg/kg b.w. per day in background situations and up to 0.03 µg/kg b.w. per day in polluted urban areas.
7.5.2. Smoking
In 1927, Remington reported on a “hitherto unsuspected source of arsenic in human environment” (Remington, 1927). He reported that samples of smoking and plug tobacco contained 6 to 30 µg arsenic trioxide per g of tobacco. Similar levels were reported by Gross and Nelson (1934) and they also identified the source to be lead arsenate applied to plants during the growing season in order to control insect pests. In the 1960s, the arsenic content in US cigarette tobaccos was reported to be 5-10 µg per cigarette (Lee and Murphy, 1969). According to the US Surgeon General (USSG, 1989), the arsenic content of US cigarettes in the late 1980s was still high – 0.5-0.9 µg/g in processed tobacco, and 0.04-0.12 µg per cigarette in mainstream smoke. Based on these data, 10 % to 17 % of the arsenic in tobacco could appear in mainstream smoke (Hoffman and Hecht, 1990).
Arsenic in quantities ranging up to 1.4 µg per cigarette have been reported by Smith et al. (1997). Of 27 brands selected by the tobacco industry to profile the range of cigarettes on the US market, and tested in 1999 by leading tobacco manufacturers for the Massachusetts Department of Health, the mean arsenic content in mainstream smoke was around 0.01 µg per g of tobacco (assuming that one cigarette contains 1 g of tobacco) with a wide range from 0.0034-1.4 µg per g.
Thus, it is likely that cigarettes sold today do not contribute more than 0.01 to 0.1 µg per cigarette in mainstream smoke. For an average smoker, consuming 20 cigarettes per day the contribution from smoking could then be 0.2 to 2 µg per day or considering a 60 kg person, 0.003 to 0.03 µg/kg b.w. per day.
7.5.3. Soil
Human exposure to arsenic via soil could be of special importance for children living in contaminated areas. In a study by Wickre et al. (2004), the concentration of arsenic in toe nails was shown to be

Arsenic in food
76 EFSA Journal 2009; 7(10):1351
higher in children compared to adults living in a contaminated area in Nicaragua. The arsenic concentration in toe nails from adults was correlated to the concentration in drinking water, whereas the elevated concentrations in children’s toe nails were correlated to the arsenic concentrations in soil. This indicates that soil could be an important route of exposure for children living in areas with elevated levels of arsenic. In a small study from Sweden, no age-specific differences in nail arsenic concentrations could be identified (Rodushkin and Axelsson, 2000). In general, within the EU the contribution to total human arsenic exposure from soil is likely to be low compared to the arsenic dietary exposure.
7.6. Importance of dietary and non-dietary sources of human exposure to inorganic arsenic
Based on the available information presented above, ambient air could make a contribution of 0.001 µg/kg b.w. to the daily arsenic exposure whereas smoking could contribute up to 0.03 µg/kg b.w. per day. Soil could be of importance for the exposure of children in highly contaminated areas not representative for the general situation within the EU. Thus, non dietary exposure to arsenic is likely to be of minor importance for the general population within the EU.
A summary of different exposure sources of inorganic arsenic is presented in Table 32. Oral exposure from food is clearly the dominating source of overall arsenic exposure for adults and children. Highly contaminated food can increase up to 10 times the total dietary exposure from a median of 0.43 µg/kg b.w. per day in the mean diets of European countries up to a maximum of 4.03 µg/kg b.w. per day in a simulated extreme diet containing large amounts of a high arsenic alga. Some ethnic diets could almost double the mean dietary inorganic arsenic exposure. With regard to infants up to six months old, the inorganic arsenic exposure can be more than three times higher when the diet is based on infant formula rather than breast milk. High dietary exposure of inorganic arsenic has been also estimated in the case of children fed with rice-based food, according to occurrence data provided. Exposure estimates reported for 0.5 to 3 year-old children in two different studies, show the inorganic arsenic dietary exposure ranging from 0.50 to 2.66 µg/kg b.w. per day.

Arsenic in food
77 EFSA Journal 2009; 7(10):1351
Table 32. Overview of mean daily inorganic arsenic exposure estimates. Dietary exposure figures are based on scenario 5
Exposed population Pathway
Range of calculated or reported exposures (µg/kg b.w. per day)
Average consumers
High consumers
Dietary Exposure(a)
Adult (base diet) Oral 0.13-0.56 0.37-1.22 Infant (6 months)_breast fed Oral 0.04 Infant (6 months)_ fed with infant formula Oral 0.116 Infant (6 months)_ fed with rice based food Oral 1.63-1.76(d) Children <3 years old(b) Oral 0.5-0.76 0.84-1.24 Children <3 years old(c) Oral 0.74-1.39(e) 1.47-2.66(e) Consumers of algae as food Oral 4.03 Consumers of ethnic rice based diets Oral 0.95 Vegetarians Oral 0.27-0.40
Inhalation exposure
Ambient air Inhalation 0.001 Smokers Inhalation 0.03
b.w.: body weight (a): Exposure estimation based on the occurrence figures provided in the current opinion. (b): Exposure estimation based on INRAN (Italian Istituto Nazionale di Ricerca per gli Alimenti e la Nutrizione)
consumption data for children. (c): Exposure estimation based on European consumption data for children (EFSA, 200924). (d): Reported range refers to intake of inorganic arsenic from “rice based food” only and from “rice based food” combined
with the possible water used for the food preparation. (e): Reported exposure figures refer to the range of varability of the medians (instead of the mean) within the age groups
ranging from 1 to 3 years old.
8. Hazard identification and characterisation
8.1. Toxicokinetics
8.1.1. Absorption
Each of the forms of arsenic has different physicochemical properties and bioavailability. Several studies in rats and mice and in humans indicate that arsenite and arsenate present in drinking water are rapidly and nearly completely (about 95 %) absorbed after ingestion (ATSDR, 2007). However, the absorption of ingested inorganic arsenic varies, depending on the solubility of the arsenical compounds (the more water soluble the compound, the greater its absorption), the presence of other food constituents and nutrients in the gastrointestinal tract, and on the food matrix itself. For example, Juhasz et al. (2008) demonstrated that whereas the bioavailability of inorganic arsenic present in mung beans was almost 100 % in swine, this percentage was only 50 % for lettuce and chard, suggesting an influence of the non-digestible polysaccharide component of the vegetable on the gastrointestinal absorption of arsenic. Using the same animal model, these authors demonstrated that speciation plays a major role in determining the amount of arsenic absorbed after consumption of arsenic-contaminated rice (Juhasz et al., 2006). For rice bought at the supermarket and cooked with arsenic contaminated water, arsenic was present entirely in the inorganic form, and bioavailability was high (89 %). Conversely, 86 % of total arsenic was present as dimethylarsinate in greenhouse-grown rice (using irrigation water contaminated with sodium arsenate), resulting in the absorption of only 33 % of the total rice-bound arsenic.

Arsenic in food
78 EFSA Journal 2009; 7(10):1351
Significant interspecies differences have been reported for organic arsenic bioavailability. In rodents, compounds such as methylarsonate and dimethylarsinate, in which arsenic is present as the pentavalent form, are absorbed to a significant extent (>40 % of ingested dose) from the gastrointestinal tract, while the trivalent organoarsenicals are generally poorly absorbed (Goodman and Gilman, 1980; Vahter, 1994; Hughes et al., 2005). Recently, Juhasz et al. (2006) found that gastrointestinal absorption of methylarsonate and dimethylarsinate in swine was 17 and 33 %, respectively. Little data exist on the absorption of organic arsenic in humans. In a study performed by Buchet et al. (1981) with volunteers who ingested a single oral dose of arsenic (500 µg arsenic) either as methylarsonate, or dimethylarsinate, the amount of arsenic excreted in urine after four days represented 78 and 75 % of the ingested dose respectively, suggesting a gastrointestinal absorption >75 % for pentavalent organoarsenicals. Francesconi et al. (2002) found that approximately 80 % of arsenosugar was excreted in urine in one male volunteer four days after ingestion, giving evidence of almost complete absorption in humans. However, more recent data based on urinary excretion suggest considerable individual variability in the absorption of arsenosugars (Raml et al., 2009).
The very early studies of arsenic in fish and crustaceans (i.e. mostly arsenobetaine) indicated that arsenobetaine was efficiently absorbed and excreted unchanged (Chapman, 1926), and many subsequent studies showing >70 % recovery of seafood arsenic in the urine within two days have supported this view (Freeman et al., 1979; Tam et al., 1982). However, there appear to be no precise quantitative data on arsenobetaine absorption by humans. A study with 74-arsenic-labelled arsenobetaine administered to six volunteers measured the whole body content of the labelled arsenic (Brown et al., 1990). Unfortunately, the first measurement point was after one day by which time much of the absorbed arsenobetaine would have already been excreted in the urine. The reported whole body content after one day, however, was about 50 % of the ingested dose, and this value dropped steadily over the following days. These results are consistent with essentially complete absorption of arsenobetaine.
8.1.2. Distribution
In the bloodstream, arsenic is distributed between the plasma and the erythrocytes, in which it is bound to the globin of hemoglobin. The relative amounts in each compartment depend on the valency and dose of arsenic administered as well as the species of animal. Both arsenite and arsenate are readily transported to the cell, the former by aquaglycoporins 7 and 9, which normally transport water and glycerol, and the latter by phosphate transporters (Liu et al., 2002, Villa-Bellosta and Sorribas, 2008; Schuhmacher-Wolz, 2009). Hexose permease transporters are another pathway for influx of arsenite (Hernandez and Marcos, 2008). In most species, after the administration of arsenicals, residue levels are elevated in liver, kidney, spleen and lung. However, several weeks later, arsenic is translocated to hair, nails and skin because of the high concentration of sulfur-containing proteins in these tissues. In experiments on mice orally administered 74-arsenic-labelled arsenite or arsenate for periods of 9 days (Hughes et al., 2003) or 12 weeks (Vahter, 1983), the radiolabel was widely distributed to all tissues, with the highest levels found in skin, kidney, liver, and lung. Residual levels tended to be higher for arsenite than arsenate. In a recent study, tissue distributions for inorganic arsenic and its methylated metabolites were assessed in female mice exposed to 0.5, 2, 10 or 50 mg/L arsenic (as arsenate) in their drinking water for 12 weeks, corresponding to an average daily elemental arsenic intake of 0.08, 0.35, 1.9 and 7.0 mg arsenic/kg b.w., respectively (Kenyon et al., 2008). Total tissue arsenic accumulation (measured as the sum of inorganic arsenic, methylarsonate and dimethylarsinate) was greatest in kidney > lung > urinary bladder > skin > blood > liver. Methylarsonate was the predominant metabolite in the kidney, whereas dimethylarsinate was the predominant metabolite in the lung. Adair et al. (2007) also exposed a group of adult female rats to 100 mg arsenate/L drinking water for 14 days, which corresponds to an estimated daily intake of 2.2 mg arsenic/kg b.w. Most of the arsenic in the rats was found in the blood as dimethylarsinate. Although the experiment duration was different between the Adair and Kenyon studies, it is noteworthy that whole blood arsenic levels were 1800-fold higher in rats in comparison to mice for similar exposure levels. Rats differ from most

Arsenic in food
79 EFSA Journal 2009; 7(10):1351
mammalian species by accumulating arsenic in erythrocytes, probably by binding trivalent arsenic species to cysteine components (Cys-13α) in the haemoglobin (Lu et al., 2004). According to Lu et al. (2007), the binding affinity of trivalent arsenic species to red blood cells is 15- to 30-fold higher in rats than in humans.
In mice and rats orally administered 74-arsenic-labelled dimethylarsinate, accumulation occurred in kidneys > lungs > intestinal mucosa > stomach > testes within six hours after dosing (Vahter et al., 1984). Although the concentration of dimethylarsinate decreases rapidly in most tissues, the longest retention times were observed in the lungs, thyroid and intestinal mucosa. The disposition of trivalent (methylarsonite) and pentavalent (methylarsonate) methylarsenic species in mice was investigated, following a single oral administration (0.4 or 40 mg arsenic/kg b.w.) of these compounds by Hughes et al. (2005). The highest residue levels (measured as methylarsonate and dimethylarsinate) were found in the urinary bladder and kidney for the pentavalent methylarsonate group, and in the lung for the trivalent methylarsonite group. In pentavalent methylarsonate-dosed mice (0.4 mg arsenic/kg b.w.), dimethylarsinate ranged from undetectable in blood, to 19 % in the lung, whereas in trivalent methylarsonite-dosed animals, dimethylarsinate ranged from 75 % in the blood to 100 % in the bladder, kidney and lung.
Arsenic readily passes through the placenta in mammals (Lindgren et al., 1984; Willhite and Ferm, 1984), including humans (Concha et al., 1998; Hall et al., 2007), resulting in similar exposure levels in both the fetus and the mother. Both inorganic arsenic and its methylated metabolites, methylarsonate and dimethylarsinate, pass through the placenta (Lindgren et al., 1984; Concha et al., 1998; Devesa et al., 2006). In newborn babies of women exposed to arsenic via drinking water in Argentina, essentially all arsenic in plasma and urine was in the form of dimethylarsinate, suggesting that it is mainly this metabolite that reaches the foetal in late gestation (Concha et al., 1998). Similar results have been reported from experimental studies on mice, with most of the arsenic in foetal tissues being dimethylarsinate (Devesa et al., 2006). The metabolic methylation of arsenic via one-carbon metabolism increases in women during pregnancy (Concha et al., 1998; Hopenhayn et al., 2003a). For that reason, the human foetal is likely to be exposed to more inorganic arsenic and methylarsonate in early gestation. Furthermore, efficient maternal methylation to dimethylarsinate is likely to increase the rate of excretion in maternal urine (Vahter, 2002).
There seems to be only one report showing placental transfer of arsenobetaine in mammals (Kubota et al., 2005). Total arsenic concentrations in the liver, kidney, muscle and blubber of a female Dall’s porpoise (Phocoenoides dalli) were 0.76, 0.69, 0.35 and 0.55 mg/kg wet weight, respectively, while the corresponding concentrations in tissues of her six month old foetal were 0.28, 0.23, 0.26 and 0.07 mg/kg wet weight, respectively. Arsenic speciation revealed that arsenobetaine was the major arsenic compound in the liver, kidney and muscle of both mother porpoise and foetal, ranging from 76 to 91 % of the total arsenic in the tissues. Dimethylarsinate, arsenocholine, methylarsonate and an unidentified arsenic compound were also detected as minor constituents in the tissue of both mother and foetal.
In contrast to the rapid transfer of arsenic to the fetus, very little arsenic is excreted in breast milk. Indigenous women in the Argentine Andes exposed to about 200 µg/L arsenic in their drinking water showed very low excretion in breast milk (ca. 3 µg/L) (Concha et al., 1998). Results of a study conducted in Bangladesh indicate low arsenic concentrations in breast-milk samples (median 1 µg/kg; range 0.25 to 19 µg/kg) despite high arsenic exposures from drinking water (about 50 µg/L) (Fängström et al., 2008). As the small amounts of arsenic passing to milk is almost entirely in inorganic form (Fängström et al., 2008), it seems likely that efficient maternal methylation of arsenic protects against excretion in breast milk.

Arsenic in food
80 EFSA Journal 2009; 7(10):1351
8.1.3. Metabolism
In most mammalian species, including humans, the inorganic arsenicals are extensively biotransformed and are excreted mainly as their metabolites. Arsenate enters the cell via the phosphate carrier system and can be biotransformed enzymatically (about 50-70 % in mammals) to the more reactive arsenite (Aposhian et al., 2004) by glutathione reductase, and also by purine nucleoside phosphorylase (PNP) as proposed recently on the basis of in vitro experiments (Gregus and Nemeti, 2002; Radabaugh et al., 2002). In mammals, arsenite undergoes oxidative methylation in the liver by addition of a methyl group from S-adenosylmethionine, catalysed by arsenic-methyltransferase and resulting in the formation of methylarsonate (Figure 13). The pentavalent arsenic in methylarsonate is then reduced to the trivalent form in methylarsonite by glutathione-S-transferase ω1, also known as methylarsonate reductase (Tseng, 2007). While formation of the pentavalent methylated arsenic metabolites can indeed be regarded as detoxification, production of trivalent methylarsonates is rightly considered to be bioactivation, and thus the latter process, if significant, may contribute to the toxicity of trivalent arsenic (Csanaky et al., 2003).
Formation of methylarsonite facilitates the addition of a second methyl group via oxidative methylation to yield dimethylarsinate (Pott et al., 2001). It is unclear to what extent dimethylarsinate is reduced to dimethylarsinite in vivo, especially as dimethylarsinite is an unstable intermediate and difficult to measure (Hansen et al., 2004; Francesconi and Kuehnelt, 2004). In rodents (mainly rat), dimethylarsinate probably via dimethylarsinite, can be further methylated and excreted as trimethylarsine oxide (pentavalent form) (Cohen et al., 2006). Trimethylarsine oxide can also be reduced to trimethylarsine (trivalent form). Trimethylarsine oxide is not usually detected in human urine (Cohen et al., 2006), however, it was found in the urine of a human subject who had ingested a high dose of dimethylarsinate (Marafante et al., 1987).
The testes have the highest specific activity for methyltransferase in mice, followed by the kidneys, liver and lungs (Healy et al., 1998). However, it is believed that the liver is the major site for the methylation of arsenic because of its mass and the first pass effect of ingested arsenic (Vahter, 2002). Although incubation of sodium arsenate with caecal contents in vitro resulted in its reduction and subsequent methylation (Hall et al., 1997), there is no evidence that gut microflora play a significant role in the metabolism of arsenic in vivo (Coates and Walker, 1992; Rowland, 1995).
Another pathway was proposed recently by Hayakawa et al. (2005), suggesting that trivalent methylated arsenic species may be formed before the respective end products of pentavalent species. In this newly proposed scheme, arsenite reacts with glutathione, becoming arsenic triglutathione which has been identified in the bile of rats treated either with arsenate or arsenite (Cui et al., 2008). Arsenic triglutathione is then methylated by arsenic-methyltransferase by transfer of the methyl group from S-adenosylmethionine, resulting in monomethylarsenic diglutathione, which is further methylated by arsenic-methyltransferase to dimethylarsenic glutathione or it becomes methylarsonite after reacting with glutathione. Monomethylarsenic diglutathione and dimethylarsenic glutathione are biliary metabolites of arsenic in rats (Cui et al., 2008).
Because the reduced methylated arsenic metabolites, methylarsonite and dimethylarsinite, are reactive species, they are not readily determined in biological samples. There have however, been several reports of their presence in urine (Mandal et al., 2001; Valenzuela et al., 2005), although the analytical quality of these data has been questioned (Francesconi and Kuehnelt, 2004; Slejkovec et al., 2008). It is worth noting that most studies on arsenic urine metabolites have failed to detect these reduced methylated species despite specific efforts to do so (e.g. Slejkovec et al., 2008). Thio-dimethylarsinate has been shown to be a urine metabolite from Bangladeshi women (Raml et al., 2007) and the suggestion was that this species may previously have been misidentified as dimethylarsinite. The reduced methylated species have also been detected in hair and fingernails (Mandal et al., 2001), samples which might present fewer analytical difficulties in terms of sample storage and instability.

Arsenic in food
81 EFSA Journal 2009; 7(10):1351
A more recent study however, reported only inorganic arsenic, methylarsonate and dimethylarsinate in the toenails of an arsenic-exposed group of 17 people (Button et al., 2009).
There are considerable differences between species in arsenic biotransformation. Most studied animals are more efficient in methylating arsenic to dimethylarsinate than humans, except the chimpanzee and marmoset monkey which have been shown not to methylate arsenic at all (Cui et al., 2008). In addition, many factors such as age, gender, nutritional status and race affect arsenic biotransformation in humans, and marked inter-individual variations in arsenic metabolism have been observed. For example, the percentage of methylarsonate in urine may vary from 1 to 30 % depending on individuals. Such variations are partly due to a genetic polymorphism in the regulation of enzymes responsible for arsenic metabolism. This issue is addressed in Section 8.3.4 “Susceptible population”.
Although arsenobetaine present in seafood is not metabolised in humans and is excreted unchanged in urine (Ma and Le, 1998), arsenosugars, which are abundant in seaweeds and many molluscs, are essentially completely metabolised (Ma and Le, 1998; Francesconi et al., 2002). The presence of arsenosugars in foods is of interest because these compounds are biotransformed in humans mainly to dimethylarsinate, the same metabolite produced from ingested inorganic arsenic. The gastrointestinal microflora probably play a role in the conversion of arsenosugars to bioavailable metabolites as demonstrated in vitro with mice caecum contents by Conklin et al. (2006) and by in vivo experiments carried out in sheep (Hansen et al., 2003). The human metabolism of arsenolipids also results in the formation of dimethylarsinate, which is then excreted in the urine (Schmeisser et al., 2006).
8.1.4. Excretion
Arsenic and metabolites are readily excreted in urine and bile. Although rats tend to excrete preferentially arsenic and metabolites into bile (Csanaky et al., 2003), the major route of excretion of arsenic compounds in most mammalian species and humans is via urine, and dimethylarsinate is the primary urinary metabolite (Schuhmacher-Wolz et al., 2009). In rats and hamsters intraperitoneally injected with arsenate, approximately half of the administered dose was excreted in bile and urine within two hours, whereas rabbits eliminated 20 % of the dose during the same period. The urinary excretion profiles of arsenic and its methylated metabolites are highly variable among species (Vahter, 1994; Csanaky et al., 2003). In contrast to most other mammals, humans excrete appreciable amounts of methylarsonate in urine. The composition of urinary arsenic metabolites varies from person to person and has been interpreted to reflect arsenic methylation efficiency, with a typical profile of urinary arsenic metabolites consisting of 10-30 % inorganic arsenic, 10-20 % methylarsonate and 60-70 % dimethylarsinate (Vahter, 1999). Urinary dimethylarsinate percentage has been regarded as an indicator of methylation efficiency. Some authors calculate the primary methylation index defined as the ratio between methylarsonate and inorganic arsenic (arsenate + arsenite) level, and secondary methylation index as the ratio between dimethylarsinate and methylarsonate to assess the arsenic methylation capacity of the first and second methylation step respectively. Others calculate the percentage ratio between methylarsonate plus dimethylarsinate and total arsenic to assess the methylation capacity (Tseng, 2007).

Arsenic in food
82 EFSA Journal 2009; 7(10):1351
SAM: S-adenosylmethionine; As3MT: arsenic-methyltransferase; GSH: glutathione.
Figure 13: Proposed metabolic pathways of inorganic arsenic in mammals (adapted from Cui et al., 2008).
As OHOH
OHO As OH
OH
OHAs CH3
OH
OHO
As CH3
OH
OH
As CH3
CH3
OHOAs CH3
CH3
OH
As SGSG
SGAs SGCH3
SG
As CH3
CH3
SG
As CH3
CH3
OH
As CH3
CH3
OHO
As OHCH3
OH
As OHCH3
OHO
Arsenate (As(V)) Arsenite (As(III)) Methylarsonate (MA)
Methylarsonite (MA(III)) Dimethylarsinate (DMA)
GSH
reductas
SAM
As3MT
GSH reductas
SAM
As3MT
GSH
reductas
Arsenic
Monomethylarsenidiglutathione
Dimethylarsinite (DMA(III))
Methylarsonite (MA(III))
Dimethyl arsenic
glutathione
Dimethylarsinate (DMA)
Dimethylarsinite (DMA(III)) Methylarsonate (MA)
GSH
GSH
GSH
SAM
As3MT
SAM As3MT

Arsenic in food
83 EFSA Journal 2009; 7(10):1351
8.1.5. Physiologically based pharmacokinetic (PBPK) models
Several physiologically based models were developed to describe the absorption, distribution, metabolism, and elimination of arsenic in target organs. Mann et al. (1996a, 1996b) extended an inorganic arsenic PBPK model developed for hamsters and rabbits to humans. Their model described the pharmacokinetics of arsenite, arsenate, methylarsonate and dimethylarsinate. The routes of intake considered were inhalation of arsenic dust and fumes, and oral intake of arsenic via drinking water and food. The model consisted of lungs, blood (plasma and red blood cells), the liver, skin, kidneys and remaining tissues. Distribution of arsenic into tissues was described using a diffusion-limited model based on the fact that non-ionised compounds such as arsenite freely diffuse through the capillary membrane whereas ionised compounds such as arsenate, methylarsonate and dimethylarsinate diffuse only through the pores of the membranes. Partition coefficients were originally estimated from rabbit and hamster data and assumed to be the same for humans. Metabolic rates for reduction and methylation (Vmax and Km), in addition to oral absorption rate constants, were all optimised using data obtained from the cumulative excretion of arsenic and its metabolites in urine from human volunteers. The model gives satisfactory results for comparing the urinary excretion of arsenic metabolites under different exposure conditions, especially different routes of absorption and different oxidation states of the absorbed inorganic arsenic.
Yu (1999a, 1999b) developed a PBPK model for short-term oral exposure to inorganic arsenic in humans. The model described four circulating species (arsenite, arsenate, methylarsonate and dimethylarsinate) in various tissue groups and considered both reductive metabolism and methylation. Transport into tissues was modelled as a flow-limited process. Partition coefficients determined in the Yu model were based on a single study using a child poisoning case. Using this model, the input parameters that most significantly affected the output of the model were the maximum methylation reaction rate, the level of GSH for determination of the reaction rate of arsenate to arsenite, and the urinary excretion constants.
Recently, El-Masri and Kenyon (2008) published a model consisting of interconnected individual PBPK sub-models for arsenite, arsenate, methylarsonate, and dimethylarsinate in humans. Each sub-model was constructed using flow-limited compartments describing the mass balance of the chemicals in the gastrointestinal (GI) tract, the lungs, liver, kidneys, muscles, skin, heart, and brain. The metabolism of inorganic arsenic in the liver was described as a series of reduction and oxidative methylation steps incorporating the inhibitory influence of metabolites on methylation. The inhibitory effects of arsenite on the methylation of methylarsonite to dimethylarsinate, and methylarsonite on the methylation of arsenite to methylarsonate were modelled as non-competitive. To avoid the uncertainty inherent in the estimation of many parameters from limited human data, a priori independent parameter estimates were derived using data from diverse experimental systems including human cells and tissues.
Liao et al. (2009a) refined the basic compartmental structure that was previously employed in PBPK models for arsenic exposure in humans, taking into account variations of physiological parameters such as blood flow rates, organ volumes and water elimination according to age.
8.2. Toxicity in experimental animals
8.2.1. Acute and short term toxicity
8.2.1.1. Inorganic arsenic
Available LD50 values for inorganic arsenic are 15 to 145 mg/kg b.w. for arsenite in the rat, 26-39 mg/kg b.w. for arsenite in the mouse and 112-175 mg/kg b.w. for arsenate in the rat (ATSDR, 2007). The variability in LD50 values can be attributed to differences in species, strain, specific

Arsenic in food
84 EFSA Journal 2009; 7(10):1351
compound, and testing laboratory. Most deaths occurred within 1 day of exposure, but details regarding cause of death were not generally reported. Data on lethality from subacute exposure studies (<2 weeks) in animals are relatively sparse.
8.2.1.2. Organic arsenic
The oral LD50 values reported by WHO (2001) and ATSDR (2007) are as follows:
- methylarsonate: 102 (male rabbit), 1800 (male mouse), 961 and 2449 (female rat), 1101 and 3,184 (male rats) mg/kg b.w.
- dimethylarsinate: 1,200 and 1,800 (male mouse), 644 (female rat), and 1313 and 1433 mg/kg b.w. (male rat)
- Roxarsone: 81 and 155 (female rat) and 244 (female mouse) mg/kg b.w.
- Trimethylarsine oxide and arsenobetaine: >10,000 mg/kg b.w. (weanling male mouse)
A literature search up to July 2009 did not provide any new data.
8.2.2. Repeat dose toxicity
8.2.2.1. Inorganic arsenic
It is generally considered that trivalent arsenic compounds are more toxic than the pentavalent forms, at least at high doses. Oral exposure to inorganic arsenic has a number of effects, including cardiovascular, respiratory, gastrointestinal, haematological, immune, reproductive, and nervous systems (WHO, 2001; ATSDR, 2007).
Arsenate and arsenite have been shown to alter cardiovascular response in studies in rats and rabbits. A recent study in rats given 50 mg/L arsenite and arsenate in drinking water for 200 days showed an elevation in blood pressure up to day 80, followed by a time-dependent change in anti-oxidative enzymes, with the effects of arsenite more marked than those of arsenate. The most common marker of hypertension, the angiotensin-converting enzyme (ACE), showed no significant change in either arsenic group whereas CYP4A was highly expressed in both groups. The authors concluded that CYP4A might be more important than ACE in contributing to arsenic-induced hypertension (Yang et al., 2007). Sodium arsenite (50 µg arsenic/mL) in drinking-water to rats (18 months) or rabbits (10 months) was associated with decreased in cardiac stroke volume and output and increased vascular resistance (WHO, 2001). Respiratory effects have been reported at higher doses, and may be secondary to effects on the pulmonary vasculature (ATSDR, 2007). Signs of gastrointestinal irritation have been reported, particularly in studies with administration by gavage. In two-year feeding studies, there was evidence of gastrointestinal injury in dogs at 2.4 mg/kg b.w. per day arsenite, but not in rats at doses of arsenate or arsenite up to 30 mg/kg b.w. per day (ATSDR, 2007). Changes in blood cell counts, in enzymes associated with haem synthesis and anaemia have been reported in a number of studies. The lowest arsenite doses (administered in drinking water) associated with altered haemotocrit were 0.9 mg/kg b.w. per day in rats and 0.7 mg/kg b.w. per day in guinea pigs (ATSDR, 2007). More recent studies have focussed on the immune, reproductive and nervous systems.

Arsenic in food
85 EFSA Journal 2009; 7(10):1351
8.2.2.2. Organic arsenic
For organic arsenic, the available data from studies in experimental animals relate to methylarsonate, dimethylarsinate and roxarsone. Unlike inorganic arsenic, these have been found not to cause cardiovascular effects (ATSDR, 2007). The CONTAM Panel decided not to consider the toxicity of roxarsone in detail, since it is not permitted for use in the EU and is unlikely to be present in food.
Methylarsonate has been shown to have effects on the gastrointestinal tract, kidney, thyroid and reproductive system (ATSDR, 2007). The most sensitive effect is diarrhoea, which has been reported in rats, mice, rabbits and dogs, occuring at decreasing doses with increasing duration of treatment. Histological alterations in the GI tract generally occurred at higher doses than the lowest dose resulting in diarrhoea. The lowest NOAEL following dietary administration was 3.0 mg/kg b.w. per day in a two-year dietary study in rats in which the lowest observed adverse effect level (LOAEL) for diarrhoea was 25.7 mg/kg b.w. per day (Arnold et al., 2003).
Dimethylarsinate has effects on the urinary bladder, kidneys, thyroid and foetal development. The most sensitive effect is considered to be carcinogenicity of the bladder (see Section 8.3.3). Roxarsone has effects on the GI tract, kidney and nervous system, with the most sensitive effect being neurotoxicity in the pig (ATSDR, 2007).
8.2.3. Immunotoxicity
8.2.3.1. Inorganic arsenic
In male mice exposed to arsenate at levels of 2.5, 25 and 100 mg/L in drinking water for 10-12 weeks no evidence of immunosuppression was detected (Kerkvliet et al., 1980); a NOAEL at 25 mg/kg b.w. per day (ATSDR, 2007) was reported. In contrast arsenate concentrations of 0.5, 5 and 50 mg/L in drinking water administered to female mice for 12 weeks have been shown more recently to modulate function of the isolated peritoneal macrophages (Arkusz et al., 2005). With respect to arsenite in male mice, 3 weeks of exposure from drinking water (0.5, 2.0, 10 mg/L) resulted in immunosuppression of the humoral response, suppressing both primary and secondary immune response (Blakley et al., 1980). In day-old chicks 3.7 mg/L inorganic arsenic in drinking water for up to 60 days suppressed the cellular and humoral immune response (Aggarwal et al., 2008).
Studies observing effects on the immune system at environmentally relevant low arsenic concentrations have recently been published. Thus, in zebrafish embryos 2 and 10 µg inorganic arsenic/L egg water for several days resulted in amplified pathogen load most probably by a suppression of the overall innate immune system (Nayak et al., 2007). In male mice exposure to 0.1, 1.0 and 50 µg/L arsenite in drinking water for 5 weeks decreased transcripts involved in the immune response (Andrew et al., 2007) and 10 or 100 µg/L arsenite in drinking water or food for 5-6 weeks disturbed the innate immune response by a downregulation of the gene expression and protein level of key innate immune regulators. The authors speculated that this dysregulation might alter disease risk in response to respiratory viral infection (Kozul et al., 2009).
8.2.3.2. Organic arsenic
Oral administration of 4 to 72 mg/kg b.w. per day methylarsonate to nestling finches for 20 days resulted in no effects on immune function. No further studies were found regarding immune function, immunological and lymphoreticular effects following oral exposure to organic arsenic. No histological alterations were observed in immunological tissues following exposure of rats and mice with high doses (mg/kg b.w. per day) of dimethylarsinate (7.8, 94 mg/kg b.w. per day), methylarsonate (67.1, 72.4 mg/kg b.w. per day or roxarsone (4, 43 mg/kg b.w. per day (ATSDR, 2007).

Arsenic in food
86 EFSA Journal 2009; 7(10):1351
8.2.4. Developmental and reproductive toxicity
8.2.4.1. Inorganic arsenic
Inorganic arsenic has been shown to be embryotoxic and teratogenic in experimental animals; however, most studies have used high parenteral arsenic dosing, which might have involved maternal toxicity (Golub et al., 1998; Wang et al., 2006). Only recently have experimental studies without maternal toxicity shown foetal growth retardation,neurotoxicity and alteration in pulmonary structure following oral dosing at relevant exposure levels, often in the form of arsenate Wang et al., 2006; Hill et al., 2008). Using a mouse model, in utero and early postnatal exposures to arsenic (100 µg/L or less in drinking water in the form of arsenite) were found to alter airway reactivity to methacholine challenge in 28 day old pups (Lantz et al., 2009). The functional changes correlated with protein and gene expression changes as well as morphological structural changes around the airways.
During its development the brain is particularly vulnerable and foetal arsenic exposure and exposure soon after birth causes neurotoxicity resulting in behavioural changes (Rodriguez et al., 2003; Wang et al., 2006). Rats exposed to high concentrations of arsenite (37 mg/L) in drinking water from gestation day 15 until 4 months of age showed increased spontaneous locomotor activity and alterations in a spatial learning task compared to control rats (Rodriguez et al. 2002). The latter effects were also found in rats exposed from postnatal day one. Exposure of high inorganic arsenic (100 mg/L sodium arsenite in drinking water from day 6 of gestation to postnatal day 42) to pregnant rats and offspring also caused alterations in learning and memory behaviour, and some reflex responses (Xia et al., 2009).
Exposure of mouse dams to relatively low levels of arsenic (50 µg arsenate/L) during pregnancy and lactation resulted in changes in the neuroendocrine markers associated with depression and depressive-like behaviours in affected adult C57BL/6J mouse offspring (Martinez et al., 2008). The results suggested that perinatal arsenic exposure may disrupt the regulatory interactions between the hypothalamic-pituitary-adrenal axis and the serotonergic system in the dorsal hippocampal formation in a manner that predisposes affected offspring towards depressive-like behaviour.
Due to the major differences between species (Vahter, 1999), direct extrapolation to humans cannot be made (Vahter, 2009). However, comparison of the susceptibility to arsenic of various species during embryonic and foetal development could provide information on the importance of metabolism for developmental toxicity. Also, mechanistic information may be obtained from experimental studies. Neural tube effects are a consistent finding in experimental studies (Hill et al., 2008), but there are few studies investigating such effects in human populations and no convincing data (Shalat et al., 1996; Brender et al., 2006). Also, findings of aberrant migration and delayed maturation of Purkinje cells following low-dose prenatal arsenic exposure in rats (Dhar et al., 2007) warrant further studies on early human development. Nevertheless, studies on pregnant mice given periodate-oxidized adenosine, known to inhibit arsenic methylation (Marafante and Vahter, 1984), showed increased developmental toxicity from arsenic (Lammon et al., 2003).
8.2.4.2. Organic arsenic
No data on the early-life toxicity of arsenobetaine have been found. Similarly, little information exists on early-life toxicity of methylarsonate and dimethylarsinate. Both inorganic arsenic and dimethylarsinate are transferred from the mother through the placenta and cross the immature blood-brain barrier easily (Jin et al., 2006). Compared to that in the liver of newborn mice, dimethylarsinate as an organic metabolite is prevalent in the brain.
Developmental toxicity studies of orally administered methylarsonate and dimethylarsinate in the Sprague-Dawley rat and New Zealand White rabbit have shown an absence of dose-related effects at exposure levels that were not maternally toxic. Methylarsonate at doses of 0, 10, 100, and 500 mg/kg

Arsenic in food
87 EFSA Journal 2009; 7(10):1351
b.w. per day (rat) and 0, 1, 3, 7, and 12 mg/kg b.w. per day (rabbit) and dimethylarsinate at doses of 0, 4, 12, and 36 mg/kg b.w. per day (rat) and 0, 3, 12, and 48 mg/kg b.w. per day (rabbit) were administered by oral gavage daily during organogenesis (gestation day (GD) 6-15 in rats and 7-19 in rabbits), and the litters were examined at maternal sacrifice (GD 20 in rats; GD 29 in rabbits) (Irvine et al., 2006). After treatment with methylarsonate, maternal and foetal toxicity was observed at the highest doses of 500 mg/kg b.w. per day (rats) and 12 mg/kg b.w. per day (rabbits), but no treatment-related developmental toxicity was found at the lower doses. There was no evidence of teratogenicity associated with methylarsonate treatment. With dimethylarsinate, maternal and developmental toxicity were observed in the rat at 36 mg/kg b.w. per day. In the rabbits at 48 mg/kg b.w. per day there was marked maternal toxicity, culminating for most females in abortion and with no surviving fetuses for evaluation. There was no treatment-related maternal or developmental toxicity in the rat or rabbit at 12 mg/kg b.w. per day or below.
In summary, studies in experimental animals demonstrate that in utero exposure to inorganic arsenic via oral administration to the dam causes neural tube defects, foetal growth retardation and neurotoxicity including alteration in lomotor activity, spatial learning, changes in neuroendocrine markers associated with depressive-like behaviours in the offspring. Inhibition of arsenic methylation has been shown to increase its developmental toxicity. However, due to the major species differences and insufficient data, direct extrapolation to humans cannot be made.
Limited data are available on the developmental toxicity of organic arsenic species in experimental animals. No data are available for arsenobetaine. For oral methylarsonate, NOAEL values for developmental toxicity based on pregnancy outcome, with administration during organogenesis, were 100 and 7 mg/kg b.w. per day in the rat and the rabbit, respectively. For oral dimethylarsinate reported NOAEL values are 12 mg/kg b.w. per day in the rat and the rabbit (ATSDR, 2007).
8.2.5. Neurotoxicity of arsenic
8.2.5.1. Inorganic arsenic
A number of studies in rats and mice have reported no symptoms of overt systemic toxicity from inorganic arsenic, but observed more subtle – neurobehavioural – effects (Rodriguez et al., 2003). In rats the most consistent change in behaviour after high oral inorganic arsenic administration (10, 20 mg/kg b.w. per day by gavage for 2-4 weeks) was a decrease in locomotor activity. Additionally rats showed a delay in the execution of various task tests reflecting learning and memory after oral exposure to arsenic (Rodriguez et al., 2001, 2002). Effects on locomotor activity, grip strength and rota rod performance were also observed recently in rats exposed to 20 mg arsenite/kg b.w. p.o. for 28 days (Yadav et al., 2009). Mice were exposed to 1 and 4 mg/kg of As2O3 subchronically for 60 days in water and significant dose-dependent neurobehavioural changes associated with memory (Morris Water Maze test) were observed. In addition, the critical gene expression profiles related to the Creb-dependent phase of cerebellar long-term depression (LTD) were analyzed by GeneChip and showed down-regulated expression of Ca2+/calmodulin dependent protein kinase IV (Camk4). Finally, antioxidants such as taurine or vitamin C did not prevent the down-regulation of Camk4, indicating that such down-regulation may be via an oxidation-independent mechanism (Wang et al., 2009a). Additionally, rats exposed to inorganic arsenic in drinking water at 68 mg/L for 3 months showed a significant decrease in their spatial memory, while neurons and endothelial cells presented pathological changes, and the gene expression of aspartate receptors in the hippocampus was down-regulated. These effects were not seen at 2.72 and 13.6 mg/L (Luo, 2009).
In mice, inorganic arsenic in drinking water (0.05-5 mg/L, 4 months) led to sex-dependent alterations in dopaminergic markers, spontaneous locomotor activity and downregulation of the antioxidant capacity of the brain (Bardullas et al., 2009).

Arsenic in food
88 EFSA Journal 2009; 7(10):1351
8.2.5.2. Organic arsenic
Dietary organo-arsenicals including arsenobetaine and arsenocholine have not been associated with peripheral or central neurotoxicity. The ATSDR (2007) refers to chronic animal studies of methylarsonate and dimethylarsinate in rats and mice (Arnold et al., 2003, 2006). Methylarsonate caused no clinical signs or brain lesions following chronic exposure of rats to 72.4 mg/kg b.w. per day or mice to 67.1 mg/kg b.w. per day; a similar outcome for dimethylarsinate was reported, causing no clinical signs or histologic alterations after chronic exposure to 7.8 or 94 mg/dimethylarsinate/kg per day. Of the species studied, the pig is the most sensitive to the neurotoxicity of roxarsone, with serious effects observed at the lowest dose tested (6.3 mg/kg b.w. per day for one month) (ATSDR, 2007). Hippocampal slices of young (14-21 days-old) and adult (2-4 months-old) rats were treated with methylarsonate and methylarsonite and evoked synaptic field potentials from the Schaffer collateral-CA1 synapse (fEPSPs) were measured under control conditions and during and after 30 and 60 minutes of application of the arsenic compounds. Methylarsonate had no effect on the synapse functions neither in slices of adult nor in those from young rats whereas methylarsonite strongly depressed the synaptic transmission at concentrations of 50 and 25 µmol/L (adult/young rats) and long term potentiation (LTP) amplitudes at concentrations of 25/10 µmol/L (adult/young rats) respectively. In contrast, application of 1 µmol/L methylarsonite led to an enhancement of the LTP amplitude in young rats, which was interpreted as an enhancing effect on N-methyl-D-aspartate (NMDA) receptors and a lack of blocking effect on alpha-amino-3-hydroxy-5-methylisoxazole-4-propionate (AMPA) receptors. These impairments of the excitatory cornu ammoni (CA1)27 synapse were interpreted to be more likely caused by the action of methylarsonite on postsynaptic glutamatergic receptors and may be jointly responsible for dysfunctions of cognitive effects in arsenic toxicity (Krüger et al., 2009).
8.2.6. Carcinogenicity
8.2.6.1. Inorganic arsenic
In contrast to humans, where the carcinogenic potential is clearly evident, studies in experimental animals have usually failed to demonstrate increased tumour incidences following chronic oral exposure to inorganic arsenic. Oral studies on arsenic trioxide, various arsenate salts and sodium arsenite gave negative results when tested in mice and rats, and also in dogs for sodium arsenite and arsenate (IARC, 1973, 1980). The basis for the lack of tumorigenesis in animals is not known, but could be related to species-specific differences in arsenic toxicokinetics (Section 8.1). One important exception seems to be studies in mice demonstrating transplacental carcinogenesis (Waalkes et al., 2007, Liu and Waalkes, 2008). Thus foetal exposure to inorganic arsenic in mice can induce tumours or preneoplasias in numerous tissues, including tissues that are potential human targets of arsenic carcinogenesis, such as the lung, bladder and liver (Waalkes et al., 2003, 2004a). Exposure to the tumour promoter TPA (12-0-tetradecanoyl phorbol-13-acetate) (Waalkes et al., 2004b), diethylstilbestrol or tamoxifen (Waalkes et al., 2006a,b) enhances the carcinogenic response of prenatal arsenic exposure in a variety of mouse tissues. Arsenic exposure in utero does not include skin cancer, but exacerbates skin cancer response after TPA exposure, possibly by altering tumor stem cell response (Waalkes et al., 2008). In summary, there is clear evidence for inorganic arsenic to be a transplacental carcinogen, however extrapolation to humans seems to be limitated since applied doses were extremely high (42.4 and 85 mg/L arsenite in drinking water ad libitum during days 8 through 18 of gestation). Other animal studies indicate that in skin inorganic arsenic acts as an enhancer with other carcinogens. Thus in mice sodium arsenite (≥1.25 mg/L in drinking water) is cocarcinogenic with solar ultraviolet (UV) light (Rossman et al., 2001, Burns et al., 2004) and arsenate (25 mg/L in drinking water ad libitum for a period of 25 weeks) is cocarcinogenic with 9,10 dimethyl 1-2-benzanthracene (DMBA) (Motiwale et al., 2005).
27 cornu ammoni = ammons horn, specific anatomic area (1) in the hippocampus

Arsenic in food
89 EFSA Journal 2009; 7(10):1351
8.2.6.2. Organic arsenic
Methylarsonate was not carcinogenic in 2-year cancer bioassays when administered to male rats at concentrations up to 200 mg/L in drinking water (Shen et al., 2003a), or to mice or rats at dietary concentrations up to 400 mg/kg (Arnold et al., 2003). The dietary concentrations were comparable to doses in the region of 100 mg/kg b.w. per day. However, 100 mg/L methylarsonate, dimethylarsinate or trimethylarsine oxide in drinking water were shown to induce the formation of preneoplastic lesions in the liver of rats pretreated with di-ethylnitrosamine (Nishikawa et al., 2002). In a 2-year feeding study, roxarsone did not produce convincing evidence of carcinogenicity in rats (50, 100 mg/kg) or mice (100, 200 mg/kg) (NTP, 1989). Trimethylarsine oxide (200 mg/L in drinking water for 2 years) induced hepatocellular adenomas in rats, possibly by a mechanism involving oxidative damage and cell proliferation (Shen et al., 2003b). Dimethylarsinate (≥50 mg/L in drinking water) was carcinogenic in the urinary bladder of rats but not in the urinary bladder of mice (Cohen et al., 2006; Cohen et al., 2007). Furthermore, dimethylarsinate has been reported to promote carcinogenesis in the urinary bladder (≥10 mg/L), kidney (≥200 mg/L), liver (≥200 mg/L) and thyroid gland (≥400 mg/L) (Yamamoto et al., 1995, Wanibuchi et al., 1996).
8.2.7. Molecular mechanisms
Modes of action of arsenic induced toxicity are discussed based on the reports of ATSDR (2007) and the US EPA Science Advisory Board (US EPA SAB, 2007) a number of reviews (Hartwig and Schwerdtle, 2009; Salnikow and Zhitkovich, 2008; Klein et al., 2007; Kumagai and Sumi, 2007; Kligerman and Tennant, 2007; Aposhian and Aposhian, 2006; Huang et al., 2004; Shi et al., 2004) and recent original papers. Arsenic exerts its effects by different mechanisms. This chapter specifically addresses the mechanisms implicated in the carcinogenic and neurotoxic effects of arsenic. Further effects such as those on cutaneous and systemic immunity (Biswas et al., 2008; Olsen et al., 2008; Liao et al., 2009b; Raqib et al., 2009), on developmental and reproductive toxicity and on endocrine processes including estrogen receptor mediated signalling (Watson and Yager, 2007) are partly addressed in the respective sections but are not addressed in detail here.
8.2.7.1. Induction of genetic damage
Inorganic arsenic
Inorganic arsenic does not covalently bind to DNA (Kitchin and Wallace, 2008a). This is consistent with its inability to induce the SOS system in E.coli (Rossman et al., 1984). Inorganic arsenic does not induce point mutations in bacterial or mammalian test systems and it has been shown to be an extremely weak (or insignificant) mutagen at single gene loci such as thymidine kinase (TK) or hypoxanthine guanine phosphoribosyltransferase (HPRT) (Rossman, 2003; ATSDR, 2007).
However, as a secondary result of genomic instability low chronic sub µM non-cytotoxic concentrations of arsenite (≥0.1 µM) have been shown to induce delayed mutagenesis at the HPRT locus and cell transformation after 20-30 generations in cultured human human osteogenic sarcoma (HOS) cells (Mure et al., 2003). At higher concentrations, arsenite (≥7 µM) induced large deletion (multilocus) mutations in hamster human hybrid cells (Hei et al., 1998), micronuclei and chromosome aberrations, aneuploidy, and sister-chromatid exchanges in various mammalian cells (recently summarized in (ATSDR, 2007)). Numerous studies in mammalian cells demonstrated the induction of DNA damage (strand breaks, oxidative base modifications, apurinic/apyrimidinic sites, DNA-protein-crosslinks) by low non-cytotoxic nM to µM arsenite concentrations (Wang et al., 2002 (≥0.1 µM), Schwerdtle et al., 2003 (≥10 nM)). Thus, chromosome alterations may be a secondary result of arsenite induced DNA damage and interference with DNA damage response pathways (see below). Furthermore Li and Broome (1999) proposed a model, in which arsenite crosslinks tubulin and inhibits guanosine triphosphate (GTP) binding, resulting in disturbed tubulin polymerization, and mitosis,

Arsenic in food
90 EFSA Journal 2009; 7(10):1351
which may contribute to micronuclei formation. Additionally, inorganic arsenic can cause gene amplification in mouse 3T6 cells (Lee et al., 1988).
Inorganic arsenic increases the genotoxicity, mutagenicity and clastogenicity of other DNA damaging agents, among others UV-light, benzo[a]pyrene and alkylating agents (Rossman et al., 1986; Okui and Fujiwara, 1986), which may be explained by the interference with DNA damage response processes. This is consistent with the co-mutagenic effect of arsenic, resulting in arsenic co-carcinogenesis (Section 8.2.7.7) that has been shown in vivo.
In vivo, after oral treatment arsenite induced micronuclei and chromosomal aberrations in mouse peripheral blood lymphocytes and in mouse bone marrow (ATSDR, 2007; US EPA, 2007). Additionally, arsenite strongly increased micronuclei induced by benzo[a]pyrene in mouse bone marrow (50 mg/L sodium arsenite, 7 days, Lewinska et al., 2007) and increased the mutagenicity of benzo[a]pyrene in mouse skin (10 mg/L sodium arsenite, 10 weeks, Fischer et al., 2005).
Organic arsenic
A number of studies indicate that dimethylarsinate, methylarsonate and roxarsone might be able to cause chromosomal aberrations and mutations, however only at high µM concentrations (ATSDR, 2007). The trivalent methylated metabolites methylarsonite and dimethylarsinite were not mutagenic in the Ames test. They show weak mutagenicity in mouse lymphoma L5178Y cells, but only at toxic concentrations (Kligerman et al., 2003, Moore et al., 1997). Consistently it was recently reported that at highly cytotoxic concentrations methylarsonite (≥0.6 µM, 43 % survival) and dimethylarsinite (0.3 µM, 7 % survival) are mutagenic at the gpt locus in Chinese hamster G12 cells (Klein et al., 2007). Both metabolites are clastogens, inducing chromosomal alterations; here effects were also restricted to cytotoxic concentrations (Kligerman et al., 2003, Kligerman and Tennant, 2007).
Regarding the induction of DNA damage, in subcellular and cellular systems methylarsonite and dimethylarsinite induced DNA strand breaks and oxidative base lesions generally at lower concentrations than inorganic arsenic and the pentavalent metabolites. In the case of the cellular systems DNA lesions occurred at non-cytotoxic low µM (≥0.1 µM) concentrations (Nesnow et al., 2002; Mass et al., 2001; Ahmad et al., 2002; Wang et al., 2002; Schwerdtle et al., 2003). With respect to the genotoxicity of arsenosugars there is only one paper available. Here neither the investigated trivalent nor the pentavalent arsenosugar were mutagenic in Salmonella TA104. In human epidermal keratinocytes the arsenosugars showed lower cytotoxicity as compared to arsenite, arsenate, methylarsonite and dimethylarsinite; the trivalent arsenosugar exerted stronger cytotoxic effects than the pentavalent arsenosugar, methylarsonate and dimethylarsinate (Andrewes et al., 2004). In the case of thio-dimethylarsinate the only study available shows thio-dimethylarsinate induced aneuploidy, chromosome structural aberrations and abnormalities of spindle organisation and centrosome integrity starting at µM (≥10 µM) concentrations (Ochi et al., 2008).
In vivo studies on the genotoxic effects of methylated arsenic metabolites are limited to a small number of studies on rodents. Oral administration of high concentrations of dimethylarsinate to mice caused DNA strand breaks in the lung (1500 mg/kg b.w., one single dose, Yamanaka and Okada, 1994; Yamanaka et al., 1989), increased the urinary level of 8-hydroxy-2’deoxyguanosine (8-OHdG) lesions (50 mg/kg bw, one single dose, Yamanaka et al., 2001) and the 8-OHdG DNA levels in the lung and liver (400 mg/L in drinking water, four weeks, Yamanaka et al., 2001), but not in the bladder, skin, spleen or kidney. In contrast, dimethylarsinate administered to rats, significantly increased the level of 8-OHdG in the bladder (200 mg/L in drinking water, two weeks (Wei et al., 2002), 0.02 % in drinking water, 20 days (Kinoshita et al., 2007)) and kidney (10 mg/kg b.w., four weeks, each five days, Vijayaraghavan et al., 2001). After trimethylarsine oxide exposure (0.02 % in drinking water, 15 days, Kinoshita et al., 2007) a significant increase of 8-OHdG was observed in the rat liver. Following an i.p. injection dimethylarsinate induced aneuploidy (300 mg/kg, b.w., one single injection), but no chromosome aberrations in mouse bone marrow cells (Kashiwada et al., 1998) and

Arsenic in food
91 EFSA Journal 2009; 7(10):1351
in MutaMice (10.6 mg/kg b.w. per day, six days) an increase of lacZ mutations in the lung, but not in the bladder or bone marrow (Noda et al., 2002).
Effects in humans
The majority of the studies on the cytogenetic effects of arsenic in humans are based on the frequency of micronuclei in peripheral lymphocytes, urothelial and oral epithelial cells (Ghosh et al., 2008; ATSDR, 2007). Peripheral lymphocytes are used as surrogate target cells (Albertini et al., 2000), whereas exfoliated cells of buccal mucosa and urinary bladder serve as an appropriate index to measure arsenic-related genotoxicity, because these cells are in direct contact with the carcinogen (Smith et al., 1993). For all three cell types an association has been demonstrated in numerous studies between micronuclei frequency and exposure to arsenic-contaminated drinking water (Ghosh et al., 2008; ATSDR, 2007; Hartwig and Schwerdtle, 2009). By comparing the effects in 13 studies, the evaluation of micronuclei frequency in lymphocytes was found to be a more sensitive tool than that in urothelial and buccal epithelial cells (Ghosh et al., 2008). Higher incidences of chromosomal aberrations and sister chromatid exchanges have been reported from humans exposed to arsenic via drinking water (ATSDR, 2007).
8.2.7.2. Epigenetic mechanisms and indirect mechanisms
The most important epigenetic events observed after exposure to inorganic arsenic are: (i) hypermethylation of DNA gene promoters; (ii) loss of global DNA methylation, and (iii) alteration of global histone H3 methylation. The most significant studies that provide evidence of these effects in cells in culture, animal models and humans are summarised below
Increased cytosine methylation in the p53 promoter was detected in A549 human lung cells exposed to sodium arsenite (0.08-2 µM) or sodium arsenate (30-300 µM), but not to dimethylarsinate (2-2000 µM) (Mass and Wang, 1997). Chronic exposure of rat liver epithelial cells to sodium arsenite (0.12-5 µmol/L) induced S-adenosylmethionine (SAM) depletion, causing a global loss of DNA methylation during malignant transformation (Zhao et al., 1997). Arsenic was found to deplete SAM in human HaCaT keratinocytes, repress DNA methyltransferase genes DNMT1 and DNMT3A transcription and cause DNA hypomethylation (Reichard et al., 2007). Arsenite also alters global histone H3 methylation. Significant altered histone modifications were reported in A549 human lung carcinoma cells exposed to arsenite at very low doses (0.1 µM) (Zhou et al., 2008). The alteration of specific histone methylations represents both gene silencing and activation marks.
In A/J mice exposure to arsenic (drinking water containing 0, 1, 10, and 100 mg/L arsenate for 18 months) resulted in higher rates of methylation of cytosine-phosphate-guanine (CpG) islands of tumor suppressor genes p16INK4a and RASSF1A in lungs, and decreased expression of these genes as compared with unexposed controls (Cui et al., 2006). Chronic exposure of animals to inorganic arsenic was shown to produce hepatic DNA hypomethylation in mice under two dose regimens: 45 mg/L arsenic (as NaAsO2) in the drinking water for 48 weeks (Chen et al., 2004a) or arsenite, sodium arsenate, methylarsonate, dimethylarsinate at dosages of 150, 200, 1,500, or 1,000 mg/L, respectively, in the drinking water for 17 weeks (Xie et al., 2004). Hypomethylation of the promoter region of the estrogen receptor-alpha (ER-alpha) was detected in the livers of mice with in utero induced hepatocellular carcinomas (HCC) by arsenic exposure (85 mg/L in the drinking water from gestation days 8 to 18) (Waalkes et al., 2004b). Altered estrogen signaling may play a role in the induction of HCC by arsenic exposure in utero. Prenatal exposure to inorganic arsenic (85 mg/L in the drinking water from gestation days 8 to 18) was shown to alter the DNA methylation pattern and lead to aberrant gene expression in the newborn liver (Xie et al., 2007).
Effects in humans

Arsenic in food
92 EFSA Journal 2009; 7(10):1351
In human bladder cancers arsenic exposure measured as toenail levels (>0.26 µg/g, only 18 subjects) was associated with hypermethylation at the promoter of tumor suppressor genes RASSF1A and RPSS3 (Marsit et al., 2006). Significant and dose-related hypermethylation of the promoter region of p53 was observed in the DNA of arsenic-exposed (>50 µg/L of arsenic in drinking water) subjects from West Bengal (India), compared to the control subjects. Significant hypermethylation of gene p16 was observed in cases of exposure to high level of arsenic (>250 µg/L of arsenic in drinking water) (Chanda et al., 2006).
Genomic methylation of peripheral blood leukocyte (PBL) DNA has been described in humans (Pilsner et al., 2007). Bangladeshi adults who were chronically exposed to arsenic (median water arsenic of 80 µg/L, range 0.1-716 µg/L) showed positive association between exposure and genomic PBL DNA methylation in a dose-dependent manner. This effect was modified by folate. These results are in contrast with those obtained in the animal models where DNA hypomethylation was detected (see above). However, it should be taken into account that the arsenic levels in water used in the animal experiments (45 mg/L) are nearly three orders of magnitude higher than the median level estimated in drinking water (80 µg/L) in the human study. Moreover, the duration of exposure (<1 year in animals and chronic in humans) differed considerably and the target tissues (liver in animals and PBL in humans) are also different. In newborns from mothers exposed to inorganic arsenic (levels of toenail arsenic from 0.1 to 68.63 µg/g; 0.5 µg/g toenail arsenic corresponds to chronic consumption of water with approximately 10 µg/L) through contaminated water in Thailand, altered transcript profiles in cord blood have been reported including changes of stress-related genes and breast cancer/estrogen-signature genes (Fry et al., 2007).
8.2.7.3. Involvement of reactive oxygen species (ROS) and reactive nitrogen species (RNS) in arsenic response
Inorganic arsenic
Numerous studies over the past decades provide strong evidence that oxidative stress mediated by increased levels of ROS and RNS is an important molecular mechanism contributing to arsenic-induced carcinogenicity. Thus, in diverse cellular systems, arsenite has been shown to increase the generation of superoxide anions (•O2
-) and hydrogen peroxide (H2O2) and to modulate the level of nitric oxide (NO) (Shi et al., 2004, Huang et al., 2004). Chemically neither reduction of arsenate to arsenite nor oxidation of arsenite to arsenate can produce ROS in the absence of other reactants; arsenic can only undergo two-electon reduction/oxidation. Indirect sources of elevated levels of reactive species include interactions with the respiratory chain, their generation during metabolism of inorganic arsenic, the modulation of NO synthases and effects on cellular redox homeostasis by decreasing cellular glutathione (GSH). The application of radical scavengers revealed the involvement of arsenite induced ROS and RNS in the induction of lipid peroxidation, protein oxidation, DNA damage (Shi et al., 2004) and DNA repair inhibition (Bau et al., 2001). Furthermore, inorganic arsenic can affect cell signalling via low levels of ROS that do not cause DNA damage (Simeonova and Luster, 2004). The impact of the induced reactive species on the activation of signal cascades such as the mitogen-activated protein kinases (MAPKs) cascade, the transcription factors activator protein-1 (AP-1) and also nuclear factor-κB (NFκB) have recently been summarised (Leonard et al., 2004; Kumagai and Sumi, 2007). In male Wistar rats which were exposed to 50 mg/L sodium arsenite in drinking water for 10 months an increased level of ROS was determined in blood and different brain region as well as an increase in DNA strand breaks in the lymphocytes (Mishra and Flora, 2008).
Organic arsenic
Methylarsonite has been shown to induce ROS in cultured human bladder cells, most probably by a different mechanism and at lower concentrations as compared to arsenite. ROS production was accompanied by the induction of oxidative DNA damage and altered cellular signalling (Eblin et al.,

Arsenic in food
93 EFSA Journal 2009; 7(10):1351
2006, 2008). Additionally, methylarsonite is a potent inhibitor of GSH related enzymes, thioredoxin reductase and endothelial NO synthase (Lin et al., 2001; Chouchane and Snow, 2001; Petrick et al., 2001). Dimethylarsinite and dimethylarsinate can release redox-active iron from ferritin, which in turn might catalyse the production of hydroxyradicals (•OH) (Ahmad et al., 2000). Dimethylarsinate and dimethylarsinite might also catalyse ROS generation in vitro and in vivo via the formation of intermediary dimethylarsine and radical arsenic species; however, these observations were restricted to very high concentrations of dimethylarsinate (Yamanaka et al., 1989, 1990, 1991, 1997, 2000, 2001, 2004). In consequence, the US EPA concluded recently, that the principle mode of action of dimethylarsinate, namely induced bladder cancer in rats, does not appear to be mediated via the ROS-induced DNA damage pathway (US EPA SAB, 2007).
Effects in humans
Recently the effects of arsenic-exposure on oxidative stress, oxidative DNA damage and their applicability as biomarkers of effect in humans have been reviewed (De Vizcaya-Ruiz et al., 2009). In a Chinese population exposed to arsenic-contaminated drinking water (400 µg/L) serum lipid peroxides were increased and whole blood non-protein sulfhydryl levels were decreased in comparison to a control population (20 µg/L) (Pi et al., 2002). An association of total blood arsenic with increased reactive oxidants, increased expression of inflammatory mediator genes and decreased antioxidant capacity in plasma was reported in a Taiwanese population exposed to drinking water arsenic (<10 - >300 µg arsenic/L) (Wu et al., 2001, 2003). In human peripheral blood mononuclear cells (PBMC) of arsenic exposed skin lesion individuals (204.7±102 µg/L arsenic drinking water (mean±SD); 30 individuals) significantly elevated levels of intracellular ROS were determined as compared to control individuals (6.6±1.8 µg/L arsenic drinking water (mean±SD), 28 individuals). Arsenic exposure significantly reduced mitochondrial membrane permeability, increased cytochrome C release, reduced Bcl-2/Bax ratio and resulted in cell cycle arrest of PBMC in G0/G1 phase, and increased downstream caspase activity and the percentage of apoptotic cells (Banerjee et al., 2008a).
The amount of urinary 8-OHdG was associated with high but not with medium to moderate arsenic drinking water exposure. Thus in six communities in Arizona and Sonora a relationship between arsenic exposure from ≤5-40 µg arsenic/L in tap water and urinary 8-OHdG was studied. Although total urinary arsenic increased with higher levels in tap water, 8-OhdG was neither associated to arsenic in tap water nor to total urinary arsenic (Burgess et al., 2007). In a cross-sectional study in Inner Mongolia arsenic species in urine were significantly associated with 8-OHdG in subjects with arsenic dermatosis, while there was no statistically significant relationship for subjects without arsenic dermatosis; although there were no differences in mean arsenic levels in the well water (158.3 µg arsenic/L) between either type of subject, methylarsonate was significantly higher in subjects with arsenic dermatosis (Fujino et al., 2005). In a hospital-based case-control Taiwanese study evaluating the relationship among the levels of urinary 8-OHdG, the arsenic profile, and urothelial carcinoma (UC), multiple linear regression analyses revealed that high urinary 8-OHdG levels were associated with increased total arsenic concentrations, inorganic arsenic, methylarsonate and dimethylarsinate, as well as the primary methylation index (PMI). Urinary total arsenic and urinary 8-OHdG were significantly higher for the UC patients than for healthy controls (Chung et al., 2008). A cross-sectional study in China revealed increased urinary 8-OHdG levels, but decreased blood GSH levels, in children and adults exposed to high arsenic concentrations (90; 160 µg arsenic/L) compared with children and adults exposed to low concentrations (20 µg arsenic/L). In multiple linear regression models, urinary 8-OHdG and blood GSH levels and urinary 8-OHdG concentrations in children and adults exposed to arsenic showed strong associations with the levels of urinary arsenic species. Thus the relative content of methylarsonate was found to be positively associated with urinary 8-OHdG but negatively associated with the blood GSH level (Xu et al., 2008). A study in Inner Mongolia suggested that arsenic induced gene expression of 8-oxoguanine glycosylase 1 (ogg1) may contribute to elevated excretion of 8-OHdG in urine.

Arsenic in food
94 EFSA Journal 2009; 7(10):1351
Therefore ogg1 expression levels were linked to arsenic concentrations in drinking water (0.34-826 μg arsenic/L) and nails, selenium concentrations in nails, and skin hyperkeratosis (Mo et al., 2006).
Elevated tissue 8-OHdG levels were reported for arsenic-related skin neoplasms and keratosis of arsenic-related Bowen’s diseases (Matsui et al., 1999) and arsenic-related human skin tumours of inhabitants in an arsenic contaminated area in China (An et al., 2004). In individuals with skin lesions exposed to arsenic-contaminated water a genome-wide expression study showed downregulation of SOD2, TNF and CCL20 expression as compared to individuals without skin lesions, indicating an increased vulnerability to ROS and a suppression of a chemokine response pathway, which is associated with deficient wound healing in the exposed individuals (Argos et al., 2006); the mean (standard deviation) well water arsenic concentration was 342.7 (258.1) µg/L for individuals with skin lesions and 39.6 (49.5) µg/L for individuals without skin lesions.
8.2.7.4. Interference with DNA damage response pathways
To control the integrity of their genome, cells have evolved a complex network of DNA damage responses that include DNA repair, cell cycle arrest, senescence and apoptosis.
Inorganic arsenic
With respect to DNA repair inhibition, several recent studies point to an interaction of inorganic arsenic with nucleotide (NER) and base excision repair (BER), being capable of removing a wide variety of bulky, DNA helix distorting lesions and oxidative DNA damage, respectively (Hartwig and Schwerdtle, 2009). Thus, arsenite has been shown to decrease removal of bulky DNA adducts induced by UV-radiation (≥1 µM) or benzo[a]pyrene (≥5 µM) in cultured cells at non-cytotoxic concentrations, probably in the first line by disturbing the DNA damage recognition/incision step (Hartwig et al., 1997). To date the most sensitive target related to DNA repair is inhibition of poly(ADP-ribosyl)ation by arsenite (≥10 nM) (Hartwig et al., 2003). Besides direct and indirect interaction with repair or repair-associated proteins (Kitchin and Wallace, 2008b), arsenic compounds may also diminish DNA repair by altering the expression of specific DNA repair genes (Hartwig and Schwerdtle, 2009).
In numerous in vitro and in vivo studies, inorganic arsenic exposure has been shown to frequently result in a generalised tolerance to apoptosis which is often associated with increased cell proliferation (Liu and Waalkes, 2008; Salnikow and Zhitovich, 2008). Often these effects depend on altered gene expression that can result from genetic and epigenetic effects.
In laboratory animals studies, inorganic arsenic induced effects on proliferation and DNA repair seems to be restricted to extremely high concentrations. For example, recently high doses of inorganic arsenic administered as sodium arsenite (173 mg/L drinking water; 350 mg/kg feed, 2 or 10 weeks) or sodium arsenate (416 mg/L) in drinking water or diet to rats or mice have been demonstrated to induce a hyperplastic response in the bladder epithelium (Suzuki et al., 2008). In rats, arsenite (10 mg/L, intra-mammilary injection) has been shown to inhibit repair of benzo[a]pyrene induced DNA-adducts in mammary gland tissue (Tran et al., 2002).
Organic arsenic
Inhibitory effects on DNA repair by trivalent methylated arsenical metabolites were mostly observed at lower concentrations as compared to arsenite, whereas the impact of the pentavalent metabolites was restricted to much higher concentrations (Hartwig and Schwerdtle, 2009). Similar to arsenite, the most sensitive target related to DNA repair is inhibition of poly(ADP-ribosyl)ation by methylarsonite and dimethylarsinite at (≥1 nM) (Walter et al., 2007). One possible molecular mechanism for the observed interference with DNA damage response pathways by trivalent inorganic and organic arsenic compounds may lie in their ability to react with thiols, for example in zinc binding structures prevalent

Arsenic in food
95 EFSA Journal 2009; 7(10):1351
in many transcription factors, cell cycle control and DNA repair proteins (Kitchin and Wallace, 2008b). As well as interaction with proteins, arsenic compounds may also diminish DNA damage response by altering the gene expression (ATSDR, 2007; Hartwig and Schwerdtle, 2009). To date there are only two studies available on the impact of organic arsenic compounds on DNA repair processes in animals (Wang et al., 2009b, c). They show that dimethylarsinate does not affect baseline levels of four repair genes (100 mg dimethylarsinare/L in drinking water, 4 weeks) in the rat bladder, nor the repair of cyclophosphamide-induced DNA damage (100 mg dimethylarsinate/L in drinking water, 1 week); this indicates that dimethylarsinate induced carcinogenesis/cocarcinogenesis in the urinary bladder is most likely not due to repair inhibition of DNA strand breaks or DNA-protein crosslinks.
The molecular mechanism of dimethylarsinate-induced rat urinary bladder carcinogenesis involves generation of a highly reactive metabolite (possibly dimethylarsinite) leading to urothelial cytotoxicity, increased cell proliferation (hyperplasia) and ultimately urothelial tumours (US EPA, 2007; Cohen et al., 2006, 2007). Thus, increases of oxidative stress related cell proliferation and apoptosis were observed, by dimethylarsinate (200 mg/L in drinking water, 20 days) in rat bladder and by trimethylarsine oxide (200 mg/L in drinking water, 20 days) in rat liver (Kinoshita et al., 2007).
Effects in humans
Arsenic exposure via drinking water (10.4-74.7 μg arsenic/L, New Hampshire; 43±8.4 µg arsenic/L, Sonora) was associated with decreased expression of nucleotide excision and base excision repair genes and diminished repair of lesions in lymphocytes as compared to control populations (0.007-5.3 µg arsenic/L, New Hampshire; 5.5±0.2 µg arsenic/L, Sonora). Excision repair cross-complementation group 1 (ERCC1) expression decreased with increased urinary arsenic, and reduced ERCC1 expression and ERCC1 protein levels were found in individuals exposed to arsenic concentrations higher than 6 and 5 µg/L in drinking water, respectively (Andrew et al., 2003, 2006). A follow up paper concluded that statistically significant differences between the high and low arsenic exposure groups included an overexpression of the genes involved in defence response, immune function, cell growth, apoptosis and regulation of cell cycle (Andrew et al., 2008). In addition, a recent study demonstrated that upon induction of DNA damage by gamma irradiation, the repair capacity in the whole blood of arsenic-exposed individuals with premalignant hyperkeratosis was significantly less compared to that of individuals with no skin lesions (Banerjee et al., 2008b); furthermore the number of apoptotic cells were significantly increased in high arsenic exposed skin lesion individuals as compared to low arsenic exposed (3-10 µg/L) non skin lesion individuals.
Additionally, there is some evidence that the development of skin lesions from inorganic arsenic exposure is mediated by increases in the expression of various growth factors, including the transforming growth factor alpha (TGFα) (Germolec et al., 1998; Hsu et al., 2006; Do et al., 2001). TGFα was also significantly increased in exfoliated bladder urothelial cells of people with high arsenic exposure (23-378 µg arsenic/L drinking water) as compared to a low arsenic exposure group (2-10 µg arsenic/L drinking water); notably exfoliated cells isolated from individuals with skin lesions contained significantly greater levels of TGFα than cells from individuals without skin lesions (Valenzuela et al., 2007).
8.2.7.5. Effects on cancer related gene proteins
Inorganic arsenic
Several lines of evidence indicate an effect of arsenic on p53 whose inactivation is associated with cell transformation. High concentrations of arsenic compounds almost always induce an increase in p53 protein levels but most relevant lower doses give variable results depending on concentration, compound, duration of treatment and cell type. A recent study (Huang et al., 2008) showed convincing evidence that treatment of cells with sodium arsenite at concentrations close to environmental

Arsenic in food
96 EFSA Journal 2009; 7(10):1351
exposures (0.5 or 1.0 µmol/L) for long-term treatment (24 hours) and 10 µmol/L for short exposure (12 hours) is associated with induction of cytoplasmic accumulation of p53. Arsenite was shown to stimulate the expression of Hdm2 which then promote p53 nuclear export. As a consequence, the p53 response to genotoxic stress is impaired as shown by the lack of p53 activation and, consequently, of apoptosis following DNA damage. This mechanism was also confirmed in vivo in mice fed with water containing sodium arsenite (1.0 mg/L) for five days and then given 5-Fluorouracil (5FU). The analysis of apoptosis in the most sensitive tissue, i.e. small intestine, showed lack of apoptosis in sodium arsenite fed mice as compared with massive apoptosis in mice treated only with 5FU. The functional significance of this effect would be the abrogation of a mechanism for elimination of damaged cells (via apoptosis), leading to an accumulation of mutations and malignant transformation. Other studies provide evidence that in vitro and in vivo arsenic can facilitate the ubiquitination-dependent degradation of several oncoproteins in leukemia (Chen et al., 2002; Shackelford et al., 2006, Zhang et al., 2009).
Organic arsenic
In vitro studies in various human cell lines demonstrate an increase of cellular p53 protein amount by dimethylated arsenic metabolites (≥40 µM) but not by its monomethylated metabolites at non-cytotoxic concentrations; arsenite showed effects at concentrations ≥10 µM (Filippova et al., 2003). Furthermore, a recent study provided evidence that in cultured human cells methylarsonite (1 µM) impaired benzo[a]pyrene diolepoxide (BPDE) induced p53 accumulation most probably by inhibiting p53 phosphorylation at serine 53 (Shen et al., 2008).
Effects in humans
A recent study compared the incidence of chromosomal aberrations in individuals with keratosis with those without arsenic-induced skin lesions but drinking water with similar levels of arsenic contamination. Chromosomal aberrations in lymphocytes were significantly higher in the keratotic group compared to individuals with no skin lesions. Moreover, individuals with the p53 codon 72 arginine homozygous genotype showed increased levels of chromosomal aberrations compared to individuals with other genotypes of p53 (De Chaudhuri et al., 2008). Previously it has been reported that this p53 polymorphism is associated with the development of arsenic-induced keratosis in individuals exposed to arsenic through drinking water in West Bengal (De Chaudhuri et al., 2006).
8.2.7.6. Potential mechanisms of arsenic-induced neurotoxicity
As underlying mechanism for arsenic-induced peripheral and central neurotoxicity in the first line changes in the cytoskeletal composition of the peripheral nerve leading to the axonal degeneration and alterations in the cholinergic, glutaminergic and monoaminergic neurotransmitter systems are discussed (Vahidnia et al., 2007a; Rodriguez et al., 2003).
Inorganic arsenic
In vitro and in vivo data indicate that cytoskeletal changes are caused by disruption of the neurofilament and microtubule network in the nerve cells, most probably through gradual degradation of the neurofilament-light subunit (NF-L) by the calcium-activated cytoplasmic protease calpain. Additionally, a hyperphosphorylation and consequently deregulation of the microtubule-associated protein (MAP)-tau may contribute to the loss of cytoskeletal integrity of the axon (Vahidnia et al., 2007a).
Thus in rats the NF-L protein level was reduced by a single dose of arsenite (15-20 mg/kg b.w. injected in a tail vein, Vahidnia et al., 2006) and a 4-12 week repeated daily administration (3, 10 mg/kg b.w., intragastric route, Vahidnia et al., 2008a), whereas in vitro neither arsenite nor arsenate (0.3-3 µM, 24 or 48 hours incubation) changed NF-L gene expression (Vahidnia et al.,

Arsenic in food
97 EFSA Journal 2009; 7(10):1351
2007b). However, in vitro trivalent inorganic arsenic increased intracellular calcium (Florea et al., 2007), which is most probably responsible for p35 proteolytic cleavage to p25 by calpain resulting in hyperphosphorylation of cytoskeletal proteins including MAP-tau (Vahidnia et al., 2008b).
Arsenic enters the brain through an, as yet, undefined mechanism and seems to accumulate in the choroid plexus, more than in other brain compartments. Arsenic alters cholinergic, glutaminergic and monoaminergic neurotransmitter systems in adult rodents, with the dopaminergic system being the most affected. Arsenate is similar in structure to inorganic phosphate and can therefore exert substrate competition and inhibit the conversion of 3,4 dihydroxyphenylalanine (l-DOPA) to 2-(3,4-dihydroxyphenyl)ethylamine (dopamine). Arsenite interacts with thiol groups and may consequently perturb the function of enzymes for carbohydrate metabolism such as succinate and pyruvate dehydrogenase (Rodriguez et al., 2003; Vahidnia et al., 2007a).
Additionally, as mentioned before (Section 8.2.7.3) inorganic arsenic is known to induce oxidative stress, to which brain cells are particularly sensitive. Therefore arsenic induced oxidative stress is also discussed as molecular mechanism of inorganic arsenic induced neurotoxicity in vivo (Mishra and Flora, 2008; Hong et al., 2009).
Organic arsenic
In contrast to inorganic arsenic, methylarsonate and dimethylarsinate (≥0.3 µM 24 or 48 hours incubation) decreased the gene expression of neurofilament proteins in vitro (Vahidnia et al. 2007b), but not gene expression of p35. Similar to arsenite, methylarsonite and dimethylarsinite (10, 30 µM, 4 hours incubation) increase p35 gene expression and p35 cleavage to p25 (Vahidnia et al., 2008b). Hippocampal slices of young (14-21 days-old) and adult (2-4 months-old) rats were treated with methylarsonate and methylarsonite. Evoked synaptic field potentials from the Schaffer collateral-CA1 synapse (fEPSPs) were measured under control conditions as well as during and after 30 and 60 minutes of application of the arsenic compounds. Methylarsonate had no effect on the synapse functions neither in slices of adult nor in those from young rats whereas methylarsonite strongly depressed the synaptic transmission at concentrations of 50 and 25 µmol/L (adult/young rats) and LTP amplitudes at concentrations of 25/10 µmol/L (adult/young rats) respectively. In contrast, application of 1 µmol/L methylarsonite led to an enhancement of the LTP amplitude in young rats, which was interpreted as an enhancing effect on NMDA receptors and a lack of blocking effect on AMPA receptors. These impairments of the excitatory CA1 synapse were interpreted to be more likely caused by the action of methylarsonite on postsynaptic glutamatergic receptors and may be jointly responsible for dysfunctions of cognitive effects in arsenic toxicity (Krüger et al., 2009). Additionally, as mentioned for inorganic arsenic, adverse effects on brain cells might also occur by oxidative stress induced by methylated arsenicals.
8.2.7.7. Interaction of arsenic with other elements
Studies of rats exposed to arsenic, lead and cadmium either alone or in combination have revealed some additive or subadditive effects on body weight, hematological parameters and enzymes of heme synthesis (Choudhury and Mudipalli, 2008), but overall there is limited evidence that arsenic toxicity is influenced by concomitant exposure to these elements. Conversely, several lines of evidence indicate that chromium (Aguilar et al., 1997) and zinc (Kreppel et al., 1994) may be useful in reducing the toxic effects of chronic exposure to arsenic. Selenium has also been described to decrease the effects of arsenic, including clastogenicity, cytotoxicity, delayed mutagenesis and teratogenicity (ATSDR, 2007).
Several mechanisms have been suggested as being responsible for chemically-induced arsenic tolerance, including increased elimination of arsenic from the body (e.g. by formation of complexes with arsenic), induction of metallothionein (MT) (in the case of zinc) or increased methylation of inorganic arsenic to less toxic arsenicals, possibly due to glutathione synthesis. On the other hand,

Arsenic in food
98 EFSA Journal 2009; 7(10):1351
chemicals that interfere with the methylation process or decrease glutathione levels can increase arsenic toxicity (Marafante and Vahter, 1986). Cigarette smoking has been shown to increase the occurrence of lung cancer in people with high levels of arsenic in the drinking water (Chiou et al., 1995; Tsuda et al., 1995). A positive interaction between arsenic and benzo[a]pyrene has been reported for lung adenocarcinomas in hamster (Pershagen et al., 1984). Co-exposure to ethanol and arsenic may also increase the toxic effects of arsenic as suggested by experiments in rats where histological damage to the liver was reported to have increased following exposure to a combination of ethanol and arsenic compared to treatment with one or the other (Flora et al., 1997).
In summary, there are a variety of potential mechanisms for arsenical-induced carcinogenesis. Although arsenic does not induce direct DNA damage, genetic damage can be induced via oxidative mechanisms. Arsenic causes significant changes in DNA methylation and histone modifications, leading to epigenetic silencing or reactivation of gene expression. In vitro genotoxicity experiments and recent animal carcinogenicity studies provide strong support for the suggestion that arsenic can act as cocarcinogen in combination with nonmetal carcinogens. Cocarcinogenic and comutagenic effects of arsenic are likely to stem from its ability to interfere with DNA repair processes. Overall, arsenic carcinogenesis appears to require the formation of chromosomal damage, and activation of signal transduction pathways promoting survival and expansion of genetically/epigenetically altered cells. Possible mechanisms for arsenic-induced neurotoxicity include changes in the cytoskeletal composition of the peripheral nerve, alterations in neurotransmitter systems and oxidative stress.
8.3. Observations in humans
8.3.1. Biomarkers
8.3.1.1. Biomarkers of exposure
There are several biomarkers of exposure that may be used to quantify the intake of inorganic arsenic from all sources of exposure. A commonly used biomarker of arsenic exposure has been the measurement of total urinary arsenic, as most arsenic compounds present in food items are excreted in urine with a half time generally of a few days (Vahter, 1994; Vahter, 2002; Hughes, 2006). However, because seafood can contain high concentrations of organic arsenic compounds, in particular arsenobetaine, consumption of even small amounts of such food, or food items containing fish products, may markedly increase the total urinary arsenic concentrations, thereby leading to an overestimation of the exposure to inorganic arsenic (Heitland and Koster, 2008; Caldwell et al., 2009; Sirot et al., 2009). Only in the case of very low total arsenic concentrations in urine, can it be assumed that the exposure to inorganic arsenic must also be low.
Since even small increases in exposure to inorganic arsenic might be toxicologically relevant, total urinary arsenic is often not a suitable biomarker of exposure. Specific measurement of the inorganic arsenic and its methylated metabolites in urine (often called inorganic arsenic and related metabolites) provides much more reliable estimates of inorganic arsenic exposure. Thus, in European reference populations with no occupational arsenic exposure, no seafood consumption at least 48 hours prior to urine sampling and arsenic concentrations in drinking water far below 10 µg/L, mean concentrations of urinary inorganic arsenic and related metabolites are around 5-6 µg/L (Foà et al., 1984; Ranft et al., 2003; Wilhelm et al., 2005; Link et al., 2007). Assuming excretion of 1-2 L urine a day, a concentration of e.g. 10 µg/L inorganic arsenic and related metabolites would correspond to an intake of about 10-20 µg inorganic arsenic/day. Several studies from Europe, USA, South America and South-East Asia have indicated a roughly 1:1 ratio between the sum of the concentrations of inorganic arsenic and related metabolites in urine and the concentrations of inorganic arsenic in water in cases where the arsenic intake from water exceeds the one from food (Calderon et al., 1999; Concha et al., 2006; Hopenhayn-Rich et al., 1996a; Lindberg et al., 2006, 2008a; Vahter et al., 2006). Thus, at low

Arsenic in food
99 EFSA Journal 2009; 7(10):1351
levels of arsenic in drinking water, the ratio of the sum of urinary inorganic arsenic and related metabolites in urine to inorganic arsenic in water may be much higher than 1.
The sum of inorganic arsenic and related metabolites in urine may be affected by the ingestion of arsenosugars present in seafood. Thus for example Heinrich-Ramm et al. (2001) observed an around 3-fold increase of urinary dimethylarsinate after seafood consumption, and numerous studies observed an increase of the sum of inorganic arsenic and related metabolites by a factor of 2-4 after seafood consumption within 3 days before urine sampling (Link et al., 2007; Vahter and Lind, 1986). Therefore, speciation of the different metabolites of inorganic arsenic, which is used to evaluate the efficiency of arsenic metabolism, can provide an indication of exposure to dimethylarsinate, or to arsenosugars metabolised into dimethylarsinate. However, since variability in the metabolism of inorganic arsenic between individuals and population groups (Vahter, 2002) might mask low to moderate urinary dimethylarsinate contribution from seafood, it is still recommended that the individuals under study should be asked to refrain from seafood consumption a few days before sampling.
Because of the inter-individual and intra-individual variations in dilution of urine, depending on e.g. fluid intake, the concentrations of arsenic in urine need to be adjusted. Commonly, this is done by normalising the arsenic data against creatinine excretion or specific gravity (Nermell et al., 2008).
Since arsenic is cleared from blood within a few hours after absorption, total arsenic in blood has been considered to reflect only very recent exposure and to have limited value as a general biomarker of exposure. Thus older studies reported no or only poor relationships between arsenic levels in drinking water and blood (NRC, 1999; ATSDR, 2007). However, with chronic high exposure to inorganic arsenic, total blood arsenic reaches a steady state, reflecting the degree of exposure. Thus for example in a big case-cohort analysis (1152 individuals) in Bangladesh, total blood arsenic (1.6-63.9 µg/L) was highly correlated with total water arsenic (0.1-564 µg/L) and creatinine-adjusted total urinary arsenic, and there was a dose-response relationship between the risk of skin lesions and all three arsenic exposure measures (Hall et al., 2006). In a further study with 101 pregnant Bangladesh women, water arsenic (0.1-661.0 µg/L) was significantly associated with both total maternal blood arsenic (3.1-76.5 µg/L) and total cord blood arsenic (2.9-74.6 µg/L), as well as with creatinine-adjusted maternal total urinary arsenic (5.2-3084.4 µg/g creatinine); maternal and cord blood arsenic metabolites were found to be strongly correlated (Hall et al., 2007). These recent data indicate that in the case of chronic inorganic arsenic exposure total blood arsenic might be a reliable biomarker of exposure. In contrast to urinary arsenic, which reflects arsenic excretion, total blood arsenic represents a measure of internal dose, which might better reflect actual tissue burdens.
When arsenic is absorbed, it accumulates in hair and nails because of their high keratin content containing sulfhydryl groups that might bind arsenite. Because hair and nails grow slowly, they are believed to be reliable biomarkers for long-term chronic exposure to arsenic (NRC, 1999; ATSDR, 2007; Hughes, 2006). Inorganic arsenic is the predominant form of arsenic in hair and nails, the sum of methylarsonate and dimethylarsinate is generally less than 20 % of total arsenic (NRC, 1999; Mandal et al., 2003; Button et al., 2009). Animal studies revealed no accumulation of arsenic in hair after an exposure to arsenobetaine (Vahter et al., 1983). Overall, it is considered that arsenic concentrations in hair, fingernails and toenails (mostly measured as total arsenic) can be used as biomarkers of inorganic arsenic exposure.
Numerous studies demonstrated associations between arsenic in hair and nails and exposure to inorganic arsenic in drinking water (NRC, 1999; Hughes, 2006) as well as total urinary arsenic (Kurttio et al., 1998). With an increase of 10 µg/L of arsenic in drinking water or a 10-20 µg/day increase in daily arsenic intake, total arsenic in hair increased by 0.1 µg/g (Kurttio et al., 1998). Karagas et al. (2000) and Slotnick et al. (2007, 2008a) reported a significant correlation between arsenic in water and toenails. In an US population-based control study (New Hampshire, 540 individuals, 0.002-66.6 µg/L arsenic in drinking water) toenail total arsenic concentrations ranged

Arsenic in food
100 EFSA Journal 2009; 7(10):1351
from <0.01-0.81 µg/g. Based on a regression model in individuals with water arsenic of ≥1 µg/L a 10-fold increase in water arsenic was associated with a doubling in toenail total arsenic (Karagas et al., 2000); in water with arsenic concentrations <1 µg/L no correlation was found. The ability of toenail arsenic to reflect arsenic exposure was not influenced by population characteristics such as age, smoking status, body mass index (BMI), gender and medium level of selenium (Karagas et al., 2000; Slotnick et al., 2008b). Measurements of arsenic made in individual toenail and household tap water samples 3 to 5 years apart were significantly correlated in the New Hampshire study (Karagas et al., 2001, and for toenail samples collected six years apart in the Nurse's Health Study (Garland et al., 1993), indicating consistency of the measurements over time.
A major issue in the use of hair and nails as biomarkers is their adsorption of arsenic from external sources. To date it is not possible to distinguish between externally and internally derived arsenic (Hindmarsh, 2002; Hughes, 2006). In general, nails are preferred to hair, since their contamination from air is negligible, whereas hair can absorb up to 16 % exogenous inorganic arsenic (Mandal et al., 2003). However, external exposure might also result from contact with contaminated water or soil.
8.3.1.2. Biomarkers of effect
To date no specific biomarker of effect has been identified for arsenic exposure. Thus effects in humans observed after increased arsenic exposure are summarised in sections 8.2.7 “Molecular mechanisms” and 8.3.3 “Chronic effects”. Some of these might serve as biomarkers of effect for arsenic exposure. In addition, two recent studies demonstrated the significant potentials of mass spectrometry proteomics to identify the arsenic biomarkers of effect. Hegedus et al. (2008) conducted urine proteomic analyses and observed that in highly arsenic exposed men (well water >500 µg arsenic/L), there was an increased level of human β-defensin-1 (HBD-1). Harezlak et al. (2008) showed significant associations of arsenic exposure to either under- or over-expression of 20 proteins in the plasma of highly arsenic exposed study participants selected from a large arsenic case control study of skin disease in Bangladesh.
8.3.2. Short term effects
8.3.2.1. Inorganic arsenic
Reports of acute (single dose) and subacute (exposure <2-3 weeks) poisoning show that almost all physiological systems of the body can be affected including the gastrointestinal, cardiovascular, renal and nervous systems, and to a lesser degree the respiratory, hepatic, haematological and dermal systems. Most human case reports concern inorganic arsenic (arsenite or arsenate). These reports provide important information for the clinical course of the poisoning but generally do not provide the dose response information necessary for risk assessment. They show wide variation in the ingested dose and in the levels at which each of the systems is affected.
ATSDR (2007) reported an acute lethal dose after ingestion of 100-300 mg (approximately 1-5 mg arsenic/kg b.w.). The ATSDR (2007) underlined that only in some cases the chemical form responsible for arsenic intoxication in humans is known (e.g. the most common arsenic medicinal was Fowler's solution, which contained 1 % potassium arsenite or arsenic trioxide), but in the majority of cases (e.g. exposures through drinking water), the chemical form is not known and it is presumed that the most likely forms are either arsenate, arsenite or a mixture. Although more recent case reports indicate that individuals may survive much higher ingested doses with timely clinical intervention, the literature provides no data to revise the estimate of the lethal dose (Yilmaz et al., 2009; Kim and Abel, 2009).

Arsenic in food
101 EFSA Journal 2009; 7(10):1351
The major effects of subchronic elevated inorganic arsenic exposure are gastrointestinal, haematological and dermal effects. The LOAELs range approximately between 0.05 and 0.1 mg/kg b.w.day (ATSDR, 2007).
8.3.2.2. Organic arsenic
The ATSDR report (2007) and an additional literature search up to July 2009 did not locate any studies regarding acute poisoning and lethality in humans after oral exposure to organic arsenic species.
8.3.3. Chronic effects
8.3.3.1. Cancer
Skin Cancer
Arsenic is known to cause human malignancies. It was first classified as a carcinogen by the International Agency for Research on Cancer (IARC) in 1987. The decision was based largely on evidence of skin cancers following treatment with Fowler’s solution and respiratory cancers from occupational exposures via mining and smelting. In 2004, the IARC published a re-review of arsenic in drinking water and confirmed a causal relation with skin cancer. Studies considered included ecologic studies from Taiwan (primarily in the southwest endemic arsenic region) that indicated strong dose-related effects of village drinking water arsenic concentrations on skin cancer incidence, prevalence and mortality. These findings were substantiated further in cohort studies with one detecting potential effect modification of arsenic-related skin cancer risk by beta-carotene and urinary metabolites of arsenic. At lower levels of exposure, a population-based case-control study of skin cancers from the US detected evidence of a dose-related risk of squamous cell carcinomas in relation to arsenic exposure measured in toenail clippings (Karagas et al., 2001, 2002). Increased statistical power was achieved by modeling the individual data. A two segment linear regression model fit the data and identified a maximum likelihood change point of 0.105 µg/g (95 % confidence interval (CI): 0.068-0.115) after which the increasing trend of 0.61 % increase in risk of squamous cell carcinoma (SCC) associated with a 1 % increase in toenail arsenic was statistically significant (Karagas et al., 2002). The change point value in toenails equates to 1-2 µg/L based on a regression analysis of toenail versus water arsenic among the population control group for the study (Karagas et al., 2000). An additional population based case-control study from the US investigated the risk of melanoma skin cancer in relation to toenail arsenic concentration, and found a dose-related increase in risk, especially among those with a prior skin cancer diagnosis (Beane Freeman et al., 2004). This was regarded as a supporting finding because individuals with a diagnosis of colon cancer served as controls (i.e. they derived both cases and controls through the state’s population-based registry). In a geographic information system (GIS) analysis of water arsenic and nonmelanoma skin cancer and melanoma in the European Prospective Investigation into Cancer and Nutrition (EPIC) cohort in Denmark, no association was observed after adjustment for region; however, few subjects had levels above 2 µg/L (Baastrup et al., 2008). Inferences on nonmelanoma skin cancer were further limited by lack of histologic specificity (e.g. basal cell carcinomas and squamous cell carcinomas combined). The results for the key studies are summarised in Table 33.

Arsenic in food
102 EFSA Journal 2009; 7(10):1351
Table 33: Epidemiological case-control studies on skin cancer in humans in relation to ingested inorganic arsenic exposure <100 µg/L / µg/kg(a)
Reference Study
population Design
Outcome definition
Population size (n) Case/control Arsenic exposure Results Additional information
Tseng et al. (1968) South West Taiwan Ecologic
Skin cancer prevalence
40,421 (428 skin cancers)
Concentration in water (µg/L) Prevalence rate (/1000)
Used in earlier risk assessments with extrapolation to lower levels
of exposure <300 2.6
300-600 10.1 >600 21.4
Karagas et al. (2001); Karagas et al. (2002) USA (New Hampshire) Case-control study
Histologically confirmed,
incident basal and squamous
cell carcinomas (BCC, SCC)
BCC/SCC/controls Concentration in toenail (µg/g)
OR (95% CI) Maximum likelihood estimate of the point at which the dose-
response began to increase for SCC by 0.61 % with a 1 % increase in toenail arsenic:
0.105 μg/g (95 % CI = 0.093, 0.219). Equates to 1-2 μg/L in
water. In total 587 BCC cases and 284 SCC cases
BCC SCC281/155/263 0.009-0.089 1.00 (reference) 1.00 (reference) 156/64/136 0.090-0.133 1.01 (0.76, 1.35) 0.93 (0.64, 1.34) 92/33/73 0.134-0.211 1.06 (0.74, 1.51) 0.98 (0.61, 1.58) 22/14/26 0.212-0.280 0.72 (0.40, 1.31) 1.10 (0.55, 2.21) 10/5/11 0.281-0.344 0.75 (0.31, 1.81) 1.00 (0.33, 3.01) 26/13/15 0.345-0.81 1.44 (0.74, 2.81) 2.07 (0.92, 4.66)
Beane Freeman et al. (2004) USA (Iowa) Case-control study
Histologically confirmed,
incident melanoma of
the skin
Cases/controls Concentration in toenail (µg/g)
OR (95 % CI) p for trend = 0.001
Estimated 12 % equal or above 10 µg/L in the population, highest level 80 µg/L. Note finding was regarded as prelimary because
controls were colon cancer cases. In total 363 melanoma cases and
373 controls (colon cancer)
52/82 ≤0.020 1.0 58/83 0.021-0.039 1.0 (0.6, 1.6) 95/82 0.04-0.083 1.7 (1.1, 2.7)
121/82 >0.084 2.1 (1.4-3.3)
Baastrup et al. (2008) Denmark Cohort study
First NMSC 1,010 NMSC cases,
147 melanomas, cohort size = 57,053
Adjusted Analysis Further adjustment for area of enrollment
GIS analysis based on “Diet, Cancer and Health” cohort, exposure range: 0.05 and
25.3 μg/L (mean = 1.2 μg/L). No designation of histologic type, of NMSC and most could be BCC, complete coverage of NMSCs is
also questionable.
Time-weighted average exposure from water (µg/L)
NMSC melanoma NMSC melanoma p-value =
0.99 p-value =
0.80 p-value =
0.85 p-value =
0.14 0.88
(0.81-0.94) 0.89
(0.73-1.07) 0.99
(0.94-1.06) 0.80
(0.59-1.08)
Cumulated exposure (5 mg)
p-value = <0.0001
p-value = 0.35
p-value = 0.35
p-value = 0.32
0.95 (0.92-0.97)
0.80 (0.59-1.08)
0.99 (0.97-1.01)
0.96 (0.89-1.04)
(a): Excludes Knobeloch et al. (2006) of skin cancer (no histologic type specified) based on self report, excludes Guo (2001) ecologic study. CI: confidence interval; OR: odds ratio; NMCS: non-melanoma skin cancer; BCC: basal cell carcinoma; SCC: squamous cell carcinomas

Arsenic in food
103 EFSA Journal 2009; 7(10):1351
Bladder Cancer
The 2004 IARC Working Group report classified arsenic exposure in drinking water as a bladder carcinogen. The assessment was based on ecologic studies from Taiwan, Chile and Argentina that were supported by evidence from cohort and case-control studies in Taiwan. Studies at lower levels of exposure have observed increased risks of bladder cancer in certain subgroups. In particular, case-control studies by Bates and colleagues (Bates et al., 1995) in Utah (water arsenic values range from 0.5 to 160 µg/L) and Kurttio and colleagues (Kurttio et al., 1999) in Finland found dose-related effects for arsenic levels in drinking water (up to 64 µg/L), with relatively short latency periods among smokers. Two standardized mortality ratio/standardized incidence ratio (SMR/SIR) analyses, Lewis and colleagues in Utah (Lewis et al., 1999) of a Mormons cohort, and Hinwood et al. (1999) in Australia, found no excess risk; but this could be explained by study limitations, i.e. the small number of bladder cancers and questions about actual consumption of the arsenic-contaminated water. Some of the additional studies carried out since the IARC report support an excess risk of bladder cancer (Bates et al., 2004; Karagas et al., 2004; Steinmaus et al., 2003), whereas others do not (Baastrup et al., 2008; Michaud et al., 2004). Recent literature on arsenic and bladder cancer was reviewed by Cantor and Lubin (2007) and by Mink et al. (2008). Part of the inconsistencies could be due to weak statistical power to detect modest effects at lower levels of exposure. In the nested case-control study of male smokers enrolled in a chemoprevention trial, the odds ratio (OR) was over 2 in the highest tertile of toenail arsenic among long term smokers (>45 years); but this was not statistically significant. Likewise, the case-control study from New Hampshire found about a 2-fold risk of bladder cancer in the highest exposure category, but with wide CIs, and, as in the other studies, the increase risk was found only among smokers (Karagas et al., 2004). As with the skin cancer data, a two segment model fit the bladder cancer results, with a maximum likelihood change point estimate of 0.326 µg/g (equating to approximately 50 µg/L in water) with a 1.1 % increase in ORs for a 1 % increase in toenail arsenic. An earlier cohort study from Taiwan, was updated by Liao, and suggests a concentration-related trend in bladder cancer risk; however, as in the earlier report, this is based on very few bladder cancer cases (i.e. 2 men and 5 women with levels <10 µg/L, and 1 man and 3 women with levels between 10 and 50 µg/L) (Liao et al., 2009c). A further weakness is the hospital-based design, which brings into question the comparability of the controls. The results for the key studies are summarised in Table 34.

Arsenic in food
104 EFSA Journal 2009; 7(10):1351
Table 34: Epidemiological studies on bladder cancer and arsenic exposure informing dose-response at levels <100 µg/L Reference
Study population Design
Outcome definition
Population size (n) Case/control
Smoking status Arsenic exposure Results
OR (CI 95 %) Additional information
Chiou et al. (2001) North-east Taiwan Cohort study
Area endemic for arseniasis
Number cases/person years of observation
Concentration in well water (µg/L) Urinary tract
Adjusted for age, sex, smoking and duration of
drinking well water. Duration of the study
approximately 4 years only
Sample size: 8,102 (n = 18 urinary tract cancer,
11 transitional cell carcinomas (TCCs)
3/7978 <10.0 1.0 3/6694 10.1-50.0 1.5 (0.3-8.0) 2/3013 50.1-100.0 2.2 (0.4-13.7) 7/5220 >100.0 4.8 (1.2-19.4)
P for trend <0.01 Transitional cell carcinoma
1/7978 <10.0 1.0 1/6694 10.1-50.0 1.9 (0.1-32.5) 2/3013 50.1-100.0 8.2 (0.7-99.1) 6/5220 >100.0 15.3 (1.7-139.2)
P for trend <0.01
Bates et al. (1995) Utah, USA Case-Control study
Histologically confirmed bladder
cancer
Bladder Cancer cases =177 controls =266 Cases/controls
14/47 21/36 17/39 19/38
Cumulative exposure (mg) All subjects
Range 0.5-160 µg/L; recorded daily total fluid
intake in litres
Statistically significant trend observed for ever smokers with 10-19 years exposure, but not for shorter or longer
exposure, or for any exposure period for never
smokers
<19 1.00 19-<33 1.56 (0.8-3.2) 33-<53 0.95 (0.4-2.0)
>53 1.41 (0.7-2.9) (mg/L years),
latency 10-19 years
<33 1.00 33-<53 0.69 (0.3-1.5) 53-<74 0.54 (0.3-1.2) ≥74 1.00 (0.5-2.1)
10-19 years exposure 9/23
Never smoked
<8 1.00 8/19 8-<10 0.99 (0.3-2.9) 6/20 10-<13 0.67 (0.2-2.2) 6/17 ≥ 13 0.79 (0.2-2.6) 8/21
Ever Smoked
<8 1.00 12/19 8-<10 1.36 (0.5-3.9) 12/19 10-<13 1.57 (0.5-4.5) 17/18 ≥13 2.92 (1.1-8.0)
P for trend < 0.05

Arsenic in food
105 EFSA Journal 2009; 7(10):1351
Table 34: Continued
Reference Study population
Design
Outcome definition
Population size (n) Case/control
Smoking status Arsenic exposure Results
OR (CI 95 %) Additional information
Kurttio et al. (1999) Finland Case-Control study
Bladder cancer
Cases
Concentration in water (µg/L) Short latency Long latency
maximum = 64 µg/L and 1% exceeded 10 µg/L
Bladder cancer cases = 61, controls = 275
Short latency Long latency23 26 <0.1 1.00 1.00 19 18 0.1-0.5 1.53 (0.75-3.09) 0.81 (0.41-1.63) 19 17 0.5-64 2.44 (1.11-5.37) 1.51 (0.67-3.38)
(log) continuous 1.37 (0.95-1.96) 0.96 (0.59-1.55)
Smoker Never/ex-smoker
Concentration in water (µg/L) Smoker Never/ex- smoker
8 8 See results
<0.1 1.00 1.00 3 4 0.1-0.5 1.10 (0.19-6.24) 0.95 (0.25-3.02) 7 5 0.5-64 10.3 (1.16-92.6) 0.87 (0.25-3.02)
Steinmaus (2003) USA (Nevada, California) Case-Control study
Primary bladder cancer
5 years lag 40 years lag Cumulative exposure from
water (mg) 5 years lag 40 years lag
Bladder cancer cases = 181, controls = 238
58/63 130/189 Ever Smokers
<6.4 1.00 1.00 46/79 6/8 6.4-82.8 0.69 (0.40-1.18) 1.06 (0.34-3.33) 48/66 16/11 >82.8 0.76 (0.44-1.30) 2.25 (0.97-5.20) 8/38 23/92 Never
Smokers
<6.4 1.00 1.00 11/32 3/5 6.4-82.8 1.55 (0.51-4.72) 2.65 (0.49-14.24) 10/49 3/22 >82.8 0.83 (0.28-2.49) 0.50 (0.12-2.05)
Karagas et al. (2004) USA (New Hampshire) Case-Control study
Incident transitional cell
carcinoma (96 %)
Never smoker Ever smoker
See results
Toenail arsenic (µg/g) Never smoker Ever smoker Maximum likelihood estimate change-point of
0.326 µg/g (95% CI 0.121-0.446), which equates to approximately 50 µg/L,
with a 1.1% increase in ORs for 1% increase in toenail
arsenic concentration above change-point (p = 0.10).
TCC cases = 383, controls = 641
15/41 75/121 0.009-0.059 1.00 1.00 20/56 99/105 0.060-0.086 0.85 (0.38-1.91) 1.53 (1.02-2.29) 22/48 66/109 0.087-0.126 1.18 (0.53-2.66) 1.02 (0.66-1.56) 11/29 37/67 0.127-0.193 1.10 (0.42-2.90) 1.00 (0.60-1.67) 3/14 18/18 0.194-0.277 0.49 (0.12-2.05) 1.78 (0.86-3.67) 0/3 3/10 0.278- 0.330 - 0.50 (0.1-1.88) 0/8 14/11 0.331-2.484 - 2.17 (0.92-5.11)
7/4 0.331-2.484, <15 years 3.09 (0.80-11.96)
7/6 0.331-2.484, >15 years 1.86 (0.57-6.03)

Arsenic in food
106 EFSA Journal 2009; 7(10):1351
Table 34: Continued
Reference Study population
Design
Outcome definition
Population size (n) Case/control
Smoking status Arsenic exposure Results
OR (CI 95 %) Additional information
Bates et al. (2004) Argentina Case-Control study
Incident transitional bladder-cell cancer cases
Never smoker Ever smoker Concentration in water (µg/L) Never smoker Ever smoker Possible latency effects:
statistically significant associations among
smokers with more than 50 years exposure:
51-60 years OR = 2.65 (1.2-5.8);
61-70 yrs: OR = 2.54 (1.0-6.4) for well water
use. TCC cases = 114,
controls = 114
22/37 65/45 0-50 1.00 1.00
2/4 7/4 51-100 1.05 (0.2-6.9) 1.29 (0.3-5.0)
3/5 10/8 101-200 1.10 (0.2-6.3) 0.96 (0.3-3.0)
1/4 2/6 >200 0.58 (0.1-6.2) 0.17 (0.0-1.0)
Michaud (2004) Finland Case-Control study
All cases of bladder cancer were identified
through the Finnish Cancer
Registry
Years of smoking Cases
Concentration in toenail (µg/g) Years of smoking
Male smokers ages 50-60, range: 0.02-17.5 µg/g
Choice of the concentration intervals was
based on tertiles or quartiles
Total bladder cancer cases = 280, controls = 280
≤35 36-45 >45 ≤35 36-45 >45 16 57 11 0.017-0.070 1.0 1.0 1.0
21 50 18 0.071-0.137 1.14 (0.45-2.93)
0.90 (0.53-1.53)
1.46 (0.52-4.13)
30 60 17 >0.137 1.30 (0.55-3.06)
1.16 (0.69 -1.95)
2.30 (0.77-6.88)
65/74 <0.050 1.0 71/73 0.050-0.105 1.09 (0.68-1.74) 73/73 0.106-0.161 1.13 (0.71-1.80) 71/73 >0.161 1.13 (0.70-1.81)
P trend = 0.65
Baastrup et al. (2008) Denmark Cohort study
First bladder cancer 214 Bladder cancer cases
IRR (95 % CI) GIS analysis based on “Diet, Cancer and Health”
cohort, exposure range: 0.05 and 25.3 μg/L
(mean = 1.2 μg/L), i.e. few subjects >2 µg/L
Time-weighted average exposure (µg/L)
Adjusted Analysis Further adjustment for area of enrollment
p-value = 0.75 p-value = 0.93 1.01 (0.93-1.11) 1.00 (0.91-1.11)
Cumulated Exposure p-value = 0.55 p-value = 0.69 1.0 (0.98-1.04) 1.01 (0.98-1.04)
CI: confidence interval; OR: odds ratio; TCC: Transitional cell carcinoma; IRR: incidence rate ration; GIS: geographic information system

Arsenic in food
107 EFSA Journal 2009; 7(10):1351
Lung Cancer
Arsenic exposure via drinking water was also considered carcinogenic to the lung in the IARC (2004) assessment. While there are fewer studies of lung cancer, the evidence for an association is consistent in highly exposed populations, including studies from Taiwan, Japan, Chile, Argentina and the US included in the IARC report and subsequently (Guo, 2004). At lower concentrations, again, the Lewis et al. (1999) study from Utah in the USA and the Hinwood et al. (1999) study from Australia did not detect an excess mortality or risk of lung cancer, respectively, but with the limitations mentioned above. In Chile, a case-control study found evidence of a dose-related increase in lung cancer incidence, beginning with a 1.6 OR at 10-29 µg/L that was not statistically significant and an OR of 3.9 (95 % CI = 1.2-12.3) for exposure 30-49 µg/L versus 0-10 µg/L (Ferreccio et al., 2000). This was a hospital-based study, and thus, appropriate control group selection was a limitation. A re-analysis of this study performed by Smith and colleagues found a similar trend in risk associated with urinary arsenic as with water arsenic levels (Smith et al., 2009). A cohort study from Taiwan reported an increased risk of lung cancer beginning to show a significantly elevated relative risk (RR) ratio at 100 μg/L arsenic (RR = 2.28, 95 % CI = 1.22-4.27 for 100-299 μg/L); no excess risk was found in the 10-99 μg/L arsenic range (with less than 10 μg/L as the reference category) (Chen et al., 2004b). Among patients referred for a lung biopsy in Bangladesh, those diagnosed with malignant lung tumors had higher well water arsenic concentrations than those diagnosed with benign conditions (e.g. inflammatory or tubular disease), but only among smokers (Mostafa et al., 2008), while the ORs were only statistically significant for arsenic above 100 μg/L compared to less than 10 μg/L (OR = 1.65; 95 % CI = 1.25-1.68 for smokers only), there was evidence of a dose-related increase. A limitation of this study is the reliance on patients with suspicious lung lesions on chest x-ray as controls (i.e. those who screened negative for lung cancer). In Denmark, no evidence was found of an increase in lung cancer incidence with higher drinking water levels of arsenic (up to 23 µg/L) (Baastrup et al., 2008). A recent population-based study from New Hampshire (Heck et al., 2009) found evidence of an increased risk of small cell and squamous cell carcinomas of the lung (OR = 2.75; 95 % CI = 1.00-7.57), and among individuals with chronic lung disease in relation to toenail arsenic (OR = 4.78, 95 % CI = 1.87, 12.2), but no association with lung cancers overall. The results for the key studies are summarised in Table 35.

Arsenic in food
108 EFSA Journal 2009; 7(10):1351
Table 35: Epidemiological studies on lung cancer in humans in relation to ingested inorganic arsenic exposure Reference
Study population Design
Outcome definition
Population size (n) Case/control
Smoking Status Arsenic exposure Results Additional information
Lewis et al. (1999) USA (Millard County, Utah) Cohort study
Respiratory tract cancer mortality
28 cases in men, 6 cases in women
Concentration in water (µg/L-years)
SMR Mormon population abstains
from smoking; median drinking water concentration of towns ranged from 14 to 166 µg/L
Women Men <1000 0.44 0.32
1000-4999 0.66 0.96 >5000 0.22 0.44
Ferreccio et al. (2000)Chile Case-Control study
Lung cancer 151/419
OR Age- and Sex-adjusted
Hospital-based study; two control groups: i) excludes
cancers of liver, skin, kidney, bladder or prostate; ii) shared
control group for bladder cancer study – excludes cardiovascular disease (CVD), skin, neurologic
diseases
Average concentration in water 1930-1994 (µg/L)
Total
0-10 1.00 10-29 1.6 (0.5-5.3) 30-49 3.9 (1.2-12.3) 50-199 5.2 (2.3-11.7)
200-400 8.9 (4.0-19.6)
Peak years average concentration in water 1958-1970 (µg/L)
0-10 1.00 10-29 0.3 (0.1-1.2) 30-59 1.8 (0.5-6.9) 60-89 4.1 (1.8-9.6) 90-199 2.7 (1.0-7.1)
200-399 4.7 (2.0-11.0) 400-699 5.7 (1.9-16.9 700- 999 7.1 (3.4-14.8)
Average concentration in water 1930-1994 (µg/L)
Never smoked
≤49 1.00 50-199 5.9 (1.2-40.2) ≥200 8.0 (1.7-52.3)
Ever smoked≤49 6.1 (1.31-39.2)
50-199 18.6 (4.13-116.4) ≥200 32.0 (7.22-198.0)

Arsenic in food
109 EFSA Journal 2009; 7(10):1351
Table 35: Continued
Reference Study population
Design
Outcome definition
Population size (n) Case/control
Smoking Status Arsenic exposure Results Additional information
Smith et al. (2009); Re-analysis of the Ferreccio et al. (2000) study
Concentration in water (µg/L)
Mean concentration in urine (µg/L)
OR (95 % CI)
Re-analysis of the Ferreccio et al. (2000) study and the
addition of urine (Smith et al., 2009)
0-9 4.9 1.00 10-59 34.0 0.7 (0.3-1.7) 60-199 126.1 3.4 (1.8-6.5)
200-399 291.0 4.7 (2.0-11.0) 400-699 533.5 5.7 (1.9-16.9) 700-999 824.5 7.1 (3.4-14.8)
Chen et al. (2004b) Taiwan Case-Control study
Newly diagnosed
lung cancer
2503 in South West 8088 North East
(n = 139 lung cancer cases)
Average concentration in well water (µg/L)
Multivariate-Adjusted RR (95 % CI)
Overall
<10 1.00 10-99 1.09 (0.63-1.91)
100-299 2.28 (1.22-4.27) 300-699 3.03 (1.62-5.69) ≥700 3.29 (1.60-6.78)
Unknown 1.10 (0.60-2.03)
Non-smoker
<10 1.00 10-699 1.24 (0.53-2.91) ≥700 2.21 (0.71-6.86)
<25 pack-years**
<10 2.55 (0.68-9.52) 10-699 5.50 (1.96-15.5) ≥700 6.28 (1.53-25.7)
≥25 pack-years**
<10 3.80 (1.29-11.2) 10-699 5.93 (2.19-16.1)
*Packs/ day ×
duration ≥700 11.10 (3.32-37.2)

Arsenic in food
110 EFSA Journal 2009; 7(10):1351
Table 35: Continued Reference
Study population Design
Outcome definition
Population size (n) Case/control
Smoking Status Arsenic exposure Results Additional information
Mostafa et al. (2008) Bangladesh Case-Control study
Primary lung cancer 3223/1588
Average concentration in well water (µg/L)
Clinic based study; people drank from tube wells and lived in a village for 10 years; controls =
patients referred for lung cytology and found not to have cancer. No significant trends in non-
smokers
Overall 0-10 1.00 >100 Men (all): 1.45 (1.16-1.80)
Women (smokers): 2.64 (0.65-10.73)
Non-smoker
0-≤10 1.00 11-≤50 0.90 (0.62-1.33) 51-≤100 1.10 (0.62-1.96) 101-400 0.94 (0.62-1.41)
Smoker
0-≤10 1.00 11 -≤50 1.25 (0.96-1.62) 51-≤100 1.37 (0.92-2.03) 101-400 1.65 (1.25-2.18)
Baastrup et al. (2008) Denmark Cohort study
Primary lung cancer 402 0.99 (0.92-1.07) See notes on bladder cancer table.
Heck et al. (2009) USA Case-control study
Average concentration in toenail (µg/g)
All lung cancer
65/69 <0.05 1.00 58/66 0.05-<0.0768 1.34 (0.71, 2.53) 58/44 0.0768-<0.1137 1.10 (0.55, 2.20 58/44 >=0.1137 0.89 (0.46, 1.75)
Small cell and squamous cell
65/17 <0.05 1.00 58/24 0.05-<0.0768 2.99 (1.12, 7.99) 58/13 0.0768-<0.1137 1.86 (0.62, 5.58) 57/21 >=0.1137 2.75 (1.00, 7.57)
Lung Disease:
No 52/57 <0.05 1.00
121/164 >=0.05 1.02 (0.62, 1.69)
Yes 17/8 <0.05 1.31 (0.45, 3.84) 33/9 >=0.05 4.78, (1.87, 12.2)
CI: confidence interval; OR: odds ratio; SMR: standardised mortality ratio; RR: relative risk; CVD: cardiovascular disease

Arsenic in food
111 EFSA Journal 2009; 7(10):1351
Other cancers
Cancers of the kidney, liver, prostate and other sites reviewed in the IARC report (IARC, 2004) had far fewer studies, and less conclusive results. Some studies reviewed from highly exposed population found elevations in kidney cancer; however, no association was found in the Australian study (Hinwood et al., 1999), or the SMR study from Utah, with the limitations mentioned above in the section on bladder cancer. No excess of prostate cancer was found in the study from Australia (Hinwood et al., 1999); whereas the study from Utah identified an overall elevated SMR of 1.5 for prostate cancer (95 % CI = 1.07-1.9) (Lewis et al., 1999). A recent report from the southwest of Taiwan describes a decline in the SMRs for prostate cancer since the introduction of tap water, suggesting the association may be causal (Yang et al., 2008). No other cancers have been found to be consistently related to drinking water arsenic exposure. The 2009 IARC assessment still considered the evidence "limited" for cancers of the kidney, liver and prostate (Straif et al., 2009).
8.3.3.2. Skin lesions
Skin (dermal) lesions such as skin hyperpigmentation and palmoplantar hyperkeratosis are sensitive indicators of chronic inorganic arsenic ingestion. Table 36 summarises epidemiological studies relating low levels of inorganic arsenic in water (<100 µg/L) and dermal lesions/hyperpigmentation/keratosis. These dermal effects have been noted in a large majority of human studies involving repeated oral exposure via arsenic-contaminated drinking water. Studies in Bangladesh (Ahsan et al., 2000, 2006; Rahman et al., 2006a; McDonald et al., 2007), India (Guha Mazumder et al., 1998; Haque et al., 2003), Inner Mongolia (Wu et al., 1992; Li et al., 1994; Luo et al., 1994; Sun et al., 1994; Yoshida et al., 2004; Guo et al., 2006; Xia et al., 2009) and Pakistan (Fatmi et al. 2009; Kazi et al., 2009) reported increased incidences of skin lesions associated with arsenic concentrations in drinking water <100 µg/L.
There were significant associations between the skin alterations and the risk of skin cancer such as squamous cell carcinoma (NRC, 2001; Yoshida et al., 2004; Chen et al., 2005; ATSDR, 2007).
No epidemiological studies are available regarding dermal effects after exposure to organic arsenic. However, three studies have indicated that subjects excreting elevated proportions of methylarsonate have a higher risk of arsenic-induced skin lesions (ORs for skin lesions were 1.5-2.8 times greater) than those who excrete lower proportions (Ahsan et al., 2007; McCarty et al., 2007; Lindberg et al., 2008b). However, none of these distinguished between methylarsonite and methylarsonate in their measurements. Valenzuela et al. (2005) demonstrated that the average urinary methylarsonite concentration was significantly higher in exposed individuals with skin lesions compared with individuals who were exposed to inorganic arsenic through drinking water but had no skin lesions.

Arsenic in food
112 EFSA Journal 2009; 7(10):1351
Table 36: Selected epidemiological studies relating low level inorganic arsenic in water/urine (<100 μg/L) and dermal lesions
Reference Study population
Design
Population size (n) Case/Control Arsenic exposure
Results *Odds/risk ratio [95 % CI]; **Prevalence (%)
Dermal lesions Hyper-pigmentation Keratosis
Concentration in water (μg/L)
Kalra et al. (2009) (abstract) Bangladesh Prospective cohort study
Not available
<10 * 1 10.1-50 1.15 [0.88-1.49]
50.1-100 1.68 [1.30-2.19] 100.1-300 2.10 [1.30-2.19]
>300 3.39 [2.56-4.50]
Fatmi et al. (2009) Pakistan Cross sectional study
63/432
Concentartion in in urine (μg/L)
<10 ** 3.66 10-<50 9.9
50-<100 12.36 >100 18.6 (Trend p = 0.06)
Concentration in
water (μg/L)
Xia et al. (2009) Mongolia Case control study
58/3215 0-5 * 1 32/845 5.1-10 2.52 [1.47-4.30]
53/1277 10.1-20 2.83 [1.77-4.52] 235/3429 20.1-50 3.94 [2.78-5.59] 128/1537 50.1-100 6.03 [4.05-8.97] 107/1021 100.1-300 8.83 [5.77-13.51]
9/92 >300 7.94 [2.73-23.12] McDonald et al. (2007)Bangladesh Cross sectional study
85/97 0-10 * 1 53/49 11-50 1.33 [0.77–2.28] 17/9 >51 2.96 [1.02-8.59]

Arsenic in food
113 EFSA Journal 2009; 7(10):1351
Table 36: Continued Reference
Study population Design
Population size (n) Case/Control Arsenic exposure
Results *Odds/risk ratio [95 % CI]; **Prevalence (%)
Dermal lesions Hyper-pigmentation Keratosis
Rahman et al. (2006a) Bangladesh Case Referent Study
F M Concentration in water (μg/L)
F M
12/127 13/103 <10 *1 *1 15/141 38/120 10-49 1.66 [0.65-4.24] 3.25 [1.43-7.38] 65/287 59/264 50-149 3.06 [1.39-6.74] 2.28 [1.04-4.98] 84/300 110/251 150-299 4.08 [1.86-8.93] 5.41 [2.52-16.2] 56/142 52/95 >300 6.88 [3.06-15.5] 9.56 [4.20-21.8]
Ahsan et al. (2006) Bangladesh Cross sectional study
F M F M 12/1287 47/980 0.1-8.0 *1(a) * 3.61[1.79-4.53] 15/1218 72/897 8.1-40.0 1.59 [0.65-3.89] 6.88 [3.09-15.32] 118/923 27/1269 40.1-91.0 2.82 [1.20-6.61] 11.3 [5.11-24.99] 24/1245 141/946 91.1-175 2.53 [1.07-5.97] 14.04 [6.39-30.87] 48/1248 191/93 175.1-864.0 4.81 [2.12-10.88] 19.04 [8.70-41.65]
Guo et al. (2006) Mongolia Case control study
35/117(K) 5/117 (H) <50 *1 *1 41/94 (K) 13/94 (H) 51-199 1.81 [1.02-3.22] 3.59 [1.21-11.32]
58/165(K) 27/165 (H) 200-499 1.26 [0.76-2.12] 4.38 [1.60-11.98] 28/72 (K) 20/72 (H) >500 1.49 [0.80-2.78] 8.62 [2.87-25.90]
Haque et al. (2003) India, West Bengal Case control study
6/57 <50 *1 6/25 50-99 2.5 [0.7-8.9]
32/46 100-199 7.4 [2.8-20.0] 45/44 200-299 11.1 [4.2-29.6] 103/41 >300 29.4 [11.1-77.5]
Guha Mazumder et al. (1998) India Cross sectional study
4093(F) 3590(M)
F M F M <50 **0.3 ** 0.4 **0 ** 0.2
50-99 0.8 3.2 0.4 1.5 100-149 5.7 11.0 1.2 1.6 150-199 5.1 7.8 2.3 4.7 200-349 6.5 13.1 2.0 4.9 350-499 9.5 15.7 2.7 9.0 500-799 5.3 13.8 3.1 8.9
>800 11.5 22.7 8.3 10.7 Sun et al. (1994) Mongolia Ecological study
0/182 <50 **0 33/340 50-100 9.7
278/1480 >100 18.8

Arsenic in food
114 EFSA Journal 2009; 7(10):1351
Table 36: Continued
Reference Study population
Design
Population size (n) Case/Control Arsenic exposure
Results *Odds/risk ratio [95 % CI]; **Prevalence (%)
Dermal lesions Hyper-pigmentation Keratosis
Concentration in water (μg/L)
Luo et al. (1994) Central Inner Mongolia Ecological study
0/624 <40 **0 26/241 50-190 10.8 10/34 200-390 29.4 11/18 400-640 61.1 23/28 650-950 82.1
Wu et al. (1992) Central Inner MongoliaEcological study
0/112 <40 **0 1/96 50-100 1.0 10/81 110-200 12.3 18/67 210-300 26.9 20/48 310-500 41.7
CI: Confidence interval; F: female; M: male; K: keratosis; H: hyperpigmentation (a): Women were used as the reference group.

Arsenic in food
115 EFSA Journal 2009; 7(10):1351
8.3.3.3. Developmental toxicity
Effects of arsenic on foetal development
Because of the marked differences in arsenic metabolism in most experimental animals, compared to humans (Vahter, 1999), it is difficult to extrapolate the results of experimental studies to humans. There are some human studies reported, most of which are cross-sectional and ecologic in design, that increase the risk of prejudicing the outcome of assessments of both exposure and outcomes. The latter have often been obtained through interviews carried out many years after a particular pregnancy, when a mother known to be exposed may, report more adverse effects than one with no known exposure. Increased risk of spontaneous abortion, stillbirth, preterm birth and neonatal death at elevated water arsenic concentrations were indicated in three, fairly small, studies two in Bangladesh and one in West Bengal, in which 192, 533, and 202 women of childbearing age, respectively, were interviewed about previous pregnancies (Ahmad et al., 2001; Milton et al., 2005; von Ehrenstein et al., 2006). In northern Chile, register-derived data on foetal and neonatal mortality in the town of Antofagasta was found to be elevated during a period (1959-1970) with increased arsenic concentration in drinking water (800 µg/L) compared to that in the town of Valparaiso with essentially no arsenic in the drinking water (Hopenhayn-Rich et al., 2000). There are only two cohort studies with individual exposure data reported, both from Bangladesh and both fairly large. Pregnancy outcome data for 2,189 women in 2002, obtained from the Bangladesh Rural Advancement Committee (BRAC) administered Community Nutrition Centres providing care to all pregnant women in three areas with known elevated arsenic concentrations in drinking water, showed a small but statistically significant association between arsenic concentrations in drinking water (sampled at personal follow-up interviews) and birth-defects (adjusted OR 1.005; CI 1.001-1.010) although there were only 11 cases. Birth defects included individual cases of cleft lip and palate, anencephaly and hydrocephalus, congenital heart disease, missing hand, laryngomalacia, 3 cases of club feet and 2 cases of neural tube defects or meningocele (Kwok et al., 2006). No other outcomes were significantly associated with arsenic in drinking water. A much larger study involving a cohort of 29,134 pregnancies during 1991-2000 in Matlab, Bangladesh, evaluated the association between arsenic exposure via drinking water and foetal and infant survival data, obtained from the health and demographic surveillance system carried out by International Centre for Diarrhoeal Disease Research, Bangladesh (ICDDR,B) over the past 40 years in Matlab (Rahman et al., 2007). The drinking water concentrations were obtained based on interviews about drinking water history and screening of arsenic concentrations in all functioning tube-wells in Matlab in a parallel study (Rahman et al., 2006b). There was a significant but fairly weak dose-response for foetal loss, and drinking water containing more than 270 µg/L during pregnancy corresponded to a relative risk of 1.14 (CI 1.01-1.30).
There are also a few studies indicating that infants born to women who drink water with elevated arsenic concentrations during pregnancy have a lower birthweight (Hopenhayn et al., 2003b; Yang et al., 2003; Huyck et al., 2007). Two of the studies, in north-eastern Taiwan (up to 3,600 µg/L; 85 % above 50 µg/L in the drinking water) and northern Chile (average 40 µg/L in the water), showed 30 and 57 g lower birthweights in infants weighing on average 3,133 and 3,398 g, respectively. The only longitudinal study, carried out in Bangladesh showed significant negative association between birthweight or head and chest circumferences and urinary arsenic in the low concentration range (<100 µg/L in urine), where birthweight decreased by 1.7 g (standard error 0.6 g) for each µg per L of maternal urine (Rahman et al., 2009). Unexpectedly, no further negative effects were shown above about 100 µg/L. A recent study performed in Mongolia for which arsenic level in maternal drinking water of up to 100 µg/L arsenic were measured did not show adverse birth outcomes nor significant increase neonatal death rate in this population. However, in this study, the exposure assessment was based on assigning subjects to the average water content from their respective village and no individual exposure data (ecological design) were available (Myers et al., 2009).
There is increasing evidence that early-life exposures affecting foetal and infant growth, mainly by epigenetic effects, may cause chronic disease later in life (Godfrey and Barker, 2000; Langley-Evans,

Arsenic in food
116 EFSA Journal 2009; 7(10):1351
2006). Because arsenic has been shown to both affect foetal growth and to cause epigenetic effects (Vahter, 2007; Vahter, 2008), more research concerning the health risks of early arsenic exposure is highly warranted.
Effects of arsenic on child health and development
Although the breast-fed infant is largely protected from arsenic exposure, both prenatal and post-weaning exposures may affect child health and development. Indeed, a significant association between maternal exposure to arsenic during pregnancy (individual water arsenic concentrations) and on infant mortality was observed in the cohort study mentioned above, including more than 29,000 pregnancies in Bangladesh (Rahman et al., 2007). Infants born to mothers who had drinking water with more than 164-275 µg/L during pregnancy had significantly increased mortality during the first year of life (RR 1.19, CI 1.00-1.42). However, the dose-response relationship indicated that the increased risk of infant mortality started around 50 µg/L in water. There may be several mechanisms involved in arsenic-related enhanced infant mortality, e.g. growth retardation as well as impaired immune function, rendering the infant more susceptible to infectious diseases (Soto-Pena et al., 2006; Ferrario et al., 2008; Raqib et al., 2009).
Considering the major differences in how different species metabolise arsenic (Vahter, 1999) and the longer time period of brain development in humans compared with that of experimental animals, the critical neurotoxic dose may be lower in humans than in these experimental studies. A few recent cross-sectional studies have reported associations between arsenic exposure and neurobehavioural deficits in school children, although the studies did not include many children and held little information on exposure early in life. A cross-sectional study of 210 ten-year-old children, exposed to arsenic via drinking water in Bangladesh, reported that the children’s intellectual function, based on tests with WISC (Wechsler Intelligence Scale for Children) version III, was reduced in relation to increasing water arsenic concentration, after adjustment for socio-demographic covariates and water manganese (Wasserman et al., 2004). A similar investigation of 301 randomly selected six year-old children indicated that their intellectual function (tested with WISC) was negatively associated with concurrent arsenic concentrations in drinking water, after covariate adjustment (Wasserman et al., 2007). A cross-sectional study among 351 children age 5-15 years in West Bengal, India, studied associations between arsenic concentrations in the children’s urine and intellectual function assessed with six subtests from the WISC as well as with the Total Sentence Recall test, the Colored Progressive Matrices test, and a pegboard test (von Ehrenstein et al., 2007). There was, however, no evidence of an association between test results and water arsenic concentrations during pregnancy or early childhood.
Two additional, much smaller, cross-sectional studies have been reported. Chronic exposure to arsenic (geometric mean 63 µg arsenic/g creatinine in urine) and lead (89 µg/L in blood) was found to be associated with impaired neuropsychological development (Wechsler Intelligence Scale for Children, revised for Mexico, WISC-RM) in 41 children, 6-9 years of age, living in the vicinity of a smelter in Mexico, compared to 39 children living in an area with lower, although still elevated arsenic exposure, but similar lead exposure (urinary arsenic 40 µg/g creatinine, 97 µg lead/L) (Calderon et al., 2001). Higher concentrations of urinary arsenic were related to poorer test performances examining long-term memory and linguistic abstraction, while higher lead exposure was associated with lower scores in WISC-RM factors measuring attention. There were significant associations between urinary arsenic and reductions in the adjusted scores of the vocabulary test (-12 % in the upper urinary arsenic tertile), the object assembly test (-21 %), and the picture completion test (-13 %). A cross-sectional study examining cognitive function in 49 adolescents exposed to high and 60 controls exposed to low levels of arsenic in drinking water in Taiwan found that memory and switching attention were significantly affected by long-term cumulative exposure to arsenic after adjusting for education and sex (Tsai et al., 2003).
These studies on arsenic exposure and developmental effects in humans were all cross-sectional in design, focusing on a small number of (200-300) school-aged children. Obviously, neurobehavioural outcomes are influenced by the age at examination and many other factors, such as nutrition and

Arsenic in food
117 EFSA Journal 2009; 7(10):1351
stimulation. The exposure at the time of the studies may have been very different from that early in life, which may be difficult to assess in retrospect. Therefore, prospective longitudinal studies are important for evaluation of late effects of early life exposure. So far, only one such study has been reported. A large population-based cohort study looked at the effects of in utero arsenic exposure via drinking water on infant development at 7 months of age and was assessed by arsenic in maternal urine in early and late pregnancy. This study was conducted in an area with a high prevalence of arsenic-contaminated tube wells in rural Bangladesh (Tofail et al., 2009). Measurements of problem-solving ability and motor development (Bayley Scales of Infant Development-II) among 1,799 infants were not related to prenatal arsenic exposure in multiple regressions of children's motor and problem-solving test scores and behaviour ratings, after controlling for socioeconomic background variables, age, and sex. However, it is possible that effects other than those measured have occurred, or that effects may become apparent at a later age.
Support for persistent neurotoxic effects of high-dose arsenic exposure is provided by follow-up of infants who were severely poisoned by arsenic contaminated milk powder used for preparation of infant formula in Japan in the 1950ies (WHO/IPCS 1981; Grandjean and Murata, 2007). Records showed that the prepared milk contained at least 4-7 mg arsenic/L. Clinical poisoning was observed within one month of exposure, which corresponded to daily doses of 3-5 mg, depending on age, and total doses of approximately 60 mg arsenic; and more than 100 infants died. A follow-up study of the children at 14-16 years of age, including interviews of 415 children, clinical examination of 292 and psychological testing of 261 children, revealed a higher prevalence of physical and mental effects, central nervous system disorders, e.g. epilepsy, minimal brain damage, mental retardation, as well as hearing disability and proteinuria (Yamashita et al., 1972) as reported (WHO/IPCS, 1981; Dakeishi et al., 2006). Similar results were obtained in a much later follow-up when the individuals were in their 50s (Dakeishi et al., 2006).
Taken together, these studies provide some evidence for neurobehavioural effects of arsenic during childhood, also at exposure levels occurring in areas with elevated arsenic exposure via drinking water. More longitudinal studies are warranted to evaluate the most critical windows of exposure, the type of effects and dose-response relationships. Tables 37-39 summarise the studies on developmental effects.
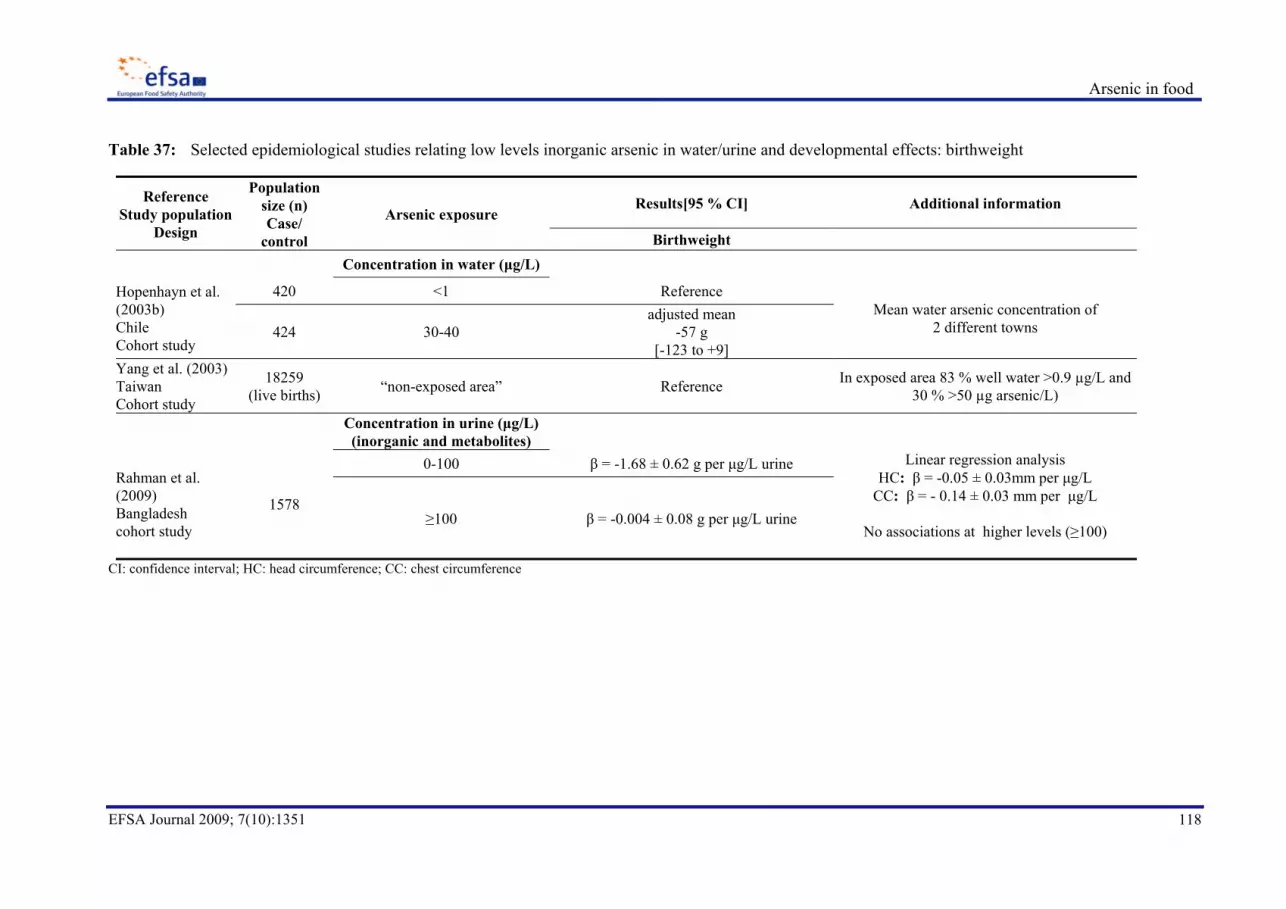
Arsenic in food
118 EFSA Journal 2009; 7(10):1351
Table 37: Selected epidemiological studies relating low levels inorganic arsenic in water/urine and developmental effects: birthweight
Reference Study population
Design
Population size (n) Case/
control
Arsenic exposure Results[95 % CI] Additional information
Birthweight
Concentration in water (μg/L)
Hopenhayn et al. (2003b) Chile Cohort study
420 <1 Reference Mean water arsenic concentration of
2 different towns 424 30-40 adjusted mean
-57 g [-123 to +9]
Yang et al. (2003) Taiwan Cohort study
18259 (live births) “non-exposed area” Reference In exposed area 83 % well water >0.9 µg/L and
30 % >50 µg arsenic/L)
Concentration in urine (μg/L) (inorganic and metabolites)
Rahman et al. (2009) Bangladesh cohort study
1578
0-100 β = -1.68 ± 0.62 g per μg/L urine Linear regression analysis HC: β = -0.05 ± 0.03mm per μg/L
CC: β = - 0.14 ± 0.03 mm per μg/L
No associations at higher levels (≥100)
≥100 β = -0.004 ± 0.08 g per μg/L urine
CI: confidence interval; HC: head circumference; CC: chest circumference

Arsenic in food
119 EFSA Journal 2009; 7(10):1351
Table 38: Selected epidemiological studies relating low levels inorganic arsenic in water/urine and developmental effects: foetal/infant loss
Reference Study population
Design
Population size (n) Case/
control
Arsenic exposure
Results *OR [95 % CI]
**Spearman correlation coefficients *** outcome rates (per 1000 births)
Additional information
Concentration in water (μg/L) Foetal loss/infant death Other
Ahmad et al. (2001) Bangladesh Cross sectional study
192 (96 exposed,
96 non exposed)
≤20 ***M: 23.7 ***Preterm birth: 27.1
98 % exposed group exposed to water >100 μg arsenic/L
***SB: 23.7
>100 ***M: 68.8 (p<0.008) 68.8 (p< 0.018) ***SB: 53.1 (p<0.046) >100,
<15 years ***M: 43.5 (p<0.03)
47.8 (p<0.021) ***SB: 43.5 (p<0.046) >100,
≥15 years ***M: 133.3 (p<0.03)
122.2 (p<0.021) ***SB: 77.5 (p<0.046)
Yang et al. (2003) Taiwan Cohort study
18,259 (live births)
“non-exposed area” *Preterm birth 1 In exposed area 83 % well water >0.9 µg/L and 30 %
>50 µg arsenic/L) “exposed area” 1.10 (0.91-1.33)
Milton et al. (2005) Bangladesh Cross sectional study
533
≤50 1
51-100, ≤10 years *M: 2.8 [1.2-6.6] *SB: 0.9 [0.2-4.6] *ND: 0.9 [0.3-3.3]
51-100, >10 years *M: 2.1 [0.8-5.3] *SB: 1.7 [0.6-4.9]
*ND: 3.9 [1.4-10.9]
>100, ≤10 years *M: 2.3 [1.1-4.5] *SB: 2.1 [0.9-4.7] *ND: 1.3 [0.6-2.7]
>100, ≥10 years *M: 2.9 [1.6-5.2] *SB: 3.6 [1.7-7.2] *ND: 2.1 [1.1-4.5]

Arsenic in food
120 EFSA Journal 2009; 7(10):1351
Table 38: Continued
Reference Study population
Design
Population size (n) Case/
control
Arsenic exposure
Results *OR [95 % CI]
**Spearman correlation coefficients *** outcome rates (per 1000 births)
Additional information
Concentration in water (μg/L) Foetal loss/infant death Other
Von Ehrenstein et al. (2006) West Bengal Cross sectional study
545 (SB) 527 (ND) 527 (ID)
≤49 1
50-199 *SB: 0.80 [0.10-6.66] *ND: 1.21 [0.09-15.4] *ID: 0.82 [0.13-5.25]
>200 *SB: 6.1 [1.54-24]
*ND: 2.81 [0.73-10.8] *ID: 1.33 [0.43-4.04]
Kwok et al. (2006)Bangladesh Cohort study
11/2006 < LOD to >300 SB: No association Birth defects : *1.005 (1.001-1.010)
No association with birthweight Significant but
very small OR

Arsenic in food
121 EFSA Journal 2009; 7(10):1351
Table 38: Continued
Reference Study population
Design
Population size (n) Case/
control
Arsenic exposure
Results *OR [95 % CI]
**Spearman correlation coefficients *** outcome rates (per 1000 births)
Additional information
Concentration in water (μg/L) Foetal loss/infant death Other
Rahman et al. (2007) Bangladesh Cohort study
29,134
<50 1
ID Risk Ratio adjusted for calendar year
OR based on logistic
regression with generalized estimating equations
≥50
ID: 1.17 [1.03-1.32] FL: 1.14 [1.04-1.25]
* ID: 1.16 [1.02-1.31] *FL: 1.15 [1.05-1.26]
<10 1
10-166
FL: 0.98 [0.86-1.11] ID: 1.13 [0.95-1.35] ND: 1.11 [0.89-1.38]
PND: 1.22 [0.91-1.63]
167-276
FL: 1.05 [0.93-1.20] ID: 1.19 [1.00-1.42] ND: 1.18 [0.95-1.47]
PND: 1.26 [0.94-1.69]
277-408
FL: 1.14 [1.01-1.30] ID: 1.29 [1.08-1.53] ND: 1.17 [0.94-1.46]
PND: 1.55 [1.17-2.05]
≥409
FL: 1.10 [0.97-1.25] ID: 1.19 [1.00-1.41] ND: 1.21 [0.98-1.50]
PND: 1.22 [0.91-1.63]

Arsenic in food
122 EFSA Journal 2009; 7(10):1351
Table 38: Continued
Reference Study population
Design
Population size (n) Case/
control
Arsenic exposure
Results *OR [95 % CI]
**Spearman correlation coefficients *** outcome rates (per 1000 births)
Additional information
Concentration in water (μg/L) Foetal loss/infant death Other
Cherry et al. (2008) Bangladesh Ecological study
30,984 <10 1 Still birth rate
>10: 2.96 %, 10-50: 3.8 %
>50: 4.43
10-<50 *SB: 1.23 [0.87-1.74] ≥50 *SB: 1.80 [1.14-2.86]
Sen and Chaudhuri, (2008) India (west Bengal) Cross sectional study
300
<10 control Chi-square test to estimate
statistical differences 10-600 SB: 0.08-1.99 (p<0.05)
M: 2.69-3.18 (p<0.05) OR: odds ratio; CI: confidence interval; LOD: limit of detection; M: miscarriage; SB: stillbirth; ND: neonatal death; ID: infant death; FL: foetal loss (miscarriage + stillbirth); PND: postneonatal death (>28days, <12 months)

Arsenic in food
123 EFSA Journal 2009; 7(10):1351
Table 39: Selected epidemiological studies relating low levels inorganic arsenic in water/urine and developmental effects (cognitive performance)
Reference Study population
Design
Population size (n) Case/control Arsenic exposure
Results *OR [95 % CI]
**Spearman correlation coefficients *** outcome rates (per 1000 births)
Additional information
Calderon et al. (2001)Mexico Cross sectional study
39
Concentration in urine (µg/g creatinine)
40.28±0.03 **Full IQ: 0.04 (NS)
Total arsenic
**Vebal IQ: -0.24 (NS) **WISC-R scale: (NS)
41 61.91±0.03.
**Full IQ: -0.33 (p<0.05) **Verbal IQ: -0.43 (p<0.05)
**WISC-R scale: concepts : -0.31 (p<0.05) knowledge: 0.41 (p<0.05) sequential: -0.31 (p<0.05)
Tseng et al. (2006) Taiwan Cross sectional study
117 (12-14 years old)
Concentration in water (μg/L) nerve conduction velocity
OR between risk of slow nerve conduction
velocity of sural sensory action potential
(<46.2 m/s) and arsenic exposure
≤10.0 *1.0 10.1-50 * 0.9 [0.3-3.2]
>50 *2.4 [0.7-8.1] Cumulative exposure (mg)
≤100 1.0 >100 *1.5 [0.3-6.9] (NS) ≤100 *1.0 >100 *7.8 [1.001-69.5] <50 *1.0
50.1-100 0.4 [0.04-3.2] >100 *2.9 [1.1-7.5]

Arsenic in food
124 EFSA Journal 2009; 7(10):1351
Table 39: Continued Reference
Study population Design
Population size (n) Case/control Arsenic exposure
Results *OR [95 % CI]
**Spearman correlation coefficients *** outcome rates (per 1000 births)
Additional information
Concentration in urine (μg/L) (total inorganic)
Von Ehrenstein et al. (2007) India Cross sectional study
351
43.6
Vocabulary: -0.14 (-0.37 to 0.10) (p<0.02)
WISC, Total Sentence Recall, the Colored
Progressive Matrices and pegboard tests
Object assembly: -0.16 (-0.34 to 0.06 ) (p<0.03) Picture completion: -0.15 (-0.34 to -0.09) (p<0.02) Full scale: -0.11 (-0.34 to 0.12) (p<0.05)
86.1
Vocabulary: -0.28 (-0.55 to -0.0008) (p<0.02) Object assembly: -0.24 (-0.49 to 0.01) (p<0.03) Picture completion: -0.26 (-0.51 to -0.01) (p<0.02) Full scale: -0.20 (-0.44 to 0.07) (p<0.05)
Concentration in water (μg/L) 0-9 Reference
10-49
Vocabulary: -0.17 (-0.48-0.14) (NS) Coding: -0.14 (-0.47-0.20) (NS) CPM: -0.02 (-0.28-0.24) (NS) Full scale: 0.006 (-0.31-0.33) (NS)
50-99
Vocabulary: -0.23 (-0.52-0.12) (NS) Coding: -0.0.03 (-0.48-0.43) (NS) CPM: -0.29 (-0.57 to -0.02) (NS) Full scale: -0.16 (-0.56-0.23) (NS)
≥100
Vocabulary: -0.05 (-0.29-0.20) (NS) Coding: -0.13 (-0.37-0.11) (NS) CPM: -0.02 (-0.28-0.24) (NS) Full scale: -0.06 (-0.30-0.18) (NS)
Wang et al. (2007) China Ecological study
Concentration in μg/L (n)
Water Urine 196 2±3 (10) 10±2 (120) **Mean IQ Score 105 ± 15
Total arsenic in water and urine 91 142±106 (46) 46±3 (50) ** Mean IQ Score 101 ± 16 (p<0.05)
180 190±183 (190) 73±3 (86) ** Mean IQ Score 95 ± 17 (p<0.05)

Arsenic in food
125 EFSA Journal 2009; 7(10):1351
Table 39: Continued Reference
Study population Design
Population size (n) Case/control Arsenic exposure
Results *OR [95 % CI]
**Spearman correlation coefficients *** outcome rates (per 1000 births)
Additional information
Wasserman et al. (2004) Bangladesh Cross sectional study
Concentration in water (μg/L)
210
0.1-5.5 reference Association was
generally stronger for well-water arsenic than for inorganic arsenic in
urine
5.6-50.0
50.1-176 Performance: β = -7.3 (p<0.05) Full scale: β = -7.8 (p<0.05)
177-790 Performance: β = -9.7 (p<0.01) Full scale: β = -11.3 (p<0.01)
Wasserman et al. (2007) Bangladesh Cross sectional study
310 (6 years old)
0.1-20.9 reference WISC preschool and primary scale tests
giving verbal, performance, processing speed and fullscale raw scores.No statistically
significant associations for verbal scale or
urinary arsenic
21-77.9 Performance raw score: β = -2.8 (p<0.03) 78-184.9 Performance raw score: β = -2.4 (p = 0.05)
185-864
Processing speed raw score: β = -2.48 (p<0.09)
Full-scale raw score: β = -5.70 (p<0.06)
Tofail et al. (2009) Bangladesh Cohort study
1799
Concentration in urine (μg/L) (inorganic and metabolites)
Problem solving tests No significant differences between
groups but significant linear tread in support
test. Infant development:
problem solving test, psychomotor
development index and behavioural ratings
“Cover” test ”Support” test 0-45.0 12.9 ± 70 11.5 ± 7.6
45.1-97.7 12.7 ± 7.1 11.4 ± 7.9 97.8-218 13.4 ± 6.8 10.9 ± 7.3
>218 12.6 ± 7.2 10.4 ± 7.8

Arsenic in food
126 EFSA Journal 2009; 7(10):1351
Table 39: Continued Reference
Study population Design
Population size (n) Case/control Arsenic exposure
Results *OR [95 % CI]
**Spearman correlation coefficients *** outcome rates (per 1000 births)
Additional information
Rosado et al. (2007) Mexico Cross sectional study
557
Concentration in urine (μg/L) (inorganic and metabolites) 98 % exposed group
exposed to water >100 μg arsenic/L
Linear regression
Sex differences: boys affected on different cognitive areas than
girls and excrete more urinary arsenic.
≤50
VSAFD: β = -0.018 [-0.096 to +0.061] PPVT: β = -0.185 [-0.293 to -0.078] WISC-RM DSS: β = -0.037 [-0.065 to -0.010] Sternberg memory: β = -0.027 [-0.065 to -0.002] VMS: β = -0.003 [-0.007 to 0.000]
>50
VSAFD: β = -0.028 [-0.053 to -0.004] PPVT: β = -0.058 [-0.120 to +0.004] WISC-RM DSS: β = -0.012 [-0.037 to +0.012] Sternberg memory: β = 0.002 [-0.008 to +0.012] VMS: β = -0.001 [-0.002 to +0.003]
OR: Odds ratio; CI: Confidence interval; NS: Non significant; WISC-R: Wechsler Intelligence Scale for Children, revised version; CPM: Coloured progressive matrices; PPVT: Peabody picture vocabulary test; DSS: Digit span subtest; VMS; Visual memory span; VSAFD: Visual-spatial abilities with figure design; IQ: Intellectual quotient.
Arsenic in food
127 EFSA Journal 2009; 7(10):1351
8.3.3.4. Neurotoxicity
Effects of arsenic on the peripheral nervous system
Peripheral neuropathy has historically been a signature observation in both acute and chronic inorganic arsenic exposure; the clinical symptoms in human poisoning being numbness in hand and feet, a pins and needles sensation, muscle weakness and diminished sensitivity to stimulation. In many cases a symmetrical peripheral neuropathy is one of the earliest symptoms of arsenic poisoning. Histological discrepancies between acute and chronic arsenic peripheral neuropathy in humans might suggest different mechanisms in their pathogenesis (Tseng et al., 2006; Kawasaki et al., 2002).
Acute exposure of humans to inorganic arsenic is commonly associated with peripheral neuropathy with both axonopathy and demyelination (Kishi et al., 2001; Goebel et al., 1990; Greenberg, 1996). Oral homicidal and suicidal dosages are usually reported in the g (<10 g) range, however early symptoms on nerve conduction velocity may start within two weeks of a total dose of approximately 50 mg (Kishi et al., 2001).
In contrast to acute exposure, chronic inorganic arsenic exposure was not found to be consistently associated with peripheral neuropathy. Positive associations between cumulative arsenic exposure (>100 mg) from well water and the parameters for peripheral neuropathy (nerve conduction velocity, vibrotactile threshold) were found by Tseng et al. (2006), who studied 130 subjects in the 12-14 year age groups. Also Hafeman et al. (2005) report an association between cumulative arsenic exposure (1,271 µg) from well water and vibrotactile threshold after studying 137 subjects in the 20-50 year age groups. However, in an older study Kreiss et al. (1983) concluded that no dose-response relationship existed between daily arsenic ingestion from well water with levels up to 5 mg/L and peripheral neuropathy (147 subjects).
In an earlier 1999 study, the National Research Council (USA) argued that existing chronic studies did not prove that neurotoxicity actually does occur as a common or significant finding at levels below 1 mg/L in drinking water. However, results of a more recent study (320 subjects, 9-64 year age groups) (Otto et al., 2007) indicate that the neurosensory effects of chronic arsenic exposure (up to 690 µg/L) occur at concentrations well below 1 mg/L drinking water. In addition, Hafeman et al. (2005) argued it is the cumulative arsenic ingestion over time and not the water arsenic that relates best to the effects, and may therefore be a better predictor. Another important issue highlighted by previous inconsistencies in such studies may be differences in sensitivity of the end-points chosen to detect peripheral neuropathy (e.g. nerve conduction velocity, vibration thresholds) (Tseng et al., 2006; Hafeman et al., 2005), but this has still to be clarified.
Peripheral neurotoxicity of organic arsenic compounds has been poorly documented. Organic arsenic compounds were used - by injection - in the past (1920-1940) to treat syphilis (3,3'-diamino-4,4'-dihydroxy-arsenobenzene; arsphenamine) while to date human African trypanosomiasis (sleeping sickness) is treated by another organic arsenic compound melarsoprol ((2-(4-(4,6-diamino-1,3,5-triazin-2-ylamino)phenyl)- 1,3,2-dithiarsolan-4-yl) methanol). Both of these compounds are notorious for their acute central arsenic toxicity (see below) while peripheral neuropathies in syphilitic and trypanosomiasis patients are only occasionally reported (Gherardi et al., 1990). Human pathology can not as yet distinguish between the inorganic and organic arsenic induced types of peripheral neurotoxicity.
Beyond these therapeutically used organic arsenic compounds, no overt human peripheral neurotoxicity has been observed in the dietary organic arsenic compounds such as arsenobetaine or arsenocholine. Similarly, the neurotoxicity of the various arsenic metabolites (e.g. methylarsonate, dimethylarsinate) has never been decisively established on a clinical level.

Arsenic in food
128 EFSA Journal 2009; 7(10):1351
Effects of arsenic on the central nervous system
Gross arsenic encephalopathy occurs more frequently in the occupational setting after acute inhalatory exposure of inorganic arsenic containing fumes (ATSDR, 2007). However, encephalopathy is also reported after acute ingestion of inorganic arsenic (generally >2 mg/kg b.w.) (ATSDR, 2007); the severity of the symptoms is related to the ingested dose and commonly affects the higher neurological functions.
Contrary to acute ingestion, the chronic ingestion of low arsenic dosages has not been reported to lead to overt encephalopathy. However, the central nervous system is more subtly affected on a neurobehavioural level as evidenced by impairment of cognitive functions for instance, learning, memory, hand-eye coordination and attentive processes.
In the infant arsenic poisoning incident that occurred in 1955 in Japan (Yamashita et al. 1972; Grandjean and Murata 2007; Dakeishi et al. 2006), mentioned above, the arsenic concentration in the infant milk was about 4-7 mg/L, corresponding to daily doses of 500 µg/kg b.w. or more, giving rise to severe effects among the infants, including many deaths. At follow-up 15 and 50 years later the surviving victims have been reported to suffer from central nervous disorders such as epilepsy, minimal brain damage or mental retardation. The serious consequences in many of the victims show that arsenic is a developmental neurotoxin and also that the effects may be irreversible at exposure levels of 4-7 mg/L.
A small percentage of syphilis patients treated with the organic arsenic compound arsphenamine developed an acute condition called arsphenamine encephalitis (hemorrhagic encephalitis, brain purpura) due to the presence of hemorrhages in the brain. Common symptoms were stupor, convulsions, vomit, headache, fever and delirium. Examination of the brain showed flattenend and broadened convulsions, the vessels of the meninges were congested in some of the cases, necrosis, demyelination and moderate to severe chromatolysis (Roseman and Aring, 1941; Globus and Ginsburg, 1933). Treatment with melarsoprol may lead to severe reactive arsenical encephalopathy, which may manifest itself either as acute nonlethal mental disturbances without overt clinical neurological signs, or rapidly progressive coma without convulsions, or convulsive status associated with acute cerebral edema (Haller et al., 1986; Adams et al., 1986).
Beyond these therapeutically used organic arsenic compounds, no overt human central neurotoxicity has been observed in the dietary organic arsenic compounds such as arsenobetaine or arsenocholine. Similarly, neurotoxicity of the various arsenic metabolites (e.g. methylarsonate, dimethylarsinate) has never been decisively established on a clinical level.
In summary, available epidemiological studies indicate a relationship between high level oral exposures to inorganic arsenic and sensitive end-points for peripheral and central neurotoxicity. Moreover, as also described in Section 8.3.3.3, exposures to the developing central, and probably the peripheral nervous system, even in utero, may lead to serious health effects in later life. Therefore longitudinal studies are necessary to better establish the relation between exposure in a specific time frame during development and neurotoxic effect.
8.3.3.5. Cardiovascular diseases
The association between arsenic exposure through drinking water contamination and cardiovascular disease has been investigated in numerous studies, and reviewed by Navas-Acien et al. (2005). Endpoints ranged from cardiovascular outcomes including Black Foot Disease (BFD), peripheral vascular disease prevalence, coronary heart disease (CHD) mortality and prevalence, and specifically myocardial infarction prevalence, stroke mortality and prevalence. The systematic review included 13 epidemiological studies of drinking water exposure.

Arsenic in food
129 EFSA Journal 2009; 7(10):1351
Prevalence of peripheral vascular disease (Black Foot Disease) was examined in at least three studies from Taiwan. One case-control study based on a clinical examination reported an OR of 3.47 (95 % CI = 2.20-5.48) associated with greater than or equal to 30 years of well water consumption compared to no well water consumption. This study adjusted for family history of Black Foot Disease, and hence could have led to an underestimate of risk if family history related to exposure. Another small case-control study (n = 20 cases and n = 20 controls) that measured urinary arsenic found an OR of 1.66 that was not statistically significant. Another small study (n = 31 cases and 30 = noncases) of accident victims measured arsenic exposure in arterial tissue, and found statistically significantly higher levels among BFD patients. Not included in the review was the ecologic study from the southwest of Taiwan that described a dose-related increase in BFD in relation to village drinking water arsenic concentrations (Tseng, 2008).
Two studies from Taiwan and two from the US investigated peripheral artery disease (PAD); all but one found positive associations with drinking water arsenic exposure. Tseng et al. (1996) conducted a cross-sectional study of PAD (n = 69 cases and n = 513 noncases) in the endemic arsenic region and estimated a relative risk of 4.28 (95 % CI = 1.26-14.5) associated with greater than or equal to 20 mg/L-year of water arsenic consumption versus no consumption. The SMR for PAD mortality among those who lived in the endemic arsenic region was 2.40 (95 % CI = 1.88-4.42) based on 175 PAD deaths (Tsai et al., 1999; Wu et al., 1989). In an ecologic study of 30 US counties, the SMR for >20 µg/L versus 5-10 µg/L water arsenic was 1.58 (95 % CI = 1.34-1.88) for PAD mortality (n = 7203 PAD deaths) (Engel and Smith, 1994). This excess was not observed in a smaller study of PAD mortality (n = 75) of the Mormon population in Utah (RR estimate for >5 mg/L-year versus <1 mg/L-year water arsenic = 0.61, 95 % CI = 0.28-1.31; n = 47 PAD deaths) (Lewis et al., 1999).
Studies of CHD prevalence or mortality indicate elevated risks associated with arsenic exposure in Taiwan, but this has not been detected in US studies. One of the cohort studies of CHD death in Taiwan estimated a relative risk of 4.90 (95 % CI = 1.36-17.7) in relation of greater than or equal to 20 mg/L-year versus no water arsenic exposure, and another a relative risk of 1.59 (1.32-1.93) for residence in the endemic arsenic region versus the general population of Taiwan. A smaller study of CHD prevalence (n = 78 cases, and n = 384 noncases) based on an electrocardiogram survey estimated a relative risk of 3.60 (95 % CI = 1.11-11.7) adjusted for multiple potentially confounding factors i.e. smoking, BMI, lipids, hypertension and diabetes. In the ecologic study of arsenic and CHD deaths in 30 US counties and a cohort study of CHD deaths in US Mormons no excess CHD mortality was observed (Lewis et al., 1999). In the cross-sectional survey from Wisconsin, self-reported CHD prevalence was increased among those with >10 µg/L versus <2 µg/L water arsenic (RR estimate = 1.54), but this was not statistically significant (95 % CI = 0.90-2.68) (Zierold et al., 2004).
Fewer studies have evaluated stroke as an outcome. In a cross-sectional study by Chiou et al. (2001), from the endemic arsenic region of Taiwan, stroke prevalence (from self report or medical records) indicated an excess risk (RR estimate = 2.69, 95 % CI = 1.35-1.93). This was not observed in ecologic analysis or the Utah Mormon study of stroke mortality from the US. A modestly elevated stroke prevalence was detected in the cross-sectional survey in Wisconsin but without statistical power (n = 31 cases).
Thus, in conclusion, an excess of cardiovascular diseases has been described in highly exposed population; but as yet, the data are limited at lower levels of exposure, and thus, limited data for quantitative dose-response evaluation at lower levels of exposure (e.g. <100 μg/L).
8.3.3.6. Abnormal glucose metabolism and diabetes
A number of studies have explored the potential effects of arsenic from drinking water exposure on risk of diabetes or on glucose metabolism. Navas-Acien et al. (2006) reviewed a total of 10 studies of general populations. Of these, four were from Taiwan and two were from Bangladesh. All six of these observed a statistically significant excess risk of diabetes, with relative risk estimates ranging from

Arsenic in food
130 EFSA Journal 2009; 7(10):1351
1.46 to 10.1 (pooled estimate of 2.52; 95 % CI = 1.9-3.75). Definitions of diabetes varied from self-report, oral glucose tolerance test (OGGT) results, glucosuria, H1AC, death certificate diagnosis or health insurance data. Study designs were either cross-sectional or cohort with arsenic exposure estimated from village drinking water, living in an endemic arsenic region, and presence of keratoses. The study by Tseng et al. (2000), was a prospective cohort study of 446 individuals in the high arsenic area of Taiwan of whom 41 developed diabetes based on OGTT greater than or equal to 7.8 mmol/L and/or a 2-hour post-load glucose level > or = 11.1 mmol/L detected on biannual follow-up examinations; the relative risk of diabetes among those with greater than versus less than 17 ppm-year water arsenic was 2.10 (1.1.0-4.2) adjusted for age, sex and body mass index (BMI). A limitation of the other studies is that they lacked adjustment for BMI.
Four studies of general populations with low to moderate exposure were reviewed by Navas-Acien et al. (2006), none found associations. Two were small hospital based studies from Europe, one from the UK, and the other from Spain; these studies used plasma and urinary arsenic as their exposure measure, respectively. No adjustment for potential confounders was made. A Utah, US study of Mormons relied on 55 diabetes cases reported on death certificates, which are not likely an accurate reflection of diabetes incidence. A case-control comparison of 67 self-reported diabetes cases measured current drinking water arsenic concentrations and adjusted for multiple factors (e.g. age, sex, BMI and smoking), with a relative risk estimate close to null for >10 µg/L versus <2 µg/L and 1.35 for 2-10 µg/L versus less than 2 µg/L; however, lack of statistical power is certainly a possible explanation for the findings and it unclear how type 2 diabetes was assessed in their survey.
More recently, Navas-Acien et al. (2008) published a report using the US National Health and Nutrition Examination Survey data which included urinary arsenic determinations, mainly of arsenobetaine and dimethylarsinate, besides total urinary arsenic; most of the measurements of inorganic arsenic and methylarsonate were below the LOD of the analytical method used. A statistically significant trend was found in the prevalence ORs for type 2 diabetes (p for trend = 0.03; OR for 80th versus 20th percentiles of total urinary arsenic = 3.58, 95 % CI = 1.18-10.83, adjusted for sex, age, race and ethnicity, education, BMI, urine creatinine, serum cotinine, hypertension medication, and arsenobetaine). The OR for 80th versus 20th percentile for dimethylarsinate was 1.57 (95 % CI = 0.89-2.76) and 0.69 (95 % CI = 0.33-1.48) for arsenobetaine. Diabetes was defined as 126 mg/dl or greater of fasting serum glucose, a self report of diabetes or use of insulin or an oral hypoglycemic medication (n = 93). Limitations of the study include adjustment rather than exclusion of arsenobetaine, that the study is cross-sectional with assessment of current arsenic exposure only, and the possibility that urinary arsenic measurements could be problematic in diabetics due to altered kidney function. In a reanalysis of this study, substacting the arsenobetaine from total arsenic (to derive the inorganic component and its metabolites), the association did not persist (Steinmaus et al., 2009). Thus, whilst aggregate studies in highly exposed populations suggest an excess risk, there remains uncertainty whether arsenic contributes to the occurrence of type 2 diabetes, and there is inadequate data from which to inform dose response at lower levels of exposure.
8.3.3.7. Other effects
The potential interaction between cadmium and arsenic in humans was examined in cohorts that were slightly (Belgian) and moderately (Chinese) exposed to both elements. Human co-exposure to cadmium and inorganic arsenic gave rise to a more pronounced excretion of biomarkers of renal damage than exposure to each of the elements alone, but further studies were needed to clarify this interaction (Nordberg et al., 2005). BMDLs for urinary arsenic and urinary cadmium, and representing a 10 % excess risk level in renal damage above the background, were derived (102 and 0.88 µg/g creatinine, respectively) for the general Chinese population co-exposed to arsenic and cadmium (Hong et al., 2003).

Arsenic in food
131 EFSA Journal 2009; 7(10):1351
8.3.4. Susceptible populations
Susceptibility factors in the response to arsenic may include life stage, sex, nutritional status, genetic make-up, exposure to other chemicals and, in particular, the arsenic exposure level. Even moderately elevated arsenic exposure may inhibit the methylation of arsenic, in particular the methylation of methylarsonate to dimethylarsinate (Lindberg et al., 2007). Consequently, this would cause proportionally higher methylarsonate doses to the fetus at higher maternal exposure levels or in the tissues of the exposed child.
8.3.4.1. Life stage
In contrast to the extensive foetal exposure in women exposed to arsenic during pregnancy (due to the easy transport of arsenic through the placenta), the infants seem to be protected towards arsenic exposure during the breast-feeding period because the passage of arsenic through the mammary gland is limited. Infants seem to efficiently methylate arsenic (Fängström et al., 2008), present high levels of circulating free choline (Ilcol et al., 2005) and folate stored in the liver (50 % higher than in the maternal liver) (Maloney et al., 2007) and are partly protected against arsenic induced oxidative stress by the significant amounts of antioxidants present in the breast milk. Indeed, determination of arsenic metabolites in the urine of breast-fed infants showed marginal increases (from 1 µg/L to 90th percentile 4 µg/L) with increasing maternal exposure to arsenic (Fängström et al., 2008). In contrast, formula prepared from drinking water may result in a very high exposure. A mortality study conducted in northern Chile in a town where the public water contained highly elevated arsenic concentrations (860 µg/L) showed an elevated infant mortality rate (particularly neonatal) (relative risk 1.5) compared to a city with comparable low arsenic concentrations in the drinking water (5 µg/L) (Hopenhayn-Rich et al., 2000). However, in that period there was a marked general decrease in infant mortality in the areas under study. A cohort study carried out in Bangladesh showed a significant increase (29 % increase) in infant mortality when mothers had been exposed to high concentrations of arsenic (275-400 µg/L) in drinking water compared with mothers with lower exposure (<10 µg/L). This effect is most likely due to prenatal exposure because most women breastfeed.
Concha et al. (1998) reported that children ingesting 200 µg/L arsenic in their drinking water excreted about 49 % as inorganic arsenic and 47 % as dimethylarsinate, compared to women who were determined to excrete 66 % of arsenic as dimethylarsinate and 32 % as inorganic arsenic (in agreement with values reported for adults with excretion of 40-60 % of the arsenic as dimethylarsinate, 15-25 % as methylarsonate and 20-25 % as inorganic arsenic. A large study was recently conducted on 2,400 children at 18 months of age (Fängström et al., 2009) in Bangladesh. Arsenic concentrations in child urine were considerably higher than that measured at three months of age, but lower than that in maternal urine. Child urine contained on average 12 % inorganic arsenic, 9.4 % methylarsonate and 78 % dimethylarsinate, which implies a marked change in metabolite pattern since infancy. In particular, there was a marked increase in urinary % methylarsonate, which has been associated with increased risk of health effects. The arsenic metabolite pattern in urine of children at 18 months of age in rural Bangladesh indicates a marked decrease in arsenic methylation efficiency during weaning.
The specific historic exposure scenario is however of great importance when the long-term effects of arsenic are considered. Two studies from northern Chile found that liver cancer mortality and lung cancer mortality under the age of 20 year was greater than expected and significantly increased among those exposed in utero or early life to peak levels of arsenic (850 µg/L) in drinking water (Liaw et al. 2008; Smith et al., 2006).
8.3.4.2. Sex differences
Men seem to be more susceptible to arsenic-induced skin lesions than women (Vahter et al, 2007; Lindberg et al., 2008a). To a great extent, this is due to more efficient arsenic metabolism in women compared to men (Lindberg et al., 2008b). In general, women have a higher fraction of dimethylarsinate and a lower fraction of methylarsonate in urine than men do

Arsenic in food
132 EFSA Journal 2009; 7(10):1351
(methylarsonate:dimethylarsinate ratios of 0.23 and 0.17 in men and women, respectively) (Hopenhayn-Rich et al., 1996b). It is known that the methylation of arsenic in women is induced during pregnancy. Pregnant women in the third trimester excrete more than 90 % dimethylarsinate in plasma and urine (Concha et al., 1998), in agreement with the efficient methylation of arsenic in the childbearing years (Lindberg et al., 2008a; Lindberg et al., 2007). This sex difference is abrogated before puberty and after menopause. This indicates there are possible hormonal effects of arsenic methylation. It has been proposed that this is related to the endogeneous production in women of the methyl group-donor choline that is regulated by estrogens (Fischer et al., 2007). Specific effects of arsenic on women’s health have also been described. For example, a higher rate of anemia during pregnancy has been reported in women exposed to moderate arsenic concentrations (40 µg/L) in Chile and increased age at menarche have been observed in Indian girls exposed to arsenic in drinking water (Vahter, 2009). Comprehension of the mechanism involved in these sex differences is limited. Conversely, it has been clearly established that the lower risk of arsenic related skin lesions in women is largely accounted for by the more efficient metabolism of arsenic in women compared to men as defined by a higher fraction of methylarsonate and lower fraction of dimethylarsinate in the urine, among men (Lindberg et al., 2008b).
8.3.4.3. Nutritional status
Several studies have shown an association between the prevalence or severity of arsenic-related health effects and indicators of food and nutritional status (Vahter, 2007), suggesting that people with poor nutrition are particularly susceptible. There are several plausible mechanisms to explain the arsenic-nutrition interaction. Because arsenic metabolism is closely linked to one-carbon metabolism, the factors influencing the transmethylation and transsulfuration reactions may also impact arsenic biotransformation. Adequate intakes of folic acid, vitamin B-12 and choline are required for the full functioning of one-carbon metabolism. Arsenic induces oxidative stress and may inhibit the expression of several antioxidant systems. Lastly, arsenic as well as diet may interfere with DNA methylation.
8.3.4.4. Genetic polymorphisms
High inter-individual variability is observed in the susceptibility of humans to arsenic exposure, which may be attributed to the genetic polymorphism in the enzyme related to arsenic metabolism. Most of the studies dealing with the genetic basis of variability in the human metabolism of arsenic concentrate on the polymorphisms of arsenic-methyltransferase and glutathione-S-transferase (GST, especially omega1 and omega2 isoforms). Schläwicke-Engström et al. (2007) analysed polymorphism in different genes supposed to affect the urinary metabolite pattern in a group of indigenous women in northern Argentina who were exposed to arsenic. They found three intronic polymorphism in arsenic-methyltransferase (GC12390C, C14215T and G35991A) associated with a lower percentage of methylarsonate and a higher percentage of dimethylarsinate in urine. Recently, Fujihara et al. (2009) have investigated the relationship between several intronic single-nucleotide polymorphisms (SNPs) in arsenic-methyltransferase and urinary arsenic profiles in 100 Vietnamese. The results show that 12390GG and 35587CC had higher urinary %-methylarsonate values and thus lower dimethylarsinate/methylarsonate values. No relationship was observed in G7395A, T14215C, and G35991A polymorphisms.
Steinmaus et al. (2007) observed that women with the null genotype of GSTM1 (i.e. no enzyme activity) excreted a significantly higher proportion of arsenic as methylarsonate than women with the active genotype. Additionally subjects with the TT/AA variant of methylenetetrahydrofolate reductase (MTHFR) 677/1298 excreted a significantly higher proportion of ingested arsenic as inorganic arsenic and a lower proportion as dimethylarsinate. To find any probable association between arsenicism and SNPs in an arsenic-exposed population from West Bengal, De Chaudhuri et al. (2008) screened the exons in the following genes: purine nucleoside phosphorylase (PNP), arsenic-methyltransferase, GSTO1, and GSTO2. Among these candidate genes, they found that distribution of three exonic

Arsenic in food
133 EFSA Journal 2009; 7(10):1351
polymorphisms, His20His, Gly51Ser, and Pro57Pro of PNP, was associated with arsenic-induced skin lesions. A case-control study, found no association with NAT2, slow acetylator genotypes and bladder cancer risk among those exposed to arsenic (Su et al., 1998).
Lindberg et al. (2007) investigated the influence of genetic polymorphisms on the arsenic metabolism in a central European population. The polymorphism of arsenic-methyltransferase, MTHFR and GSTO1-1 investigated in this study only partially explained the variation seen in arsenic metabolism (about 20 % of the variation seen in men and around 4 % among women). Similarly, Marcos et al. (2006) found that the polymorphic expression of several genes of GST isoforms only partially explained the variations in the urinary profile of arsenic metabolites. In a recent review on genetic variations associated with interindividual sensitivity in the response to arsenic, Hernandez and Marcos (2008) concluded that, despite the large number of genes included in association studies with respect to the adverse effects of arsenic exposure, no clear results have been obtained until now, except for arsenic-methyltransferase.
Arsenic has been shown to inhibit DNA repair and interfere with the DNA damage response. Population-based studies have been conducted to address the question of whether DNA repair polymorphisms are a risk factor for arsenic-induced cancer. A significant interaction was observed between a DNA repair gene polymorphism, (in XRCC1 codon 194), arsenic exposure and bladder cancer risk, but not polymorphisms in GSTM1, GSTT1, GSTP1 or epoxide hydrolase (Hsu et al., 2008). In another recent hospital based study from Taiwan, stronger trends in the risk of bladder cancer from arsenic exposure (based on urinary levels) were found among those variant for polymorphisms in cell cycle genes (e.g. p21 codon 31, p53 codon 72), although the interactions were not statistically significant. These were all relatively small studies, and to date gene-arsenic interaction for bladder cancer has been explored in only one study in populations with lower exposures. Andrew et al. (2009) detected an arsenic-gene interaction with bladder cancer risk and a XRCC3 241 polymorphism, and possibly an ERCC2 312 polymorphism in the New Hampshire bladder cancer study. Data from a population based control study in New Hampshire additionally indicate a reduced non melanoma skin cancer (NMSC) risk in relation to XPD Asp312Asn and Lys751Gln variants, supporting the hypothesis that NER polymorphisms may modify the association between NMSC and arsenic (Applebaum et al., 2007).
8.4. Dose response assessment
8.4.1. Inorganic arsenic
In 1983, the JECFA noted that available epidemiological evidence allowed the tentative conclusion that arsenicism can be associated with water supplies containing an upper arsenic (presumably inorganic) concentration of 1000 µg/L or greater (FAO/WHO, 1983). This conclusion appears to have been based on observations of effects such as hyperkeratosis, chronic cough, Raynaud's syndrome and chronic diarrhoea in patients exhibiting abnormal skin pigmentation, and Blackfoot disease in populations with elevated arsenic levels in water in Argentina (Arguello et al., 1938; Bergoglio, 1964), Chile (Zaldívar et al., 1981; Zaldívar and Guiller, 1977; Borgoño et al., 1977) and Taiwan (Tseng et al., 1968; Tseng, 1977). The JECFA further concluded that a concentration of 100 µg/L may give rise to presumptive signs of toxicity. The primary basis for this conclusion seems to have been a study in Nova Scotia (Grantham and Jones, 1977), in which the medical findings associated with a survey of well-water for arsenic content revealed that out of 33 people using water with arsenic concentrations greater than 100 µg/L, 23 (70 %) had mild symptoms and signs possibly attributable to arsenic poisoning whereas only 25 out of 86 people (29 %) consuming water with arsenic at 50-100 µg/L were similarly affected.
Assuming a daily water consumption of 1.5 L, JECFA concluded that intakes of 1.5 mg/day of inorganic arsenic were likely to result in chronic arsenic toxicity and daily intakes of 0.15 mg may also be toxic in the long term to some individuals. On this basis, without clear incorporation of a

Arsenic in food
134 EFSA Journal 2009; 7(10):1351
safety or uncertainty factor, a provisional maximum tolerable daily intake (PMTDI) of 2 µg/kg b.w. was estimated for inorganic arsenic. JECFA also noted that WHO/IPCS (1981) had estimated that 200 µg/L of arsenic in drinking-water would lead to a 5 % life-time risk of skin cancer (based on the data of Tseng, 1977), but that skin cancer did not occur in the absence of other toxic effects due to arsenic.
The JECFA subsequently confirmed its previous evaluation and converted the PMTDI into a PTWI of 15 µg/kg b.w. for inorganic arsenic, “with the clear understanding that the margin between the PTWI and intakes reported to have toxic effects in epidemiological studies was narrow” (FAO/WHO, 1989). Thus there was already some doubt at that time with respect to the adequacy of the PTWI for protection of public health.
The CONTAM Panel noted that since the JECFA evaluations, the IARC has concluded that there is sufficient evidence that arsenic in drinking water causes cancers in humans of the urinary bladder and lung as well as skin (IARC, 2004). This conclusion was repeated in 2009, when an IARC working group also noted that there is limited evidence in humans for cancers of the kidney, liver and prostate (Straif et al., 2009).
From the evidence relating to internal cancers and the studies showing statistically significant associations between adverse effects of arsenic and drinking water concentrations below 100 µg/L, the CONTAM Panel concluded that the JECFA PTWI of 15 µg/kg b.w. for inorganic arsenic is no longer appropriate. In its evaluation, the CONTAM Panel therefore focussed on possible effects of inorganic arsenic at relatively low levels of exposure, and on endpoints with sufficient evidence of causality in humans. The data from experimental animals could not provide a suitable basis for the risk characterisation because of important species differences, particularly the limited evidence of carcinogenicity of inorganic arsenic to experimental animals.
As described in Chapter 8.3, the main adverse effects reported to be associated with long term ingestion of inorganic arsenic in humans are skin lesions, cancer, developmental toxicity, neurotoxicity, cardiovascular diseases, abnormal glucose metabolism and diabetes. Neurotoxicity is mainly reported with acute exposure from deliberate poisoning or suicide, or at relatively high concentrations in drinking water. Evidence of cardiovascular disease (Blackfoot disease, peripheral vascular disease, coronary heart disease, myocardial infarction and stroke) and diabetes in areas with relatively low levels of inorganic arsenic exposure is inconclusive. Studies relating developmental toxicity (decreased birthweight, spontaneous miscarriage, stillbirth, neonatal death, impaired intellectual function) have been published over the past decade, as summarised in Tables 37-39. There is a need for further evidence regarding the dose-response relationships and critical exposure times for these outcomes.
Therefore the data for cancers of the urinary bladder, lung and skin, which are causally associated with oral exposure to inorganic arsenic and skin lesions are considered by the CONTAM Panel as possibly providing an appropriate reference point. A limitation in all of the available studies is that total dietary exposure to inorganic arsenic was not measured. In most studies, the concentration of arsenic in drinking water was used as the exposure metric. Urinary or toenail arsenic has been used in a smaller number of studies. In order to provide an opinion on the risks to health related to the presence of inorganic arsenic in foodstuffs, it is necessary to make assumptions about the total dietary exposure of the populations in which the respective health endpoints were studied. The CONTAM Panel noted that underestimating the total dietary exposure in the study populations will lead to an underestimation of the reference point and consequently to an overestimation of the risk when considering the total dietary exposure of EU countries in this opinion, and vice versa.
8.4.1.1. Estimated dietary exposure for the study populations
Estimates of average exposure from food excluding cooking water in Asian populations include: 50 (range: 15-211) µg/day (inorganic arsenic, Taiwan, Schoof et al., 1998), 171/189 µg/day

Arsenic in food
135 EFSA Journal 2009; 7(10):1351
(male/female, total arsenic, Bangladesh, Roychowdhury et al., 2002), 285 µg/day (total arsenic, West Bengal India, Chowdhury et al., 2000), 214/120 µg/day (male/female, total arsenic, Bangladesh, Watanabe et al., 2004) and 108 µg/day (Bangladesh, average b.w. 58 kg, Signes-Pastor et al., 2008). Estimated average intakes from food including cooking water are 174 µg/day (total arsenic, females, duplicate diet study, Bangladesh, Kile et al., 2007) and 34-97 µg/day (inorganic arsenic, two regions of West Bengal, using cooking water containing <3 µg/L, average b.w. 53 kg, Pal et al., 2009). The US EPA Science Advisory Board (US EPA SAB) recommended that a range of values from at least 50 µg/day to as high as 200 µg/day should be used in a sensitivity analysis (US EPA SAB, 2007). The CONTAM Panel decided to use this range together with an average body weight of 55 kg for those populations.
Estimated values for daily water intake were 1.7-3.5 L direct consumption and 1 or 1.6 L indirect consumption through use in cooking (e.g. rice, sweet potato, bread) (NRC, 1999, 2001; Watanabe et al., 2004; Kile et al., 2007; Signes-Pastor et al., 2008; Pal et al., 2009).
ATSDR extrapolated from the NOAEL for skin lesions of 9 µg/L in drinking water, to a total exposure of 0.8 µg/kg b.w. per day, assuming a very low amount in food (2 µg/day), together with water intake of 4.5 L/day (including 1 L/day used for cooking) and an average body weight of 55 kg for Taiwanese adults. In contrast, applying assumptions of 5 L water per day, including cooking, 200 μg from food, and 55 kg b.w. to the same concentration of 9 µg/L results in an estimated total dietary exposure of 4.5 µg/kg b.w. per day, i.e. approximately 5-fold greater. The assumption regarding arsenic in food is the major factor in this difference.
For the USA, assumptions of 10-20 µg/day inorganic arsenic exposure from food and 1-2 L per day direct water consumption have been applied. Approximately 10 % of total water intake is from food preparation in the USA and Canada (NRC, 1999, 2001).
On the basis of the above information, the CONTAM Panel concluded that a range of scenarios should be identified in estimating total dietary exposure to inorganic arsenic in the study populations: for rural Asian communities, 50-200 µg/day from food and 3-5 L per day for water consumption, including that used in cooking; for North and South American populations, 10-20 µg/day from food and 1-2 L per day for water consumption, including that used in cooking. Average body weights were assumed to be 55 kg for rural Asian populations and 70 kg for the North and South America.
8.4.1.2. Skin lesions (Table 36)
As noted in Section 1.3, the data from Tseng et al. (1968) and Tseng, 1977 were used by the US EPA (1998, 2001a) and ATSDR (2007) to estimate a NOAEL of 0.8 µg/kg b.w. per day. This was largely based on a population of 7,500 people who consumed water from wells containing 1-17 µg/L arsenic, compared with populations consuming water containing <300 µg/L, 300-600 µg/L and >600µg/L arsenic. Because of the uncertainty with respect to the estimated water intake and dietary exposure in this early study, the CONTAM Panel decided to model the dose-response relationship from more recent studies in order to identify a reference point for the dermal lesions.
Significant increases in the prevalence of dermal lesions were reported at drinking water concentrations below 100 µg/L for populations in Bangladesh (Ahsan et al., 2006; Rahman et al., 2006a; Kalra et al., 2009), Mongolia (Xia et al., 2009) and possibly West Bengal (Guha Mazumder et al., 1998).
Guha Mazumder et al. (1998) reported exposure to arsenic on a body weight basis, using an unspecified estimate of daily water consumption and measured body weights, but no allowance for arsenic in food. There was a statistically significant dose related increase in prevalence of skin lesions, and a small proportion (<1 % of 4,443 individuals) in the lowest tertile (0-3.2 µg/kg b.w. per day) also had lesions. The reliability of this study has been questioned due to hypothesised exposure to arsenic from sources other than drinking water and possible misdiagnosis of cases (Schuhmacher-Wolz et al.,

Arsenic in food
136 EFSA Journal 2009; 7(10):1351
2009). The studies in Bangladesh involved more robust approaches to ascertain cases. Ahsan et al. (2006) also took into account increased susceptibility due to impaired nutritional status, which Rahman et al. (2006a) did not. Schuhmacher-Wolz et al. (2009) therefore favoured the dataset of Ahsan et al. (2006) in their dose-response modelling of arsenic-induced skin lesions. In this cross-sectional study involving more than 10,000 subjects, there was a statistically significant increase in prevalence of skin lesions associated with drinking water inorganic arsenic of 8.1-40 (median 23) µg/L compared to the lowest quintile of 0.1-8 (median 1.8) µg/L at which the prevalence was 5 % in males (47/980) and 1 % in females (12/938). The OR of the second lowest exposure quintile ranging from 8.1 to 40.0 μg/L adjusted for age, gender, socioeconomic status, sun exposure and BMI was 3.35 (95 % CI: 1.43-7.38, frequency: 72/897) for males and as such statistically significantly different from the reference quintile with a p-value less than 0.05 whereas the increase in females was not statistically significant from the lowest quintile in the second lowest exposure quintile with an OR = 1.66 (95 % CI: 0.65-4.24) but in the middle quintile ranging from 50 to 149 μg/L (OR = 3.06; 95 % CI: 1.39-6.74).
Schuhmacher-Wolz et al. (2009) conducted a dose-response modelling for men only using an older version of the US EPA’s benchmark dose software (BMDS) version 1.3.2 which gave "suitable fits with p-values above or near 0.2" only with the log-probit and log-logistic models. The results obtained with the log-probit and log-logistic models were benchmark dose (BMD01) and (BMDL01)28 values of 22.8 (13.2) μg/day and 12.5 (6.4) μg/day, respectively. The drinking water arsenic concentration in Ahsan et al. (2006) was transformed by combining arsenic intake via food according to Watanabe et al. (2004) and arsenic intake via 3 L drinking water per day and calculating therefrom a total arsenic intake in the unit of μg (per person and day). Recalculation of their analysis showed that Schuhmacher-Wolz et al. (2009) expressed the benchmark dose response (BMR) as extra risk and had used the two models with unrestricted slope. Adjusting for 50 kg b.w. resulted in a BMD01 (BMDL01) of 0.25 (0.13) µg/kg b.w. per day, when using the log-probit model results.
The CONTAM Panel used Ahsan et al. (2006) conduct a BMD analysis according to the recent EFSA opinion (EFSA, 2009b) using the combined (males and females together) skin lesion incidence data and decided that because the exposure data were concentrations in drinking water the results should be expressed as a benchmark concentration (BMC) and its lower confidence limit (BMCL). For a 1 % extra risk the BMC01 and BMCL01 for these data as 26.47 µg/L and 22.92 µg/L, respectively, were calculated using the most recent US-EPA software package BMDS version 2.0 applying the log-logistic model which fitted best among the models provided by BMDS for quantal data (see Table 40) when restricting the slope to values not larger than 1. The BMD analysis is described in detail in Appendix showing also the risk BMC01 and BMCL01 values obtained with no slope restriction.
28 95 % lower confidence limit of the benchmark dose for 1 % extra risk

Arsenic in food
137 EFSA Journal 2009; 7(10):1351
Table 40: Skin lesion data from Ahsan et al. (2006) used in benchmark dose-analysis.
Arsenic-exposure measure (quintiles)
μg/L
Median time weighted well arsenic concentration
in water per exposure quintile µg/L
Number of cases with dermal lesions
Total number of individuals
0.1–8.0 1.8 57 2259 8.1–40.0 23 90 2122
40.1–91.0 62 144 2202 91.1–175.0 125 162 2185
175.1–864.0 255 242 2183
Rahman et al. (2006a) reported the results of a case-control study conducted in Matlab, Bangladesh, 53 km southeast of Dakah where the Meghna river joins the confluent Brahmaputtra and Ganges with highly affected bedrock, on a population exposed to tube well drinking water contamined with arsenic. A total of 504 cases identified when screening 166,934 persons in that region was matched to n = 1830 evaluable unexposed controls. Arsenic exposure was categorised into five groups 0-9.9, 10-49, 50-149, 150- 299 >299 µg/L, and mean lifetime doses were calculated for these 5 exposure groups separately for females and males to 8.3, 60, 124, 199, 370 µg/L and 9.8, 59.3, 127, 199, 344 µg/L, respectively. Both, for the females (272 cases and 833 controls) and the males (232 cases and 997 controls), population risk of arsenic related skin lesions was increased, statistically significantly in the second lowest category for males (OR = 3.25, 95 % CI: 1.43-7.38) and in the middle category for females (OR = 3.06, 95 % CI: 1-39-6.74). A Benchmark dose analysis was based on estimated prevalence and estimated exposure using the data reported by Rahman et al. (2006a). A total of 182 766 individuals was identified as eligible for the examination of skin lesions when combining the 180 811 residents > 4 years who had lived and consumed drinking water in the Health and Demographic Surveillance System (HDSS) area at least 6 months prior to the study with the 1 955 referents >4 years who were randomly selected from the HDSS database living in Matlab. Using the distribution into the five exposure groups of the 1830 interviewed and examined referents without lesions (Table 36) the CONTAM Panel calculated from the five percentages (230/1830 = 12.57 %, 261/1830 = 14.26 %, 542/1830 = 30.11 %, 551/1830 = 30.11 %, and 237/1830 = 12.95 %) the total number of individuals in the five exposure groups, respectively (Table 41: Estimated total number of individuals) on the basis of the total number of 182 766 eligible individuals. Using the mid-dose of the exposure categories, setting the highest dose equal to 300+100 = 400 µg/L and combining males and females responses the Benchmark analysis was based on the quantal dose-response data presented in Table 41:
Table 41: Skin lesion data from Rahman et al. (2006a) used in benchmark dose-analysis
Exposure intervals µg/L
Midpoint of exposure intervals of arsenic
concentration in water µg/L
Number of cases with dermal lesions
Estimated total number of individuals
<10 5 25 22971 10-49 30 53 26067
50-149 100 124 55029 150-299 225 194 55029 ≥300 400(a) 108 23670
(a): Dose deliberately set to 400 µg/L for the largest interval >300 µg/L, used in Table 3 in Rahman et al. (2006a).
The excess risk BMC01 and BMCL01 values of the accepted models calculated using US EPA software package BMDS version 2.0, ranged between 1152 and 2049 and between 804 and 1160, respectively. Because these values were 2-5 times higher than the highest concentration used in this analysis, they

Arsenic in food
138 EFSA Journal 2009; 7(10):1351
were not considered to provide an appropriate reference point. The BMD analysis is described in detail in Appendix.
A recent study on more than 12,000 persons in Inner Mongolia has shown a strong association between well water arsenic and increased prevalence of skin lesions statistically significantly elevated from concentrations of 5.1-10 µg/L and above (10.1-20, 20.1-50, 50.1-100, 100.1-300 and >300 µg/L) compared to a lowest exposure category ranging up to 5 µg/L (Xia et al., 2009). They observed in the second lowest category a prevalence of 3.8 % compared to 1.8 % in the lowest, corresponding to an OR = 2.52 (95 % CI: 1.47-4.30, n = 845, n-affected = 32) compared to the reference category of the lowest dose interval 0-5 µg/L (n = 3,215, n-affected = 58). The OR of the five higher exposure intervals increased up to 8.83 (2.83 for 10.1-20 µg/L, 3.94 for 20.1-50 µg/L, 6.03 for 50.1-100 µg/L, 8.83 for 100.1-300 µg/L, and 7.94 for >300 µg/L). Using the midpoint of each dose interval as exposure dose the CONTAM Panel calculated for a 1 % excess risk the BMC01 and BMCL01 of 0.56 µg/L and 0.31 µg/L, respectively using US EPA software package BMDS version 2.0 for the log-probit model (with no slope restriction) which fitted best the dose response data (Table 42). The BMD analysis is described in detail in Appendix showing also the risk BMC01 and BMCL01 values obtained with slope restriction where however none of the models was acceptable.
Table 42: Skin lesion data from Xia et al. (2009) used in benchmark dose-analysis.
Exposure intervals µg/L
Midpoint of exposure intervals of arsenic
concentration in water µg/L
Number of cases with dermal lesions
Total number of individuals
0-5 2.5 58 3215 5.1-10 7.5 32 845
10.1-20 15 53 1277 20.1-50 35 235 3429 50.1-100 75 128 1537
100.1-300 200 107 1021 ≥300 400(a) 9 92
(a): Dose deliberately set to 400 µg/L for the largest interval >300 µg/L, used in Table 2 in Xia et al. (2009)
8.4.1.3. Skin cancer (Table 33)
Previous assessments, such as that of WHO/IPCS (1981), based their skin cancer risk estimates on the data of Tseng et al. (1968), Tseng (1977) with extrapolation to lower levels of exposure. For example, the US EPA used these data to estimate that the lifetime risk due to 1 μg/kg b.w. per day of arsenic intake from water ranges from 1 × 10⁻³ to 2 × 10⁻³ (US EPA, 1998). More recent assessments have focussed on the internal cancers because of limitations in the data, particularly with respect to exposure (NRC 1999, 2001; US EPA SAB, 2007). Of the newer studies, one in Iowa, USA, reported a significant association between histologically confirmed melanoma and arsenic concentration in toenails (Beane-Freeman et al., 2004). The results of this study are considered preliminary and require confirmation because of the unusual reference group (patients with colon cancer). A study conducted in New Hampshire, USA, associated the incidence of histologically confirmed basal and squamous cell carcinomas with toenail arsenic concentration (Karagas et al., 2002). Regression analysis resulted in a non-linear curve, the base of which is the maximum likelihood change point at which the dose-response began to increase (0.105 µg/g; 95 % CI: 0.093-0.219) and might be viewed as a NOAEL for skin cancer. According to the regression analysis of Karagas et al. (2000), this range in toenail arsenic correlates with 1-2 µg/L arsenic in drinking water, and hence it is at common background levels of arsenic exposure.

Arsenic in food
139 EFSA Journal 2009; 7(10):1351
8.4.1.4. Urinary bladder cancer (Table 34)
A statistically significant increase in the incidence of bladder cancer has been reported in Finland associated with arsenic in drinking water at a concentration range of 0.5-64 µg/L compared to <0.1 µg/L (Kurttio et al., 1999). The authors noted that the relative risks were higher than expected from other studies and that more studies were needed to confirm the possible association at such low exposure levels. The NRC modelled the data from North East Taiwan involving about 8,000 individuals (Chiou et al., 2001) and older data from South West Taiwan (Chen et al., 1985, 1992). The data of Chiou et al. (2001) showed a significant trend for urinary tract and transitional cell carcinoma with increasing arsenic concentrations in water, although the numbers of cases at concentrations below 100 µg/L were small and not statistically significant compared to the lowest quartile (<10 µg/L). The BMC01
29 (and BMCL01) values for the model with an acceptable fit producing the lowest results (additive, linear dose, <200 µg/L) were 129 (42) and 281 (92) µg/L for males and females, respectively from the Chiou data and 102 (94) and 138 (125) µg/L for males and females, respectively from the Chen data (NRC, 2001). The CONTAM Panel considered that the Chen data related to relatively high concentrations in drinking water and did not use them in the assessment. In their New Hampshire, USA, study Karagas et al. (2004) found a two-fold increase in risk of bladder cancer in the highest category of toenail arsenic which was not statistically significant. As for the skin cancer data, regression analysis resulted in a non-linear curve, and the maximum likelihood change point at which the dose-response began to increase was 0.326 µg/g; (95 % CI: 0.121-0.446), which is higher than the corresponding value for skin cancer.
8.4.1.5. Lung cancer (Table 35)
NRC (2001) focussed on the data from South West Taiwan of Chen et al. (1985, 1992). Their lowest calculated BMC01
29 (and BMCL01) values for the model with an acceptable fit (additive, linear dose) were 38 (37) and 33 (31) µg/L for males and females, respectively. The NRC considered that these results were supported by the data of Ferreccio et al. (2000) who reported significant increases in the prevalence of lung cancer in Chile at drinking water concentrations of 30-49 µg/L and above, compared to the lowest quintile of 0-10 µg/L. Based on the years with highest arsenic exposure, the NRC calculated BMC01
29 (and BMCL01) values by linear regression of 17 (14) and 27 (21) µg/L for males and females, respectively (NRC, 2001). As for the bladder cancer data, the CONTAM Panel considered that the data of Chen et al. (1985, 1992) related only to relatively high concentrations in drinking water and they were not used for the current opinion, but noted that applying the assumptions described in section 8.4.1.1 the BMCL01 of 31 µg/L can be extrapolated to a dietary dose of 2.6-6.5 μg/kg b.w. per day. The recent data reported in Heck et al. (2009) are not adequate for dose-response modelling.
8.4.1.6. Selection of critical reference point
The potential reference points described above are summarised in Table 43, together with the estimated total dietary exposure ranges associated with the water concentrations. The CONTAM Panel noted that the US EPA SAB supported the use of the Taiwanese data in the EPA risk assessments, but recommended that other relevant epidemiological databases should be used to compare the risk estimates (US EPA SAB, 2007). The EFSA opinion on benchmark dose modelling (EFSA, 2009b) provides no formal guidance on an appropriate benchmark response for human data or on calculation of confounder adjusted BMDs and BMDLs. Because the individual data were not available to the CONTAM Panel, it estimated a 1 % excess risk (and its lower 95 % CI) on the unadjusted incidence data reported in the original papers. Whilst it would also be possible to estimate 5 % or 10 % excess
29 NRC (2001) referred to ED01s as the doses corresponding to a theoretical 1 % excess risk of cancer mortality in the US
population. The CONTAM Panel considers these values to be BMC01 values since they relate to concentration of arsenic in drinking water and not to dose.

Arsenic in food
140 EFSA Journal 2009; 7(10):1351
risk, the CONTAM Panel concluded that a 1 % excess risk would be within the observed data range, and decided to use the 1 % excess risk for dose response modelling.
The lowest BMDL values are for lung cancer (Table 43). This is from a relatively small study but has the advantage that the population is likely to have a nutritional and genetic background that is more similar to that of EU populations than those of the rural Asian populations. The CONTAM Panel noted that the association was much stronger in smokers, consistent with inorganic arsenic being a co-carcinogen, and could not determine whether there would be residual confounding after adjusting for smoking. The data for skin lesions are from larger populations. Inorganic arsenic exposure is considered to be a necessary but not sufficient cause of dermal lesions (Chen et al., 2006) and given that the observations of dermal lesions mainly originate from rural Asian communities with high levels of arsenic in the water, it is possible that the findings were influenced by other factors such as nutritional status. The CONTAM Panel therefore concluded that the overall range of BMDL01 values of 0.3-8 μg/kg b.w. per day identified in Table 43 should be used instead of a single reference point in the risk characterisation for inorganic arsenic. Allowing for the uncertainty in correlating toenail arsenic to dietary exposure, the change points identified for skin and bladder cancer in New Hampshire, which provide indication of no effect level for these endpoints, seem to support this range.
In addition, the CONTAM Panel assessed the data associating birthweight with arsenic content in urine of the mother collected at around of gestational weeks 8 and 30 (both contents were averaged) in a prospective cohort study in 1578 evaluable mother-infant pairs in Matlab, Bangladesh conducted in 2002-2003 (Rahman et al., 2009). The investigated dose range was restricted to arsenic exposure level less than 100 μg/L urine. Birthweight decreased by 1.68 g (standard error (s.e.): 0.62, p = 0.007) when arsenic level in mother’s urine increased by 1 μg/L. The cut off level of 100 μg/L was determined by the same data using non-linear regression smoothing (loess method) by visual inspection of the fitted curve and its leveling out after a decrease at low arsenic exposure levels (see Figure 2 A in the original paper of Rahman et al., 2009) and it was substantated by a statistical test when dichotomising exposure at the level of 100 μg/L aresenic in mothers urine averaged between gestation week 8 and 30.
The intercept of the linear regression line not available from the publication was visually estimated from the loess curve provided in the above mentioned Figure 2(A) to 2730 g birthweight. Applying a BMR = 0.01 (i.e. 1 % reduction from background corresponding to a decrease by 27.3 g) one would get from the slope estimate 1.68 [μg/L per g birthweight] a BMD01 = 27.3/1.68 = 16.25 μg/L. An exact calculation of a BMDL01 is not possible from the information available from Rahman et al. (2009). However, when using the lower one-sided 95 % confidence bound of the slope of -2.7 [μg/L per g birthweight]30 for the calculation of the BMDL01, a value of 27.3/2.7 = 10.11 μg/L maternal urine would be obtained. Therefore, it was concluded that the BMDL01 for the birthweight of this study would be around 10 μg/L maternal urine. According to correlations of Lindberg et al. (2006), Vahter et al. (2006) and Lindberg et al. (2008a) this could be in the region of about 10-20 µg/day from water and food combined or about 0.3 µg/kg b.w. per day assuming a b.w. of 55 kg, which further supports the range of BMDL01 values identified in Table 43.
The CONTAM Panel noted that inorganic arsenic is not directly DNA-reactive and there are a number of proposed mechanisms of carcinogenicity, for each of which a thresholded mechanism could be postulated. However, taking into account the uncertainty with respect to the shape of the dose-response relationships, it was not considered appropriate to identify from the human data a dose of inorganic arsenic with no appreciable health risk, i.e. a tolerable daily or weekly intake. Therefore the margins of exposure (MOEs) should be assessed between the identified reference points from the human data and the estimated dietary exposure to inorganic arsenic in the EU population.
30 The one-sided lower 95 % confidence bound of the slope was calculated as slope (-1.68) + (-1.64 x s.e) = -2.7, using the
one sided 5 % percentile 1.64 of the Gaussian normal distribution and the s.e. = 0.62 taken from Table 3 of Xia et al. (2009).

Arsenic in food
141 EFSA Journal 2009; 7(10):1351
Table 43: Summary of potential reference points for inorganic arsenic
Endpoint Population Reference point μg/L water
Reference point μg/kg b.w. per day
Dermal lesions Bangladesh (Ahsan et al., 2006) BMCL01: 23(a) BMDL01: 2.2-5.7(b)
Dermal lesions Mongolia (Xia et al., 2009) BMCL01: 0.3(a) BMDL01: 0.93-3.7(b)
Lung cancer Chile (Ferreccio et al., 2000)
BMCL01: 14 (NRC, 2001) BMDL01: 0.34-0.69(c)
Bladder cancer North East Taiwan (Chiou et al., 2001)
BMCL01: 42 (NRC, 2001) BMDL01: 3.2-7.5(b)
Skin cancer USA (New Hampshire) (Karagas et al., 2002) Change point(d): 1-2 Change point: 0.16-0.31(c)
Bladder cancer USA (New Hampshire) (Karagas et al., 2004) Change point: ca. 50 Change point: 0.9-1.7(c)
b.w.: body weight; BMCL01: 95 % lower confidence limit of the benchmark concentration of 1 % extra risk; BMDL01: 95 % lower confidence limit of the benchmark dose of 1 % extra risk
(a): Calculated by CONTAM Panel for this opinion (b): Extrapolated from the BMCL01 assuming 3-5 L water and 50-200 µg/day inorganic arsenic in food per day, 55 kg b.w.
(see Section 8.4.1.1) (c): Extrapolated from the BMCL01 assuming 1-2 L water and 10-20 μg/day inorganic arsenic in food consumed per day,
70 kg b.w. (see Section 8.4.1.1) (d): The maximum likelihood change point before the trend becomes significant, which provides an indication of a no effect
level rather than a BMDL (see Section 8.3.3.1)
8.4.2. Organic arsenic
The toxicities of different organic arsenic compounds are not comparable and need to be considered separately.
Arsenobetaine is not metabolised in humans and is excreted unchanged. Although few direct toxicity data are available, either in humans or in experimental animals, arsenobetaine is assumed to be of no toxicological concern. In addition, very few occurrence data from member states were submitted to the CONTAM Panel and therefore arsenobetaine is not considered further in this opinion.
Arsenosugars and arsenolipids are metabolised by humans to dimethylarsinate (Raml et al., 2009; Schmeisser et al., 2006), but no other information is available regarding their toxicity.
The gastrointestinal tract appears to be the most sensitive target of toxicity for methylarsonate in experimental animals. From the results of Arnold et al. (2003) the ATSDR calculated BMD(L)10 values of 16 (12) mg/kg b.w. per day for diarrhoea in female rats (ATSDR, 2007).
For dimethylarsinate, the most sensitive effect is carcinogenicity in the urinary bladder, observed in rats. The mode of action is considered to involve cytotoxicity and sustained increased cell proliferation rather than direct DNA damage (US EPA, 2005b; Cohen et al., 2006). The US EPA modelled the dose-response relationships for cell proliferation (labelling with bromodeoxyuridine), hyperplasia and tumour incidence, resulting in BMD(L)10 values of 0.65 (0.29), 1.97 (1.61) and 7.74 (5.96) mg/kg b.w. per day, respectively (US EPA, 2005b). However, the rat is considered to be particularly sensitive to dimethylarsinate due to dimethylarsinate’s (pentavalent) much slower elimination and greater potential

Arsenic in food
142 EFSA Journal 2009; 7(10):1351
for metabolism to dimethylarsinite (trivalent) in rat compared to other species, including human (Cohen et al., 2006; ATSDR, 2007).
Because very few occurrence data were submitted on methylarsonate and dimethylarsinate, the CONTAM Panel does not consider these compunds further in this opinion.
9. Risk characterisation
The estimated national dietary exposures to inorganic arsenic for average (0.13-0.56 μg/kg b.w. per day) and high level adult consumers (0.37-1.22 μg/kg b.w. per day) in Europe (see Table 26) are within the range of the BMDL01 values (0.3-8 μg/kg b.w. per day) identified by the CONTAM Panel for lung and bladder cancer and for dermal lesions. Therefore there is little or no MOE and the possibility of a risk to some consumers cannot be excluded.
The limited available evidence does not indicate a different dietary exposure or risk for vegetarians from the general population (Table 32).
Consumer groups with higher inorganic arsenic exposure levels include high consumers of rice such as certain ethnic groups (0.95 μg/kg b.w. per day) and high consumers of algae-based products (4.03 μg/kg b.w. per day) (see Table 32). The estimated dietary exposures of these groups are also within, or at the higher end of the range of the BMDL01 values.
Infants below 6 months of age fed on only breast-milk have very low intakes of inorganic arsenic. Infants fed only on cows’ milk formula reconstituted with water containing arsenic at the average European concentration level have intakes of inorganic arsenic that are about 3-fold higher than those of breast-fed infants, but below the range of BMDL01 values. Substitution of milk with rice-based infant formula might lead to a daily inorganic arsenic intake that is higher than for other consumers; however data on such formula were not submitted to EFSA. The estimated dietary exposures of children under three years of age (0.50-2.66 µg/kg b.w. per day) are about 2 to 3-fold higher than those of adults, due to their greater food consumption relative to their body weight. This does not necessarily indicate that children are at greater risk because the effects are due to long term exposure and the exposure estimates are also within the range of BMDL01 values.
The available data on mean and median urinary arsenic in European populations without specific high level exposure are in the region of 5-6 μg/L, which is close to, or below, the concentrations in the reference populations in the epidemiological studies providing the basis for the BMDL01 values. However, data on European sub-groups with high dietary inorganic arsenic exposure were not available.
10. Uncertainty analysis
The evaluation of the inherent uncertainties in the assessment of exposure to arsenic has been performed following the guidance of the Opinion of the Scientific Committee related to Uncertainties in Dietary Exposure Assessment (EFSA, 2006). In addition, the report on “Characterizing and Communicating Uncertainty in Exposure Assessment” has been considered (WHO/IPCS, 2008). According to the guidance provided by the EFSA opinion (2006) the following sources of uncertainties have been considered: assessment objectives, exposure scenario, exposure model, and model input (parameters).
10.1. Assessment objectives
The objectives of the assessment were clearly specified in the terms of reference. The CONTAM Panel assessed the occurrence data that were collected by EFSA, and evaluated whether the JECFA PTWI for inorganic arsenic of 15 µg/kg body weight is still appropriate. In its assessment the CONTAM

Arsenic in food
143 EFSA Journal 2009; 7(10):1351
Panel used the MOE approach as adopted by the EFSA Scientific Committee in the Opinion related to substances which are both genotoxic and carcinogenic (EFSA, 2005a) rather than the derivation of a health based guidance value. This was because although arsenic is not directly DNA-reactive the uncertainty with respect to the shapes of the dose-response relationships meant it was not considered appropriate to identify from the human data a dose of inorganic arsenic with no appreciable health risk, i.e. a tolerable daily or weekly intake. Because almost no occurrence and toxicological data were available for specific arsenic species, such as arsenobetaine, arsenosugars, arsenolipids, arsenocholine, methylarsonate and dimethylarsinate, these substances could not be considered in the risk characterisation. This may add to the overall uncertainty.
10.2. Exposure scenario
In response to the DATEX-2008-0012 call for data on arsenic, 15 countries submitted analytical results covering testing of a variety of different food products mainly in 2003-2008. Overall, more than 100,000 results were included in the analysis. There is uncertainty in possible regional differences in arsenic contamination of food commodities, and the CONTAM Panel recognised that the data set is not fully representative of food on the EU market. However, considering that the data set includes a large number of analytical data from a wide range of European countries and for a number of food categories, the uneven distribution of occurrence data over the countries will not add significantly to the overall uncertainty. The products for which data were provided varied considerably between submissions from the different countries, with most samples belonging to the tap water category, followed by meat and meat products, edible offal and offal products, and vegetables, nuts and pulses. As most of the samples were collected within the frame of official food control, they originated from both targeted and random sampling.
Because most of the occurrence data were reported as total arsenic and only a limited number of results were available for inorganic arsenic as well as for arsenic species, assumptions had to be made especially for the contribution of inorganic arsenic to total arsenic in the exposure assessment. The conservative approach chosen by the CONTAM Panel could have resulted in an overestimation of exposure to inorganic arsenic.
The type of food processing may have a significant influence, due to the arsenic concentration in the cooking medium, especially products that absorb water during cooking, or alternatively if arsenic transfers from food to cooking water that is subsequently discarded. As the food processing was not considered due to the lack of data, this may add to the overall uncertainty.
10.3. Exposure model
Two thirds of the samples had total arsenic levels below the LOD, which may have introduced uncertainties to the overall estimate. However, calculations made for this opinion show only a limited effect of using the upper or lower bound. The use of the upper bound in this opinion tends to slightly overestimate the dietary exposure. Because of the high proportion of samples below the LOD, all the exposure calculations were based on the mean concentrations. It is generally accepted that the use of the mean contamination to represent the long term dietary exposure is expected to be an overestimation compared with the use of the median. Taken together, the uncertainties regarding the exposure estimates are considered to be small, and tend to overestimate the exposure.
10.4. Model input (parameters)
There are no prescribed fixed official methods for the analysis of arsenic and laboratories can use any method of analysis, provided they fulfil the requirements stipulated by the respective accreditation bodies. Whilst a harmonised regulatory limit value exists for arsenic in drinking water, so far there are no regulatory limits for total arsenic for food except for mineral water, and no limit values at all for

Arsenic in food
144 EFSA Journal 2009; 7(10):1351
arsenic species. Consequently, there are no performance requirements for the laboratories. This may have added to the uncertainty in the analytical results.
The data from experimental animals could not provide a suitable basis for the risk characterisation because of important species differences. Human data from epidemiological prospective cohort studies as well as epidemiological case-control studies were available and identified for risk characterisation. Differences in the strength of the design (e.g. lower evidence level of case control studies with retrospective data collection compared to prospective cohort studies) and in detail of reporting (e.g. of the sampling of individuals or households and the ascertainment of the health effect endpoints) contribute to the uncertainty of the estimated dose-responses. There were limitations in the assessment of epidemiological studies due to the absence of information on levels of individual exposure and the need to use for the dose-response analysis aggregate dose information, e.g. mid-points of dose quintiles or the dose categories which had been prespecifed by the investigators by design or by convenience of data analysis. Note that midpoints, medians and doses for the highest dose interval had to be set without knowledge of the individual exposure data. Furthermore, the analysis was conducted without adjustment for potential confounders because the individual incidence and exposure data were not available to the CONTAM Panel. Finally, since the exposure data were mainly expressed as concentration of arsenic in drinking water, it was necessary to make assumptions about total dietary exposure. These limitations, may result in either over- or underestimation of the risk. The largest studies have been conducted in rural Asian populations which differ from EU populations with respect to genetic and lifestyle factors. The studies conducted in western populations are smaller with less power. For all of the studies it was necessary to make assumptions in order to estimate total dietary exposure to inorganic arsenic. In view of these uncertainties, the CONTAM Panel identified a range of BMDL01 values to be used instead of a single reference point in the assessment of the MOEs for inorganic arsenic. Modeling uncertainty due to the selection of dose-response models for the BMD analysis can not be excluded but may be a minor source of uncertainty since the best fitting model has always been used when applying the US EPA Software BMDS version 2.0. Limited choices of modeling due to missing individual data and limitations of the software (e.g constraints on the model parameters) may have added modeling uncertainty.
10.5. Summary of uncertainties
In Table 44, a summary of the uncertainty evaluation is presented, highlighting the main sources of uncertainty and indicating an estimate of whether the respective source of uncertainty might have led to an over- or underestimation of the exposure or the resulting risk.

Arsenic in food
145 EFSA Journal 2009; 7(10):1351
Table 44: Summary of qualitative evaluation of the impact of uncertainties on the risk assessment of the dietary exposure of arsenic
Sources of uncertainty Direction Measurement uncertainty of analytical results +/-(a) Extrapolation of occurrence data from a number of Member States to wholeEurope
+/-
Use of analytical data from both targeted and random sampling + Influence of upper bound for non-detects on exposure estimate + Use of adjustment factors for several broad food categories +/- Assumptions for contribution of inorganic to total arsenic in scenario 5 + Non consideration of food processing +/- Limitations in data for characterisation of possible health effects of total dietary exposure to inorganic arsenic
+/-
Use of arsenic as single cause of multi-factorial endpoints (lack of control for known risk factors)
+
Lack of suitable animal models +/- (a): + = uncertainty with potential to cause over-estimation of exposure/risk; - = uncertainty with potential to cause under-
estimation of exposure/risk
The CONTAM Panel considered that the impact of the uncertainties on the risk assessment of exposure to inorganic arsenic is considerable. By using the upper end of the high exposure estimate and the lower end of the BMDL01 estimates, the assessment of the risk is likely to be conservative.
CONCLUSIONS AND RECOMMENDATIONS
CONCLUSIONS
General
• Arsenic is a metalloid that occurs in different organic and inorganic forms. It is widely present as an environmental contaminant both from natural occurrence and anthropogenic activity.
• Certain terrestrial plants may accumulate arsenic by root uptake from the soil and by absorption of deposited arsenic, and certain species, such as rice and some ferns, may accumulate substantial levels.
• Marine algae can effectively take up arsenate. This process represents the most significant bioaccumulation step for arsenic in the environment.
• Arsenic and arsenic-containing compounds have been (and in several non-European Union (EU) countries still are) used as wood preservatives, pesticides and feed additives.
• Arsenic and arsenic-containing compounds have some industrial and medicinal uses.
Methods of analysis
• Several suitable methods are available for the measurement of total arsenic and arsenic species in food and biological samples. Following mineralisation, hydride generation atomic absorption spectrometry and inductively coupled mass spectrometry (ICPMS) are sensitive, reliable and commonly used methods for the determination of total arsenic.

Arsenic in food
146 EFSA Journal 2009; 7(10):1351
• High performance liquid chromatography (HPLC)/ICPMS has become the method of choice for arsenic speciation analysis.
Occurrence/Exposure
• Following a call for data, 15 European countries submitted more than 100,000 results of arsenic concentrations in various food commodities. Two thirds of the samples were below limit of detection. While approximately 98 % of the results were reported as total arsenic, only a few investigations differentiated between arsenic species.
• The highest total arsenic levels have been measured in the following food commodities: fish and seafood, products or supplements based on algae, especially hijiki, and cereal and cereal products, with particularly high concentrations in rice grains and rice-based products and bran and germ.
• Depending on the type of food processing, temperature and time, changes to total arsenic concentration and arsenic species may occur. The arsenic content in cooking water seems to be of special importance because it determines whether the arsenic concentrations in the prepared food may be higher or lower compared to the raw product.
• The relative proportion of inorganic arsenic in fish and seafood is small and tends to decrease as the total arsenic content increases. Fixed values for inorganic arsenic content of 0.03 mg/kg in fish and 0.1 mg/kg in seafood were considered realistic for calculating the dietary exposure.
• The proportion of inorganic arsenic in food commodities other than fish and seafood was assumed to vary from 50 to 100 % of total arsenic reported, with 70 % considered as best reflecting an overall average.
• Given the above assumptions, the national inorganic arsenic exposures from food and water across 19 European countries, using lower bound and upper bound concentrations, have been estimated to range from 0.13 to 0.56 µg/kg body weight (b.w.) per day for average consumers, and 0.37 to 1.22 µg/kg b.w for 95th percentile consumers.
• Extrapolating from the main food categories of the European Food Safety Authority (EFSA) Concise Food Consumption Database, the following food subclasses were identified as largely contributing to the inorganic arsenic daily exposure in the general European population: cereal grains and cereal based products, followed by food for special dietary uses, bottled water, coffee and beer, rice grains and rice based products, fish and vegetables.
• The limited available evidence does not indicate a different dietary exposure for vegetarians from that of general population unless they consume a large amount of algae-based products.
• High consumers of rice such as certain ethnic groups in Europe are estimated to have a daily dietary exposure of inorganic arsenic of about 1 µg/kg b.w. and high consumers of algae-based products can have dietary exposure of about 4 µg/kg b.w. per day of inorganic arsenic.
• Children under three years of age are the most exposed to inorganic arsenic. Exposure estimates reported in two different studies show an inorganic arsenic intake ranging from 0.50 to 2.66 µg/kg b.w. per day. Dietary exposure to inorganic arsenic for children, including from rice-based foods, under three years old is in general estimated to be about 2 to 3-fold that of adults. These estimates do not include milk intolerant children substituting rice-drinks for formula or cows’ milk.
• Compared to dietary exposure, non-dietary exposure to arsenic is likely to be of minor importance for the general population in the EU.

Arsenic in food
147 EFSA Journal 2009; 7(10):1351
Hazard identification and characterisation
• In humans, soluble inorganic arsenic is rapidly and nearly completely absorbed after ingestion. Absorption of different organic arsenic compounds is generally greater than 70 %.
• After being absorbed, arsenic is widely distributed to almost all organs and readily crosses the placental barrier.
• Biotransformation of inorganic arsenic in mammals includes reduction of pentavalent arsenic to trivalent arsenic and methylation of trivalent arsenic.
• High inter-species, inter-population and inter-individual variability have been reported for arsenic metabolism and other aspects of toxicokinetics. Methylation capacity is suggested to be highly involved in arsenic toxicity. Susceptibility factors include life stage, sex, nutritional status and genetic polymorphisms.
• Long term ingestion of inorganic arsenic in humans has been associated with skin lesions, cancer, neurotoxicity, cardiovascular diseases, abnormal glucose metabolism and diabetes. There is emerging evidence of negative impacts on foetal and infant development, particularly reduced birth weight, and there is a need for further evidence regarding the dose-response relationships and critical exposure times for these outcomes.
• The evidence is sufficient to assume causality for skin lesions and for cancers of the urinary bladder, lung and skin.
• From the evidence of adverse effects of inorganic arsenic at concentrations in drinking water below those considered by the Joint FAO/WHO Expert Committee on Food Additives (JECFA) in establishing the provisional tolerable weekly intake (PTWI) of 15 µg/kg b.w., the Panel on Contaminants in the Food Chain (CONTAM Panel) concluded that the PTWI is no longer appropriate.
• The data from experimental animals do not provide a suitable basis for risk characterisation because of important species differences.
• The available epidemiological studies relate to arsenic in drinking water, or in some instances biomarkers of exposure, and total dietary exposure to inorganic arsenic was not specifically measured.
• In order to provide an opinion on the risks to health related to the presence of inorganic arsenic in foodstuffs, it is necessary to make assumptions about the total dietary exposure of the populations in which the respective health endpoints were studied. Because such assumptions can have a major influence on the risk characterisation, the CONTAM Panel identified a range of values for water consumption and inorganic arsenic exposure from food to be used in extrapolating from arsenic concentration in drinking water to total dietary exposure.
• The CONTAM Panel concluded that the epidemiological data provided a basis for dose response modelling. A benchmark response of 1 % extra risk was selected which could be within the range of the observed data.
• Because of the uncertainties in the exposure in the key epidemiological studies, the CONTAM Panel identified a range of values for the 95 % lower confidence limit of the benchmark dose of 1 % extra risk (BMDL01) instead of a single reference point, for use in the risk characterisation for inorganic arsenic. The BMDL01 values for the relevant health endpoints, i.e. skin lesions, cancers of the skin, urinary bladder and lung, ranged from 0.3 to 8 μg/kg b.w. per day.

Arsenic in food
148 EFSA Journal 2009; 7(10):1351
• Inorganic arsenic is not directly DNA-reactive and there are a number of proposed mechanisms of carcinogenicity such as oxidative damage, epigenetic effects and interference with DNA damage repair, for each of which a threshold mechanism could be postulated.
• Taking into account the uncertainty with respect to possible dose-response relationships, the CONTAM Panel considered it not appropriate to establish a tolerable daily or weekly intake.
• Arsenobetaine, the major form of arsenic in fish and most seafood, is not metabolised in humans, is excreted unchanged and is widely assumed to be of no toxicological concern.
• In humans arsenosugars and arsenolipids are mainly metabolised to dimethylarsinate, but no specific information is available regarding their toxicity.
• For other organoarsenic compounds no human toxicity data are available.
• The gastrointestinal tract appears to be the most sensitive target of toxicity for methylarsonate in experimental animals. For dimethylarsinate, the critical effect is carcinogenicity in the urinary bladder, observed in rats. The mode of action involves cytotoxicity and sustained increased cell proliferation rather than direct DNA damage.
Risk characterisation
• The estimated dietary exposures to inorganic arsenic for average and high level consumers in Europe are within the range of the BMDL01 values identified by the CONTAM Panel, and therefore there is little or no margin of exposure (MOE), and the possibility of a risk to some consumers cannot be excluded.
• Consumer groups with higher exposure levels include high consumers of rice, such as certain ethnic groups, and high consumers of algae-based products. The estimated dietary exposures of these groups are also within the range of the BMDL01 values.
• Infants below 6 months of age fed on only breast-milk or on cows’ milk formula reconstituted with water containing arsenic at the average European concentration have intakes of inorganic arsenic that are below the range of BMDL01 values
• The estimated dietary exposures of children are higher than those of adults, due to the greater food consumption relative to their body weight. This does not necessarily indicate that children are at greater risk because the effects are due to long term exposure, and the exposure estimates are also within the range of BMDL01 values.
• The available data on mean and median urinary arsenic in European populations without specific high level exposure are in the region of 5 to 6 μg/L, which is close to, or below, the concentrations in the reference populations in the epidemiological studies providing the basis for the BMDL01 values. However, data on European sub-groups with high dietary inorganic arsenic exposure were not available.
• Because of the lack of data, arsenosugars, arsenolipids, methylarsonate and dimethylarsinate could not be considered in the risk characterisation.
RECOMMENDATIONS (INCL. KNOWLEDGE/ DATA GAPS)
• Dietary exposure to inorganic arsenic should be reduced.

Arsenic in food
149 EFSA Journal 2009; 7(10):1351
• In order to refine risk assessment of inorganic arsenic, there is a need to produce speciation data for different food commodities to support dietary exposure assessment and dose-response data for the possible health effects.
• Although several arsenic speciation methods have been reported, their suitability for a range of food samples and/or arsenic species needs to be established.
• There is a need for robust validated analytical methods for determining inorganic arsenic in a range of food items.
• Certified reference materials especially for inorganic arsenic in products such as water, rice and seafood are required. The production of such a material should be a priority to facilitate future surveys of the inorganic arsenic content of foods.
• Future epidemiological studies should incorporate better characterisation of exposure to inorganic arsenic including food sources.
• There is a need for more information on critical age periods of arsenic exposure, in particular in early life. Studies should include effects later in life of early life arsenic exposure.
• There is a need for improved understanding of the human metabolism of organoarsenicals in foods (arsenosugars, arsenolipids etc.) and the human health implications.
REFERENCES Abdelghani AA, Reimers RS, Anderson AC, Englande AJ, Lo CP, Shariatpanahi M, 1981. Transport
and distribution of arsenic in sediments. Heavy metals in the environment. Proceedings of the 3rd International Conference, Amsterdam, September 1981, Geneva, WHO, pp. 665-668.
Abedin MJ, Feldmann J, Meharg A, 2002. Uptake kinetics of arsenic species in rice plants. Plant Physiology 128, 1120-1128.
Ackerman AH, Creed PA, Parks AN, Fricke MW, Schwegel CA, Creed JT, Heitkemper DT, Velal NP, 2005. Comparison of a chemical and enzymatic extraction of arsenic from rice and an assessment of the arsenic absorption from contaminated water by cooked rice. Environmental Science & Technology 39 (14), 5241-5246.
Adair BM, Moore T, Conklin SD, Creed JT, Wolf DC, Thomas DJ, 2007. Tissue distribution and urinary excretion of dimethylated arsenic and its metabolites in dimethylarsinic acid- or arsenate-treated rats. Toxicology and Applied Pharmacology 222 (2), 235-242.
Adams JH, Haller L, Boa FY, Doua F, Dago A, Konian K, 1986. Human African trypanosomiasis (Tb gambiense) - a study of 16 fatal cases of sleeping sickness with some observations on acute reactive arsenical encephalopathy. Neuropathology and Applied Neurobiology 12 (1), 81-94.
Aggarwal M, Naraharisetti SB, Dandapat S, Degen GH, Malik JK, 2008. Perturbations in immune responses induced by concurrent subchronic exposure to arsenic and endosulfan. Toxicology 251 (1-3), 51-60.
Aguilar MV, Martinez-Para MC, Gonzalez MJ, 1997. Effects of arsenic(V) chromium(III) interaction on plasma glucose and cholesterol levels in growing rats. Annals of Nutrition and Metabolism 41 (3), 189-195.
Ahmad S, Kitchin KT, Cullen WR, 2000. Arsenic species that cause release of iron from ferritin and generation of activated oxygen. Archives of Biochemistry and Biophysics 382 (2), 195-202.
Ahmad SA, Sayed SU, Barua S, Khan MH, Jalil A, Hadi SA, Talukder HK, 2001. Arsenic in drinking water and pregnancy outcomes. Environmental Health Perspectives 109 (6), 629-631.

Arsenic in food
150 EFSA Journal 2009; 7(10):1351
Ahmad S, Kitchin KT, Cullen WR, 2002. Plasmid DNA damage caused by methylated arsenicals, ascorbic acid and human liver ferritin. Toxicology Letters 133 (1), 47-57.
Ahsan H, Perrin M, Rahman A, Parvez F, Stute M, Zheng Y, Milton AH, Brandt-Rauf P, van Geen A, Graziano J, 2000. Associations between drinking water and urinary arsenic levels and skin lesions in Bangladesh. Journal of Occupational and Environmental Medicine 42 (12), 1195-1201.
Ahsan H, Chen Y, Parvez F, Zablotska L, Argos M, Hussain I, Momotaj H, Levy D, Cheng ZQ, Slavkovich V, van Geen A, Howe GR, Graziano JH, 2006. Arsenic exposure from drinking water and risk of premalignant skin lesions in Bangladesh: baseline results from the health effects of arsenic longitudinal study. American Journal of Epidemiology 163 (12), 1138-1148.
Ahsan H, Chen Y, Kibriya MG, Slavkovich V, Parvez F, Jasmine F, Gamble MV, Graziano JH, 2007. Arsenic metabolism, genetic susceptibility, and risk of premalignant skin lesions in Bangladesh. Cancer Epidemiology Biomarkers & Prevention 16 (6), 1270-1278.
Albertini RJ, Anderson D, Douglas GR, Hagmar L, Hemminki K, Merlo F, Natarajan AT, Norppa H, Shuker DEG, Tice R, Waters MD, Aitio A, 2000. IPCS guidelines for the monitoring of genotoxic effects of carcinogens in humans. Mutation Research-Reviews in Mutation Research 463 (2), 111-172.
Almela C, Algora S, Benito V, Clemente MJ, Devesa V, Suner MA, Velez D, Montoro R, 2002. Heavy metal, total arsenic, and inorganic arsenic contents of algae food products. Journal of Agricultural and Food Chemistry 50 (4), 918-923.
Almela C, Clemente MJ, Velez D, Montoro R, 2006. Total arsenic, inorganic arsenic, lead and cadmium contents in edible seaweed sold in Spain. Food and Chemical Toxicology 44 (11), 1901-1908.
An Y, Gao ZL, Wang ZW, Yang SH, Liang JF, Feng Y, Kato K, Nakano M, Okada S, Yamanaka K, 2004. Immunohistochemical analysis of oxidative DNA damage in arsenic-related human skin samples from arsenic-contaminated area of China. Cancer Letters 214 (1), 11-18.
Andreae MO, 1980. Arsenic in rain and the atmospheric mass balance of arsenic. Journal of Geophysical Research 85, 4512-4518.
Andrew AS, Karagas MR, Hamilton JW, 2003. Decreased DNA repair gene expression among individuals exposed to arsenic in United States drinking water. International Journal of Cancer 104 (3), 263-268.
Andrew AS, Burgess JL, Meza MM, Demidenko E, Waugh MG, Hamilton JW, Karagas MR, 2006. Arsenic exposure is associated with decreased DNA repair in vitro and in individuals exposed to drinking water arsenic. Environmental Health Perspectives 114 (8), 1193-1198.
Andrew AS, Bernardo V, Warnke LA, Davey JC, Hampton T, Mason RA, Thorpe JE, Ihnat MA, Hamilton JW, 2007. Exposure to arsenic at levels found in US drinking water modifies expression in the mouse lung. Toxicological Sciences 100, 75-87.
Andrew AS, Jewe DA, Mason RA, Whitfleld ML, Moore JH, Karagas MR, 2008. Drinking-water arsenic exposure modulates gene expression in human lymphocytes from a US population. Environmental Health Perspectives 116 (4), 524-531.
Andrew AS, Mason RA, Kelsey KT, Schned AR, Marsit CJ, Nelson HH, Karagas MR, 2009. DNA repair genotype interacts with arsenic exposure to increase bladder cancer risk. Toxicology Letters 187 (1), 10-14.
Andrewes P, Demarini DM, Funasaka K, Wallace K, Lai VWM, Sun HS, Cullen WR, Kitchin KT, 2004. Do arsenosugars pose a risk to human health? The comparative toxicities of a trivalent and pentavalent arsenosugar. Environmental Science & Technology 38 (15), 4140-4148.
Aposhian VH, Zakharyan RA, Avram MD, Sampayo-Reyes A, Wollenberg ML, 2004. A review of the enzymology of arsenic metabolism and a new potential role of hydrogen peroxide in the

Arsenic in food
151 EFSA Journal 2009; 7(10):1351
detoxication of the trivalent arsenic species. Toxicology and Applied Pharmacology 198 (3), 327-335.
Aposhian HV, Aposhian MM, 2006. Arsenic toxicology: Five questions. Chemical Research in Toxicology 19 (1), 1-15.
Applebaum KM, Karagas MR, Hunter DJ, Catalano PJ, Byler SH, Morris S, Nelson HH, 2007. Polymorphisms in nucleotide excision repair genes, arsenic exposure, and non-melanoma skin cancer in New Hampshire. Environmental Health Perspectives 115 (8), 1231-1236.
Argos M, Kibriya MG, Parvez F, Jasmine F, Rakibuz-Zaman M, Ahsan H, 2006. Gene expression profiles in peripheral lymphocytes by arsenic exposure and skin lesion status in a Bangladeshi population. Cancer Epidemiology Biomarkers & Prevention 15 (7), 1367-1375.
Arguello RA, Cenget DD, Tello EE, 1938. Cancer y arsenicismo regional endemico en Cordoba. Revista argentina de dermatosifilología 22 (4), 461-487.
Arkusz J, Stanczyk M, Lewinska D, Stepnik M, 2005. Modulation of murine peritoneal macrophage function by chronic exposure to arsenate in drinking water. Immunopharmacology and Immunotoxicology 27 (2), 315-330.
Arnold LL, Eldan M, van Gemert M, Capen CC, Cohen SM, 2003. Chronic studies evaluating the carcinogenicity of monomethylarsonic acid in rats and mice. Toxicology 190 (3), 197-219.
Arnold LL, Eldan M, Nyska A, van Gemert M, Cohen SM, 2006. Dimethylarsinic acid: results of chronic toxicity/oncogenicity studies in F344 rats and in B6C3F1 mice. Toxicology 223 (1-2), 82-100.
ATSDR (Agency for Toxic Substances and Disease Registry), 2007. Toxicological profile for arsenic. U. S. Department of Health and Human Services, Public Health Service. Atlanta, GA.
Baars AJ, Theelen RMC, Janssen PJCM, Hesse JM, van Apeldoorn ME van, Meijerink MCM, Verdam L, Zeilmaker MJ, 2001. Re-evaluation of human-toxicological maximum permissible risk levels, RIVM-report no. 711701025, March 2001; Bilthoven, The Netherlands.
Baastrup R, Sorensen M, Balstrom T, Frederiksen K, Larsen CL, Tjonneland A, Overvad K, Raaschou-Nielsen O, 2008. Arsenic in drinking-water and risk for cancer in Denmark. Environmental Health Perspectives 116 (2), 231-237.
Bae M, Watanabe C, Inaoka T, Sekiyama M, Sudo N, Bokul MH, Ohtsuka R, 2002. Arsenic in cooked rice in Bangladesh. Lancet 360 (9348), 1839-1840.
Banerjee M, Sarma N, Biswas R, Roy J, Mukherjee A, Giri AK, 2008b. DNA repair deficiency leads to susceptibility to develop arsenic-induced premalignant skin lesions. International Journal of Cancer 123, 283-287.
Banerjee N, Banerjee M, Ganguly S, Bandyopadhyay S, Bandyopadhay A, Chatterjee M, Giri AK, 2008a. Arsenic-induced mitochondrial instability leading to programmed cell death in the exposed individuals. Toxicology 246, 101-111.
Bardullas U, Limon-Pacheco JH, Giordano M, Carrizales L, Mendoza-Trejo MS, Rodriguez VM, 2009. Chronic low-level arsenic exposure causes gender-specific alterations in locomotor activity, dopaminergic systems, and thioredoxin expression in mice. Toxicology and Applied Pharmacology 239 (2), 169-177.
Bates MN, Smith AH, Cantor KP, 1995. Case-control study of bladder-cancer and arsenic in drinking water. American Journal of Epidemiology 141 (6), 523-530.
Bates MN, Rey OA, Biggs ML, Hopenhayn C, Moore LE, Kalman D, Steinmaus C, Smith AH, 2004. Case-control study of bladder cancer and exposure to arsenic in Argentina. American Journal of Epidemiology 159 (4), 381-389.
Bau DT, Gurr JR, Jan KY, 2001. Nitric oxide is involved in arsenite inhibition of pyrimidine dimer excision. Carcinogenesis 22 (5), 709-716.

Arsenic in food
152 EFSA Journal 2009; 7(10):1351
Beane Freeman LE, Dennis LK, Lynch CF, Thorne PS, Just CL, 2004. Toenail arsenic content and cutaneous melanoma in Iowa. American Journal of Epidemiology 160 (7), 679-687.
Bergoglio RM, 1964. Mortalidad por cancer on zonas de aguas arsenicales de la provincia de Cordoba, Republica Argentina. Prensa Médica Argentina 51(IT), 994-998.
Biswas R, Ghosh P, Banerjee N, Das JK, Sau T, Banerjee A, Roy S, Ganguly S, Chatterjee M, Mukherjee A, Giri AK, 2008. Analysis of T-cell proliferation and cytokine secretion in the individuals exposed to arsenic. Human & Experimental Toxicology 27 (5), 381-386.
Blakley BR, Sisodia CS, Mukkur TK, 1980. Effect of methylmercury, tetraethyl lead, and sodium arsenite on the humoral immune-response in mice. Toxicology and Applied Pharmacology 52 (2), 245-254.
Borgoño JM, Vicent P, Venturino H, Infante A, 1977. Arsenic in the drinking water of the city of Antofagasta: epidemiological and clinical study before and after the installation of treatment plant. Environmental Health Perspectives 19, 103-105.
Boutakhrit K, Claus R, Bolle F, Degroodt JM, Goeyens L, 2005. Open digestion under reflux for the determination of total arsenic in seafood by inductively coupled plasma atomic emission spectrometry with hydride generation. Talanta 66, 1042-1047.
Boyle RW, Jonasson IR, 1973. The geochemistry of arsenic and its use as an indicator element in geochemical prospecting. Journal of Geochemical Exploration 2 (3), 251-296.
Braman RS, Foreback CC, 1973. Methylated forms of arsenic in the environment. Science 182 (118), 1247-1249.
Brender JD, Suarez L, Felkner M, Gilani Z, Stinchcomb D, Moody K, Henry J, Hendricks K, 2006. Maternal exposure to arsenic, cadmium, lead, and mercury and neural tube defects in offspring. Environmental Research 101 (1), 132-139.
Brown RM, Newton D, Pickford CJ, Sherlock JC, 1990. Human Metabolism of arsenobetaine ingested with fish. Human & Experimental Toxicology 9 (1), 41-46.
Brügmann L, Matschullat J, 1997. Zur Biogeochemie und Bilanzierung von Schwermetallen in der Ostsee. In: Geochemie und Umwelt. Relevante Prozesse in Atmo-, Pedo- und Hydrosphäre. Matschullat J, Tobschall HJ, Voigt HJ (Eds), Springer, Berlin, Germany, 267-290.
Buchet JP, Lauwerys R, Roles H, 1981. Comparison of the urinary-excretion of arsenic metabolites after a single oral dose of sodium arsenite, monomethylarsonate, or dimethylarsinate in man. International Archives of Occupational and Environmental Health. 48 (1), 71-79.
Buchet JP, Pauwels J, Lauwerys R, 1994. Assessment of exposure to inorganic arsenic following ingestion of marine organisms by volunteers. Environmental Research 66, 44-51.
Burgess JL, Meza MM, Josyula AB, Poplin GS, Kopplin MJ, McClellen HE, Sturup S, Lantz RC, 2007. Environmental arsenic exposure and urinary 8-OHdG in Arizona and Sonora. Clinical Toxicology 45 (5), 490-498.
Burlo F, Guijarro I, Carbonell-Barrachina AA, Valero D, Martinez-Sanchez F, 1999. Arsenic species: Effects on and accumulation by tomato plants. Journal of Agricultural and Food Chemistry 47 (3), 1247-1253.
Burns FJ, Uddin AN, Wu F, Nadas A, Rossman TG, 2004. Arsenic-induced enhancement of ultraviolet radiation carcinogenesis in mouse skin: A dose-response study. Environmental Health Perspectives 112 (5), 599-603.
Button M, Jenkin GR, Harrington CF, Watts MJ, 2009. Human toenails as a biomarker of exposure to elevated environmental arsenic. Journal of Environmental Monitoring 11 (3), 610-617.

Arsenic in food
153 EFSA Journal 2009; 7(10):1351
Calderon RL, Hudgens E, Le XC, Schreinemachers D, Thomas DJ, 1999. Excretion of arsenic in urine as a function of exposure to arsenic in drinking water. Environmental Health Perspectives, 107, 663-667.
Calderon J, Navarro ME, Jimenez-Capdeville ME, Santos-Diaz MA, Golden A, Rodriguez-Levya I, Borja-Aburto V, Diaz-Barriga F, 2001. Exposure to arsenic and lead and neuropsychological development in Mexican children. Environmental Research 85 (2), 69-76.
Caldwell KL, Jones RL, Verdon CP, Jarrett JM, Caudill SP, Osterloh JD, 2009. Levels of urinary total and speciated arsenic in the US population: National Health and Nutrition Examination Survey 2003-2004. Journal of Exposure Science & Environmental Epidemiology 19 (1), 59-68.
Callahan MA, Slimak MW, Gabel NW, May IP, Fowler CF, Freed JR, Jennings P, Durfee RL, Whitmore FC, Maestri B, Mabey WR, Holt BR, Gould C, 1979. Water-related environmental fate of 129 priority pollutants. Vol I. Introduction and technical background, metals and inorganics, pesticides and PCBs. EPA-440/4-79-029a. Washington, DC, U.S. Environmental Protection Agency, Office of Water Planning and Standards.
Cantor KP, Lubin JH, 2007. Arsenic, internal cancers, and issues in inference from studies of low-level exposures in human populations. Toxicology and Applied Pharmacology 222 (3), 252-257.
Carbonell-Barrachina AA, Burló F, Valero D, López E, Martínez-Romero D, Martínez-Sánchez F, 1999. Arsenic toxicity and accumulation in turnip as affected by arsenic chemical speciation. Journal of Agricultural and Food Chemistry 47, 2288-2294.
CEN (European Committee for Standardization), 2002. EN 13804:2002. Foodstuffs-Determination of trace elements-Performance criteria, general conciderations and sample preparation.
CEN (European Committee for Standardization), 2004. EN 14332:2004. Foodstuffs-Determination of trace elements-Determination of total arsenic in seafood by ETAAS after microwave digestion.
CEN (European Committee for Standardization), 2005. EN 14546:2005. Foodstuffs-Determination of trace elements-Determination of total arsenic by hydride generation atomic absorption spectrometry (HG-AAS) after dry ashing.
CEN (European Committee for Standardization), 2006. EN 14627:2006. Foodstuffs-Determination of trace elements-Determination of total arsenic and selenium by atomic absorption spectrometry (AAS) hydride technique after pressure digestion.
Chanda S, Dasgupta UB, GuhaMazumder D, Gupta M, Chaudhuri U, Lahiri S, Das S, Ghosh N, Chatterjee D, 2006. DNA hypermethylation of promoter of gene p53 and p16 in arsenic-exposed people with and without malignancy. Toxicological Sciences 89 (2), 431-437.
Chapman AC, 1926. On the presence of compounds of arsenic in marine crustaceans and shellfish. Analyst 51, 548-563.
Chatterjee A, Das D, Mandal BK, Chowdhury TR, Samanta G, Chakraborti D, 1995. Arsenic in ground-water in 6 districts of West-Bengal, Ind–a - the biggest arsenic calamity in the world. 1. Arsenic species in drinking-water and urine of the affected people. Analyst 120 (3), 643-650.
Chen CJ, Chuang YC, Lin TM, Wu HY, 1985. Malignant neoplasms among residents of a blackfoot disease-endemic area in Taiwan: high-arsenic artesian well water and cancers. Cancer Research, 45 (11 Pt 2), 5895-5899.
Chen CJ, Chen CW, Wu MM, Kuo TL, 1992. Cancer potential in liver, lung, bladder and kidney due to ingested inorganic arsenic in drinking water. British Journal of Cancer, 66 (5), 888-892.
Chen CJ, Hsu LI, Wang CH, Shih WL, Hsu YH, Tseng MP, Lin YC, Chou WL, Chen CY, Lee CY, Wang LH, Cheng YC, Chen CL, Chen SY, Wang YH, Hsueh YM, Chiou HY, Wu MM, 2005. Biomarkers of exposure, effect, and susceptibility of arsenic-induced health hazards in Taiwan. Toxicology and Applied Pharmacology 206 (2), 198-206.

Arsenic in food
154 EFSA Journal 2009; 7(10):1351
Chen C-L, Hsu L-I, Chiou H-Y, Hsueh Y-M, Chen S-Y, Wu M-M, Chen C-J, 2004b. Ingested arsenic, cigarette smoking, and lung cancer risk: A follow-up study in arseniasis-endemic areas in Taiwan. Journal of the American Medical Association 292 (24), 2984-2990.
Chen F, Zhang Z, Bower J, Lu Y, Leonard SS, Ding M, Castranova V, Piwnica-Worms H, Shi X, 2002. Arsenite-induced Cdc25C degradation is through the KEN-box and ubiquitin-proteasome pathway. Proceedings of the National Academy of Sciences of the United States of America 99 (4), 1990-1995.
Chen H, Li SF, Liu J, Diwan BA, Barrett JC, Waalkes MP, 2004a. Chronic inorganic arsenic exposure induces hepatic global and individual gene hypomethylation: implications for arsenic hepatocarcinogenesis. Carcinogenesis 25 (9), 1779-1786.
Chen Y, Graziano JH, Parvez F, Hussain I, Momotaj H, van Geen A, Howe GR, Ahsan H, 2006. Modification of risk of arsenic-induced skin lesions by sunlight exposure, smoking, and occupational exposures in Bangladesh. Epidemiology 17(4), 459-467.
Cheng CN, Focht DD, 1979. Production of arsine and methylarsines in soil and in culture. Applied and Enviromental Microbiology 38 (3), 494-498.
Cherry N, Shaikh K, McDonald C, Chowdhury Z, 2008. Stillbirth in rural Bangladesh: arsenic exposure and other etiological factors: a report from Gonoshasthaya Kendra. Bulletin of the World Health Organization 86, 172-177.
Chester R, 1993. Marine geochemistry. Chapman & Hall, London, UK, pp. 698.
Chiou HY, Hsueh YM, Liaw KF, Horng SF, Chiang MH, Pu YS, Lin JS, Huang CH, Chen CJ, 1995. Incidence of internal cancers and ingested inorganic arsenic: a seven-year follow-up study in Taiwan. Cancer Research 55 (6), 1296-1300.
Chiou HY, Chiou ST, Hsu YH, Chou YL, Tseng CH, Wei ML, Chen CJ, 2001. Incidence of transitional cell carcinoma and arsenic in drinking water: A follow-up study of 8,102 residents in an arseniasis-endemic area in northeastern Taiwan. American Journal of Epidemiology 153 (5), 411-418.
Chouchane S, Snow ET, 2001. In vitro effect of arsenical compounds oil glutathione-related enzymes. Chemical Research in Toxicology 14 (5), 517-522.
Choudhury H, Mudipalli A, 2008. Potential considerations & concerns in the risk characterization for the interaction profiles of metals. Indian Journal of Medical Research 128 (4), 462-483.
Chowdhury UK, Biswas BK, Chowdhury TR, Samanta G, Mandal BK, Basu GC, Chanda CR, Lodh D, Saha KC, Mukherjee SK, Roy S, Kabir S, Quamruzzaman Q, Chakraborti D, 2000. Groundwater arsenic contamination in Bangladesh and West Bengal, India. Environmental Health Perspectives 108 (5), 393-397.
Chung CJ, Huang CJ, Pu YS, Su CT, Huang YK, Chen YT, Hsueh YM, 2008. Urinary 8-hydroxydeoxyguano sine and urothelial carcinoma risk in low arsenic exposure area. Toxicology and Applied Pharmacology 226 (1), 14-21.
Clowes LA, Francesconi KA, 2004. Uptake and elimination of arsenobetaine by the mussel Mytilus edulis is related to salinity. Comparative Biochemistry and Physiology C-Toxicology & Pharmacology 137 (1), 35-42.
Coates ME, Walker R, 1992. Interrelationships between the gastrointestinal microflora and non-nutrient components of the diet. Nutrition Research Reviews 5, 85-96.
Cohen SM, Arnold LL, Eldan M, Lewis AS, Beck BD, 2006. Methylated arsenicals: The implications of metabolism and carcinogenicity studies in rodents to human risk assessment. Critical Reviews in Toxicology 36 (2), 99-133.
Cohen SM, Ohnishi T, Arnold LL, Le XC, 2007. Arsenic-induced bladder cancer in an animal model. Toxicology and Applied Pharmacology 222 (3), 258-263.

Arsenic in food
155 EFSA Journal 2009; 7(10):1351
Coles DG, Ragaini RC, Ondov JM, Fisher GL, Silberman D, Prentice BA, 1979. Chemical studies of stack fly-ash from a coal-fired power-plant. Environmental Science & Technology 13 (4), 455-459.
Concha G, Vogler G, Lezcano D, Nermell B, Vahter M, 1998. Exposure to inorganic arsenic metabolites during early human development. Toxicological Sciences 44 (2), 185-190.
Concha G, Nermell B, Vahter M, 2006. Spatial and temporal variations in arsenic exposure via drinking-water in northern Argentina. Journal of Health, Population, and Nutrition, 24, 317-326.
Conklin SD, Ackerman AH, Fricke MW, Creed PA, Kohan MC, Herbin-Davis K, Thomas DJ, 2006. In vitro biotransformation of an arsenosugar by mouse anaerobic cecal microflora and cecal tissue a&s examined using IC-ICP-MS and LC-ESI-MS/MS. Analyst 131 (5) 648-655.
COT (Committee on Toxicity of Chemicals in Food, Consumer Products and the Environment), 2008. COT Statement on the 2006 UK Total Diet Study of Metals and Other Elements. December 2008. Available from: http://cot.food.gov.uk/pdfs/cotstatementtds200808.pdf, pp. 38.
Csanaky I, Nemeti B, Gregus Z, 2003. Dose-dependent biotransformation of arsenite in rats - not S-adenosylmethionine depletion impairs arsenic methylation at high dose. Toxicology 183 (1-3), 77-91.
Cubadda F, Raggi A, Zanasi F, Carcea M, 2003. From durum wheat to pasta: effect of technological processing on the levels of arsenic, cadmium, lead and nickel - a pilot study. Food Additives & Contaminants 20 (4), 353-360.
Cui X, Wakai T, Shirai Y, Hatakeyama K, Hirano S, 2006. Chronic oral exposure to inorganic arsenate interferes with methylation status of p16(INK4a) and RASSF1A and induces lung cancer in A/J mice. Toxicological Sciences 91 (2), 372-381.
Cui X, Kobayashi Y, Akashi M and Okayasu R, 2008. Metabolism and the paradoxical effects of arsenic: carcinogenesis and anticancer. Current Medicinal Chemistry 15 (22), 2293-2304.
Dahl L, Molin M, Amlund H, Meltzer HM, Julshamn K, Alexander J, Sloth JJ, 2009. Stability of arsenic compounds in seafood samples during processing and storage by freezing. Food and Chemical Toxicology, submitted.
Dakeishi M, Murata K, Grandjean P, 2006. Long-term consequences of arsenic poisoning during infancy due to contaminated milk powder. Environmental Health 5 (31).
Davidson CI, Goold WD, Mathison TP, Wiersma GB, Brown KW, Reilly MT, 1985. Airborne trace-elements in great Smoky mountains, Olympic, and Glacier national-parks. Environmental Science & Technology 19 (1), 27-35.
De Boer WJ, van der Voet H, 2007. MCRA, Release 6, a web-based program for Monte Carlo Risk Assessment. Report Juli 2007. Biometris, RIKILT and RIVM. Available from: http://mcra.rikilt.wur.nl.
De Chaudhuri S, Mahata J, Das JK, Mukherjee A, Ghosh P, Sau TJ, Mondal L, Basu S, Giri AK, Roychoudhury S, 2006. Association of specific p53 polymorphisms with keratosis in individuals exposed to arsenic through drinking water in West Bengal, India. Mutation Research-Fundamental and Molecular Mechanisms of Mutagenesis 601 (1-2), 102-112.
De Chaudhuri S, Manjari K, Mayukh B, Das JK, Papiya M, Santanu B, Susanta R, Singh KK, Giri AK, 2008. Arsenic-induced health effects and genetic damage in keratotic individuals: Involvement of p53 arginine variant and chromosomal aberrations in arsenic susceptibility. Mutation Research - Reviews in Mutation Research 659 (1-2), 118-125.
De Vizcaya-Ruiz A, Barbier O, Ruiz-Ramos R, Cebrian ME, 2009. Biomarkers of oxidative stress and damage in human populations exposed to arsenic. Mutation Research/Genetic Toxicology and Environmental Mutagenesis 674 (1-2), 85-92.

Arsenic in food
156 EFSA Journal 2009; 7(10):1351
Devesa V, Suner MA, Algora S, Velez D, Montoro R, Jalon M, Urieta I, Macho ML, 2005. Organoarsenical species contents in cooked seafood. Journal of Agricultural and Food Chemistry 53 (22), 8813-8819.
Devesa V, Adair BM, Liu J, Waalkes MP, Diwan BA, Styblo M, Thomas DJ, 2006. Arsenicals in maternal and fetal mouse tissues after gestational exposure to arsenite. Toxicology 224 (1-2), 147-155.
Devesa V, Velez D, Montoro R, 2008. Effect of thermal treatments on arsenic species contents in food. Food and Chemical Toxicology 46 (1), 1-8.
DG Environment, 2000. Ambient air pollution by As, Cd and Ni compounds. Position paper, Final version, October 2000. DG Environment, European Commission.
Dhar P, Mohari N, Mehra RD, 2007. Preliminary morphological and morphometric study of rat cerebellum following sodium arsenite exposure during rapid brain growth (RBG) period. Toxicology 234 (1-2), 10-20.
Dhar RK, Biswas BK, Samanta G, Mandal BK, Chakraborti D, Roy S, Jafar A, Islam A, Ara G, Kabir S, Khan AW, Ahmed SA, Hadi SA, 1997. Groundwater arsenic calamity in Bangladesh. Current Science 73 (1), 48-59.
Diaz OP, Leyton I, Munoz O, Nunez N, Devesa V, Suner MA, Velez D, Montoro R, 2004. Contribution of water, bread, and vegetables (raw and cooked) to dietary intake of inorganic arsenic in a rural village of Northern Chile. Journal of Agricultural and Food Chemistry 52 (6), 1773-1779.
Do T, Gambelunghe A, Ahsan H, Graziano J, Perrin M, Slavkovich V, Parvez F, Milton AH, Brandt-Rauf P, 2001. Urinary transforming growth factor-alpha in individuals exposed to arsenic in drinking water in Bangladesh. Biomarkers 6 (2), 127-132.
Donat JR, Bruland KW, 1995. Trace elements in the ocean. In: Trace elements in natural waters. Salbu B and Steinnes E (Eds), Boca Raton: CRC Press, pp. 247-281.
Dufailly V, Noël L, Guérin T, 2008. Optimisation and critical evaluation of a collision cell technology ICP-MS system for the determination of arsenic in foodstuffs of animal origin. Analytica Chimica Acta 611, 134-142.
Eblin KE, Bowen ME, Cromey DW, Bredfeldt TG, Mash EA, Lau SS, Gandolfi AJ, 2006. Arsenite and monomethylarsonous acid generate oxidative stress response in human bladder cell culture. Toxicology and Applied Pharmacology 217 (1), 7-14.
Eblin KE, Hau AM, Jensen TJ, Futscher BW, Gandolfi AJ, 2008. The role of reactive oxygen species in arsenite and monomethylarsonous acid-induced signal transduction in human bladder cells: Acute studies. Toxicology 250 (1), 47-54.
Edmonds JS,Francesconi KA, 2003. Arsenic in seafoods-human health-aspects and regulations. Marine Pollutants Bulletin 26, 665-674.
EFSA (European Food Safety Authority), 2005. Opinion of the Scientific Panel on contaminants in the food chain (CONTAM) related to Arsenic as undesirable substance in animal feed. The EFSA Journal 180, pp. 35..
EFSA (European Food Safety Authority), 2005a. Guidance of the Scientific Committee on a request from EFSA related to a harmonised approach for risk assessment of substances which are both genotoxic and carcinogenic. The EFSA Journal 282, pp.31.
EFSA (European Food Safety Authority), 2006. Guidance of the Scientific Committee on a request from EFSA related to Uncertainties in Dietary Exposure Assessment. The EFSA Journal 438, pp. 54.

Arsenic in food
157 EFSA Journal 2009; 7(10):1351
EFSA (European Food Safety Authority), 2008a. Guidance Document for the use of the Concise European Food Consumption Database in Exposure Assessment, pp. 11. Available from: http://www.efsa.europa.eu/cs/BlobServer/General/Coincise_database_guidance_document_and_annexes.pdf?ssbinary=true.
EFSA (European Food Safety Authority), 2008b. Polycyclic Aromatic Hydrocarbons in Food - Scientific Opinion of the Panel on Contaminants in the Food Chain (Question N° EFSA-Q-2007-136) Adopted on 9 June 2008. The EFSA Journal 724, pp. 114.
EFSA (European Food Safety Authority), 2009a. Cadmium in food. Scientific Opinion of the Panel on Contaminants in the Food Chain. The EFSA Journal 980, pp. 139
EFSA (European Food Safety Authority), 2009b. Guidance of the Scientific Committee on Use of the benchmark dose approach in risk assessment. The EFSA Journal 1150, pp. 72.
El-Masri HA, Kenyon EM, 2008. Development of a human physiologically based pharmacokinetic (PBPK) model for inorganic arsenic and its mono- and di-methylated metabolites. Journal of Pharmacokinetics and Pharmacodynamics 35 (1), 31-68.
Engel RR, Smith AH, 1994. Arsenic in drinking-water and mortality from vascular-disease - an ecologic analysis in 30 counties in the United States. Archives of Environmental Health 49 (5), 418-427.
Fängström B, Moore S, Nermell B, Kuenstl L, Goessler W, Grander M, Kabir I, Palm B, El Arifeen S, Vahter M, 2008. Breast-feeding protects against arsenic exposure in Bangladeshi infants. Environmental Health Perspectives 116 (7), 963-969.
Fängström B, Hamadani J, Nermell B, Grandér M, Palm B, Vahter M, 2009. Impaired arsenic metabolism in children during weaning. Toxicology and Applied Pharmacology, in Press, corrected proof, doi:10.1016/j.taap.2008.12.019.
Falk Filipsson AF, Sand S, Nilsson J, Victorin K, 2003. The Benchmark dose method-Review of available models, and recommendations for application in health risk assessment. Critical Reviews in Toxicology 33(5), 505-542.
FAO/WHO (Food and Agriculture Organization/ World Health Organization), 1983. Evaluation of certain food additives and contaminants. WHO Food Additive Report Series, No. 18. International Programme on Chemical Safety, World Health Organization, Geneva.
FAO/WHO (Food and Agriculture Organization/ World Health Organization), 1989. Evaluation of certain food additives and contaminants. WHO Food Additive Report Series, No. 24. International Programme on Chemical Safety, World Health Organization, Geneva.
FAO/WHO (Food and Agriculture Organization/World Health Organization), 2006. Evaluation of certain food contaminants: 64th report of the Joint FAO/WHO Expert Committee on Food Additives. WHO Technical Report Series 930, Geneva 2006. Available from: http://whqlibdoc.who.int/trs/WHO_TRS_930_eng.pdf, pp. 109.
Fatmi Z, Azam I, Ahmed F, Kazi A, Gill AB, Kadir MM, Ahmed M, Ara N, Janjua NZ, 2009. Health burden of skin lesions at low arsenic exposure through groundwater in Pakistan. Is river the source? Environmental Research, 109 (5), 575-581.
FDA (Food and Drug Administration), 2000. FDA approves arsenic trioxide for leukemia treatment in record time for a cancer drug development program. DHHS, FDA Talk Paper.
Ferguson JF, Gavis J, 1972. Review of arsenic cycle in natural waters. Water Research 6 (11), 1259-1274.
Ferrario D, Croera C, Brustio R, Collotta A, Bowe G, Vahter M, Gribaldo L, 2008. Toxicity of inorganic arsenic and its metabolites on haematopoietic progenitors "in vitro": Comparison between species and sexes. Toxicology 249 (2-3), 102-108.

Arsenic in food
158 EFSA Journal 2009; 7(10):1351
Ferreccio C, Gonzalez C, Milosavjlevic V, Marshall G, Sancha AM, Smith AH, 2000. Lung cancer and arsenic concentrations in drinking water in Chile. Epidemiology 11 (6), 673-679.
Filippova M, Duerksen-Hughes PJ, 2003. Inorganic and dimethylated arsenic species induce cellular p53. Chemical research in toxicology 16 (3), 423-431.
Fischer JM, Robbins SB, Al-Zoughool M, Kannamkumarath SS, Stringer SL, Larson JS, Caruso JA, Talaska G, Stambrook PJ, Stringer JR, 2005. Co-mutagenic activity of arsenic and benzo[a]pyrene in mouse skin. Mutation Research-Genetic Toxicology and Environmental Mutagenesis 588 (1), 35-46.
Fischer LM, daCosta KA, Kwock L, Stewart PW, Lu TS, Stabler SP, Allen RH, Zeisel SH, 2007. Sex and menopausal status influence human dietary requirements for the nutrient choline. The American Journal of Clinical Nutrition 85 (5), 1275-1285.
Flora SJ, Pant SC, Malhotra PR, Kannan GM, 1997. Biochemical and histopathological changes in arsenic-intoxicated rats coexposed to ethanol. Alcohol 14 (6), 563-568.
Florea AM, Splettstoesser F, Busselberg D, 2007. Arsenic trioxide (As2O3) induced calcium signals and cytotoxicity in two human cell lines: SY-5Y neuroblastoma and 293 embryonic kidney (HEK). Toxicology and Applied Pharmacology 220 (3), 292-301.
Foà V, Colombi A, Maroni M, Buratti M, Calzaferri G, 1984. The speciation of the chemical forms of arsenic in the biological monitoring of exposure to inorganic arsenic. The Science of the Total Environment 34 (3), 241-259.
Francesconi KA, Edmonds JS, Stick RV, 1989. Accumulation of arsenic in yelloweye mullet (Aldrichetta-Forster) following oral-administration of organoarsenic compounds and arsenate. Science of the Total Environment 79 (1), 59-67.
Francesconi KA, Edmonds JS, 1997. Arsenic and marine organisms. In: Advances in Inorganic Chemistry, Vol. 44. Academic Press Inc., San Diego, CA, 147-189.
Francesconi KA, Khokiattiwong S, Goessler W, Pedersen SN, Pavkov M, 2000. A new arsenobetaine from marine organisms identified by liquid chromatography-mass spectrometry. Chemical Communications (12), 1083-1084.
Francesconi KA, Kuehnelt D, 2002. Arsenic compounds in the environment. In: Environmental Chemistry of Arsenic. Books in Soils, Plants, and the Environment. Marcel Dekker, (Ed), New York, 51-94.
Francesconi KA, 2003. Complete extraction of arsenic species: a worthwhile goal? Applied Organometallic Chemistry 17 (9), 682-683.
Francesconi KA, Tanggaard R, McKenzie CJ, Goessler W, 2002. Arsenic metabolites in human urine after ingestion of an arsenosugar. Clinical Chemistry 48 (1), 92-101.
Francesconi KA, Kuehnelt D, 2004. Determination of arsenic species: A critical review of methods and applications, 2000-2003. Analyst 129 (5), 373-395.
Francesconi KA, Sperling M, 2005. Speciation analysis with HPLC-mass spectrometry: time to take stock. Analyst 130 (7), 998-1001.
Freeman HC, Uther JF, Flemming RB, Odense PH, Ackerman RG, Landry G, Musical C, 1979. Clearance of arsenic ingested by man from arsenic-contaminated fish. Bulletin of Environmental Contamination and Toxicology 22, 224-229.
Fry RC, Navasumrit P, Valiathan C, Svensson JP, Hogan BJ, Luo M, Bhattacharya S, Kandjanapa K, Soontararuks S, Nookabkaew S, Mahidol C, Ruchirawat M, Samson LD, 2007. Activation of inflammation/NF-kappa B signalling in infants born to arsenic-exposed mothers. Plos Genetics 3 (11), 2180-2189.

Arsenic in food
159 EFSA Journal 2009; 7(10):1351
FSA (Food Standards Agency), 2004. Arsenic in seaweed, July 2004. Available from: http://www.food.gov.uk/multimedia/pdfs/arsenicseaweed.pdf, p. 4.
Fujihara J, Fujii Y, Agusa T, Kunito T, Yasuda T, Moritani T, Takeshita H, 2009. Ethnic differences in five intronic polymorphisms associated with arsenic metabolism within human arsenic (+3 oxidation state) methyltransferase (AS3MT) gene. Toxicology and Applied Pharmacology 234, 41-46.
Fujino Y, Guo XJ, Liu J, Matthews IP, Shirane K, Wu KG, Kasai H, Miyatake M, Tanabe K, Kusuda T, Yoshimura T, 2005. Chronic arsenic exposure and urinary 8-Hydroxy 2'-deoxyguanosine in an arsenic-affected area in Inner Mongolia, China. Journal of Exposure Analysis and Environmental Epidemiology 15 (2), 147-152.
Gallagher RE, 1998. Arsenic - New life for an old potion. New England Journal of Medicine 339 (19), 1389-1391.
Garland M, Morris JS, Rosner BA, Stampfer MJ, Spate VL, Baskett CJ, Willett WC, Hunter DJ, 1993. Toenail trace element levels as biomarkers: reproducibility over a 6-year period. Cancer Epidemiology, Biomarkers & Prevention 2 (5), 493-497.
Geiszinger A, Goessler W, Kuehnelt D, Francesconi K, Kosmus W, 1998. Determination of Arsenic compounds in earthworms. Environmental Science & Technology 32 (15), 2238-2243.
Germolec DR, Spalding J, Yu HS, Chen GS, Simeonova PP, Humble MC, Bruccoleri A, Boorman GA, Foley JF, Yoshida T, Luster MI, 1998. Arsenic enhancement of skin neoplasia by chronic stimulation of growth factors. American Journal of Pathology 153 (6), 1775-1785.
GESAMP, 1986. (IMO/FAO/UNESCO/WMO/WHO/IAEA/UN/UNEP Joint group of experts on the scientific aspects of marine pollution). Review of potentially harmful substances. Arsenic, mercury and selenium. Rep. Stud. GESAMP 28, 172.
Gherardi RK, Chariot P, Vanderstigel M, Malapert D, Verroust J, Astier A, Brunbuisson C, Schaeffer A, 1990. Organic arsenic-induced Guillain-Barre-like syndrome due to melarsoprol - a clinical, electrophysiological, and pathological-study. Muscle & Nerve 13 (7), 637-645.
Ghosh P, Basu A, Singh KK, Giri AK, 2008. Evaluation of cell types for assessment of cytogenetic damage in arsenic exposed population. Molecular Cancer 7 (45), 1-7.
Globus JH, Ginsburg SW, 1933. Pericapillary encephalorrhagia due to arsphenamine. Archives of Neurology. Psychiatry 30, 1226-1247.
Godfrey KM, Barker DJP, 2000. Fetal nutrition and adult disease. American Journal of Clinical Nutrition 71 (5), 1344S-1352S.
Goebel HH, Schmidt PF, Bohl J, Tettenborn B, Kramer G, Gutmann L, 1990. Polyneuropathy due to acute arsenic intoxication - biopsy studies. Journal of Neuropathology and Experimental Neurology 49 (2), 137-149.
Goessler W, Pavkov M, 2003. Accurate quantification and transformation of arsenic compounds during wet ashing with nitric acid and microwave assisted heating. Analyst 128 (6), 796-802.
Golub MS, Macintosh MS, Baumrind N, 1998. Developmental and reproductive toxicity of inorganic arsenic: Animal studies and human concerns. Journal of Toxicology and Environmental Health-Part B-Critical Reviews 1 (3), 199-241.
Goodman A and Gilman LS, 1980. Goodman and Gilman’s The Pharmacological Basis of Therapeutics, 6th edition, Gilman AG, Goodman AL, Gilman A (Eds), MacMillan, London.
Grandjean P, Weihe P, Needham LL, Burse VW, Patterson DG, Jr., Sampson EJ, Jorgensen PJ, Vahter M, 1995. Relation of a seafood diet to mercury, selenium, arsenic, and polychlorinated biphenyl and other organochlorine concentrations in human milk. Environmental Research 71 (1), 29-38.
Arsenic in food
160 EFSA Journal 2009; 7(10):1351
Grandjean P, Murata K, 2007. Developmental arsenic neurotoxicity in retrospect. Epidemiology 18 (1), 25-26.
Grantham DA, Jones JF, 1977. Arsenic contamination of water wells in Nova Scotia. Journal of the American Water Works Association 69 (12), 653-657.
Greenberg SA, 1996. Acute demyelinating polyneuropathy with arsenic ingestion. Muscle & Nerve 19 (12), 1611-1613.
Gregus Z, Nemeti B, 2002. Purine nucleoside phosphorylase as a cytosolic arsenate reductase. Toxicological Sciences 70 (1), 13-19.
Gross CR, Nelson OA, 1934. Arsenic in tobacco smoke. American Journal of Public Health 24 (1), 36-42.
Guha Mazumder DN, Haque R, Ghosh N, De BK, Santra A, Chakraborty D, Smith AH, 1998. Arsenic levels in drinking water and the prevalence of skin lesions in West Bengal, India. International Journal of Epidemiology 27, 871-877.
Gunderson EL, 1995. FDA Total Diet Study, July 1986-April 1991, dietary intakes of pesticides, selected elements, and other chemicals. Journal of AOAC International 78 (6), 1353-1363.
Guo X, Fujino Y, Kaneko S, Wu K, Xia Y, Yoshimura T, 2001. Arsenic contamination of groundwater and prevalence of arsenical dermatosis in the Hetao plain area, Inner Mongolia, China. Molecular and Cellular Biochemistry 222, 137-140.
Guo HR, 2004. Arsenic level in drinking water and mortality of lung cancer (Taiwan). Cancer Causes & Control 15 (2), 171-177.
Guo XJ, Liu Z, Huang CJ,You L, 2006. Levels of arsenic in drinking-water and cutaneous lesions in Inner Mongolia. Journal of Health, Population and Nutrition 24 (2), 214-220.
Hafeman DM, Ahsan H, Louis ED, Siddique AB, Slavkovich V, Cheng ZQ, van Geen A, Graziano JH, 2005. Association between arsenic exposure and a measure of subclinical sensory neuropathy in Bangladesh. Journal of Occupational and Environmental Medicine 47 (8), 778-784.
Hall LL, George SE, Kohan MJ, Styblo M, Thomas DJ, 1997. In vitro methylation of inorganic arsenic in mouse intestinal cecum. Toxicology and Applied Pharmacology 147 (1) 101-109.
Hall M, Chen Y, Ahsan H, Slavkovich V, van Geen A, Parvez F, Graziano J, 2006. Blood arsenic as a biomarker of arsenic exposure: Results from a prospective study. Toxicology 225 (2-3), 225-233.
Hall M, Gamble M, Slavkovich V, Liu X, Levy D, Cheng Z, van Geen A, Yunus M, Rahman M, Pilsner JR, Graziano J, 2007. Determinants of arsenic metabolism: blood arsenic metabolites, plasma folate, cobalamin, and homocysteine concentrations in maternal-newborn pairs. Environmental Health Perspectives 115 (10), 1503-1509.
Haller L, Adams H, Merouze F, Dago A, 1986. Clinical and pathological aspects of human African trypanosomiasis (Trypanosoma-gambiense) with particular reference to reactive arsenical encephalopathy. American Journal of Tropical Medicine and Hygiene 35 (1), 94-99.
Hanaoka K, Goessler W, Ohno H, Irgolic KJ, Kaise T, 2001. Formation of toxic arsenical in roasted muscles of marine animals. Applied Organometallic Chemistry 15 (1), 61-66.
Hansen HR, Raab A, Francesconi KA, Feldmann J, 2003. Metabolism of arsenic by sheep chronically exposed to arsenosugars as a normal part of their diet. 1 Quantitative intake, uptake and excretion. Environmental Science and Technology. 37 (5) 845-851.
Hansen HR, Raab A, Jaspars M, Milne BF, Feldmann J, 2004. Sulfur-containing arsenical mistaken for dimethylarsinous acid [DMA(III)] and identified as a natural metabolite in urine: Major implications for studies on arsenic metabolism and toxicity. Chemical Research in Toxicology 17 (8), 1086-1091.

Arsenic in food
161 EFSA Journal 2009; 7(10):1351
Haque R, Mazumder DN, Samanta S, Ghosh N, Kalman D, Smith MM, Mitra S, Santra A, Lahiri S, Das S, De BK, Smith AH, 2003. Arsenic in drinking water and skin lesions: dose-response data from West Bengal, India. Epidemiology 14, 174-182.
Harezlak J, Wu MC, Wang M, Schwartzman A, Christiani DC, Lin XH, 2008. Biomarker discovery for arsenic exposure using functional data. Analysis and feature learning of mass spectrometry proteomic data. Journal of Proteome Research 7 (1), 217-224.
Hartwig A, Groblinghoff UD, Beyersmann D, Natarajan AT, Filon R, Mullenders LHF, 1997. Interaction of arsenic(III) with nucleotide excision repair in UV-irradiated human fibroblasts. Carcinogenesis 18 (2), 399-405.
Hartwig A, Pelzer A, Asmuss M, Burkle A, 2003. Very low concentrations of arsenite suppress poly(adp-ribosyl)ation in mammalian cells. International Journal of Cancer 104 (1), 1-6.
Hartwig A,Schwerdtle T, 2009. Arsenic-Induced Carcinogenicity: New Insights in Molecular Mechanism. In: Metal-Complex DNA Interactions. Hadjiliadis N and Sletten E (Eds), John Wiley & Sons, Inc., 491-510.
Hayakawa T, Kobahashi Y, Cui X. 2005. A new metabolic pathway of arsenite : arsenic-glutathione complexes are substarates for human arsenic methyltransferase Cyt19. Archives of Toxicology 79, 183-191.
Health Canada, 2006. Guidelines for Canadian Drinking Water Quality: Guideline Technical Document, Arsenic, Water Quality and Health Bureau, May 2006, Ottawa, Ontario.
Healy SM, Casarez EA, Ayala-Fierro F, Aposhian H, 1998. Enzymatic methylation of arsenic compounds. V. Arsenic methyltransferase activity in tissues of mice. Toxicology and Applied Pharmacology 148, 65-70.
Heck JE, Andrew AS, Onega T, Rigas JR, Jackson BP, Karagas MR and Duell EJ, 2009. Lung cancer in a US population with low to moderate arsenic exposure. Environmental Health Perspectives, in press, doi: 10.1289/ehp.0900566.
Hegedus CM, Skibola CF, Warner M, Skibola DR, Alexander D, Lim S, Dangleben NL, Zhang L, Clark M, Pfeiffer RM, Steinmaus C, Smith AH, Smith MT, Moore LE, 2008. Decreased urinary beta-defensin-1 expression as a biomarker of response to arsenic. Toxicological Sciences 106 (1), 74-82.
Hei TK, Liu SX, Waldren C, 1998. Mutagenicity of arsenic in mammalian cells: role of reactive oxygen species. Proceedings of the National Academy of Sciences of the United States of America 95 (14), 8103-8107.
Heinrich-Ramm R, Mindt-Prufert S, Szadkowski D, 2001. Arsenic species excretion in a group of persons in northern Germany--contribution to the evaluation of reference values. International Journal of Hygiene and Environmental Health 203 (5-6), 475-477.
Heitkemper DT, Vela NP, Stewart KR,Westphal CS, 2001. Determination of total and speciated arsenic in rice by ion chromatography and inductively coupled plasma mass spectrometry. Journal of Analytical Atomic Spectrometry 16 (4), 299-306.
Heitland P, Koster HD, 2008. Fast determination of arsenic species and total arsenic in urine by HPLC-ICP-MS: concentration ranges for unexposed german inhabitants and clinical case studies. Journal of Analytical Toxicology 32 (4), 308-314.
Hernandez A, Marcos R, 2008. Genetic variations associated with interindividual sensitivity in the response to arsenic exposure. Pharmacogenomics 9 (8), 1113-1132.
Hill DS, Wlodarczyk BJ, Finnell RH, 2008. Reproductive consequences of oral arsenate exposure during pregnancy in a mouse model. Birth Defects Research Part B-Developmental and Reproductive Toxicology 83 (1), 40-47.

Arsenic in food
162 EFSA Journal 2009; 7(10):1351
Hindmarsh JT, 2002. Caveats in hair analysis in chronic arsenic poisoning. Clinical Biochemistry 35 (1), 1-11.
Hinwood AL, Jolley DJ, Sim MR, 1999. Cancer incidence and high environmental arsenic concentrations in rural populations: results of an ecological study. International Journal of Environmental Health Research 9 (2), 131-141.
Hoffmann D, Hecht SS, 1990. Advances in tobacco carcinogenesis. In: Handbook of Experimental Pharmacology. Cooper CS and Grover PL (Eds), Springer-Verlag, Heidelberg, Germany, 63-102.
Hong F, Jin T Y, Lu G D, Yin Z Y, 2003. Renal dysfunction in workers exposed to arsenic and cadmium. Zhonghua Lao Dong Wei Sheng Zhi Ye Bing Za Zhi (Chinese Journal of Industrial Hygiene and Occupational Diseases) 21(6), 432-436.
Hong Y, Piao F, Zhao Y, Li S, Wang Y, Liu P, 2009. Subchronic exposure to arsenic decreased Sdha expression in the brain of mice. Neurotoxicology 30 (4), 538-543.
Hopenhayn C, Huang B, Christian J, Peralta C, Ferreccio C, Atallah R, Kalman D, 2003a. Profile of urinary arsenic metabolites during pregnancy. Environmental Health Perspectives 111 (16), 1888-1891.
Hopenhayn C, Ferreccio C, Browning SR, Huang B, Peralta C, Gibb H, Hertz-Picciotto I, 2003b. Arsenic exposure from drinking water and birth weight. Epidemiology 14 (5), 593-602.
Hopenhayn-Rich C, Biggs ML, Kalman DA, Moore LE, Smith AH, 1996b. Arsenic methylation patterns before and after changing from high to lower concentrations of arsenic in drinking water. Environmental Health Perspectives 104 (11), 1200-1207.
Hopenhayn-Rich C, Biggs ML, Smith AH, Kalman DA, Moore LE, 1996a. Methylation study of a population environmentally exposed to arsenic in drinking water. Environmental Health Perspectives 104, 620-628.
Hopenhayn-Rich C, Browning SR, Hertz-Picciotto I, Ferreccio C, Peralta C, Gibb H, 2000. Chronic arsenic exposure and risk of infant mortality in two areas of Chile. Environmental Health Perspectives 108 (7), 667-673.
Hsu KH, Brandt-Rauf P, Lin TM, Chiou HY, Tseng CH, Chew CJ, Lu JCJ, 2006. Plasma-transforming growth factor-alpha expression in residents of an arseniasis area in Taiwan. Biomarkers 11 (6), 538-546.
Hsu LI, Chiu AW, Huan SK, Chen CL, Wang YH, Hsieh FI, Chou WL, Wang LH, Chen CJ, 2008. SNPs of GSTM1, T1, P1, epoxide hydrolase and DNA repair enzyme XRCC1 and risk of urinary transitional cell carcinoma in southwestern Taiwan. Toxicology and Applied Pharmacology 228 (2), 144-155.
Huang CJ, Ke Q, Costa M, Shi X, 2004. Molecular mechanisms of arsenic carcinogenesis. Molecular and Cellular Biochemistry 255 (1-2), 57-66.
Huang YL, Zhang JL, McHenry KT, Kim MM, Zeng WQ, Lopez-Pajares V, Dibble CC, Mizgerd JP, Yuan ZM, 2008. Induction of Cytoplasmic Accumulation of p53: A Mechanism for Low Levels of Arsenic Exposure to Predispose Cells for Malignant Transformation. Cancer Research 68 (22), 9131-9136.
Hughes MF, Kenyon EM, Edwards BC, Mitchell CT, Razo LM, Thomas DJ, 2003. Accumulation and metabolism of arsenic in mice after repeated oral administration of arsenate. Toxicology and Applied Pharmacology 191, 202-210.
Hughes MF, Devesa V, Adair BM, Styblo M, Kenyon EM, Thomas DJ, 2005. Tissue dosimetry, metabolism and excretion of pentavalent and trivalent monomethylated arsenic in mice after oral administration. Toxicology and Applied Pharmacology 208(2), 186-187.
Hughes MF, 2006. Biomarkers of exposure: A case study with inorganic arsenic. Environmental Health Perspectives 114 (11), 1790-1796.

Arsenic in food
163 EFSA Journal 2009; 7(10):1351
Hutton M, Symon C, 1986. The quantities of cadmium, lead, mercury and arsenic entering the U.K. environment from human activities The Science of The Total Environment 57, 129-150.
Huyck KL, Kile ML, Mahiuddin G, Quamruzzaman Q, Rahman M, Breton CV, Dobson CB, Frelich J, Hoffman E, Yousuf J, Afroz S, Islam S, Christiani DC, 2007. Maternal arsenic exposure associated with low birth weight in Bangladesh. Journal of Occupational and Environmental Medicine 49 (10), 1097-1104.
IARC (International Agency for Research on Cancer), 1973. Arsenic and inorganic arsenic compounds. IARC monographs on the evaluation of the carcinogenic risk of chemicals to humans. Vol. 2. Some Inorganic and Organometallic Compounds. Lyon, France, 48-149.
IARC (International Agency for Research on Cancer), 1980. IARC Monographs on the Evaluation of the Carcinogenic Risk of Chemicals to Humans, Volume 23. Some Metals and Metallic Compounds, Lyon, France, 39-141.
IARC (International Agency for Research on Cancer), 1987. IARC Monographs on the Evaluation of the Carcinogenic Risks to Humans, Suppl. 7, Overall Evaluations of Carcinogenicity: An Updating of IARC Monographs Volumes 1 to 42, Lyon, France.
IARC (International Agency for Research on Cancer), 2004. Some drinking-water disinfectants and contaminants, including arsenic. IARC Monographs on the Evaluation of Carcinogenic Risks to Humans. 84, pp. 526.
Ilcol YO, Ozbek R, Hamurtekin E, Ulus IH, 2005. Choline status in newborns, infants, children, breast-feeding women, breast-fed infants and human breast milk. The Journal of Nutritional Biochemistry 16 (8), 489-499.
IOM (Institute of Medicine), 1991. Nutrition During Lactation, Released On: January 01, 1991.
Irvine L, Boyer IJ, DeSesso JM, 2006. Monomethylarsonic acid and dimethylarsinic acid: Developmental toxicity studies with risk assessment. Birth Defects Research Part B-Developmental and Reproductive Toxicology 77 (1), 53-68.
Jin YP, Xi SH, Li X, Lu CN, Li GX, Xu YY, Qu CN, Niu YH, Sun GF, 2006. Arsenic speciation transported through the placenata from mother mice to their newborn pups. Environmental Research 101 (3), 349-355.
Jorhem L, 2008. Promoting analytical quality control of trace-element data to be presented in international journals and reports. Accreditation and Quality Assurance 13 (6), 289-292.
Jorhem L, Åstrand C, Sundström B, Baxter M, Stokes P, Lewis J, Grawé KP, 2007. Elements in rice from the Swedish market: 1. Cadmium, lead and arsenic (total and inorganic). Food Additives & Contaminants 25, 284-292.
Jorhem L, Åstrand C, Sundström B, Baxter M, Stokes P, Lewis J, Grawé KP, 2008. Elements in rice on the Swedish market: Part 2. Chromium, copper, iron, manganese, platinum, rubidium, selenium and zinc. Food Additives and Contaminants 25 (7), 841-850.
Juhasz AL Smith E Weber J, Rees M, Rofe A, Kuchel T, Sansom L, Naidu R, 2006. In vivo assessment of arsenic bioavailability in rice and its significance for Human Health Risk Assessment. Environmental Health Perspectives 114, 1826-1831.
Juhasz AL, Smith E, Weber J, Rees M, Rofe A,Kuchel T, Sansom L, Naidu R, 2008. Application of an in vivo swine model for the determination of arsenic bioavailability in hydroponically-grown vegetables. Chemosphere 71, 1963-1969.
Julshamn K, Lundebye AK, Heggstad K, Berntssen MH, Boe B, 2004. Norwegian monitoring programme on the inorganic and organic contaminants in fish caught in the Barents Sea, Norwegian Sea and North Sea, 1994-2001. Food Additives & Contaminants 21 (4), 365-376.

Arsenic in food
164 EFSA Journal 2009; 7(10):1351
Julshamn K, Maage A, Norli HS, Grobecker KH, Jorhem L, Fecher P, 2007. Determination of arsenic, cadmium, mercury, and lead by inductively coupled plasma/mass spectrometry in foods after pressure digestion: NMKL1 interlaboratory study. Journal of AOAC International 90 (3), 844-856.
Julshamn K, Thorlacius A, Lea P, 2000. Determination of arsenic in seafood by electrothermal atomic absorption spectrometry after microwave digestion: NMKL1 collaborative study. Journal of AOAC International 83 (6), 1423-1428.
Kalra T, Argos M, Rathouz P, Parvez F, Graziano J, Ahsan H, 2009. A prospective cohort study of arsenic exposure from drinking water and incident skin lesions in Bangladesh. American Journal of Epidemiology 169, S91-S91.
Karagas MR, Le XC, Morris S, Blum J, Lu X, Spate V, Carey M, Stannard V, Klaue B, Tosteson TD, 2001. Markers of low level arsenic exposure for evaluating human cancer risks in a US population. International Journal of Occupational Medicine and Environmental Health 14 (2), 171-175.
Karagas MR, Stukel TA, Tosteson TD, 2002. Assessment of cancer risk and environmental levels of arsenic in New Hampshire. International Journal of Hygiene and Environmental Health 205 (1-2), 85-94.
Karagas MR, Tosteson TD, Blum J, Klaue B, Weiss JE, Stannard V, Spate V, Morris JS, 2000. Measurement of low levels of arsenic exposure: A comparison of water and toenail concentrations. American Journal of Epidemiology 152 (1), 84-90.
Karagas MR, Tosteson TD, Morris JS, Demidenko E, Mott LA, Heaney J, Schned A, 2004. Incidence of transitional cell carcinoma of the bladder and arsenic exposure in New Hampshire. Cancer Causes & Control 15 (5), 465-472.
Kashiwada E, Kuroda K, Endo G, 1998. Aneuploidy induced by dimethylarsinic acid in mouse bone marrow cells. Mutation Research-Genetic Toxicology and Environmental Mutagenesis 413 (1), 33-38.
Kawasaki S, Yazawa S, Ohnishi A, Ohi T, 2002. Chronic and predominantly sensory polyneuropathy in Toroku Valley where a mining company produced arsenic. Rinsho Shinkeigaku 42 (6), 504-511.
Kazi TG, Arain MB, Baig JA, Jamali MK, Afridi HI, Jalbani N, Sarfraz RA, Shah AQ, Niaz A, 2009. The correlation of arsenic levels in drinking water with the biological samples of skin disorders. Science of the Total Environment 407 (3), 1019-1026.
Kenyon EM, Hughes MF, Adair BM, Highfill JH, Crecelius EA, Clewell HJ, Yager JW, 2008. Tissue distribution and urinary excretion of inorganic arsenic and its methylated metabolites in C57BL6 mice following subchronic exposure to arsenate in drinking water. Toxicology and Applied Pharmacology 232 (3), 448-455.
Kerkvliet NI, Steppan LB, Koller LD, Exon JH, 1980. Immunotoxicology studies of sodium arsenate effects of exposure on tumor-growth and cell-mediated tumor-immunity. Journal of Environmental Pathology and Toxicology 4 (5-6), 65-79.
Kerr HD, Saryan LA, 1986. Arsenic content of homeopathic medicines. Journal of Toxicology. Clinical Toxicology 24 (5), 451-459.
Kersting M, Alexy U, Sichert Hellert W, Manz F, Schoch G, 1998. Measured consumption of commercial infant food products in German infants: results from the DONALD study. Dortmund Nutritional and Anthropometrical Longitudinally Designed. Journal of Pediatric Gastroenterology and Nutrition 27, 547-552.
Kile ML, Houseman EA, Breton CV, Smith T, Quamruzzaman Q, Rahman M, Mahiuddin G, Christiani DC, 2007. Dietary arsenic exposure in Bangladesh. Environmental Health Perspectives 115 (6), 889-893.
Kim IH, Abel SJ, 2009. Survival after a massive overdose of arsenic trioxide. Critical Care Resuscitation 11 (1), 42-45

Arsenic in food
165 EFSA Journal 2009; 7(10):1351
Kinoshita A, Wanibuchi H, Wei M, Yunoki T, Fukushima S, 2007. Elevation of 8-hydroxydeoxyguanosine and cell proliferation via generation of oxidative stress by organic arsenicals contributes to their carcinogenicity in the rat liver and bladder. Toxicology and Applied Pharmacology 221 (3), 295-305.
Kirby J, Maher W, Chariton A, Krikowa F, 2002. Arsenic concentrations and speciation in a temperate mangrove ecosystem, NSW, Australia. Applied Organometallic Chemistry 16 (4), 192-201.
Kishi Y, Sasaki H, Yamasaki H, Ogawa K, Nishi M, Nanjo K, 2001. An epidemic of arsenic neuropathy from a spiked curry. Neurology 56 (10), 1417-1418.
Kitchin KT, Wallace K, 2008a. Evidence against the nuclear in situ binding of arsenicals-oxidative stress theory of arsenic carcinogenesis. Toxicology and Applied Pharmacology 232 (2), 252-257.
Kitchin KT, Wallace K, 2008b. The role of protein binding of trivalent arsenicals in arsenic carcinogenesis and toxicity. Journal of Inorganic Chemistry 102 (3), 532-539.
Klein CB, Leszczynska J, Hickey C, Rossman TG, 2007. Further evidence against a direct genotoxic mode of action for arsenic-induced cancer. Toxicology and Applied Pharmacology 222 (3), 289-297.
Kligerman AD, Doerr CL, Tennant AH, Harrrington-Brock K, Allen JW, Winkfield E, Poorman-Allen P, Kundu B, Funasaka K, Roop BC, Mass MJ, DeMarini DM, 2003. Methylated trivalent arsenicals as candidate ultimate genotoxic forms of arsenic: Induction of chromosomal mutations but not gene mutations. Environmental and Molecular Mutagenesis 42 (3), 192-205.
Kligerman AD, Tennant AH, 2007. Insights into the carcinogenic mode of action of arsenic. Toxicology and Applied Pharmacology 222 (3), 281-288.
Knobeloch LM, Zierold KM, Anderson HA, 2006. Association of arsenic-contaminated drinking-water with prevalence of skin cancer in Wisconsin's Fox River Valley. Journal of Health, Population, and Nutrition 24, 206-213.
Komárek M, Chrastny V, Stichova J, 2007. Metal/metalloid contamination and isotopic composition of lead in edible mushrooms and forest soils originating from a smelting area. Environment International 33 (5), 677-684.
Kozul CD, Hampton TH, Davey JC, Gosse JA, Nomikos AP, Eisenhauer PL, Weiss DJ, Thorpe JE, Ihnat MA, Hamilton JW, 2009. Chronic exposure to arsenic in the drinking water alters the expression of immune response genes in mouse lung. Environmental Health Perspectives 117 (7), 1108-1115.
Kreiss K, Zack MM, Feldman RG, Niles CA, Chiricopost J, Sax DS, Landrigan PJ, Boyd MH, Cox DH, 1983. Neurologic evaluation of a population exposed to arsenic in Alaskan well water. Archives of Environmental Health 38 (2), 116-121.
Kreppel H, Liu J, Liu YP, Reichl FX, Klaassen CD, 1994. Zinc-induced arsenite tolerance in mice. Fundamental and Applied Toxicology 23 (1), 32-37.
Kroemer G, de Thé H, 1999. Arsenic trioxide, a novel mitochondriotoxic anticancer agent? Journal of the National Cancer Institute 91 (9), 743-745.
Krüger K, Straub H, Hirner AV, Hippler J, Binding N, Musshoff U, 2009. Effects of monomethylarsonic and monomethylarsonous acid on evoked synaptic potentials in hippocampal slices of adult and young rats. Toxicology and Applied Pharmacology 236 (1), 115-123.
Kubota R, Kunito T, Fujihara J, Tanabe S, Yang J, Miyazaki N, 2005. Placental transfer of arsenic to fetus of D’ll's porpoises (Phocoenoides dalli). Marine Pollution Bulletin 51 (8-12), 845-849.
Kumagai Y, Sumi D, 2007. Arsenic: Signal transduction, transcription factor, and biotransformation involved in cellular response and toxicity. Annual Review of Pharmacology and Toxicology 47, 243-262.

Arsenic in food
166 EFSA Journal 2009; 7(10):1351
Kurttio P, Komulainen H, Hakala E, Kahelin H, Pekkanen J, 1998. Urinary excretion of arsenic species after exposure to arsenic present in drinking water. Archives of Environmental Contamination and Toxicology 34 (3), 297-305.
Kurttio P, Pukkala E, Kahelin H, Auvinen A, Pekkanen J, 1999. Arsenic concentrations in well water and risk of bladder and kidney cancer in Finland. Environmental Health Perspectives 107 (9), 705-710.
Kwok RK, Kaufmann RB, Jakariya M, 2006. Arsenic in drinking-water and reproductive health outcomes: A study of participants in the Bangladesh integrated nutrition programme. Journal of Health Population and Nutrition 24 (2), 190-205.
Lammon CA, Le XC, Hood RD, 2003. Pretreatment with periodate-oxidized adenosine enhances developmental toxicity of inorganic arsenic in mice. Birth Defects Research Part B-Developmental and Reproductive Toxicology 68 (4), 335-343.
Langley-Evans SC, 2006. Developmental programming of health and disease. Proceedings of the Nutrition Society 65 (1), 97-105.
Lantz RC, Chau B, Sarihan P, Witten ML, Pivniouk VI, Chen GJ, 2009. In utero and postnatal exposure to arsenic alters pulmonary structure and function. Toxicology and Applied Pharmacology 235 (1), 105-113.
Laparra JM, Veléz D, Barberá R, Farré R, Montoro R, 2005. Bioavailability of inorganic arsenic in cooked rice: practical aspects for human health risk assessments. Journal of Agricultural and Food Chemistry 53 (22), 8829-8833.
Laparra JM, Velez D, Montoro R, Barbera R, Farré R, 2003. Estimation of arsenic bioaccessibility in edible seaweed by an in vitro digestion method. Journal of Agricultural and Food Chemistry 51 (20), 6080-6085.
Larsen EH, Moseholm L, Nielsen MM, 1992. Atmospheric deposition of trace-elements around point sources and human health risk assessment. 2. Uptake of arsenic and chromium by vegetables grown near a wood preservation factory. Science of the Total Environment 126 (3), 263-275.
Larsen EH, Francesconi KA, 2003. Arsenic concentrations correlate with salinity for fish taken from the North Sea and Baltic waters. Journal of the Marine Biological Association of the United Kingdom 83 (2), 283-284.
Larsen EH, Engman J, Sloth JJ, Hansen M, Jorhem L, 2005. Determination of inorganic arsenic in white fish using microwave-assisted alkaline alcoholic sample dissolution and HPLC-ICP-MS. Analytical and Bioanalytical Chemistry 381 (2), 339-346.
Lee BK, Murphy G, 1969. Determination of arsenic content of American cigarettes by neutron activation analysis. Cancer 23 (6), 1315-1317.
Lee TC, Tanaka N, Lamb PW, Gilmer TM, Barrett JC, 1988. Induction of gene amplification by arsenic. Science 241 (4861), 79-81.
Leonard SS, Harris GK, Shi XL, 2004. Metal-induced oxidative stress and signal transduction. Free Radical Biology and Medicine 37 (12), 1921-1942.
Lewinska D, Arkusz J, Stanczyk M, Palus J, Dziubaltowska E, Stepnik M, 2007. Comparison of the effects of arsenic and cadmium on benzo(a)pyrene-induced micronuclei in mouse bone-marrow. Mutation Research-Genetic Toxicology and Environmental Mutagenesis 632, 37-43.
Lewis DR, Southwick JW, Ouellet-Hellstrom R, Rench J, Calderon RL, 1999. Drinking water arsenic in Utah: A cohort mortality study. Environmental Health Perspectives 107 (5), 359-365.
Li G, Gao H, Zhang Z, Guo X, Dai G, Zhai C, Yan G, Du J, 1994. Epidemiological investigation on the skin lesions of resident in arsenism area. Neimenggu Difangbing Fangzhiyanjiu (Journal of Endemic Diseases Control Study in Inner Mongolia) 19 (suppl), 50-51 (in Chinese).

Arsenic in food
167 EFSA Journal 2009; 7(10):1351
Li YM, Broome JD, 1999. Arsenic targets tubulins to induce apoptosis in myeloid leukemia cells. Cancer Research 59 (4), 776-780.
Liao CM, Shen HH, Chen CL, Hsu LI, Lin TL, Chen SC, Chen CJ, 2009a. Risk assessment of arsenic-induced internal cancer at long-term low dose exposure. Journal of Hazardous Materials 165 (1-3), 652-663.
Liao WT, Yu CL, Lan CC, Lee CH, Chang CH, Chang LW, You HL and Yu HS, 2009b. Differential effects of arsenic on cutaneous and systemic immunity: focusing on CD4+ cell apoptosis in patients with arsenic-induced Bowen's disease. Carcinogenesis 30 (6), 1064-1072.
Liao Y-T, Li W-F, Chen C-J, Prineas RJ, Chen WJ, Zhang Z-M, Sun C-W, Wang S-L, 2009c. Synergistic effect of polymorphisms of paraoxonase gene cluster and arsenic exposure on electrocardiogram abnormality. Toxicology and Applied Pharmacology 239 (2), 178-183.
Liaw J, Marshall G, Yuan Y, Ferreccio C, Steinmaus C, Smith AH, 2008. Increased childhood liver cancer mortality and arsenic in drinking water in Northern Chile. Cancer Epidemiology Biomarkers Preview 17(8), 1982-1987.
Lin S, Del Razo LM, Styblo M, Wang CQ, Cullen WR, Thomas DJ, 2001. Arsenicals inhibit thioredoxin reductase in cultured rat hepatocytes. Chemical Research in Toxicology 14 (3), 305-311.
Lindberg AL, Ekstrom EC, Nermell B, Rahman M, Lonnerdal B, Persson LA, Vahter M, 2008a. Gender and age differences in the metabolism of inorganic arsenic in a highly exposed population in Bangladesh. Environmental Research, 106 (1), 110-120.
Lindberg AL, Goessler W, Gurzau E, Koppova K, Rudnai P, Kumar R, Fletcher T, Leonardi G, Slotova K, Gheorghiu E, Vahter M, 2006. Arsenic exposure in Hungary, Romania and Slovakia. Journal of Environmental Monitoring 8 (1), 203-208.
Lindberg AL, Kumar R, Goessler W, Thirumaran R, Gurzau E, Koppova K, Rudnai P, Leonardi G, Fletcher T, Vahter M, 2007. Metabolism of low-dose inorganic arsenic in a central European population: influence of sex and genetic polymorphisms. Environmental Health Perspectives 115 (7), 1081-1086.
Lindberg AL, Rahman M, Persson LA, Vahter M, 2008b. The risk of arsenic induced skin lesions in Bangladeshi men and women is affected by arsenic metabolism and the age at first exposure. Toxicology and Applied Pharmacology 230 (1), 9-16.
Lindgren A, Danielsson BRG, Dencker L, Vahter M, 1984. Embryotoxicity of arsenite and arsenate - distribution in pregnant mice and monkeys and effects on embryonic-cells in vitro. Acta Pharmacologica et Toxicologica 54 (4), 311-320.
Link B, Gabrio T, Piechotowski I, Zollner I, Schwenk M, 2007. Baden-Wuerttemberg Environmental Health Survey (BW-EHS) from 1996 to 2003: Toxic metals in blood and urine of children. International Journal of Hygiene and Environmental Health 210 (3-4), 357-371.
Lithner G, Holm K, Borg H, 1995. Bioconcentration factors for metals in humic waters at different pH in the Ronnskar area (N Sweden). Water Air and Soil Pollution 85 (2), 785-790.
Liu Z, Shen J, Carbrey JM, Mukhopadhyay R, Agre P, Rosen BP, 2002. Arsenite transport by mammalian aquaglyceroporins AQP7 and AQP9. Proceedings of the National Academy of Science of the United States of America 99, 6053-6058.
Liu J, Waalkes MP, 2008. Liver is a target of arsenic carcinogenesis. Toxicological Sciences 105 (1), 24-32.
Lu M, Wang H, Li XF, Lu X, Cullen WR, Arnold LL, Cohen SM, Le XC, 2004. Evidence of hemoglobin binding to arsenic as a basis for the accumulation of arsenic in rat blood. Chemical Research in Toxicology 17, 1733-1742.

Arsenic in food
168 EFSA Journal 2009; 7(10):1351
Luo JH, Qiu ZQ, Shu WQ, Zhang YY, Zhang L , Chen JA, 2009. Effects of arsenic exposure from drinking water on spatial memory, ultra-structures and NMDAR gene expression of hippocampus in rats. Toxicology Letters 184 (2), 121-125.
Luo Z, Ma L, Zang Y, Zang G, Naren G, Fan C, Zhou Y, Li H, Dai Q, Liang X, 1994. Investigtion on the chronic arsenism in Huhhot. Neimenggu Difangbing Fangzhiyanjiu 19(suppl), 44-47 (in Chinese).
Lu M, Wang H Li XF, Arnold LL, Cohen SM, Le XC, 2007. Binding of dimethylarsinous acid to cys-13alpha of rat hemoglobin is responsible for the retention of arsenic in rat blood. Chemical Research in Toxicology 20, 27-37.
Ma LQ, Komar KM, Tu C, Zhang WH, Cai Y, Kennelley ED, 2001. A fern that hyperaccumulates arsenic - A hardy, versatile, fast-growing plant helps to remove arsenic from contaminated soils. Nature 409 (6820), 579-579.
Ma MS, Le XC, 1998. Effect of arsenosugar ingestion on urinary arsenic speciation. Clinical Chemistry 44 (3), 539-550.
Maloney CA, Hay SM, Rees WD, 2007. Folate deficiency during pregnancy impacts on methyl metabolism without affecting global DNA methylation in the rat fetus. The British Journal of Nutrition 97 (6), 1090-1098.
Mandal BK, Chowdhury TR, Samanta G, Basu GK, Chowdhury PP, Chanda CR, Lodh D, Karan NK, Dhar RK, Tamili DK, Das D, Saha KC, Chakraborti D, 1996. Arsenic in groundwater in seven districts of West Bengal, India - The biggest arsenic calamity in the world. Current Science 70 (11), 976-986.
Mandal BK, Ogra Y, Suzuki KT, 2001. Identification of dimethylarsinous and monomethylarsonous acids in human urine of the arsenic-affected areas in West Bengal, India. Chemical Research in Toxicology 14 (4), 371-378.
Mandal BK, Ogra Y, Suzuki KT, 2003. Speciation of arsenic in human nail and hair from arsenic-affected area by HPLC-inductively coupled argon plasma mass spectrometry. Toxicology and Applied Pharmacology 189 (2), 73-83.
Mann S, Droz PO,Vahter M, 1996a. A physiologically based pharmacokinetic model for arsenic exposure. 1. Development in hamsters and rabbits. Toxicology and Applied Pharmacology 137 (1), 8-22.
Mann S, Droz PO, Vahter M, 1996b. A physiologically based pharmacokinetic model for arsenic exposure. 2. Validation and application in humans. Toxicology and Applied Pharmacology 140 (2), 471-486.
Marafante E, Vahter M, 1984. The effect of methyltransferase inhibition on the metabolism of [As-74] arsenite in mice and rabbits. Chemico-Biological Interactions 50 (1), 49-57.
Marafante E, Vahter M, 1986. The effect of dietary and chemically-induced methylation deficiency on the metabolism of arsenate in the rabbit. Acta Pharmacologica et Toxicologica 59, 35-38.
Marafante E, Vahter M, Norin H, Envall J, Sandstrom M, Christakopoulos A, Ryhage R. 1987. Biotransformation of dimethylarsinic acid in mouse, hamster and man. Journal of Applied Toxicology 7(2),111-117.
Marcos R, Martinez V, Hernandez A, Creus A, Sekaran C, Tokunaga H, Quinteros D, 2006. Metabolic profile in workers occupationally exposed to arsenic: role of GST polymorphisms. Journal of Occupational and Environmental Medicine 48, 334-341.
Marsit CJ, Karagas MR, Danaee H, Liu M, Andrew A, Schned A, Nelson HH,Kelsey KT, 2006. Carcinogen exposure and gene promoter hypermethylation in bladder cancer. Carcinogenesis 27 (1), 112-116.

Arsenic in food
169 EFSA Journal 2009; 7(10):1351
Martinez EJ, Kolb BL, Bell A, Savage DD, Allan AM, 2008. Moderate perinatal arsenic exposure alters neuroendocrine markers associated with depression and increases depressive-like behaviors in adult mouse offspring. Neurotoxicology 29 (4), 647-655.
Mason RP, Laporte JM, Andres S, 2000. Factors controlling the bioaccumulation of mercury, methylmercury, arsenic, selenium, and cadmium by freshwater invertebrates and fish. Archives of Environmental Contamination and Toxicology 38 (3), 283-297.
Mass MJ, Wang L, 1997. Arsenic alters cytosine methylation patterns of the promoter of the tumor suppressor gene p53 in human lung cells: a model for a mechanism of carcinogenesis. Mutation Research/Reviews in Mutation Research 386 (3), 263-277.
Mass MJ, Tennant A, Roop BC, Cullen WR, Styblo M, Thomas DJ, Kligerman AD, 2001. Methylated trivalent arsenic species are genotoxic. Chemical Research in Toxicology 14 (4), 355-361.
Matschullat J, 2000. Arsenic in the geosphere - a review. Science of the Total Environment 249 (1-3), 297-312.
Matsui M, Nishigori C, Toyokuni S, Takada J, Akaboshi M, Ishikawa M, Imamura S, Miyachi Y, 1999. The role of oxidative DNA damage in human arsenic carcinogenesis: Detection of 8-hydroxy 2'-deoxyguanosine in arsenic-related Bowen's disease. Journal of Investigative Dermatology 113 (1), 26-31.
McCarty KM, Chen YC, Quamruzzaman Q, Rahman M, Mahiuddin G, Hsueh YM, Su L, Smith T, Ryan L, Christiani DC, 2007. Arsenic methylation, GSTT1, GSTM1, GSTP1 polymorphisms, and skin lesions. Environmental Health Perspectives 115 (3), 341-345.
McDonald C, Hoque R, Huda N, Cherry N, 2007. Risk of arsenic-related skin lesions in Bangladeshi villages at relatively low exposure: a report from Gonoshasthaya Kendra. Bulletin of the World Health Organization 85 (9), 668-673.
Meacher DM, Menzel DB, Dillencourt MD, Bic LF, Schoof RA, Yost LJ, Eickhoff JC, Farr CH, 2002. Estimation of multimedia inorganic arsenic intake in the US population. Human and Ecological Risk Assessment 8, 1697-1721.
Meharg AA, Sun G, Williams PN, Adomako E, Deacon C, Zhu YG, Feldmann J, Raab A, 2008. Inorganic arsenic levels in baby rice are of concern. Environmental Pollution 152 (3), 746-749.
Meharg AA, Williams PN, Adomako E, Lawgali YY, Deacon C, Villada A, Cambell RCJ, Sun G, Zhu YG, Feldmann J, Raab A, Zhao FJ, Islam R, Hossain S, Yanai J, 2009. Geographical variation in total and inorganic arsenic content of polished (white) rice. Environmental Science & Technology 43 (5), 1612-1617.
Meliker JR, Franzblau A, Slotnick MJ,Nriagu JO, 2006. Major contributors to inorganic arsenic intake in southeastern Michigan. International Journal of Hygiene and Environmental Health 209 (5), 399-411.
Mennella JA, Ziegler P, Briefel R, Novak T, 2006. Feeding infants and toddlers study: the types of foods fed to Hispanic infants and toddlers. Journal of American Dietetic Association 106 (1 Suppl 1), S96-106.
Mensink GB, Beitz R, 2004. Food and nutrient intake in East and West Germany, 8 years after the reunification – The German Nutrition Survey 1998. European Journal of Clinical Nutrition 58 (7), 1000-1010.
Michaud DS, Wright ME, Cantor KP, Taylor PR, Virtamo J, Albanes D, 2004. Arsenic concentrations in prediagnostic toenails and the risk of bladder cancer in a cohort study of male smokers. American Journal of Epidemiology 160 (9), 853-859.
Miller M, 1998. Scientists explore use of arsenic in therapy. Journal of the National Cancer Institute 90 (24), 1866-1867.

Arsenic in food
170 EFSA Journal 2009; 7(10):1351
Milton AH, Smith W, Rahman B, Hasan Z, Kulsum U, Dear K, Rakibuddin M, Ali A, 2005. Chronic arsenic exposure and adverse pregnancy outcomes in Bangladesh. Epidemiology 16 (1), 82-86.
Mink PJ, Alexander DD, Barraj LM, Kelsh MA, Tsuji JS, 2008. Low-level arsenic exposure in drinking water and bladder cancer: A review and meta-analysis. Regulatory Toxicology and Pharmacology 52 (3), 299-310.
Mishra D, Flora SJS, 2008. Differential oxidative stress and DNA damage in rat brain regions and blood following chronic arsenic exposure. Toxicology and Industrial Health 24 (4), 247-256.
Mo JY, Xia YJ, Wade TJ, Schmitt M, Le XC, Dang RH, Mumford JL, 2006. Chronic arsenic exposure and oxidative stress: OGG1 expression and arsenic exposure, nail selenium, and skin hyperkeratosis in Inner Mongolia. Environmental Health Perspectives 114 (6), 835-841.
Mok WM, Wai CM, 1994. Mobilization of arsenic in contaminated river waters. In: Arsenic in the environment: Part I: Cycling and characterization. Nriagu JO (Ed). John Wiley & Sons, New York, 99–117.
Moore MM, Harrington Brock K, Doerr CL, 1997. Relative genotoxic potency of arsenic and its methylated metabolites. Mutation Research-Reviews in Mutation Research 386 (3), 279-290.
Mostafa MG, McDonald JC, Cherry NM, 2008. Lung cancer and exposure to arsenic in rural Bangladesh. Occupational and Environmental Medicine 65 (11), 765-768.
Motiwale L, Ingle AD, Rao KVK, 2005. Mouse skin tumor promotion by sodium arsenate is associated with enhanced PCNA expression. Cancer Letters 223 (1), 27-35.
Muñoz O, Devesa V, Suner MA, Velez D, Montoro R, Urieta I, Macho ML, Jalon M, 2000. Total and inorganic arsenic in fresh and processed fish products. Journal of Agricultural and Food Chemistry 48 (9), 4369-4376.
Muñoz O, Diaz OP, Leyton I, Nunez N, Devesa V, Suner MA, Velez D, Montoro R, 2002. Vegetables collected in the cultivated Andean area of northern Chile: total and inorganic arsenic contents in raw vegetables. Journal of Agricultural and Food Chemistry 50 (3), 642-647.
Mure K, Uddin AN, Lopez LC, Styblo M, Rossman TG, 2003. Arsenite induces delayed mutagenesis and transformation in human osteosarcoma cells at extremely low concentrations. Environmental and Molecular Mutagenesis 41 (5), 322-331.
Myers SL, Lobdell DT, Liu Z, Xia Y, Ren H, Li Y, Kwok RK, Mumford JL, Mendola P, 2009. Maternal drinking water arsenic exposure and perinatal outcomes in Inner Mongolia, China. Journal of Epidemiology and Community Health, ahead of print, doi:10.1136/jech.2008.084392
Navas-Acien A, Sharrett AR, Silbergeld EK, Schwartz BS, Nachman KE, Burke TA, Guallar E, 2005. Arsenic exposure and cardiovascular disease: A systematic review of the epidemiologic evidence. American Journal of Epidemiology 162 (11), 1037-1049.
Navas-Acien A, Silbergeld EK, Pastor-Barriuso R, Guallar E, 2008. Arsenic exposure and prevalence of type 2 diabetes in US adults. Journal of the American Medical Association 300 (7), 814-822.
Navas-Acien A, Silbergeld EK, Streeter RA, Clark JM, Burke TA, Guallar E, 2006. Arsenic exposure and type 2 diabetes: A systematic review of the experimental and epidemiologic evidence. Environmental Health Perspectives 114 (5), 641-648.
Nayak AS, Lage CR, Kim CH, 2007. Effects of low concentrations of arsenic on the innate immune system of the zebrafish (Danio rerio). Toxicological Sciences 98 (1), 118-124.
Nermell B, Lindberg AL, Rahman M, Berglund M, Persson LA, El Arifeen S, Vahter M, 2008. Urinary arsenic concentration adjustment factors and malnutrition. Environmental Research 106 (2), 212-218.

Arsenic in food
171 EFSA Journal 2009; 7(10):1351
Nesnow S, Roop BC, Lambert G, Kadiiska M, Mason RP, Cullen WR, Mass MJ, 2002. DNA damage induced by methylated trivalent arsenicals is mediated by reactive oxygen species. Chemical Research in Toxicology 15 (12), 1627-1634.
Nischwitz V, Pergantis SA, 2005. First report on the detection and quantification of arsenobetaine in extracts of marine algae using HPLC-ES-MS/MS. Analyst 130 (10), 1348-1350.
Nishikawa T, Wanibuchi H, Ogawa M, Kinoshita A, Morimura K, Hiroi T, Funae Y, Kishida H, Nakae D,Fukushima S, 2002. Promoting effects of monomethylarsonic acid, dimethylarsinic acid and trimethylarsine oxide on induction of rat liver preneoplastic glutathione S-transferase placental form positive foci: a possible reactive oxygen species mechanism. International Journal of Cancer 100 (2), 136-139.
Noda Y, Suzuki T, Kohara A, Hasegawa A, Yotsuyanagi T, Hayashi M, Sofuni T, Yamanaka K, Okada S, 2002. In vivo genotoxicity evaluation of dimethylarsinic acid in Muta (TM) Mouse. Mutation Research-Genetic Toxicology and Environmental Mutagenesis 513 (1-2), 205-212.
Noël L, Dufailly V, Lemahieu N, Vastel C, Guérin T, 2005. Simultaneous analysis of cadmium, lead, mercury and arsenic content in foodstuffs of animal origin by ICPMS after closed vessel microwave digestion: method validation. Journal of AOAC International 8 (6), 1811-1821.
Nordberg G F, Jin T, Hong F, Zhang A, Buchet J P, Bernard A, 2005. Biomarkers of cadmium and arsenic interactions. Toxicology and Applied Pharmacology 206, 191-197.
NPIRS (National Pesticide Information Retrieval System), 2009. Arsenic acid, Arsenic trioxide. Available from: http://ppis.ceris.purdue.edu/htbin/epaprod.com.
NRC (National Research Council), 1999. Arsenic in drinking water. National Academy Press, Washington, D.C. Available from: http://www.nap.edu/openbook/0309063337/html/R1.html, pp. 310.
NRC (National Research Council), 2001. Arsenic in drinking water 2001 Update. National Academy Press, Washington, D.C. Available from: http://www.nap.edu/openbook/0309076293/html/R1.html, p. 226.
Nriagu JO, 1990. Heavy metal pollution poisoning the biosphere? Environment 32 (7-11), 28-33.
NTP (National Toxicology Programme), 1989. Toxicology and Carcinogenesis Studies of Roxarsone (CAS No. 121-19-7) in F344/N Rats and B6C3F1 Mice (Feed Studies), National Toxicology ProgrammeTech Rep Ser 345. pp. 198
Ochi T, Kita K, Suzuki T, Rumpler A, Goessler W, Francesconi KA, 2008. Cytotoxic, genotoxic and cell-cycle disruptive effects of thio-dimethylarsinate in cultured human cells and the role of glutathione. Toxicology and Applied Pharmacology 228 (1), 59-67.
Okui T, Fujiwara Y, 1986. Inhibition of human excision DNA repair by inorganic arsenic and the co-mutagenic effect in V79 Chinese hamster cells. Mutation Research 172, 69-76.
Olsen CE, Liguori AE, Zong Y, Lantz RC, Burgess JL, Boitano S, 2008. Arsenic upregulates MMP-9 and inhibits wound repair in human airway epithelial cells. American Journal of Physiology. Lung Cellular and Molecular Physiology 295 (2), L293-302.
O’Neill P, 1990. Arsenic. In: Heavy metals in soils. Alloway BJ (Ed), Blackie and Sons, Glasgow, 83-99.
Onishi H, 1969. Arsenic. In: Handbook of Geochemistry. Wedepohl KH (Ed), Springer, New York.
OSPAR (The Convention for the Protection of the Marine Environment of the North-East Atlantic), 1997. OSPAR Commission.
Otto D, Xia Y, Wu K, He L, Telech J, Hundell H, Prah J, Mumford J,Wade T, 2007. Neurosensory effects of chronic human exposure to arsenic associated with body burden and environmental measures. Human & Experimental Toxicology 26 (3), 169-177.

Arsenic in food
172 EFSA Journal 2009; 7(10):1351
Page GW, 1981. Comparison of groundwater and surface-water for patterns and levels of contamination by toxic-substances. Environmental Science & Technology 15 (12), 1475-1481.
Pal A, Chowdhury UK, Mondal D, Das B, Nayak B, Ghosh A, Maity S, Chakraborti D, 2009. Arsenic burden from cooked rice in the populations of arsenic affected and nonaffected areas and Kolkata City in West-Bengal, India. Environmental Science & Technology 43(9), 3349-3355.
Parris GE, Brinckman FE, 1976. Reactions which relate to environmental mobility of arsenic and antimony. II. Oxidation of trimethylarsine and trimethylstibine. Environmental Science and Technology 10 (12), 1128–1134.
Pavlovičá D, Šalgovičová D, 2008. Dietary intake of arsenic in the Slovak Republic. Journal of Food and Nutrition Research 47 (1), 6-17.
Pelkonen R, Alfthan G, Järvinen O, 2006. Cadmium, lead, arsenic and nickel in wild edible mushrooms. Environmental protection, The Finnish Enviroment 17, Helsinki.
Perelló G, Martí-Cid R, Llobet JM, Domingo JL, 2008. Effects of various cooking processes on the concentrations of arsenic, cadmium, mercury, and lead in foods. Journal of Agricultural and Food Chemistry 56, 11262-11269.
Pershagen G, Nordberg G, Bjorklund NE, 1984. Carcinomas of the respiratory tract in hamsters given arsenic trioxide and/or benzo[a]pyrene by the pulmonary route. Environmental Research 34 (2), 227-241.
Petrick JS, Jagadish B, Mash EA, Aposhian HV, 2001. Monomethylarsonous acid (MMA(III)) and arsenite: LD50 in hamsters and in vitro inhibition of pyruvate dehydrogenase. Chemical Research in Toxicology 14 (6), 651-656.
Pi J, Yamauchi H, Kumagai Y, Sun G, Yoshida T, Aikawa H, Hopenhayn-Rich C, Shimojo N, 2002. Evidence for induction of oxidative stress caused by chronic exposure of Chinese residents to arsenic contained in drinking water. Environmental Health Perspectives 110 (4), 331-336.
Pilsner JR, Liu XH, Ahsan H, Ilievski V, Slavkovich V, Levy D, Factor-Litvak P, Graziano JH, Gamble MV, 2007. Genomic methylation of peripheral blood leukocyte DNA: influences of arsenic and folate in Bangladeshi adults. American Journal of Clinical Nutrition 86, 1179-1186.
Postma D, Larsen F, Hue NTM, Duc MT, Viet PH, Nhan PQ, Jessen S, 2007. Arsenic in groundwater of the Red River floodplain, Vietnam: Controlling geochemical processes and reactive transport modeling. Geochimica et Cosmochimica Acta 71, 5054-5071.
Pott WA, Benjamin SA, Yang RSH, 2001. Pharmacokinetics, metabolism, and carcinogenicity of arsenic. Reviews of Environmental Contamination and Toxicology 169, 165-214.
Raab A, Baskaran C, Feldmann J, Meharg AA, 2009. Cooking rice in a high water to rice ratio reduces inorganic arsenic content. Journal of Environmental Monitoring 11 (1), 41-44.
Radabaugh TR, Sampayo-Reyes A, Zakharyan RA, Aposhian HV, 2002. Arsenate reductase II. Purine nucleoside phosphorylase in the presence of dihydrolipoic acid is a route for reduction of arsenate to arsenite in mammalian systems. Chemical Research in Toxicology 15 (5), 692-698.
Rahman M, Vahter M, Wahed MA, Sohel N, Yunus M, Streatfield PK, El Arifeen S, Bhuiya A, Zaman K, Chowdhury AMR, Ekstrom EC, Persson LA, 2006b. Prevalence of arsenic exposure and skin lesions. A population based survey in Matlab, Bangladesh. Journal of Epidemiology and Community Health 60 (3), 242-248.
Rahman A, Vahter M, Ekstrom EC, Rahman M, Mustafa AMG, Wahed MA, Yunus M, Persson LA, 2007. Association of arsenic exposure during pregnancy with foetal loss and infant death: a cohort study in Bangladesh. American Journal of Epidemiology 165 (12), 1389-1396.
Rahman A, Vahter M, Smith AH, Nermell B, Yunus M, El Arifeen S, Persson LA, Ekstrom EC, 2009. Arsenic exposure during pregnancy and size at birth: a prospective cohort study in Bangladesh. American Journal of Epidemiology 169 (3), 304-312.

Arsenic in food
173 EFSA Journal 2009; 7(10):1351
Rahman M, Vahter M, Sohel N, Yunus M, Wahed MA, Streatfield PK, Ekstrom EC, Persson LA, 2006a. Arsenic exposure and age and sex-specific risk for skin lesions: a population-based case-referent study in Bangladesh. Environmental Health Perspectives 114 (12), 1847-1852.
Raml R, Raber G, Rumpler A, Bauernhofer T, Goessler W, Francesconi KA, 2009. Individual variability in the human metabolism of an arsenic-containing carbohydrate, 2´, 3´-dihydroxypropyl 5-deoxy-5-dimethylarsinoyl-β-D-riboside, a naturally occurring arsenical in seafood. Chemical Research in Toxicology 22, 1535.
Raml R, Rumpler A, Goessler W, Vahter M, Li L, Ochi T, Francesconi KA, 2007. Thio-dimethylarsinate is a common metabolite in urine samples from arsenic-exposed women in Bangladesh. Toxicology and Applied Pharmacology 222, 374-380.
Ranft U, Miskovic P, Pesch B, Jakubis P, Fabianova E, Keegan T, Hergemoller A, Jakubis M, Nieuwenhuijsen MJ, Grp ES, 2003. Association between arsenic exposure from a coal-burning power plant and urinary arsenic concentrations in Prievidza District, Slovakia. Environmental Health Perspectives 111 (7), 889-894.
Raqib R, Ahmed S, Sultana R, Wagatsuma Y, Mondal D, Hoque AMW, Nermell B, Yunus M, Roy S, Persson LA, El Arifeen S, Moore S, Vahter M, 2009. Effects of in utero arsenic exposure on child immunity and morbidity in rural Bangladesh. Toxicology Letters 185 (3), 197-202.
Reichard JF, Schnekenburger M, Puga A, 2007. Long term low-dose arsenic exposure induces loss of DNA methylation. Biochemical and Biophysical Research Communications 352 (1), 188-192.
Remington RE, 1927. A hitherto unsuspected source of arsenic in human environment. Journal of American Chemical Society 49 (6), 1410-1416.
Robertson FN, 1989. Arsenic in groundwater under oxidizing conditions, south-west United-States. Environmental Geochemistry and Health 11 (3-4), 171-185.
Rodriguez VM, Carrizales L, Jimenez-Capdeville ME, Dufour L, Giordano M, 2001. The effects of sodium arsenite exposure on behavioral parameters in the rat. Brain Research Bulletin 55 (2), 301-308.
Rodriguez VM, Carrizales L, Mendoza MS, Fajardo OR, Giordano M, 2002. Effects of sodium arsenite exposure on development and behavior in the rat. Neurotoxicology and Teratology 24 (6), 743-750.
Rodriguez VM, Jimenez-Capdeville ME, Giordano M, 2003. The effects of arsenic exposure on the nervous system. Toxicology Letters 145 (1), 1-18.
Rodushkin I, Axelsson MD, 2000. Application of double focusing sector field ICP-MS for multielemental characterization of human hair and nails. Part II. A study of the inhabitants of northern Sweden. Science of the Total Environment 262 (1-2), 21-36.
Rosado JL, Ronquillo D, Kordas K, Rojas O, Alatorre J, Lopez P, Garcia-Vargas G, Del Carmen CM, Cebrian ME, Stoltzfus R J, 2007. Arsenic exposure and cognitive performance in Mexican schoolchildren. Environmental Health Perspectives 115, 1371-1375.
Roseman E, Aring CD, 1941. Encephalopathy following neoarsphenamine therapy. New England Journal of Medicine 24, 550-553.
Rossman TG, Molina M, Meyer LW, 1984. The genetic toxicology of metal-compounds. 1. Induction of λ prophage in Escherichia-coli WP2S(λ). Environmental Mutagenesis 6 (1), 59-69.
Rossman TG, Molina M, Klein CB, 1986. Comutagens in E. coli and Chinese hamster cells with special attention to arsenite. Progress in Clinical and Biological Research 209A, 403-408.
Rossman TG, Uddin AN, Burns FJ, Bosland MC, 2001. Arsenite is a cocarcinogen with solar ultraviolet radiation for mouse skin: An animal model for arsenic carcinogenesis. Toxicology and Applied Pharmacology 176 (1), 64-71.

Arsenic in food
174 EFSA Journal 2009; 7(10):1351
Rossman TG, 2003. Mechanism of arsenic carcinogenesis: an integrated approach. Mutation Research 533 (1-2), 37-65.
Rowland IR, 1995. The interaction of gut flora with metal compounds. In : Role of bacteria in human toxicology and pharmacology. MJ Hill (Ed), Taylor and Francis, London, UK, 197-212.
Roychowdhury T, Uchino T, Tokunaga H, Ando M, 2002. Survey of arsenic in food composites from an arsenic-affected area of West Bengal, India. Food and Chemical Toxicology 40 (11), 1611-1621.
Roychowdhury T, Tokunaga H, Ando M, 2003. Survey of arsenic and other heavy metals in food composites and drinking water and estimation of dietary intake by the villagers from an arsenic-affected area of West Bengal, India. Science of the Total Environment 308 (1-3), 15-35.
Rumpler A, Edmonds JS, Katsu M, Jensen KB, Goessler W, Raber G, Gunnlaugsdottir H, Francesconi KA, 2008. Arsenic-containing long-chain fatty acids in cod liver oil: a result of biosynthetic infidelity? Angewandte Chemie International Edition 47, 2665-2667.
Salnikow K, Zhitkovich A, 2008. Genetic and epigenetic mechanisms in metal carcinogenesis and cocarcinogenesis: Nickel, arsenic, and chromium. Chemical Research in Toxicology 21 (1), 28-44.
Schaeffer R, Francesconi KA, Kienzl N, Soeroes C, Fodor P, Váradi L, Raml R, Goessler W, Kuehnelt D, 2006. Arsenic speciation in freshwater organisms from the river Danube in Hungary. Talanta 69, 856-865.
Schläwicke-Engström K, Broberg K, Concha G, Nermell B, Warholm M, Vahter M, 2007. Genetic polymorphisms influencing arsenic metabolism: evidence from Argentina. Environmental Health Perspectives 115, 599-605.
Schmeisser E, Goessler W, Kienzl N, Francesconi KA, 2005. The direct measurement of lipid-soluble arsenic species in biological samples with HPLC-ICPMS. Analyst 130, 948-955.
Schmeisser E, Raml R, Francesconi KA, Kuehnelt D, Lindberg A, Sörös C, Goessler W, 2004. Thio arsenosugars identified as natural constituents of mussels by liquid chromatography-mass spectrometry. Chemical Communications (Cambridge) 16, 1824-1825.
Schmeisser E, Rumpler A, Kollroser M, Rechberger G, Goessler W, Francesconi KA, 2006. Arsenic fatty acids are human urinary metabolites of arsenolipids present in cod liver. Angewandte Chemie International Edition 45, 150-154.
Schoof RA, Yost LJ, Crecelius E, Irgolic K, Goessler W, Guo HR, Greene H, 1998. Dietary arsenic intake in Taiwanese districts with elevated arsenic in drinking water. Human and Ecological Risk Assessment 4 (1), 117-135.
Schoof RA, Yost LJ, Eickhoff J, Crecelius EA, Cragin DW, Meacher DM, Menzel DB, 1999. A market basket survey of inorganic arsenic in food. Food and Chemical Toxicology 37 (8), 839-846.
Schuhmacher-Wolz U, Dieter HH, Klein D, Schneider K, 2009. Oral exposure to inorganic arsenic: evaluation of its carcinogenic and non-carcinogenic effects. Critical Reviews in Toxicology 39 (4), 271-298.
Schwerdtle T, Walter I, Mackiw I, Hartwig A, 2003. Induction of oxidative DNA damage by arsenite and its trivalent and pentavalent methylated metabolites in cultured human cells and isolated DNA. Carcinogenesis 24 (5), 967-974.
SCOOP (Scientific Cooperation), 2004. SCOOP Report of experts participating in Task 3.2.11. March 2004. Assessment of the dietary exposure to arsenic, cadmium, lead and mercury of the population of the EU Member States. Available from: http://ec.europa.eu/food/food/chemicalsafety/contaminants/scoop_3-2-11_heavy_metals_report_en.pdf. pp. 125
Scudlark JR, Church TM, 1988. The atmospheric deposition of arsenic and association with acid precipitation. Atmospheric Environment 22 (5), 937–943.

Arsenic in food
175 EFSA Journal 2009; 7(10):1351
Sen J, Chaudhuri AB, 2008. Arsenic exposure through drinking water and its effect on pregnancy outcome in Bengali women. Arhiv za Higijenu Rada Toksikologiju 59, 271-275.
Sengupta MK, Hossain MA, Mukherjee A, Ahamed S, Das B, Nayak B, Pal A, Chakraborti D, 2006. Arsenic burden of cooked rice: Traditional and modern methods. Food and Chemical Toxicology 44 (11), 1823-1829.
Shackelford D, Kenific C, Blusztajn A, Waxman S, Ren R, 2006. Targeted Degradation of the AML1/MDS1/EVI1 Oncoprotein by Arsenic Trioxide. Cancer Research 66 (23), 11360-11369.
Shalat SL, Walker DB,Finnell RH, 1996. Role of arsenic as a reproductive toxin with particular attention to neural tube defects. Journal of Toxicology and Environmental Health 48 (3), 253-272.
She LK, Kheng LC, 1992. Arsenic contents in some Malaysian vegetables. Pertanika 15, 171-173.
Shen J, Wanibuchi H, Salim EI, Wei M, Doi K, Yoshida K, Endo G, Morimura K, Fukushima S, 2003a. Induction of glutathione S-transferase placental form positive foci in liver and epithelial hyperplasia in urinary bladder, but no tumor development in male Fischer 344 rats treated with monomethylarsonic acid for 104 weeks. Toxicology and Applied Pharmacology 193 (3), 335-345.
Shen J, Wanibuchi H, Salim EI, Wei M, Kinoshita A, Yoshida K, Endo G, Fukushima S, 2003b. Liver tumorigenicity of trimethylarsine oxide in male Fischer 344 rats-association with oxidative DNA damage and enhanced cell proliferation. Carcinogenesis 24 (11), 1827-1835.
Shen S, Lee J, Weinfeld M, Le XC, 2008. Attenuation of DNA damage-induced p53 expression by arsenic: a possible mechanism for arsenic co-carcinogenesis. Molecular Carcinogenesis 47 (7), 508-518.
Shi HL, Shi XL, Liu KJ, 2004. Oxidative mechanism of arsenic toxicity and carcinogenesis. Molecular and Cellular Biochemistry 255 (1-2), 67-78.
Signes-Pastor AJ, Mitra K, Sarkhel S, Hobbes M, Burló F, de Groot WT, Carbonell-Barrachina AA, 2008. Arsenic speciation in food and estimation of the dietary intake of inorganic arsenic in a rural village of West Bengal, India. Journal of Agricultural and Food Chemistry 56 (20), 9469-9474.
Simeonova PP, Luster MI, 2004. Arsenic and atherosclerosis. Toxicology and Applied Pharmacology 198 (3), 444-449.
Sirot V, Guérin T, Volatier JL, Leblanc JC, 2009. Dietary exposure and biomarkers of arsenic in consumers of fish and shellfish from France. Science of the Total Environment 407 (6), 1875-1885.
Slejkovec Z, Bajc Z, Doganoc DZ, 2004. Arsenic speciation patterns in freshwater fish. Talanta 62 (5), 931-936.
Slejkovec Z, Falnoga I, Goessler W, van Elteren JT, Raml R, Podgornik H, Cernelc P, 2008. Analytical artefacts in the speciation of arsenic in clinical samples. Analytica Chimica Acta 607 (1), 83-91.
Sloth JJ, Larsen EH, Julshamn K, 2005. Survey of inorganic arsenic in marine animals and marine certified reference materials by anion exchange high-performance liquid chromatography-inductively coupled plasma mass spectrometry. Journal of Agricultural and Food Chemistry 53 (15), 6011-6018.
Sloth JJ, Julshamn K, 2008. Survey of total and inorganic arsenic content in blue mussels (Mytilus edulis L.) from Norwegian fiords: revelation of unusual high levels of inorganic arsenic. Journal of Agricultural and Food Chemistry 56 (4), 1269-1273.
Slotnick MJ, Meliker JR, AvRuskin GA, Ghosh D, Nriagu JO, 2007. Toenails as a biomarker of inorganic arsenic intake from drinking water and foods. Journal of Toxicology and Environmental Health-Part A-Current Issues 70 (2), 148-158.
Slotnick MJ, Meliker JR, Kannan S, Nriagu JO, 2008b. Effects of nutritional measures on toenail arsenic concentration as a biomarker of arsenic exposure. Biomarkers 13 (5), 451-466.

Arsenic in food
176 EFSA Journal 2009; 7(10):1351
Slotnick MJ, Meliker JR, Nriagu JO, 2008a. Intra-individual variability in toenail arsenic concentrations in a Michigan population, USA. Journal of Exposure Science and Environmental Epidemiology 18 (2), 149-157.
Smedley PL, Kinniburgh DG, 2002. A review of the source, behaviour and distribution of arsenic in natural waters. Applied Geochemistry 17 (5), 517-568.
Smith AH, Hopenhayn-Rich C, Warner M, Biggs ML, Moore L, Smith MT, 1993. Rationale for selecting exfoliated bladder cell micronuclei as potential biomarkers for arsenic genotoxicity. Journal of Toxicology and Environmental Health 40 (2-3), 223-234.
Smith CJ, Livingston SD, Doolittle DJ, 1997. An international literature survey of "IARC Group I carcinogens" reported in mainstream cigarette smoke. Food and Chemical Toxicology 35 (10-11), 1107-1130.
Smith AH, Marshall GH, Yuan Y, Ferreccio C, Liaw J, von Ehrenstein O, Steinmaus C, Bates MN, Selvin S, 2006. Increased mortality from lung cancer and bronchiestasis in young adults after exposure to arsenic in utero and in early childhood. Environmental Health Perspectives 114, 1293-1296.
Smith AH, Ercumen A, Yuan Y, Steinmaus CM, 2009. Increased lung cancer risks are similar whether arsenic is ingested or inhaled. Journal of Exposure Science and Environmental Epidemiology 19 (4), 343-348.
Soeroes C, Goessler W, Francesconi KA, Schmeisser E, Raml R, Kienzl N, Kahn M, Fodor P, Kuehnelt D, 2005. Thio arsenosugars in freshwater mussels from the Danube in Hungary. Journal of Environmental Monitoring 7, 688-692.
Soto-Pena GA, Luna AL, Acosta-Saavedra L, Conde-Moo P, Lopez-Carrillo L, Cebrian ME, Bastida M, Calderon-Aranda ES, Vega L, 2006. Assessment of lymphocyte subpopulations and cytokine secretion in children exposed to arsenic. Faseb Journal 20 (2), 779-781.
Steinmaus C, Yuan Y, Bates MN, Smith AH, 2003. Case-control study of bladder cancer and drinking water arsenic in the Western United States. American Journal of Epidemiology 158 (12), 1193-1201.
Steinmaus C, Moore LE, Shipp M, Kalman, Rey OA et al. 2007, Genetic polymorphisms in MTHFR 677 and 1298, GSTM1 and T1, and metabolism of arsenic. Journal of Toxicology and Environmental Health A 70 (2), 159-170.
Steinmaus C, Yuan Y, Liaw J, Smith AH, 2009. Low-level population exposure to inorganic arsenic in the United States and diabetes mellitus. Epidemiology 20 (6), ahead of print, doi: 10.1097/EDE.0b013e3181b0fd29.
Sternowsky HJ, Moser B, Szadkowsky D, 2002. Arsenic in breast milk during the first 3 months of lactation. International Journal of Hygiene and Environmental Health 205 (5), 405-409.
Straif K, Benbrahim-Tallaa L, Baan R, Grosse Y, Secretan B, El Ghissassi F, Bouvard V, Guha N, Freeman C, Galichet L, Cogliano V, the Working Group WHO/IARC, 2009. A review of human carcinogens-Part C: metals, arsenic, dusts, and fibres. Lancet Oncology 10 (5), 453-454.
Su HJ, Guo YL, Lai MD, Huang JD, Cheng YW, Christiani DC, 1998. The NAT2* slow acetylator genotype is associated with bladder cancer in Taiwanese, but not in the Black Foot disease endemic area population. Pharmacogenetics 8 (2), 187-190.
Sun GX, Williams PN, Carey AM, Zhu YG, Deacon C, Raab A, Feldmann J, Islam RM, Meharg AA, 2008. Inorganic arsenic in rice bran and its products are an order of magnitude higher than in bulk grain. Environmental Science and Technology 42 (19), 7542-7546.
Sun GX, Williams PN, Zhu YG, Deacon C, Carey AM, Raab A, Feldmann J, Meharg AA, 2009. Survey of arsenic and its speciation in rice products such as breakfast cereals, rice crackers and Japanese rice condiments. Environment International 35 (3), 473-475.

Arsenic in food
177 EFSA Journal 2009; 7(10):1351
Sun Y, Wang J, Wu Y, 1994. Investigation report about chronic arsenism in Bayinmaodao. Neimenggu Difangbing Fangzhiyanjiu 19 (suppl), 63-66 (in Chinese).
Suzuki S, Arnold LL, Ohnishi T, Cohen SM, 2008. Effects of inorganic arsenic on the rat and mouse urinary bladder. Toxicological Sciences 106 (2), 350-363.
Taleshi MS, Jensen KB, Raber G, Edmonds JS, Gunnlaugsdottir H, Francesconi KA, 2008. Arsenic-containing hydrocarbons: Natural compounds in oil from the fish capelin, Mallotus villosus. Chemical Communications 39, 4706-4707.
Tam GKH, Charbonneau SM, Bryce F, Sandi E, 1982. Excretion of a single oral dose of a fish-arsenic in man. Bulletin of Ecnivronmental Contamination and Toxicology 28, 669-673.
Tamaki S, Frankenberger WT, 1992. Environmental biochemistry of arsenic. Reviews of Environmental Contamination and Toxicology 124, 79-110.
Tao SS, Bolger PM, 1999. Dietary arsenic intakes in the United States: FDA Total Diet Study, September 1991-December 1996. Food Additives & Contaminants 16 (11), 465-472.
Tofail F, Vahter M, Hamadani JD, Nermell B, Huda SN, Yunus M, Rahman M, Grantham-McGregor SM, 2009. Effect of arsenic exposure during pregnancy on infant development at 7 months in rural Matlab, Bangladesh. Environmental Health Perspectives 117 (2), 288-293.
Torres-Escribano S, Leal M, Velez D, Montoro R, 2008. Total and inorganic arsenic concentrations in rice sold in Spain, effect of cooking, and risk assessments. Environmental Science & Technology 42 (10), 3867-3872.
Tran HP, Prakash AS, Barnard R, Chiswell B, Ng JC, 2002. Arsenic inhibits the repair of DNA damage induced by benzo(a)pyrene. Toxicology Letters 133 (1), 59-67.
Tsai SM, Wang TN, Ko YC, 1999. Mortality for certain diseases in areas with high levels of arsenic in drinking water. Archives of Environmental Health 54 (3), 186-193.
Tsai SY, Chou HY, The HW, Chen CM, Chen CJ, 2003. The effects of chronic arsenic exposure from drinking water on the neurobehavioral development in adolescence. Neurotoxicology 24 (4-5), 747-753.
Tseng CH, Chong CK, Chen CJ, Tai TY, 1996. Dose-response relationship between peripheral vascular disease and ingested inorganic arsenic among residents in blackfoot disease endemic villages in Taiwan. Atherosclerosis 120 (1-2), 125-133.
Tseng CH, Tai TY, Chong CK, Tseng CP, Lai MS, Lin BJ, Chiou HY, Hsueh YM, Hsu KH, Chen CJ, 2000. Long-term arsenic exposure and incidence of non-insulin-dependent diabetes mellitus: A cohort study in arseniasis-hyperendemic villages in Taiwan. Environmental Health Perspectives 108 (9), 847-851.
Tseng CH, 2008. Cardiovascular disease in arsenic-exposed subjects living in the arseniasis-hyperendemic areas in Taiwan. Atherosclerosis 199 (1), 12-18.
Tseng HP, Wang YH, Wu MM, The HW, Chiou HY, Chen CJ, 2006. Association between chronic exposure to arsenic and slow nerve conduction velocity among adolescents in Taiwan. Journal of Health Population and Nutrition 24 (2), 182-189.
Tseng WP, Chu HM, How SW, Fong JM, Lin CS, Yeh S, 1968. Prevalence of skin cancer in an endemic area of chronic arsenicism in Taiwan. Journal of the National Cancer Institute 40 (3), 453-463.
Tseng WP, 1977. Effects and dose-response relationships of skin cancer and blackfoot disease with arsenic. Environmental Health Perspectives 19, 109-119.
Tsuda T, Babazono A, Yamamoto E, Kurumatani N, Mino Y, Ogawa T, Kishi Y, Aoyama H, 1995. Ingested arsenic and internal cancer: a historical cohort study followed for 33 years. American Journal of Epidemiologol 141 (3), 198-209.

Arsenic in food
178 EFSA Journal 2009; 7(10):1351
Tsuji JS, Yost LJ, Barraj LM, Scrafford CG, Mink PJ, 2007. Use of background inorganic arsenic exposures to provide perspective on risk assessment results. Regulatory Toxicology and Pharmacology 48 (1), 59-68.
Turrini A, Lombardi-Boccia G, 2002. The formulation of the market basket of the Italian total diet 1994-96. Nutrition Research 22 (10), 1151-1162.
Turrini A, Saba A, Perrone D, Cialfa E, D'Amicis A, 2001. INN-CA (Nationwide Nutritional Survey of Food Behaviour). Food consumption patterns in Italy: the INN-CA Study 1994-1996. European Journal of Clinical Nutrition 55, 571-588.
Ulman C, Gezer S, Anal O, Ore RT, Kirca U, 1998. Arsenic in human and cow's milk: A reflection of environmental pollution. Water, Air, and Soil Pollution 101(1-4), 411-416.
Umweltbundesamt, 1997. Data about the environment. The condition of the environment in Germany (in German). Federal Ministry for the Environment, Berlin. Germany.
UNEP (United Nations Environment Programme), 2002. Annual Report. Available from: http://www.unep.org/pdf/annualreport/UNEP_Annual_Report_2002.pdf. pp. 64.
Uneyama C, Toda M, Yamamoto M, Morikawa K, 2007. Arsenic in various foods: cumulative data. Food Additives & Contaminants 24 (5), 447-534.
US EPA (United States Environmental Protection Agency), 1982a. Exposure and risk assessment for arsenic. Washington, DC: U.S. Environmental Protection Agency, Office of Water Regulations and Standards. PB85221711. EPA-440/4-85-005
US EPA (United States Environmental Protection Agency), 1982b. Inductively coupled plasma-atomic emission spectrometric method for trace element analysis of water and wastes – method 200.7. Cincinnati, OH: U.S. Environmental Protection Agency, Environmental Monitoring and Support Laboratory.
US EPA (United States Environmental Protection Agency), 1998. Integrated Risk Information System (IRIS) on Arsenic, National Center for Environmental Assessment, Office of Research and Development, Washington, DC.
US EPA (United States Environmental Protection Agency), 2001a. Integrated Risk Information System (IRIS) on Arsenic, National Center for Environmental Assessment, Office of Research and Development, Washington, DC.
US EPA (United States Environmental Protection Agency), 2001b. National primary drinking water regulations; arsenic and clarifications to compliance and new source contaminants monitoring. Fed Regist 66(14):69767066.
US EPA (United States Environmental Protection Agency), 2003a. Response to requests to cancel certain chromated copper arsenate (CCA) wood preservative products and amendments to terminate certain uses of other CCA products. Fed Regist 68(68), 17366-17372.
US EPA (United States Environmental Protection Agency), 2003b. Technical summary of information available on the bioaccumulation of arsenic in aquatic organisms. Washington, DC: U.S. Environmental Protection Agency. EPA822R03032. Available from: http://www.epa.gov/waterscience/criteria/arsenic/tech-sum-bioacc.pdf. August 27, 2007. 102 pp
US EPA (United States Environmental Protection Agency), 2005a. Issue Paper: Inorganic Arsenic Cancer Slope Factor, Final Draft. July 23, 2005 report of the EPA Intra-Agency Arsenic Cancer Slope Factor Workgroup.
US EPA (United States Environmental Protection Agency), 2005b. Office of Pesticide Programs. Science Issue Paper: Mode of Action for Cacodylic Acid (Dimethylarsinic Acid) and Recommendations for Dose Response Extrapolation. July 26, 2005, Health Effects Division.

Arsenic in food
179 EFSA Journal 2009; 7(10):1351
US EPA (United States Environmental Protection Agency), 2007. Framework for metals risk assessment. U.S. Environmental Protection Agency. EPA120R07001. Available from: http://www.epa.gov/osa/metalsframework/pdfs/metals-risk-assessment-final.pdf. pp. 172.
US EPA (United States Environmental Protection Agency), 2008. Benchmark dose software (BMDS). Available from: http://www.epa.gov/ncea/bmds/about.html.
US EPA SAB (United States Environmental Protection Agency Science Advisory Board), 2007. Advisory on EPA's assessments of carcinogenic effects of organic and inorganic arsenic. United States Environmental Protection Agency Science Advisory Board. EPA-SAB-07-008, Washington DC, USA. Available from: http://www.epa.gov/sab/pdf/sab-07-008.pdf, pp. 88.
USGS (United States Geological Survey), 2006. Arsenic. Mineral commodity studies. U.S: Geological Survey. Available from: http://minerals.usgs.gov/minerals/pubs/commodity/arsenic/arsenmcs06.pdf, 26-27.
USSG (United States Surgeon General), 1989. Reducing the Health Consequences of Smoking, 25 years of progress. A report of the Surgeon General. US DHSS. pp. 80.
Vaessen H, Van Ooik A, 1989. Speciation of arsenic in Dutch total diets: methodology and results. Zeitschrift fur lebensmittel-untersuchung und-forschung 189 (3), 232-235.
Vahidnia A, Romijn F, Tiller M, van der Voet GB, de Wolff FA, 2006. Arsenic-induced toxicity: effect on protein composition in sciatic nerve. Human & Experimental Toxicology 25 (11), 667-674.
Vahidnia A, Romijn F, van der Voet GB, de Wolff FA, 2008a. Arsenic-induced neurotoxicity in relation to toxicokinetics: effects on sciatic nerve proteins. Chemico-Biological Interactions 176 (2-3), 188-195.
Vahidnia A, van der Straaten R, Romijn F, van Pelt J, van der Voet GB, de Wolff FA, 2007b. Arsenic metabolites affect expression of the neurofilament and tau genes: An in-vitro study into the mechanism of arsenic neurotoxicity. Toxicology in Vitro 21, 1104-1112.
Vahidnia A, van der Straaten RJ, Romijn F, van Pelt J, van der Voet GB, de Wolff FA, 2008b. Mechanism of arsenic-induced neurotoxicity may be explained through cleavage of p35 to p25 by calpain. Toxicology in Vitro 22 (3), 682-687.
Vahidnia A, van der Voet GB, de Wolf FA, 2007a. Arsenic neurotoxicity - A review. Human & Experimental Toxicology 26 (10), 823-832.
Vahter M, 1983. Metabolism of arsenic. In: Biological and envrironmental effects of arsenic. Fowler BA (Ed), Elsevier Science, Oxford, UK, pp. 171-197.
Vahter M, 1994. What are the chemical forms of arsenic in urine, and what can they tell us about exposure? Clinical Chemistry 40 (5), 679-680.
Vahter M, 1999. Methylation of inorganic arsenic in different mammalian species and population groups. Science Progress 82 (1), 69-88.
Vahter M, 2002. Mechanisms of arsenic biotransformation. Toxicology 181, 211-217.
Vahter ME, 2007. Interactions between arsenic-induced toxicity and nutrition in early life. Journal of Nutrition 137 (12), 2798-2804.
Vahter M, 2008. Health effects of early life exposure to arsenic. Basic & Clinical Pharmacology & Toxicology 102 (2), 204-211.
Vahter M, 2009. Effects of arsenic on maternal and foetal health. Annual Review of Medicine 29, in press.
Vahter M, Akesson A, Liden C, Ceccatelli S, Berglund M, 2007. Gender differences in the disposition and toxicity of metals. Environmental Research 104 (1), 85-95.

Arsenic in food
180 EFSA Journal 2009; 7(10):1351
Vahter ME, Li L, Nermell B, Rahman A, El Arifeen S, Rahman M, Persson LA, Ekstrom EC, 2006. Arsenic exposure in pregnancy: a population-based study in Matlab, Bangladesh. Journal of Health, Population, and Nutrition, 24, 236-245.
Vahter M, Lind B, 1986. Concentrations of arsenic in urine of the general population in Sweden. The Science of the Total Environment 54, 1-12.
Vahter M, Marafante E, Dencker L, 1983. Metabolism of arsenobetaine in mice, rats and rabbits. Science of the Total Environment 30, 197-211.
Vahter M, Marafante E, Dencker L, 1984. Tissue distribution and retention of 74As-dimethylarsinic acid in mice and rats. Archives of Environmental Contamination and Toxicology 13, 259-264.
Valenzuela OL, Borja-Aburto VH, Garcia-Vargas GG, Cruz-Gonzalez MB, Garcia-Montalvo EA, Calderon-Aranda ES, Del Razo LM, 2005. Urinary trivalent methylated arsenic species in a population chronically exposed to inorganic arsenic. Environmental Health Perspectives 113 (3), 250-254.
Valenzuela OL, Germolec DR, Borja-Aburto VH, Contreras-Ruiz J, Garcia-Vargas GG, Del Razo LM, 2007. Chronic arsenic exposure increases TGFalpha concentration in bladder urothelial cells of Mexican populations environmentally exposed to inorganic arsenic. Toxicology and Applied Pharmacology 222 (3), 264-270.
van Netten C, Hoption Cann SA, Morley DR, van Netten JP, 2000. Elemental and radioactive analysis of commercially available seaweed. Science of the Total Environment 255 (1-3), 169-175.
Varsanyi I, 1989. Arsenic in deep groundwater. In: Proceedings of the Sixth International Symposium on Water–rock Interaction (WRI-6). Miles DL (Ed), AA Balkema Publisher, Rotterdam/Brookfield, 715-718.
Vermeire TG, Apeldoorn ME van, de Fouw JC, Janssen PJCM (1991): Voorstel voor de humaan-toxicologische onderbouwing van C-toetsingswaarden. National Institute of Public Health and the Environment, RIVM-report no. 725201005, February 1991; Bilthoven, The Netherlands.
Vetter J, 2004. Arsenic content of some edible mushroom species. European Food Research and Technology 219 (1), 71-74.
Vijayaraghavan M, Wanibuchi H, Karim R, Yamamoto S, Masuda C, Nakae D, Konishi Y, Fukushima S, 2001. Dimethylarsinic acid induces 8-hydroxy-2'-deoxyguanosine formation in the kidney of NCI-Black-Reiter rats. Cancer Letters 165 (1), 11-17.
Vilano M, Rubio R, 2001. Determination of arsenic in seafood by focused microwave digestion and hydride generation-atomic fluorescence detection. Journal of AOAC International 84 (2), 551-555.
Villa-Bellosta R, Sorribas V, 2008. Role of rat sodium/phosphate cotransporters in the cell membrane transport of arsenate. Toxicology and Applied Pharmacology 232(1), 125-134.
von Ehrenstein OS, Guha Mazumder DN, Hira-Smith M, Ghosh N, Yuan Y, Windham G, Ghosh A, Haque R, Lahiri S, Kalman D, Das S, Smith AH, 2006. Pregnancy outcomes, infant mortality, and arsenic in drinking water in West Bengal, India. American Journal of Epidemiology 163 (7), 662-669.
von Ehrenstein OS, Poddar S, Yuan Y, Mazumder DG, Eskenazi B, Basu A, Hira-Smith M, Ghosh N, Lahiri S, Haque R, Ghosh A, Kalman D, Das S, Smith AH, 2007. Children's intellectual function in relation to arsenic exposure. Epidemiology 18 (1), 44-51.
Waalkes MP, Liu J, Diwan BA, 2007. Transplacental arsenic carcinogenesis in mice. Toxicology and Applied Pharmacology 222 (3), 271-280.
Waalkes MP, Liu J, Germolee DR, Trempus CS, Cannon RE, Tokar EJ, Tennant RW, Ward JM, Diwan BA, 2008. Arsenic exposure in utero exacerbates skin cancer response in adulthood with contemporaneous distortion of tumor stem cell dynamics. Cancer Research 68 (20), 8278-8285.

Arsenic in food
181 EFSA Journal 2009; 7(10):1351
Waalkes MP, Liu J, Ward JM, Diwan BA, 2004a. Animal models for arsenic carcinogenesis: inorganic arsenic is a transplacental carcinogen in mice. Toxicology and Applied Pharmacology 198 (3), 377-384.
Waalkes MP, Liu J, Ward JM, Diwan BA, 2006a. Enhanced urinary bladder and liver carcinogenesis in male CD1 mice exposed to transplacental inorganic arsenic and postnatal diethylstilbestrol or tamoxifen. Toxicology and Applied Pharmacology 215 (3), 295-305.
Waalkes MP, Liu J, Ward JM, Powell DA, Diwan BA, 2006b. Urogenital carcinogenesis in female CD1 mice induced by in utero arsenic exposure is exacerbated by postnatal diethylstilbestrol treatment. Cancer Research 66 (3), 1337-1345.
Waalkes MP, Ward JM, Liu J, Diwan BA, 2003. Transplacental carcinogenicity of inorganic arsenic in the drinking water: induction of hepatic, ovarian, pulmonary, and adrenal tumors in mice. Toxicology and Applied Pharmacology 186 (1), 7-17.
Waalkes MP, Ward JM, Diwan BA, 2004b. Induction of tumors of the liver, lung, ovary and adrenal in adult mice after brief maternal gestational exposure to inorganic arsenic: promotional effects of postnatal phorbol ester exposure on hepatic and pulmonary, but not dermal cancers. Carcinogenesis 25 (1), 133-141.
Walter I, Schwerdtle T, Thuy C, Parsons JL, Dianov GL, Hartwig A, 2007. Impact of arsenite and its methylated metabolites on PARP-1 activity, PARP-1 gene expression and poly(ADP-ribosyl)ation in cultured human cells. DNA Repair 6 (1), 61-70.
Wang A, Holladay SD, Wolf DC, Ahmed SA, Robertson JL, 2006. Reproductive and developmental toxicity of arsenic in rodents: A review. International Journal of Toxicology 25 (5), 319-331.
Wang A, Kligerman AD, Holladay SD, Wolf DC, Robertson JL, 2009c. Arsenate and dimethylarsinic acid in drinking water did not affect DNA damage repair in urinary bladder transitional cells or micronuclei in bone marrow. Environmental and Molecular Mutagenesis, ahead of print, doi:10.1002/em.20496.
Wang A, Wolf DC, Sen B, Knapp GW, Holladay SD, Huckle WR, Caceci T, Robertson JL, 2009b. Dimethylarsinic acid in drinking water changed the morphology of urinary bladder but not the expression of DNA repair genes of bladder transitional epithelium in F344 rats. Toxicologic Pathology 37 (4), 425-437.
Wang SX, Wang ZH, Cheng XT, Li J, Sang ZP, Zhang XD, Han LL, Qiao XY, Wu ZM, Wang ZQ, 2007. Arsenic and fluoride exposure in drinking water: c’ildren's IQ and growth in Shanyin county, Shanxi province, China. Environmental Health Perspectives 115, 643-647.
Wang TS, Chung CU, Wang ASS, Bau DT, Samikkannu T, Jan KY, Cheng YM, Lee TC, 2002a. Endonuclease III, formamidopyrimidine-DNA glycosylase, and proteinase K additively enhance arsenic-induced DNA strand breaks in human cells. Chemical Research in Toxicology 15 (10), 1254-1258.
Wang Y, Li S, Piao F, Hong Y, Lin P, Zhao Y, 2009a. Arsenic down-regulates the expression of Camk4, an important gene related to cerebellar LTD in mice. Neurotoxicology and Teratology 31 (5), 318-322.
Wang ZY, 2001. Arsenic compounds as anticancer agents. Cancer Chemotherapy and Pharmacology 48, S72-S76.
Wanibuchi H, Yamamoto S, Chen H, Yoshida K, Endo G, Hori T, Fukushima S, 1996. Promoting effects of dimethylarsinic acid on N-butyl-N-(4-hydroxybutyl)nitrosamine-induced urinary bladder carcinogenesis in rats. Carcinogenesis 17 (11), 2435-2439.
Wasserman GA, Liu XH, Parvez F, Ahsan H, Factor-Litvak P, Kline J, Van Geen A, Slavkovich V, Lolacono NJ, Levy D, Cheng ZQ, Graziano JH, 2007. Water arsenic exposure and intellectual function in 6-year-old children in Araihazar, Bangladesh. Environmental Health Perspectives 115 (2), 285-289.

Arsenic in food
182 EFSA Journal 2009; 7(10):1351
Wasserman GA, Liu XH, Parvez F, Ahsan H, Factor-Litvak P, van Geen A, Slavkovich V, Lolacono NJ, Cheng ZQ, Hussain L, Momotaj H, Graziano JH, 2004. Water arsenic exposure and c’ildren's intellectual function in Araihazar, Bangladesh. Environmental Health Perspectives 112 (13), 1329-1333.
Watanabe C, Kawata A, Sudo N, Sekiyama M, Inaoka T, Bae M, Ohtsuka R, 2004. Water intake in an Asian population living in arsenic-contaminated area. Toxicology and Applied Pharmacology 198 (3), 272-282.
Watson WH, Yager JD, 2007. Arsenic: extension of its endocrine disruption potential to interference with estrogen receptor-mediated signaling. Toxicological Sciences 98 (1), 1-4.
Wei M, Wanibuchi H, Morimura K, Iwai S, Yoshida K, Endo G, Nakae D, Fukushima S, 2002. Carcinogenicity of dimethylarsinic acid in male F344 rats and genetic alterations in induced urinary bladder tumors. Carcinogenesis 23 (8), 1387-1397.
Welch AH, Lico MS, Hughes JL, 1988. Arsenic in the groundwater of the western United States. Ground Water 26 (3), 333-347.
WHO (World Health Organization), 2001. Arsenic and arsenic compounds, Environmental Health Criteria no 224, World Health Organization, Geneva.
WHO (World Health Organization), 2003. Instructions for electronic submission of data on chemical contaminants in food and the diet. Global Environment Monitoring System - Food Contamination Monitoring and Assessment Programme (GEMS/Food). Available from: http://www.who.int/foodsafety/publications/chem/en/gemsmanual.pdf, pp. 160.
WHO/IPCS (World Health Organization/ International Programme on Chemical Safety), 1981. Environmental Health Criteria 18, Arsenic.
WHO/IPCS (World Health Organization/International Programme on Chemical Safety), 2008. Uncertainty and Data Quality in Exposure Assessment. Part 1: Guidance document on characterizing and communicating uncertainty in exposure assessment. Part 2: Hallmarks of data quality in chemical exposure assessment. Available from: http://www.who.int/ipcs/publications/methods/harmonization/exposure_assessment.pdf, pp. 175.
Wickre JB, Folt CL, Sturup S, Karagas MR, 2004. Environmental exposure and fingernail analysis of arsenic and mercury in children and adults in a Nicaraguan gold mining community. Archives of Environmental Health 59 (8), 400-409.
Wilhelm M, Pesch B, Wittsiepe R, Jakubis P, Miskovic P, Keegan T, Nieuwenhuijsen MJ, Ranft U, 2005. Comparison of arsenic levels fingernails with urinary As species as biomarkers of arsenic exposure in residents living close to a coal-burning power plant in Prievidza District, Slovakia. Journal of Exposure Analysis and Environmental Epidemiology 15 (1), 89-98.
Willhite CC, Ferm VH, 1984. Prenatal and developmental toxicology of arsenicals. Advances in Experimental Medicine and Biology 177, 205-228.
Williams L, Schoof RA, Yager JW, Goodrich-Mahoney JW, 2006a. Arsenic bioaccumulation in freshwater fishes. Human and Ecological Risk Assessment 12 (5), 904-923.
Williams PN, Islam MR, Adomako EE, Raab A, Hossain SA, Zhu YG, Feldmann J, Meharg AA, 2006b. Increase in rice grain arsenic for regions of Bangladesh irrigating paddies with elevated arsenic in groundwaters. Environmental Science & Technology 40 (16), 4903-4908.
Williams PN, Price AH, Raab A, Hossain SA, Feldmann J, Meharg AA, 2005. Variation in arsenic speciation and concentration in paddy rice related to dietary exposure. Environmental Science & Technology 39 (15), 5531-5540.
Williams PN, Villada A, Deacon C, Raab A, Figuerola J, Green AJ, Feldmann J, Meharg AA, 2007. Greatly enhanced arsenic shootassimilation in rice leads to elevated grain levels compared to wheat and barley. Environmental Science & Technology 41, 6854-6859.

Arsenic in food
183 EFSA Journal 2009; 7(10):1351
Wood JM, 1974. Biological cycles for toxic elements in the environment. Science 183 (129), 1049-1052.
Wu MM, Kuo TL, Hwang YH, Chen CJ, 1989. Dose-response relation between arsenic concentration in well water and mortality from cancers and vascular diseases. American Journal of Epidemiology 130 (6), 1123-1132.
Wu D, Zhou G, Xu R, Chen G, Dai G, Zhang H, Zang F, Gao T, Yang F, 1992. The investigation of arsenism caused by high arsenic content driking water in Huhhot. Neimenggu Difangbing Fangzhiyanjiu 17, 150-153 (in Chinese).
Wu MM, Chiou HY, Ho IC, Chen CJ, Lee TC, 2003. Gene expression of inflammatory molecules in circulating lymphocytes from arsenic-exposed human subjects. Environmental Health Perspectives 111 (11), 1429-1438.
Wu MM, Chiou HY, Wang TW, Hsueh YM, Wang IH, Chen CJ, Lee TC, 2001. Association of blood arsenic levels with increased reactive oxidants and decreased antioxidant capacity in a human population of northeastern Taiwan. Environmental Health Perspectives 109 (10), 1011-1017.
Xia Y, Wade TJ, Wu K, Li Y, Ning Z, Le XC, He X, Chen B, Feng Y, Mumford JL, 2009. Well water arsenic exposure, arsenic induced skin-lesions and self-reported morbidity in Inner Mongolia. International Journal of Environmental Research and Public Health 6 (3), 1010-1025.
Xie Y, Liu J, Benbrahim-Tallaa L, Ward JM, Logsdon D, Diwan BA, Waalkes MP, 2007. Aberrant DNA methylation and gene expression in livers of newborn mice transplacentally exposed to a hepatocarcinogenic dose of inorganic arsenic. Toxicology 236, 7-15.
Xie Y, Trouba KJ, Liu J, Waalkes MP, Germolec DR, 2004. Biokinetics and subchronic toxic effects of oral arsenite, arsenate, monomethylarsonic acid, and dimethylarsinic acid in v-Ha-ras transgenic (Tg.AC) mice. Environmental Health Perspectives 112 (12), 1255-1263.
Xu Y, Wang Y, Zheng Q, Li X, Li B, Jin Y, Sun X, Sun G, 2008. Association of oxidative stress with arsenic methylation in chronic arsenic-exposed children and adults. Toxicology and Applied Pharmacology 232 (1), 142-149.
Yadav RS, Sankhwar ML, Shukla RK, Chandra R, Pant AB, Islam F, Khanna VK, 2009. Attenuation of arsenic neurotoxicity by cucumin in rats. Toxicology and Applied Pharmacology, in press, doi:10.1016/j.taap.2009.1007.1017.
Yamamoto S, Konishi Y, Matsuda T, Murai T, Shibata MA, Matsuiyuasa I, Otani S, Kuroda K, Endo G, Fukushima S, 1995. Cancer induction by an organic arsenic compound, dimethylarsinic acid (Cacodylic acid), in F344/DUCRJ rats after pretreatment with 5 carcinogens. Cancer Research 55 (6), 1271-1276.
Yamanaka K, Hasegawa A, Sawamura R, Okada S, 1989. Dimethylated arsenics induce dna strand breaks in lung via the production of active oxygen in mice. Biochemical and Biophysical Research Communications 165 (1), 43-50.
Yamanaka K, Hasegawa A, Sawamura R, Okada S, 1991. Cellular-response to oxidative damage in lung induced by the administration of dimethylarsinic acid, a major metabolite of inorganic arsenics, in mice. Toxicology and Applied Pharmacology 108 (2), 205-213.
Yamanaka K, Hayashi H, Tachikawa M, Kato K, Hasegawa A, Oku N, Okada S, 1997. Metabolic methylation is a possible genotoxicity-enhancing process of inorganic arsenics. Mutation Research-Genetic Toxicology and Environmental Mutagenesis 394 (1-3), 95-101.
Yamanaka K, Hoshino M, Okamoto M, Sawamura R, Hasegawa A, Okada S, 1990. Induction of DNA damage by dimethylarsine, a metabolite of inorganic arsenics, is for the major part likely due to its peroxyl radical. Biochemical and Biophysical Research Communications 168 (1), 58-64.

Arsenic in food
184 EFSA Journal 2009; 7(10):1351
Yamanaka K, Kato K, Mizoi M, An Y, Takabayashi F, Nakano M, Hoshino M, Okada S, 2004. The role of active arsenic species produced by metabolic reduction of dimethylarsinic acid in genotoxicity and tumorigenesis. Toxicology and Applied Pharmacology 198 (3), 385-393.
Yamanaka K, Katsumata K, Ikuma K, Hasegawa A, Nakano M, Okada S, 2000. The role of orally administered dimethylarsinic acid, a main metabolite of inorganic arsenics, in the promotion and progression of UVB-induced skin tumorigenesis in hairless mice. Cancer Letters 152 (1), 79-85.
Yamanaka K, Okada S, 1994. Induction of lung-specific dna-damage by metabolically methylated arsenics via the production of free-radicals. Environmental Health Perspectives 102, 37-40.
Yamanaka K, Takabayashi F, Mizoi M, An Y, Hasegawa A, Okada S, 2001. Oral exposure of dimethylarsinic acid, a main metabolite of inorganic arsenics, in mice leads to an increase in 8-oxo-2'-deoxyguanosine level, specifically in the target organs for arsenic carcinogenesis. Biochemical and Biophysical Research Communications 287 (1), 66-70.
Yamashita N, Doi M, Nishio M, Hojo H, Tanaka M, 1972. Recent observations of Kyoto children poisoned by arsenic tainted "Morinaga Dried Milk". Japanese Journal of Hygiene 27 (4), 364-399.
Yang CY, Chang CC, Chiu HF, 2008. Does Arsenic exposure Iincrease the risk for prostate cancer? Journal of Toxicology and Environmental Health-Part A-Current Issues 71 (23), 1559-1563.
Yang CY, Chang CC, Tsai SS, Chuang HY, Ho CK, Wu TN, 2003. Arsenic in drinking water and adverse pregnancy outcome in an arseniasis-endemic area in northeastern Taiwan. Environmental Research 91 (1), 29-34.
Yang HT, Chou HJ, Han BC, Huang SY, 2007. Lifelong inorganic arsenic compounds consumtion affected blood pressure in rats. Food and Chemical Toxicology 45 (2), 2479-2487.
Yilmaz Y, Armagan E, Olmez O, Esen M, Alkis N, Dolar E, 2009. Acute arsenic self-poisoning for suicidal purpose in a dentist: a case report. Human & Experimental Toxicology 28 (1), 63-65.
Yoshida T, Yamauchi H, Sun GF, 2004. Chronic health effects in people exposed to arsenic via the drinking water: dose-response relationships in review. Toxicology and Applied Pharmacology 198 (3), 243-252.
Yost LJ, Schoof RA, Aucoin R, 1998. Intake of inorganic arsenic in the North American diet. Human and Ecological Risk Assessment 4, 137-152.
Yost LJ, Tao SH, Egan SK, Barraj LM, Smith KM, Tsuji JS, Lowney YW, Schoof RA, Rachman NJ, 2004. Estimation of dietary intake of inorganic arsenic in US children. Human and Ecological Risk Assessment 10 (3), 473-483.
Yu DH, 1999a. A physiologically based pharmacokinetic model of inorganic arsenic. Regulatory Toxicology and Pharmacology 29 (2), 128-141.
Yu DH, 1999b. A pharmacokinetic modeling of inorganic arsenic: A short-term oral exposure model for humans. Chemosphere 39 (15), 2737-2747.
Yuan C, Gao E, He B, Jiang G, 2007. Arsenic species and leaching characters in tea (Camellia sinensis). Food and Chemical Toxicology 45 (12), 2381-2389.
Zaldívar R, Guillier A, 1977. Environmental and clinical investigations on endemic chronic arsenic poisoning in infants and children. Zentralblatt fur Bakteriologie, Parasitenkunde, Infektionskrankheiten und Hygiene. Erste Abteilung Originale. Reihe B: Hygiene, präventive Medizin 165 (2), 226-234.
Zaldívar R, Prunes L, Ghai GL, 1981. Arsenic dose in patients with cutaneous carcinomata and hepatic hemangio-endothelioma after environmental and occupational exposure. Archives of Toxicology 47 (2), 145-154.
Zhang QY, Mao JH, Liu P, Huang QH, Lu J, Xie YY, Weng L, Zhang Y, Chen Q, Chen SJ, Chen Z, 2009. A systems biology understanding of the synergistic effects of arsenic sulfide and Imatinib in

Arsenic in food
185 EFSA Journal 2009; 7(10):1351
BCR/ABL-associated leukemia. Proceedings of the National Academy of Sciences of the United States of America 106 (9), 3378-3383.
Zhao CQ, Young MR, Diwan BA, Coogan TP, Waalkes MP, 1997. Association of arsenic-induced malignant transformation with DNA hypomethylation and aberrant gene expression. Proceedings of the National Academy of Sciences of the United States of America 94 (20), 10907-10912.
Zhou X, Sun H, Ellen TP, Chen HB, Costa M, 2008. Arsenite alters global histone H3 methylation. Carcinogenesis 29 (9), 1831-1836.
Zierold KM, Knobeloch L, Anderson H, 2004. Prevalence of chronic diseases in adults exposed to arsenic-contaminated drinking water. American Journal of Public Health 94, 1936-1937.

Arsenic in food
186 EFSA Journal 2009; 7(10):1351
APPENDIX
A. BENCHMARK DOSE MODELLING OF DERMAL LESIONS
The US EPA’s benchmark dose software software (BMDS) version 2.0 was used (US EPA, 2008)31 for modelling the incidence of skin lesions in the following three human studies on dermal lesions (see Table 36):
Ahsan et al. (2006), Bangladesh, cross sectional study
Rahman et al. (2006a), Bangladesh, case referent study
Xia et al. (2009), Mongolia, case control study
The models available in the BMDS, model fitting characteristics and goodness-of-fit statistics, and methods comparing the models in order to decide which one to use for obtaining the benchmark dose lower confidence limit (BMDL01) are outlined below. The following eight dose-response models were fitted to the dose-incidence data:
• Probit
• Log-Probit
• Logistic
• Log-logistic
• Weibull
• Multistage
• Quantal-Linear
• Gamma-Multihit
The (benchmark dose) BMD01 and BMDL01 values for an extra 1 % risk were calculated using the BMDS software by fitting each of the above eight models. The Scientific Opinion of the EFSA (EFSA, 2009b) on the use of the benchmark dose approach in risk assessment states that "ideally the BMR would reflect an effect size that is negligible or non-adverse" but also constraints this proposal by requiring " that the benchmark dose response (BMR) chosen should not be too small to avoid having to estimate a BMD by extrapolation outside the range of observation". Since the dermal lesion data of the three studies above range from low background exposure to high exposure of several hundreds of µg arsenic/L this criterion allows in principle usage of the BMD01. However, by using a low exposure reference group (e.g. the lowest quintile of the study population) the human studies authors’ also indicate by their analysis that lowest group can be considered as a group of background exposure. Therefore, a choice of the BMR leading to a BMD in – or at least in the lower part of – the lowest dose group of the study used may be too low.
In general, the Scientific Opinion of the EFSA proposed a BMR=10 % as default for quantal data (EFSA, 2009b). That choice considered, in particular, experimental animal data where the number of individuals per dose group would be usually 50 or less. The three studies on dermal lesions had sample sizes of about one order of magnitude higher, such that a BMR=1 % was considered to be 31 http://www.epa.gov/ncea/bmds/about.html

Arsenic in food
187 EFSA Journal 2009; 7(10):1351
applicable. Therefore, a BMR=1 % was used to calculated a BMD and BMDL value and the location of the value of the BMD was put in relation to the location of the lowest dose group, i.e. respectively the reference group of the calculation of odds ratios (ORs) or relative risks of the three human studies.
Constraints of model parameters e.g. avoiding infinite slopes of the fitted dose-response curve at dose zero are addressed in the Scientific Opinion of the EFSA, but without giving further advice. BMDS allows restricting the slope of the dose-response model at zero to values not larger than 1 to avoid an infinite slope at dose zero (see the current manual of BMDS2.0/2.1). The default is to constrain the slope to value not larger than 1.
Acceptability of a model was assessed using the likelihood ratio test versus the full model and versus the reduced model in each model fit:
• The full model is the model that does not assume any dose-response function (its parameters are simply the frequencies per dose level).
• The reduced model is the model with no dose-relationship (it is a straight line parallel to the dose axis representing mean exposure of the total sample).
The following analysis was performed such that the fit of the chosen model:
• should be statistically significantly better than the reduced model (p<0.05);
• should be not significantly worse then the full model (p>0.1). However, in the current evaluations a cut off of p=0.01, instead of 0.1, was chosen to account for the large sample size of the three Asian studies since the larger than usual size provides a high power to test for statistical significance between model fit. The larger sample size allows detecting differences in modelling which may be not be detected or may be not substantial, and which are hard to see when comparing the fitted curves visually.
Since the likelihood ratio test can not be applied for comparing the eight non-nested models, the Akaike information criterion (AIC) was used as an approximate criterion for comparing the fits of non-nested models (Falk Filipsson et al., 2003). Statistics for the suitability of the fit as provided by the BMDS software are reported. Note, that the lower the chi-square value and the higher the calculated p-value to reject the model the better the fit. Consistency in the outcome of those criteria supports confidence for having chosen the best model.
The presentation of the results follows the scheme used by the CONTAM Panel in the Scientific opinion on polycyclic aromatic hydrocarbons in food (EFSA, 2008b).
The BMD01 and BMDL01 values, as well as the associated statistics for the models used, are presented in Tables A1-A3 below. For comparison, BMD05 and BMDL05 and BMD10 and BMDL10 are also presented for the chosen best fitting model (Tables A1-A3).
As default the slope parameter (i.e. the parameter ß of the dichotomous models) was restricted to values not smaller than 1 when using the BMDS software. As noted in the comments to BMDS version 2.0 software (BMDS 2.0 Help) a slope parameter ß allowed to be less than 1 would cause an infinite slope at dose zero. However, the models were also fitted without that default restriction on the slope parameter ß, respectively the slope of the e dose-response curve at dose zero. Not restricting the fit lead in general to BMDs of about one order of magnitude lower and a difference between the BMD and BMDL of sometimes more than one order of magnitude. Note that the Scientific opinion of the EFSA (EFSA, 2009b) proposed “that as a general rule dose-response data should not result in a range of BMDL values from different accepted models that substantially exceed one order of magnitude”. Models with unrestricted slope parameter ß were considered for the calculation of the BMD01 and BMDL01 by the CONTAM Panel when none of restricted models provided a reasonable fit. That was e.g. the case when the data of Xia et al (2009) were analysed.

Arsenic in food
188 EFSA Journal 2009; 7(10):1351
The data used for the BMD evaluation of skin lesions were selected from Table 36 of the main document. Tables 40-42 in the main document present the dose response data as they were used for calculating the BMD and BMDL with the BMDS version 2.0 software. Note that for the study of Ahsan et al. (2006) this analysis used the dose-response data combined for males and females as used by Schuhmacher-Wolz et al. (2009), see their Table 10. BMDS-graphics are given for the best fitting model only (Figures A1-A3).
For the data of the three dermal lesion studies, when the Multistage, the Quantal Linear or the Gamma-Multihit model give results identical to those obtained for the Weibull model, the results were not listed (Tables A1-A3, below).
Table A1: BMD01 and BMDL01 calculations for skin lesion data of Ahsan et al. (2006) based on the number of all persons examined and the number of patients with lesions as shown in Table 40. For comparison the BMD/BMDL for BMR=5 % (BMR05) and 10 % (BMR10) for the best fitting model are reported in italics. The best fitting model is indicated in bold.
Model BMR Log likely-
hood
p-value AIC Chi-square
value
p-value Accepted
model
BMD
µg/L
BMDL
µg/L
Full model 01 2508.1
Probit 01 2519.2 10-5 5042.3 21.52 0.0001 no 45.94 42.16
Log-Probit 01 2531.7 10-10 5067.3 45.21 <10-5 no 102.90 94.22
Logistic 01 2530.1 10-5 5044.2 23.26 <10-5 no 49.42 45.61
Log-Logistic 01 2513.3 0.015 5030.6 10.56 0.014 yes 26.47 22.92
Log-Logistic 05 137.9 119.44
Log-Logistic 10 291.12 252.14
Weibull 01 2513.7 0.0105 5031.4 11.53 0.010 yes 27.67 24.09
Reduced model 01 2588.8
Log-Logistic(a) 01 2509.1 0.35 5024.3 2.06 0.36 yes 5.08 0.64
Log-Probit(a) 01 2509.2 0.33 5024.4 2.19 0.36 yes 8.26 1.83
Weibull(a) 01 2509.1 0.36 5024.2 2.04 0.26 yes 4.73 0.53
Gamma(a) 01 2509.1 0.36 5024.2 2.01 0.37 yes 4.41 0.43
Gamma(a) 05 84.37 38.79
Gamma(a) 10 302.22 241.96
Multi-stage(a) 01 2510.7 0.08 5027.3 5.08 0.08 yes 17.30 13.55 BMR: bench mark response; BMD: benchmark dose; BMDL: benchmark dose lower confidence limit; AIC: Akaike information criterion (a): Models with no slope restriction.
The calculated accepted (at the level of 0.01) BMD01 values ranged from 26.47 to 27.67 µg/L with the best fit being 26.47 µg/L for models with a slope restricted as of being not larger than 1 at the zero dose. The BMDL01 values ranged from 22.92 to 24.09 µg/L with 22.92 µg/L representing the best fit.
All models allowing for non-restricted slopes were acceptable at the level of 0.01 with BMD01 values ranging between 4.41 and 17.30 µg/L with best fit being 4.41 and 4.73. The BMDL01 values ranged from 13.55 to 0.43 µg/L with best fit values 0.53 and 0.43 µg/L, respectively. These BMDL01 values were all below or near the lowest dose level of 1.8 µg/L which was the dose level of the reference group, i.e. the lowest dose of the BMD analysis of the data of that human study. Because of concerns using a model with infinite slope at zero dose when at the same time the BMDL is within the lowest dose group including the zero dose, these BMDLs were not used for deriving a references point. Thus, the BMDL01 of 22.92 µg/L was chosen for this human study.

Arsenic in food
189 EFSA Journal 2009; 7(10):1351
Because the exposure data were in concentrations in drinking water the CONTAM Panel decided that the results should be expressed as a benchmark concentration (BMC) and its lower confidence limit (BMCL). Thus, the BMC01 of 26.47 µg/L and the BMCL01 of 22.92 µg/L were chosen for the Ahsan et al. (2006) study.
Figure A1: Fitted log-logistic model to the Ahsan et al. (2006) data with BMD01 and BMDL01

Arsenic in food
190 EFSA Journal 2009; 7(10):1351
Table A2: BMD01 and BMDL01 calculations for dermal lesion data of Rahman et al. (2006a) based on the data of Table 41.
Model BMR Log likely-
hood
p-value AIC Chi-square
value
p-value Accepted
model
BMD
µg/L
BMDL
µg/L
Full model 01 3436
Probit 01 3441 0.02 6886 9.08 0.03 no 733 636
Log-Probit 01 failed
Logistic 01 3441 0.02 6886 9.64 0.02 no 706 616
Log-Logistic 01 3438 0.16 6881 5.08 0.17 yes 1156 897
Weibull 01 3438 0.16 6881 5.09 0.16 yes 1152 895
Gamma 01 3438 0.16 6881 5.09 0.17 yes 1152 896
Multistage 01 3438 0.16 6881 5.09 0.17 yes 1152 804
Log-Logistic(a) 01 3438 0.020 6881 3.34 0.19 yes 2046 1031
Log-Probit(a) 01 3438 0.18 6881 3.52 0.17 yes 2449 1160
Weibull(a) 01 3437 0.20 6881 3.3 0.19 yes 2040 1029
Gamma(a) 01 3437 0.20 6881 3.34 0.19 yes 2028 1028
Multi-stage(a) 01 failed BMR: benchmark response; BMD: benchmark dose; BMDL: benchmark dose lower confidence limit; AIC: Akaike information criterion (a): unconstraint models.
The calculated accepted BMD01 and BMDL01 values were larger than 1100 µg/L and 800 µg/L, respectively; i.e. larger than the dose level of 400 µg/L used for the largest exposure group. Note that the BMD analysis was based on extremely low prevalences ranging between 0.1 % and 0.5 %.
Because the exposure data were in concentrations in drinking water the results should be expressed as a BMC and BMCL.

Arsenic in food
191 EFSA Journal 2009; 7(10):1351
Figure A2: Fitted log-logistic constraint (upper figure a) and unconstraint (lower figure b) model to the Rahman et al. (2006a) data with BMD01 and BMDL01

Arsenic in food
192 EFSA Journal 2009; 7(10):1351
Table A3: BMD01 and BMDL01 calculations for dermal lesion data of Xia et al. (2009) based on the number of referent persons and the number of patients with lesions as shown in Table 42. For comparison the BMD/BMDL for BMR=5 % (BMR05) and 10 % (BMR10) for the best fitting model are reported in italics. The best fitting model is indicated in bold.
Model BMR Log likely-
hood
p-value AIC Chi-square
value
p-value Accepted
model
BMD
µg/L
BMDL
µg/L
Full model 01 2316.4
Probit 01 2368.9 10-21 4741.8 95.45 <10-5 no 39.27 35.08
Log-Probit(a) 01
Logistic 01 2371.6 10-22 4747.2 99.71 <10-5 no 44.56 39.54
Log-Logistic 01 2349.1 10-13 4702.3 62.47 <10-5 no 16.53 13.91
Log-Logistic 05 86.15 72.29
Log-Logistic 10 181.87 153.04
Weibull 01 2351.2 10-13 4706.5 66.33 <10-5 no 18.15 15.37
Reduced model 01 2414.65
Log-Logistic(b) 01 2321.2 0.083 4646.4 9.46 0.09 yes 0.35 0.18
Log-Probit(b) 01 2319.8 0.24 4643.5 6.64 0.25 yes 0.56 0.31
Log-Probit(b) 05 19.79 16.47
Log-Probit(b) 10 132.24 105.23
Weibull(b) 01 2321.6 0.06 4647.2 10.14 0.07 yes 0.32 0.16
Gamma(a) 01
Multi-stage(c) 01 BMR: benchmark response; BMD: benchmark dose; BMDL: benchmark dose lower confidence limit; AIC: Akaike information criterion (a): non convergence (b): Models with no slope restriction (c): Fit was not possible, time overflow
No model was identified giving an acceptable (at the level of p>0.01) BMD01 value for models when using the restriction on the slope parameter ß to be not smaller than 1 (such avoiding an infinite slope at dose zero). The best fitting but not acceptable model was the log-logistic model with a BMDL01 value of 13.91. Because of that lack of fit of the restricted models and the much better fit of the unrestricted models the unretsricetd models were used for deriving a BMD and BMDL for the Xia et al. (2009) data.
All models allowing for non-restricted slopes and which could be fitted to the data were acceptable at the level of 0.01 with BMD01 values ranging between 0.56 and 0.32 µg/L with best fit being 0.56 µg/L. The BMDL01 values ranged from 0.31 to 0.16 µg/L with best fit value 0.31 µg/L. All these BMDL01 values were below the lowest dose level of 2.5 µg/L which was the dose level of the reference group and the lowest dose of the BMD analysis of the data of the Xia et al. (2009) study. The BMDL01 of 0.31 µg/L was chosen for this human study. Because the exposure data were in concentrations in drinking water the results should be expressed as a BMC and BMCL. The BMC01 of 0.56 µg/L and the BMCL01 of 0.31 µg/L were chosen for the Xia et al. (2009) study.

Arsenic in food
193 EFSA Journal 2009; 7(10):1351
Figure A3: Not acceptable log-logistic model (upper figure a) and acceptable and used log-probit model (lower figure b) fitted to the Xia et al. (2009) data with BMD01 and BMDL01

Arsenic in food
194 EFSA Journal 2009; 7(10):1351
ABBREVIATIONS 5FU 5-Fluorouracil
8-OHdG Urinary 8-hydroxy-2’-deoxyguanosine
AAS Atomic absorption spectrometry
AB Arsenobetaine
AC Arsenocholine
ACE Angiotensin-converting enzyme
AFS Atomic fluorescence spectrometry
AIC Akaike information criterion
ALARP As low as reasonably practicable
AMPA alpha-amino-3-hydroxy-5-methylisoxazole-4-propionate
AP-1 Activator protein-1
As(III) Arsenite/ arsenous acid
As3MT As-methyltransferase
As(V) Arsenate/ arsenic acid
AT Austria
ATSDR Agency for Toxic Substances and Disease Registry
BAF Bioaccumulation factor
BBN Beta binomial-normal
BCF Bioconcentration factor
BE Belgium
BER base excision repair
BFD Black foot disease
BG Bulgaria
BMC Benchmark concentration
BMCL Benchmark concentration lower confidence limit
BMD Benchmark dose
BMDL Benchmark dose lower confidence limit
BMDS Benchmark dose software
BMI
BMR
Body mass index
Benchmark dose response
BPDE Benzo[a]pyrene diolepoxide
BRAC Bangladesh Rural Advancement Committee
b.w. Body weight
CA1 cornu ammoni (=ammons horn, specific anatomic area (1) in the hippocampus

Arsenic in food
195 EFSA Journal 2009; 7(10):1351
CC Chest circumference
CCA chromated copper arsenate (CrO3 CuO As2O5)
CAMA
CCA
calcium acid methanearsonate
chromated copper arsenate (CrO3 CuO As2O5)
CEN European Committee for Standardization
CHD Coronary heart disease
CI Confidence interval
CONTAM Panel Panel on Contaminants in the Food Chain
COT The Committee on Toxicity of Chemicals in Food, Consumer Products and the Environment
CpG Cytosine-phosphate-guanine
CPM Coloured progressive matrices
CRM Certified reference material
CVD Cardiovascular disease
CZ Czech Republic
DATEX Data Collection and Exposure Unit, European Food Safety Authority
DE Germany
DK Denmark
DMA Dimethylarsinate/ dimethylarsinic acid
DMA(III) Dimethylarsinite/ dimethylarsinous acid
DMBA 9,10 dimethyl 1-2-benzanthracene
DNA Deoxyribonucleic acid
DSMA disodium methanearsonate
DSS Digit span subtest
EC European Commission
ED01 The exposure dose at which there is a 1 % increased response in the study population
EE Estonia
EFSA European Food Safety Authority
EPIC The European Prospective Investigation into Cancer and Nutrition
ER-alfa estrogen receptor-alfa
ERM European reference material
ERCC1 Excision repair cross-complementation group 1 protein/gen
ET-AAS Electrothermal-atomic absorption spectrometry
ES Spain
EU European Union
FAO/WHO Food and Agriculture Organization/ World Health Organization

Arsenic in food
196 EFSA Journal 2009; 7(10):1351
FDA Food and Drug Administration (United States)
fEPSP Field potential from the Schaffer collateral-CA1 synapse
FI Finland
FL Foetal loss (miscarriage + stillbirth)
FR France
FSA Food Standards Agency (United Kingdom)
GB Great Britain
GD Gestation day
GEMS/Food World Health Organisation Global Environment Monitoring System – Food Contamination Monitoring and Assessment Programme
GESAMP The Group of Experts on Scientific Aspects of Marine Environmental Protection
GFAAS Graphite furnace atomic absorption spectrometry
GI Gastrointestinal
GIS Geographic informatic system
GSH Glutathione
GST Glutathione-S-transferase
GTP Guanosine triphosphate
H Hyperpigmentation
H2O2 hydrogen peroxide
HBD-1 human β-defensin-1
HC Head circumference
HCC hepatocellular carcinomas
HG Hydride generation
HG-AAS Hydride generation-atomic absorption spectrometry
HG-AFS Hydride generation-atomic fluorescence spectrometry
HG-ICPAES Hydride generation-inductively coupled plasma atomic emission spectrometry
HG-ICPMS Hydride generation-inductively coupled mass spectrometry
HOS Human osteosarcoma
HPLC High performance liquid chromatography
HPRT Hypoxanthine guanine phosphor ribosyltransferase
HU Hungary
iAs Inorganic arsenic
IARC International Agency for Research on Cancer
ICPAES Inductively coupled atomic emission spectrometry
ICPMS Inductively coupled mass spectrometry
ICDDR,B International Centre for Diarrhoeal Disease Research, Bangladesh
ID Infant death

Arsenic in food
197 EFSA Journal 2009; 7(10):1351
IE Ireland
INRAN Istituto Nazionale di Ricerca per gli Alimenti e la Nutrizione
IOM Institute of Medicine
IQ Intellectual quotient
IRMM Institute for Reference Materials and Measurements (Belgium)
IRR Incidence rate ratio
IS Iceland
ISS Istituto Superiore di Sanità
IT Italy
JECFA Joint FAO/WHO Expert Committee on Food Additives
K Keratosis
l-DOPA Dihydroxyphenylalanine
LB Lower bound
LD50 Lethal dose– the dose required to kill half the members of a tested animal population
LOAEL Lowest observed adverse effect level
LOD Limit of detection
LOQ Limit of quantification
LTD Long-term deppression
LTP long-term potentiation
M Miscarriage
MA Methylarsonate/ methylarsonic acid
MA(III) Methylarsonite/ methylarsonous acid
MAP Microtubule-associated protein
MAPK mitogen-activated protein kinase
MCRA Monte Carlo Risk Assessment
ML Maximum level
MOE Margin of exposure
MRL Maximum residue level/Minimum risk to humans
MSMA sodium methanearsonate, arsenic acid
MT Metallothionein
MTHFR methylenetetrahydrofolate reductase
N Number of samples
ND Neonatal death
NER Nucleotide excision repair
NF-L neurofilament-light subunit
NFκB nuclear factor-κB

Arsenic in food
198 EFSA Journal 2009; 7(10):1351
NIST The National Institute of Standards and Technology (USA)
NL The Netherlands
NMDA N-methyl-D-aspartate
NMSC Non-melanoma skin cancer risk
NO Nitric oxide/ Norway
NOAEL No observed adverse effect level
NPIRS The National Pesticide Information Retrieval System
NRC The National Research Council
NRCC The National Research Council of Canada (Canada)
NS Non significant
ogg1 8-oxoguanine glycosylase 1
OGGT Oral glucose tolerance test
OR Odds/ risk ratio
OSPAR The Convention for the Protection of the Marine Environment of the North-East Atlantic
P5/P95 5th/95th percentile
PAD Peripheral artery disease
PBL Peripheral bllod leukocyte
PBMC Peripheral blood mononuclear cells
PBPK Physiologically Based Pharmacokinetic (modelling)
PL Poland
PMI Primary methylation index
PMTDI Provisional maximum tolerable daily intake
PND Postneonatal death
PNP Purine nucleoside phosphorylase
PPVT Peabody picture vocabulary test
PTWI Provisional tolerable weekly intake
REACH Registration, Evaluation, Authorisation and Restriction of Chemicals
RfD Reference dose
RIVM The Dutch National Institute for Public Health and the Environment
RNS Reactive nitrogen species
ROS Reactive oxygen species
RR Relative risk
US EPA SAB United States Environmental Protection Agency Science Advisory Board
SAF Sampling adjustment factor
SAM S-adenosylmethionine
SB Stillbirth

Arsenic in food
199 EFSA Journal 2009; 7(10):1351
SCC Squamous cell carcinoma
SCOOP The European Commission Scientific Cooperation Project
s.e. Standard error
SE Sweden
SIR Standardized incidence ratio
SK Slovak Republic
SMR Standardized mortality ratio
SNP Single-nucleotide polymorphism
SRM Standard reference material
TCC Transitional cell carcinoma
TDI Tolerable daily intake
TETRA Tetramethylarsonium ion
TGFα Transforming growth factor alpha
Thio-DMA Thio-dimethylarsinate
TK Thymidine kinase/ toxicokinetic
TMAO Trimethylarsine oxide
TMAP Trimethylarsoniopropionate
TPA Tumor promoter
UB Upper bound
UC Urothelial carcinoma
UK The United Kingdom
UNEP United Nations Environment Programme
US/USA United States/ United States of America
US EPA United States Environmental Protection Agency
USGS United States Geological Survey
UV Ultraviolet
VG Vapour generation
VMS Visual memory span
VSAFD Visual-spatial abilities with figure design
WHO/ICPS World Health Organization/ International Programme on Chemical Safety
WISC Wechsler Intelligence Scale for Children
WISC-RM Wechsler Intelligence Scale for Children Revised for Mexico