120227_Fairness Opinion Uster Technologies AG_e_v53.docx
38
Fairness Opinion: Uster Technologies AG 20 February 2012 Reliance Restricted Louis Siegrist Partner Hannes Schobinger, CFA Senior Manager Transaction Advisory Services Transaction Advisory Services T +41 58 286 21 31 T +41 58 286 42 91 M +41 58 289 21 31 M +41 58 289 42 91 F +41 58 286 30 25 F +41 58 286 30 25 E [email protected] E [email protected] Stéphanie Chaumier Manager Annick Winandy Senior Transaction Advisory Services Transaction Advisory Services T +41 58 286 59 49 T +41 58 286 55 41 M +41 58 289 59 49 M +41 58 289 55 41 F +41 58 286 30 25 F +41 58 286 30 25 E [email protected] E [email protected]
-
Upload
khangminh22 -
Category
Documents
-
view
5 -
download
0
Transcript of 120227_Fairness Opinion Uster Technologies AG_e_v53.docx

www.
Fairness Opinion: Uster Technologies AG 20 February 2012 Reliance Restricted
Louis Siegrist Partner
Hannes Schobinger, CFA Senior Manager
Transaction Advisory Services Transaction Advisory Services T +41 58 286 21 31 T +41 58 286 42 91 M +41 58 289 21 31 M +41 58 289 42 91 F +41 58 286 30 25 F +41 58 286 30 25 E [email protected] E [email protected] Stéphanie Chaumier Manager
Annick Winandy Senior
Transaction Advisory Services Transaction Advisory Services T +41 58 286 59 49 T +41 58 286 55 41 M +41 58 289 59 49 M +41 58 289 55 41 F +41 58 286 30 25 F +41 58 286 30 25 E [email protected] E [email protected]

Abbreviations
Abbreviations
20 February 2012 120227_Fairness Opinion Uster Technologies AG_e_v53.docx
AG Aktiengesellschaft, public company
BR Brazil
Capex Capital Expenditures
CAGR Compound annual growth rate
CAPM Capital Asset Pricing Model
CEO Chief Executive Officer
CFIB China Fiber Inspection Bureau
CHF Swiss Francs
CHF XXXk XXX thousand Swiss Francs
CN China
Corp. Corporation
CRP Country Risk Premium
cs Credit spread
D Debt ratio
DCF Discounted Cash Flow
DE Germany
DecXXA Actual figures as of December 20xx
E Equity ratio
EBIT Earnings before Interest and Taxes
EBITA Earnings before Interest Taxes and Goodwill Amortization
EBITDA Earnings before Interest Taxes Depreciation and Amortization
ERP Equity Risk Premium
EUR Euro
EV Enterprise Value
EY Ernst & Young Ltd.
FCF Free cash flow to the firm

Abbreviations
Abbreviations
20 February 2012 120227_Fairness Opinion Uster Technologies AG_e_v53.docx
FX Foreign Exchange Rates
FYXXA Actual figures for FYXX
FYXXB Budgeted figures for FYXX
GBP British Pounds
HR Human Resources
HX Semester X
i.e. id est
IN India
JP Japan
JPY Japanese Yen
kd Cost of debt
ke Cost of equity
Ltd. Limited
LTM Last twelve months
m Million(s)
M&A Mergers and Acquisitions
MRP Market Risk Premium
MX Mexico
n.a. not available
NV Naamloze Vennootschap, public company
OEM Original Equipment Manufacturer
P&L Profit and loss
P/E Price/earnings ratio
plc Public limited company
PPA Purchase price agreement
QX Quarter X

Abbreviations
Abbreviations
20 February 2012 120227_Fairness Opinion Uster Technologies AG_e_v53.docx
R&D Research and Development
rf Risk free rate
rs Interest swap rate
RSU Restricted stock unit
SA Société Anonyme
SEK Swedish Krona
SIX Swiss Exchange
sp Size premium
t Corporate income tax rate
TH Thailand
Toyota Toyota Industries Corporation
US United States
USD United States Dollar
USDA United States Department of Agriculture
Uster Technologies Uster Technologies AG
USTN Reuters Ticker, Uster Technologies AG
VWAP Volume Weighted Average Price
WACC Weighted Average Cost of Capital
wd Debt ratio
we Equity ratio
y-o-y year-on-year
βl Adjusted levered beta
βu Adjusted unlevered beta

Contents
Contents
20 February 2012 120227_Fairness Opinion Uster Technologies AG_e_v53.docx
Introduction 1
1. Background ..................................................................................................................................... 2
2. Our engagement .............................................................................................................................. 3
Business description 4
3. Company description ....................................................................................................................... 5
4. Financial results ............................................................................................................................... 8
5. Market overview ............................................................................................................................... 9
Valuation foundations 11
6. Valuation approach ........................................................................................................................ 12
Valuation analysis 13
7. Share price and liquidity analysis ................................................................................................... 14
8. Income approach: DCF valuation ................................................................................................... 16
9. Market approach: Multiples valuation ............................................................................................. 23
General assessment / fairness opinion 26
10. General assessment / fairness opinion ........................................................................................... 27
Appendix 28
11. Appendix A - Sources of information .............................................................................................. 29
12. Appendix B - Peer group ................................................................................................................ 30
13. Appendix C - Sensitivity analysis (DCF) ......................................................................................... 31
14. Appendix D - Market approach ....................................................................................................... 32

Introduction
20 February 2012 120227_Fairness Opinion Uster Technologies AG_e_v53.docx
1
Introduction
1. Background
2. Our engagement

Introduction : Background
Background
20 February 2012 120227_Fairness Opinion Uster Technologies AG_e_v53.docx
2
Public tender offer from Toyota for the remaining shares in Uster
Uster Technologies
� Uster Technologies (“Uster”) is an international manufacturer of high tech testing and measuring equipment for industrial textile quality control, from ‘fiber to fabric’. The company is headquartered in Uster, Switzerland.
� The shares of Uster are quoted on the SIX Swiss Exchange in Zurich since October 2007 (Reuters Ticker: USTN). As at 17 February 2012, 8.46 million shares, with a nominal value of CHF 9.4 per share, have been issued.
Evolution of events with respect to the proposed transaction
� On 8 November 2011, Toyota Industries Corporation (“Toyota”) issued a pre-announcement of a public tender offer of CHF 38 for one Uster share.1 The offer has been rejected by the Board of Directors of Uster on 8 November 2011.2
� On 9 February 2012, Toyota announced that all required merger control approvals have been obtained. The acquisition of the 21.88% stake in Uster from Groupe Alpha was closed on 15 February 2012.3 Since then, Toyota holds 50.34% of all Uster shares and is the controlling shareholder.
� On 20 February 2012 Toyota and Uster entered into a transaction agreement with the following elements4:
– Toyota agrees to increase the offering price from CHF 38.0 by CHF 6.0 to CHF 44.0 and Uster‘s board of director agrees to recommend to Uster’s shareholders to accept Toyota’s public tender offer.
– Toyota as shareholder agrees to approve a dividend of CHF 2.5 per Uster share, which will be proposed by the board of directors at the annual shareholder meeting on 12 April 2012.
– The proposed dividend of CHF 2.5 will not be accounted for as a dilution effect and will not reduce the offering price.
– Uster agrees to comply with the Best Price Rule.
1 http://www.toyota-industries.com/news/2011/uster_technologies/pdf/111108pre_announcement-e.pdf 2 http://www.uster.com/fileadmin/customer/Investors/Media_Release/2011/20111108_Media_Release_on_announcement_final_E.pdf 3 http://www.toyota-industries.com/news/2011/uster_technologies/pdf/120209release-e.pdf 4 http://www.toyota-industries.com/news/2011/uster_technologies/pdf/120221release-e.pdf
Company logo Source: Company homepage

Introduction : Our engagement
Our engagement
20 February 2012 120227_Fairness Opinion Uster Technologies AG_e_v53.docx
3
Preparation of a fairness opinion on the offering price
� In this context described on the previous page, the independent board committee of Uster has engaged Ernst & Young Ltd. Switzerland (“Ernst & Young” or “us”) to prepare a fairness opinion and to determine the business enterprise value of Uster and its implied share value as at 17 February 2012.
� The following Uster board members are members of the independent board committee:
– Max-Ulrich Zellweger, Chairman
– Dr .Barry James Mulady
– Dr. Geoffrey Scott
� The fairness opinion will be based on the offering price of CHF 44.0 plus the agreed dividend payment of CHF 2.5 per Uster share, amounting to a total value of CHF 46.5 per Uster share. As the dividend payments directly flow to the holder of an Uster share, it is considered an integrated part of the value of one Uster share for the purpose of this fairness opinion.
� Our engagement agreement with Uster dates 28 October 2011.
� This fairness opinion has been completed on 20 February 2012 and considered events and circumstances up to this date, including 2011 full year actual results of Uster.

Business description
20 February 2012 120227_Fairness Opinion Uster Technologies AG_e_v53.docx
4
Business description
3. Company description
4. Financial results
5. Market overview

Business description : Company description
Company description
20 February 2012 120227_Fairness Opinion Uster Technologies AG_e_v53.docx
5
Overview
� Founded in 1875, Uster has a workforce of 498 employees as at December 2011. The group is made of a number of operating entities throughout the world, as presented in the chart below.
Group structure - Uster Source: Company’s website
Uster Tech.US
Uster Technologies Ltd., CH
100%
Uster Tech. MX
Uster Tech.
TradingCN
Uster Tech. TH
Uster Tech. Pvt.
IN
Uster Tech.
DE
Uster Tech.CN
Uster Tech.
HoldingTH
Uster Tech.TR
Uster Tech.
JP
Uster Tech.
MarketingIN
Uster Tech.BR
49%1)49%
51%
(1) As requested by Thai law, 49% of the stock is owned directly and 51% is formally held by local stockholders.
� Our valuation has been performed on a consolidated basis.
� Since August 2011, Toyota increased its shareholding in Uster to 50.34% and is at present the majority shareholder.
Shareholder structure as at 20 February 2012 Shareholder Percentage of share capital held Toyota 50.34% Management 8.41% Other 41.25% Source: SIX Swiss Exchange homepage

Business description : Company description
Company description
20 February 2012 120227_Fairness Opinion Uster Technologies AG_e_v53.docx
6
� Uster offers testing and monitoring instruments, systems and services for controlling quality over the entire textile production process.
Textile value chain Source: Management information
Ginning Classing Spinning Weaving, Knitting
Dyeing, Finishing
Making up, sewing Retailing
� The company’s main clients are OEM, which account for approximately 62% of FY10A sales. The remaining revenues derive from fiber testing and classing (14.5%), laboratory yarn testing (11.0%) and after sales services (12.5%). The breakdown and evolution of net sales revenues is presented in the chart on the left.
� The company’s products include:
– INTELLIGIN and HVI Systems for ginning and cotton classing. USTER HVI 1000 classification is acknowledged as industry standard and Uster is the exclusive supplier for the United States Department of Agriculture (“USDA”) and the China Fiber Inspection Bureau (“CFIB”);
– HVI Systems and AFIS PRO for laboratory fiber testing;
– TESTER and CLASSIMAT for yarn testing;
– QUANTUM for yarn cleaning and LAB-ONLINE for Total Quality Monitoring;
– STATISTICS, a comprehensive database for quality measurement statistics, providing values used as industry benchmarks;
– CLASSIMAT, TENSORAPID, TENSOJET, and ZWEIGLE for fabric quality assurance;
– USTERIZED and INTELLIGENT SOURCING for intelligent sourcing;
– Integrated Data and Expert Systems and after sales services.
Evolution of sales by product category – FY07A – FY15F Source: 5 year planning 2011 – 2015, Bod Meeting September 15th 2011
10069
4082
120 107 109 112 115
41
42
34
19
27 33 37 40 40 23
25
11
15
27 19 21 25 29 22
19
16
17
18 17 17
17 18
0
50
100
150
200
250
FY07A FY08A FY09A FY10A FY11B FY12F FY13F FY14F FY15F
CHF
000
Yarn online Fiber Testing & Classing Yarn Testing After Sales / Services

Business description : Company description
Company description
20 February 2012 120227_Fairness Opinion Uster Technologies AG_e_v53.docx
7
Business model
� Uster has established a flexible business model, enabling to maintain high profitability. While core activities like key knowledge, systems and processes are kept in-house, component manufacturing and other non-key activities are outsourced. This allows Uster to manage cyclical shifts in demand, without negative impacts on profit margins.
� With three technology centres located in Switzerland, United States and China, seven regional sales and services companies and 50 agents, Uster is serving more than 4’000 customers in 75 countries.
� As shown in the graphic on the left, two thirds of Uster’s revenues in FY10A have been realised in Asia. As the major invoicing currency is Swiss Francs, Uster is not heavily exposed to fluctuations in foreign exchange rates.
� “White Area Projects”, listed in the table on the left, are projects in areas such as R&D, marketing or IT, aiming at improving group efficiency and supporting future growth, which can be realized at a flexible date in time.
Conclusion
The valuation of Uster has been performed on a consolidated basis.
Split of revenues by geographic area – FY10A Source: Capital IQ
Europe22%
Americas11%
Asia67%
Examples of White Area projects Corporate identity refresh with new product brochures Web site improvement Management development and training Renewal of the Intranet to further improve internal communication SAP implementation in subsidiaries Implementation of a budget software Global standardization of HR procedures Source: Management information

Business description : Financial results
Financial results
20 February 2012 120227_Fairness Opinion Uster Technologies AG_e_v53.docx
8
Historical figures5
Revenues
� During the first six months of 2011, Uster realised net revenues of CHF 105.6m, i.e. a sales growth of 72.2% compared to prior year figures (6M10A), driven mainly by increased demand from and on-going modernisation by Asian textile marketers, and high demand for the Uster QUANTUM3, launched in Q3 2010.
� Uster’s sales have not been affected by the appreciation of the CHF, and translational FX effects were insignificant, as the major invoicing currency is CHF. In addition, Uster benefited from lower costs of EUR-denominated materials and components.
� The flexible business model allowed Uster to rapidly expand capacities in order to meet growing demand.
Margins
� EBITDA amounted to 29.3% of net sales over the six-month reporting period (6M11A).
� Over the historical reporting period, Uster has generated EBITDA margins between 23.5% and 29.3% (FY07A to 6M11A).
Cash flows
� Operating cash flows of CHF 22.5m per June 2011 have been used to reduce net debt to CHF 67.5m, compared to CHF 76.5m in December 2010.
Trade working capital
� Historical trade working capital ranged between 24.8% and 44.7% of net sales. Higher values of working capital as a % of sales in FY09A were driven by a reduction in sales, leading to higher relative inventory levels.
� Based on management information, cash required to fund operating activities is equal to CHF 20m over the reporting and forecast period.
5 Note: the historical analysis is based on the latest published results of Uster for the first half year 2011 as the full year 2011 figures were not yet published at the date of issuance of this report. However, for the valuation we had access to the full year 2011 actual financial statements and considered them in our valuation analysis.
Evolution of revenues and profit margins Source: Annual reports FY10A, 6M11A, Business Plan
184153
98130
211
29.1%
23.5% 24.6%
28.7% 29.3%
2.0%3.5%
1.1%
16.0%
24.0%
0%
5%
10%
15%
20%
25%
30%
35%
0
50
100
150
200
250
FY07A FY08A FY09A FY10A 6M11A
CHF
m
Revenues EBITDA margin Net profit
Note: EBITDA and net profit margins have been based on net revenues (as opposed to gross revenues in the annual reports)
Evolution of working capital Source: Capital IQ, EY analysis
24.8% 26.7%
44.7%
34.2%31.1%
0%
5%
10%
15%
20%
25%
30%
35%
40%
45%
50%
-20
-10
0
10
20
30
40
50
60
70
Dec07A Dec08A Dec09A Dec10A Jun11A
CHF
000
Accounts Receivable Inventory Accounts PayableOperating cash As % of sales
Conclusion
Uster’s flexible business model allows the company to rapidly adapt to changes in demand patterns. Thus in 2009, when sales decreased by 35.9% y-o-y EBITDA margins increased.

Business description : Market overview
Market overview
20 February 2012 120227_Fairness Opinion Uster Technologies AG_e_v53.docx
9
Market positioning
� Uster is internationally recognized as the market leader for the manufacturing of quality measurement and certification products for the textile industry.
� The company’s Uster STATISTICS database has become an undisputed industry standard, providing Uster with significant market power.
� As exclusive supplier for the USDA and the CFIB, Uster has a very strong position in the classification of cotton.
� Due to its unique market positioning, Uster has a limited number of competitors and benefits from a high pricing power.
� R&D being the main driver for growth in testing and measurement markets, Uster has been continuously investing around 10% of its sales revenues in R&D activities, resulting in a strong portfolio of patents and trademarks.
Market cycles
� Approximately 45% of Uster’s sales are impacted by the textile economic cycle, corresponding to the sales of machines to OEMs.
� Based on analyst reports by Credit Suisse, Vontobel, MainFirst and Berenberg, the business cycle for textile and yarn producing machinery is expected to reach a peak in 2011, resulting in declining sales volumes in FY12. The current replacement wave of semi-automated winders which is likely to last for at least another year could partially offset the expected downturn.
� Asian markets have strongly contributed to the development of general textile and yarn producing machinery markets in 2011. Currently, many Asian companies are switching from semi-automatic to automatic winders. Nonetheless, for 2012, a contraction in revenues from Asian markets is expected, with revenues and growth rates stabilising at long-term sustainable levels.

Business description : Market overview
Market overview
20 February 2012 120227_Fairness Opinion Uster Technologies AG_e_v53.docx
10
Benchmark analysis
� The table below shows the main financial ratios and margins of Uster and its group of comparable companies, based on figures for the last financial year (“LFY”). Further details on the selected peer group are provided in Appendix B of this report.
Benckmarking analysis – comparable companies – LFY
In percentage EBITDA margin (%)* EBITA margin (%)* EBIT margin (%)* Gross Profit margin
(%)* Net Profit margin
(%)* Capex (as % of sales) Total Debt/Equity (%) Working Capital (as % of sales)**
Picanol NV 14.0 12.0 11.8 20.7 8.9 0.9 12.7 13.9 Rieter Holding AG 8.8 4.0 3.8 52.7 1.1 3.9 57.8 15.8 OC Oerlikon Corporation AG 7.6 3.3 2.2 22.6 0.1 3.2 74.1 17.7 Schweiter Technologies AG 10.1 7.3 6.9 49.8 5.5 2.4 1.3 20.4 Intertek Group plc 20.1 16.4 15.4 20.3 9.4 4.4 80.4 15.2 SGS SA 22.2 18.2 17.7 46.6 12.4 4.8 26.4 17.3 Mettler-Toledo International, Inc. 18.9 17.4 17.1 52.7 11.8 3.8 89.0 22.8 Cognex Corporation 29.4 27.8 26.1 73.3 21.1 2.0 0 - 19.8 Oxford Instruments plc 12.2 10.7 8.9 41.7 12.3 2.2 12.8 22.6 Spectris plc 17.5 15.9 14.3 58.4 10.7 2.1 29.6 22.7 Toyota Tsusho Corp. 2.3 1.8 1.5 5.8 0.8 0.4 125.0 9.4 MTS Systems Corp. 12.8 10.2 9.7 41.0 5.0 3.0 25.1 32.8 Bureau Veritas SA 18.8 16.7 15.6 33.3 9.9 2.6 153.4 20.2 Uster Technologies AG 28.7 26.8 15.2 59.3 16.0 2.6 43.9 18.8 Minimum 2.3 1.8 1.5 5.8 0.1 0.4 0 - 9.4 Median 14.0 12.0 11.8 41.7 9.4 2.6 29.6 19.8 Maximum 29.4 27.8 26.1 73.3 21.1 4.8 153.4 32.8 Source: Capital IQ
Notes: * Margins are based on net sales
** Trade working capital has been computed, excluding operating cash
� Uster generates EBITDA, gross profit and net profit margins exceeding the ratios of all its major competitors, except for Cognex. High margins result from a very strong competitive position allowing for strong pricing power.
� Capital expenditures and working capital as a % of sales are in line with industry averages.
� While Uster has reduced its long-term debt during FY11, its leverage is exceeding the median value for the group of comparable companies. Nonetheless, cash flows from operating activities allow covering the interest charges on interest-bearing debts.

Valuation foundations
20 February 2012 120227_Fairness Opinion Uster Technologies AG_e_v53.docx
11
Valuation foundations
6. Valuation approach

Valuation foundations : Valuation approach
Valuation approach
20 February 2012 120227_Fairness Opinion Uster Technologies AG_e_v53.docx
12
Principles
� The purpose of our valuation is to assess the value of one share in Uster, as at 17 February 2012.
� As at the Valuation Date, the share capital of Uster consists of 8’460’000 shares outstanding. Furthermore, in May 2010, the group implemented a restricted stock units (“RSU”) plan, allowing selected employees to purchase shares of Uster at a price of CHF 9.4 per share. These options will vest in 2013, or, inter alia, in the event of a change of control, whereby a change of control shall mean the acquisition by any one person, or more than one person acting in concert, of shares that, together with shares held by such person or group, constitute more than 5% of the total share capital or total voting power of all shares. In this sense, a successful public tender offer of Toyota will qualify as a change of control. As at the valuation date, 295’500 RSUs were issued and need to be considered in the number of shares on a fully diluted basis, as the option is in the money.
Approach
� The paragraphs below set out our theoretical framework only on how we approached the valuation of on Uster share. In the subsequent chapters we show the actual application of our approach to Uster.
� To value Uster‘s shares, the income approach was used as the main approach, as income approaches allow to optimally consider company specific factors because the company financials have to be modeled in detail. In particular, the discounted cash flow (“DCF”) method was applied as the primary valuation method for the operating business. Management confirmed that Uster does not hold any non-operating assets, except excess cash.
– Assumptions made by Management were challenged through performing benchmarking analyses and establishing an independent view on the reasonableness of the underlying business plan.
� To further substantiate our valuation analysis, additional values of Uster’s shares as at the Valuation Date were derived by applying market methods (trading and comparable transaction multiples). However, market approaches usually have limited explanation power and are only used for plausibility purposes.
Share capital structure as at 17 February 2012 # of shares to consider Shares outstanding 8’460’000 Restricted share units issued (maximum number of RSU: 320’000)
295’500
Total number of relevant shares on fully diluted basis 8’755’500 Source: SIX Swiss Exchange homepage, Uster management
Valuation approaches Income approach (DCF method) Primary method Market approach (trading and transaction multiples)
Plausibility checks
Source: EY analysis
Conclusion
We have assessed the fair value of one share in Uster based on the results from the different valuation methods, whereby DCF was used as the primary valuation method.
The public offering price should lie within this range of values, to be considered as fair by us.
Valuation analysis
20 February 2012 120227_Fairness Opinion Uster Technologies AG_e_v53.docx
13
Valuation analysis
7. Share price and liquidity analysis
8. Income approach: DCF valuation
9. Market approach: Multiples valuation

Valuation analysis : Share price and liquidity analysis
Share price and liquidity analysis
20 February 2012 120227_Fairness Opinion Uster Technologies AG_e_v53.docx
14
Share price analysis
� The graph on the left shows historical stock prices since the initial public offering in October 2007. On 17 February 2012, the closing price was CHF 43.55 per share.
� The highest price over the reporting period was CHF 56.0 per share (24 October 2007), while the lowest price was CHF 5.8 (5 March 2009).
VWAP
� In order to corroborate the share value calculated for Uster, we calculated the company’s 60-day VWAP.
� The 60-day VWAP is defined as the volume weighted average price of all on-order-book-trades executed during the last 60 trading days.
� For valuation purposes, Uster’s 60-day VWAP has been calculated as at 17 February 2012 and amounted to CHF 41.4. This compares to CHF 41.6 for the Group’s equity weighted average daily price.
Development of Uster’s 60-day VWAP (LTM) Trading volume Source: Bloomberg
0
20'000
40'000
60'000
80'000
100'000
120'000
140'000
160'000
180'000
0
5
10
15
20
25
30
35
40
45
2/16/2011 3/16/2011 4/16/2011 5/16/2011 6/16/2011 7/16/2011 8/16/2011 9/16/2011 10/16/2011 11/16/2011 12/16/2011 1/16/2012 2/16/2012
CHF
Volume Moving Average (60)
VWAP (60)
Evolution of Uster’s share price, since October 2007 Source: Capital IQ, EY analysis
0
10
20
30
40
50
60
CHF
Share Price

Valuation analysis : Share price and liquidity analysis
Share price and liquidity analysis
20 February 2012 120227_Fairness Opinion Uster Technologies AG_e_v53.docx
15
� Please note that the VWAP relevant for the best price rule would be as of the date of the pre-announcement of the public tender offer, i.e. 8 November 2011, calculated according to the rules of the Swiss Takeover Board. According to the Swiss Takeover Board, Uster’s 60-day VWAP at that date was equal to CHF 31.5.
Liquidity analysis
� The graphic below shows trading volumes for the twelve-month period between February 2011 and January 2012. Over the observation period, the trading volume of Uster’s shares constantly remains above the liquidity threshold (set at 0.04% by Swiss Takeover Board in its circular No. 2 “Liquidity in the context of Takeover Law”6). Uster’s shares are therefore deemed liquid.
� The data underlying our VWAP calculation was obtained from Bloomberg, which we consider a trusted source. The data underlying the liquidity analysis was obtained from SIX Swiss Stock Exchange, as required by the Swiss Takeover Board.
Trading volume Feb11 – Jan 12 Source: SIX Swiss Stock Exchange, EY analysis
0.139% 0.116% 0.145%
0.178%
0.135%
0.194% 0.202%
0.341%
0.137%
0.392%
0.169%
0.055%
0
2,000
4,000
6,000
8,000
10,000
12,000
14,000
16,000
18,000
- %
0.05%
0.10%
0.15%
0.20%
0.25%
0.30%
0.35%
0.40%
0.45%
Feb 2011 Mar 2011 Apr 2011 May 2011 Jun 2011 Jul 2011 Aug 2011 Sep 2011 Oct 2011 Nov 2011 Dec 2011 Jan 2012
Mon
thly
med
ian
Liquid
ity
Monthly median of the daily trading volume Liquidity as defined by the Swiss Takeover Board Minimum required liquidity (0.04%)
6 http://www.takeover.ch/legaltexts/overview/lang/en

Valuation analysis : Income approach: DCF valuation
Income approach: DCF valuation method
20 February 2012 120227_Fairness Opinion Uster Technologies AG_e_v53.docx
16
DCF valuation method
� As mentioned earlier, the DCF method has been deemed as the most relevant and appropriate. Consequently it has been applied as our primary approach.
� The DCF involves deriving the cash flows from business activities along with the respective costs that are incurred and then discounting them at the appropriate cost of capital, as presented in the chart on the left. Our DCF model has been derived from the business plan described earlier in the report.
� All interest-bearing liabilities and minority interests contained in Uster’s balance sheet as of the Valuation Date were deducted from the company’s total EV to arrive at its equity value. Conversely all non-operational assets including any excess cash was added to the company’s total EV to arrive at its equity value.
� To arrive at Uster’s share value, its equity value was divided by the total number of shares and RSUs issued.
Presentation of the DCF method Source: EY
Explicit forecast period(business plan)
FCF1 FCF2 FCF3 FCF4 FCFn+1
Company value
DCF0
Terminal year(normalized operations)
Discounting by risk-adjusted cost of capital to valuation date
FCFn-1 FCFn
Forecast period(model horizon)
t

Valuation analysis : Income approach: DCF valuation
Key valuation assumptions
20 February 2012 120227_Fairness Opinion Uster Technologies AG_e_v53.docx
17
Valuation parameters
� Our DCF model was based on the following assumptions:
– Valuation date: 17 February 2012
– Currency: Swiss Franc (“CHF”)
– Corporate tax rate: effective tax rate of 17%
– Losses carried forward: As at 17 February 2012, no losses existed to be carried forward
– Excess cash: according to management, an amount of CHF 20m is required for operating activities, and should be included in the trade working capital. The remaining amount has been considered as excess cash
– Non-operating assets: According to management, Uster does not hold any non-operating assets, except for excess cash
– Revenues are expected to grow at a compound annual growth rate (“CAGR”) of 1.0% over the explicit forecast period
Business Plan
� Our valuation, as at 17 February 2012 is based on the business plan prepared by Uster. The business plan was approved by Uster’s management and board of directors.
� The explicit forecast period consists of 4 years, i.e. the years FY12F to FY15F. As Uster’s cash flows are impacted by the cyclical nature of the textile machinery business, normalised cash flows have been derived for FY16F, based on an average of FY11A-FY15F figures. This average value is used as a basis for determining long-term cash flows.
� To account for Uster’s going concern assumption (i.e. growth into perpetuity) in the terminal year, its sustainable revenues growth rate was set equal to the weighted average of risk free rates used in the WACC calculation, based on invoiced currencies.
� Key assumptions for both the explicit forecast period and terminal value are illustrated in the table on the left.
Main business plan assumptions Item Average forecast
period Terminal year
CAGR 1.0% 1.2%EBITDA-margin 32.1% 30.0%Trade WC / net sales 28.9% 28.4%Capex / net sales 1.6% 1.6%Source: Management, EY analysis

Valuation analysis : Income approach: DCF valuation
Key valuation assumptions
20 February 2012 120227_Fairness Opinion Uster Technologies AG_e_v53.docx
18
Revenues
� The textile business cycle is expected to peak in 2011, resulting in a contraction of revenues in FY12. However, revenues from the sale of off-line laboratory systems, retrofit and fibre classing machines, services and sales of spare parts, as well as the replacement wave of semi-automated winders (likely to last for at least another year) could partially offset the expected downturn.
� As of FY13, revenues are expected to increase again.
EBITDA
� Thanks to Uster’s flexible business model, which allows the company to rapidly adjust to changes in demand patterns, EBITDA margins are expected to remain relatively constant over time.
Investments (Capex)
� According to management assumptions, Capex has been set at an average 1.6% of net sales over the planning period.
Working capital
� Net working capital has been derived by Ernst & Young and is based on management assumptions for forecast balance sheet figures. Cash of CHF 20m, required to fund operating activities, has been included in trade working capital over the forecast period. Over the forecasting period, net working capital amounts to an average of 16.1% of net sales (28.9% for trade working capital).
� From FY16F onwards, working capital is expected to grow in line with revenues.
Net debt
� Uster’s debt situation is expected to further improve over the forecast period, with planned loan repayments of CHF 10m per annum.
� For the valuation we considered Uster’s total interest bearing liabilities less any excess cash.

Valuation analysis : Income approach: DCF valuation
Discount rate
20 February 2012 120227_Fairness Opinion Uster Technologies AG_e_v53.docx
19
Cost of capital
� The WACC describes the weighted average return required by providers of debt and equity. Cost of equity is derived from the Capital Asset Pricing Model (“CAPM”). The cost of debt has been adjusted for the effective tax rate of 17% as in the DCF valuation the taxes are calculated based on EBIT. The WACC of Uster has been computed according to the graphic below.
WACC calculation for Uster Source: Ernst & Young
Cos
t of d
ebt
Cos
t of e
quity
WACC10.5%
Risk-free interest rate1.2%
ERP5.1%
+
Size premium4.07%
+Cost of equity
11.0%
×Equity ratio
92.0%
Interest swap rate1.2%
Credit spread3.4%
+Debt ratio
8.0%
Cost of debt (post-tax)3.8%
×Cost of debt (pre-tax)4.6%
Corporate income tax rate
(1 - 17.0% )
×
+
Adjusted unlevered beta0.947x
1+ D / E × (1 – t)
× Adjusted levered beta1.015x
MRP5.0%
×
Expected market return6.2%
Risk-free interest rate1.2%
−
CRP1
0.7%
+
Notes:1 A CRP is only included if uncertainty or increased risk exists with investing internationally (i.e., in developing countries)2 Abbreviations: D: debt ratio / E: equity ratio / t: tax rate / MRP: market risk premium / ERP: equity risk premium / CRP: country risk premium

Valuation analysis : Income approach: DCF valuation
Discount rate
20 February 2012 120227_Fairness Opinion Uster Technologies AG_e_v53.docx
20
� The following tables illustrate the underlying inputs of the WACC calculation.
Cost of equity, as at 17 February 2012 Parameter Input Description Source Risk-free interest rate (rf) 1.2% The risk free rate describes the expected nominal return on risk
free investments. As a nominal value, the risk free rate accounts for expected real interest rates and inflation. The risk free rate has been computed as a weighted average of the risk free rates of the major invoicing currencies, i.e. CHF (70%) and USD (30%). rf = 70%*rfCH + 30%* rfUS
Implied yield on 10-year government bond of the country in local currency (Capital IQ)
Adjusted unlevered beta (βU) 0.947 The beta reflects the systematic risk of a share, derived from the CAPM. These have been observed on the capital markets, and unlevered, according to their capital structure. This process of unlevering adjusts for the effects of different capital structures.
The adjusted unlevered beta has been derived from peer group median value (Capital IQ) See Appendix B for further details.
Adjusted levered beta (βL) 1.015 The adjusted unlevered beta, has been relevered, according to the target capital structure. Formula: βL = βU × (1 + D / E) × (1 – t)
According to Modigliani and Miller
Market risk premium (MRP) 5.0% The market risk premium corresponds to the difference between the return of the underlying capital market and the risk free rate. Formula: MRP = E(Rm) – rf (market studies)
Market risk premium (market studies)
Size premium (sp) 4.07% Empirical studies have shown that smaller companies (w.r.t. market capitalisation) realise higher returns, as compared to larger companies. These higher returns cannot be explained by the CAPM and can only be achieved through taking higher risks. Capital providers require to be compensated for these risks. A size premium, which increases the cost of equity accounts for this higher expected return.
Low cap status based on market capitalization as of Valuation Date (Ibbotson SBBI Yearbook 2011 – Morningstar)
Country risk premium (CRP) 0.7% Country risk refers to the additional risk associated with investing internationally rather than domestically. To compensate for this uncertainty or increased risk, the average CRPs are weighted by FY11B sales mix
Damodaran online / Management information
Cost of equity (ke) 11.0% Formula: ke = rf + βL × MRP + sp + CRP
Valuation analysis : Income approach: DCF valuation
Discount rate
20 February 2012 120227_Fairness Opinion Uster Technologies AG_e_v53.docx
21
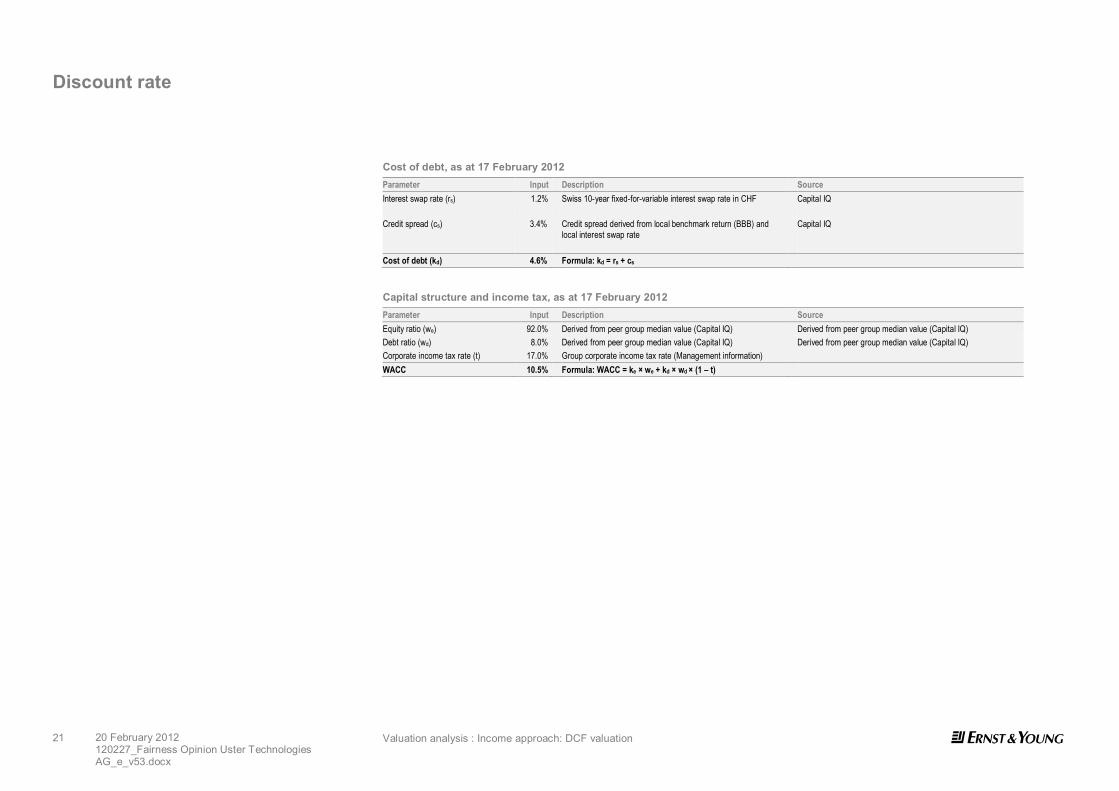
Cost of debt, as at 17 February 2012 Parameter Input Description Source Interest swap rate (rs) 1.2% Swiss 10-year fixed-for-variable interest swap rate in CHF
Capital IQ
Credit spread (cs) 3.4% Credit spread derived from local benchmark return (BBB) and local interest swap rate
Capital IQ
Cost of debt (kd) 4.6% Formula: kd = rs + cs Capital structure and income tax, as at 17 February 2012 Parameter Input Description Source Equity ratio (we) 92.0% Derived from peer group median value (Capital IQ) Derived from peer group median value (Capital IQ) Debt ratio (wd) 8.0% Derived from peer group median value (Capital IQ) Derived from peer group median value (Capital IQ) Corporate income tax rate (t) 17.0% Group corporate income tax rate (Management information) WACC 10.5% Formula: WACC = ke × we + kd × wd × (1 – t)

Valuation analysis : Income approach: DCF valuation
DCF valuation results
20 February 2012 120227_Fairness Opinion Uster Technologies AG_e_v53.docx
22
Valuation results – DCF method
� The table on the left shows the results of the DCF analysis.
� Based on information provided, input from Management and our analysis, we have determined an equity value of CHF426m, as at 17 February 2012.
� To derive the equity value of Uster, enterprise value has been adjusted for:
– Cash receipts from the exercise of stock options in FY13F (RSU vesting).
– Net debt, consisting interest-bearing debt, net of excess cash and financial assets.
– Deferred tax liability on amortisation of PPA intangibles. Enterprise value has been adjusted for the fair value of additional tax payments over the useful life of the assets as taxes in the business plan are based on EBIT.
� Taking into account the number of 8’460’000 outstanding shares and 295’500 issued RSUs we have determined a value of CHF 48.7 per share.
� The sensitivities of the price per share to changes in discount rates, growth rates and EBITDA margins are illustrated in Appendix C of this report.
� Based on the sensitivity analyses and our professional judgment we conclude that the DCF value of on Uster share lies within a range of CHF 46.0 and 51.0.
Conclusion
As at 17 February 2012, the value of one share in Uster, determined according to the DCF method, is estimated at CHF 48.7.
Based on the sensitivity analyses and our professional judgment we conclude that the DCF value of on Uster share lies within a range of CHF 46.0 and 51.0.
Discounted cash-flow analysis Currency: CHF 000 Discounted FCFF - Forecast period 185,611 Discounted FCFF - Terminal value 325,417 Enterprise value 511,029 Non-operating assets - RSU vesting 2,401 Net debt (60,491) Deferred tax liability (26,893) Equity value (100%) 426,246 Number of shares 8,775,500 Price per share (in CHF) (control-basis) 48.7 Source: Uster, E&Y analysis

Valuation analysis : Market approach: Multiples valuation
Market approach: Multiples valuation
20 February 2012 120227_Fairness Opinion Uster Technologies AG_e_v53.docx
23
Market approach: trading/transaction multiples valuation
� Market valuation approaches (i.e. trading and transaction multiples) were applied as backup methods in order to corroborate the findings obtained through the primary valuation method.
� This is a common approach to determine the company value by taking the company’s main value drivers and applying a multiple to it. Market based multiples can be either trading multiples derived from comparable public companies or transaction multiples derived from comparable mergers and acquisitions in the same industry.
� The trading multiple analysis is focused on comparing the subject company to a reasonable selection of similar publicly traded companies. The basis of our analysis for the trading multiples was the identification of companies with similar business operations. This method is presented in the chart below:
Trading multiple method Source: EY
Adjustments (if applicable)
Peer group(comparable companies)
Market price
Key value driver(e.g., sales, EBITDA, EBIT)
Multiple÷ =
MultipleKey value driver target company
Market value target company ×=
► Industry► Size► Profitability and growth► Markets/segments► Risk profile
Comparability
� Performing a transaction multiple analysis involves comparing the subject company to a reasonable selection of corporate transactions where companies similar to the subject company were acquired or merged. Our analysis encompasses five transactions where companies with similar business operations were acquired (please refer to Appendix D for further details).
� To cross-check the DCF valuation, Ernst & Young normally chooses the EBITDA multiple for the following reasons:
– Sales give no indications of the cost structure of a company;
– EBIT could be influenced by different depreciation policies and levels of fixed assets.
� However, for comparable transactions, no relevant information on EBITDA was available, we have therefore used EBIT multiple.

Valuation analysis : Market approach: Multiples valuation
Multiples valuation
20 February 2012 120227_Fairness Opinion Uster Technologies AG_e_v53.docx
24
Valuation based on market multiples
� In order to further substantiate Ernst & Young’s DCF calculations, the value of Uster’s shares was derived based on trading as well as transaction multiples.
Peer group
� Companies adjudged to be reasonably comparable to Uster were included in the peer group. Upon defining comparable companies, the following characteristics were taken into account: industry, size, profitability and growth, markets/segments, risk profile.
� Likewise, companies that were quoted by Uster’s management as competitors or are used by the company to benchmark performance were equally considered.
� Since no direct comparables could be identified for Uster, the compiled peer group encompasses two distinct company subsets:
– Textile machinery and equipment manufacturers
– Testing and measurement
� We identified four publicly traded companies that are active in the textile machinery industry and nine publicly traded companies from the testing and measurement sector. The data underlying the trading multiples was retrieved from Capital IQ. The peer group and the relevant data are presented in Appendixes B and D.
Trading multiple analysis
� The median EBITDA multiple for FY11 and forward-looking multiple for FY12 were applied to Uster’s actual EBITDA in FY11 and forecast EBITDA for FY12 respectively.
� The adjacent table presents an overview of the valuation of Uster calculated by applying a trading multiple valuation approach.
Trading multiple analysis Currency: CHF 000 FY11 FY12 EBITDA 59,690 54,653 EBITDA-Multiple 10.1x 9.7x Enterprise Value 601,216 527,672 Non-operating assets - - RSU vesting 2,401 2,401 Net debt (60,491) (60,491) Deferred tax liability (26,893) (26,893) Equity Value (100%) 516,234 442,690 Number of shares 8,755,500 8,755,500 Value of one share CHF 59.0 50.6 Source: Capital IQ, Ernst & Young calculations

Valuation analysis : Market approach: Multiples valuation
Multiples valuation
20 February 2012 120227_Fairness Opinion Uster Technologies AG_e_v53.docx
25
Transaction multiple analysis
� To determine an appropriate transaction multiple, Ernst & Young screened Capital IQ and Mergermarket for mergers and acquisitions (“M&A”) transactions in the textile industry and the testing and measurement sector, which took place between 2006 and 2011. In addition, we referred to the “Test and measurement report, a middle-market perspective on the test and measurement industry” published by Baird in June 2011.
� The transaction multiple analysis encompasses a set of five completed transactions in which majority stakes in companies with similar business operations to Uster were acquired. Further details on the identified transactions are displayed in Appendix D.
� Given the lack of relevant information available on EBITDA, Ernst & Young applied the median EBIT transaction multiple to Uster EBIT in 2011. However, the information was available for one transaction only. The adjacent table presents an overview of the valuation of Uster calculated by applying a transaction multiple valuation approach.
Valuation results – market approach
� The trading multiple analyses, reflecting actual EBITDA multiples for 2011 and forward looking EBITDA multiples for 2012 result in values for one share in Uster between CHF 50.4 and CHF 58.8.
� The transaction multiple analyses results in a value of CHF 46.9 for one share in Uster.
Conclusion
Market approaches have limited explanation power and are only used for plausibility purposes.
Transaction multiple analysis Currency: CHF 000 FY11 EBIT 41,360 EBIT-Multiple 12.0x Enterprise Value 496,320 Non-operating assets - RSU vesting 2,401 Net debt (60,491) Deferred tax liability (26,893) Equity Value (100%) 411,338 Number of shares 8,755,500 Value of one share (control basis) CHF 47.0 Source: Capital IQ, Ernst & Young calculations

General assessment / fairness opinion
20 February 2012 120227_Fairness Opinion Uster Technologies AG_e_v53.docx
26
General assessment / fairness opinion
10. General assessment / fairness opinion

General assessment / fairness opinion : General assessment / fairness opinion
General assessment / fairness opinion
20 February 2012 120227_Fairness Opinion Uster Technologies AG_e_v53.docx
27
Result of our fairness opinion
� The chart on the left summarizes the results from our valuation analyses. As outlined in the valuation foundations, we used the DCF as the primary method, whereas trading and transaction multiples, VWAP and analyst reports were considered in our final conclusion as a plausibility check.
– The estimated value of one share in Uster, derived from the DCF method, lies within a range of CHF 46.0 and CHF 51.0.
– The trading and transaction multiple analyses result in values for one share in Uster between CHF 47.0 and CHF 59.0. However, because of the absence of directly comparable companies and the fact that transaction multiples were available for only one comparable transaction, these additional methods have been used as plausibility checks only.
– Uster’s 60-day VWAP was calculated at CHF 41.4 whereas the Group’s equity weighted average daily price was CHF 41.6.
– As illustrated in the table on the left, the different analyst reports set target prices between CHF 45.0 and 52.0, which supports the value determined with the DCF method.
� This fairness opinion has been completed on 20 February 2012.
Louis Siegrist Stéphanie Chaumier
Partner Manager
Conclusion
Based on our valuation analyses, we conclude that the fair value of one share in Uster, as at 17 February 2012 lies within in a range of CHF 46.0 and CHF 51.0. We therefore consider the offering price of CHF 44.0, plus a dividend of CHF 2.5 per share, resulting in a per share value of CHF 46.5, as financially fair.
Range of values for one Uster share Source: EY analysis
27.8
47.0
50.6
46.0
44.0
59.0
51.0
20 30 40 50 60 70 80
Share Price (LTM)
Transaction multiples
Trading multiples
DCF
Analyst views Report Target price per share Credit Suisse, 26 September 2011 CHF 50 Berenberg Bank, 18 July 2011 CHF 52 Vontobel, 19 September 2011 CHF 45 MainFirst, 19 July 2011 CHF 50
Value to shareholders = CHF 46.5

Appendix
20 February 2012 120227_Fairness Opinion Uster Technologies AG_e_v53.docx
28
Appendix
11. Appendix A - Sources of information
12. Appendix B - Peer group
13. Appendix C - Sensitivity analysis (DCF)
14. Appendix D - Market approach

Appendix : Appendix A - Sources of information
Sources of information
20 February 2012 120227_Fairness Opinion Uster Technologies AG_e_v53.docx
29
Information received File name Date received File type Assuring textile quality and value - Uster Technologies AG - Company Presentation, August 2011 28.10.2011 Hardcopy 5 year planning 2011 – 2015, Bod Meeting September 15th 2011 28.10.2011 Hardcopy Annual Report 2010 31.10.2011 PDF File Interim Accounts, June 2011 31.10.2011 PDF File December 2011 balance sheet and P&L figures, prepared by Management 17.02.2012 Excel Analyst Reports – Credit Suisse - 19.07.11, 20.07.11, 10.08.11, 15.09.11, 26.09.11 31.10.11 PDF File Analyst Report – Main First – 19.07.11 04.11.11 PDF File Analyst Report – Vontobel – 19.09.11 04.11.11 PDF File Analyst Report – Berenberg Bank – 19.09.11 04.11.11 PDF File Test and measurement report, a middle-market perspective on the test and measurement industry – Baird - June 2011
04.11.11 PDF File
Prinzipalbesteuerung, Uster Technologies AG – Eidgenössische Steuerverwaltung – 17.02.09 04.11.11 PDF File
Contact person at Uster Name Position Geoffrey Scott CEO Uster Beat Gisin Head of Group Controlling

Appendix : Appendix B - Peer group
Peer group
20 February 2012 120227_Fairness Opinion Uster Technologies AG_e_v53.docx
30
Peer group Uster Companies Ticker Country Currency Filing date Minority interests Total debt Adjusted beta Unlevered beta Textile machinery manufacturers Picanol NV ENXTBR:PIC Belgium EUR 30.06.2011 - 10 0.908 0.877 Rieter Holding AG SWX:RIEN Switzerland CHF 30.06.2011 14 279 1.437 1.154 OC Oerlikon Corporation AG SWX:OERL Switzerland CHF 30.06.2011 21 983 2.689 1.962 Schweiter Technologies AG SWX:SWTQ Switzerland CHF 30.06.2011 - 6 0.781 0.776 Testing and measurement companies Intertek Group plc LSE:ITRK United Kingdom GBP 30.06.2011 27 810 0.843 0.720 SGS SA SWX:SGSN Switzerland CHF 31.12.2011 50 1,299 0.762 0.704 Mettler-Toledo International, Inc. NYSE:MTD United States USD 31.12.2011 - 505 1.110 1.051 Cognex Corporation NasdaqGS:CGNX United States USD 31.12.2011 - - 1.072 1.072 Oxford Instruments plc LSE:OXIG United Kingdom GBP 30.09.2011 - 8 0.988 0.979 Spectris plc LSE:SXS United Kingdom GBP 30.06.2011 - 154 1.362 1.285 Toyota Tsusho Corp. TSE:8015 Japan JPY 31.12.2011 71,496 773,047 1.250 0.719 MTS Systems Corp. NasdaqGS:MTSC United States USD 31.12.2011 - 41 0.980 0.947 Bureau Veritas SA ENXTPA:BVI France EUR 30.06.2011 7 1,353 0.707 0.621 Source: Capital IQ as of February 9, 2012 Ref: Multiple overview - Section MU - Multiples

Appendix : Appendix C - Sensitivity analysis (DCF)
Sensitivity analysis
20 February 2012 120227_Fairness Opinion Uster Technologies AG_e_v53.docx
31
Sensitivity analysis
� Sensitivity analysis related to the DCF method was performed on the share price in Uster, whereby the WACC and long-term growth were modified. Similarly, the impact of a parallel shift in the assumed EBITDA margin over the entire forecast period was analyzed.
� The results are presented in the tables below.
Sensitivity analysis : WACC and long-term growth Currency CHF 000 Long-term growth 0.2% 0.7% 1.2% 1.7% 2.2% 8.5% 57.0 60.1 63.6 67.6 72.2 9.5% 50.3 52.6 55.2 58.2 61.6 WACC 10.5% 44.8 46.6 48.7 50.9 53.5 11.5% 40.3 41.7 43.4 45.1 47.1 12.5% 36.5 37.7 39.0 40.4 42.0 Source: EY Analysis
Sensitivity analysis: Delta EBITDA margin and long-term growth Currency CHF 000 Long-term growth 0.2% 0.7% 1.2% 1.7% 2.2% 2.0% 48.3 50.3 52.5 55.0 57.7 1.0% 46.5 48.4 50.6 53.0 55.7 Delta EBITDA margin 0.0% 44.7 46.6 48.7 51.0 53.6 -1.0% 42.9 44.7 46.7 49.0 51.5 -2.0% 41.1 42.9 44.8 47.0 49.4 Source: EY Analysis

Appendix : Appendix D - Market approach
Trading multiples
20 February 2012 120227_Fairness Opinion Uster Technologies AG_e_v53.docx
32
Trading multiples analysis
Companies Ticker Enterprise value
(EV) EV / Revenue FY11 EV / Revenue FY12 EV / Revenue FY13 EV / EBITDA
FY11 EV / EBITDA
FY12 EV / EBITDA
FY13 EV / EBIT
FY11 EV / EBIT
FY12 EV / EBIT
FY13 Textile machinery manufacturers Picanol NV ENXTBR:PIC 146 n/a n/a 0.3x n/a n/a 1.7x n/a n/a 2.0x Rieter Holding AG SWX:RIEN 772 0.6x 0.6x 0.6x 4.5x 5.4x 5.1x 6.3x 8.3x 7.7x OC Oerlikon Corporation AG SWX:OERL 2,431 0.6x 0.6x 0.6x 4.4x 4.6x 4.5x 6.5x 7.2x 7.1x Schweiter Technologies AG SWX:SWTQ 527 0.6x 0.7x 0.6x 6.6x 6.8x 5.9x 10.1x 10.4x 8.3x Testing and measurement companies Intertek Group plc LSE:ITRK 4,142 2.4x 2.1x 2.0x 12.1x 10.5x 9.5x 15.8x 13.4x 12.0x SGS SA SWX:SGSN 13,010 2.4x 2.2x 2.0x 11.0x 9.7x 8.5x 14.2x 12.4x 10.7x Mettler-Toledo International NYSE:MTD 6,109 2.5x 2.4x 2.3x 12.8x 11.9x 11.2x 14.3x 13.0x 12.2x Cognex Corporation NasdaqGS:CGNX 1,632 4.7x 4.0x 3.9x 15.6x 13.2x 14.1x 16.9x 14.4x 16.2x Oxford Instruments plc LSE:OXIG 601 1.8x 1.6x 1.6x 12.4x 11.0x 11.0x 15.1x 13.0x 12.1x Spectris plc LSE:SXS 1,979 1.8x 1.6x 1.5x 9.1x 7.9x 7.4x 10.3x 8.9x 8.2x Toyota Tsusho Corp. TSE:8015 1,089,560 0.2x 0.2x 0.2x 7.9x 7.3x 7.4x 11.7x 10.2x 9.6x MTS Systems Corp. NasdaqGS:MTSC 712 1.3x 1.3x n/a 8.0x n/a n/a 8.1x 7.8x n/a Bureau Veritas SA ENXTPA:BVI 7,568 2.3x 2.1x 2.0x 12.0x 11.0x 10.1x 14.4x 13.3x 12.1x Low 0.2x 0.2x 0.2x 4.4x 4.6x 1.7x 6.3x 7.2x 2.0x High 4.7x 4.0x 3.9x 15.6x 13.2x 14.1x 16.9x 14.4x 16.2x Average 1.8x 1.6x 1.5x 9.7x 9.0x 8.0x 12.0x 11.0x 9.8x Median 1.8x 1.6x 1.5x 10.1x 9.7x 8.0x 12.9x 11.4x 10.2x Source: Capital IQ as of February 9, 2012

Appendix : Appendix D - Market approach
Transaction multiples
20 February 2012 120227_Fairness Opinion Uster Technologies AG_e_v53.docx
33
Comparable transactions analysis
Target Description Country % Acquired Acquirer Date Currency Equity Value (m) Net Debt/(cash) Enterprise Value (m)
EV/ Sales
EV/ EBITDA EV/EBIT P/E
AB Lorentzen Industrial machinery Sweden 100% ABB Participatio 10/3/2011 SEK 750 750 2.4 n.a n.a n.a Omega Engineering Electronics Equipment US 100% Spectris 8/15/2011 USD 475 475 2.8 n.a 12.0 n.a Savio Machine Industrial machinery Italy 100% Groupe Alpha 6/21/2011 EUR 135 165 300 0.9 n.a n.a n.a Industrial Control Group Electronics Equipment UK 100% Rockwell 7/2/2007 GBP 110 110 1.6 n.a n.a n.a Saurer Specialized industrial equipment CH 74% Oerlikon 1/10/2007 CHF 1075 247 1322 0.4 8.4 10.3 12.5 Average 1.6x 8.4x 11.1x 12.5x Median 1.6x 8.4x 11.1x 12.5x Source: Capital IQ, Mergermarket, Press releases