Climate and crop-responsive emission factors significantly alter estimates of current and future...
15
Climate- and crop-responsive emission factors significantly alter estimates of current and future nitrous oxide emissions from fertilizer use HELEN C. FLYNN *, JO SMITH *, KEITH A. SMITH w , JIM WRIGHT w 1 , PETE SMITH * and JON MASSHEDER z *School of Biological Sciences, University of Aberdeen, Cruickshank Building, St Machar Drive, Aberdeen AB24 3UU, UK, wSchool of GeoSciences, University of Edinburgh, Darwin Building, Mayfield Road, Edinburgh EH9 3JU, UK, zSimulistics Ltd, ETTC, King’s Buildings, Mayfield Road, Edinburgh EH9 3JL, UK Abstract The current Intergovernmental Panel on Climate Change (IPCC) default methodology (tier 1) for calculating nitrous oxide (N 2 O) emissions from nitrogen applied to agricultural soils takes no account of either crop type or climatic conditions. As a result, the methodology omits factors that are crucial in determining current emissions, and has no mechanism to assess the potential impact of future climate and land-use change. Scotland is used as a case study to illustrate the development of a new methodology, which retains the simple structure of the IPCC tier 1 methodology, but incorporates crop- and climate-dependent emission factors (EFs). It also includes a factor to account for the effect of soil compaction because of trampling by grazing animals. These factors are based on recent field studies in Scotland and elsewhere in the UK. Under current conditions, the new methodology produces significantly higher estimates of annual N 2 O emissions than the IPCC default methodology, almost entirely because of the increased contribution of grazed pasture. Total emissions from applied fertilizer and N deposited by grazing animals are estimated at 10 662 t N 2 O-N yr 1 using the newly derived EFs, as opposed to 6 796 t N 2 O-N yr 1 using the IPCC default EFs. On a spatial basis, emission levels are closer to those calculated using field observations and detailed soil modelling than to estimates made using the IPCC default methodology. This can be illustrated by parts of the western Ayrshire basin, which have previously been calculated to emit 8–9 kg N 2 O-N ha 1 yr 1 and are estimated here as 6.25–8.75 kg N 2 O-N ha 1 yr 1 , while the IPCC default methodology gives a maximum emission level of only 3.75 kg N 2 O- N ha 1 yr 1 for the whole area. The new methodology is also applied in conjunction with scenarios for future climate- and land-use patterns, to assess how these emissions may change in the future. The results suggest that by 2080, Scottish N 2 O emissions may increase by up to 14%, depending on the climate scenario, if fertilizer and land management practices remain unchanged. Reductions in agricultural land use, however, have the potential to mitigate these increases and, depending on the replacement land use, may even reduce emissions to below current levels. Keywords: agricultural soils, climate change, emission factors, fertilizer, grazing, IPCC, land-use change, nitrous oxide, modelling, Scotland Received 10 December 2004; revised version received 17 March 2005 and accepted 22 March 2005 Introduction Nitrous oxide (N 2 O) is a potent greenhouse gas. Its global warming potential (cumulative radiative forcing) is 296 times greater than that of carbon dioxide (IPCC, 2001a). Microbial processes in soils account for 65% of Correspondence: Helen Flynn, tel. 1 44 1224 273810, fax 1 44 1224 272703, e-mail: h.c.fl[email protected] 1 Present address: Department of Geography, University of Southampton, Highfield, Southampton SO17 1BJ, UK. Global Change Biology (2005) 11, 1522–1536, doi: 10.1111/j.1365-2486.2005.00998.x 1522 r 2005 Blackwell Publishing Ltd
-
Upload
independent -
Category
Documents
-
view
3 -
download
0
Transcript of Climate and crop-responsive emission factors significantly alter estimates of current and future...

Climate- and crop-responsive emission factorssignificantly alter estimates of current and future nitrousoxide emissions from fertilizer use
H E L E N C . F LY N N *, J O S M I T H *, K E I T H A . S M I T H w , J I M W R I G H T w 1 , P E T E S M I T H * and
J O N M A S S H E D E R z*School of Biological Sciences, University of Aberdeen, Cruickshank Building, St Machar Drive, Aberdeen AB24 3UU, UK,
wSchool of GeoSciences, University of Edinburgh, Darwin Building, Mayfield Road, Edinburgh EH9 3JU, UK, zSimulistics Ltd,
ETTC, King’s Buildings, Mayfield Road, Edinburgh EH9 3JL, UK
Abstract
The current Intergovernmental Panel on Climate Change (IPCC) default methodology
(tier 1) for calculating nitrous oxide (N2O) emissions from nitrogen applied to
agricultural soils takes no account of either crop type or climatic conditions. As a result,
the methodology omits factors that are crucial in determining current emissions, and has
no mechanism to assess the potential impact of future climate and land-use change.
Scotland is used as a case study to illustrate the development of a new methodology,
which retains the simple structure of the IPCC tier 1 methodology, but incorporates crop-
and climate-dependent emission factors (EFs). It also includes a factor to account for the
effect of soil compaction because of trampling by grazing animals. These factors are
based on recent field studies in Scotland and elsewhere in the UK. Under current
conditions, the new methodology produces significantly higher estimates of annual N2O
emissions than the IPCC default methodology, almost entirely because of the increased
contribution of grazed pasture. Total emissions from applied fertilizer and N deposited
by grazing animals are estimated at 10 662 t N2O-N yr�1 using the newly derived EFs, as
opposed to 6 796 t N2O-N yr�1 using the IPCC default EFs. On a spatial basis, emission
levels are closer to those calculated using field observations and detailed soil modelling
than to estimates made using the IPCC default methodology. This can be illustrated by
parts of the western Ayrshire basin, which have previously been calculated to emit
8–9 kg N2O-N ha�1 yr�1 and are estimated here as 6.25–8.75 kg N2O-N ha�1 yr�1, while the
IPCC default methodology gives a maximum emission level of only 3.75 kg N2O-
N ha�1 yr�1 for the whole area. The new methodology is also applied in conjunction with
scenarios for future climate- and land-use patterns, to assess how these emissions may
change in the future. The results suggest that by 2080, Scottish N2O emissions may
increase by up to 14%, depending on the climate scenario, if fertilizer and land
management practices remain unchanged. Reductions in agricultural land use, however,
have the potential to mitigate these increases and, depending on the replacement land
use, may even reduce emissions to below current levels.
Keywords: agricultural soils, climate change, emission factors, fertilizer, grazing, IPCC, land-use
change, nitrous oxide, modelling, Scotland
Received 10 December 2004; revised version received 17 March 2005 and accepted 22 March 2005
Introduction
Nitrous oxide (N2O) is a potent greenhouse gas. Its
global warming potential (cumulative radiative forcing)
is 296 times greater than that of carbon dioxide (IPCC,
2001a). Microbial processes in soils account for 65% of
Correspondence: Helen Flynn, tel. 1 44 1224 273810,
fax 1 44 1224 272703, e-mail: [email protected] address: Department of Geography, University of
Southampton, Highfield, Southampton SO17 1BJ, UK.
Global Change Biology (2005) 11, 1522–1536, doi: 10.1111/j.1365-2486.2005.00998.x
1522 r 2005 Blackwell Publishing Ltd
the global annual emissions of N2O (IPCC, 1995), and
for cultivated soils, levels of nitrogen (N) fertilizer
applied have a major influence on the rate of emissions.
The current Intergovernmental Panel on Climate
Change (IPCC) default (tier 1; IPCC, 2001b) methodol-
ogy for calculating direct N2O emissions from agricul-
tural soils uses emission factors (EFs), which specify
that a fixed proportion of the N applied will be emitted
as N2O (IPCC, 1997). The default values for these EFs
take no account of the effect of crop type or climate:
factors that are known to regulate N2O production. The
absence of crop- and climate-dependent EFs not only
omits important factors in controlling emissions, but
also results in a methodology that cannot be used to
assess the impact of potential future land use and
climate change on N2O emissions.
The research described in this paper uses Scotland as
a case study area to illustrate the development of crop-
and climate-dependent EFs. The newly derived EFs are
then used to assess how potential future climatic- and
land-use changes may affect N2O emissions from
fertilizer applications in Scotland. These EFs were
derived principally from field experiments carried out
in Scotland and the rest of the UK, but may be
applicable in similar climatic zones in other countries,
or the approach could equally be used to derive EFs
tailored to other regions from relevant field experi-
ments within those regions. The new EFs were used,
along with calculations of annual N inputs from
mineral fertilizers and manure applications at a 2 km
grid resolution, to produce maps of current N2O
emissions. These were compared with calculations
made using the IPCC default methodology. The impact
of future rainfall and temperature changes on N2O
emissions were then assessed, along with potential
changes in land use. The crop-specific aspect of the
methodology allows calculation of the sensitivity to
climate change of emissions from different land-use
types. Combined with the climate dependence, this
allows regions of high emission risk to be identified,
allowing future research priorities to be set, and
potential options to mitigate increases in N2O emissions
to be identified. The methodology reflects the effect of
site-specific processes on emissions without including
detailed descriptions of the individual processes.
Explicit simulation of the individual processes at
each site would require more detailed information
than is currently available. This approach (a tier 2
methodology; IPCC, 2001b), contrasts with previous
approaches (such as Brown et al., 2002) in which
detailed process-based models were used (a tier 3
methodology; IPCC, 2001b), with estimation techniques
to fill gaps in the input data needed to run the more
complex model.
Materials and methods
Annual nitrogen inputs
The amount and spatial distribution of N fertilizer
applied in Scotland were estimated for both mineral
fertilizers and organic (manure) additions. Agricultural
census data are available for 2 km grid-squares, which
are derived by combining parish-level summary data
with a gridded land cover map (http://datalib.ed.
ac.uk/EUDL/agriculture/griddata.html). Scotland was
therefore subdivided into the 2 km grid-squares used
by the Agricultural Census. Mineral fertilizer inputs
were calculated by multiplying the number of hectares
of a crop in each grid-square (data from the Agricultur-
al Census for the year 2000) by the annual fertilizer
application data for that crop, taken from the British
Survey of fertilizer Practice (BSFP) (Anon, 2000a). For
crops such as soft fruit that are not included in the
BSFP, the N requirements from the fertilizer Recom-
mendations report (Anon, 2000b) were used instead of
the annual fertilizer application from the BSFP. This
approach gave approximately the same total amount of
N applied as was estimated using the ‘other tillage’
fertilizer application rate from the BSFP, but was more
spatially explicit. Inputs to land uses not described as
crops or managed grasslands were not included in the
estimates. This should not cause a significant under-
estimate of fertilizer-induced N2O emissions, as set-
aside and rough grazing land do not receive significant
levels of fertilizer, and there are currently less than
200 ha of forestry land which have nitrogen fertilizers
applied to them (W. Mason, personal communication,
Forestry Commission). It should be noted that the
spatial distribution of applied N estimated by this
approach reflects only the distribution of crop types.
The BSFP produces averaged data, based on a small
percentage of farms in each size class, and taking no
account of soil type. Using these national averages for
different crop types produces a spatial distribution that
is based solely on the distribution of crop types.
However, because no spatial data for fertilizer applica-
tions are currently available, this is the best estimate
possible.
The amount of N applied as manure or slurry is more
difficult to estimate than the amount applied as mineral
nitrogen as no data on organic applications are
currently available. IPCC estimates of N production
by cattle and sheep, and the division between manure
deposited directly onto grazing land, and manure
that is collected and applied to crops (IPCC, 2001b),
were used, together with animal numbers in each
grid-square from the Agricultural Census (2000). It
was assumed that all manure produced within a
N I T R O U S O X I D E E M I S S I O N S F R O M F E R T I L I Z E R U S E 1523
r 2005 Blackwell Publishing Ltd, Global Change Biology, 11, 1522–1536
grid-square was disposed of within that square. This
means that for grid-squares where there were no crops
grown, it was assumed that all the manure was
deposited directly by animals onto grazing land. This
assumption results in a conservative estimate of organic
N fertilizer use.
Fertilizer-derived N2O emissions under currentconditions
The IPCC default methodology was used to provide a
baseline for comparison with estimates of N2O emis-
sions obtained using the new EFs. The IPCC default
method uses an EF of 1.25% for all the N applied to
agricultural land, after correcting for losses because of
NH3 and NOx volatilization. The Agricultural Census
gives only animal numbers per grid-square and does
not specify whether they are grazed on managed
(fertilized) grassland or rough grazing. Therefore,
grazing-related emissions cannot be separated to allow
only those from fertilized fields to be considered. N
deposited directly by animals onto grazing land has a
higher N2O EF of 2%.
The Scotland-specific emissions were calculated in
the same way as the IPCC default emissions, but with
the default EFs replaced by the newly derived EFs.
These depend on a combination of crop type, fertilizer
type and climatic factors, and are summarized in Table
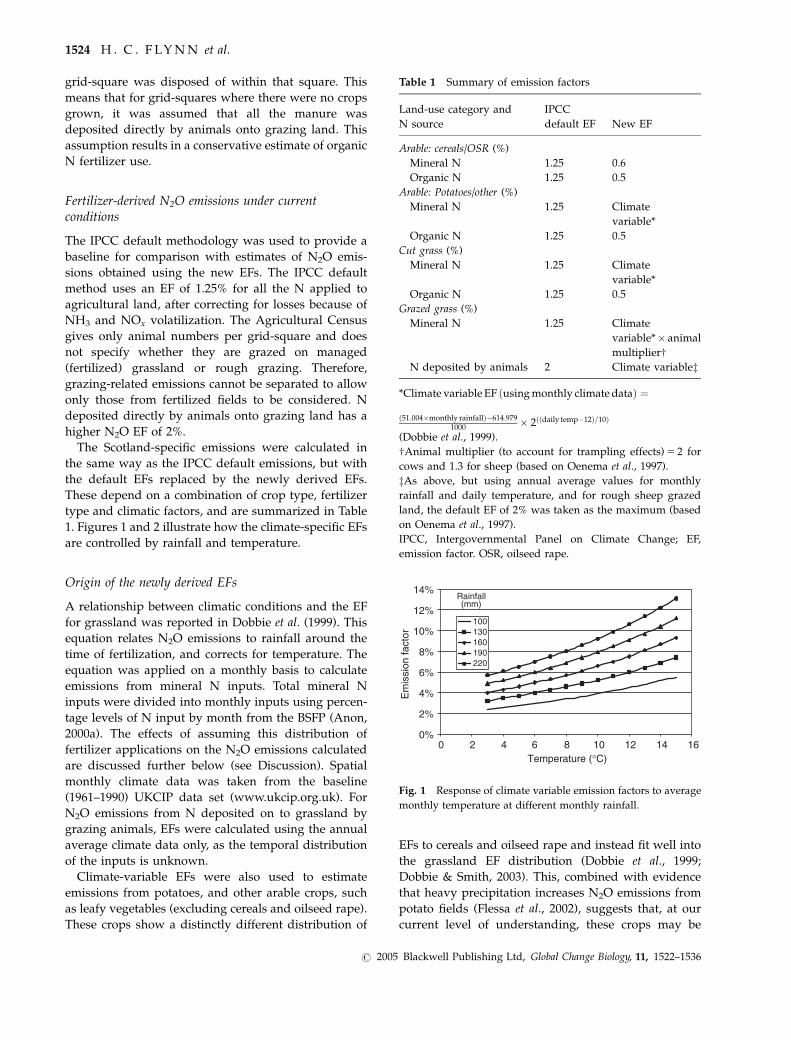
1. Figures 1 and 2 illustrate how the climate-specific EFs
are controlled by rainfall and temperature.
Origin of the newly derived EFs
A relationship between climatic conditions and the EF
for grassland was reported in Dobbie et al. (1999). This
equation relates N2O emissions to rainfall around the
time of fertilization, and corrects for temperature. The
equation was applied on a monthly basis to calculate
emissions from mineral N inputs. Total mineral N
inputs were divided into monthly inputs using percen-
tage levels of N input by month from the BSFP (Anon,
2000a). The effects of assuming this distribution of
fertilizer applications on the N2O emissions calculated
are discussed further below (see Discussion). Spatial
monthly climate data was taken from the baseline
(1961–1990) UKCIP data set (www.ukcip.org.uk). For
N2O emissions from N deposited on to grassland by
grazing animals, EFs were calculated using the annual
average climate data only, as the temporal distribution
of the inputs is unknown.
Climate-variable EFs were also used to estimate
emissions from potatoes, and other arable crops, such
as leafy vegetables (excluding cereals and oilseed rape).
These crops show a distinctly different distribution of
EFs to cereals and oilseed rape and instead fit well into
the grassland EF distribution (Dobbie et al., 1999;
Dobbie & Smith, 2003). This, combined with evidence
that heavy precipitation increases N2O emissions from
potato fields (Flessa et al., 2002), suggests that, at our
current level of understanding, these crops may be
Table 1 Summary of emission factors
Land-use category and
N source
IPCC
default EF New EF
Arable: cereals/OSR (%)
Mineral N 1.25 0.6
Organic N 1.25 0.5
Arable: Potatoes/other (%)
Mineral N 1.25 Climate
variable*
Organic N 1.25 0.5
Cut grass (%)
Mineral N 1.25 Climate
variable*
Organic N 1.25 0.5
Grazed grass (%)
Mineral N 1.25 Climate
variable*� animal
multiplierwN deposited by animals 2 Climate variablez
*Climate variable EF ðusing monthly climate dataÞ ¼
ð51:004�monthly rainfallÞ�614:9791000 � 2ððdaily temp�12Þ=10Þ
(Dobbie et al., 1999).
wAnimal multiplier (to account for trampling effects) 5 2 for
cows and 1.3 for sheep (based on Oenema et al., 1997).
zAs above, but using annual average values for monthly
rainfall and daily temperature, and for rough sheep grazed
land, the default EF of 2% was taken as the maximum (based
on Oenema et al., 1997).
IPCC, Intergovernmental Panel on Climate Change; EF,
emission factor. OSR, oilseed rape.
0%
2%
4%
6%
8%
10%
12%
14%
0 2 4 6 8 10 12 14 16Temperature (°C)
Em
issi
on fa
ctor
100130160190220
Rainfall (mm)
Fig. 1 Response of climate variable emission factors to average
monthly temperature at different monthly rainfall.
1524 H . C . F LY N N et al.
r 2005 Blackwell Publishing Ltd, Global Change Biology, 11, 1522–1536

assumed to respond to climate in the same way as
grassland. By contrast, cereals and oilseed rape do not
show a clear response to changes in rainfall level (Smith
& Dobbie, 2002). Therefore, a crop-specific EF was used
for these crops, which is the mean of the EFs reported
for cereals and oilseed rape in the UK (Dobbie et al.,
1999; Dobbie & Smith, 2003).
Emissions from rough, sheep-grazed land are much
lower than from fertilized grassland grazed by cattle,
because of reduced trampling effects and the less
concentrated nature of the N excretion (Oenema et al.,
1997). This observation was accounted for in two ways:
the default EF of 2% for N deposited by animals was
taken as the maximum for the climate-variable EFs for
rough grazing land, and an animal effects multiplier,
which accounts for trampling effects on mineral N
emissions, was set at 2 for cattle and 1.3 for sheep
(based on Oenema et al., 1997). This required further
assumptions as the Agricultural Census grid-square
data is not of sufficient resolution to allow allocation of
animals to individual fields. Therefore, all fertilized
grazing land was treated as cattle grazed if there were
any cows recorded within that grid-square. For rough
grazing land, using a 2% maximum EF assumes that
this category has low emissions associated with sheep
grazing, but the calculation allows for higher N input
levels associated with cattle grazing. Also, rough
grazing which occurs within grid-squares alongside
managed grazing, did not have the 2% maximum
applied as it is not possible to allocate animals between
grazing land types within grid-squares. In summary,
the approach assumes that the majority of fertilized
pastures are cattle grazed, while rough unfertilized
pasture is sheep grazed, but the calculations allow for
deviations from this assumption by accounting for all
manure inputs, and only capping EFs for rough grazing
land in grid-squares with no managed pastures.
The EF for applied organic N was taken from studies
of grassland emissions, which highlight the low
emissions from spreader applied slurry and farmyard
manure (D. Chadwick, personal communication). The
value of 0.5% lies within the 0.01–1.65% range of
emissions reported for organic fertilizers applied to
Scottish soils (Akiyama et al., 2004). Under laboratory
conditions, N2O emissions of 0.2% of applied N have
been reported from cattle manure and surface-applied
slurry (Flessa & Beese, 2000; Akiyama et al., 2004).
Comparing the results for applied urea N with Scottish
field studies however, suggests that these emissions
may be closer to 0.5% under field conditions (Akiyama
et al., 2004). In the absence of studies into N2O
emissions, from applied organic N fertilizers for land
uses other than grassland, this EF is assumed to apply
to all crop types. Emissions from organic N applications
were not deemed to be climate variable. This is in
accordance with Ball et al. (2004), who carried out field
studies in Scotland, and reported that use of organic
manures avoids the very high fluxes associated with
heavy rainfall occurring around the time of application,
and can therefore mitigate total N2O emissions over a
growing season by approximately 90% in comparison
with mineral fertilizers.
EFs were not adjusted for soil properties such as
texture or wetness class, as transient properties rather
than permanent soil features appear to be dominant in
determining emissions. This is discussed in detail
below (see Discussion).
Fertilizer-derived N2O emissions under future climaticconditions
Predictions for climate change (UKCIP dataset;
www.ukcip.org.uk) were derived from the HadCM3
climate model, which was used to implement four
IPCC emission scenarios (IPCC, 2000). The four
scenarios considered, based on the predicted cumula-
tive CO2 emissions between 1990 and 2100, are as
follows: the ‘low’ emissions scenario assumes that the
cumulative emissions will be less than 1100 Gt C, the
‘medium–low’ scenario assumes emissions between
1100 and 1450 Gt C, the ‘medium–high’ scenario as-
sumes emissions between 1450 and 1800 Gt C, while the
‘high’ scenario assumes that the cumulative emissions
will exceed 1800 Gt C over the period.
The UKCIP database includes rainfall and tempera-
ture predictions for each scenario, for three future time
steps: 2020, 2050 and 2080. These data, in 50 km grid-
squares covering the whole of Scotland, were used to
estimate how N2O emissions might change in response
to climate change. Crop areas, fertilizer inputs and
animal numbers were kept constant and the new
0%
2%
4%
6%
8%
10%
12%
14%
20 40 60 80 100
120
140
160
180
200
220
Em
issi
on fa
ctor
1512963
Rainfall (mm)
Temperature(°C)
Fig. 2 Response of climate variable emission factors to monthly
rainfall at different average monthly temperatures.
N I T R O U S O X I D E E M I S S I O N S F R O M F E R T I L I Z E R U S E 1525
r 2005 Blackwell Publishing Ltd, Global Change Biology, 11, 1522–1536
emission methodology was used. Therefore, emissions
from land use and fertilizer categories which have fixed
EFs remained constant, while emissions from categories
with climate variable EFs were adjusted according to
predicted changes in the Scottish climate.
Fertilizer-derived N2O emissions under future climaticconditions and future land-use patterns
The ATEAM project (www.pik-potsdam.de/ateam/)
has produced Europe-wide land-use change scenarios
for each of the IPCC future scenarios, based on the
IPCC emission scenario narratives (IPCC, 2000), at a
resolution of 100 � 100 (Rounsevell et al., 2005). Besides
climate change, the narratives also reflect changes in
socio-economic factors. These are based on many
dimensions but the two most important are the relative
orientation of the scenario toward economic or envir-
onmental considerations, and toward global or regional
development objectives. Therefore, the land-use change
scenarios incorporate responses to climate change,
socio-economic conditions, and a consideration of
land-use processes and competition between land-use
types. The scenarios are entirely consistent, both
internally and with the future climate scenarios, and
therefore, represent the most plausible descriptions of
potential future changes currently available. The
changes in the extent of arable crops and grassland
across Scotland from these scenarios were therefore
used to adjust the predicted emissions for each future
scenario, as a more consistent approach than arbitrarily
set scenarios. The calculations do not take into account
emissions from any alternative land use.
Results
Annual nitrogen inputs
Using data for the year 2000, total fertilizer mineral N
inputs are estimated to be 196 thousand tonnes (Gg) per
year, of which 37% is applied to crops and 63% to grass.
This estimate assumes that the percentage of wheat
sown in spring is 3% (the UK average for 2001, from
http://www.hgca.com/c-stats/fileindex.html ‘UK
Spring and Winter cereals.xls’) as the BSFP gives
different fertilizer input levels for winter and spring
wheat, but the Agricultural Census gives only total
wheat areas.
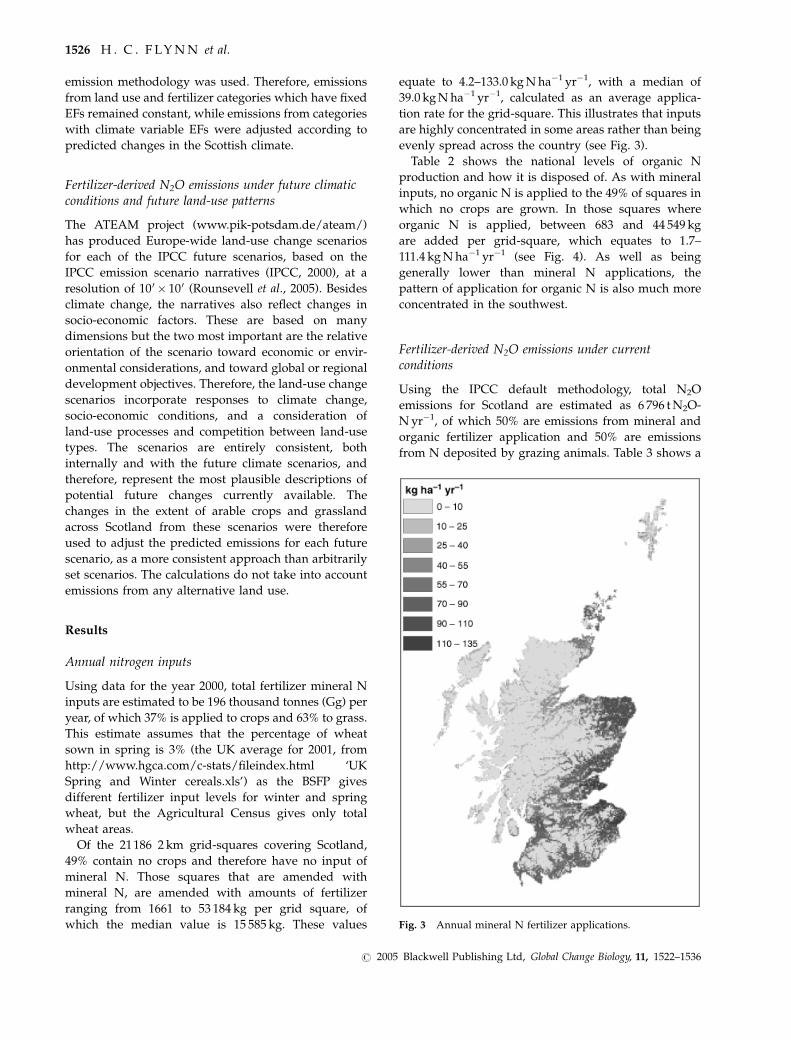
Of the 21186 2 km grid-squares covering Scotland,
49% contain no crops and therefore have no input of
mineral N. Those squares that are amended with
mineral N, are amended with amounts of fertilizer
ranging from 1661 to 53 184 kg per grid square, of
which the median value is 15 585 kg. These values
equate to 4.2–133.0 kg N ha�1 yr�1, with a median of
39.0 kg N ha�1 yr�1, calculated as an average applica-
tion rate for the grid-square. This illustrates that inputs
are highly concentrated in some areas rather than being
evenly spread across the country (see Fig. 3).
Table 2 shows the national levels of organic N
production and how it is disposed of. As with mineral
inputs, no organic N is applied to the 49% of squares in
which no crops are grown. In those squares where
organic N is applied, between 683 and 44 549 kg
are added per grid-square, which equates to 1.7–
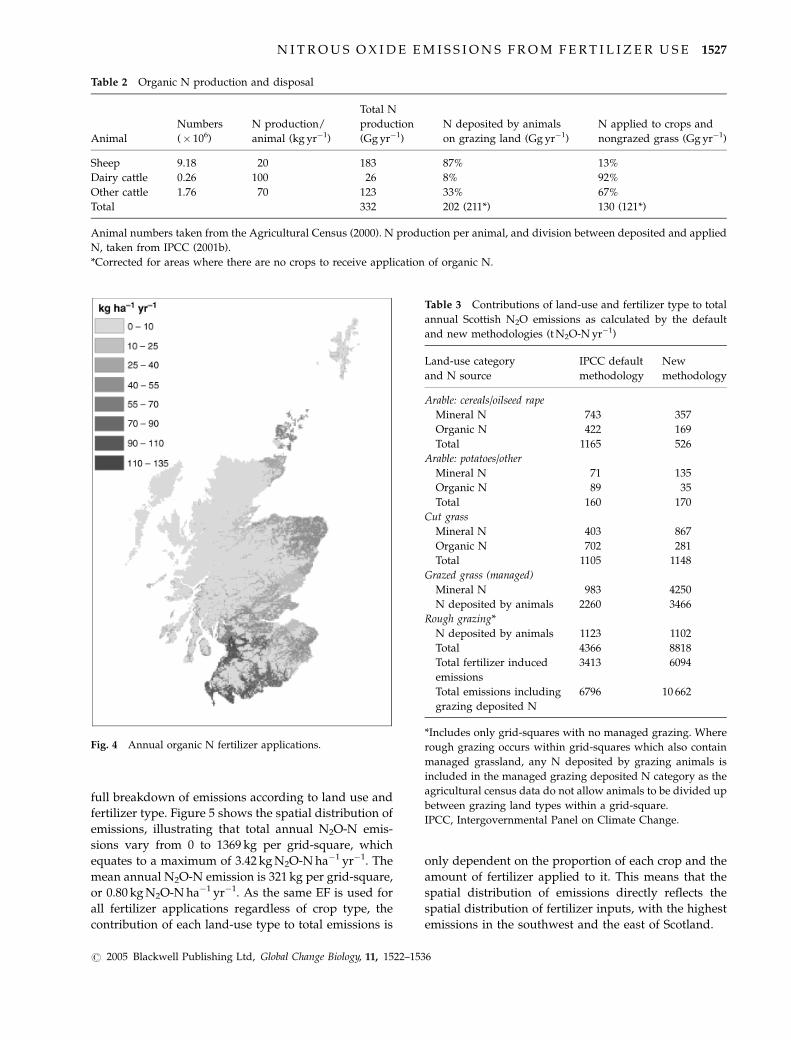
111.4 kg N ha�1 yr�1 (see Fig. 4). As well as being
generally lower than mineral N applications, the
pattern of application for organic N is also much more
concentrated in the southwest.
Fertilizer-derived N2O emissions under currentconditions
Using the IPCC default methodology, total N2O
emissions for Scotland are estimated as 6 796 t N2O-
N yr�1, of which 50% are emissions from mineral and
organic fertilizer application and 50% are emissions
from N deposited by grazing animals. Table 3 shows a
Fig. 3 Annual mineral N fertilizer applications.
1526 H . C . F LY N N et al.
r 2005 Blackwell Publishing Ltd, Global Change Biology, 11, 1522–1536
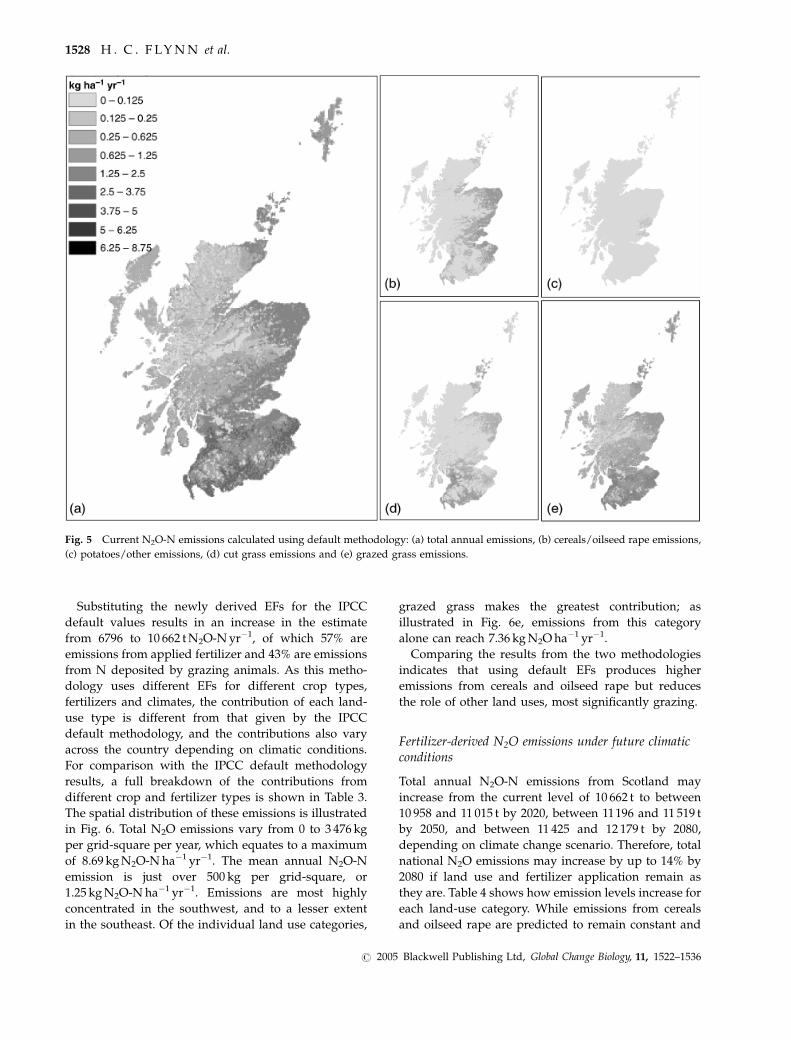
full breakdown of emissions according to land use and
fertilizer type. Figure 5 shows the spatial distribution of
emissions, illustrating that total annual N2O-N emis-
sions vary from 0 to 1369 kg per grid-square, which
equates to a maximum of 3.42 kg N2O-N ha�1 yr�1. The
mean annual N2O-N emission is 321 kg per grid-square,
or 0.80 kg N2O-N ha�1 yr�1. As the same EF is used for
all fertilizer applications regardless of crop type, the
contribution of each land-use type to total emissions is
only dependent on the proportion of each crop and the
amount of fertilizer applied to it. This means that the
spatial distribution of emissions directly reflects the
spatial distribution of fertilizer inputs, with the highest
emissions in the southwest and the east of Scotland.
Table 2 Organic N production and disposal
Animal
Numbers
(� 106)
N production/
animal (kg yr�1)
Total N
production
(Gg yr�1)
N deposited by animals
on grazing land (Gg yr�1)
N applied to crops and
nongrazed grass (Gg yr�1)
Sheep 9.18 20 183 87% 13%
Dairy cattle 0.26 100 26 8% 92%
Other cattle 1.76 70 123 33% 67%
Total 332 202 (211*) 130 (121*)
Animal numbers taken from the Agricultural Census (2000). N production per animal, and division between deposited and applied
N, taken from IPCC (2001b).
*Corrected for areas where there are no crops to receive application of organic N.
Fig. 4 Annual organic N fertilizer applications.
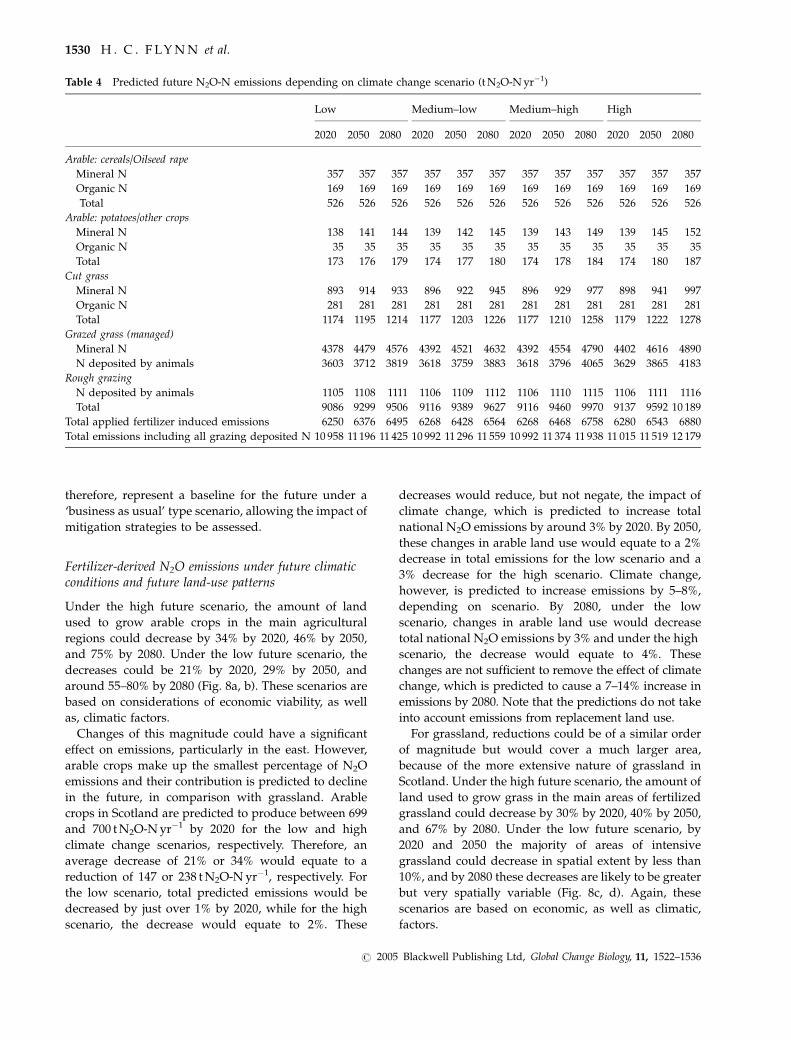
Table 3 Contributions of land-use and fertilizer type to total
annual Scottish N2O emissions as calculated by the default
and new methodologies (t N2O-N yr�1)
Land-use category
and N source
IPCC default
methodology
New
methodology
Arable: cereals/oilseed rape
Mineral N 743 357
Organic N 422 169
Total 1165 526
Arable: potatoes/other
Mineral N 71 135
Organic N 89 35
Total 160 170
Cut grass
Mineral N 403 867
Organic N 702 281
Total 1105 1148
Grazed grass (managed)
Mineral N 983 4250
N deposited by animals 2260 3466
Rough grazing*
N deposited by animals 1123 1102
Total 4366 8818
Total fertilizer induced
emissions
3413 6094
Total emissions including
grazing deposited N
6796 10 662
*Includes only grid-squares with no managed grazing. Where
rough grazing occurs within grid-squares which also contain
managed grassland, any N deposited by grazing animals is
included in the managed grazing deposited N category as the
agricultural census data do not allow animals to be divided up
between grazing land types within a grid-square.
IPCC, Intergovernmental Panel on Climate Change.
N I T R O U S O X I D E E M I S S I O N S F R O M F E R T I L I Z E R U S E 1527
r 2005 Blackwell Publishing Ltd, Global Change Biology, 11, 1522–1536
Substituting the newly derived EFs for the IPCC
default values results in an increase in the estimate
from 6796 to 10 662 t N2O-N yr�1, of which 57% are
emissions from applied fertilizer and 43% are emissions
from N deposited by grazing animals. As this metho-
dology uses different EFs for different crop types,
fertilizers and climates, the contribution of each land-
use type is different from that given by the IPCC
default methodology, and the contributions also vary
across the country depending on climatic conditions.
For comparison with the IPCC default methodology
results, a full breakdown of the contributions from
different crop and fertilizer types is shown in Table 3.
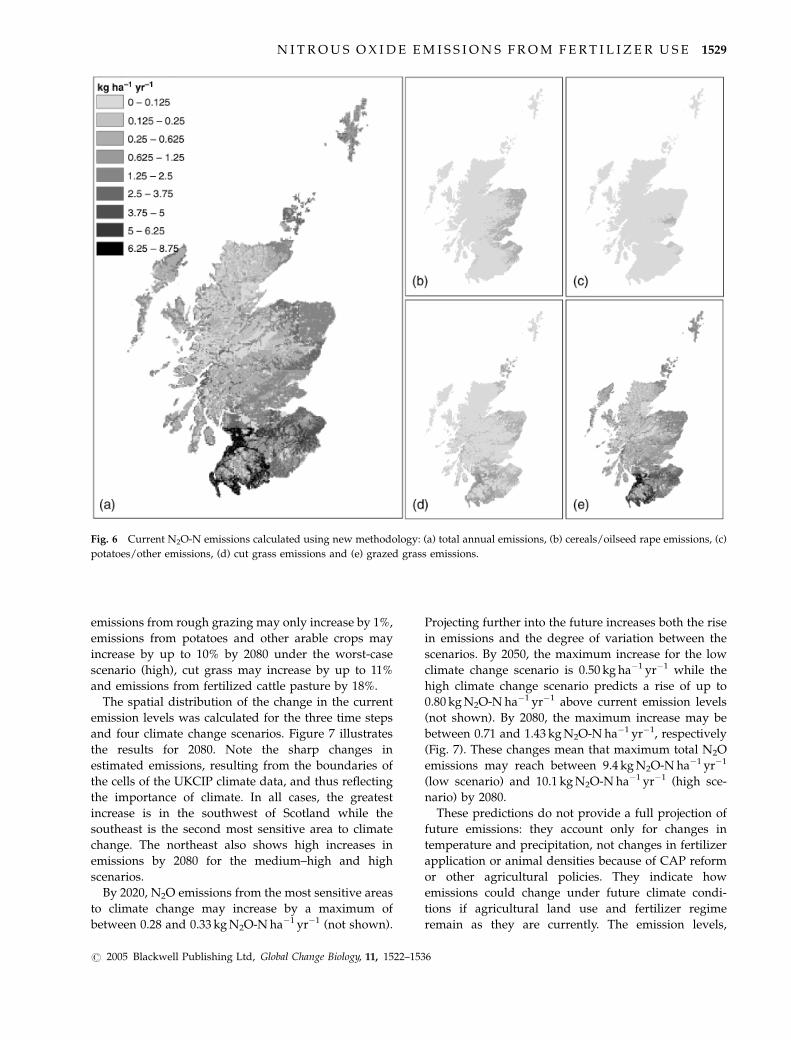
The spatial distribution of these emissions is illustrated
in Fig. 6. Total N2O emissions vary from 0 to 3 476 kg
per grid-square per year, which equates to a maximum
of 8.69 kg N2O-N ha�1 yr�1. The mean annual N2O-N
emission is just over 500 kg per grid-square, or
1.25 kg N2O-N ha�1 yr�1. Emissions are most highly
concentrated in the southwest, and to a lesser extent
in the southeast. Of the individual land use categories,
grazed grass makes the greatest contribution; as
illustrated in Fig. 6e, emissions from this category
alone can reach 7.36 kg N2O ha�1 yr�1.
Comparing the results from the two methodologies
indicates that using default EFs produces higher
emissions from cereals and oilseed rape but reduces
the role of other land uses, most significantly grazing.
Fertilizer-derived N2O emissions under future climaticconditions
Total annual N2O-N emissions from Scotland may
increase from the current level of 10 662 t to between
10 958 and 11 015 t by 2020, between 11196 and 11 519 t
by 2050, and between 11 425 and 12 179 t by 2080,
depending on climate change scenario. Therefore, total
national N2O emissions may increase by up to 14% by
2080 if land use and fertilizer application remain as
they are. Table 4 shows how emission levels increase for
each land-use category. While emissions from cereals
and oilseed rape are predicted to remain constant and
Fig. 5 Current N2O-N emissions calculated using default methodology: (a) total annual emissions, (b) cereals/oilseed rape emissions,
(c) potatoes/other emissions, (d) cut grass emissions and (e) grazed grass emissions.
1528 H . C . F LY N N et al.
r 2005 Blackwell Publishing Ltd, Global Change Biology, 11, 1522–1536
emissions from rough grazing may only increase by 1%,
emissions from potatoes and other arable crops may
increase by up to 10% by 2080 under the worst-case
scenario (high), cut grass may increase by up to 11%
and emissions from fertilized cattle pasture by 18%.
The spatial distribution of the change in the current
emission levels was calculated for the three time steps
and four climate change scenarios. Figure 7 illustrates
the results for 2080. Note the sharp changes in
estimated emissions, resulting from the boundaries of
the cells of the UKCIP climate data, and thus reflecting
the importance of climate. In all cases, the greatest
increase is in the southwest of Scotland while the
southeast is the second most sensitive area to climate
change. The northeast also shows high increases in
emissions by 2080 for the medium–high and high
scenarios.
By 2020, N2O emissions from the most sensitive areas
to climate change may increase by a maximum of
between 0.28 and 0.33 kg N2O-N ha�1 yr�1 (not shown).
Projecting further into the future increases both the rise
in emissions and the degree of variation between the
scenarios. By 2050, the maximum increase for the low
climate change scenario is 0.50 kg ha�1 yr�1 while the
high climate change scenario predicts a rise of up to
0.80 kg N2O-N ha�1 yr�1 above current emission levels
(not shown). By 2080, the maximum increase may be
between 0.71 and 1.43 kg N2O-N ha�1 yr�1, respectively
(Fig. 7). These changes mean that maximum total N2O
emissions may reach between 9.4 kg N2O-N ha�1 yr�1
(low scenario) and 10.1 kg N2O-N ha�1 yr�1 (high sce-
nario) by 2080.
These predictions do not provide a full projection of
future emissions: they account only for changes in
temperature and precipitation, not changes in fertilizer
application or animal densities because of CAP reform
or other agricultural policies. They indicate how
emissions could change under future climate condi-
tions if agricultural land use and fertilizer regime
remain as they are currently. The emission levels,
Fig. 6 Current N2O-N emissions calculated using new methodology: (a) total annual emissions, (b) cereals/oilseed rape emissions, (c)
potatoes/other emissions, (d) cut grass emissions and (e) grazed grass emissions.
N I T R O U S O X I D E E M I S S I O N S F R O M F E R T I L I Z E R U S E 1529
r 2005 Blackwell Publishing Ltd, Global Change Biology, 11, 1522–1536
therefore, represent a baseline for the future under a
‘business as usual’ type scenario, allowing the impact of
mitigation strategies to be assessed.
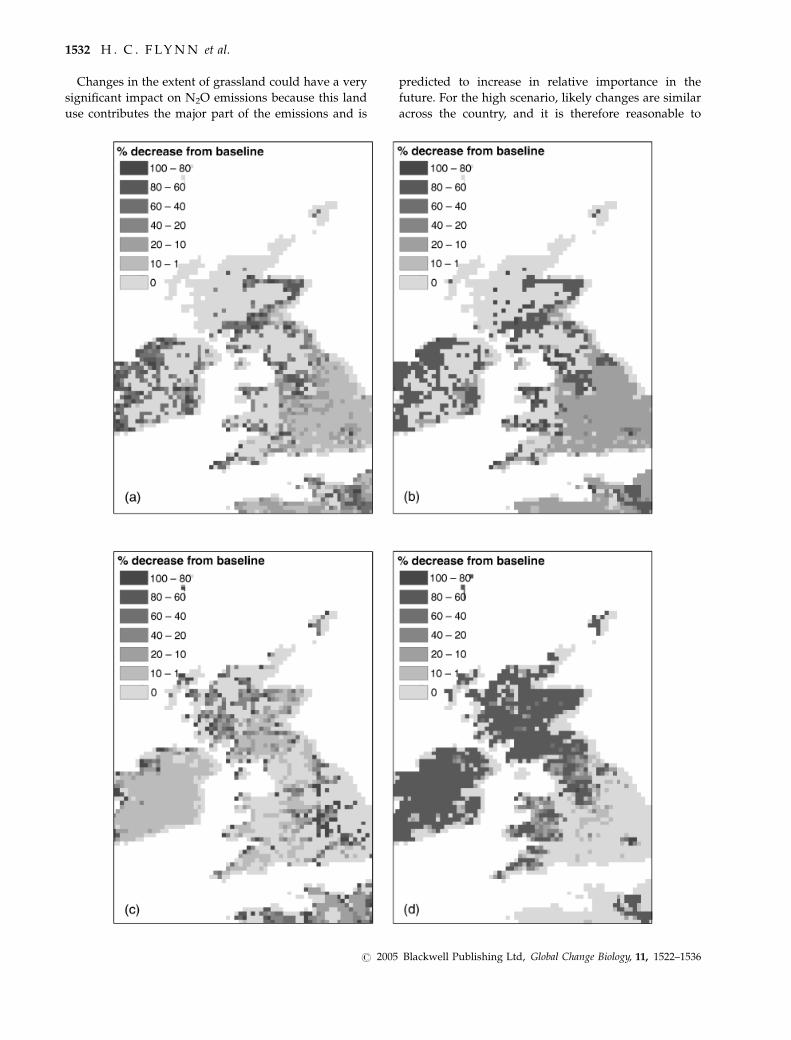
Fertilizer-derived N2O emissions under future climaticconditions and future land-use patterns
Under the high future scenario, the amount of land
used to grow arable crops in the main agricultural
regions could decrease by 34% by 2020, 46% by 2050,
and 75% by 2080. Under the low future scenario, the
decreases could be 21% by 2020, 29% by 2050, and
around 55–80% by 2080 (Fig. 8a, b). These scenarios are
based on considerations of economic viability, as well
as, climatic factors.
Changes of this magnitude could have a significant
effect on emissions, particularly in the east. However,
arable crops make up the smallest percentage of N2O
emissions and their contribution is predicted to decline
in the future, in comparison with grassland. Arable
crops in Scotland are predicted to produce between 699
and 700 t N2O-N yr�1 by 2020 for the low and high
climate change scenarios, respectively. Therefore, an
average decrease of 21% or 34% would equate to a
reduction of 147 or 238 t N2O-N yr�1, respectively. For
the low scenario, total predicted emissions would be
decreased by just over 1% by 2020, while for the high
scenario, the decrease would equate to 2%. These
decreases would reduce, but not negate, the impact of
climate change, which is predicted to increase total
national N2O emissions by around 3% by 2020. By 2050,
these changes in arable land use would equate to a 2%
decrease in total emissions for the low scenario and a
3% decrease for the high scenario. Climate change,
however, is predicted to increase emissions by 5–8%,
depending on scenario. By 2080, under the low
scenario, changes in arable land use would decrease
total national N2O emissions by 3% and under the high
scenario, the decrease would equate to 4%. These
changes are not sufficient to remove the effect of climate
change, which is predicted to cause a 7–14% increase in
emissions by 2080. Note that the predictions do not take
into account emissions from replacement land use.
For grassland, reductions could be of a similar order
of magnitude but would cover a much larger area,
because of the more extensive nature of grassland in
Scotland. Under the high future scenario, the amount of
land used to grow grass in the main areas of fertilized
grassland could decrease by 30% by 2020, 40% by 2050,
and 67% by 2080. Under the low future scenario, by
2020 and 2050 the majority of areas of intensive
grassland could decrease in spatial extent by less than
10%, and by 2080 these decreases are likely to be greater
but very spatially variable (Fig. 8c, d). Again, these
scenarios are based on economic, as well as climatic,
factors.
Table 4 Predicted future N2O-N emissions depending on climate change scenario (t N2O-N yr�1)
Low Medium–low Medium–high High
2020 2050 2080 2020 2050 2080 2020 2050 2080 2020 2050 2080
Arable: cereals/Oilseed rape
Mineral N 357 357 357 357 357 357 357 357 357 357 357 357
Organic N 169 169 169 169 169 169 169 169 169 169 169 169
Total 526 526 526 526 526 526 526 526 526 526 526 526
Arable: potatoes/other crops
Mineral N 138 141 144 139 142 145 139 143 149 139 145 152
Organic N 35 35 35 35 35 35 35 35 35 35 35 35
Total 173 176 179 174 177 180 174 178 184 174 180 187
Cut grass
Mineral N 893 914 933 896 922 945 896 929 977 898 941 997
Organic N 281 281 281 281 281 281 281 281 281 281 281 281
Total 1174 1195 1214 1177 1203 1226 1177 1210 1258 1179 1222 1278
Grazed grass (managed)
Mineral N 4378 4479 4576 4392 4521 4632 4392 4554 4790 4402 4616 4890
N deposited by animals 3603 3712 3819 3618 3759 3883 3618 3796 4065 3629 3865 4183
Rough grazing
N deposited by animals 1105 1108 1111 1106 1109 1112 1106 1110 1115 1106 1111 1116
Total 9086 9299 9506 9116 9389 9627 9116 9460 9970 9137 9592 10 189
Total applied fertilizer induced emissions 6250 6376 6495 6268 6428 6564 6268 6468 6758 6280 6543 6880
Total emissions including all grazing deposited N 10 958 11196 11 425 10 992 11 296 11 559 10 992 11 374 11 938 11 015 11 519 12 179
1530 H . C . F LY N N et al.
r 2005 Blackwell Publishing Ltd, Global Change Biology, 11, 1522–1536
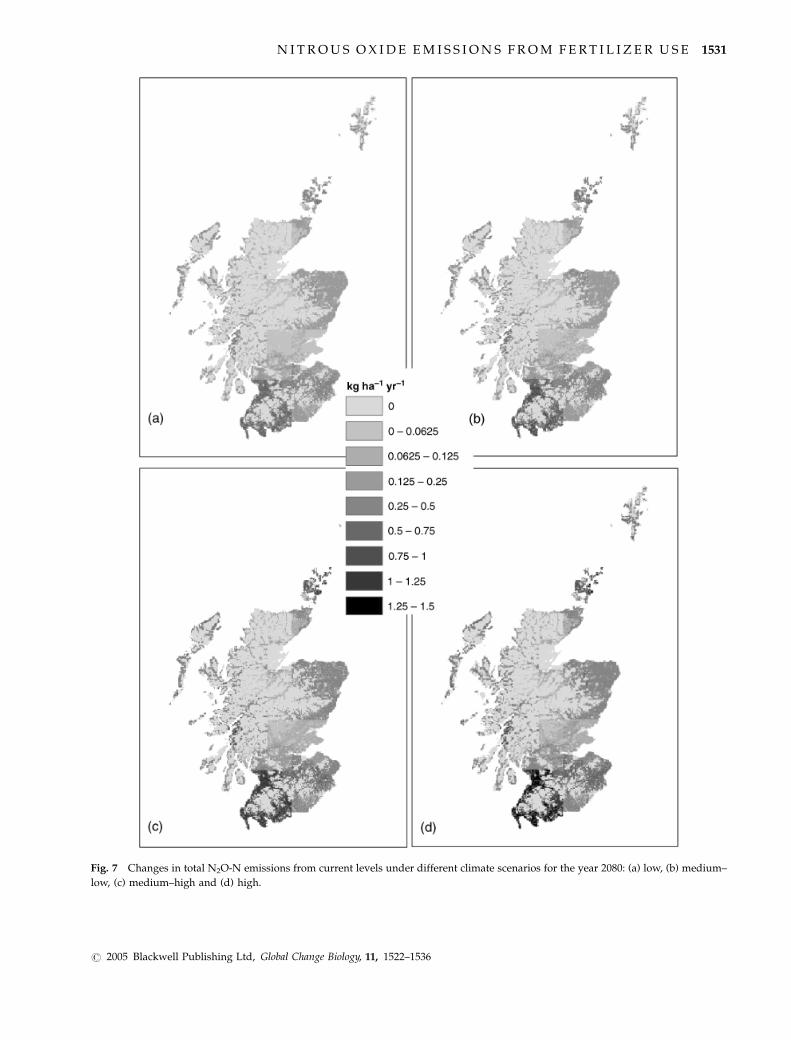
Fig. 7 Changes in total N2O-N emissions from current levels under different climate scenarios for the year 2080: (a) low, (b) medium–
low, (c) medium–high and (d) high.
N I T R O U S O X I D E E M I S S I O N S F R O M F E R T I L I Z E R U S E 1531
r 2005 Blackwell Publishing Ltd, Global Change Biology, 11, 1522–1536
Changes in the extent of grassland could have a very
significant impact on N2O emissions because this land
use contributes the major part of the emissions and is
predicted to increase in relative importance in the
future. For the high scenario, likely changes are similar
across the country, and it is therefore reasonable to
1532 H . C . F LY N N et al.
r 2005 Blackwell Publishing Ltd, Global Change Biology, 11, 1522–1536
assume a proportional reduction in all types of grass-
land. Using this assumption, it is estimated that
reductions in grassland area could reduce predicted
total annual N2O emissions by 28% by 2020, 38% by
2050, and 63% by 2080. Not only would this negate the
effect of climate change, but it would also reduce
emissions significantly below current levels. For the
low scenario however, there is a high degree of spatial
variation in the land-use change scenarios and therefore
a blanket reduction is not reasonable. Calculating
changes in the emissions with any degree of confidence
would require the patterns of land-use change and
grassland emissions to be overlaid, as emission levels
are also very spatially variable. This is difficult to do
accurately because the data grids are different resolu-
tions and projections, and so the changes are not
reported here.
These results suggest that overall reductions in
agriculture could not only negate the effects of climate
change, but also reduce total N2O emissions to below
their current level. The extent of this reduction in
emissions is dependent on the nature of the replace-
ment land use.
Discussion
This study has derived new regionally specific, crop-
and climate-responsive N2O EFs by bringing together
recent field studies of N2O emissions from different
crop types in the UK. The approach retains the
simplicity of the IPCC tier 1 methodology, but also
incorporates climate and crop dependence as a tier 2
method, without introducing the complexity of full
process-based modelling (tier 3). The new factors allow
application to large areas at the relatively high spatial
resolution at which data are now available. The IPCC
default methodology produces an estimate of emissions
from grazed pasture that is only 50% of the estimate
made using the new approach. This is because the IPCC
methodology does not allow for climate dependence, or
include the impact of trampling, which is particularly
significant for cattle. The areas that have the highest
emissions under the new methodology tend to be those
with the highest climate-variable EFs, because of wet
and mild conditions, which favour denitrification. They
also show a high concentration of fertilized cattle-
grazed pastures, the land-use category which is most
affected by increases in these EFs, as emissions from
applied mineral N are further enhanced because of soil
compaction by trampling. As the most climate-sensitive
land use, fertilized pasture produces the highest
absolute emissions, and is also likely to increase by
the greatest percentage as mild and wet conditions are
predicted to become more prevalent in Scotland under
the future climate scenarios.
This has global implications: in 2000, there were over
59 million hectares of permanent pasture in Western
Europe alone (FAOSTAT, 2004), where similar changes
in emissions as observed in Scotland because of
trampling and climate effects might be expected to
hold. Under the IPCC methodology, these areas could
all be assigned the same EFs as for Scotland. Across the
world as a whole, this figure rises to 3489 million
hectares, grazed by 1337 million cattle and 1050 million
sheep (FAOSTAT, 2004).
Several inventories of emissions have been published
previously. Brown et al. (2001) used the IPCC metho-
dology, while Skiba et al. (1996) used average emissions
from different land uses measured in the field and then
scaled up according to total crop areas. A UK wide
inventory of N2O emissions from farmed livestock,
including emissions from manure applied as fertilizer,
has also been produced (Chadwick et al., 1999). These
estimates show similar trends to the results presented
here, in terms of the contribution of different land uses
and fertilizer types, indicating that managed grazing is
the major source of N2O emissions, and that applied
manure makes a significantly smaller contribution than
applied mineral N fertilizers. It is not possible to make a
direct comparison, as the estimates are not broken
down spatially within the UK, but calculations carried
out by Chadwick et al. (1999) indicate how excluding
trampling effects can result in significant underesti-
mates of emissions from grazing land.
Estimates made using an adapted version of DNDC
have been reported on a regional scale (Brown et al.,
2002). Emissions from Scotland for 1990, were esti-
mated as 1950 t N2O-N from fertilizer applications,
370 t N2O-N from applied manure and 500 t N2O-N
from N deposited on grazing land. Emissions were
also broken down according to crop type, with Scottish
grassland accounting for 2470 t N2O-N, cereals for
220 t N2O-N, and other crops for 130 t N2O-N. For most
categories, these estimates are of the same order of
Fig. 8 Predicted changes in agricultural area from current (baseline) levels under different Intergovernmental Panel on Climate
Change (IPCC) climate change scenarios for the year 2080: (a) arable land-use, low scenario, (b) arable land-use, high scenario, (c)
grassland, low scenario and (d) grassland, high scenario Advanced Terrestrial Ecosystem Analysis and Modelling (ATEAM) data
reproduced with permission from ATEAM EU project. Note: Some areas labelled here as 0% change are predicted to increase, but none of
these areas are in Scotland.
N I T R O U S O X I D E E M I S S I O N S F R O M F E R T I L I Z E R U S E 1533
r 2005 Blackwell Publishing Ltd, Global Change Biology, 11, 1522–1536
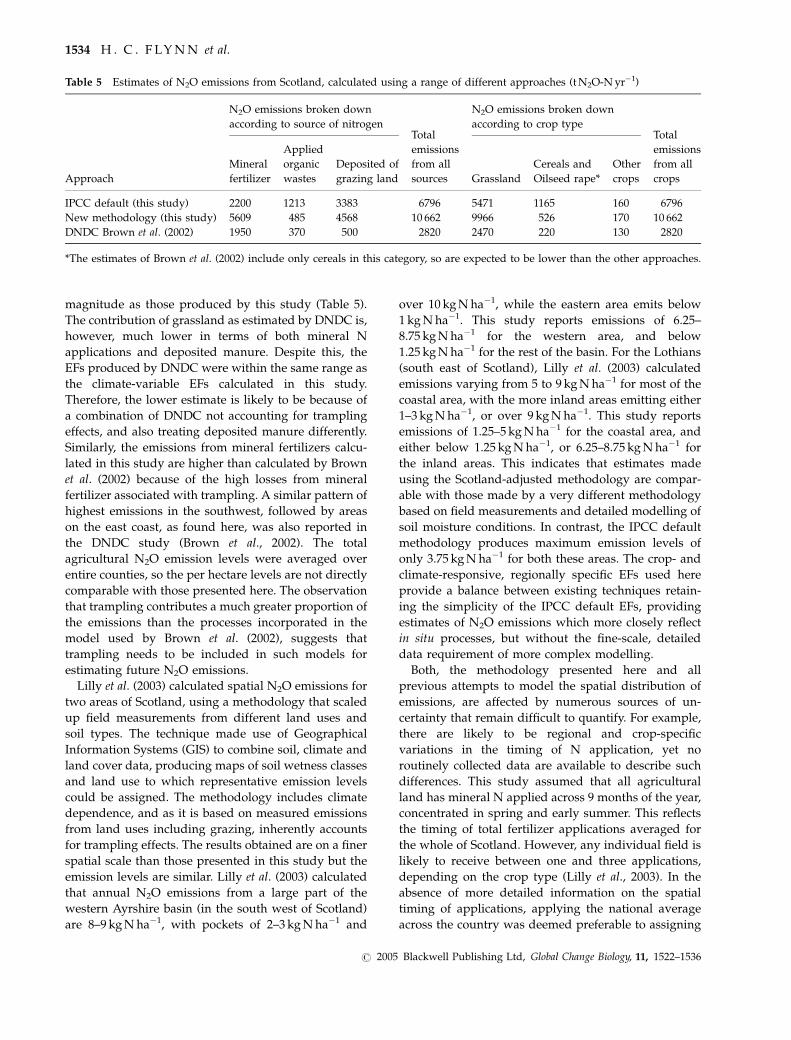
magnitude as those produced by this study (Table 5).
The contribution of grassland as estimated by DNDC is,
however, much lower in terms of both mineral N
applications and deposited manure. Despite this, the
EFs produced by DNDC were within the same range as
the climate-variable EFs calculated in this study.
Therefore, the lower estimate is likely to be because of
a combination of DNDC not accounting for trampling
effects, and also treating deposited manure differently.
Similarly, the emissions from mineral fertilizers calcu-
lated in this study are higher than calculated by Brown
et al. (2002) because of the high losses from mineral
fertilizer associated with trampling. A similar pattern of
highest emissions in the southwest, followed by areas
on the east coast, as found here, was also reported in
the DNDC study (Brown et al., 2002). The total
agricultural N2O emission levels were averaged over
entire counties, so the per hectare levels are not directly
comparable with those presented here. The observation
that trampling contributes a much greater proportion of
the emissions than the processes incorporated in the
model used by Brown et al. (2002), suggests that
trampling needs to be included in such models for
estimating future N2O emissions.
Lilly et al. (2003) calculated spatial N2O emissions for
two areas of Scotland, using a methodology that scaled
up field measurements from different land uses and
soil types. The technique made use of Geographical
Information Systems (GIS) to combine soil, climate and
land cover data, producing maps of soil wetness classes
and land use to which representative emission levels
could be assigned. The methodology includes climate
dependence, and as it is based on measured emissions
from land uses including grazing, inherently accounts
for trampling effects. The results obtained are on a finer
spatial scale than those presented in this study but the
emission levels are similar. Lilly et al. (2003) calculated
that annual N2O emissions from a large part of the
western Ayrshire basin (in the south west of Scotland)
are 8–9 kg N ha�1, with pockets of 2–3 kg N ha�1 and
over 10 kg N ha�1, while the eastern area emits below
1 kg N ha�1. This study reports emissions of 6.25–
8.75 kg N ha�1 for the western area, and below
1.25 kg N ha�1 for the rest of the basin. For the Lothians
(south east of Scotland), Lilly et al. (2003) calculated
emissions varying from 5 to 9 kg N ha�1 for most of the
coastal area, with the more inland areas emitting either
1–3 kg N ha�1, or over 9 kg N ha�1. This study reports
emissions of 1.25–5 kg N ha�1 for the coastal area, and
either below 1.25 kg N ha�1, or 6.25–8.75 kg N ha�1 for
the inland areas. This indicates that estimates made
using the Scotland-adjusted methodology are compar-
able with those made by a very different methodology
based on field measurements and detailed modelling of
soil moisture conditions. In contrast, the IPCC default
methodology produces maximum emission levels of
only 3.75 kg N ha�1 for both these areas. The crop- and
climate-responsive, regionally specific EFs used here
provide a balance between existing techniques retain-
ing the simplicity of the IPCC default EFs, providing
estimates of N2O emissions which more closely reflect
in situ processes, but without the fine-scale, detailed
data requirement of more complex modelling.
Both, the methodology presented here and all
previous attempts to model the spatial distribution of
emissions, are affected by numerous sources of un-
certainty that remain difficult to quantify. For example,
there are likely to be regional and crop-specific
variations in the timing of N application, yet no
routinely collected data are available to describe such
differences. This study assumed that all agricultural
land has mineral N applied across 9 months of the year,
concentrated in spring and early summer. This reflects
the timing of total fertilizer applications averaged for
the whole of Scotland. However, any individual field is
likely to receive between one and three applications,
depending on the crop type (Lilly et al., 2003). In the
absence of more detailed information on the spatial
timing of applications, applying the national average
across the country was deemed preferable to assigning
Table 5 Estimates of N2O emissions from Scotland, calculated using a range of different approaches (t N2O-N yr�1)
Approach
N2O emissions broken down
according to source of nitrogenTotal
emissions
from all
sources
N2O emissions broken down
according to crop typeTotal
emissions
from all
crops
Mineral
fertilizer
Applied
organic
wastes
Deposited of
grazing land Grassland
Cereals and
Oilseed rape*
Other
crops
IPCC default (this study) 2200 1213 3383 6796 5471 1165 160 6796
New methodology (this study) 5609 485 4568 10 662 9966 526 170 10 662
DNDC Brown et al. (2002) 1950 370 500 2820 2470 220 130 2820
*The estimates of Brown et al. (2002) include only cereals in this category, so are expected to be lower than the other approaches.
1534 H . C . F LY N N et al.
r 2005 Blackwell Publishing Ltd, Global Change Biology, 11, 1522–1536
typical dates for fertilizer applications. The level of
error associated with this assumption is entirely
dependent on monthly climatic variations and is
therefore likely to differ from year-to-year. Similarly,
the spatial distribution of livestock at the time of the
June agricultural census may be unrepresentative of the
livestock distribution at other times of the year.
The greatest individual source of uncertainty in the
application of an EF-based methodology is arguably the
effect of soil properties, both on the level of emissions,
and on their response to climatic variation. In this
study, EFs were not adjusted for soil properties such as
texture or wetness class. This is because clear evidence
has been obtained in a 3-year experimental study across
several contrasting Scottish sites (Dobbie et al., 1999)
that EFs depend much more on soil water-filled pore
space (WFPS) and temperature when fertilizer N is
applied, than on properties such as texture, and that
rainfall around the time of fertilization is a useful
surrogate variable for the WFPS. These conclusions are
strongly reinforced by the results of a successor study
carried out across much of Great Britain (Dobbie &
Smith, 2003). The regression model linking EF with
rainfall and temperature used here is based directly on
the relationships in Dobbie et al. (1999), which were
obtained for soils ranging in texture from sandy loam to
clay loam. The organic matter contents of Scottish soils,
particularly under grassland, are generally well above
those of most temperate soils, and the topsoils are
strongly aggregated. Many of the soils are developed
on impervious glacial tills, even though the topsoil
textures are quite coarse, and are characterized by
water tables close to the surface for much of the year.
The result is that matric suctions are often very small,
and the %WFPS values are consequently often high.
Under such conditions, substantial N2O emissions may
occur within hours of applying granular mineral N
fertilizer to the surface, in soils across the texture range;
the most plausible explanation for this is that anaerobic
microsites where N2O production by denitrification can
take place (e.g. Leffelaar, 1986; Smith, 1997) exist within
the organic-rich topsoil aggregates, even in the sandier
soils. The sensitivity of the emissions to short-term
fluctuations in near-surface moisture conditions means
that the latter have a bigger impact than the general soil
hydrological regime, used as the basis for modelling
emissions by Lilly et al. (2003). Further evidence that
high emissions can occur from coarser-textured soils is
provided by Skiba & Ball (2002). They measured N2O
emissions from 13 Scottish arable soils, all under winter
barley, and observed a large difference in emissions
(two orders of magnitude), with by far the highest
postfertilization emissions associated with a freely
drained sandy loam, followed by an imperfectly
drained sandy clay loam. A relationship between
emissions and a combination of bulk density and clay
content was established, but despite uniformity of land
use, land management and mineral N fertilizer input, it
was found to be significant in only one case out of four.
Given the uncertainties which still exist, concerning the
impact of soil properties such as texture on N2O emis-
sions, more data are required before any quantitative
texture-related function can be included in an EF model.
Previous studies have produced national inventories
of emissions, while others have reported empirical
relationships between emissions and climatic condi-
tions. This is the first work to combine the two to
produce future inventories based on predicted climate
change. Combined with the detailed spatial and land-
use breakdowns, this allows mitigation strategies to be
suggested and future research to be focused on regions
and land-use types of key concern in the future. The
work also highlights the importance of taking land-use
changes into consideration, and illustrates that careful
management of land has the potential to reduce the
emissions to below current levels.
The IPCC is currently revising its Guidelines for
National Greenhouse Gas Inventories. In this revision,
due for completion in 2006, agriculture, forestry and
other land-use categories will be brought together into
a single consistent framework. As part of this process,
default EFs will be updated where better values are
available. Further, tier 2 methods, that retain an EF
approach but use regionally specific EFs, will be
elaborated. This study suggests that the use of crop-
and climate-responsive EFs have significant potential
for use in emission inventories, and they could be
explored for use in other regions.
This work highlights the contribution of managed
pastures to N2O emissions, particularly in areas, which
currently have, or are predicted to have in the future, a
wet and mild climate such as in southwest Scotland.
For example, some regions of New Zealand are
predicted to experience an increase in precipitation of
approximately 20% and up to 3 1C higher temperatures
by 2080 (New Zealand Climate Change Office, 2004). The
country currently has 13 863 thousand hectares of
permanent pasture and significantly more grazing ani-
mals than Scotland: 9 million cattle and 42 million sheep
in 2000 (FAOSTAT, 2004). While the results may also be
applicable to other, similar bioclimatic regions, ideally,
regionally specific crop- and climate-responsive EFs
should be derived from experiments within those regions.
Acknowledgements
Land-use data from the ATEAM project (Advanced TerrestrialEcosystem Analysis and Modelling; www.pik-potsdam.de/
N I T R O U S O X I D E E M I S S I O N S F R O M F E R T I L I Z E R U S E 1535
r 2005 Blackwell Publishing Ltd, Global Change Biology, 11, 1522–1536
ateam/; contract EVK2-2000-00075) were used. Climate datafrom UKCIP were used. UKCIP02 climate data are r CrownCopyright 2002. The UKCIP02 Climate Scenario data have beenmade available by the Department for Environment, Food andRural Affairs (DEFRA). DEFRA accepts no responsibility for anyinaccuracies or omissions in the data nor for any loss or damagedirectly or indirectly caused to any person or body by reason of,or arising out of, any use of this data. Agricultural census datawere purchased from EDINA at the Edinburgh Data Library(http://datalib.ed.ac.uk/EUDL/agriculture/griddata.html).The grid-square agricultural census data are derived from thedata obtained for recognized geographies from the ScottishExecutive Environment and Rural Affairs Department (SEER-AD), the Department of Environment, Food and Rural Affairs(DEFRA), and the Welsh Assembly.
H. Flynn would like to thank Martin Wattenbach forassistance with the GIS work. The authors are grateful toSEERAD for funding this work under contract number UEH/007/03 and to the two anonymous reviewers for theirconstructive comments.
References
Anon (2000a) The British Survey of Fertilizer Practice. BSFP
Authority.
Anon (2000b) Fertiliser Review. Fertiliser Manufacturers Associa-
tion, Peterborough.
Akiyama H, McTaggart IP, Ball BC et al. (2004) N2O, NO, and
NH3 emissions from soil after the application of organic
fertilizers, urea and water. Water, Air and Soil Pollution, 156,
113–129.
Ball BC, McTaggart IP, Scott A (2004) Mitigation of greenhouse
gas emissions from soil under silage production by use of
organic manures or slow-release fertilizer. Soil Use and
Management, 20, 287–295.
Brown L, Armstrong Brown S, Jarvis SC et al. (2001) An
inventory of nitrous oxide emissions from agriculture in the
UK using the IPCC methodology: emission estimate, uncer-
tainty and sensitivity analysis. Atmospheric Environment, 35,
1439–1449.
Brown L, Syed B, Jarvis SC et al. (2002) Development and
application of a mechanistic model to estimate emission of
nitrous oxide from UK agriculture. Atmospheric Environment,
36, 917–928.
Chadwick DR, Sneath RW, Phillips VR et al. (1999) A UK
inventory of nitrous oxide emissions from farmed livestock.
Atmospheric Environment, 33, 3345–3354.
Dobbie KE, McTaggart I.P, Smith KA (1999) Nitrous oxide emis-
sions from intensive agricultural systems: variations between
crops and seasons, key driving variables, and mean emission
factors. Journal of Geophysical Research, 104, 26891–26899.
Dobbie KE, Smith KA (2003) Nitrous oxide emission factors for
agricultural soils in Great Britain: the impact of soil water-
filled pore space and other controlling variables. Global Change
Biology, 13, 204–218.
FAOSTAT (2004) Food and Agriculture Organization of the
United Nations statistical databases. http://apps.fao.org/.
Flessa H, Beese F (2000) Laboratory estimates of trace gas
emissions following surface application and injection of cattle
slurry. Journal of Environmental Quality, 29, 262–268.
Flessa H, Ruser R, Schilling R et al. (2002) N2O and CH4 fluxes in
potato fields: automated measurement, management effects
and temporal variation. Geoderma, 105, 307–325.
Intergovernmental Panel on Climate Change (IPCC) (1995) In:
Climate Change 1995 (eds Houghton JT et al.), Cambridge
University Press, Cambridge, UK.
IPCC (1997) Greenhouse gas emissions from agricultural soils.
In: Greenhouse Gas Inventory Reference Manual. Revised 1996
IPCC Guidelines for National Greenhouse Gas Inventories
(eds Houghton JT et al.), UK Meteorological Office, Bracknell,
UK.
IPCC (2000) Special Report on Emissions Scenarios. Cambridge
University Press, Cambridge, UK.
IPCC (2001a) Climate Change: The Scientific Basis. Cambridge
University Press, Cambridge, UK.
IPCC (2001b) Good Practice Guidance and Uncertainty Management
in National Greenhouse Gas Inventories. Intergovernmental
Panel on Climate Change (IPCC), Institute for Global
Environmental Strategies, Tokyo, Japan.
Leffelaar PA (1986) Dynamics of partial anaerobiosis, denitrifica-
tion, and water in a soil aggregate: experimental. Soil Science,
142, 352–366.
Lilly A, Ball BC, McTaggart IP et al. (2003) Spatial and temporal
scaling of nitrous oxide emissions from the field to the
regional scale in Scotland. Nutrient Cycling in Agroecosystems,
66, 241–257.
New Zealand Climate Change Office (2004) Preparing for
Climate Change: A Guide for Local Government in New Zealand.
Ministry for the Environment, Wellington, New Zealand
pp. 6–7.
Oenema O, Velthof GL, Yamulki S et al. (1997) Nitrous oxide
emissions from grazed grassland. Soil Use and Management, 13,
288–295.
Rounsevell MDA, Ewert F, Reginster I et al. (2005) Future
scenarios of European agricultural land-use. II: estimating
changes in land-use and regional allocation. Agriculture,
Ecosystems and Environment, 107, 117–135.
Skiba U, Ball B (2002) The effect of soil texture and soil drainage
on emissions of nitric oxide and nitrous oxide. Soil Use and
Management, 18, 52–60.
Skiba U, McTaggart IP, Smith KA et al. (1996) Estimates of
nitrous oxide emissions from soil in the UK. Energy Conversion
and Management, 37, 1303–1308.
Smith KA (1997) The potential for feedback effects induced by
global warming on emissions of nitrous oxide by soils. Global
Change Biology, 3, 327–338.
Smith KA, Dobbie KE (2002) Nitrous oxide emissions from
agricultural soils and the potential for their reduction. Final Project
Report, DEFRA Contract CC0233.
1536 H . C . F LY N N et al.
r 2005 Blackwell Publishing Ltd, Global Change Biology, 11, 1522–1536