System reliability analysis of the external stability of reinforced soil structures
21
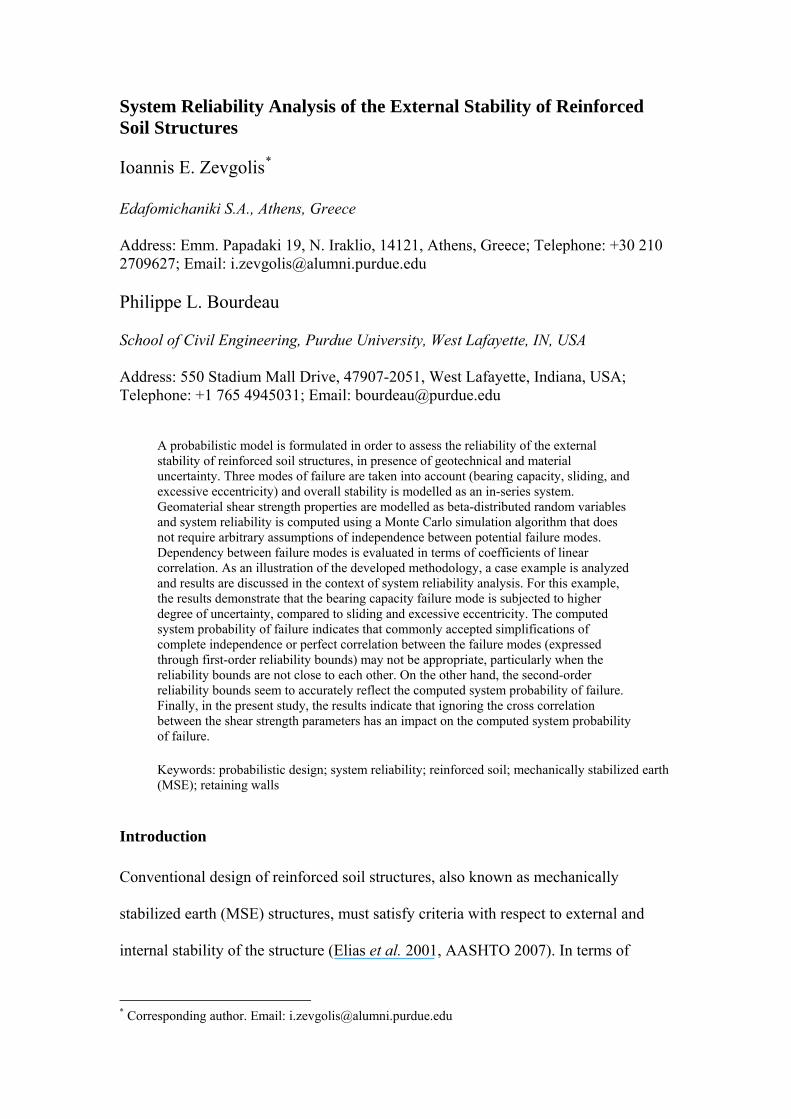
System Reliability Analysis of the External Stability of Reinforced Soil Structures Ioannis E. Zevgolis * Edafomichaniki S.A., Athens, Greece Address: Emm. Papadaki 19, N. Iraklio, 14121, Athens, Greece; Telephone: +30 210 2709627; Email: [email protected] Philippe L. Bourdeau School of Civil Engineering, Purdue University, West Lafayette, IN, USA Address: 550 Stadium Mall Drive, 47907-2051, West Lafayette, Indiana, USA; Telephone: +1 765 4945031; Email: [email protected] A probabilistic model is formulated in order to assess the reliability of the external stability of reinforced soil structures, in presence of geotechnical and material uncertainty. Three modes of failure are taken into account (bearing capacity, sliding, and excessive eccentricity) and overall stability is modelled as an in-series system. Geomaterial shear strength properties are modelled as beta-distributed random variables and system reliability is computed using a Monte Carlo simulation algorithm that does not require arbitrary assumptions of independence between potential failure modes. Dependency between failure modes is evaluated in terms of coefficients of linear correlation. As an illustration of the developed methodology, a case example is analyzed and results are discussed in the context of system reliability analysis. For this example, the results demonstrate that the bearing capacity failure mode is subjected to higher degree of uncertainty, compared to sliding and excessive eccentricity. The computed system probability of failure indicates that commonly accepted simplifications of complete independence or perfect correlation between the failure modes (expressed through first-order reliability bounds) may not be appropriate, particularly when the reliability bounds are not close to each other. On the other hand, the second-order reliability bounds seem to accurately reflect the computed system probability of failure. Finally, in the present study, the results indicate that ignoring the cross correlation between the shear strength parameters has an impact on the computed system probability of failure. Keywords: probabilistic design; system reliability; reinforced soil; mechanically stabilized earth (MSE); retaining walls Introduction Conventional design of reinforced soil structures, also known as mechanically stabilized earth (MSE) structures, must satisfy criteria with respect to external and internal stability of the structure (Elias et al. 2001, AASHTO 2007). In terms of * Corresponding author. Email: [email protected]
Transcript of System reliability analysis of the external stability of reinforced soil structures
System Reliability Analysis of the External Stability of Reinforced Soil Structures Ioannis E. Zevgolis*
Edafomichaniki S.A., Athens, Greece Address: Emm. Papadaki 19, N. Iraklio, 14121, Athens, Greece; Telephone: +30 210 2709627; Email: [email protected] Philippe L. Bourdeau School of Civil Engineering, Purdue University, West Lafayette, IN, USA Address: 550 Stadium Mall Drive, 47907-2051, West Lafayette, Indiana, USA; Telephone: +1 765 4945031; Email: [email protected]
A probabilistic model is formulated in order to assess the reliability of the external stability of reinforced soil structures, in presence of geotechnical and material uncertainty. Three modes of failure are taken into account (bearing capacity, sliding, and excessive eccentricity) and overall stability is modelled as an in-series system. Geomaterial shear strength properties are modelled as beta-distributed random variables and system reliability is computed using a Monte Carlo simulation algorithm that does not require arbitrary assumptions of independence between potential failure modes. Dependency between failure modes is evaluated in terms of coefficients of linear correlation. As an illustration of the developed methodology, a case example is analyzed and results are discussed in the context of system reliability analysis. For this example, the results demonstrate that the bearing capacity failure mode is subjected to higher degree of uncertainty, compared to sliding and excessive eccentricity. The computed system probability of failure indicates that commonly accepted simplifications of complete independence or perfect correlation between the failure modes (expressed through first-order reliability bounds) may not be appropriate, particularly when the reliability bounds are not close to each other. On the other hand, the second-order reliability bounds seem to accurately reflect the computed system probability of failure. Finally, in the present study, the results indicate that ignoring the cross correlation between the shear strength parameters has an impact on the computed system probability of failure.
Keywords: probabilistic design; system reliability; reinforced soil; mechanically stabilized earth (MSE); retaining walls
Introduction Conventional design of reinforced soil structures, also known as mechanically
stabilized earth (MSE) structures, must satisfy criteria with respect to external and
internal stability of the structure (Elias et al. 2001, AASHTO 2007). In terms of
* Corresponding author. Email: [email protected]
external stability, reinforced soil structures are analyzed similar to other type of
gravity retaining walls: stability must be verified with respect to sliding along the base
of the structure and bearing capacity of the foundation soil. In addition, the resultant
of the loads is required to intersect the base of the wall within the middle third; hence
the entire area beneath the base is theoretically subjected to compression.
Traditionally, design methods have been based on deterministic approach and on the
concept of empirical safety factors. However this approach presents two
inconveniences. 1) The uncertainty on the design loads and the soil resistance is not
considered explicitly, but implicitly by using a safety factor based on experience.
Recently, there have been efforts to develop new design methods, such as the Load
and Resistance Factor Design (LRFD) and the Eurocode, that will be founded on
rigorous analysis and statistical treatment of all included uncertainties (Orr 2000,
Phoon et al. 2003). 2) Global or partial safety factors do not accurately reflect the
reliability of a geotechnical structure. As Whitman (1984) reported, safety factors
themselves tell little as to the possibility that a failure may occur. In fact, they can be
misleading, because of the ambiguity that exists between them and the underlying
level of risk (Kulhawy and Phoon 1996). For instance, large safety factors do not
necessarily reflect lower level of risk, because their effect can be negated by the
presence of larger uncertainties (Christian et al. 1994, Kulhawy and Phoon 1996).
Probabilistic analysis offers the framework to address the above shortcomings by
explicitly accounting for sources of uncertainty in the computation of the reliability.
Each mode of failure can be analyzed separately and then corresponding components’
reliabilities can be computed. But more importantly, and provided some modeling
simplifications are accepted, an overall measure of reliability of the retaining wall can
be assessed. The key advantage of the system modeling approach is that it provides a
single index for quantifying the structure’s overall reliability, instead of partial and
unrelated components’ reliabilities. This greatly facilitates the use of reliability as a
criterion of design optimization and decision support.
Previous probabilistic models of the external stability of reinforced soil walls
either do not address system reliability issues at all, or address safety as a series
system with independent components. For example, using Monte Carlo simulations,
Chalermyanont and Benson (2005a, 2005b) examined separately the different modes
of external stability (i.e. overturning, sliding and bearing capacity) and determined
components’ reliabilities for each one of them. However, their attempt to obtain an
overall measure of the reliability was based on the assumption that the different
modes of failure are independent and mutually exclusive events. As a result of the
latter assumption, it is implied that the system probability of failure may exceed
values of 100%. Sayed et al. (2008) performed reliability analyses of reinforced soil
walls for both static and seismic conditions, using three methods: first-order second-
moment method (FOSM), point estimate method (PEM), and first-order reliability
method (FORM). Their system analysis though is based on the assumption of
statistically independent failure modes. A similar concept, of statistically independent
failure modes, was also used on studies of reliability-based design of cantilever sheet
pile walls by Babu and Basha (Babu and Basha 2008, Basha and Babu 2008). The
same authors recently presented an interesting methodology on reliability assessment
of external stability of reinforced soil walls subjected to seismic excitations (Basha
and Babu 2009). In this work, system reliability is not addressed, but in different
failure modes reliability indices (for sliding, overturning, bearing capacity and
eccentricity modes) are obtained.
The present study suggests a system reliability assessment model, where the
dependency between failure modes is quantified and taken into account in reliability
calculations. Analysis is performed using Monte Carlo simulations for assumed
probability distributions of the design controlling parameters. The model allows not
only for computation of components’ reliabilities, but for direct computation of the
system reliability, too. It is acknowledged that design and analyses are simplifications
of reality and may produce “biased” prediction of actual performance. Model
uncertainty, in the context of reliability analysis, is still a domain largely unexplored.
Its assessment would require statistical databases of prediction versus performance be
assembled and analyzed. In absence of such assessment, it is important to recognize
that computed reliability or probability of failure have only a relative meaning. This
can be used in comparative analyses, such as optimization studies, provided these
comparisons are based on the same models.
Basic features of the model The type of reinforced soil wall being considered herein for probabilistic analysis is
representative of typical reinforced soil walls frequently used in practice as bridge
abutments. Only the wall’s external stability under static conditions is considered,
through analysis of sliding, bearing capacity, and eccentricity. Probabilistic analysis
of the internal stability is presented elsewhere (Zevgolis 2007, Zevgolis and Bourdeau
2008). For all involved computations, the present study follows the FHWA guidelines
(Elias et al. 2001).
Performance functions
In order to represent limit states of equilibrium, performance functions are defined as
Safety Ratios (SR), by analogy with safety factors. So, SR with respect to sliding,
bearing capacity inadequacy, and excessive eccentricity are respectively expressed by
(Elias et al. 2001):
[ ] RSL
SL
FSR
F= ∑∑
(1)
[ ] ,
max
b LBC
qSR
q= (2)
[ ] / 6e
BSRe
= (3)
where and RF∑ SLF∑ are the summations of the base sliding resisting and driving
forces, respectively, qb,L and qmax are the foundation ultimate bearing pressure and
maximal applied pressure, respectively, B is the width of the wall, and e is the
eccentricity. The above mathematical expressions are similar to those of safety factors
but, in contrast with the latter, safety ratios are functions of parameters affected by
uncertainty. As these parameters are modeled as random variables, the three safety
ratios are functions of random variables and therefore, are random quantities, too.
Based on equations 1 to 3, failure for each mode i (where i can be SL, BC, or e) is
defined as the event where the corresponding SR is less than one. So, the probability
of failure (PF) for any mode is given by:
[ ]1F iiP P SR= < (4)
Random variables Four random variables are included in the present model: the friction angles of the
reinforced soil, the retained backfill, and the foundation soil (φREINF, φRET, and φF
respectively) and the cohesion of the foundation soil (cF). All other soil properties, as
well as reinforcement characteristics and loading conditions are assumed deterministic
variables. Apparently, more parameters could have been modelled as random
variables. Such an example is the unit weight of soil; in fact, the authors modeled unit
weights as random variables on previous works (Zevgolis and Bourdeau 2006).
However, as clearly reported by Baecher and Christian (2003), unit weight displays
considerably less variability than do most other soil properties, usually with COVs
less than 10%. This is so for two fundamental reasons: first, specific gravities for most
soil minerals lie within a narrow range of values and second, the procedure for
measuring unit weights is reasonably precise (thus the expected measurement error is
relative small). So, based on the above, the authors believe that it is a reasonable
assumption to model unit weights deterministically. Other parameters that could have
been modeled as random variables (in addition to the soil parameters) include the live
loads from the superstructure. In fact, coefficients of variation of live loads
encountered in structural engineering are often quite large. However, these are not
addressed in the present study, because the authors concentrate on geotechnical
sources of uncertainty. Of course, a comprehensive model should include these
specifically, but the goal here is to investigate the geotechnical design process.
Besides, it should always be taken into consideration that the greater the number of
random variables included in a model, the less precise the outcome of the model
might be. So, the scope of the present work is not to model probabilistically as many
parameters as possible, but to present a methodology for reliability assessment; the
choice regarding the number of random variables depends every time on the provided
data and information and it might differs on a project by project basis.
Each random variable is represented by the first two order moments (mean value μ
and standard deviation σ, or coefficient of variation COV), and the minimum and
maximum value. Therefore, based on the principle of maximum entropy, the random
variables are modeled using Beta distributions (Oboni and Bourdeau 1985, Harr
1987).
Perfect autocorrelation is assumed over the volume of interest for all four
shear strength properties, i.e. the variability of each one of them is considered in the
calculations by a global value. This is equivalent to say that each parameter is
determined by a perfectly auto-correlated random space along the soil layer.
Therefore, the adopted model specifies a higher bound for the distances and the
functions of auto-correlation. This simplifying assumption should slightly affect the
system reliability analysis numerical results but without loss of general validity. The
issue of cross correlations between the shear strength properties of a soil layer is not
clearly reported in the literature (Fenton and Griffiths 2003). Several authors in the
past have reported values of cross correlation between cohesion and friction angle that
are usually negative (Lumb 1970, Wolff 1985, Cherubini 2000). However, the wide
range of documented values and the ambiguity behind the conditions they are
obtained, does not allow for reliable conclusions. In this context, a parametric analysis
was performed, in order to assess the impact of cross correlation between cF and φF in
the probability of failure.
Assessment of reliability Monte Carlo simulations were used for computation of the reliability. External
stability was modeled as a system in series with zero redundancy. This means that if
at least one mode of failure occurs, then the whole system fails. On a probabilistic
context, failure is the event in which any of [SRSL < 1], [SRBC < 1], [SRe < 1] occurs.
The probability of occurrence (PF) is given by the union of these three events:
( ) ( ) ( )1 1F SL BC eP P SR SR SR 1⎡ ⎤= < ∪ < ∪ <⎣ ⎦ (5)
where P[-] denotes the probability of the event indicated within the brackets. In
general, computation of PF by exact integration of the involved multivariate functions
is impractical. This difficulty can be overcome by using approximate methods that
have been developed specifically for system reliability analysis. The simplest in the
present case would consist in determining the first-order reliability bounds of the
system (Ang and Amin 1968). If the safety ratios are all positively correlated, then the
system probability of failure for m failure modes can be written as (Ang and Tang
1984):
(6) { } (,1
max 1 1m
F i F F ii
P P P=
≤ ≤ − −∏ ),
The terms { },max F iP and correspond to the exact system probabilities
of failure, when safety ratios are perfectly correlated and totally independent,
respectively.
( ,1
1 1m
F ii
P=
− −∏ )
jE∩
The first order bounds described above may be narrowed down by taking into
account the correlation between pairs of the potential modes of failure. Apparently,
the resulting improved bounds require the probabilities of joint events and thus may
be called bi-modal or second order bounds (Ang and Tang 1984). For m failure
modes, the second order lower and upper bound failure probabilities are given by the
following equation (Ditlevsen 1979):
( ) ( )1
12 1 1 2
max ,0 maxm i m m
F Fi i j F Fi ii j i i j i
P P P E E P P P E−
= = = = <
⎧ ⎫+ − ∩ ≤ ≤ −⎨ ⎬
⎩ ⎭∑ ∑ ∑ ∑
(7)
where Ei and Ej are the individual failure events (with E1 being the largest set and PF1
being its probability of occurrence). It shall be noted that different orderings of the
failure modes may influence the results of equation 7. This means that the bounds
corresponding to different orderings may have to be evaluated to determine the
narrowest bounds (Ditlevsen 1979). In addition, the analytical computations of the
joint probabilities P(Ei∩Ej) may be difficult (Ang and Tang 1984).
The approach used in the present study is a still approximate, but more direct
computation of the reliability of external stability using a Monte Carlo simulation
algorithm. The dependency between the components’ reliability is evaluated by means
of coefficients of linear correlation (ρ), which is directly computed through simple
Microsoft® Excel functions. For any pair of i - j modes, ρ is given by:
,i j
i j
i jSR SR
SR SR
Cov SR SRρ
σ σ
⎡ ⎤⎣= ⎦ (8)
in which Cov is the covariance of the variables SRi, SRj, and iSRσ ,
jSRσ are their
standard deviations. Conceptually, Cov indicates the tendency of two variables to vary
together. The coefficient of linear correlation is a normalized form of Cov, so it does
not depend on the origins and units of measurements. It is defined on [-1, 1]. Because
, it is always ,i j j iCov SR SR Cov SR SR⎡ ⎤ ⎡=⎣ ⎦ ⎣ , ⎤⎦ i j j iSR SR SR SRρ ρ= . When two random
variables are perfectly linearly correlated, then ρ is equal to +1 (correlated on a
positive way) or -1 (correlated on a negative way). When two random variables are
completely independent, then ρ is equal to 0, while values between 0 and 1 (or 0 and -
1) represent intermediate correlations. So, ρ may serve as a measurement of
correlation of the three modes of failure with each other. It shall be noted that
whenever two variables X and Y are completely independent to each other then ρΧΥ =
0; however, the converse is not true. There are cases where ρΧΥ = 0 even for variables
that are connected to each other with a function, as long as this function is strongly
non-linear. Therefore, two independent variables are uncorrelated, but two
uncorrelated variables need not be independent (Shooman 1990).
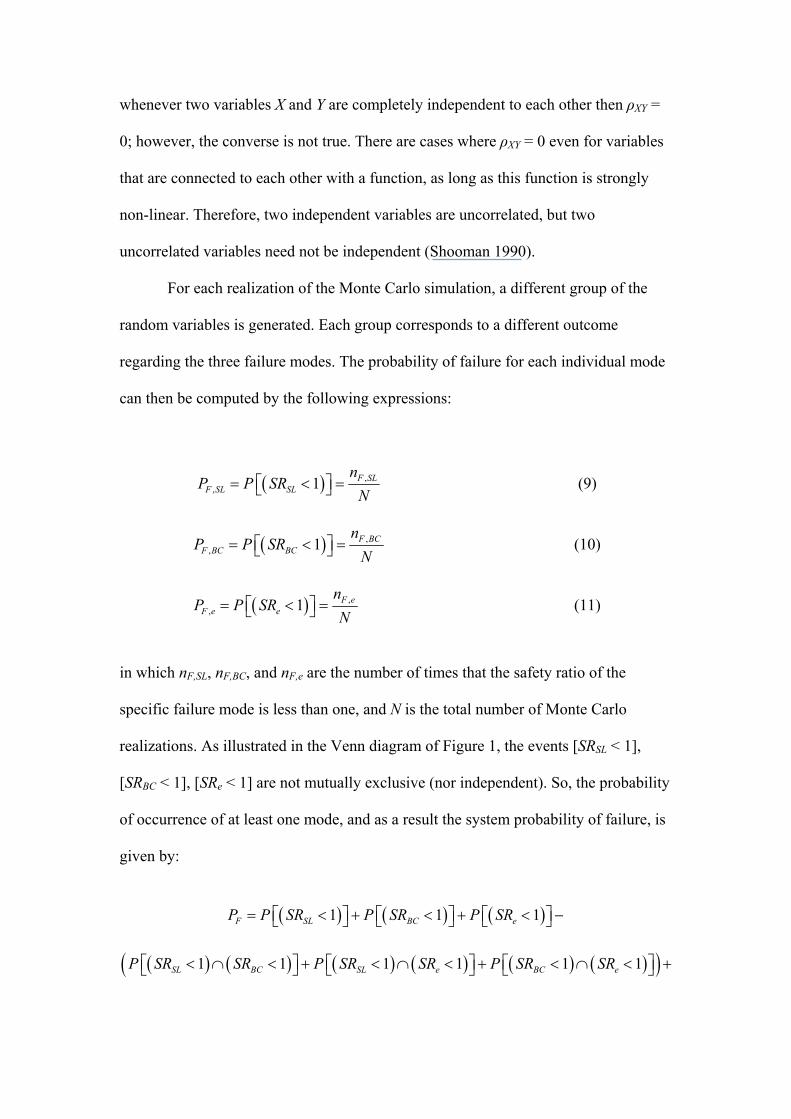
For each realization of the Monte Carlo simulation, a different group of the
random variables is generated. Each group corresponds to a different outcome
regarding the three failure modes. The probability of failure for each individual mode
can then be computed by the following expressions:
( ) ,, 1 F SL
F SL SL
nP P SR
N⎡ ⎤= < =⎣ ⎦ (9)
( ) ,, 1 F BC
F BC BC
nP P SR
N⎡ ⎤= < =⎣ ⎦ (10)
( ) ,, 1 F e
F e e
nP P SR
N⎡ ⎤= < =⎣ ⎦ (11)
in which nF,SL, nF,BC, and nF,e are the number of times that the safety ratio of the
specific failure mode is less than one, and N is the total number of Monte Carlo
realizations. As illustrated in the Venn diagram of Figure 1, the events [SRSL < 1],
[SRBC < 1], [SRe < 1] are not mutually exclusive (nor independent). So, the probability
of occurrence of at least one mode, and as a result the system probability of failure, is
given by:
( ) ( ) ( )1 1F SL BC eP P SR P SR P SR⎡ ⎤ ⎡ ⎤ ⎡= < + < + <⎣ ⎦ ⎣ ⎦ ⎣ 1 ⎤ −⎦
( ) ( ) ( ) ( ) ( ) ( )( )1 1 1 1 1 1SL BC SL e BC eP SR SR P SR SR P SR SR⎡ ⎤ ⎡ ⎤ ⎡< ∩ < + < ∩ < + < ∩ < +⎣ ⎦ ⎣ ⎦ ⎣ ⎤⎦
( ) ( ) ( )1 1SL BC eP SR SR SR⎡ < ∩ < ∩ <⎣ 1 ⎤⎦
1 1SL BCP SR SR⎡ ⎤< ∩ <⎣ ⎦
(12) where , ( ) ( ) ( ) ( )1 1SL eP SR SR⎡ ⎤< ∩ <⎣ ⎦ ,
( ) ( )1 1BC eP SR SR⎡ ⎤< ∩ <⎣ ⎦ and ( ) ( ) ( )1 1SL BC eP SR SR SR 1⎡ ⎤< ∩ < ∩ <⎣ ⎦ are given by
the number of times in which the two (or three) corresponding safety ratios are
simultaneously less than one, over the total number of Monte Carlo realizations.
Case example
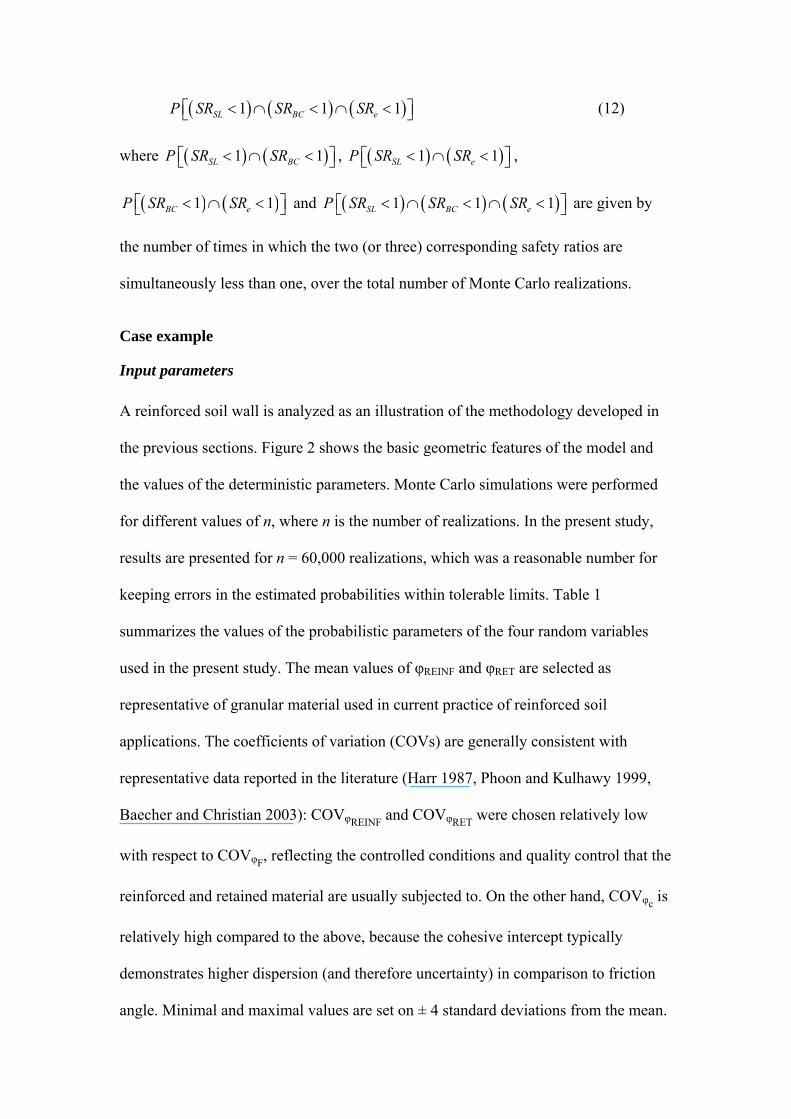
Input parameters
A reinforced soil wall is analyzed as an illustration of the methodology developed in
the previous sections. Figure 2 shows the basic geometric features of the model and
the values of the deterministic parameters. Monte Carlo simulations were performed
for different values of n, where n is the number of realizations. In the present study,
results are presented for n = 60,000 realizations, which was a reasonable number for
keeping errors in the estimated probabilities within tolerable limits. Table 1
summarizes the values of the probabilistic parameters of the four random variables
used in the present study. The mean values of φREINF and φRET are selected as
representative of granular material used in current practice of reinforced soil
applications. The coefficients of variation (COVs) are generally consistent with
representative data reported in the literature (Harr 1987, Phoon and Kulhawy 1999,
Baecher and Christian 2003): COVφREINF and COVφRET were chosen relatively low
with respect to COVφF, reflecting the controlled conditions and quality control that the
reinforced and retained material are usually subjected to. On the other hand, COVφc is
relatively high compared to the above, because the cohesive intercept typically
demonstrates higher dispersion (and therefore uncertainty) in comparison to friction
angle. Minimal and maximal values are set on ± 4 standard deviations from the mean.
The physical meaning and the likely range of fluctuation of the examined soil
properties is consistent with these values. Note that for μ – 4σ, the minimum value of
cF becomes negative, and therefore in this case the minimum value was taken equal to
zero.
Results
Table 2 presents the basic statistical parameters obtained from the analysis. Statistical
errors associated with the above parameters can be estimated using the sampling error
of the mean εμ and the corresponding confidence intervals <μ>1-α (for their
definitions, see classical textbooks on the subject). Their values for the case example
analyzed here are given in Table 3. Based on the results of the analysis the following
comments can be made: Bearing capacity computations are subjected to higher degree
of uncertainty (COVSRBC = 0.4145), compared to sliding and eccentricity (COVSRSL =
0.2861 and COVSRe = 0.1110, respectively). This is so because bearing capacity
primarily depends on the cohesion and friction angle of the foundation soil, which are
expected to demonstrate higher dispersion compared to the friction angles of the
reinforced and retained material. This has an impact on the corresponding errors and
confidence intervals, too (Table 3). For instance, the sampling error of the mean of
SRBC is twice as high as the equivalent error of SRSL and approximately an order of
magnitude higher than that of SRe. The latter one depends only on one out of the four
random variables, namely the φRET whose degree of uncertainty is relatively low. As
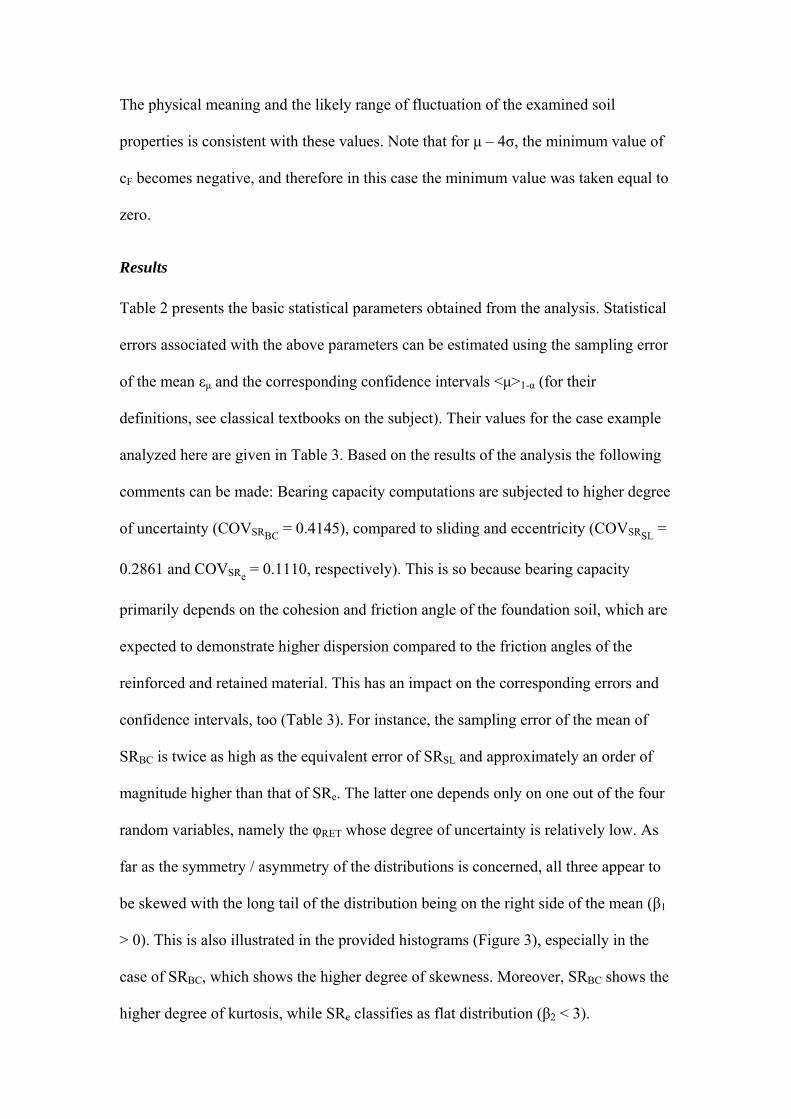
far as the symmetry / asymmetry of the distributions is concerned, all three appear to
be skewed with the long tail of the distribution being on the right side of the mean (β1
> 0). This is also illustrated in the provided histograms (Figure 3), especially in the
case of SRBC, which shows the higher degree of skewness. Moreover, SRBC shows the
higher degree of kurtosis, while SRe classifies as flat distribution (β2 < 3).
The components’ probabilities of failure (as these were calculated by
equations 9 to 11) were PF,BC = 0.01657, PF,e = 0.00050, and PF,SL = 0.02128. For the
case example analyzed in this study, failure by sliding is the event with the higher
probability of occurrence. It is also noted that, although the probability of failure in
bearing capacity is much higher than that in eccentricity, the mean value of SRBC
(equal to 2.76) is twice as high as the mean value of SRe (equal to 1.40).
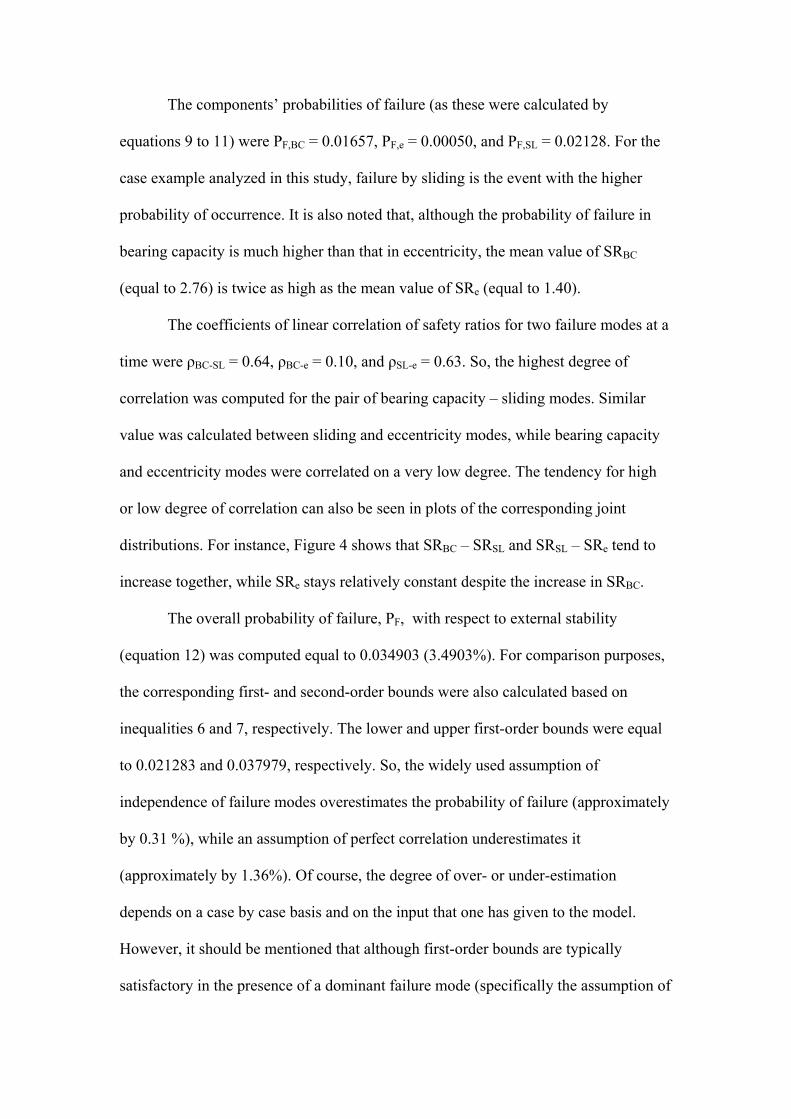
The coefficients of linear correlation of safety ratios for two failure modes at a
time were ρBC-SL = 0.64, ρBC-e = 0.10, and ρSL-e = 0.63. So, the highest degree of
correlation was computed for the pair of bearing capacity – sliding modes. Similar
value was calculated between sliding and eccentricity modes, while bearing capacity
and eccentricity modes were correlated on a very low degree. The tendency for high
or low degree of correlation can also be seen in plots of the corresponding joint
distributions. For instance, Figure 4 shows that SRBC – SRSL and SRSL – SRe tend to
increase together, while SRe stays relatively constant despite the increase in SRBC.
The overall probability of failure, PF, with respect to external stability
(equation 12) was computed equal to 0.034903 (3.4903%). For comparison purposes,
the corresponding first- and second-order bounds were also calculated based on
inequalities 6 and 7, respectively. The lower and upper first-order bounds were equal
to 0.021283 and 0.037979, respectively. So, the widely used assumption of
independence of failure modes overestimates the probability of failure (approximately
by 0.31 %), while an assumption of perfect correlation underestimates it
(approximately by 1.36%). Of course, the degree of over- or under-estimation
depends on a case by case basis and on the input that one has given to the model.
However, it should be mentioned that although first-order bounds are typically
satisfactory in the presence of a dominant failure mode (specifically the assumption of
complete modal independence), this is not always the case. On the other hand, for an
ordering of E1 = BC, E2 = SL and E3 = e, the lower and upper second-order bounds
were equal to 0.034882 and 0.035116, respectively. Similar results were obtained for
the other two possible orderings, too. So, in this case the second-order bounds
accurately reflect the system probability of failure that was calculated using equation
12. However, it shall be noted that the values of the joint probabilities of equation 7
were taken directly from the outcome of the Monte Carlo simulations executed in the
present study. Analytical calculations (described in Ditlevsen (1979) and Ang and
Tang (1984)) of these joint probabilities might remain cumbersome.
Finally, a parametric study was performed in order to investigate the impact of
random variables’ cross correlations (r) in the reliability analysis. More specifically,
cross correlations from r = -1 to r = 0 were investigated for the pair of shear strength
properties of the foundation soil (cF – φF). Figure 5 presents graphically the results in
terms of PFEXT. (Parametric studies were also performed for values of r between 0 and
+1. However, since a positive correlation between friction angle and cohesion does
not seem physically correct, the results are omitted from Figure 5). The case of r = 0
corresponds to the reference case example that was analyzed in the previous section.
The figure illustrates that as cross correlation values decrease from 0 to -1, PFEXT
decreases (from 0.0349 to approximately 0.0216). This means that for the conditions
and assumptions of this study, cross correlations close to 0 overestimate PFEXT, while
cross correlations close to -1 underestimate it. To be more specific, PFEXT for r = 0 is
more than one and a half times higher than PFEXT for r = -1. Therefore, in the absence
of reliable data that would indicate the true value of r, one should be cautious with
using any particular value.
Conclusions
In this study, a probabilistic model was developed in order to assess the
reliability of external stability of reinforced soil structures. Geotechnical uncertainty
was explicitly considered by modeling shear strength properties as random variables
following beta distributions. The model is based on Monte Carlo simulations and it
accounts for the dependency between the involved failure modes. Stability was
addressed as a system in series. For illustrative purposes, a case example of a typical
reinforced soil wall was analyzed. For this example, the results indicated that,
although failure by sliding has the higher probability of occurrence, the mode
subjected to higher uncertainty is the bearing capacity. Dependencies between failure
modes were analyzed by means of coefficients of linear correlation between
corresponding safety ratios. A noteworthy correlation was found between bearing
capacity and sliding, as well as between sliding and eccentricity. System probability
of failure was computed taking into account these correlations and was compared to
probabilities of failure obtained by the first- and second-order system reliability
bounds. The comparison indicates that commonly accepted simplifications of
complete independence or perfect correlation between the failure modes (i.e., first-
order bounds) may not always appropriate. On the other hand, the second-order
bounds accurately reflected the system probability of failure that was found following
the proposed methodology. However, the easiness of analytical calculations of joint
probabilities that are necessary in the use of second-order bounds remains an issue to
discuss. Finally, in terms of cross correlations between the shear strength properties of
the foundation soil, the results indicate that ignoring any possible cross correlation
between them may have an important effect on the system probability of failure.
Acknowledgments
The authors would like to express their gratitude to the reviewers for their
constructive feedback and comments.
References AASHTO, 2007. LRFD Bridge Design Specifications. American Association of State Highway and
Transportation Officials, 4th edition, Washington D.C., USA. Ang, A.H.-S. & Amin, M., 1968. Reliability of structures and structural systems. Journal of the
Engineering Mechanics Division, 94 (2), 671-691. Ang, A.H.-S. & Tang, W.H., 1984. Probability Concepts in Engineering Planning and Design. Volume
II: Decision, Risk and Reliability: John Wiley & Sons. Babu, G.L.S. & Basha, B.M., 2008. Optimum design of cantilever sheet pile walls in sandy soils using
inverse reliability approach. Computers and Geotechnics, 35 (2), 134-143. Baecher, G.B. & Christian, J.T., 2003. Reliability and Statistics in Geotechnical Engineering: John
Wiley & Sons. Basha, B.M. & Babu, G.L.S., 2008. Target reliability based design optimization of anchored cantilever
sheet pile walls. Canadian Geotechnical Journal, 45 (4), 535-548. Basha, B.M. & Babu, G.L.S., 2009. Seismic reliability assessment of external stability of reinforced
soil walls using pseudo-dynamic method. Geosynthetics International, 16 (3), 197-215. Chalermyanont, T. & Benson, C.H., 2005a. Method to estimate the system probability of failure of
Mechanically Stabilized Earth (MSE) walls. In: Gabr, M.A., Bowders, J.J., Elton, D. & Zornberg, J.G., ed(s). Geo-Frontiers 2005, Slopes and Retaining Structures Under Seismic and Static Conditions (GSP 140), Austin, TX, USA: ASCE.
Chalermyanont, T. & Benson, C.H., 2005b. Reliability-based design for external stability of mechanically stabilized earth walls. International Journal of Geomechanics, 5 (3), 196-205.
Cherubini, C., 2000. Reliability evaluation of shallow foundation bearing capacity on c', φ' soils. Canadian Geotechnical Journal, 37 (1), 264-269.
Christian, J.T., Ladd, C.C. & Baecher, G.B., 1994. Reliability applied to slope stability analysis. Journal of Geotechnical Engineering, 120 (12), 2180-2207.
Ditlevsen, O., 1979. Narrow Reliability Bounds for Structural Systems. Journal of structural mechanics, 7 (4), 453-472.
Elias, V., Christopher, B.R. & Berg, R.R., 2001. Mechanically stabilized earth walls and reinforced soil slopes – Design & construction guidelines. FHWA-NHI-00-043, US Department of Transportation, Federal Highway Administration, Washington D.C., USA.
Fenton, G. & Griffiths, D.V., 2003. Bearing-capacity prediction of spatially random c - φ soils. Canadian Geotechnical Journal, 40 (1), 54-65.
Harr, M.E., 1987. Reliability-Based Design in Civil Engineering: McGraw-Hill. Kulhawy, F.H. & Phoon, K.-K., 1996. Engineering judgment in the evolution from deterministic to
reliability-based foundation design. In: Shackelford, C.D., Nelson, P.P. & Roth, M.J.S., ed(s). Uncertainty'96: Uncertainty in the Geologic Environment - From Theory to Practice (Geotechnical Special Publication 58), Jul 31-Aug 3 1996, Madison, WI, USA: ASCE, 29-48.
Lumb, P., 1970. Safety factors and the probability distribution of soil strength. Canadian Geotechnical Journal, 7 (3), 225-242.
Oboni, F. & Bourdeau, P.L., 1985. Simplified use of the beta distribution and sensitivity to the bound locations. Structural Safety, 3 (1), 63-66.
Orr, T.L.L., 2000. Selection of characteristic values and partial factors in geotechnical designs to Eurocode 7. Computers and Geotechnics, 26 (3), 263-279.
Phoon, K.-K. & Kulhawy, F.H., 1999. Evaluation of geotechnical property variability. Canadian Geotechnical Journal, 36 (4), 625-639.
Phoon, K.-K., Kulhawy, F.H. & Grigoriu, M.D., 2003. Multiple resistance factor design for shallow transmission line structure foundations. Journal of Geotechnical and Geoenvironmental Engineering, 129 (9), 807-818.
Sayed, S., Dodagoudar, G.R. & Rajagopal, K., 2008. Reliability analysis of reinforced soil walls under static and seismic forces. Geosynthetics International, 15 (4), 246-257.
Shooman, M.L., 1990. Probabilistic Reliability: An Engineering Approach: R.E. Krieger Publishing Company, 2nd edition.
Whitman, R.V., 1984. Evaluating calculated risk in geotechnical engineering. Journal of Geotechnical Engineering, 110 (2), 143-188.
Wolff, T.F., 1985. Analysis and design of embankment dam slopes: A probabilistic approach. PhD Dissertation. Purdue University.
Zevgolis, I.E., 2007. Numerical and Probabilistic Analysis of Reinforced Soil Structures. PhD Dissertation. Purdue University.
Zevgolis, I.E. & Bourdeau, P.L., 2006. System reliability of cantilever retaining walls with correlated failure modes. In: Degroot, D.J., Dejong, J.T., Frost, D. & Baise, L.G., ed(s). GeoCongress 2006: Geotechnical Engineering in the Information Technology Age, February 26 – March 1, 2006, Atlanta, GA, USA: ASCE.
Zevgolis, I.E. & Bourdeau, P.L., 2008. Stochastic modeling of redundancy in Mechanically Stabilized Earth (MSE) walls. In: Reddy, K., Alshawabkeh, ed(s). GeoCongress 2008: The Challenge of Sustainability in the Geoenvironment, March 9-12, 2008, New Orleans, LA, USA: ASCE, 1179-1186.
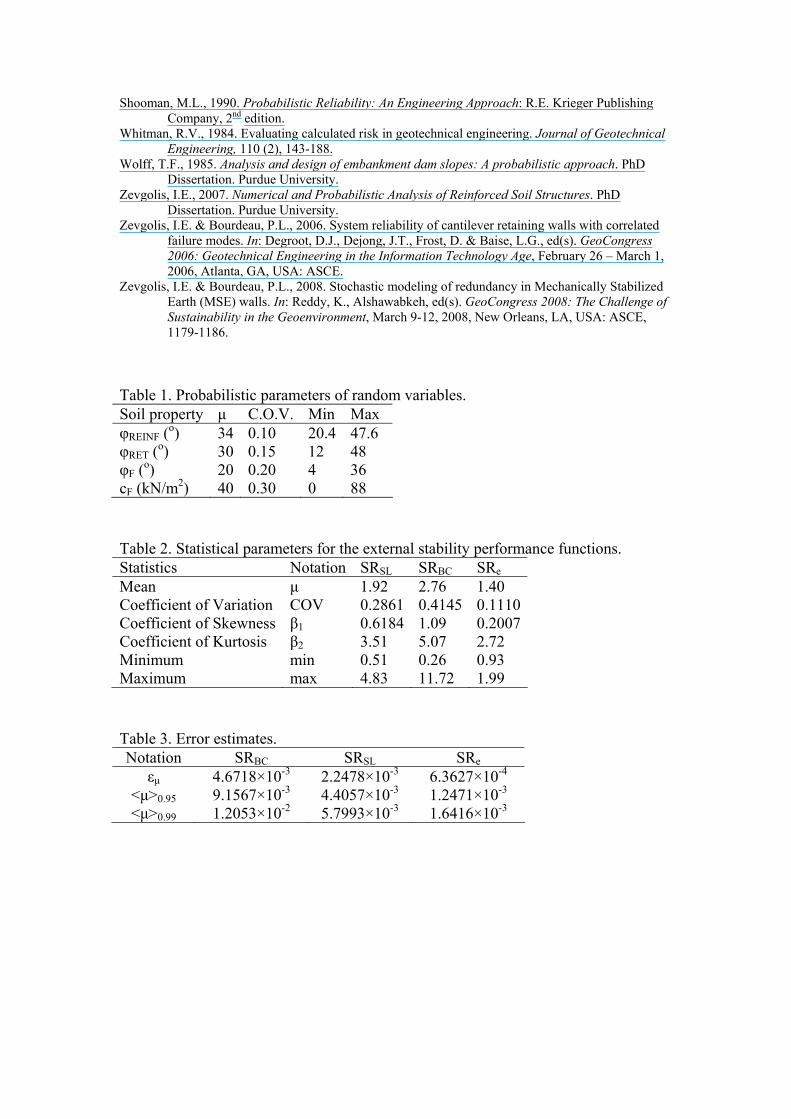
Table 1. Probabilistic parameters of random variables. Soil property μ C.O.V. Min Max φREINF (o) 34 0.10 20.4 47.6 φRET (o) 30 0.15 12 48 φF (o) 20 0.20 4 36 cF (kN/m2) 40 0.30 0 88 Table 2. Statistical parameters for the external stability performance functions. Statistics Notation SRSL SRBC SReMean μ 1.92 2.76 1.40 Coefficient of Variation COV 0.2861 0.4145 0.1110Coefficient of Skewness β1 0.6184 1.09 0.2007Coefficient of Kurtosis β2 3.51 5.07 2.72 Minimum min 0.51 0.26 0.93 Maximum max 4.83 11.72 1.99 Table 3. Error estimates. Notation SRBC SRSL SRe
εμ 4.6718×10⁻³ 2.2478×10⁻³ 6.3627×10⁻⁴
<μ>0.95 9.1567×10⁻³ 4.4057×10⁻³ 1.2471×10⁻³
<μ>0.99 1.2053×10⁻² 5.7993×10⁻³ 1.6416×10⁻³
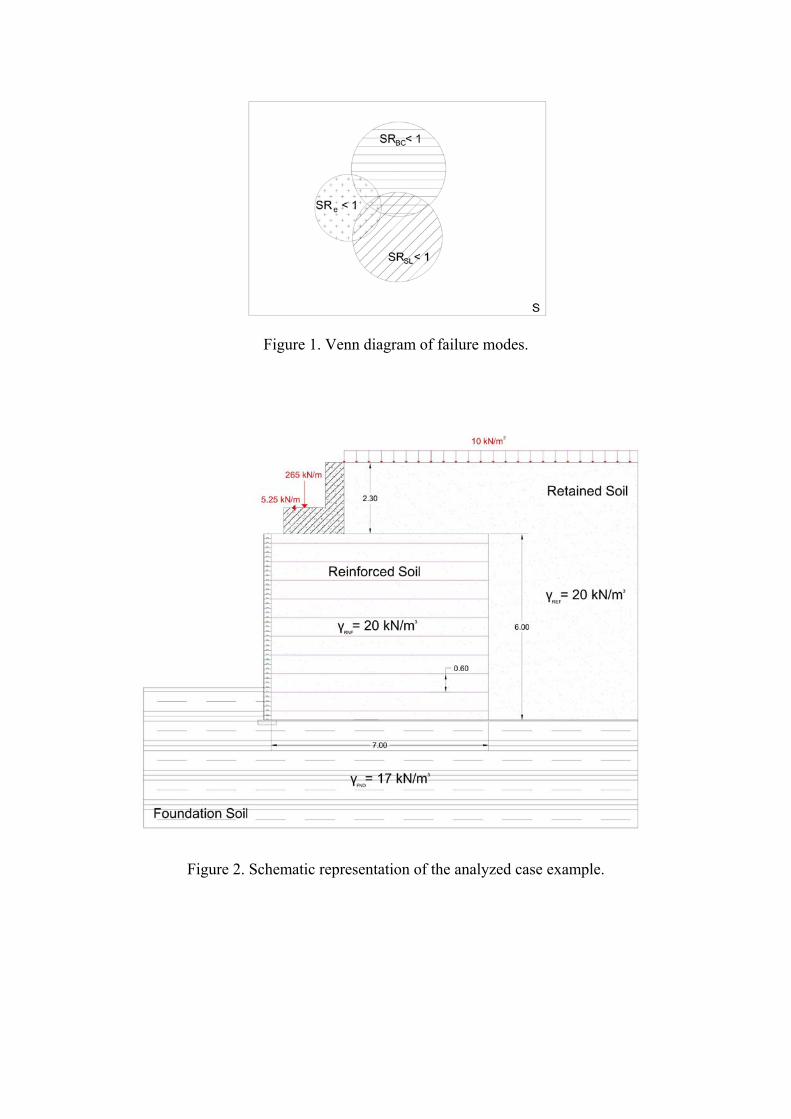
Figure 1. Venn diagram of failure modes.
Figure 2. Schematic representation of the analyzed case example.

0
0.01
0.02
0.03
0.04
0.05
0.06
0.07
0.08
0.09
Rel
ativ
e fre
quen
cy
0 1 2 3 4 5 6 7 8 9 10 11 12
μ = 2.76
SRBC
a.
0 0.4 0.8 1.2 1.6 2 2.4 2.8 3.2 3.6 4 4.4 4.8
SRSL
0
0.01
0.02
0.03
0.04
0.05
0.06
0.07
0.08
Rel
ativ
e fe
quen
cy
μ = 1.92
b.
0 0.2 0.4 0.6 0.8 1 1.2 1.4 1.6 1.8 2 2.2
SRe
0
0.01
0.02
0.03
0.04
0.05
0.06
0.07
0.08
0.09
0.1
0.11
0.12
0.13
Rel
ativ
e fre
quen
cy
μ = 1.40
c.
Figure 3. Histogram of safety ratios against: (a) bearing capacity (b) sliding and (c) eccentricity
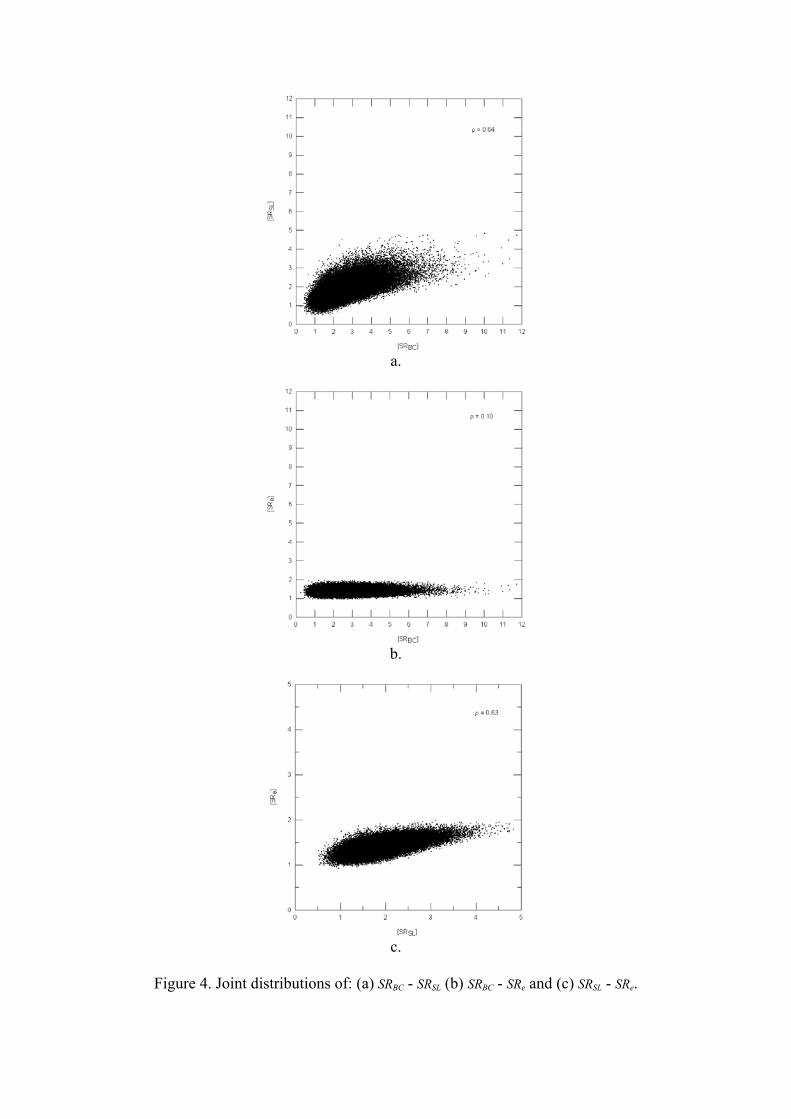
a.
b.
c.
Figure 4. Joint distributions of: (a) SRBC - SRSL (b) SRBC - SRe and (c) SRSL - SRe.

0.02
0.025
0.03
0.035
0.04
Ext
erna
l sta
bilit
-1 -0.75 -0.5 -0.25 0
c
of f
ailu
re, P
F EX
T p
roba
bilit
yy
F - φF cro rrelation coefficientss co
Figure 5. Impact of cF - φF cross correlation on PFEXT.