Synthesis of Lithium Sulfide Carbon Composites via Aerosol ...
170
UNIVERSITY OF CALIFORNIA RIVERSIDE Synthesis of Lithium Sulfide Carbon Composites via Aerosol Spray Pyrolysis A Dissertation submitted in partial satisfaction of the requirements for the degree of Doctor of Philosophy in Chemical and Environmental Engineering by Noam Hart June 2017 Dissertation Committee: Dr. Juchen Guo, Chairperson Dr. Phillip Christopher Dr. Lorenzo Mangolini
-
Upload
khangminh22 -
Category
Documents
-
view
1 -
download
0
Transcript of Synthesis of Lithium Sulfide Carbon Composites via Aerosol ...
UNIVERSITY OF CALIFORNIA
RIVERSIDE
Synthesis of Lithium Sulfide Carbon Composites via Aerosol Spray Pyrolysis
A Dissertation submitted in partial satisfaction
of the requirements for the degree of
Doctor of Philosophy
in
Chemical and Environmental Engineering
by
Noam Hart
June 2017
Dissertation Committee:
Dr. Juchen Guo, Chairperson
Dr. Phillip Christopher
Dr. Lorenzo Mangolini

Copyright by
Noam Hart
2017

The Dissertation of Noam Hart is Approved:
______________________________________________
______________________________________________
______________________________________________
Committee Chairperson
University of California, Riverside

iv
ACKNOWLEDGEMENTS
I would like to thank my advisor, Dr. Juchen Guo, for his guidance. The example he set with
his critical reading of the literature, work ethic and patience with an intractable project set
the pace for this work and saw it though to its results. His perspective kept me from getting
lost in the weeds, and somehow manage to make a functioning battery. I am grateful for his
support and the gentle encouragement with which he manages his graduate students. I am
certain no other mentor in this department would have been as patient with such a lengthy
project, which took far too long to bear fruit, nor would any other mentor had given me the
freedom to tinker so much with the system, in search of the ever-elusive results. We both
knew the joy is in the tinkering.
I would like to thank my committee members, Dr. Phillip Christopher and Dr. Lorenzo
Mangolini for their input and responsiveness to my questions. Their mix of insider academia
knowledge, experience in related projects and grounded perspective helped push this process
along. I would like to thank my fellow lab mates; Chengyin Fu, Linxiao Geng, Haiping Su,
Rahul Jay, Zheng Yan, Jian Zhang, Peng Lau and Setareh Jahanouz; for their contributions
to the work, the engaging conversations about results, the literature and looking after the
equipment in lab. As a battery team, we were all in the same boat and it felt like we were
rowing in unison.
I would like to thank my funding source, Power Solutions Inc., for funding much of this
work.

v
I would like to thank my two closest friends in the department, John Matsubu and Matthew
Kale. I am certain I would not have made it this far without you two, nor would I have
discovered how much I love white boards, pork and potlucks. Heather Kale and I will talk
potluck themes and scheduling for the next gettogether, “But can we talk while walking
Domino?”.
I would like to thank my colleagues; Talin Avanesian, whose wealth of knowledge was
invaluable for wading through the theoreticals; Alexander (Sasha) Dudchenko, whose
competence knows no bounds and without whom this work would surely have taken a year
longer; Michael Valenzuela, for his patient and effective tutelage of statistics, without which
my error bars would be an empty gesture. To Tingjun (Andy) Wu, Wenyan Duan and
Samarthya Bhagia, Thank you for making sure I would occasionally unwind. To Christian
Roach, Ece Aytan and Devin Coleman, thank you for making me feel like part of the MSE
fam. If 95% of solid matter is crystalline, you three are in the other 5%. I think that means
wine is involved.
I deeply enjoyed supervising the following undergraduate students: Dillon Gidcumb,
Samantha Teague, Sky Johnson, Lee Tsao, Ellen Ngoc Ngo and Jackson Tsai. The hours you
spent in lab drove the work forward and the conversations we had made the work
exponentially more interesting.
I would like to thank my friends past and present; Jennifer Gosik, without whom I would
not have even considered graduate school; Minyoung Yun, for battling it out in the trenches,
together; Jenna Lycan, for grounding me with the simple joys of life, for lifting me with
philosophy and reminding me that science can be so much more exciting than lab work;

vi
Kim BrennanHeffern whose quick wit and unparalleled sense of right and wrong reminded
me of my core values; Stephanie Miller for convincing me that everything is going to be
alright, despite overwhelming evidence to the contrary.
Lastly, I would like to thank my family, for their unwavering trust, in my ability to weather
this project and complete this program. I would like to thank; my mother, Valerie Baum-
Hart, easily the most reliable person on this planet; need something done? Put it on Val’s
desk; Aunt Sandy, whose advice is always on point, whether or not I choose to listen; Uncle
Wade, who’s been through it all, and remembers it with crystal clarity; my brother Nadav,
who always manages to accomplish the milestones before I do, excels at it all and leave a trail
of admirers in his wake.

vii
Dedication
This dissertation is dedicated to my mother, Valerie; the real doctah here.
She read that paper already. She’s just testing to see if I have.
viii
ABSTRACT OF THE DISSERTATION
Synthesis of Lithium Sulfide Carbon Composites via Aerosol Spray Pyrolysis
by
Noam Hart
Doctor of Philosophy, Graduate Program in Chemical and Environmental Engineering
University of California, Riverside, June 2017
Dr. Juchen Guo, Chairperson
This work is an investigation of lithium sulfide carbon (Li2S@C) composites synthesis via
Aerosol Spray Pyrolysis (ASP). These composites comprise the active portion of a cathode
for a Li-Li2S battery, designed to outperform state of the art Li-ion cells in specific capacity
(mAh/g). Producing these composites with ASP taps into the flexibility, product
homogeneity and scalability of the system. This project hopes to bridge the gap between
promising laboratory scale demonstrations and a commercially viable product.
The key concept of this project is the rationally designed Li2S@C composite microstructure,
which consists of nano-scale Li2S particles uniformly encapsulated in a carbon matrix. We
propose ASP as the synthesis method due to its unique operational mechanism: reactant
precursors are atomized as aerosol so that each reactant particle is an individual micro-
reactor. Operation in micro-reactor scale offers negligible heat and mass transport lags,
dramatically improving kinetics and microstructure control.
Three different Li2S precursors are investigated; lithium nitrate, lithium carbonate and
lithium acetate, respectively with sucrose as the carbon precursor. Effective Li2S-C cathodes

ix
have been produced from these three systems and each system delivers subtle microstructure
and compositional differences, performing differently as a result. Lithium nitrate and sucrose
derived particles appear to perform better in C/5 charging, with a specific capacity of 424
mAh/g after 40 cycles, with a capacity degradation of 0.00156. Whereas lithium carbonate
and sucrose derived particles perform better in C/10 charging, with a specific capacity of
438 after 40 cycles, with a capacity degradation of 0.000612. Suggesting differences in
architecture, such as porosity, particle size and particle size distribution play a role in
affecting performance at different charge rates.
x
CONTENTS
Units ....................................................................................................................................................... 1
1 Introduction .................................................................................................................................. 1
1.1 Importance and scope ......................................................................................................... 1
1.1.1 Energy storage as a technology enabler ................................................................... 1
1.2 Fundamentals of ‘Rocking Chair’ electrochemistry ........................................................ 4
1.2.1 Steady-state mechanism (assumes no degradation mechanisms) ......................... 4
1.2.2 Role of the components ............................................................................................. 5
1.3 Issues with the state of the art – Li-Ion ........................................................................... 6
1.3.1 Theoretical Capacity Limitations .............................................................................. 6
1.3.2 Structural Limitations ................................................................................................. 8
1.4 Alternatives ........................................................................................................................... 9
1.4.1 Alloying electrodes ...................................................................................................... 9
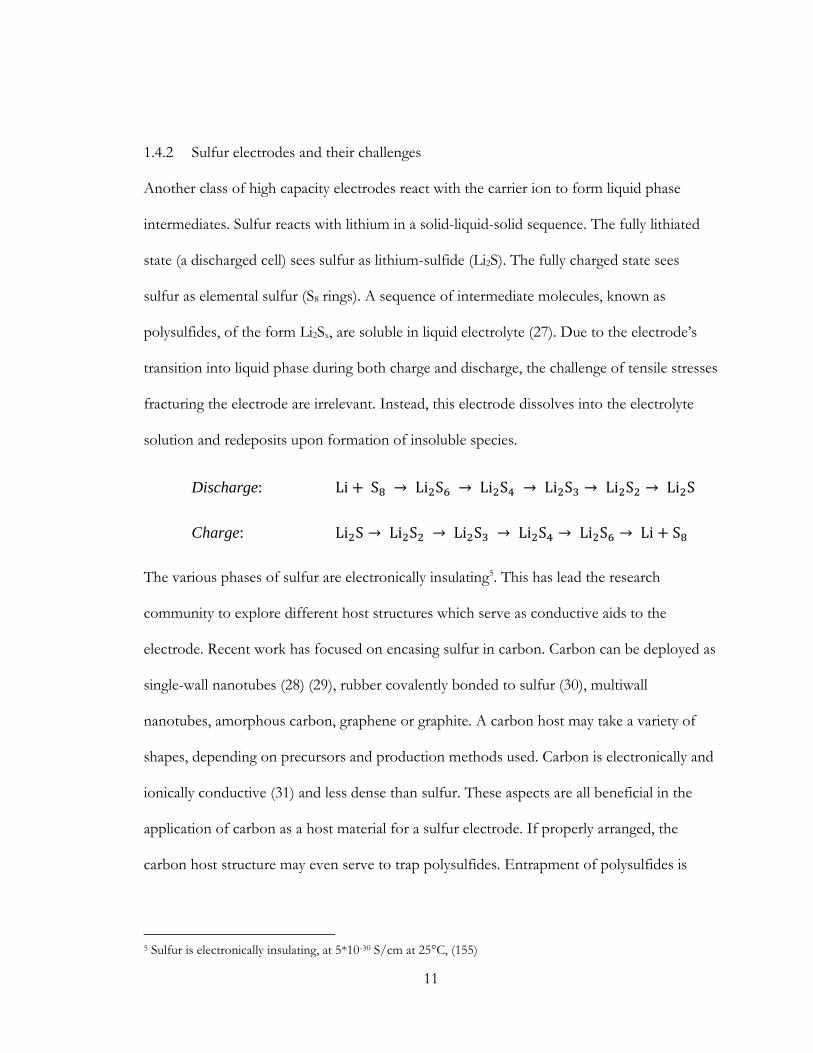
1.4.2 Sulfur electrodes and their challenges .................................................................... 11
1.4.3 Lithium Sulfide as a Cathode ................................................................................... 12
1.4.4 Economic Comparison ............................................................................................ 19
2 Methods ....................................................................................................................................... 22
2.1 ASP Synthesis apparatus ................................................................................................... 22
2.1.1 Design comments for the ASP apparatus ............................................................. 23
2.2 ASP Post treatment apparatus ......................................................................................... 25
2.2.1 Design comments for the Post treatment apparatus ........................................... 26
2.3 Characterization ................................................................................................................. 29
2.3.1 TGA ............................................................................................................................ 29
2.3.2 Cycler .......................................................................................................................... 48
2.3.3 Cyclic Voltammetry ................................................................................................... 51
2.3.4 XRD ............................................................................................................................ 51
2.3.5 TEM ............................................................................................................................ 52
2.3.6 SEM ............................................................................................................................. 52
3 ASP .............................................................................................................................................. 53
3.1 Application of spray pyrolysis .......................................................................................... 53
xi
3.2 Fundamentals ..................................................................................................................... 54
3.2.1 Micro-reactor system ................................................................................................ 55
3.2.2 Path design ................................................................................................................. 60
3.2.3 Concentration vs particle size .................................................................................. 63
3.3 Architecture ........................................................................................................................ 70
3.3.1 Reference success of Sn@C architecture............................................................... 70
3.3.2 Li2SO4/Suc ................................................................................................................. 73
3.3.3 Alternate lithium salts ............................................................................................... 76
3.3.4 Focus on comparing the architecture ..................................................................... 80
3.4 Cell Component selection and rationale ........................................................................ 80
3.4.1 Electrolyte Selection ................................................................................................. 80
4 Results and analysis ................................................................................................................ 102
4.1 Capacity driven analysis ................................................................................................. 102
4.2 QVE Analysis in C/5 cycling cells ............................................................................... 106
4.3 QVE Analysis in C/10 cycling cells ............................................................................. 112
4.3.1 Performance comparison ....................................................................................... 115
4.3.2 Precursor Selection Comparison - SEM and TEM Analysis ............................ 116
5 Conclusion ............................................................................................................................... 128
5.1 Summary .......................................................................................................................... 128
5.2 Future work and outlook ............................................................................................... 129
6 Appendix .................................................................................................................................. 130
6.1 Production ....................................................................................................................... 130
6.1.1 Electrode compounding ......................................................................................... 130
6.1.2 Punching, drying, preservation in glovebox ........................................................ 131
6.1.3 2032 cell assembly ................................................................................................... 132
6.2 Error ................................................................................................................................. 134
7 References ................................................................................................................................ 137
xii
Table of Figures
Figure 1 - Diagram of the internal function of a lithium ion cell during discharge. (157) ........ 4
Figure 2 - Schematic of long cycled silicon anode. (a) electrolyte mix with crack preventing
additive, (b) standard electrolyte mix, without crack preventing additive. (158) ...................... 10
Figure 3 - Rotating furnace CVD environment and schematic of particle hierarchal structure.
............................................................................................................................................................... 14
Figure 4 – Comparison of rotated and unrotated particles during CVD coating. .................... 14
Figure 5 - Initiation voltage of Li2S cathode as a function of charge rate. (164) ..................... 18
Figure 6 - Li vs Li2S 18650 configuration cell specific energy projection. Three scenarios are
considered, varying in E/S ratios. .................................................................................................... 20
Figure 7 - Schematic of the ASP system. A: reservoir, B: carrier gas, C: atomizer, D:
diffusion drier, E: furnace, F: filter, and G: exhaust. .................................................................... 22
Figure 8 - Temperature calibration of the ASP reaction zone. .................................................... 23
Figure 9 - Temperature calibration of the post treatment furnace. ............................................ 27
Figure 10 - TGA run of pristine Li2CO3 ......................................................................................... 32
Figure 11 - Boudouard's Reaction Equilibrium vs Temperature at 1 atm. (69) ........................ 33
Figure 12 - TGA run of Li2CO3@C. Sample generated from the 3N2S composition. .......... 35
Figure 13 - TGA run of high surface area activated carbon, made of coconut. ....................... 36
Figure 14 - Argon only TGA method, showing the reactions of Li2CO3@C under a
temperature program. ........................................................................................................................ 37
Figure 15 - XRD scan of Li2SO4 derived Li2S@C particle, after H2O wash. ............................ 39
xiii
Figure 16 - Solubility of pretreatment relevant lithium salts in aqueous solution. ................... 43
Figure 17 - TGA run of pristine Lithium Chloride (LiCl)............................................................ 44
Figure 18 - TGA run of pristine lithium hydroxide (LiOH) ........................................................ 45
Figure 19- TGA run of an HCl pretreated sample of 3N2S derived Li2S@C; This is specific
to batch #8, which features in the results of this thesis. .............................................................. 47
Figure 20 - Weight distribution histogram for cathodes punched from 3N2S batch #6. As
separated in 100ug bins. .................................................................................................................... 49
Figure 21 - Isobaric thermal conductivity of major aerosol components, for a wet particle.
http://webbook.nist.gov/chemistry/fluid/. Conductivity for the carbonized content of a
paticle may range from 7 to 50 W/mK, dpending on level of carbonization and particle
structure. Details vs temperature were not available, as the precise identity of the dry particle,
per it’s heat transport, is hard to define. Suffice it to say that it meaningfully exceeds the heat
transport of the gas stream. .............................................................................................................. 56
Figure 22 - Precipitate particle size as a function of solution concentration and droplet size
before calcination. (100) .................................................................................................................... 64
Figure 23 - SEM image of Li2CO3@C NitS particles. ................................................................. 65
Figure 24 - TEM image of Li2CO3@C NitS (left, 0011, 8.3.2016, HSU) and AceS (right, 505,
1_6.5K, 6.8.2016) particles. ............................................................................................................... 66
Figure 25 - TEM image of Li2CO3@C CarS particles (421, 1_6.5K, 12.9.2015) ...................... 67
Figure 26 - TEM image of Sn@C composite. (102) ..................................................................... 71
Figure 27 - Pluronic modified Sn@C particle. (102)..................................................................... 72
Figure 28 - Performance of the Sn@C composite (c & e) and F127 modified product (d & f)
(102) ...................................................................................................................................................... 72
xiv
Figure 29 - TEM image of carbonized pyrolysis particles produced from a mix of Li2SO4,
magnesium nitrate and sucrose. The dark regions inside the particles represent MgO crystals.
............................................................................................................................................................... 75
Figure 30 - TEM image of LiOH and sucrose pyrolysis product. Note the large LiOH cubic
crystals. ................................................................................................................................................. 77
Figure 31 – Proposed reaction schemes for the consumption of PS by ring and linear
carbonates. (116)................................................................................................................................. 82
Figure 32 - Comparison of capacity retention for Li-S cell in carbonate (red) vs ether (black)
electrolytes. Shows cycle performance of the Li-S cell at C/10 with (a) TEGDMELDOL =
1:1 with 1M LiTFSI and (b) EC:EMC = 1:2 with 1M LiTFSI. (116) ......................................... 83
Figure 33 - SEM images of lithium metal anode surface and cross sections of (a1 and a2)
fresh lithium metal and lithium metal cycled in (b1 and b2) the baseline electrolyte, (c1 and
c2) 50% Pyr14TFSI ontaining electrolyte, and (d1 and d2) 75% Pyr14TFSI containing
electrolyte for 100 cycles at C/5. (117) ........................................................................................... 84
Figure 34 - Cycling stability plot of 1:1 DOL:DME (black), Tetraglyme (red) and 1:1:2
DOL:DME: Pyr14TFSI (blue), in filled squares. Coulombic efficiecncies for each are
represented in empty squares. .......................................................................................................... 89
Figure 35 - Low E/S electrolyte loading of mix #2 , cycling of 3N2S cells. Showing E/S of
10 in red triangles, and E/S of 12 in black circles. ........................................................................ 92
Figure 36 - Cycle stability as a function of E/S ratio in Li/S cells. (Zhang, 2012) .................. 93
Figure 37 - Four discrete charge and discharge cycles shown for a 3N2S cathode, Mix #2, 10
E/S, cycling at a rate of C/10. ......................................................................................................... 94
Figure 38 - First charge and discharge cycle for a Li-S cell with E/S of 10. (Zhang, 2012) ... 96
xv
Figure 39 - First discharge for two 3N2S cells with E/S of 8. Note the lack of voltage delay
in either, as (Zhang, 2012) suggests would be expected. .............................................................. 96
Figure 40 - Specific energy of discharged 3N2S cells in various electrolyte mixtures. Each
curve represents an average of three cells. Compared to theoretical specific energy possible
in a typical Graphite-LCO li-ion cell. ............................................................................................ 102
Figure 41 - Capacity degradation, in fraction of capacity lost per cycle, of 3N2S cells in
Electrolytes #3, 4 & 5 respectively, from cycle 2 to 100. ........................................................... 104
Figure 42 - Capacity Degradation across 100 cycles for electrolytes 3, 4, & 5, in 3N2S cells.
............................................................................................................................................................. 105
Figure 43 - Quasi Voltaic Efficiency of 1:1.5 DOL:DME electrolytes, for 3N2S cathodes,
cycled at C/5. .................................................................................................................................... 106
Figure 44 - Quasi Voltaic Efficiency of 1:3 DOL:DME electrolytes, for 3N2S cathodes,
cycled at C/5. .................................................................................................................................... 107
Figure 45 - Quasi Voltaic Efficiency of 1.5 and 1:3 DOL:DME electrolytes, for 3N2S
cathodes, cycled at C/5. .................................................................................................................. 108
Figure 46 - Charge and discharge curves for (a) Li2S@C vs (b) Li2S mixed with C. Performed
in an electrolyte of 1M LiTFSI in tetraglyme. Green box added here to point out the region
where shuttle effect is most vigorous. (129) ................................................................................. 110
Figure 47 - Charge and discharge curve for a Li-S cell. Red highlight marks the indication of
elemental sulfur during in-situ XRD, while blue indicates the presence of Li2S. The dashed
section indicates a period where neither specie is observed. (130) ........................................... 111
Figure 48 - Left, untreated charge and discharge curve of second cycle 3N2S cell, #2b
electrolyte, 1:1.5 DOL:DME electrolyte cell. Right, QVE treated cycle plot of same cell. .. 112
xvi
Figure 49 - Quasi Voltaic Efficiency of 1.5 and 1:3 DOL:DME electrolytes, for 3N2S
cathodes, cycled at C/10 ................................................................................................................. 114
Figure 50 - Discharge Specific Capacity in Electrolyte 5 for cells produced with 3N2S,
1C085S and 3A015S precursor systems, cycled at C rate of C/10. .......................................... 115
Figure 51 - Discharge Specific Capacity in Electrolyte 5 for cells produced with 3N2S,
1C085S and 3A015S precursor systems, cycled at C rate of C/5. ............................................ 116
Figure 52 - Set of SEM images of 3N2S Li2CO3@C particles. ................................................. 118
Figure 53 - Figure 43 - SEM images of 3N2S derived Li2CO3@C particles, after HCl wash
............................................................................................................................................................. 119
Figure 54 - Figure 43 - SEM images of 3N2S derived Li2S@C particles, after HCl wash .... 120
Figure 55 - SEM images of 3N2S derived Li2CO3@C particles, after HCl wash. .................. 121
Figure 56 - SEM images of 3N2S derived Li2S@C particles, after HCl wash. ....................... 122
Figure 57 - TEM images of 3N2S derived Li2CO3@C particles showing a wide particle size
distribution and resultant architectures. ........................................................................................ 123
Figure 58 - TEM image of 3N2S derived Li2CO3@C particles. ................................................ 124
Figure 59 - TEM images of 3N2S derived Li2CO3@C particles, after HCl wash. ................. 125
Figure 60 - TEM images of 3N2S derived Li2S@C particles, after HCl wash. ....................... 126
Figure 61 - High areal loading electrode paste, derived of 3A015S. ......................................... 131
1
UNITS
Potential, V
Specific Capacity,mAh
g
Specific Energy,Wh
kg
1 INTRODUCTION
1.1 IMPORTANCE AND SCOPE
1.1.1 Energy storage as a technology enabler
The leap from flip-phones to smartphones, with touch screens, pocket-friendly form-factors
and wifi connectivity were enabled by the rollout of lithium-ion cells. The previous standard,
NiMH (Nickel Metal Hydride), were bulkier and ran at a lower nominal voltage. By
transitioning to higher capacity li-ion cells, which ran at 3.6V, a single cell could power the
device; whereas NiMH, with a 1.2V nominal output, required two or three cells in series to
overcome the resistances in the device. By cutting down to a single cell, the non-capacity
components of the cell; casing, governor circuit, terminals; could be minimized. Between less
space spent on non-capacity components and the inherently higher capacities of the
chemistry, li-ion enabled devices with significantly greater energy requirements. A device

2
could now run multiple apps simultaneously on a full color backlit touch screen. The charge
could be topped up at any point in the day, since li-ion did not suffer from the memory
effect plaguing NiMH. Without li-ion, The iPhone would not have been possible. (1)
In a parallel sense, Ni-MH has brought electric drive hybrid vehicles to mass market appeal,
in Toyota’s iconic Prius and Honda’s Insight. Nearly a decade behind the smartphone
market, Toyota has recently decided to reconsider li-ion for its cars, having eschewed it for
years over safety concerns. While a failed cell per million may be a reasonable bet for a
phone that holds just one cell, these odds become significantly less appealing in a car that
requires hundreds or thousands of cells. If a single li-ion cell suffers catastrophic failure, the
entire pack may go up in flames. The original Prius pack held 240 cells1, The Tesla Roadster
held 6,8002. Moreover, a car battery is expected to offer ten years of service, whereas a
phone can be expected to be replaced, along with its cell, after two years. The odds of a
catastrophic failure, and tens of thousands of dollars in a total loss, are quite high.
While safety is the greatest concern for both automotive and electronics applications, form
factor takes close second in electronics. In automotive applications, mass is the next greatest
concern. Whereas a few extra grams will not make a difference in already light cell phones, a
battery pack sufficient to drive a car four hundred miles would weigh in at close to five
metric tons. Chevrolet’s announced deal for the Bolt, from supplier LG Chem, pegs the cost
at 145 $/kWh. Even at that cut rate price, a four hundred mile pack will cost nearly $18,0003
for the cells alone.
1 http://toyotapriusbattery.com 2 http://large.stanford.edu/publications/coal/references/docs/tesla.pdf 3 Assumes 3.3 miles/kWh, 265 kWh/kg.

3
A safer, lighter, cheaper cell is necessary to enable the next generation of electric drive
vehicles. The promise of a higher capacity, made of cheaper materials with fewer failure
modes has made the lithium-sulfur chemistry an attractive research option for years; the
following reviews address general progress in the field, discuss challenges and note
opportunities for improvement (2) (3) (4) (5) (6) (7) (8). While some notable differences exist
between li-ion and lithium-sulfur cells, they both rely on the same general mechanism of
action and are subject to similar performance bottlenecks.
4
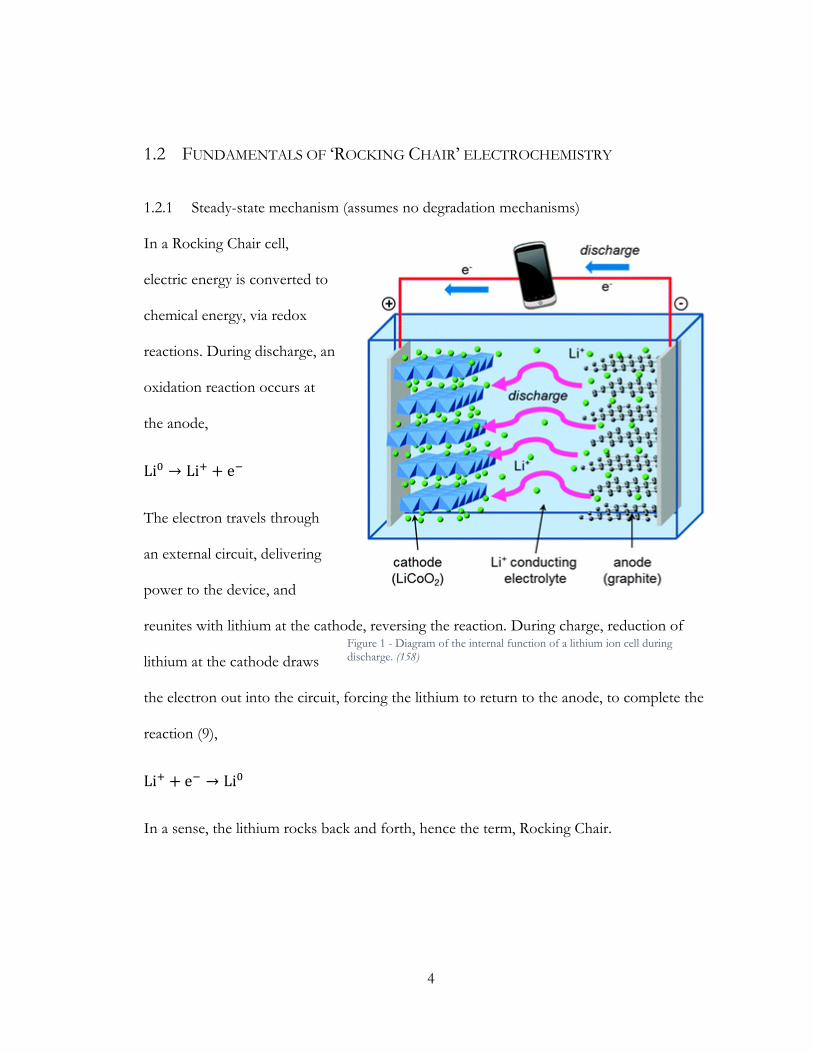
1.2 FUNDAMENTALS OF ‘ROCKING CHAIR’ ELECTROCHEMISTRY
1.2.1 Steady-state mechanism (assumes no degradation mechanisms)
In a Rocking Chair cell,
electric energy is converted to
chemical energy, via redox
reactions. During discharge, an
oxidation reaction occurs at
the anode,
Li0 → Li+ + e−
The electron travels through
an external circuit, delivering
power to the device, and
reunites with lithium at the cathode, reversing the reaction. During charge, reduction of
lithium at the cathode draws
the electron out into the circuit, forcing the lithium to return to the anode, to complete the
reaction (9),
Li+ + e− → Li0
In a sense, the lithium rocks back and forth, hence the term, Rocking Chair.
Figure 1 - Diagram of the internal function of a lithium ion cell during discharge. (158)
5
1.2.2 Role of the components
The anode and cathode serve as storage units for the cycling lithium. In the case of li-ion
cells, the traditional anode is graphite, while the cathode is a lithium metal oxide, commonly
LiCoO2. These electrodes are crystalline hosts, that the lithium travels in and out of, without
changing the fundamental structure or chemical properties. This type of electrode is called
an Intercalation Electrode. The overall capacity of the cell depends on the amount of lithium
which can be reversibly inserted and removed from within these electrodes. For every six
atoms of carbon in graphite, a single lithium can be stored. For every unit of LiCoO2, half a
unit of lithium can be safely extracted,
Anode; LiC6 ↔ Li + 6C
Cathode; LiCoO2 ↔1
2Li + Li1/2CoO2
If these two electrodes were to come into contact, a short circuit is formed, whereby the
path of electronic least resistance is the cell itself. To prevent direct contact of the two
electrodes, a thin polymer separator is used (10). This separator must be conductive of the
ions that flow through it, but sufficiently insulating of electrons to cause them to flow
through the external circuit.
To facilitating the movement of the ions, an organic liquid electrolyte wets the separator and
electrodes. The electrolyte is composed of a liquid organic solvent, lithium salts and
additives. The solvent dissolves the ions of the salt, which participate in a relay of the
lithium ions,
Li+ + (LiSalt+ + AnionSalt
−) → (Li+ + AnionSalt−) + LiSalt
+

6
In this way, it is not necessary for a lithium ion to travel across the cell, from one electrode
to another, to meet the electron at the other side.
Owing to the electronic insulation across the cell, electrons are forced outside of the cell to
move from one electrode to the other. This is facilitated by metal foils backing the
electrodes; aluminum at the cathode and copper at the anode; so selected for their stabilities
at high and low voltages, respectively.
1.3 ISSUES WITH THE STATE OF THE ART – LI-ION
1.3.1 Theoretical Capacity Limitations
The current an electrode can store is proportional to the lithium it can store; for each Li+ ion
that moves from one electrode to the other, a single electron will travel through the circuit.
The capacity of a single electrode is calculated as follows,
n electrons ∗ Faraday constant
Molar mass of electrode material= Specific capacity of electrode material
One ideal high capacity arrangement would be a silicon (Si) anode across a lithium sulfide
(Li2S) cathode. In the case of a lithium sulfide cathode, the calculation proceeds as follows,
2 e− ∗96,485 Asmol e−
∗1 hr3600 s ∗
1000 mAA
(45.95gmol
) = 1166
mAh
gLi2S
In the case of a silicon anode, the calculation proceeds as follows,
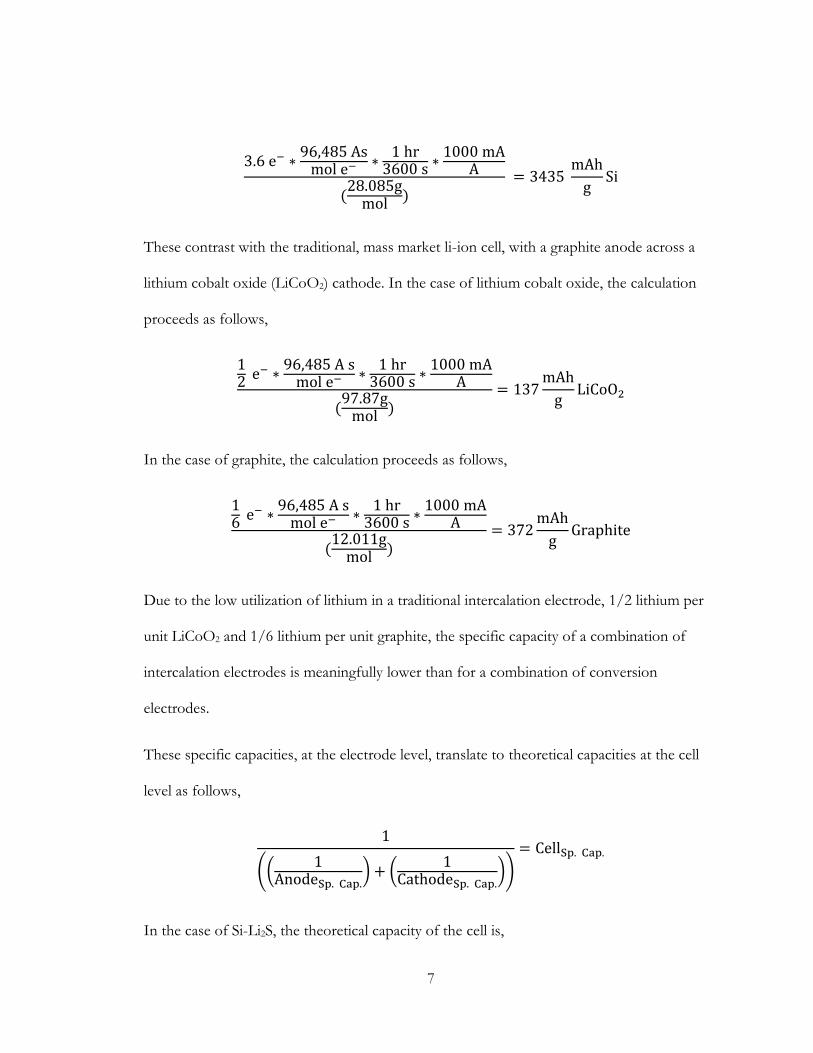
7
3.6 e− ∗96,485 Asmol e−
∗1 hr3600 s ∗
1000 mAA
(28.085gmol
) = 3435
mAh
gSi
These contrast with the traditional, mass market li-ion cell, with a graphite anode across a
lithium cobalt oxide (LiCoO2) cathode. In the case of lithium cobalt oxide, the calculation
proceeds as follows,
12 e− ∗
96,485 A smol e−
∗1 hr3600 s ∗
1000 mAA
(97.87gmol
)= 137
mAh
gLiCoO2
In the case of graphite, the calculation proceeds as follows,
16 e− ∗
96,485 A smol e−
∗1 hr3600 s ∗
1000 mAA
(12.011gmol
)= 372
mAh
gGraphite
Due to the low utilization of lithium in a traditional intercalation electrode, 1/2 lithium per
unit LiCoO2 and 1/6 lithium per unit graphite, the specific capacity of a combination of
intercalation electrodes is meaningfully lower than for a combination of conversion
electrodes.
These specific capacities, at the electrode level, translate to theoretical capacities at the cell
level as follows,
1
((1
AnodeSp. Cap.) + (
1CathodeSp. Cap.
))
= CellSp. Cap.
In the case of Si-Li2S, the theoretical capacity of the cell is,
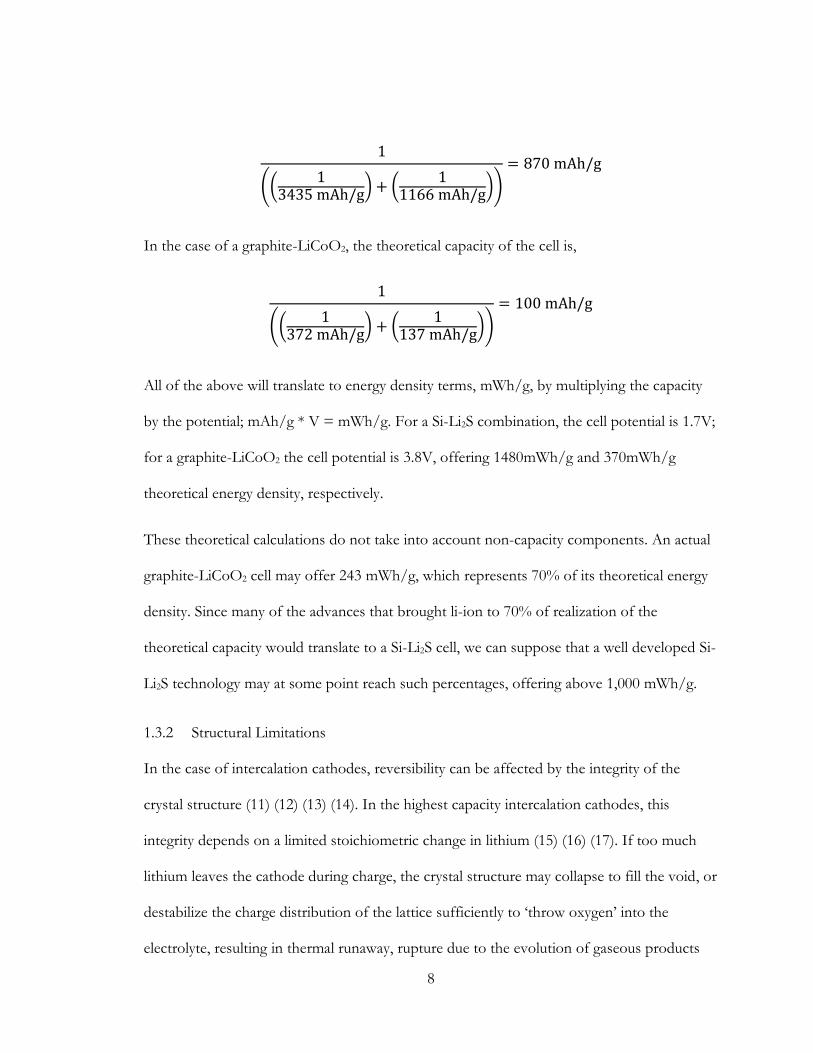
8
1
((1
3435 mAh/g) + (
11166 mAh/g
))
= 870 mAh/g
In the case of a graphite-LiCoO2, the theoretical capacity of the cell is,
1
((1
372 mAh/g) + (
1137 mAh/g
))
= 100 mAh/g
All of the above will translate to energy density terms, mWh/g, by multiplying the capacity
by the potential; mAh/g * V = mWh/g. For a Si-Li2S combination, the cell potential is 1.7V;
for a graphite-LiCoO2 the cell potential is 3.8V, offering 1480mWh/g and 370mWh/g
theoretical energy density, respectively.
These theoretical calculations do not take into account non-capacity components. An actual
graphite-LiCoO2 cell may offer 243 mWh/g, which represents 70% of its theoretical energy
density. Since many of the advances that brought li-ion to 70% of realization of the
theoretical capacity would translate to a Si-Li2S cell, we can suppose that a well developed Si-
Li2S technology may at some point reach such percentages, offering above 1,000 mWh/g.
1.3.2 Structural Limitations
In the case of intercalation cathodes, reversibility can be affected by the integrity of the
crystal structure (11) (12) (13) (14). In the highest capacity intercalation cathodes, this
integrity depends on a limited stoichiometric change in lithium (15) (16) (17). If too much
lithium leaves the cathode during charge, the crystal structure may collapse to fill the void, or
destabilize the charge distribution of the lattice sufficiently to ‘throw oxygen’ into the
electrolyte, resulting in thermal runaway, rupture due to the evolution of gaseous products
9
and eventually a visible fire. This in turn leads to a ceiling on a practical cell energy of
265Wh/kg4. For applications that favor high capacity, low weight and low cost, this renders
intercalation cathode cells unattractive; as multiple cells, with a heavy overall weight and
significant cost, render a battery powered product less competitive with alternatively
powered devices.
1.4 ALTERNATIVES
1.4.1 Alloying electrodes
One attractive alternative to lithium ion cells is the replacement of the intercalation
electrodes with higher capacity electrodes. This can be achieved by using lithium alloying
materials, which interact with significantly greater stoichiometric amounts of lithium, at a
fraction of the weight of an intercalation electrode (18) (19) (20) (21) (22) (23). Tin and
silicon will alloy with lithium to a theoretical stoichiometric amount of Li4.4Sn and Li4.4Si,
respectively. This offers a theoretical ceiling of 994 and 4,200 mAh/g (21), respectively,
comparing favorably to graphite’s 372 mAh/g. These greater capacities may translate to
fewer cells, lower mass, lower cell volume, or some combination of the above. All of which
result in, for various reasons, reduced costs, improved application performance and the
enabling of new applications.
By definition however, this means more lithium will enter and leave the electrode upon
cycling, than in intercalation electrodes. This leads to a particular challenge, that of
mechanical damage and fracture of the electrodes. While graphite anodes are known to
4 In the case of Panasonic’s NCR20700.
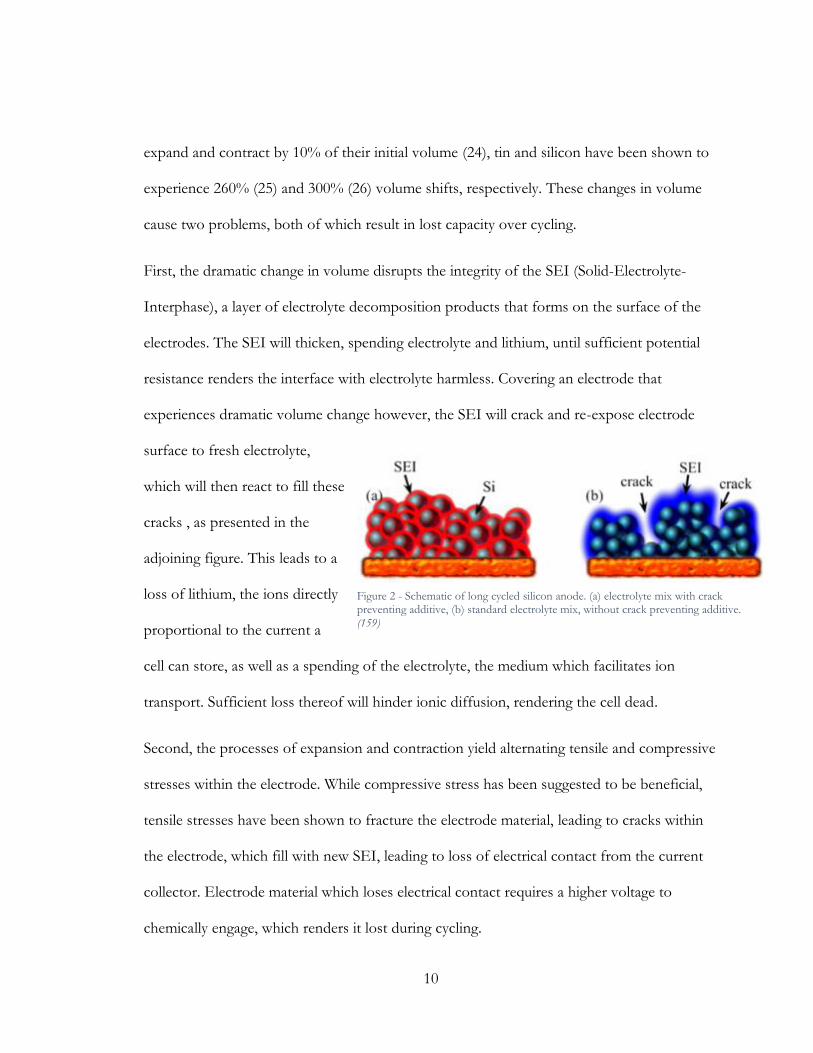
10
expand and contract by 10% of their initial volume (24), tin and silicon have been shown to
experience 260% (25) and 300% (26) volume shifts, respectively. These changes in volume
cause two problems, both of which result in lost capacity over cycling.
First, the dramatic change in volume disrupts the integrity of the SEI (Solid-Electrolyte-
Interphase), a layer of electrolyte decomposition products that forms on the surface of the
electrodes. The SEI will thicken, spending electrolyte and lithium, until sufficient potential
resistance renders the interface with electrolyte harmless. Covering an electrode that
experiences dramatic volume change however, the SEI will crack and re-expose electrode
surface to fresh electrolyte,
which will then react to fill these
cracks , as presented in the
adjoining figure. This leads to a
loss of lithium, the ions directly
proportional to the current a
cell can store, as well as a spending of the electrolyte, the medium which facilitates ion
transport. Sufficient loss thereof will hinder ionic diffusion, rendering the cell dead.
Second, the processes of expansion and contraction yield alternating tensile and compressive
stresses within the electrode. While compressive stress has been suggested to be beneficial,
tensile stresses have been shown to fracture the electrode material, leading to cracks within
the electrode, which fill with new SEI, leading to loss of electrical contact from the current
collector. Electrode material which loses electrical contact requires a higher voltage to
chemically engage, which renders it lost during cycling.
Figure 2 - Schematic of long cycled silicon anode. (a) electrolyte mix with crack preventing additive, (b) standard electrolyte mix, without crack preventing additive. (159)
11
1.4.2 Sulfur electrodes and their challenges
Another class of high capacity electrodes react with the carrier ion to form liquid phase
intermediates. Sulfur reacts with lithium in a solid-liquid-solid sequence. The fully lithiated
state (a discharged cell) sees sulfur as lithium-sulfide (Li2S). The fully charged state sees
sulfur as elemental sulfur (S8 rings). A sequence of intermediate molecules, known as
polysulfides, of the form Li2Sx, are soluble in liquid electrolyte (27). Due to the electrode’s
transition into liquid phase during both charge and discharge, the challenge of tensile stresses
fracturing the electrode are irrelevant. Instead, this electrode dissolves into the electrolyte
solution and redeposits upon formation of insoluble species.
Discharge: Li + S8 → Li2S6 → Li2S4 → Li2S3 → Li2S2 → Li2S
Charge: Li2S → Li2S2 → Li2S3 → Li2S4 → Li2S6 → Li + S8
The various phases of sulfur are electronically insulating5. This has lead the research
community to explore different host structures which serve as conductive aids to the
electrode. Recent work has focused on encasing sulfur in carbon. Carbon can be deployed as
single-wall nanotubes (28) (29), rubber covalently bonded to sulfur (30), multiwall
nanotubes, amorphous carbon, graphene or graphite. A carbon host may take a variety of
shapes, depending on precursors and production methods used. Carbon is electronically and
ionically conductive (31) and less dense than sulfur. These aspects are all beneficial in the
application of carbon as a host material for a sulfur electrode. If properly arranged, the
carbon host structure may even serve to trap polysulfides. Entrapment of polysulfides is
5 Sulfur is electronically insulating, at 5*10-30 S/cm at 25°C, (155)

12
crucial for the cycle life of the cell. If the polysulfides are allowed to leave the cathode, which
they will by simple diffusion gradient, the sulfur content they represent is lost and cell
capacity degrades.
Much of this research utilized the low melting point of sulfur (32) (33) (34) (35) (36) (37) to
introduce a molten elemental sulfur into preexisting carbon hosts. This solution is relatively
simple, allowing for handling in atmosphere and a wide selection of cathode binders; since
sulfur is unreactive and insoluble in solvents (Water, NMP) appropriate for the introduction
of binder polymers (PEO, PVDF, CMC, brown alginate). Since neither sulfur nor carbon are
reactive to atmosphere at room temperature, much of the processing after the introduction
of the melt can be done without need of containment, on a lab bench.
Unfortunately, because these methods rely on a carbon host that can accept sulfur in molten
state, it invariably means that it can also relinquish polysulfides as they drift in the electrolyte.
The performance of these cells has been lacking, as the following reviews present (38) (7) (6)
(2).
1.4.3 Lithium Sulfide as a Cathode
1.4.3.1 State of the art
In an effort to address the poor performance of sulfur cathodes, the fully lithiated phase of
sulfur, Li2S, has been explored (39). By starting with a lithiated cathode, the choice of anode
is now open to non-lithium options, such as the aforementioned silicon, tin and germanium.
Various methods exist for the formation of a Li2S cathode, encapsulated in a host matrix.
13
1.4.3.1.1 Direct mechanical introduction
In (40) Fu et al introduce Li2S as powder onto a CNT substrate or directly onto the walls of
a coin cell via spatula.
1.4.3.1.2 THF Dissolution
In (41), Wang et al introduce Li2S via injection into the cell from a LiClO4 – THF solution.
1.4.3.1.3 Precipitation from an ethanol solution
In (42) Wu et al exploit the solubility of Li2S in ethanol. Here Li2S is either precipitated out
of ethanol on its own, or MWCNT (multiwalled carbon nano tubes) are introduced prior to
solvent evaporation, offering a nucleation substrate for Li2S. In (43), Han et al go a step
further, introducing Li2S, PVP as a carbon source and Li6PS5Cl, via ethanol, vacuuming the
mix an calcining in argon.
1.4.3.1.4 Reaction of Sulfur in solution
In (44), Yoon et al, formed carbon coated Li2S particles by dissolving sulfur in toluene,
mixed with graphene oxide (GO) dispersed in tetrahydrofuran (THF). Lithium
triethylborohydride (LiEt3BH) is added, to lithiated the sulfur as follows,
S + 2LiEt3BH → Li2S + Et3B + H2
The Li2S forms in a sphere around the GO. The solution is heated to remove the THF.
Chemical vapor deposition is used to form an amorphous carbon coating around the
Li2S/GO particles. The weight ratio of Li2S:GO:Carbon is 85:2:13. CVD was performed in a
turning furnace that generated an even coating over the entire particle population. Results
showed a meaningful improvement in capacity retention with a uniform CVD generated
14
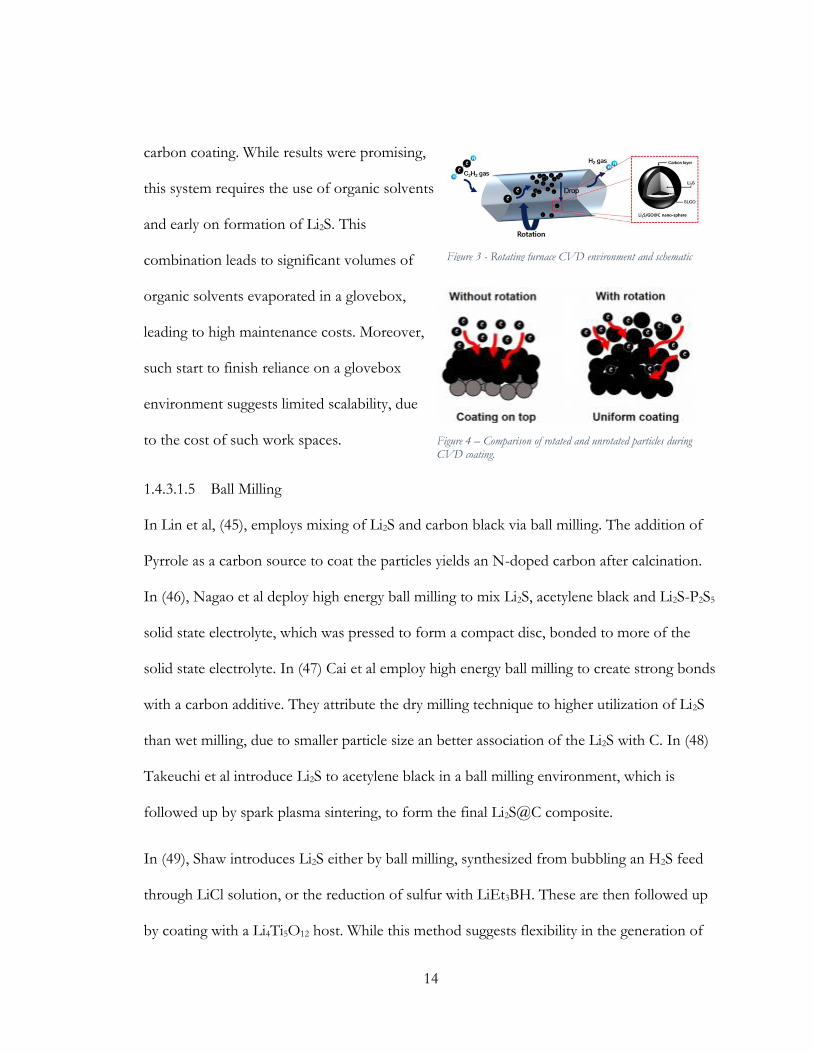
carbon coating. While results were promising,
this system requires the use of organic solvents
and early on formation of Li2S. This
combination leads to significant volumes of
organic solvents evaporated in a glovebox,
leading to high maintenance costs. Moreover,
such start to finish reliance on a glovebox
environment suggests limited scalability, due
to the cost of such work spaces.
1.4.3.1.5 Ball Milling
In Lin et al, (45), employs mixing of Li2S and carbon black via ball milling. The addition of
Pyrrole as a carbon source to coat the particles yields an N-doped carbon after calcination.
In (46), Nagao et al deploy high energy ball milling to mix Li2S, acetylene black and Li2S-P2S5
solid state electrolyte, which was pressed to form a compact disc, bonded to more of the
solid state electrolyte. In (47) Cai et al employ high energy ball milling to create strong bonds
with a carbon additive. They attribute the dry milling technique to higher utilization of Li2S
than wet milling, due to smaller particle size an better association of the Li2S with C. In (48)
Takeuchi et al introduce Li2S to acetylene black in a ball milling environment, which is
followed up by spark plasma sintering, to form the final Li2S@C composite.
In (49), Shaw introduces Li2S either by ball milling, synthesized from bubbling an H2S feed
through LiCl solution, or the reduction of sulfur with LiEt3BH. These are then followed up
by coating with a Li4Ti5O12 host. While this method suggests flexibility in the generation of
Figure 4 – Comparison of rotated and unrotated particles during CVD coating.
Figure 3 - Rotating furnace CVD environment and schematic of particle hierarchal structure.
15
the original Li2S active material, the prospect of coating with Li4Ti5O12, itself an intercalation
material in the anode voltage range, compromises the high specific capacity promised by a
Li-S cell, as this shell itself will dramatically increase the mass of the cathode. Alternately, this
patent offers a carbon coating formed via solvothermal reaction of pyrrole around the
existing Li2S particle. While this offers a lower weight support structure, even this composite
falls into the trap of handling Li2S prior to the preparation of a cathode. Every step in which
the material handled is sensitive to the environment means an increased need for glovebox
use, and as such greater costs.
1.4.3.1.6 Introduction as polysulfide
In (50), Han et al introduce the sulfur content as Li2S6, which calcines down to Li2S in the
carbon host. In (51) and (52) Fu et al introduce sulfur content as Li2S6 onto a various carbon
substrates and use it as is. In (53), Guo et al reacted Li2S an S to form polysulfides, which
were later treated to revert back to Li2S.
1.4.3.1.7 Introduction as Li2SO4
In (54) Li et al exploit Li2SO4’s insolubility in ethanol, to induce migration of Li2SO4 in
solution toward graphene oxide (GO) platelets. Once dried, the carbon content of the GO is
used to reduce Li2SO4 to Li2S in a flow of argon. Remaining GO offers a conductive matrix.
1.4.3.1.8 Polymerization of carbon host around Li2S
In (55), Seh et al introduce micron sized Li2S to pyrrole, which was allowed to polymerize
overnight around the primary Li2S particles. This polymer was left Unsintered, as the Li-N
interactions it offered provide suitable performance.
16
1.4.3.1.9 Considerations
In all of the above systems, a batch-wise approach to the manufacture of the Li2S
composites suggests expensive operation upon scale-up. Many of these systems require the
use of organic solvents in the production of the particle, extending the danger of solvents
handling to the earliest steps. Moreover, by beginning with Li2S, the materials must be
maintained in containment early on, lest they react with moisture to form LiOH, or Li2SOx
species as a result of exposure to oxygen. This would have the effect of increasing storage
and production costs dramatically. Laboratory experience and consultation with Dr Gleb
Yushin suggest that even in a regulated argon environment of a glovebox, the shelf life of
high performance Li2S particles is limited to a couple weeks at most, and the glovebox must
be regenerated frequently to maintain a pristine enough environment.
These batch approaches to electrode production might prove worth it, were the specific
energy and cycle stability compelling. Unfortunately, the body of literature on the subject has
not yet produced a scalable method for the production of a Li2S cathode that delivers both
high areal loading of sulfur, with high sulfur utilization and commercially relevant cycle
stability.
This work hinged on retaining a scalable production technique for the composite
architecture, deploying ASP as a production method. The introduction of a batch process
later on was justified by considering that later iterations of the design could combine both
systems into one, whereby the final product of ASP is a finished Li2S@C composite. The
challenge then, was to produce a composite that performed well.
17
1.4.3.2 Un-lithiated anode unlocked
A fully lithiated sulfur cathode, Li2S, need not be coupled with a lithiated anode. Si-Li2S
systems have been demonstrated (56) (57) (58) (59), with the promise of a theoretical
specific energy of 1550 Wh/kg. Such an anode could operate at a sufficiently high voltage to
preclude the formation of lithium dendrite, at reasonable charge densities (60) (61). This
would dramatically improve cell safety, deminishing a failure mode that leads to immediate
and irreversible loss of a cell, at best, or catastrophic thermal runaway at the worst.
Improvements in cell safety, coupled with high theoretical specific energy, suggest
application in aerospace and automotive products, where safety, light weight and high energy
requirements are prevalent.
1.4.3.3 High voltage requirement upon first charge
Unlike Sulfur cathodes, which are assembled in the fully charged state, Li2S must be charged
at first. Li2S however is considered electrochemically inactive, requiring a high voltage to
initiate and complete the first charge (62). This is a complicating factor, in terms of
appropriate components and cell life. In order to tap into all Li2S in the cathode, first charge
voltages are driven near 4V vs Li. Around these potentials, an irreversible plateau appears,
likely an indication of the reaction of LiTFSI with the aluminum of the current collector
(63). At this point, the function of the current collector is compromised, offering poor
18
conductivity or having lost contact with the cathode. As such, completing utilization of Li2S
is not guaranteed, within safe potentials.
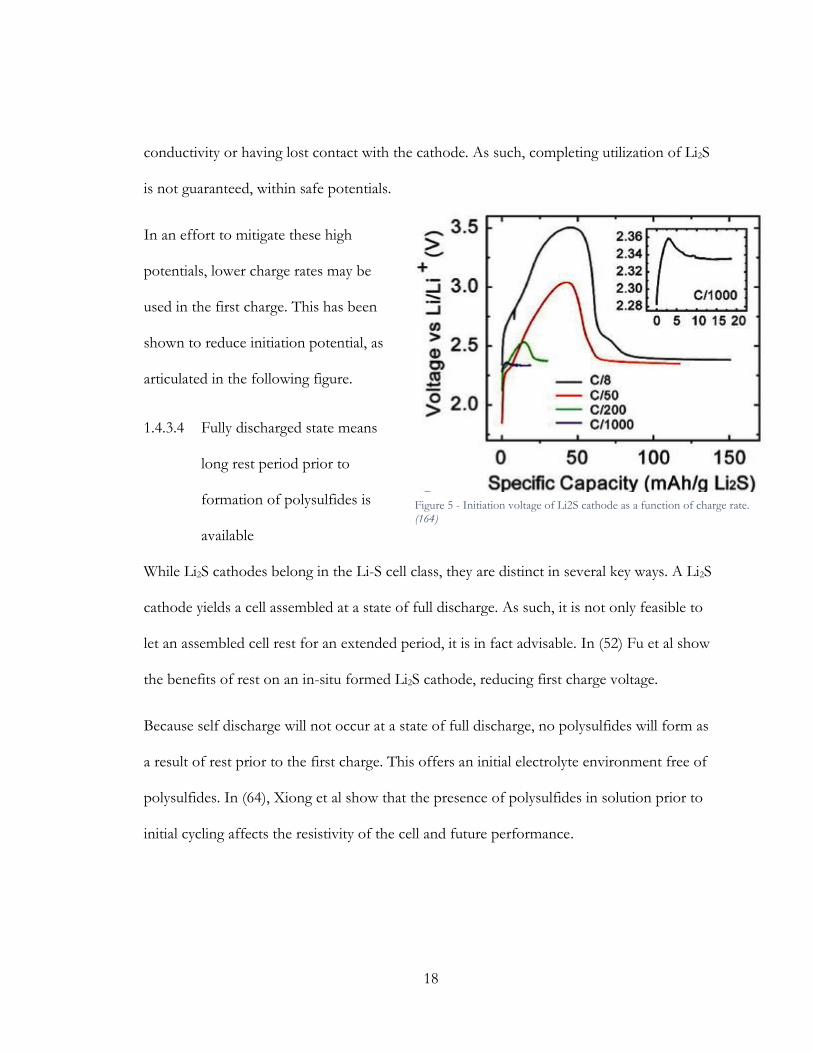
In an effort to mitigate these high
potentials, lower charge rates may be
used in the first charge. This has been
shown to reduce initiation potential, as
articulated in the following figure.
1.4.3.4 Fully discharged state means
long rest period prior to
formation of polysulfides is
available
While Li2S cathodes belong in the Li-S cell class, they are distinct in several key ways. A Li2S
cathode yields a cell assembled at a state of full discharge. As such, it is not only feasible to
let an assembled cell rest for an extended period, it is in fact advisable. In (52) Fu et al show
the benefits of rest on an in-situ formed Li2S cathode, reducing first charge voltage.
Because self discharge will not occur at a state of full discharge, no polysulfides will form as
a result of rest prior to the first charge. This offers an initial electrolyte environment free of
polysulfides. In (64), Xiong et al show that the presence of polysulfides in solution prior to
initial cycling affects the resistivity of the cell and future performance.
Figure 5 - Initiation voltage of Li2S cathode as a function of charge rate. (164)
19
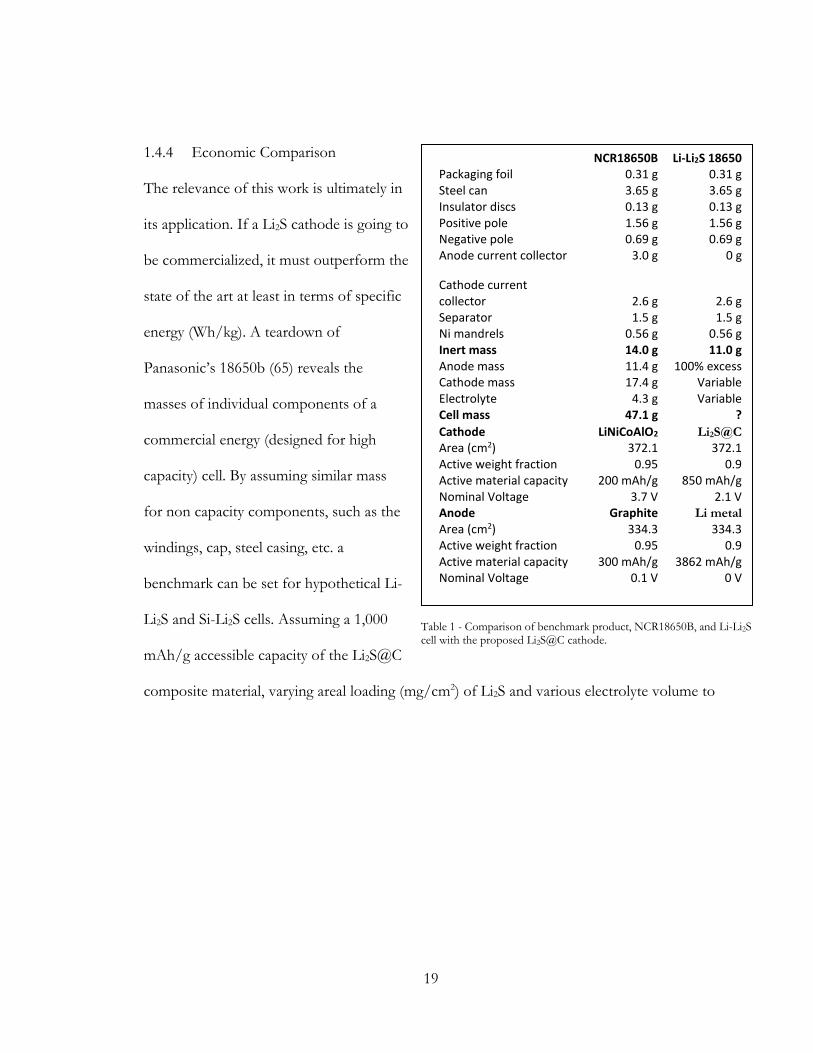
1.4.4 Economic Comparison
The relevance of this work is ultimately in
its application. If a Li2S cathode is going to
be commercialized, it must outperform the
state of the art at least in terms of specific
energy (Wh/kg). A teardown of
Panasonic’s 18650b (65) reveals the
masses of individual components of a
commercial energy (designed for high
capacity) cell. By assuming similar mass
for non capacity components, such as the
windings, cap, steel casing, etc. a
benchmark can be set for hypothetical Li-
Li2S and Si-Li2S cells. Assuming a 1,000
mAh/g accessible capacity of the Li2S@C
composite material, varying areal loading (mg/cm2) of Li2S and various electrolyte volume to
NCR18650B Li-Li2S 18650 Packaging foil 0.31 g 0.31 g Steel can 3.65 g 3.65 g Insulator discs 0.13 g 0.13 g Positive pole 1.56 g 1.56 g Negative pole 0.69 g 0.69 g Anode current collector 3.0 g 0 g
Cathode current collector 2.6 g 2.6 g Separator 1.5 g 1.5 g Ni mandrels 0.56 g 0.56 g Inert mass 14.0 g 11.0 g Anode mass 11.4 g 100% excess Cathode mass 17.4 g Variable Electrolyte 4.3 g Variable Cell mass 47.1 g ?
Cathode LiNiCoAlO2 Li2S@C
Area (cm2) 372.1 372.1 Active weight fraction 0.95 0.9 Active material capacity 200 mAh/g 850 mAh/g Nominal Voltage 3.7 V 2.1 V Anode Graphite Li metal
Area (cm2) 334.3 334.3 Active weight fraction 0.95 0.9 Active material capacity 300 mAh/g 3862 mAh/g Nominal Voltage 0.1 V 0 V
Table 1 - Comparison of benchmark product, NCR18650B, and Li-Li2S cell with the proposed Li2S@C cathode.
20
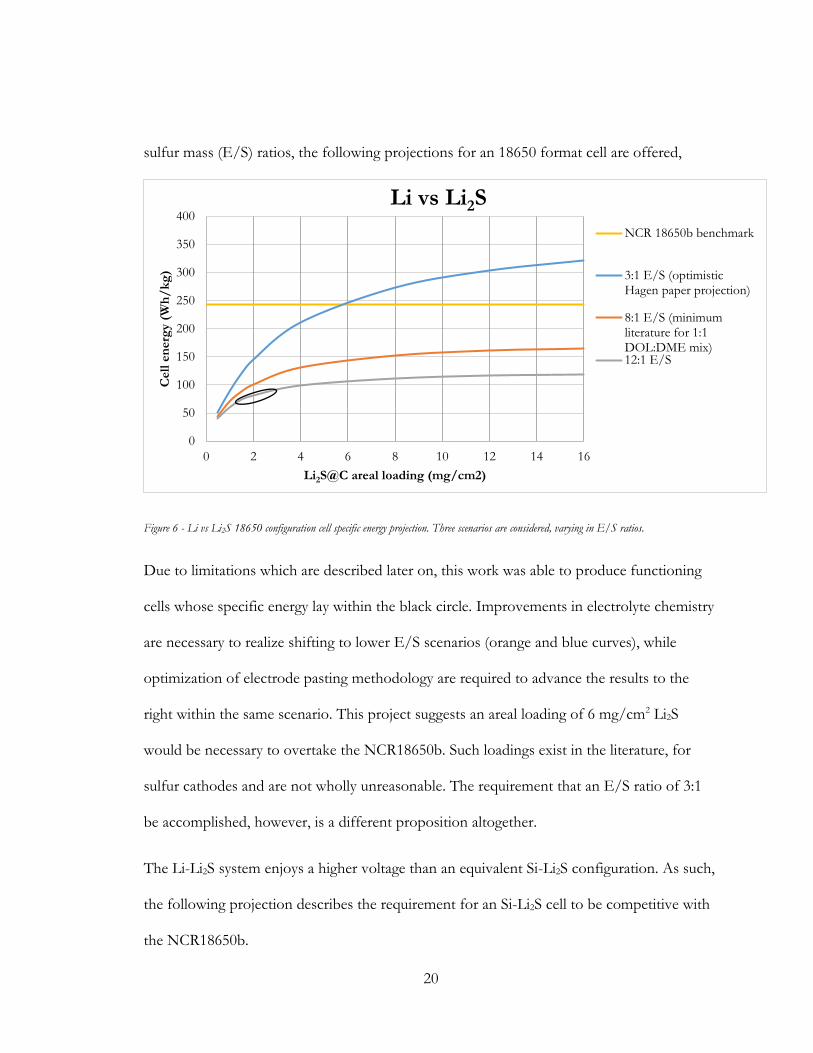
sulfur mass (E/S) ratios, the following projections for an 18650 format cell are offered,
Figure 6 - Li vs Li2S 18650 configuration cell specific energy projection. Three scenarios are considered, varying in E/S ratios.
Due to limitations which are described later on, this work was able to produce functioning
cells whose specific energy lay within the black circle. Improvements in electrolyte chemistry
are necessary to realize shifting to lower E/S scenarios (orange and blue curves), while
optimization of electrode pasting methodology are required to advance the results to the
right within the same scenario. This project suggests an areal loading of 6 mg/cm2 Li2S
would be necessary to overtake the NCR18650b. Such loadings exist in the literature, for
sulfur cathodes and are not wholly unreasonable. The requirement that an E/S ratio of 3:1
be accomplished, however, is a different proposition altogether.
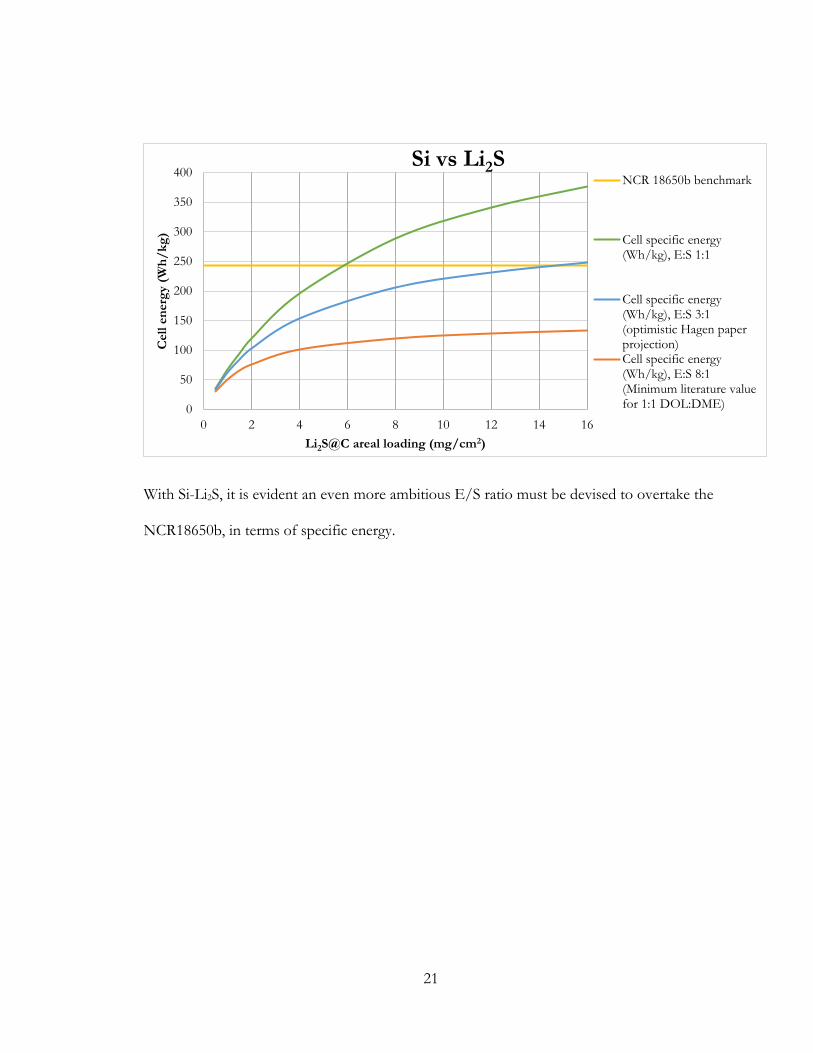
The Li-Li2S system enjoys a higher voltage than an equivalent Si-Li2S configuration. As such,
the following projection describes the requirement for an Si-Li2S cell to be competitive with
the NCR18650b.
0
50
100
150
200
250
300
350
400
0 2 4 6 8 10 12 14 16
Cell
en
erg
y (
Wh
/k
g)
Li2S@C areal loading (mg/cm2)
Li vs Li2S
NCR 18650b benchmark
3:1 E/S (optimisticHagen paper projection)
8:1 E/S (minimumliterature for 1:1DOL:DME mix)12:1 E/S
21
With Si-Li2S, it is evident an even more ambitious E/S ratio must be devised to overtake the
NCR18650b, in terms of specific energy.
0
50
100
150
200
250
300
350
400
0 2 4 6 8 10 12 14 16
Cell
en
erg
y (
Wh
/k
g)
Li2S@C areal loading (mg/cm2)
Si vs Li2SNCR 18650b benchmark
Cell specific energy(Wh/kg), E:S 1:1
Cell specific energy(Wh/kg), E:S 3:1(optimistic Hagen paperprojection)Cell specific energy(Wh/kg), E:S 8:1(Minimum literature valuefor 1:1 DOL:DME)
22
2 METHODS
2.1 ASP SYNTHESIS APPARATUS
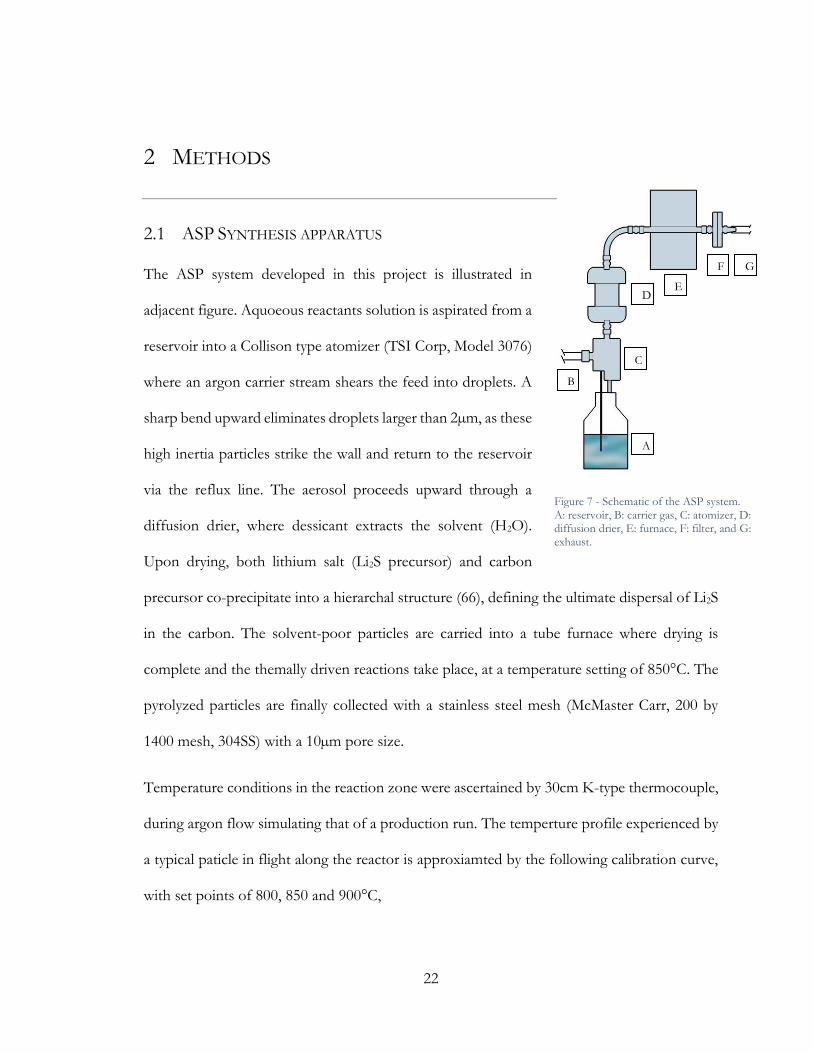
The ASP system developed in this project is illustrated in
adjacent figure. Aquoeous reactants solution is aspirated from a
reservoir into a Collison type atomizer (TSI Corp, Model 3076)
where an argon carrier stream shears the feed into droplets. A
sharp bend upward eliminates droplets larger than 2µm, as these
high inertia particles strike the wall and return to the reservoir
via the reflux line. The aerosol proceeds upward through a
diffusion drier, where dessicant extracts the solvent (H2O).
Upon drying, both lithium salt (Li2S precursor) and carbon
precursor co-precipitate into a hierarchal structure (66), defining the ultimate dispersal of Li2S
in the carbon. The solvent-poor particles are carried into a tube furnace where drying is
complete and the themally driven reactions take place, at a temperature setting of 850°C. The
pyrolyzed particles are finally collected with a stainless steel mesh (McMaster Carr, 200 by
1400 mesh, 304SS) with a 10µm pore size.
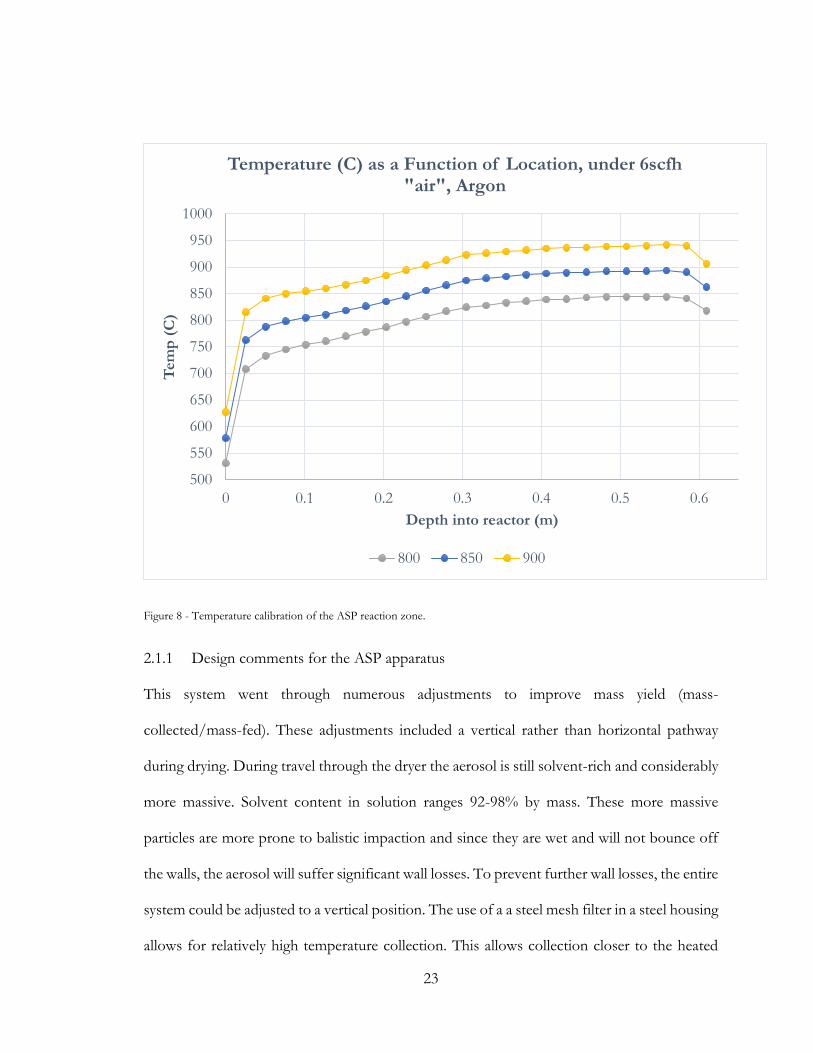
Temperature conditions in the reaction zone were ascertained by 30cm K-type thermocouple,
during argon flow simulating that of a production run. The temperture profile experienced by
a typical paticle in flight along the reactor is approxiamted by the following calibration curve,
with set points of 800, 850 and 900°C,
A
B
C
D E
F G
Figure 7 - Schematic of the ASP system. A: reservoir, B: carrier gas, C: atomizer, D: diffusion drier, E: furnace, F: filter, and G: exhaust.
23
Figure 8 - Temperature calibration of the ASP reaction zone.
2.1.1 Design comments for the ASP apparatus
This system went through numerous adjustments to improve mass yield (mass-
collected/mass-fed). These adjustments included a vertical rather than horizontal pathway
during drying. During travel through the dryer the aerosol is still solvent-rich and considerably
more massive. Solvent content in solution ranges 92-98% by mass. These more massive
particles are more prone to balistic impaction and since they are wet and will not bounce off
the walls, the aerosol will suffer significant wall losses. To prevent further wall losses, the entire
system could be adjusted to a vertical position. The use of a a steel mesh filter in a steel housing
allows for relatively high temperature collection. This allows collection closer to the heated
500
550
600
650
700
750
800
850
900
950
1000
0 0.1 0.2 0.3 0.4 0.5 0.6
Tem
p (
C)
Depth into reactor (m)
Temperature (C) as a Function of Location, under 6scfh "air", Argon
800 850 900
24
zone, and prevention of losses due to thermoforesis, whereby a relatively cool tube wall causes
the stream to bend outward. While a downward path is ideal for wall loss prevention overall,
this would require a different type of atomizer, as the 3076 must remain upright to operate
properly. An upward path is thereby a reasonable compromise.
Different tubes were considered for the heated zone. Stainless steel tubing was robust and
offered a reliable seal, but required a long cooldown under argon flow to prevent corrosion
from exposure to air at high temperatures. Quartz tubing, while chemically inert and robust,
suffers from regular breakage and a need for replacement. A 2” diamater quartz tube was
attempted, in lieu of the ½” tube, to increase residence time in the reaction zone, and offer
more complete carbonization of the carbon precursor, b y the following logic,
Q = VA
If A, the cross sectional area of the tube is increased by a factor of four, so too did V, the
velocity decrease by the same factor, under the same flow, Q, as controlled by the pressure at
the argon tank. Unfortunately, the increased residence time lead to increased wall losses due
to ballistic impaction. In essence, the aerosol stayed in the heated zone long enough to fall
onto the tube wall. Arguably, a vertical arrangement of the heated zone may alleviate this
concern, allowing for greater residence times and or lower reaction temperatures. Moreover,
during testing with a larger tube diameter, significant losses were incurred in the final
restriction to the ½” outlet to the filter housing. A larger filter outlet may alleviate these losses.
The filter and filter housing originally deployed were a 0.2µm pore plastic filter in a plastic
housing (both, Millipore). This system is designed for entrapment of particles in a liquid
25
stream, at lower temperatures. At sufficiently high filter temperatures, this plastic filter will
melt to the housing. This means the filter must be kept far enough away for the stream
temperature to drop below 100°C. While this lower temperature protects the plastic filter,
offering superior entrapment due to finer pores, it also means that solvent may recondense in
the sample. Lithium carbonate hydrate is stable above 100°C, and the hydration of the primary
particle may result in expansion and damage to the secondary host material. The use of steel
mesh, with larger pores may lead to greater losses and as such lower yields, but it is does not
sacrifice on particle quality.
Finally, replacement of the diffusion dryer with an auxiliary gas stream, diluting the aerosol,
may prove a superior choice for aerosol drying. The diffusion dryer is the most labor intensive
aspect of the system, and its drying capacity (40ml of solvent) represented a production
bottleneck. Moreover, the capacity of the dryer to remove solvent is not steady state
throughout the production. As the dryer saturates solvent is removed more slowly, which
affects the architecture of the final particle. The use of an alternative, steady state system is
beneficial for quality control purposes.
2.2 ASP POST TREATMENT APPARATUS
The Li2CO3@C composite particles from ASP are subsequently reacted with H2S gas in a
tubular furnace to produce Li2S@C composite according to the following sulfidation reaction
at a set point of 725⁰C.
Li2CO3 + H2S → Li2S + H2O + CO2
26
H2S gas is introduced as a mix, H2S /Ar (5%/95%). Exhaust bearing H2S must be remediated
before venting. A bubbler with 40g NaOH dissolved into 500ml of ultrapure DI water is used
to react the reaction zone flue stream. The remediated stream is vented into a fume hood. The
vented stream was assessed for H2S concentration and found to range from 0.00ppm and
4.00ppm; sufficiently remediated for venting, but still potentially detectable to members of the
lab.
2.2.1 Design comments for the Post treatment apparatus
The original method deployed here was an H2/Ar (5%/95%) passed over an upstream boat
of molten elemental sulfur. The reaction proceeds as follows, to deliver H2S,
8H2 + S8 → 8H2S
This system offered a lower concentration of H2S, which is safer, in the advent of leaks, but
also less dependable in terms of completing the conversion of Li2CO3 to Li2S.
Moreover, the presence of elemental sulfur vapor in the reaction environment lead to sulfur
deposition on the Li2S@C particles, during the cooling of the reactor, when the sample
temperature dips below the melting point of sulfur. This external deposition of sulfur lead to
poor performance, due to active material external to the carbon host.
As yet unpublished work suggests that a 100% H2S stream can convert lithium hydroxide to
Li2S at temperatures tolerable to the binder in an electrode (<120°C). This could make for
significantly easier, and as such cheaper, electrode production; as the air and moisture
sensitive Li2S is introduced after the electrode is fully prepared. This does however require a
27
dangerously high concentration of H2S and is as such unattractive. Ideally, a method that
avoids the use of H2S is preferable.
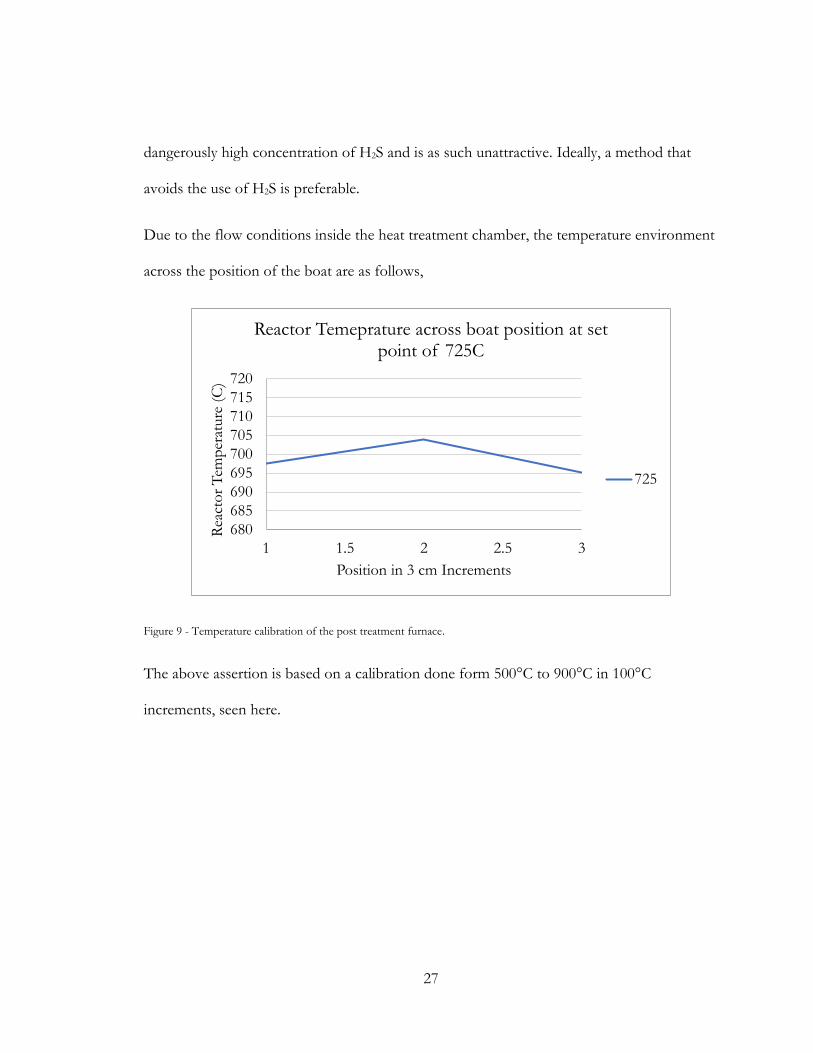
Due to the flow conditions inside the heat treatment chamber, the temperature environment
across the position of the boat are as follows,
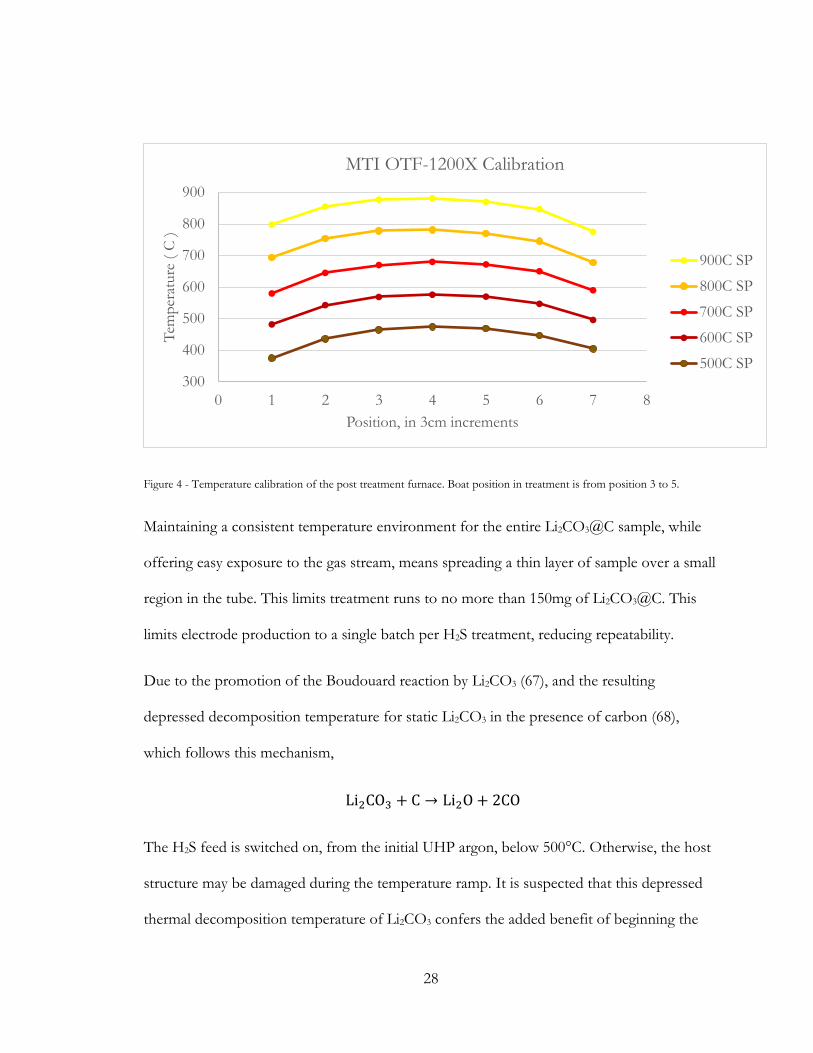
Figure 9 - Temperature calibration of the post treatment furnace.
The above assertion is based on a calibration done form 500°C to 900°C in 100°C
increments, seen here.
680
685
690
695
700
705
710
715
720
1 1.5 2 2.5 3
Rea
cto
r T
emp
erat
ure
(C
)
Position in 3 cm Increments
Reactor Temeprature across boat position at set point of 725C
725
28
Figure 4 - Temperature calibration of the post treatment furnace. Boat position in treatment is from position 3 to 5.
Maintaining a consistent temperature environment for the entire Li2CO3@C sample, while
offering easy exposure to the gas stream, means spreading a thin layer of sample over a small
region in the tube. This limits treatment runs to no more than 150mg of Li2CO3@C. This
limits electrode production to a single batch per H2S treatment, reducing repeatability.
Due to the promotion of the Boudouard reaction by Li2CO3 (67), and the resulting
depressed decomposition temperature for static Li2CO3 in the presence of carbon (68),
which follows this mechanism,
Li2CO3 + C → Li2O + 2CO
The H2S feed is switched on, from the initial UHP argon, below 500°C. Otherwise, the host
structure may be damaged during the temperature ramp. It is suspected that this depressed
thermal decomposition temperature of Li2CO3 confers the added benefit of beginning the
300
400
500
600
700
800
900
0 1 2 3 4 5 6 7 8
Tem
per
ature
( C
)
Position, in 3cm increments
MTI OTF-1200X Calibration
900C SP
800C SP
700C SP
600C SP
500C SP
29
conversion to Li2S at lower temperatures, forming a Li2S shell around the Li2CO3. This
would help prevent the losses of Li2CO3 due to melting (M.P. 723°C) or vaporization.
Experimental observation (3.8.2017, experimental notes) of the reactor at (set point) 725°C
under argon flow presented with a black smoke and burnt smell, confirming reaction in the
absence of H2S, likely that of the consumption of carbon by carbothermic decomposition of
Li2CO3.
2.3 CHARACTERIZATION
2.3.1 TGA
Thermo-Gravimetric Analysis (TGA) observation was performed in lab on a TA
Instruments Q-50 on alumina pans with platinum bails suspended by a platinum hang down
wire.
TGA utilizes a temperature programmable furnace sleeve and a gas flow feed, to affect
physical and chemical changes on a sample. The gas feed utilized in this work is either dry
air, or argon, offering oxidative and inert condition, respectively. In this work, TGA is
utilized to assess the ratio of carbon to lithium species; either Li2CO3 or Li2S, depending on
the stage of the process the sample is collected. The use of dry air as a gas feed allows for the
oxidation of carbon beginning around 350°C (depending on the quality of the carbon), at a
heating ramp of 10°C/min. The remaining mass, depending on the methods of preparation
an TGA programming, may be Li2O, Li2CO3, Li2SO4 or traces of Li2S.
In the case of Li2CO3@C particles, the ratio of carbon to Li2CO3 is ascertained via a flow of
dry air. Heating under a flow of dry air will yield mass loss during the oxidation of carbon,
30
due to the following reaction, where x increases, non-linearly, with the temperature of the
reaction.
C + O2∆H⇒ xCO + (1 − x)CO2
Complicating the measurement is the matter of carbothermal decomposition of Li2CO3, as a
participant in the Boudouard Reaction, whereby the thermal decomposition temperature of
Li2CO3 in the presence of carbon is depressed, due to the following two reactions,
Li2CO3∆H⇒ Li2O + CO2
C + CO2∆H⇒ 2CO
The oxidation of carbon by CO2 drives down the activation energy of the decomposition of
Li2CO3, expediting reaction at lower temperatures (68). As such a more conclusive TGA run
reaches the decomposition of Li2CO3 to Li2O, where the identity of the lithium specie can be
certain, rather than a combination of Li2CO3 and Li2O, at an unknown ratio. This leads to
increased wear on the TGA thermocouple, by exposure to oxidizing gas.
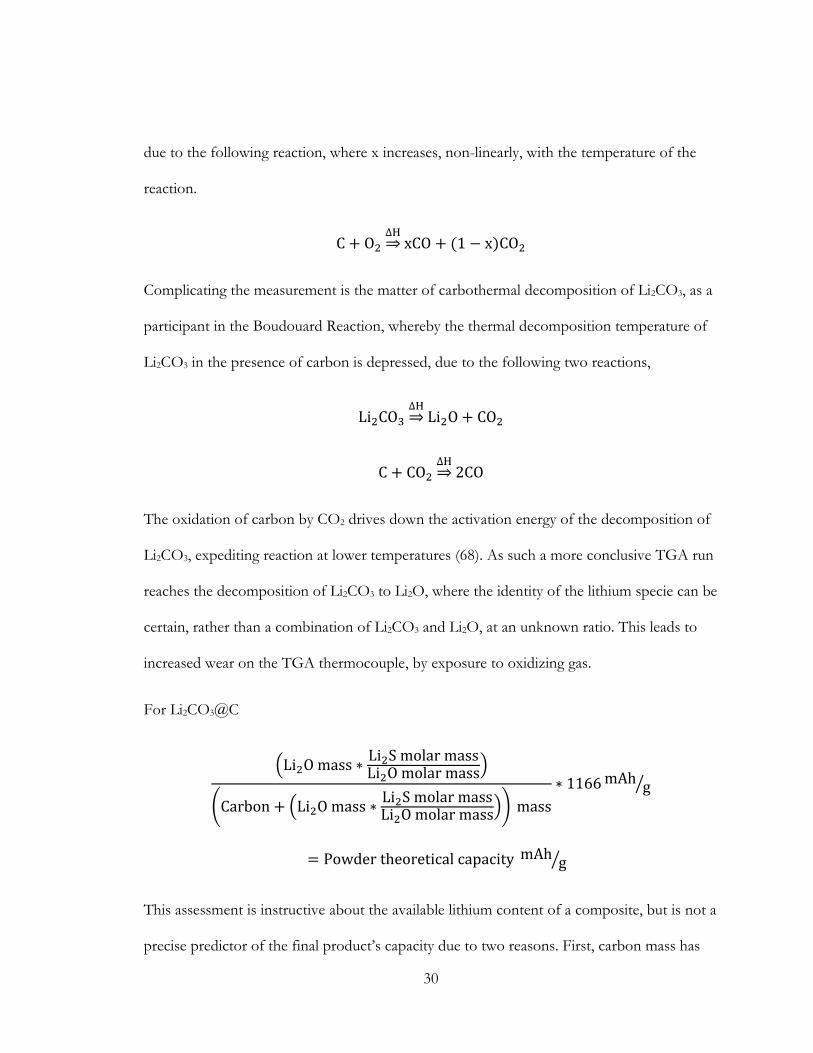
For Li2CO3@C
(Li2O mass ∗Li2S molar massLi2O molar mass
)
(Carbon + (Li2O mass ∗Li2S molar massLi2O molar mass
)) mass
∗ 1166mAh g⁄
= Powder theoretical capacity mAh g⁄
This assessment is instructive about the available lithium content of a composite, but is not a
precise predictor of the final product’s capacity due to two reasons. First, carbon mass has
31
been shown to alter during post treatment; which leads the above method to overestimate
carbon content and as such underestimate capacity. Second, complete conversion of Li2CO3
to Li2S is not guaranteed; which leads to an overestimation of capacity.
2.3.1.1 TGA methods development
A TGA program was devised with the express purpose of analyzing the Li2S content in an
Li2S@C composite. This program overcomes the reactivity of Li2S to atmospheric oxygen
and moisture, by pretreating with HCl, yielding a sample that results in a single temperature
stable lithium species, Li2O. This allows for an unambiguous analysis of Li2S content in the
original composite. This method is appropriate for the analysis of lithium content in
Li2CO3@C (such as this work), LiOH@C composites (69), Li2SO4@C (54), which may be
used as Li2S@C precursors.
The program includes temperature plateaus at 120°C, 500°C, 550°C, 650°C and 800°C. The
program operates under a flow of argon until ten minutes into the plateau at 550°C, when
the gas feed is switched to dry air, switching from an inert to an oxidizing environment. This
program was designed to parse out the various physical and chemical reactions with as great
a resolution as can be expected in TGA. A final analysis of the species present at any
moment in the sample pan would benefit from GC-MS sampling of the exhaust gases. This
is however outside the scope of this work. Best estimates of sample speciation, based on
literature and XRD, will be offered.
A pristine sample of Li2CO3 treated to the TGA program produced the following result.
32
0 50 100 150 200
0
200
400
600
800
Temperature (°C)
Weight (mg)
Derivative Weight
Time (min)
2
4
6
8
10
0
2
4
6
8
10
12
14
16
18
20
22
24
26
Figure 10 - TGA run of pristine Li2CO3
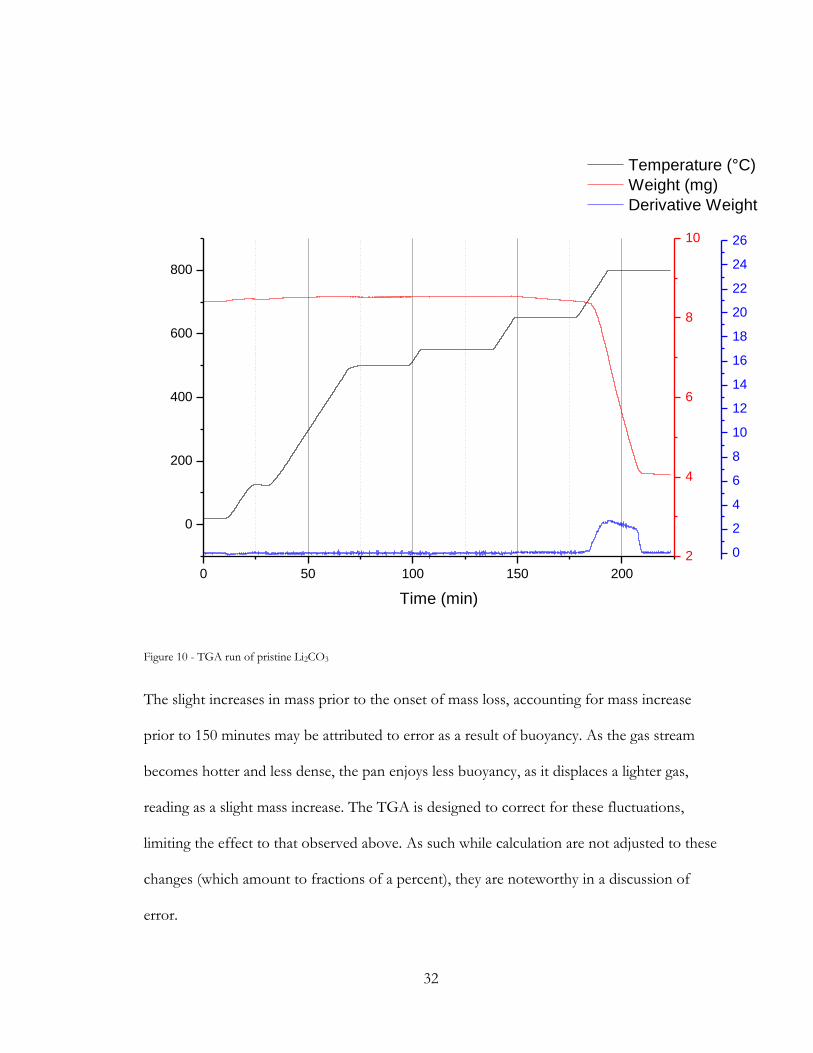
The slight increases in mass prior to the onset of mass loss, accounting for mass increase
prior to 150 minutes may be attributed to error as a result of buoyancy. As the gas stream
becomes hotter and less dense, the pan enjoys less buoyancy, as it displaces a lighter gas,
reading as a slight mass increase. The TGA is designed to correct for these fluctuations,
limiting the effect to that observed above. As such while calculation are not adjusted to these
changes (which amount to fractions of a percent), they are noteworthy in a discussion of
error.
33
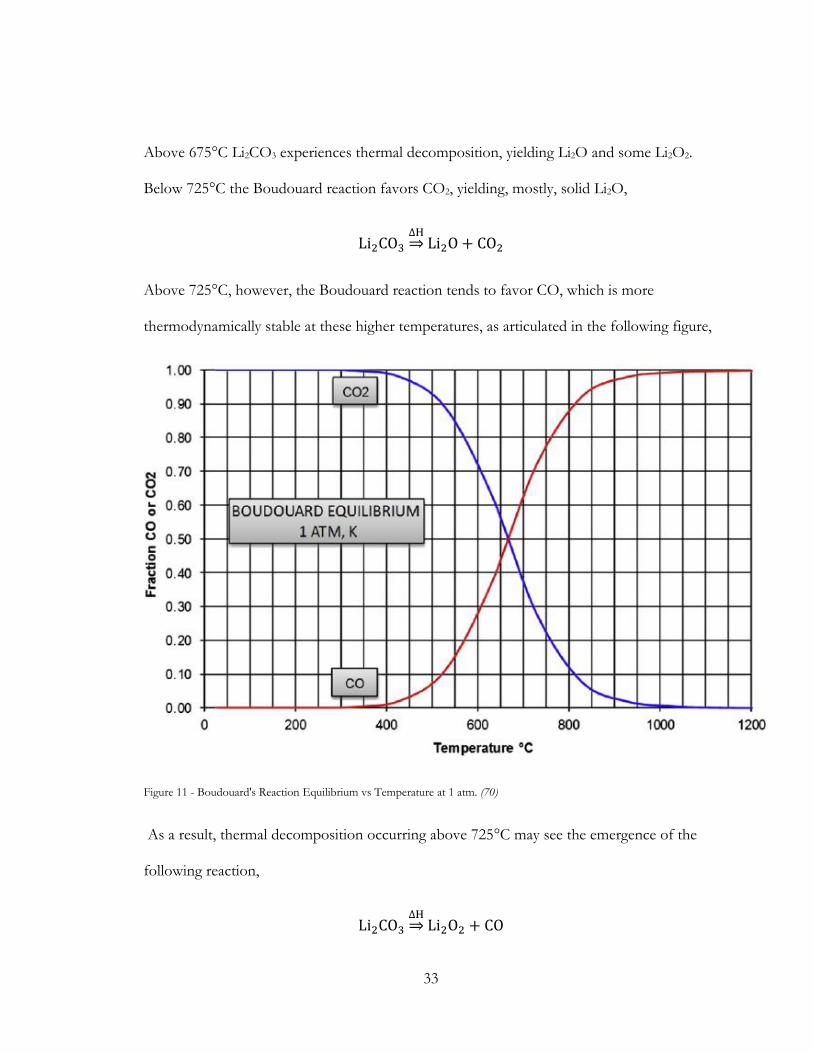
Above 675°C Li2CO3 experiences thermal decomposition, yielding Li2O and some Li2O2.
Below 725°C the Boudouard reaction favors CO2, yielding, mostly, solid Li2O,
Li2CO3∆H⇒ Li2O + CO2
Above 725°C, however, the Boudouard reaction tends to favor CO, which is more
thermodynamically stable at these higher temperatures, as articulated in the following figure,
Figure 11 - Boudouard's Reaction Equilibrium vs Temperature at 1 atm. (70)
As a result, thermal decomposition occurring above 725°C may see the emergence of the
following reaction,
Li2CO3∆H⇒ Li2O2 + CO
34
Continuing exposure to heat will eventually decompose lithium peroxide to lithium oxide, in
the following way,
Li2O2∆H⇒ Li2O +
1
2O2
The formation of Li2O exclusively would suggest a loss of nearly 59.6% mass of the sample,
while the formation of Li2O2 exclusively would suggest a roughly 38.1% mass loss. The mass
loss in the above is 51.5%, suggesting a mix of both Li2O and Li2O2. The shallow downward
slope that follows represents continuing decomposition toward Li2O.
Observing Derivative Weight serves as a fingerprint of the particular reaction. The position,
along the X axis, and character (sharp for high kinetics, truncated for slow kinetics or
transport limited) of the Derivative Weight plot allows some measure of identification of the
reactions on going, and as such the identity of reactants and products. As such, in comparing
one sample to another, the Derivative Weight plot is set to a similar minimum and
maximum, in this case: -0.5 to 26. Since the TGA will adjust the program backward or
forward based on temperature during ramps, observing X position based on the time
coordinate is incomplete, while observing temperature only may be less instructive during
temperature plateaus. For the majority of the decomposition of Li2CO3 then, the Derivative
Weight signature resides at (713, 800)°C and (185, 209)min. These points were taken as the
outer limits where the Derivative Weight registers as 0.3, a value that signal a departure from
the noise, and the clear initiation or winding down of mass loss.
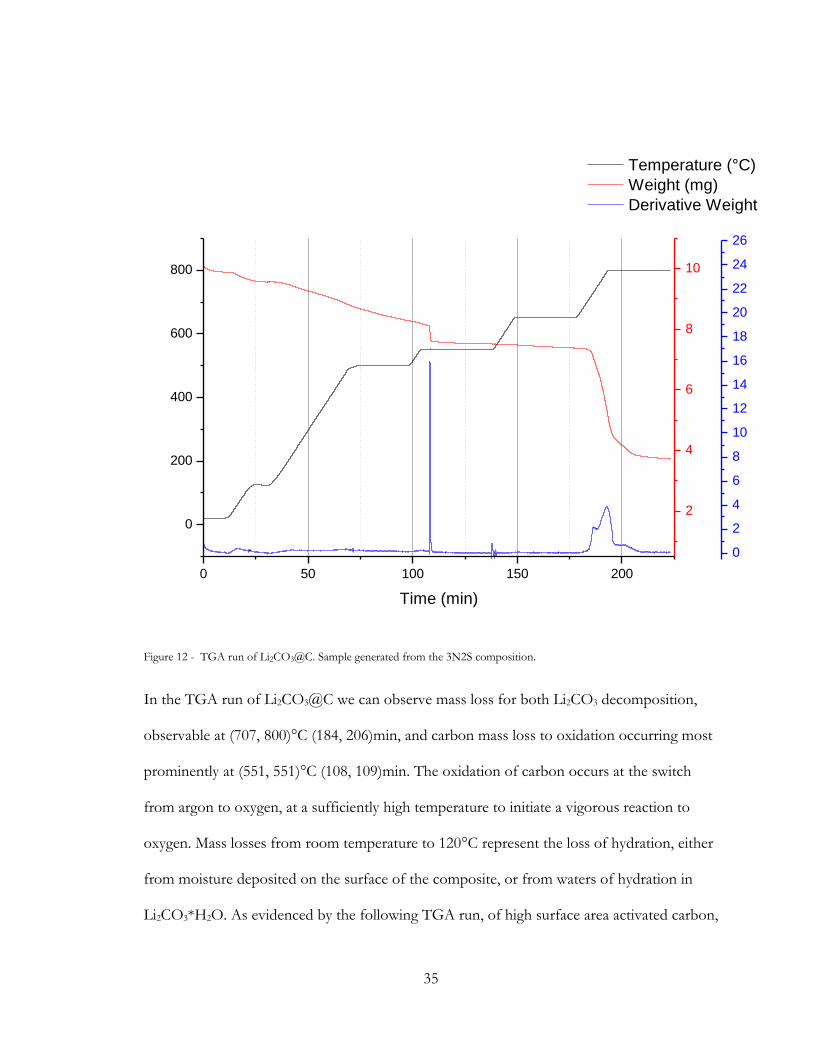
By contrast, a Li2CO3@C sample shows a more complex path of decomposition, as follows,
35
0 50 100 150 200
0
200
400
600
800
Temperature (°C)
Weight (mg)
Derivative Weight
Time (min)
2
4
6
8
10
0
2
4
6
8
10
12
14
16
18
20
22
24
26
Figure 12 - TGA run of Li2CO3@C. Sample generated from the 3N2S composition.
In the TGA run of Li2CO3@C we can observe mass loss for both Li2CO3 decomposition,
observable at (707, 800)°C (184, 206)min, and carbon mass loss to oxidation occurring most
prominently at (551, 551)°C (108, 109)min. The oxidation of carbon occurs at the switch
from argon to oxygen, at a sufficiently high temperature to initiate a vigorous reaction to
oxygen. Mass losses from room temperature to 120°C represent the loss of hydration, either
from moisture deposited on the surface of the composite, or from waters of hydration in
Li2CO3*H2O. As evidenced by the following TGA run, of high surface area activated carbon,
36
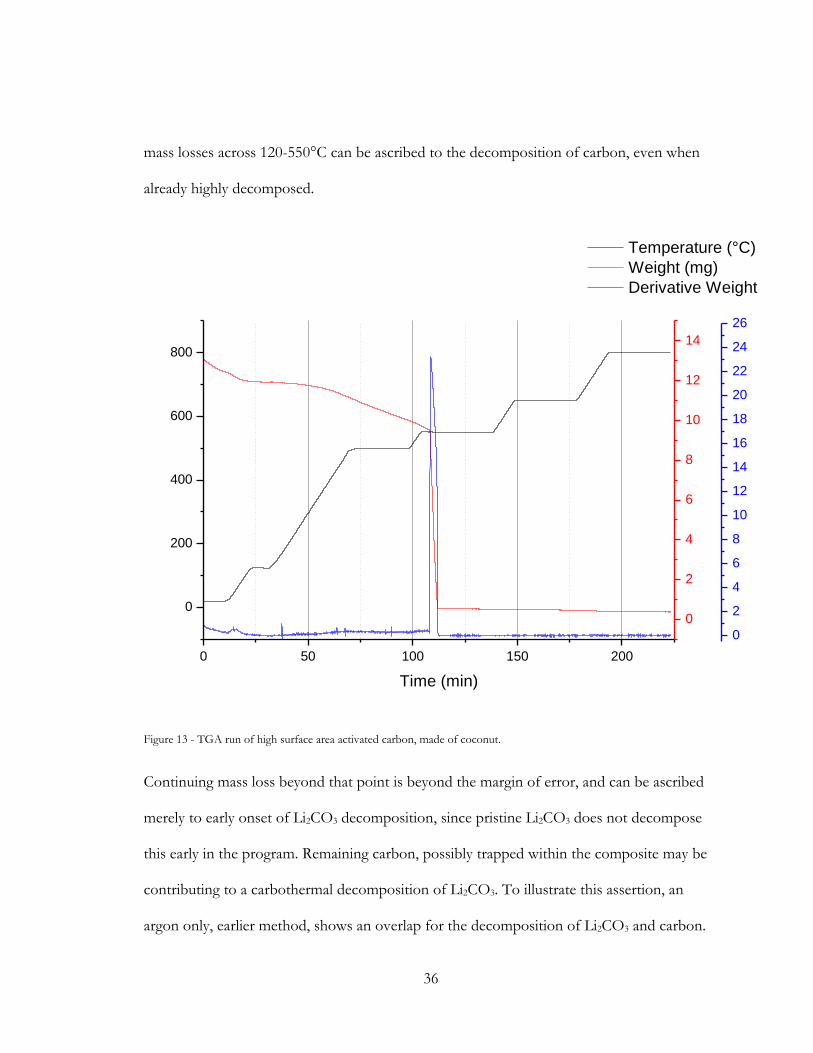
mass losses across 120-550°C can be ascribed to the decomposition of carbon, even when
already highly decomposed.
0 50 100 150 200
0
200
400
600
800
Temperature (°C)
Weight (mg)
Derivative Weight
Time (min)
0
2
4
6
8
10
12
14
0
2
4
6
8
10
12
14
16
18
20
22
24
26
Figure 13 - TGA run of high surface area activated carbon, made of coconut.
Continuing mass loss beyond that point is beyond the margin of error, and can be ascribed
merely to early onset of Li2CO3 decomposition, since pristine Li2CO3 does not decompose
this early in the program. Remaining carbon, possibly trapped within the composite may be
contributing to a carbothermal decomposition of Li2CO3. To illustrate this assertion, an
argon only, earlier method, shows an overlap for the decomposition of Li2CO3 and carbon.
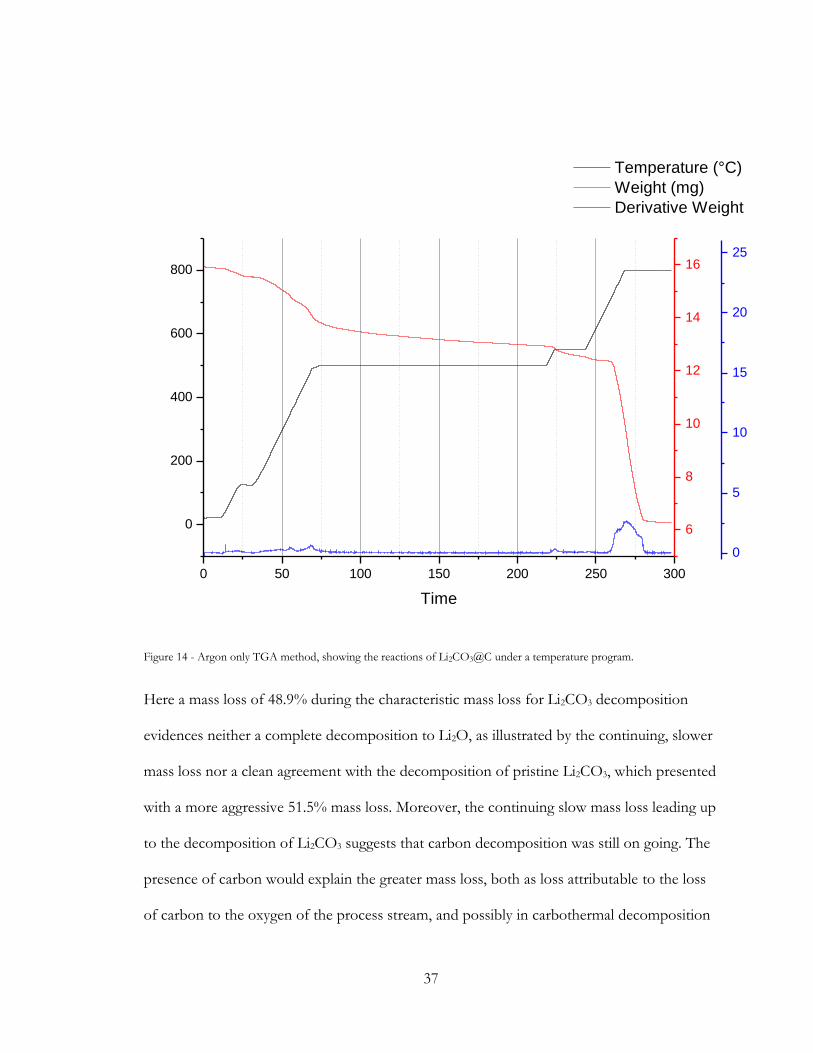
37
0 50 100 150 200 250 300
0
200
400
600
800
Temperature (°C)
Weight (mg)
Derivative Weight
Time
6
8
10
12
14
16
0
5
10
15
20
25
Figure 14 - Argon only TGA method, showing the reactions of Li2CO3@C under a temperature program.
Here a mass loss of 48.9% during the characteristic mass loss for Li2CO3 decomposition
evidences neither a complete decomposition to Li2O, as illustrated by the continuing, slower
mass loss nor a clean agreement with the decomposition of pristine Li2CO3, which presented
with a more aggressive 51.5% mass loss. Moreover, the continuing slow mass loss leading up
to the decomposition of Li2CO3 suggests that carbon decomposition was still on going. The
presence of carbon would explain the greater mass loss, both as loss attributable to the loss
of carbon to the oxygen of the process stream, and possibly in carbothermal decomposition
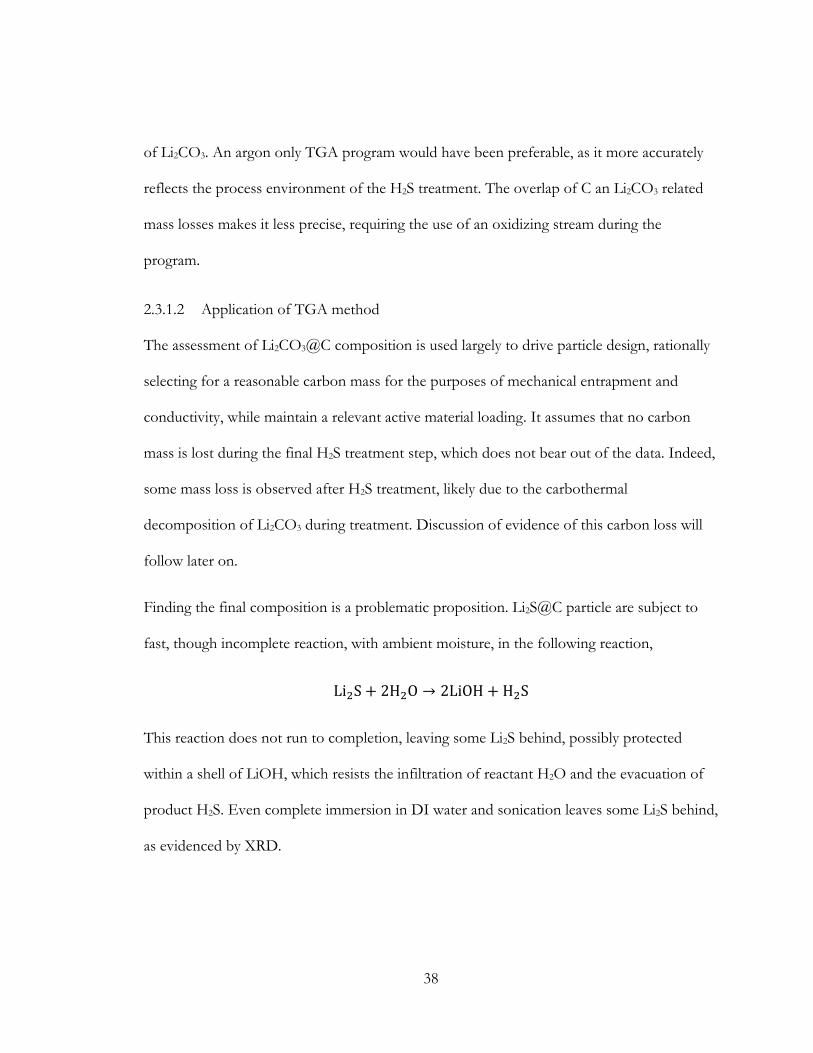
38
of Li2CO3. An argon only TGA program would have been preferable, as it more accurately
reflects the process environment of the H2S treatment. The overlap of C an Li2CO3 related
mass losses makes it less precise, requiring the use of an oxidizing stream during the
program.
2.3.1.2 Application of TGA method
The assessment of Li2CO3@C composition is used largely to drive particle design, rationally
selecting for a reasonable carbon mass for the purposes of mechanical entrapment and
conductivity, while maintain a relevant active material loading. It assumes that no carbon
mass is lost during the final H2S treatment step, which does not bear out of the data. Indeed,
some mass loss is observed after H2S treatment, likely due to the carbothermal
decomposition of Li2CO3 during treatment. Discussion of evidence of this carbon loss will
follow later on.
Finding the final composition is a problematic proposition. Li2S@C particle are subject to
fast, though incomplete reaction, with ambient moisture, in the following reaction,
Li2S + 2H2O → 2LiOH + H2S
This reaction does not run to completion, leaving some Li2S behind, possibly protected
within a shell of LiOH, which resists the infiltration of reactant H2O and the evacuation of
product H2S. Even complete immersion in DI water and sonication leaves some Li2S behind,
as evidenced by XRD.
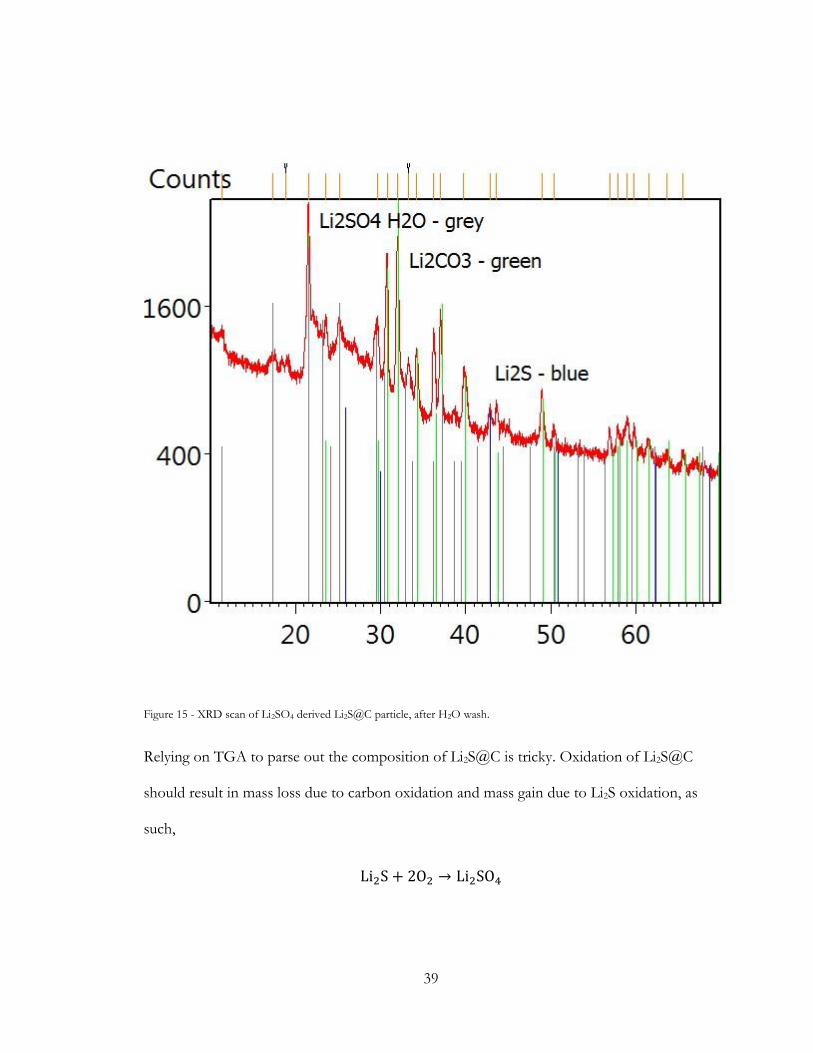
39
Figure 15 - XRD scan of Li2SO4 derived Li2S@C particle, after H2O wash.
Relying on TGA to parse out the composition of Li2S@C is tricky. Oxidation of Li2S@C
should result in mass loss due to carbon oxidation and mass gain due to Li2S oxidation, as
such,
Li2S + 2O2 → Li2SO4
40
In theory the final weight should represent bare Li2SO4. However, the conversion of an
unknown fraction of Li2S into LiOH makes this analysis impossible. Since the mass loss due
to carbon oxidation and mass gain due to Li2S oxidation overlap, their respective
contributions to the final mass can not be parsed out. The final mass then is a combination
of unknown fractions of Li2SO4, LiOH, Li2O2 and Li2O, or at higher temperatures, Li2SO4
and Li2O. The combination of Li2O and Li2SO4 at unknown ratios makes this technique
inappropriate for ascertaining the value of Li2S in the composite.
In response to this challenge, it is assumed, as a conservative estimate, that the entirety of
the composite Li2S@C is Li2S. This informs the theoretical capacity calculation and the
electrolyte to sulfur ratio. The latter represents an important variable, which bears heavily on
the feasibility of the composite as a commercial product; both in terms of affecting high
sulfur utilization to achieve high capacity, and in terms of maintaining high cycle stability.
2.3.1.3 Sample pretreatment for TGA method
An attempt to resolve this issue involves the pretreatment of Li2S@C. Immersing Li2S@C in
water and sonicating, proved to incompletely react the material to LiOH@C, as mass gains
due to remaining Li2S, oxidizing to Li2SO4, obscured the loss due to carbon oxidation. Some
mixture of Li2SO4 an Li2O (the thermal decomposition product of LiOH) of unknown
composition remains, yielding inconclusive results. The anion reactant replacing S2- in Li2S
would ideally have a significantly higher Ka value than H2S, promoting the ionization of the
replacing anion, yielding a recombination of the S2- anion as H2S, evolving as gas as the water
is evaporated off. Ka is formulated as follows, with values in the proceeding table,
41
Ka =[H+][A−]
[HA]
Table 2 - Ka values of relevant acids. Values extracted from University of Washington publication, (71)
Ka Acid Base conjugate
Name Formula Formula Name
1.3*106 Hydrochloric acid HCl Cl- Chloride ion
1.0*103 Sulfuric acid H2SO4 HSO4- Hydrogen sulfate ion
2.4*101 Nitric acid HNO3 NO3- Nitrate ion
1.0*10-2 Hydrogen Sulfate ion HSO4- SO4
- Sulfate ion
4.4*10-7 Carbonic Acid H2CO3 HCO3- Hydrogen carbonate
ion
1.1*10-7 Hydrosulfiric acid H2S HS- Hydrogen sulfide ion
1.3*10-13 Hydrogen sulfide ion HS- S2- Sulfide ion
1*10-14 Water H2O OH- Hydroxide ion
Considering hydrochloric acid (HCl) and Hydrogen Sulfide (H2S) we see that the high Ka
value of HCl and low values for H2S and HS-, drive the equilibrium toward ionized Cl- and
dissolved H2S.
2HCl + Li2S ↔ 2Li+ + S2− + 2H+ + 2Cl−↔2LiCl + H2S
In this case, chloride ions remain in solution, available for recombination with lithium ions
upon solvent evaporation, whereas the H2S and any excess HCl may evolve as gas. As such,
42
acids such as HCl and HNO3 (which likewise has a much higher Ka than H2S and HS-)
would be appropriate. XRD testing of the pretreated sample with HNO3 yielded a complex
speciation including ammonium related species of lithium sulfate. Since the goal of this
pretreatment is to simplify the sample to offer easily read TGA findings, HNO3 was deemed
inappropriate as a pretreatment option.
Moreover, due to HNO3’s lower Ka value relative to H2SO4, an HNO3 treatment would not
be appropriate for a Li2SO4 sourced material.
It was hypothesized that merely wetting Li2S@C was insufficient, since the product of this
reaction is poorly soluble in water, leading to local saturation in the fine pores of the
composite, preventing further conversion to LiOH. A more soluble reaction product is
desirable. Lithium Chloride (LiCl) is meaningfully more soluble than LiOH at room
temperature, as can be seen in the following figure,
43
0 20 40 60 80 100
0
5
10
15
20
25
30
35S
atu
ratio
n C
on
ce
ntr
atio
n [M
]
Temperature (C)
LiOH
LiNO3
LiCl
Pretreatment Temperature
Figure 16 - Solubility of pretreatment relevant lithium salts in aqueous solution.
Conversion to LiCl can be achieved by sonication of Li2S@C in a highly concentrated HCl
solution, yielding the following reaction,
Li2S + 2HCl → 2LiCl + H2S
The mixture is allowed to evaporate at room temperature in a hood. Due to the formation of
LiCl hydrates, this followed by a finishing in an oven at 120°C, to promote the following
decomposition,
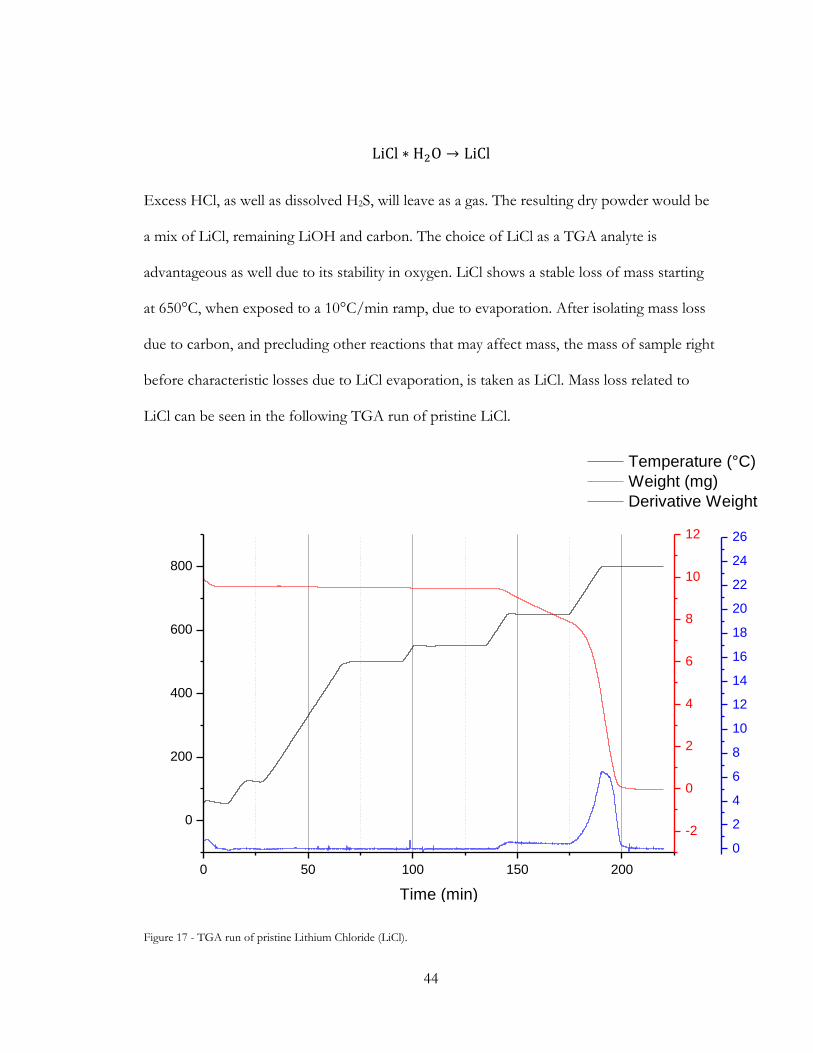
44
LiCl ∗ H2O → LiCl
Excess HCl, as well as dissolved H2S, will leave as a gas. The resulting dry powder would be
a mix of LiCl, remaining LiOH and carbon. The choice of LiCl as a TGA analyte is
advantageous as well due to its stability in oxygen. LiCl shows a stable loss of mass starting
at 650°C, when exposed to a 10°C/min ramp, due to evaporation. After isolating mass loss
due to carbon, and precluding other reactions that may affect mass, the mass of sample right
before characteristic losses due to LiCl evaporation, is taken as LiCl. Mass loss related to
LiCl can be seen in the following TGA run of pristine LiCl.
0 50 100 150 200
0
200
400
600
800
Temperature (°C)
Weight (mg)
Derivative Weight
Time (min)
-2
0
2
4
6
8
10
12
0
2
4
6
8
10
12
14
16
18
20
22
24
26
Figure 17 - TGA run of pristine Lithium Chloride (LiCl).
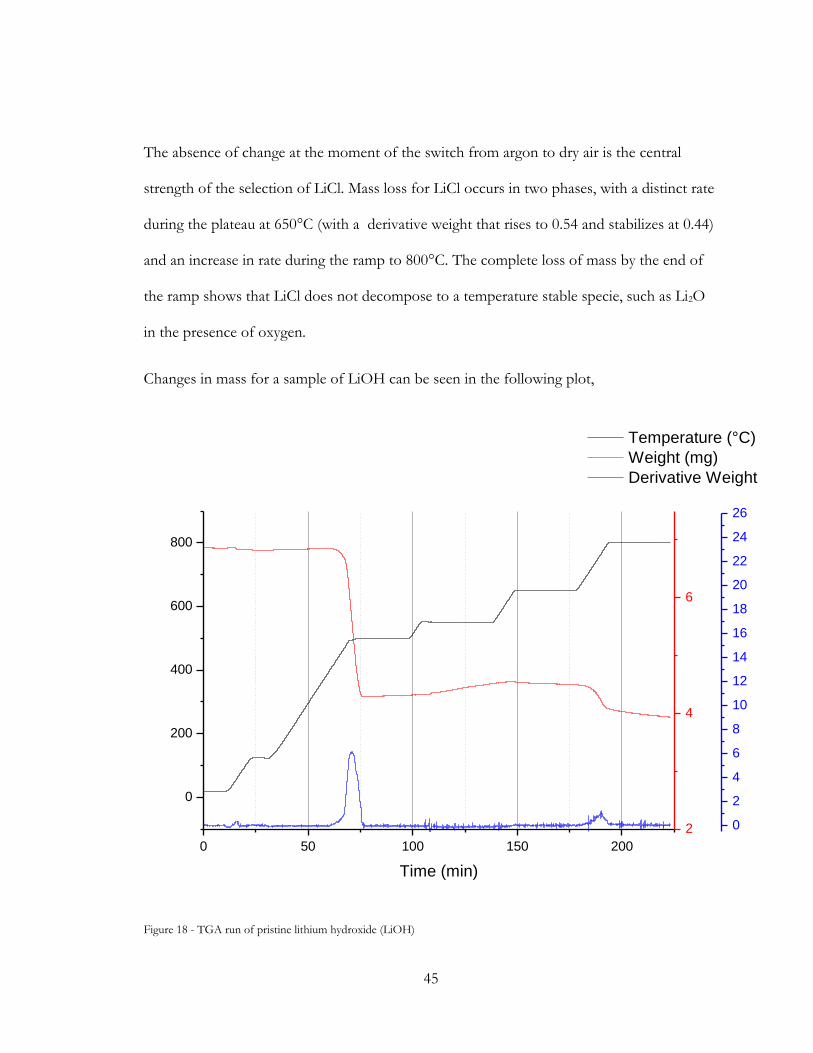
45
The absence of change at the moment of the switch from argon to dry air is the central
strength of the selection of LiCl. Mass loss for LiCl occurs in two phases, with a distinct rate
during the plateau at 650°C (with a derivative weight that rises to 0.54 and stabilizes at 0.44)
and an increase in rate during the ramp to 800°C. The complete loss of mass by the end of
the ramp shows that LiCl does not decompose to a temperature stable specie, such as Li2O
in the presence of oxygen.
Changes in mass for a sample of LiOH can be seen in the following plot,
0 50 100 150 200
0
200
400
600
800
Temperature (°C)
Weight (mg)
Derivative Weight
Time (min)
2
4
6
0
2
4
6
8
10
12
14
16
18
20
22
24
26
Figure 18 - TGA run of pristine lithium hydroxide (LiOH)
46
The first mass loss peaks at 71 minutes, occurring across (434, 500)°C, (64,76)min,
representing the following reactions,
2LiOH∆H→ Li2O + H2O↔ Li2O2 + H2
Complete decomposition to Li2O would present with a mass loss of roughly 27%, whereas
here a mass loss of 17.2% occurs, suggesting some content of Li2O2 is formed; which is
confirmed later on upon mass loss. Upon switching to oxygen during the 550°C plateau an
acceleration in mass increase is observed. Here some lithium oxide is oxidized to lithium
peroxide, by the following action,
2Li2O + O2 → 2Li2O2
Lithium peroxide is known to decompose from as low a temperature as 450°C (72). This run
however shows that formation of Li2O2 continues until roughly 575°C, and mass loss initiates
beyond 650°C where rapid decomposition occurs, back to lithium oxide, reversing the above
reaction,
2Li2O2 → 2Li2O + O2
This reaction continues until Li2O2 content is exhausted by the 800°C plateau, whereupon
Li2O begins to evaporate. As such the lithium content attributable to oxides is taken as the
mass at the end of the sharp decline leading into the 800°C plateau.
2.3.1.4 Pretreated sample analysis
This analysis can then be performed on an HCl pretreated sample,
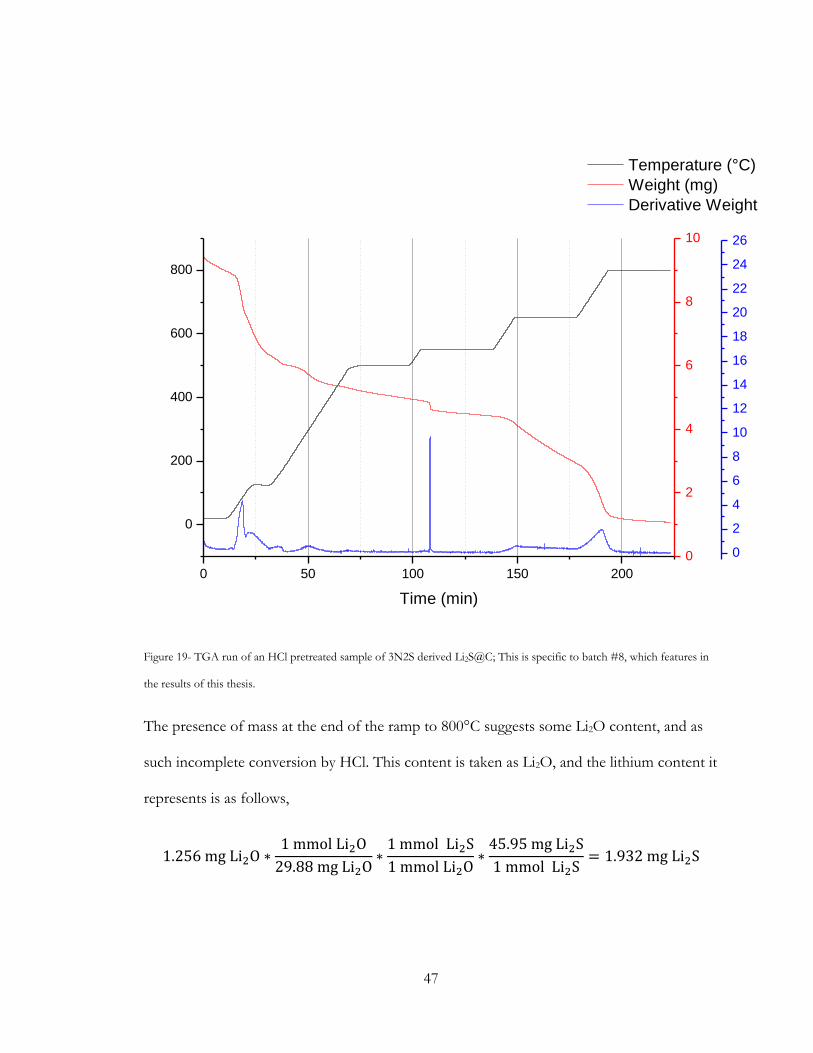
47
0 50 100 150 200
0
200
400
600
800
Temperature (°C)
Weight (mg)
Derivative Weight
Time (min)
0
2
4
6
8
10
0
2
4
6
8
10
12
14
16
18
20
22
24
26
Figure 19- TGA run of an HCl pretreated sample of 3N2S derived Li2S@C; This is specific to batch #8, which features in
the results of this thesis.
The presence of mass at the end of the ramp to 800°C suggests some Li2O content, and as
such incomplete conversion by HCl. This content is taken as Li2O, and the lithium content it
represents is as follows,
1.256 mg Li2O ∗1 mmol Li2O
29.88 mg Li2O∗1 mmol Li2S
1 mmol Li2O∗45.95 mg Li2S
1 mmol Li2S= 1.932 mg Li2S
48
Mass loss baring the signature of LiCl evaporation appears at the 650°C plateau. Mass loss
associated with final Li2O content is subtracted from the mass at the beginning of the LiCl
related mass loss.
4.313 mg (LiCl + Li2O) − 1.932 mg Li2O = 2.381 mg LiCl
This yields to the following content of Li2S, attributable to LiCl,
2.381 mg LiCl ∗1 mmol LiCl
42.394 mg LiCl∗1 mmol Li2S
2 mmol LiCl∗45.95 mg Li2S
1 mmol Li2S= 1.290 mg Li2S
The mass of dry sample is taken at the point of lowest Derivative Weight, which is 6.022mg.
Beyond this point decomposition of carbon is certainly occurring, but before it mass loss
from the dehydration of LiCl*H2O is ongoing.
6.022 mg (LiCl + Li2O + C) − 4.313 mg (LiCl + Li2O) = 1.709 mg C
The Li2S content of the Li2S@C composite is calculated as follows,
1.932 mg Li2Sattributale to Li2O + 1.290 mg Li2Sattributable to LiCl
1.709 mg C + 1.932 mg Li2Sattributale to Li2O + 1.290 mg Li2Sattributable to LiCl
=3.222 mg Li2S
4.922 mg Composite powder= 0.6546 Li2S content
The theoretical capacity of this composite is then,
0.6546 Li2S ∗ 1166 mAh g⁄ = 763.28 mAh/g
2.3.2 Cycler
Battery cycling was done on ARBIN, Neware and MTI cyclers, in lab. Charge and discharge
in this work is pursued as a function of calculated cathode theoretical capacity. The mass of
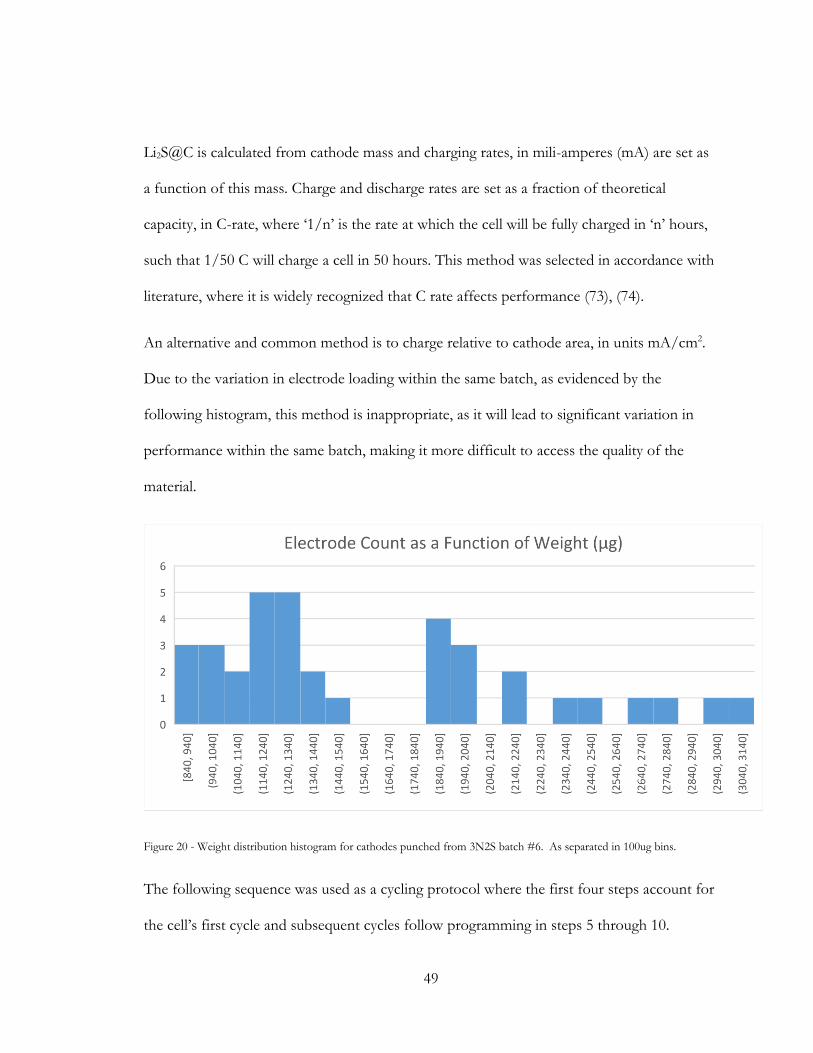
49
Li2S@C is calculated from cathode mass and charging rates, in mili-amperes (mA) are set as
a function of this mass. Charge and discharge rates are set as a fraction of theoretical
capacity, in C-rate, where ‘1/n’ is the rate at which the cell will be fully charged in ‘n’ hours,
such that 1/50 C will charge a cell in 50 hours. This method was selected in accordance with
literature, where it is widely recognized that C rate affects performance (73), (74).
An alternative and common method is to charge relative to cathode area, in units mA/cm2.
Due to the variation in electrode loading within the same batch, as evidenced by the
following histogram, this method is inappropriate, as it will lead to significant variation in
performance within the same batch, making it more difficult to access the quality of the
material.
Figure 20 - Weight distribution histogram for cathodes punched from 3N2S batch #6. As separated in 100ug bins.
The following sequence was used as a cycling protocol where the first four steps account for
the cell’s first cycle and subsequent cycles follow programming in steps 5 through 10.
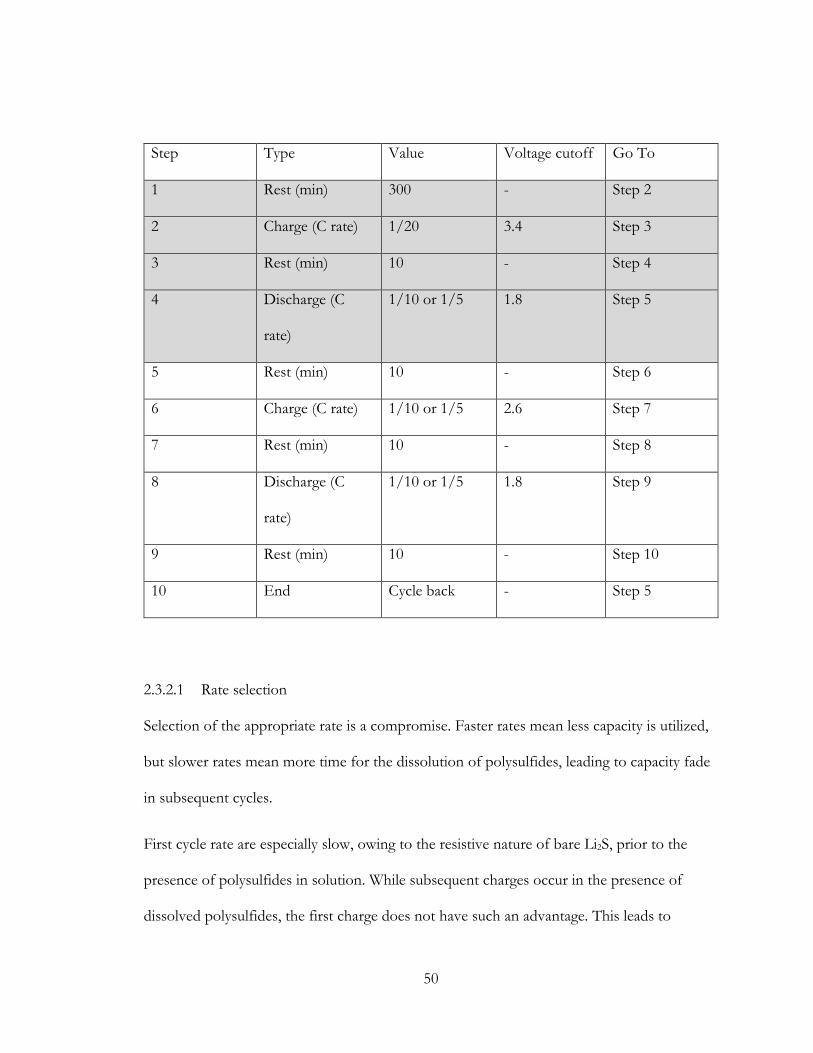
50
Step Type Value Voltage cutoff Go To
1 Rest (min) 300 - Step 2
2 Charge (C rate) 1/20 3.4 Step 3
3 Rest (min) 10 - Step 4
4 Discharge (C
rate)
1/10 or 1/5 1.8 Step 5
5 Rest (min) 10 - Step 6
6 Charge (C rate) 1/10 or 1/5 2.6 Step 7
7 Rest (min) 10 - Step 8
8 Discharge (C
rate)
1/10 or 1/5 1.8 Step 9
9 Rest (min) 10 - Step 10
10 End Cycle back - Step 5
2.3.2.1 Rate selection
Selection of the appropriate rate is a compromise. Faster rates mean less capacity is utilized,
but slower rates mean more time for the dissolution of polysulfides, leading to capacity fade
in subsequent cycles.
First cycle rate are especially slow, owing to the resistive nature of bare Li2S, prior to the
presence of polysulfides in solution. While subsequent charges occur in the presence of
dissolved polysulfides, the first charge does not have such an advantage. This leads to
51
dramatically higher overpotential, with Li2S activating above 2.7V, and full capacity reached
well above 3.3V. At normal charge and discharge rates, of 1/10 and 1/5 C, these
overpotentials are exacerbated, leading to even higher voltages necessary to see reaction.
Such high potentials activate unwanted reactions, such as the corrosion of the steel casing by
the LiTFSI electrolyte salt, above 3.9V. The selection of lower rates for the first charge and
discharge were made in order to fully access the capacity of the cathode. It is recognized
however, that these slow charge rates allow for significant capacity loss, which bears out in
the drop of capacity seen in subsequent cycles.
2.3.3 Cyclic Voltammetry
2.3.4 XRD
X-ray Diffraction observation was performed at the University of California, Riverside’s
PANalytical Empyrean, operating between 10 and 70 degrees, using the standard ½, 10 and
8 masks. For Li2CO3@C samples, preparation was done by packing powder onto a stainless
steel substrate, when sufficient powder was available to cover it entirely. When low sample
mass was available, a zero diffraction silicon or silica substrate was used (MTIXTL inc.).
Scans lasting ten minutes were deemed sufficient to characterize these samples. For Li2S@C
samples, a zero diffraction silicon or silica substrate (MTIXTL inc.) was introduced into an
argon filled glovebox. Sample is loaded onto the center of the substrate, leaving a wide
margin of clean substrate. Kapton tape is applied to seal the sample of from the
environment, utilizing the clean edges of the substrate to ensure a good seal. Poor sealing
will lead to reaction, detectable by the evolution of H2S, the potent, unmistakable scent of
rotten eggs. Due to obstruction by the kapton tape, obscuring the peaks as a large carbon
52
signal, scans of either ten or twenty eight minutes were employed. Once fully sealed by the
Kapton tape, these samples are loaded either into a spring loaded holder, or onto a pressed
putty. To facilitate a flat positioning of the substrate on the putty, press the substrate into the
putty with two glass microscope slides, one on each side of the substrate, until the slides are
flush with the outside of the holder and can press down no further.
2.3.5 TEM
Transmission Electron Microscopy observation was performed at the University of
California, Riverside’s Central Facility for Advanced Microscopy and Microanalysis
(CFAMM), on an FEI Tecnai12, operating at 120kV. Sample preparation was done by
dispersing Li2CO3@C particles, or HCl acid washed Li2S@C particles, in ethanol. The
dispersion was dropped onto a lacey carbon Cu grid (300 mesh), suspended by negative
action, anti-capillary tweezers.
2.3.6 SEM
Scanning Electron Microscopy observation was performed at the University of California,
Riverside’s Nova NanoSEM 450. Sample preparation was done by dropping dry powder
onto a sticky carbon tape substrate, then blowing off loose particles.
53
3 ASP
3.1 APPLICATION OF SPRAY PYROLYSIS
ASP is a scalable powder production system used in the pigment, advanced ceramics and
catalyst industries (66) (75) (76). In general, ASP involves aerosolizing a reactant solution
followed by a pyrolysis step under an inert or reactive environment. The ASP process is
distinctive in that each reactant solution droplet acts as a micro-reactor. Selection of a micro-
reactor scale enables this project to harness low thermal transport limitations which affords
fast reaction kinetics. Moreover, by drawing from a well mixed solution, ASP generates
droplets of uniform solution concentrations. Both of these factors come together to deliver
a homogenous product from the start of production to finish, with results that are arguably
independent of scale.
ASP has been investigated for the production of electrode materials including LiCoO2 ( (77)
(78) (79) (80) (81) (82)), Li[Ni1/3Co1/3Mn1/3]O2 (83), LiMn2O4 (84) (85) (86) (87) (88),
LiMMnO4 (M=Ni, Co, Fe, Mg, Al) (89) (90) (91) (92) (93), LiFePO4 , (94) (95) (96) (97) (98)
(99), LiNiCoAlO2 (100). Interest in ASP is due to the flexibility of the method. ASP offers a
wide range of variables to control the outcomes of production volume, particle size
distribution, composition and morphology. The aerosol can be generated by a variety of
means, including ultra-sonication, an electric field or high velocity gas followed by tube
furnace heating, plasma, flame or heating at the collection surface (56). This project utilizes
high velocity gas as the atomizing method, followed by simple furnace heating. This method
is the simplest, and least flexible option to deliver both atomization and a heat treatment. As
54
such, success with this system is a powerful proof of concept. As this project was conceived
to be a drop-in solution with existing technologies for electrochemical storage
manufacturing, ASP was selected to leverage an existing skillset in the energy storage work
force.
3.2 FUNDAMENTALS
This project relies on aerosol spray pyrolysis as shape and size setting mechanism for the
production of precursor powder. The term ‘aerosol’ refers to a population of non-gas
objects sufficiently small as to be suspended in a gas stream. In this case, a population of
solution droplets that evolve into dry particles across a heated reaction path. The solution
involves a carrier solvent, which is evolved off, and precursor solutes, which precipitate
within the droplet as the solvent is removed, and solute concentration increases past the
concentration of saturation for that solute in this solvent.
In this system the carrier solvent is water, carrying water soluble Li2S and carbon precursors.
Lithium salts were used as Li2S precursors and sucrose was used as carbon precursor. The
goal of the spray pyrolysis step is to produce hierarchal particles where a lithium salt is
encased by a carbonized material. The carbon precursor need not be fully carbonized
(becoming pure amorphous carbon), but it must be sufficiently carbonized that during
subsequent heat treatment, where the powder sits in an immobilized boat, the powder will
not melt, fuse or agglomerate, or fail to contain its lithium salt content.
Water is used as a carrier solvent for several reasons. As a solvent, it can dissolve a variety of
sufficiently ionic solutes, covering a variety of salts and carbohydrates, which are suitable as
55
Li2S and carbon precursors, respectively. With an eye toward scale-up, the choice of water as
a solvent meant cheaper feed costs than organic solvents. And lastly, the relatively low
viscosity of water, when compared to organic solvents, means collisions between droplets
will result in a spherical shape. The use of more viscous solvents may lead to slower
relaxation of the surface tensions and the occurrence of peanut shaped particles, if only two
collided, up to massive agglomerates, for multiple collisions (101).
3.2.1 Micro-reactor system
Aerosol spray pyrolysis delivers a mist of particles through a heated region, as carried by a
gas stream. In this design, every particle is a micro-reactor, as the reactions carried out in the
system occur while the particle remains suspended in the gas stream, essentially independent
of neighboring particles. Heat transport through the droplet is significantly higher than that
of the gas stream, as can be observed in the proceeding plot. As such, the temperature inside
the particle can be assumed to be in equilibrium with the temperature of the gas stream.
By deploying such an aerosol, the temperature of the reacting matter is determined less so by
the position within the particle, but the particle’s position within the reactor. This design
obviates the detrimental effects of temperature gradients in reactor environments, delivering
a predictable and consistent treatment to the feed material.
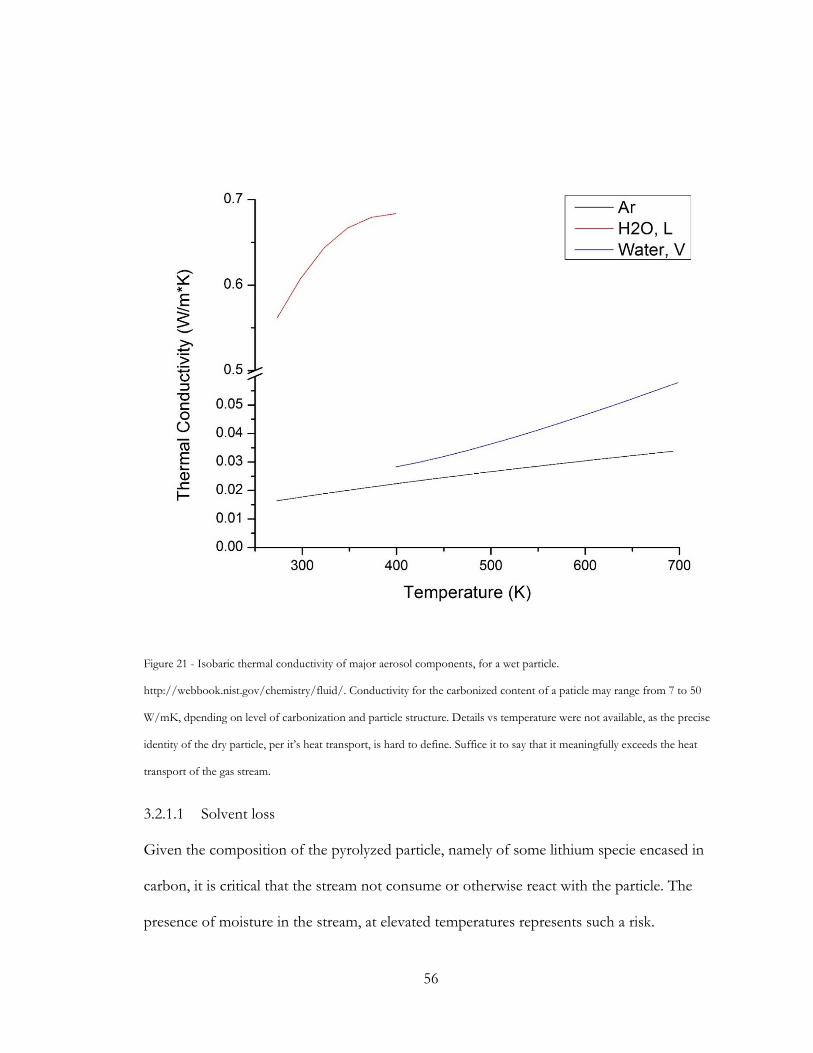
56
Figure 21 - Isobaric thermal conductivity of major aerosol components, for a wet particle.
http://webbook.nist.gov/chemistry/fluid/. Conductivity for the carbonized content of a paticle may range from 7 to 50
W/mK, dpending on level of carbonization and particle structure. Details vs temperature were not available, as the precise
identity of the dry particle, per it’s heat transport, is hard to define. Suffice it to say that it meaningfully exceeds the heat
transport of the gas stream.
3.2.1.1 Solvent loss
Given the composition of the pyrolyzed particle, namely of some lithium specie encased in
carbon, it is critical that the stream not consume or otherwise react with the particle. The
presence of moisture in the stream, at elevated temperatures represents such a risk.
57
C + H2O → H2 + CO
The water gas reaction, as seen above, is an endothermic reaction (∆H = + 131 kJ/mol). As
such the elevated temperatures of the reactor (600-900°C), necessary to carbonize the
carbon precursor, would drive the reaction toward the products, consuming the carbon host.
To accommodate a removal of the solvent, a diffusion dryer is employed between the
atomizer and the heated zone.
The diffusion dryer consists of a ½” diameter steel sheath through which the aerosol travels,
surrounded by a cylinder filled with silica gel beads. The silica gel serves as a condensation
surface for water vapor. Condensation of the water vapor draws moisture out of the stream,
which in turn draws moisture out of the aerosol droplets, out to the stream. This drying
technique offers a relatively slow solvent loss, which is beneficial for the formation of dense
particles.
3.2.1.2 Relative diffusion of solutes, solvent and impact on architecture
Slow solvent loss allows for the randomly dispersed solutes to re-equilibrate across a
shrinking droplet. In a shrinking droplet, the mean concentration of solutes can be described
as such,
Cm = Co (RoR)3
Where C denotes concentration, R is radius, subscript m is the mean and subscript o is the
initial condition. As the droplet loses solvent the concentration increases by a cubed factor
(101). As the concentration at a radius r within the droplet exceeds the saturation
58
concentration, solutes begin to precipitate. If the concentration across the droplet exceeds
saturation more or less at the same time across the entire droplet, solutes will precipitate
across the entire volume, in what is termed volume precipitation, delivering a dense particle.
Alternatively, If the solvent loss is too rapid, the solutes near the outside of the droplet have
little time to diffuse, via concentration gradient, deeper into the particle. This condition leads
to surface precipitation, where a highly concentrated solute, at the outer edge of the drying
particle, forms a shell. This shell is then subject to rupture, if further solvent cannot diffuse
through the shell. Since a coherent hierarchal structure is desired, and rupture represents
poor protection of the internal, active material, a shell structure is not desirable.
The following figure articulates the architectural results of different reactor conditions for an
aerosol particle. The top row shows a particle where solutes precipitated more or less at the
same time across the particle, leading to volume precipitation, yielding a dense particle. The
subsequent row details surface precipitation, where solvent loss rate exceeded the diffusion
rate of solutes. This leads to a shell forming around the droplet, where solvent remains to
evaporate. If the shell permeability is too low for solvent escape, pressure from the
evaporation of solvent will lead to a rupture. If shell permeability is sufficiently high, solvent
vapor may escape, leaving an intact shell. Due to the materials selected in this work, odd
structures resulting from melting are not an issue. Particles produced in this work are almost
entirely spherical.
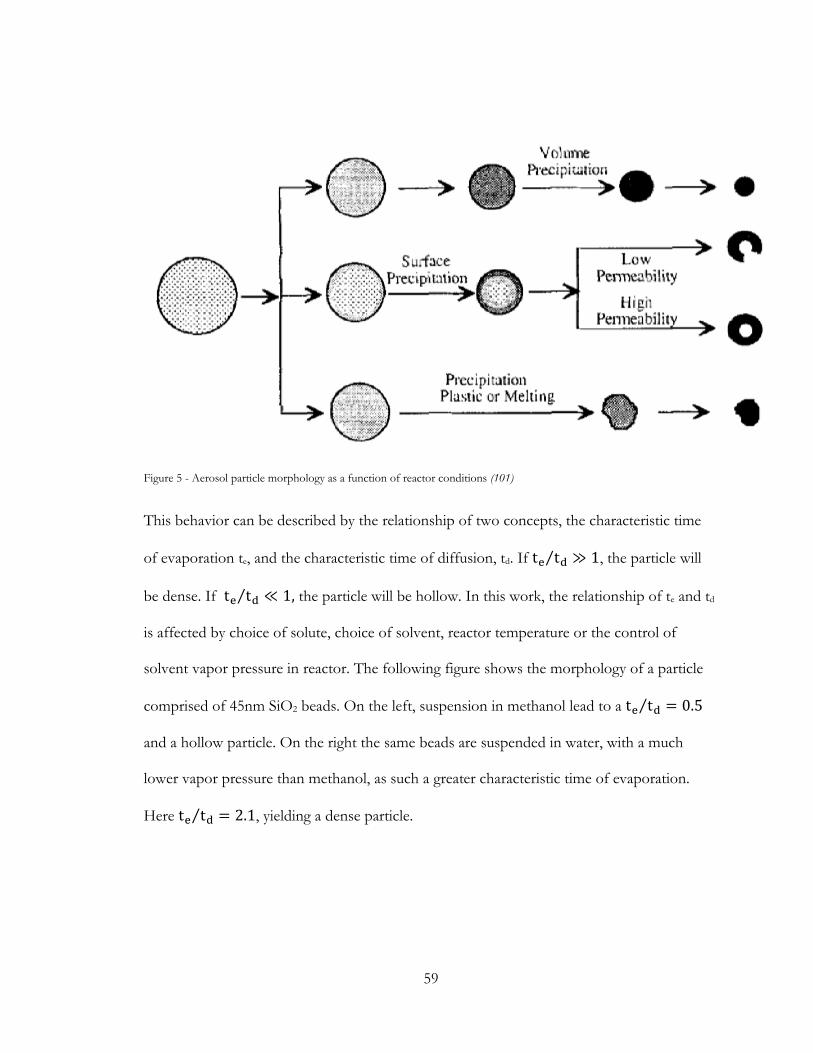
59
Figure 5 - Aerosol particle morphology as a function of reactor conditions (101)
This behavior can be described by the relationship of two concepts, the characteristic time
of evaporation te, and the characteristic time of diffusion, td. If te td⁄ ≫ 1, the particle will
be dense. If te td⁄ ≪ 1, the particle will be hollow. In this work, the relationship of te and td
is affected by choice of solute, choice of solvent, reactor temperature or the control of
solvent vapor pressure in reactor. The following figure shows the morphology of a particle
comprised of 45nm SiO2 beads. On the left, suspension in methanol lead to a te td⁄ = 0.5
and a hollow particle. On the right the same beads are suspended in water, with a much
lower vapor pressure than methanol, as such a greater characteristic time of evaporation.
Here te td⁄ = 2.1, yielding a dense particle.
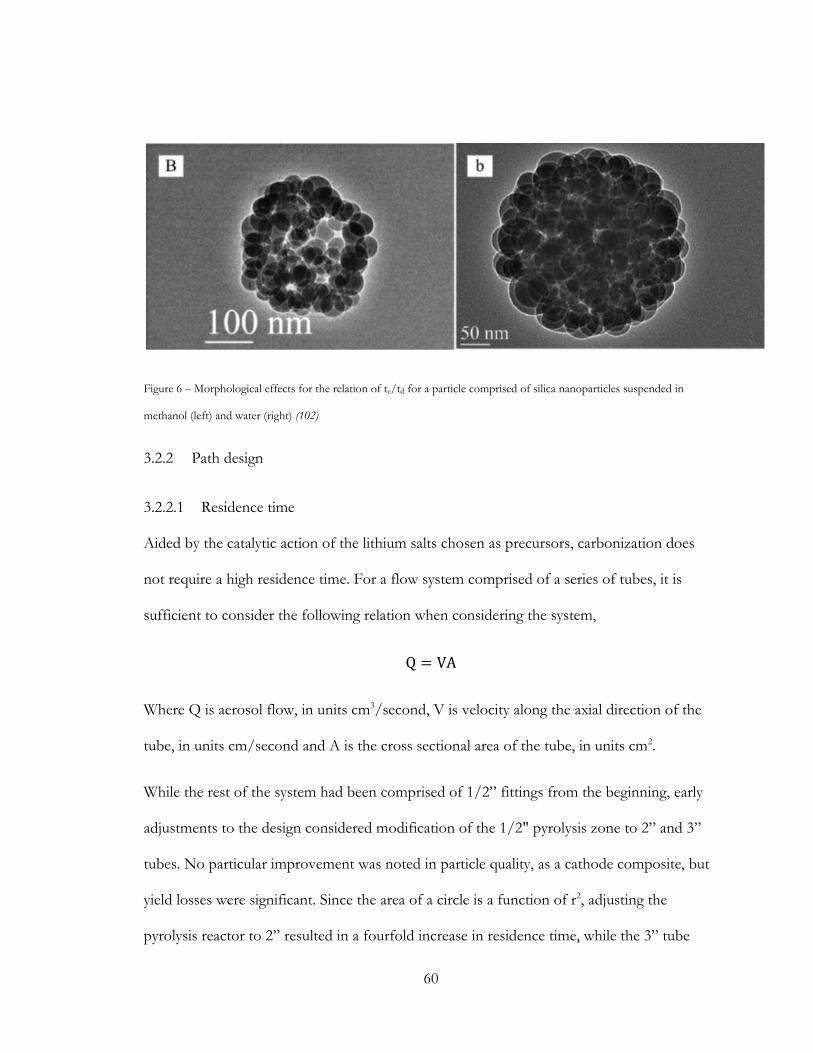
60
Figure 6 – Morphological effects for the relation of te/td for a particle comprised of silica nanoparticles suspended in
methanol (left) and water (right) (102)
3.2.2 Path design
3.2.2.1 Residence time
Aided by the catalytic action of the lithium salts chosen as precursors, carbonization does
not require a high residence time. For a flow system comprised of a series of tubes, it is
sufficient to consider the following relation when considering the system,
Q = VA
Where Q is aerosol flow, in units cm3/second, V is velocity along the axial direction of the
tube, in units cm/second and A is the cross sectional area of the tube, in units cm2.
While the rest of the system had been comprised of 1/2” fittings from the beginning, early
adjustments to the design considered modification of the 1/2" pyrolysis zone to 2” and 3”
tubes. No particular improvement was noted in particle quality, as a cathode composite, but
yield losses were significant. Since the area of a circle is a function of r2, adjusting the
pyrolysis reactor to 2” resulted in a fourfold increase in residence time, while the 3” tube
61
resulted in a nine fold increase in residence time. These increases in residence time yielded a
streak of black deposition at the bottom of the pyrolysis tube, toward the outlet. Suggesting
ballistic losses of the powder prior to reaching the collection filter. Moreover, Brownian
motion may have played a role in deposition losses as well, for the finer particles, as the
tubing darkened along its entire diameter, near the tube outlet.
Were greater residence time deemed meaningfully helpful for some reason, such as in
combining the pyrolysis step with a post treatment step, the pyrolysis chamber should be
aligned such that flow from entrance to exit moved toward gravity. In this way, ballistic
action would merely accelerate the particles toward collection, rather than lead to wall losses.
3.2.2.2 Heating regime
A preheater situated between the atomizer and diffusion dryer was considered as a means of
removing solvent more effectively from the aerosol stream, to enable the use of Li2SO4 as
the nucleating salt. At minimum, the formation of Maillardized (exhibiting some level of
carbonization) particles with substantial carbon content (>50%) are necessary, when using
Li2SO4 as a lithium salt.
The preheater consisted of 1/2” copper tubing with three full loops, wrapped in three
heating tapes, encased in an insulating box. Preheater temperature was measured by placing a
K-type thermocouple at the outlet. Temperatures of 75°C to 350°C were attempted with
sucrose, glucose and cellobiose as carbon sources, and lithium sulfate as a nucleator.
Operation at 75°C at the preheater and 400°C pyrolysis lead to a collection filter soaked in
aqueous aerosol product. This is incompatible with powder production, as any hierarchal
architecture generated will lead to redissolution of lithium salts. Operation at 200°C of the
62
preheater, with no pyrolysis generated lightly Maillardized particles with a carbon content of
79%, per TGA assessment. Light Maillardation results in light brown particles, subject to
melting at higher temperatures in post processing. Despite the high carbon content, thought
to help in encasing the lithium salt, this product was insufficiently Maillardized to be an
effective encasement in post treatment.
Operation at 200°C with pyrolysis reaction at 600°C generated well Maillardized particles
with a carbon content of 4.2%, per TGA assessment. This carbon content was deemed too
low to be useful. Operation at 350°C yielded highly agglomerated particles, which may lead
yield loss due to ballistic deposition down stream in pyrolysis chamber and uneven
downstream processing. It was determined, due to this variability in results, none of which
beneficial, that a preheater was not necessarily helpful.
A practical issue with the preheater was the formation of high concentration plugs in the
heating coil. This plug lead to increasing material losses, as the aerosol struck the growing
obstruction, until the plug sealed the system enough to create a buildup of pressure that
destroyed the quartz atomizer.
The system runs at a rate of 2-4 ml of solution drawn per hour, where solvent represents 70-
98% by weight of the solution. Variability in solution draw is attributable to increasing
pressure drop over the course of a run, as filter deposition increases, as well as solution
viscosity at varying levels of solute concentration. 25psig setting results in a flow of 8.6
SCFH argon at room temperature, as measured down stream of the pyrolysis section, which
converts to roughly 244 liters per hour (LPH). At 20°C the partial pressure of water is 0.34
psi. At 75°C, the partial pressure of water is 5.6 psi. This translates to a saturation of the
63
solvent in the aerosol stream at 0.8% and 14% respectively, across unheated and minimally
heated entrances to the diffusion dryer. At a rate of 4 ml per hour, water vapor represents, at
most 100 ml of vapor per hour in a stream of 244 LPH, or 0.04% at room temperature.
Argon and steam volume per hour would scale together linearly at higher temperatures. The
preheater concept was abandoned ultimately, having shown no beneficial effects, due to the
conceptual understanding that a heated stream has a higher carrying capacity of steam and as
such would not benefit the diffusion drying process.
3.2.3 Concentration vs particle size
In ASP, final particle sizing is proportional to initial droplet sizing, as articulated in the
following plot, whereby the ratio of initial concentration, Co, over saturation concentration,
Cs, determines the unpyrolyzed particle size. The ratio of total solute concentration (Co) to
their saturation concentration (Cs) in NitS at the low end and CarS at the high end, are
roughly 0.1 and 0.6 respectively. The atomizer employed in this study selects for aerosol
droplets of maximum diameter of 2µm. Given these ratios, maximum particles yielded from
both would result in a maximum particle size below 2µm, as described in the following plot.
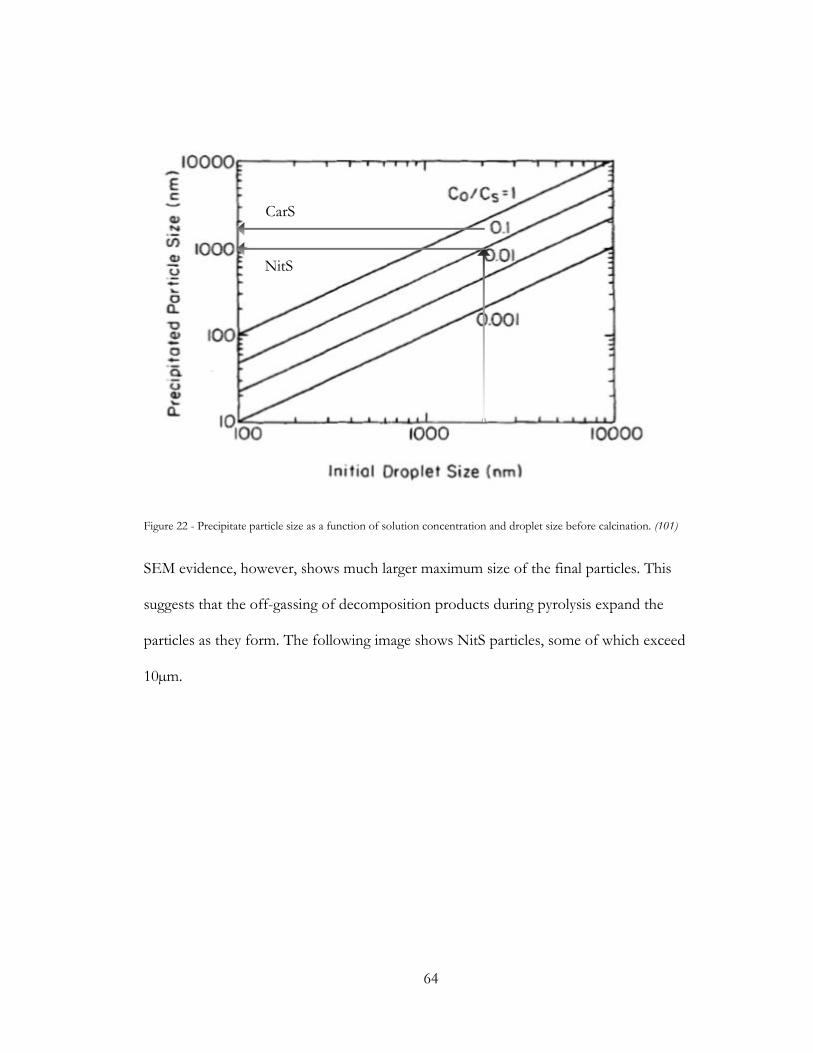
64
Figure 22 - Precipitate particle size as a function of solution concentration and droplet size before calcination. (101)
SEM evidence, however, shows much larger maximum size of the final particles. This
suggests that the off-gassing of decomposition products during pyrolysis expand the
particles as they form. The following image shows NitS particles, some of which exceed
10µm.
NitS
CarS
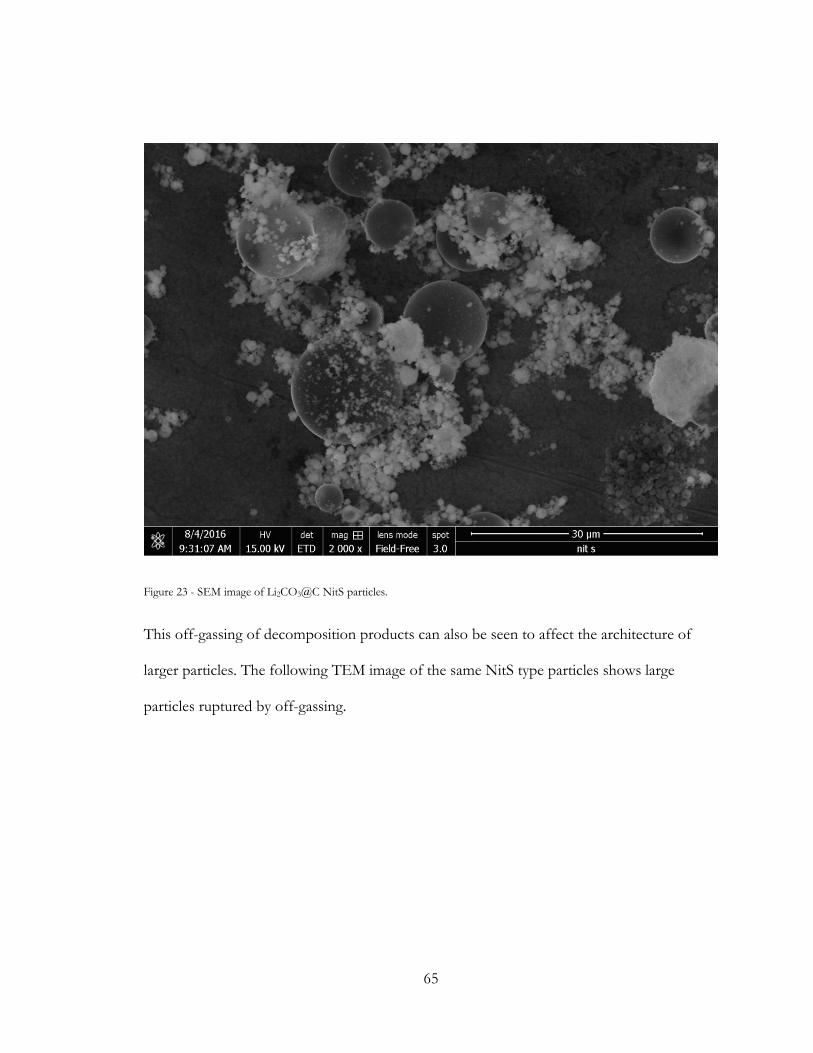
65
Figure 23 - SEM image of Li2CO3@C NitS particles.
This off-gassing of decomposition products can also be seen to affect the architecture of
larger particles. The following TEM image of the same NitS type particles shows large
particles ruptured by off-gassing.
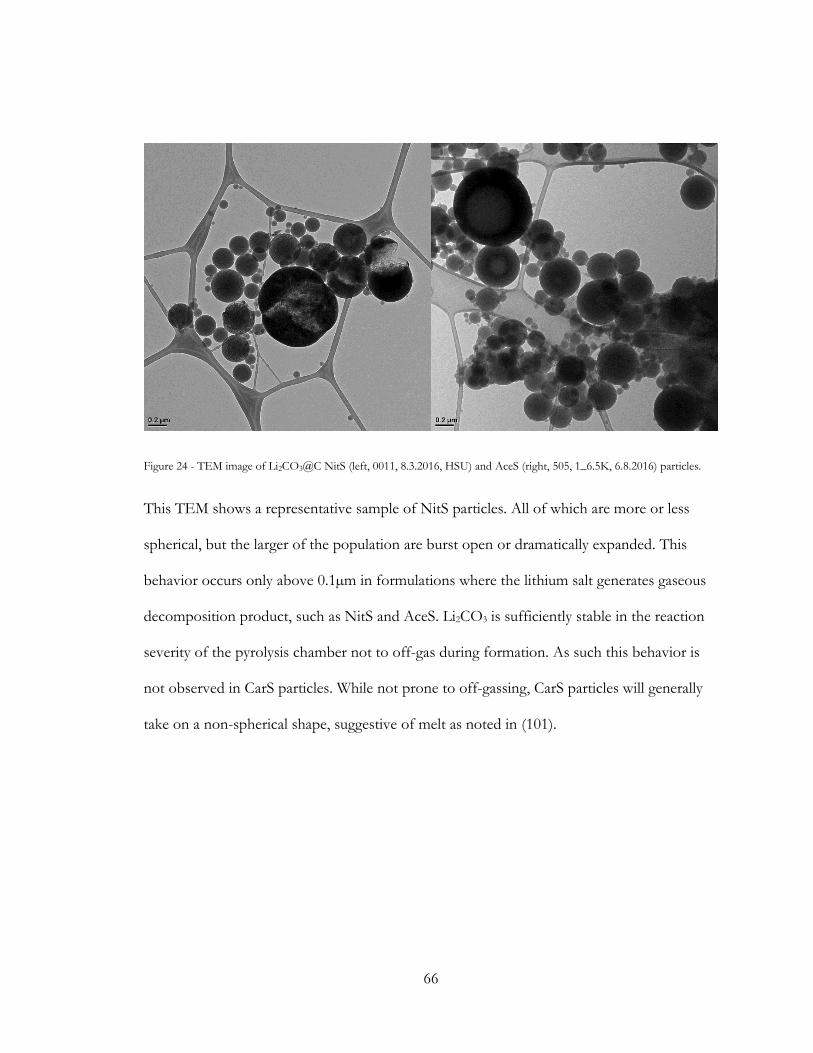
66
Figure 24 - TEM image of Li2CO3@C NitS (left, 0011, 8.3.2016, HSU) and AceS (right, 505, 1_6.5K, 6.8.2016) particles.
This TEM shows a representative sample of NitS particles. All of which are more or less
spherical, but the larger of the population are burst open or dramatically expanded. This
behavior occurs only above 0.1µm in formulations where the lithium salt generates gaseous
decomposition product, such as NitS and AceS. Li2CO3 is sufficiently stable in the reaction
severity of the pyrolysis chamber not to off-gas during formation. As such this behavior is
not observed in CarS particles. While not prone to off-gassing, CarS particles will generally
take on a non-spherical shape, suggestive of melt as noted in (101).
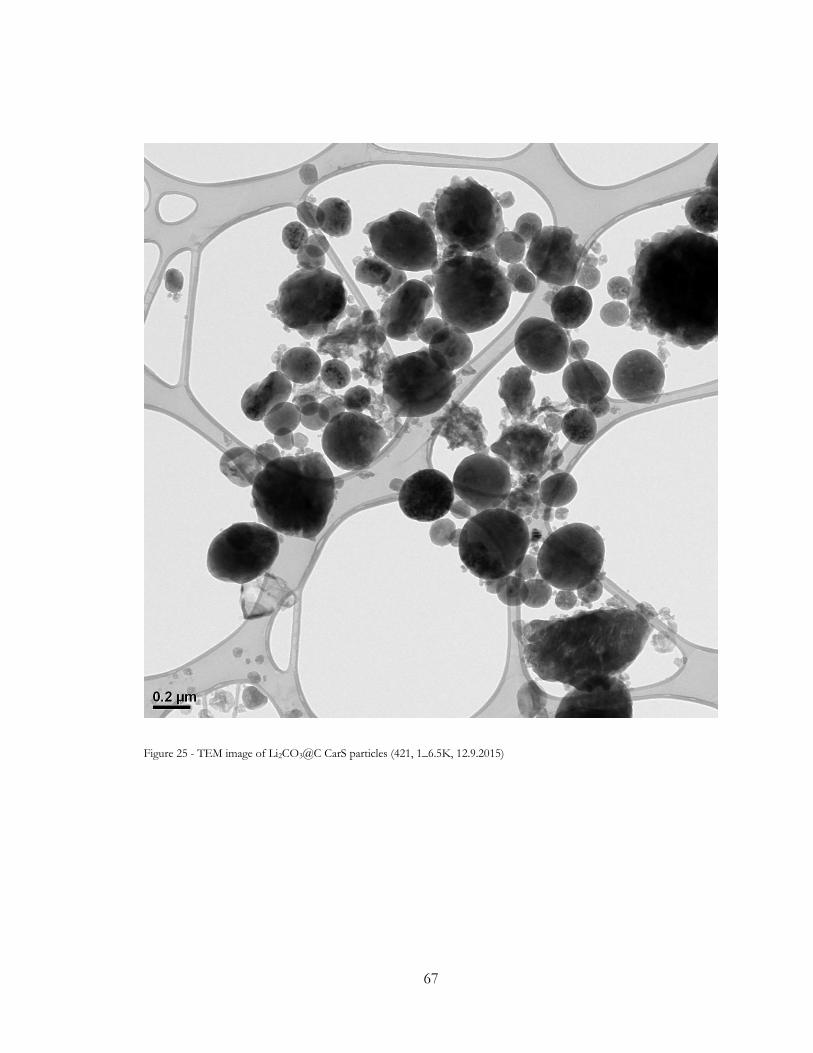
67
Figure 25 - TEM image of Li2CO3@C CarS particles (421, 1_6.5K, 12.9.2015)
68
3.2.3.1 Diffusion dryer
3.2.3.1.1 Limitations of Lab Setup
Deemed the most practical means of aerosol solvent dilution, the diffusion dryer is an
effective tool for the removal of sufficient solvent for the purposes of ASP. Due to the
design, which employs a steel mesh tube, significant turbulence can be expected. This is
thought to have contributed to the relatively low mass yields, hovering around 3-5%. While
not all solute mass is expected to translate to powder mass, given the decomposition of the
various precursors, 3-5% was almost unworkably low at times. This mass yield acted as an
additional specification setter regarding solute concentration, driving the practical
concentration of solutes upwards. Since the diffusion dryer appeared to maintain charge
until roughly 40ml of solution passed through it, greater solute concentrations were needed
to translate that 40ml of solution to a meaningful batch. This limitation is particularly
poignant in the CarS formulation, where Li2CO3 saturation, at 0.17M, severely limited mass
collected from CarS production to between 0.035 to 0.083g in the final formulation, 1C085S
(0.1M Li2CO3, 0.085M sucrose). AceS by comparison, yielded 0.043 to 0.127g, for the
3A015S formulation (0.3M lithium acetate, 0.015M sucrose). NitS yielded 0.139 to 0.257g,
for 3N2S (0.3M lithium nitrate, 0.2M sucrose). As a result of this disparity, NitS was often
used as the test bed for other variables, such as pyrolysis temperature, post treatment
duration and temperature and eventually the electrolyte study. This lead to choices made that
optimized the performance of 3N2S product, rather than optimal configurations for all three
precursor sets.
69
The diffusion dryer, moreover, is not a steady state component of the system. As the run
proceeds, the beads closest to the flow will saturate; this leads to a shallower gradient, and a
weaker draw on moisture. As such, powder produced early on in a production run will
experience a dryer pyrolysis environment, leading to faster heating in pyrolysis, and less
carbon loss. The former may affect the architecture by way of tending toward surface
precipitation, while the latter may result in better carbon coverage. As the run proceeds, a
wetter aerosol stream leads to slower H2O loss in pyrolysis (bot from remaining moisture
and from the dehydration of lithium salt hydrates), promoting less complete carbonization as
well as the consumption of the outer most carbon in the matrix. At the end of a run, all
powder is collected together, as there is no separation by production timing. This yields a
mix of particles, with varying architectures and coverage, potentially yielding meaningful
variation in composite quality as a cathode. This is an inherent source of non-reproducibility
in this system, which would be absent in a steady state system.
3.2.3.1.2 Opportunity in Scale Up
The diffusion dryer facilitates sufficient dilution of aerosol solvent so as to reduce
interaction later on in the heated zone. In this case H2O acts as an oxidizer, consuming
carbon and reducing damaging carbon coverage, as this attack will inherently arrive from the
outside, consuming the outer most aspects of the carbon host; which are arguably the most
important region of the carbon matrix.
Alternatively, sufficient solvent dilution can be accomplished by means of inert gas mixing,
post atomization. A secondary gas flow may be introduced, dramatically lowering aerosol
70
concentration, possibly sufficiently to dry the stream for the purposes of reaction at elevated
temperatures (600-900°C).
This method was considered impractical for laboratory scale, given the high flow of gas
needed to achieve it. Industrial applications may benefit from a recycling system, able to
capture the process gas and recirculate it into the ASP system.
A added benefit may be available in collecting waste heat from the ASP and introducing it
via the secondary gas flow. Since this gas stream is introduced after atomization it will not
effect the atomization action itself, but may offer a slower solvent drying rate than that
available by the pyrolysis chamber alone. This may lead to better volume precipitation (101),
densification of particles by staged pyrolysis segments (such as waste attempted with the
preheater) and an overall increase in process efficiency due to the collection of waste heat.
3.3 ARCHITECTURE
3.3.1 Reference success of Sn@C architecture
This work is based on the previous success of ASP as a method or the encapsulation of tin
in a carbon matrix, Sn@C. In (103) Guo et al showed that ASP can be deployed to template
a spherical carbon host matrix around an active material. In this case, SnCl2 was used as a Sn
source, and sucrose as the carbon matrix precursor. This system benefitted from one shot
production, where the formation of Sn metal and the carbon host occurred simultaneously
in the 700°C environment.
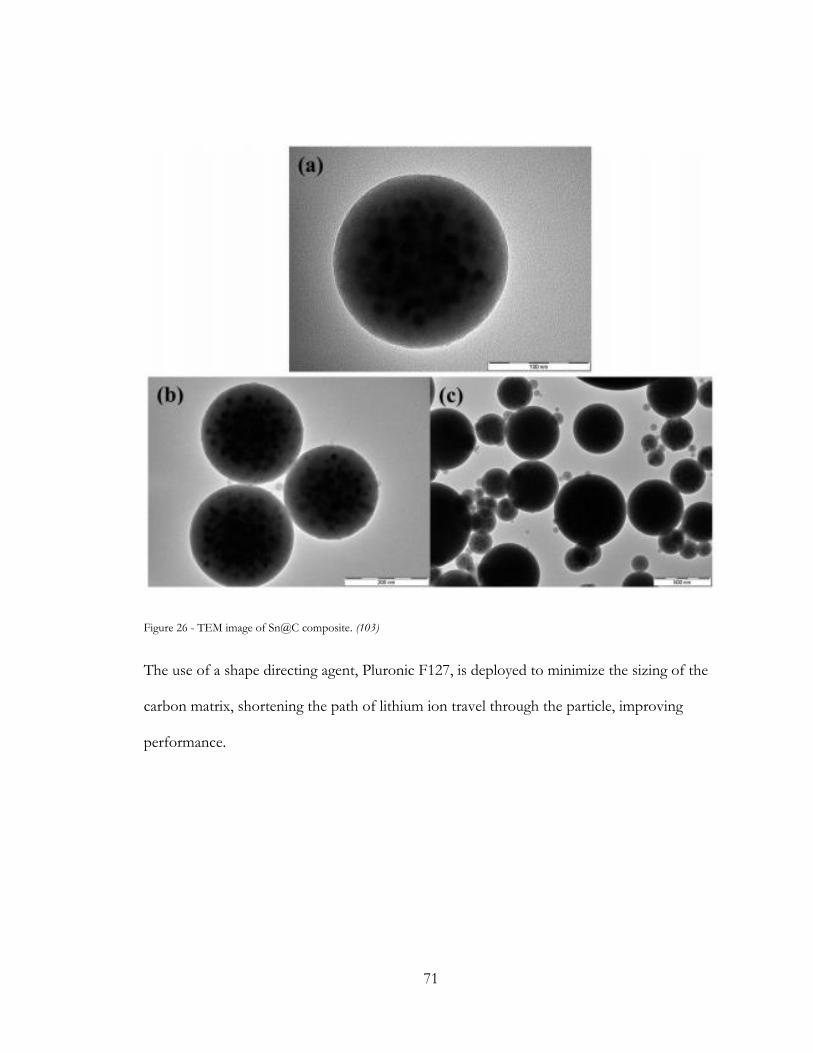
71
Figure 26 - TEM image of Sn@C composite. (103)
The use of a shape directing agent, Pluronic F127, is deployed to minimize the sizing of the
carbon matrix, shortening the path of lithium ion travel through the particle, improving
performance.
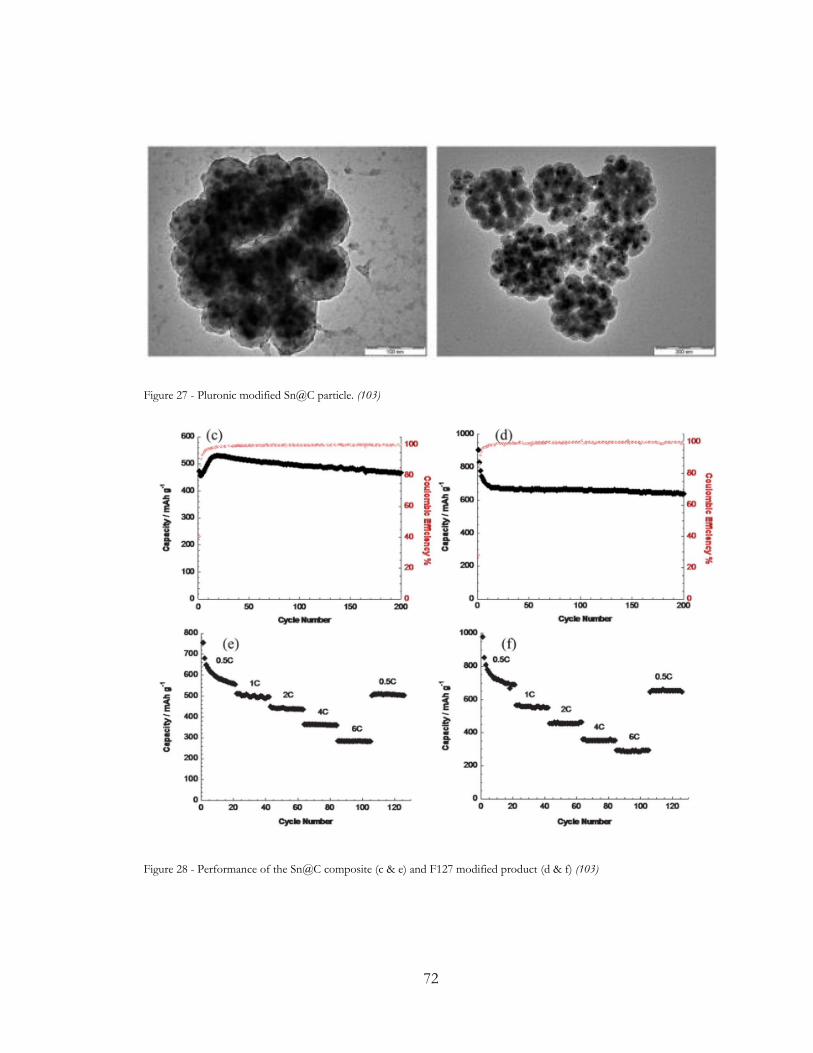
72
Figure 27 - Pluronic modified Sn@C particle. (103)
Figure 28 - Performance of the Sn@C composite (c & e) and F127 modified product (d & f) (103)
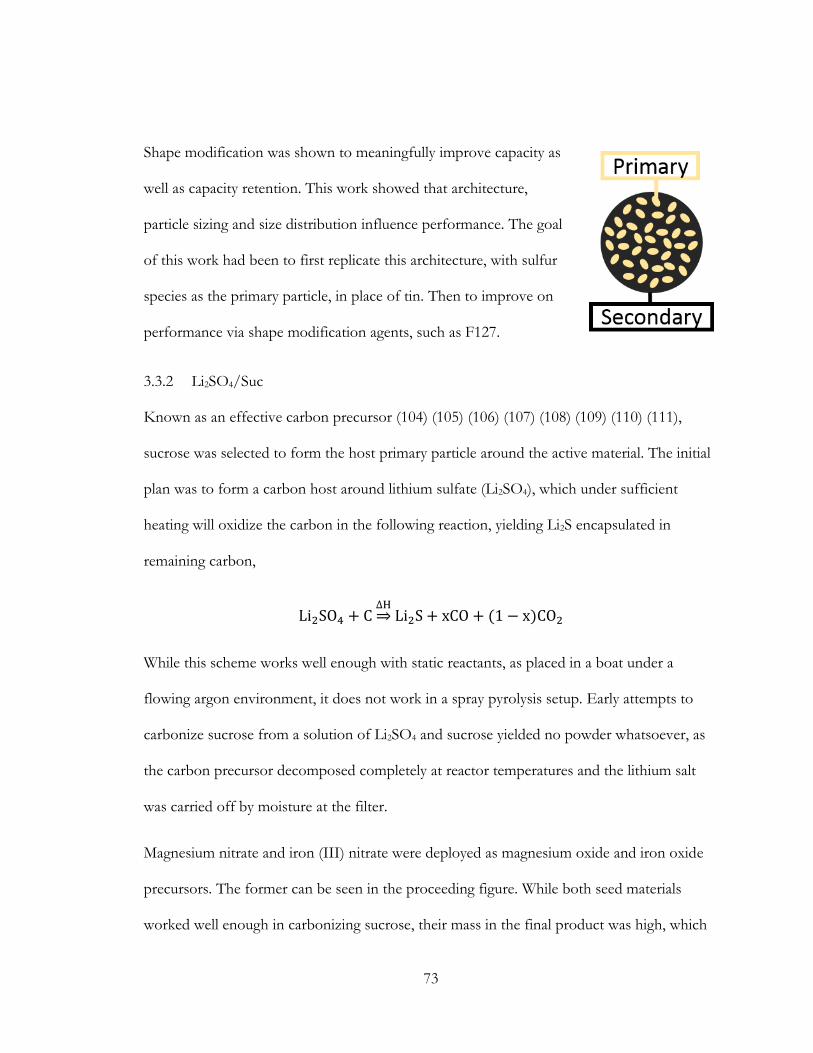
73
Shape modification was shown to meaningfully improve capacity as
well as capacity retention. This work showed that architecture,
particle sizing and size distribution influence performance. The goal
of this work had been to first replicate this architecture, with sulfur
species as the primary particle, in place of tin. Then to improve on
performance via shape modification agents, such as F127.
3.3.2 Li2SO4/Suc
Known as an effective carbon precursor (104) (105) (106) (107) (108) (109) (110) (111),
sucrose was selected to form the host primary particle around the active material. The initial
plan was to form a carbon host around lithium sulfate (Li2SO4), which under sufficient
heating will oxidize the carbon in the following reaction, yielding Li2S encapsulated in
remaining carbon,
Li2SO4 + C∆H⇒ Li2S + xCO + (1 − x)CO2
While this scheme works well enough with static reactants, as placed in a boat under a
flowing argon environment, it does not work in a spray pyrolysis setup. Early attempts to
carbonize sucrose from a solution of Li2SO4 and sucrose yielded no powder whatsoever, as
the carbon precursor decomposed completely at reactor temperatures and the lithium salt
was carried off by moisture at the filter.
Magnesium nitrate and iron (III) nitrate were deployed as magnesium oxide and iron oxide
precursors. The former can be seen in the proceeding figure. While both seed materials
worked well enough in carbonizing sucrose, their mass in the final product was high, which

74
represents an unacceptable level of electrochemical dead weight. Washing these seeds out
would mean washing out the Li2SO4 as well, defeating the purpose of the project.
Reintroducing sulfur or Li2SO4 later would not represent a novel approach, nor would the
carbon host be reliable as an affective trap for sulfur species later on. If sulfur can be
introduced from the outside, the thinking went, it could dissolve out during cycling.
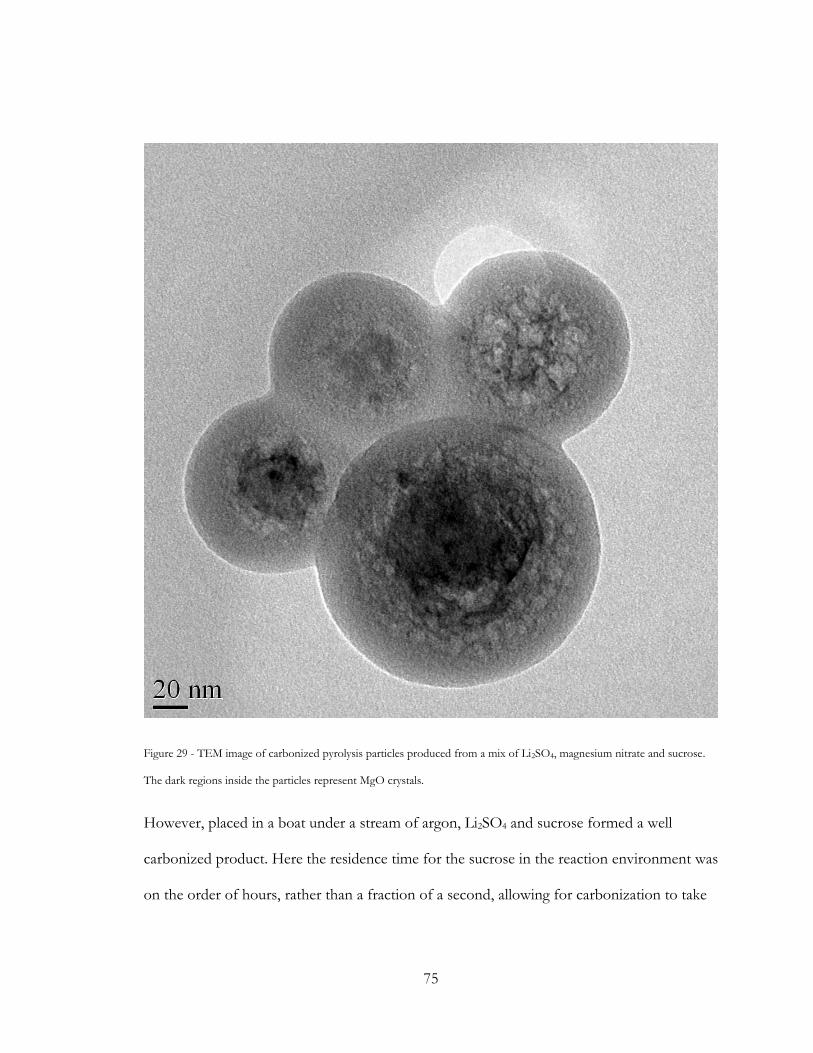
75
Figure 29 - TEM image of carbonized pyrolysis particles produced from a mix of Li2SO4, magnesium nitrate and sucrose.
The dark regions inside the particles represent MgO crystals.
However, placed in a boat under a stream of argon, Li2SO4 and sucrose formed a well
carbonized product. Here the residence time for the sucrose in the reaction environment was
on the order of hours, rather than a fraction of a second, allowing for carbonization to take
76
place. The challenge here was to ensure that the Li2SO4 remained inside the host as it
carbonized.
Further development of this approach was attempted in conjunction with freeze drying as a
means of templating the Li2SO4 into small domains, reducing crystal sizing and providing for
small Li2S particle sizing in the final product. Ultimately, this method yielded inconsistent
performance and low capacities. As a result of the escape of oxidizing species, upward out of
the sample, the upper region of the boat held sample would often yield a lighter color than
the rest of the sample. This suggests exposure of the underlying primary material, be it
converted Li2S or the unconverted Li2SO4 precursor, both of which are white in color.
3.3.3 Alternate lithium salts
3.3.3.1 LiOH
An alternative approach, of introducing lithium independent of sulfur, then converting it to
Li2S later on was attempted. Lithium hydroxide, known to convert to Li2S by the following
reaction, was attempted.
2LiOH + H2S⇔ Li2S + H2O
Carbonization with LiOH was unimpressive. While some carbonized material formed,
evident by a grey tint in the powder, the product was mostly very large crystals of LiOH, as
can be seen in the proceeding TEM images.
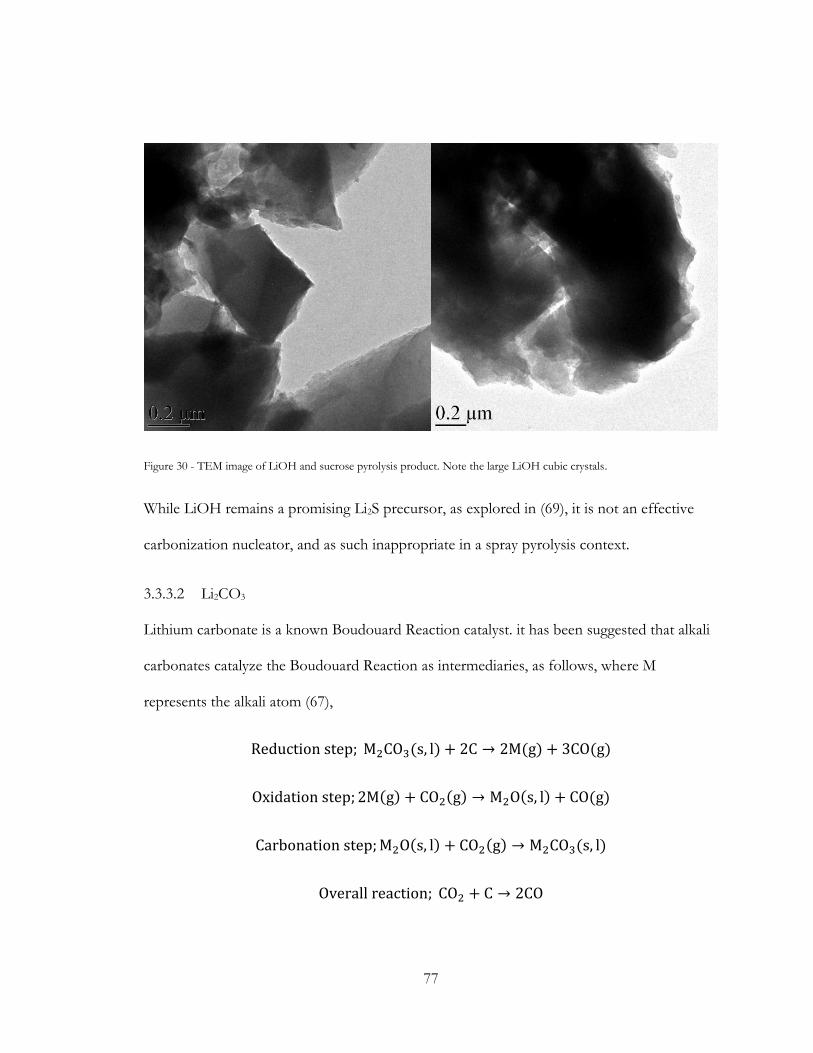
77
Figure 30 - TEM image of LiOH and sucrose pyrolysis product. Note the large LiOH cubic crystals.
While LiOH remains a promising Li2S precursor, as explored in (69), it is not an effective
carbonization nucleator, and as such inappropriate in a spray pyrolysis context.
3.3.3.2 Li2CO3
Lithium carbonate is a known Boudouard Reaction catalyst. it has been suggested that alkali
carbonates catalyze the Boudouard Reaction as intermediaries, as follows, where M
represents the alkali atom (67),
Reduction step; M2CO3(s, l) + 2C → 2M(g) + 3CO(g)
Oxidation step; 2M(g) + CO2(g) → M2O(s, l) + CO(g)
Carbonation step;M2O(s, l) + CO2(g) → M2CO3(s, l)
Overall reaction; CO2 + C → 2CO
78
Where the Reduction Step is considered to be the rate limiting step. This catalytic action
appears to drive the rapid decomposition of carbohydrates to carbonaceous materials, a
necessary step in the formation of carbon hosts in the short residence time of the pyrolysis
reactor.
The presence of Li2CO3 appears to assist in the formation of pyrolytic carbon by acting as a
local CO2 sink, and limiting oxidizing nature of the pyrolysis environment. Thermal
decomposition early on in the pyrolysis reactor releases CO2 into the argon diluted reactor
environment,
Li2CO3∆H↔ Li2O + CO2
The remaining lithium may now act as a local CO2 sink, driving the reaction toward reactants
and preserving solid carbon around the lithium specie seed.
The knowledge base of alkali metal oxides as Boudouard catalysts has not specifically been
studied a context where the alkali metal catalyst travels with the rest of the reaction
participants, suggesting different results may arise from the presence of the alkali metal
oxide. The actual mechanism by which carbon is formed in this chamber is outside the scope
of this investigation, but whatever the mechanism in play, this action has driven the selection
of the reaction precursors.
The use of other lithium salts other than Li2CO3, which thermally decompose into Li2CO3
show the same action, though resulting in characteristically different architectures and
carbon loading, as will be discussed next.
79
3.3.3.3 Acetate
3.3.3.3.1 Thermal decomp route
Lithium acetate (CH3CO2Li) is known to undergo thermal decomposition below 500°C in
the following scheme (112),
2CH3CO2Li → Li2CO3 + C3H6O
The acetate system displayed the lowest sucrose concentration needed to achieve a
Li2CO3@C with a 20-25% carbon weight, of 0.02M. This suggest that C3H6O contributes to
the carbon content of the particle.
3.3.3.4 Nitrate
3.3.3.4.1 Thermal decomp route
Lithium nitrate undergoes thermal decomposition in the following scheme,
2LiNO3 → Li2O + NOx +5 − 2x
2O2
O2 + C → CO2
Li2O + CO2 → Li2CO3
This decomposition route suggests an inherent consumption of carbon adjacent to the
decomposing LiNO3. This notion is corroborated by the relatively high concentration of
sucrose necessary to generate a LiNO3 based Li2CO3@C particle with 20-25% carbon
weight, of 0.25M.
80
3.3.4 Focus on comparing the architecture
3.3.4.1 TGA driven standardization, yields comparable though un-optimized composites
3.3.4.2 Carbonate vs Acetate vs Nitrate
3.4 CELL COMPONENT SELECTION AND RATIONALE
3.4.1 Electrolyte Selection
Identifying the appropriate electrolyte solution is a critical step in setting up this study.
Composed of solvent, lithium salt and additives, the electrolyte solution is a complex system
which affects the performance and longevity of a cell. Traditional li-ion electrolyte
components are inappropriate in a Li-S cell, due to reactivity with polysulfide (PS)
intermediates.
3.4.1.1 Salt Selection
Li-ion appropriate salts include LiPF6 (Lithium hexafluorophosphate), LiBF4 (Lithium
tetrafluoroborate), LiBOB (Lithium Bis(oxalato)borate) and LiBF2C2O4 (Lithium
oxalyldifluoroborate). These salts are reactive with Li2S in the vein of following schemes
(113),
LiPF6 + Li2S → LiPSnF4 + 2LiF
LiBF4 + Li2S → LiBSnF2 + 2LiF
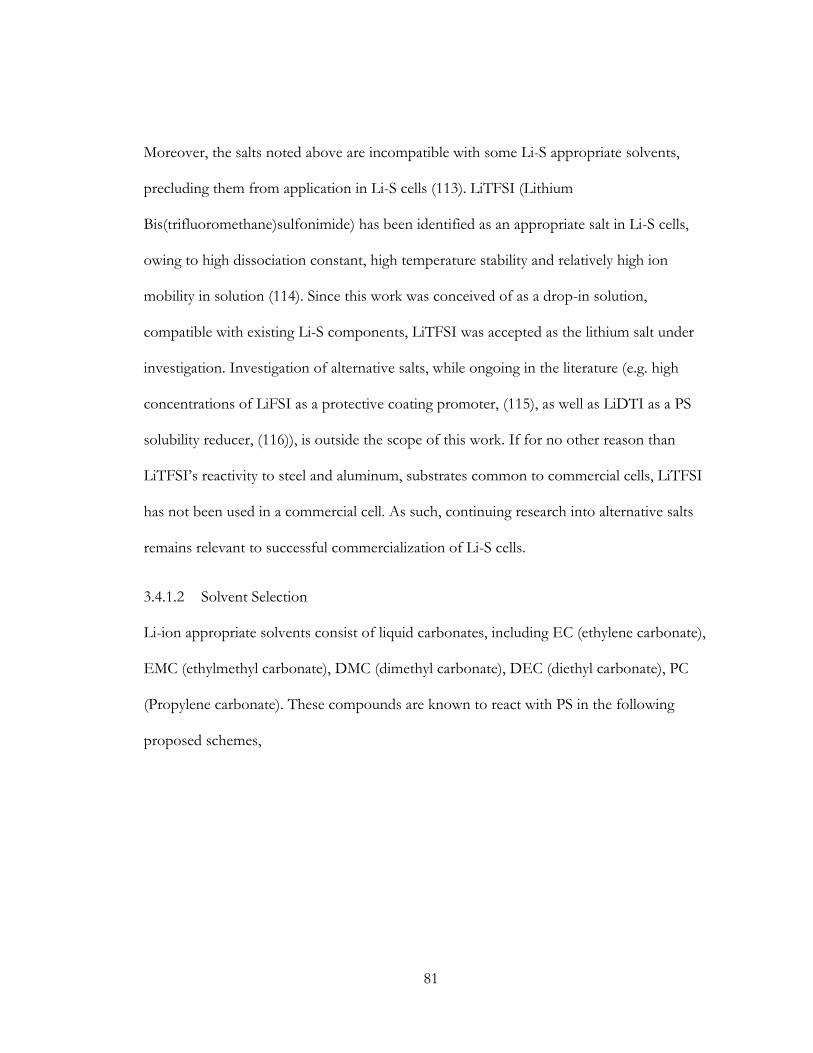
81
Moreover, the salts noted above are incompatible with some Li-S appropriate solvents,
precluding them from application in Li-S cells (113). LiTFSI (Lithium
Bis(trifluoromethane)sulfonimide) has been identified as an appropriate salt in Li-S cells,
owing to high dissociation constant, high temperature stability and relatively high ion
mobility in solution (114). Since this work was conceived of as a drop-in solution,
compatible with existing Li-S components, LiTFSI was accepted as the lithium salt under
investigation. Investigation of alternative salts, while ongoing in the literature (e.g. high
concentrations of LiFSI as a protective coating promoter, (115), as well as LiDTI as a PS
solubility reducer, (116)), is outside the scope of this work. If for no other reason than
LiTFSI’s reactivity to steel and aluminum, substrates common to commercial cells, LiTFSI
has not been used in a commercial cell. As such, continuing research into alternative salts
remains relevant to successful commercialization of Li-S cells.
3.4.1.2 Solvent Selection
Li-ion appropriate solvents consist of liquid carbonates, including EC (ethylene carbonate),
EMC (ethylmethyl carbonate), DMC (dimethyl carbonate), DEC (diethyl carbonate), PC
(Propylene carbonate). These compounds are known to react with PS in the following
proposed schemes,
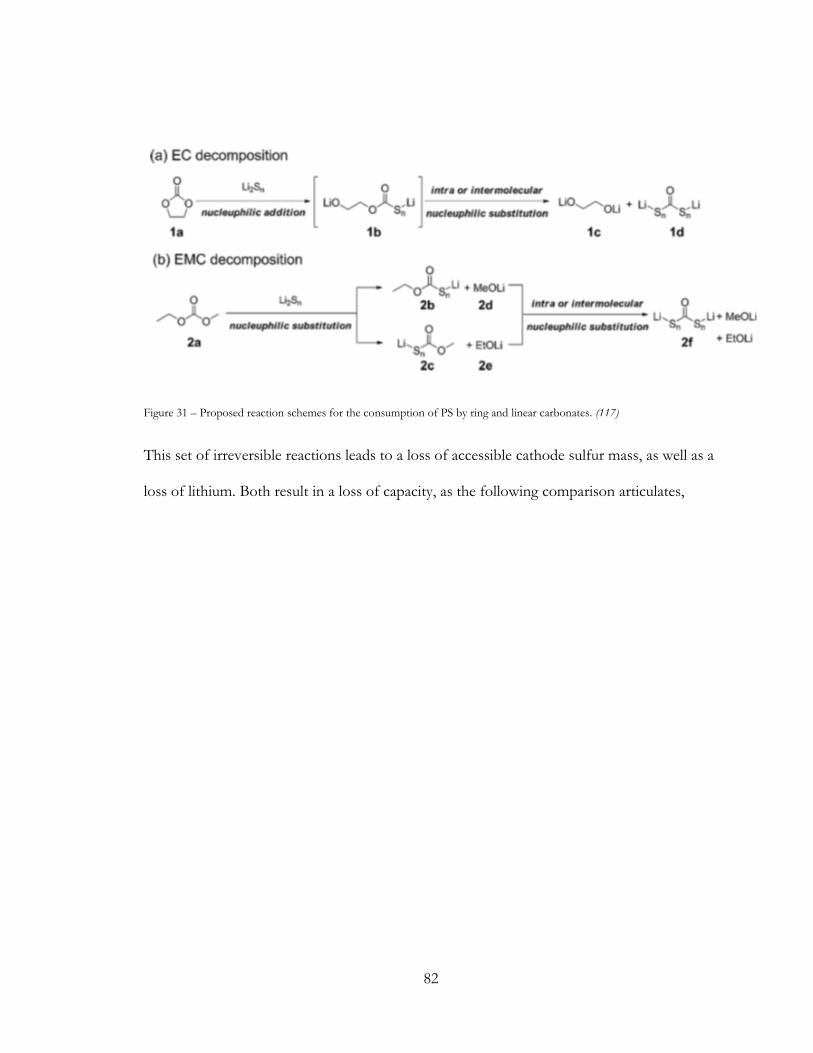
82
Figure 31 – Proposed reaction schemes for the consumption of PS by ring and linear carbonates. (117)
This set of irreversible reactions leads to a loss of accessible cathode sulfur mass, as well as a
loss of lithium. Both result in a loss of capacity, as the following comparison articulates,
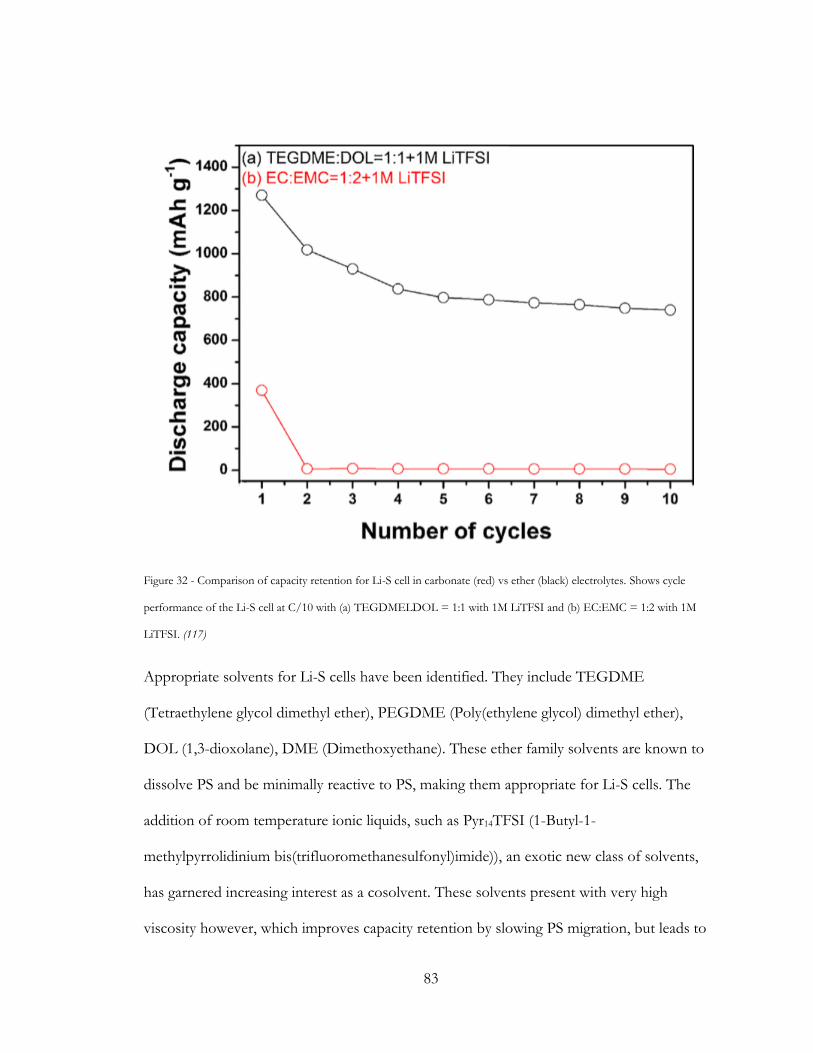
83
Figure 32 - Comparison of capacity retention for Li-S cell in carbonate (red) vs ether (black) electrolytes. Shows cycle
performance of the Li-S cell at C/10 with (a) TEGDMELDOL = 1:1 with 1M LiTFSI and (b) EC:EMC = 1:2 with 1M
LiTFSI. (117)
Appropriate solvents for Li-S cells have been identified. They include TEGDME
(Tetraethylene glycol dimethyl ether), PEGDME (Poly(ethylene glycol) dimethyl ether),
DOL (1,3-dioxolane), DME (Dimethoxyethane). These ether family solvents are known to
dissolve PS and be minimally reactive to PS, making them appropriate for Li-S cells. The
addition of room temperature ionic liquids, such as Pyr14TFSI (1-Butyl-1-
methylpyrrolidinium bis(trifluoromethanesulfonyl)imide)), an exotic new class of solvents,
has garnered increasing interest as a cosolvent. These solvents present with very high
viscosity however, which improves capacity retention by slowing PS migration, but leads to
84
sluggish kinetics, affecting rate capacity. Pyr14TFSI has also been suggested to contribute to
the formation of a beneficial SEI on lithium metal, improving cycle stability by preventing
the interaction of PS with the anode surface (118) (119).
Figure 33 - SEM images of lithium metal anode surface and cross sections of (a1 and a2) fresh lithium metal and lithium
metal cycled in (b1 and b2) the baseline electrolyte, (c1 and c2) 50% Pyr14TFSI ontaining electrolyte, and (d1 and d2) 75%
Pyr14TFSI containing electrolyte for 100 cycles at C/5. (118)
A study was conducted with select composite formulations, to identify the most appropriate
electrolyte mix for various charging rates. The electrolyte components must first excel in a
slower charging/discharging regime (C/20), where resilience to PS dissolution will be most
observable. The best performing mix will then be subjected to faster regimes (C/10 and
C/5) where typical daily use and performance can be simulated.
A high carbon content composite (3N25S) was selected to consider the effect of various
electrolyte solvents on performance. The high carbon content would arguably contribute to
higher deposition surfaces for insoluble products, greater diffusion distances for PS and as
85
such a greater barrier for the action of the shuttle. Three electrolyte systems were
considered, comprised of combinations of the following four solvents;
Table 3 - Solvents explored as electrolyte components
Colloquial
name
Density (g/ml), ρ Dynamic
Viscosity (cP), µ
Kinematic
Viscosity (cP), µ
Ionic
conductivity
(mS/cm), σ
TEGDME 0.986 3.266 -
DOL 1.06 0.576 -
DME 0.868 0.466 -
Pyr14TFSI 1.417 - 987 6.07, 2
8 & 2.29
6 (5) 7 (156) 8 (161) 9 (162)
86
Table 4 - Solutions deployed as electrolytes, with calculated dynamic viscosity. All solutions included 1M LiTFSI and
1.5%wt LiNO3.
Solvent
components
Volume
ratio
Est. dynamic
viscosity (cP)
of solvents
Measured viscosity
(cP) of solution
Ionic conductivity
of solution, σ,
(mS/cm)
DOL:DME 1:1 0.52 1.5610 13.2110
TEGDME 1 3.26
DOL:DME:
Pyr14TFSI
1.2:1.8:1 1.39 ≈3.0710 ≈13.8210
DOL:DME:
Pyr14TFSI
1:1:2 4.50 7.4110 10.4010
Estimation of the kinematic viscosities of mixtures was done using the mass based version
of the Refutas Equation for the calculation of hydrocarbon fluid mix viscosities (120). The
Refutas Equation calculates the kinematic viscosity, relevant to fluids in flow. In the context
of a closed electrochemical cell, however, the electrolyte is essentially at rest, so the results
are converted to dynamic viscosity. The method is as follows,
VBNi, Viscosity Blending Number of solution component i
xi, mass fraction of solution component i
10 (118), source uses a 1:1 ratio of DOL:DME and no LiNO3, which will result in slightly smaller values than in this work. Values are offered for relative purposes, rather than asserting absolute values.
87
ν, kinematic viscosity
µ, dynamic viscosity
Values available for fluids in terms of dynamic viscosity are converted to kinematic viscosity
by this relation,
ν =μρ⁄
Viscosity Blending Numbers are calculated, yielding the kinematic viscosity of the mix,
VBNi = 14.534 ∗ ln(ln(νi + 0.8)) + 10.975
VBNmix =∑xi ∗ VBNi
n
i=0
νmix = exp (exp (VBNmix − 10.975
14.534)) − 0.8
Returning a value of the dynamic viscosity of the mix, µmix, required parsing out the density
contributions of each component, added linearly.
ρmix = x1ρ1 +⋯+ xnρn
μmix = νmix ∗ ρmix
All cells presented were tested with an electrolyte volume (ml) to calculated sulfur mass(g)
ratio of 30:1. This ratio has shown to be sufficiently low to improve cycle stability, but high
enough to be able to wet the entire surface of the electrode. Cycling data show that within
the first few cycles, cells loaded with electrolyte mix DOL:DME, the least viscous of the set,
88
showed dramatic PS shuttling. The shuttle can be observed by the long plateaus around 2.4V
during charge.
This behavior occurred even in the presence of LiNO3 as an additive, which has been shown
to reduce shuttle behavior (121) (122). Contrasted with the cells where TEGDME was used
as an electrolyte solvent, where higher viscosity allows for capacity to retain over a longer
period. Here we see limited shuttling as evidenced by a stable, though albeit <0.8 coulombic
efficiency. The use of an overall more viscous solvent mixture, with 1:1:2
DOL:DME:Pyr14TFSI offers significantly lower shuttling, as evidenced by a coulombic
efficiency approaching unity.
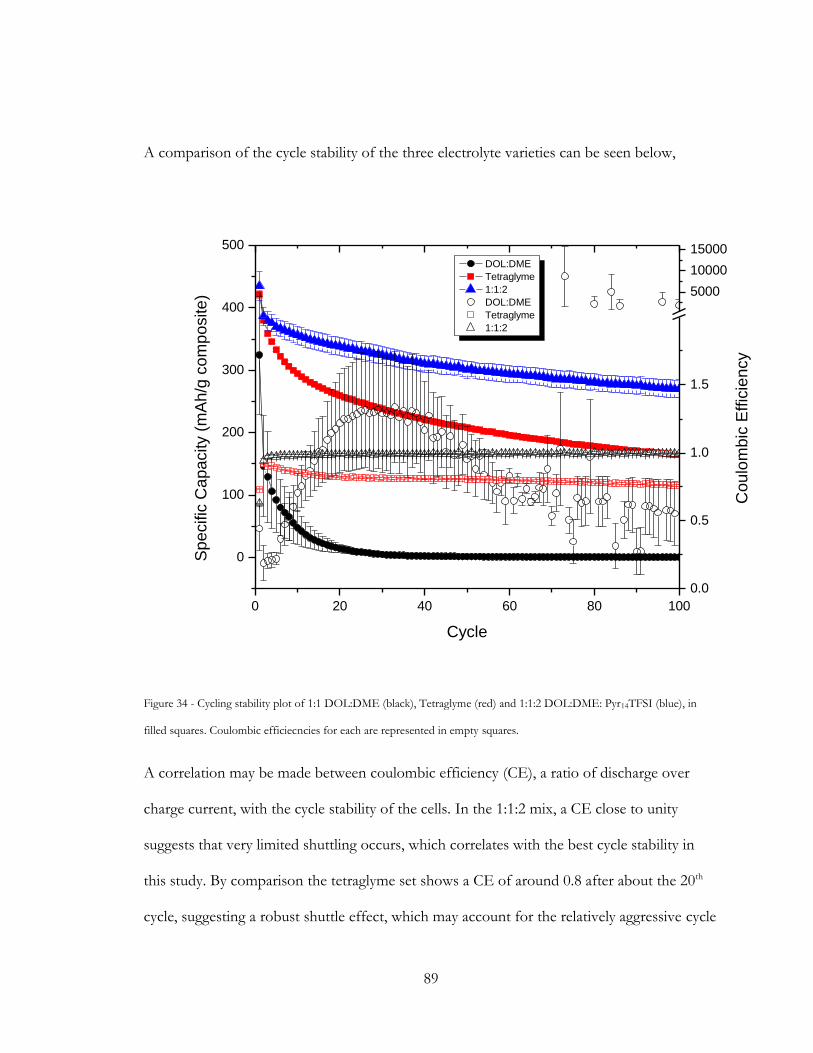
89
A comparison of the cycle stability of the three electrolyte varieties can be seen below,
0 20 40 60 80 100
0
100
200
300
400
500
DOL:DME
Tetraglyme
1:1:2
DOL:DME
Tetraglyme
1:1:2
Cycle
Sp
ecific
Ca
pa
city (
mA
h/g
co
mp
osite
)
0.0
0.5
1.0
1.5
5000
10000
15000
Co
ulo
mb
ic E
ffic
ien
cy
Figure 34 - Cycling stability plot of 1:1 DOL:DME (black), Tetraglyme (red) and 1:1:2 DOL:DME: Pyr14TFSI (blue), in
filled squares. Coulombic efficiecncies for each are represented in empty squares.
A correlation may be made between coulombic efficiency (CE), a ratio of discharge over
charge current, with the cycle stability of the cells. In the 1:1:2 mix, a CE close to unity
suggests that very limited shuttling occurs, which correlates with the best cycle stability in
this study. By comparison the tetraglyme set shows a CE of around 0.8 after about the 20th
cycle, suggesting a robust shuttle effect, which may account for the relatively aggressive cycle
90
instability. The 1:1 DOL:DME set however, drops to effectively zero capacity by the 40th
cycle. For this set, the CE is relatively meaningless, and indeed becomes rather erratic around
the 60th cycle. For the 1:1 DOL:DME set it is suspected that due to very low viscosity, as
well as high PS solubility, the sulfur (as elemental sulfur as well as PS) content of the cathode
dissolves readily into the electrolyte, failing to redeposit at the cathode.
As discussed in (118), the addition of Pyr14TFSI has a meaningful effect on the formation
and stability of the SEI and the prevention of contact between polysulfides and the lithium
anode, leading to a retarded parasitic reaction and better capacity retention. Addition of this
high viscosity component however leads to reduced rate capacity, so full replacement of the
electrolyte with Pyr14TFSI is impractical (118).
3.4.1.3 Solvent Mix Optimization
Given the benefits derived from the presence of Pyr14TFSI along with DOL:DME, further
combinations of these cosolvents was explored. This study considered two variables, (a) the
DOL:DME ratio and (b) Pyr14TFSI content. Both of which were thought to affect
performance both by affecting viscosity and by affecting the quality of the SEI.
Work by (123) showed that altering the DOL:DME ratio in a DOL:DME cosolvent system
yields meaningful changes in performance. It was suggested in (Wang et al, 2010) that a
minimum DOL content was needed to benefit SEI quality, that a low DOL:DME ratio (1:2
in the paper) was the highest performer, due to increased PS solubility from higher DME
content. It was suggested that this higher PS solubility lead to higher sulfur utilization,
leading to higher capacity. In this study, the DOL:DME ratios attempted were: 1:1, 1:1.5 and
1:3.
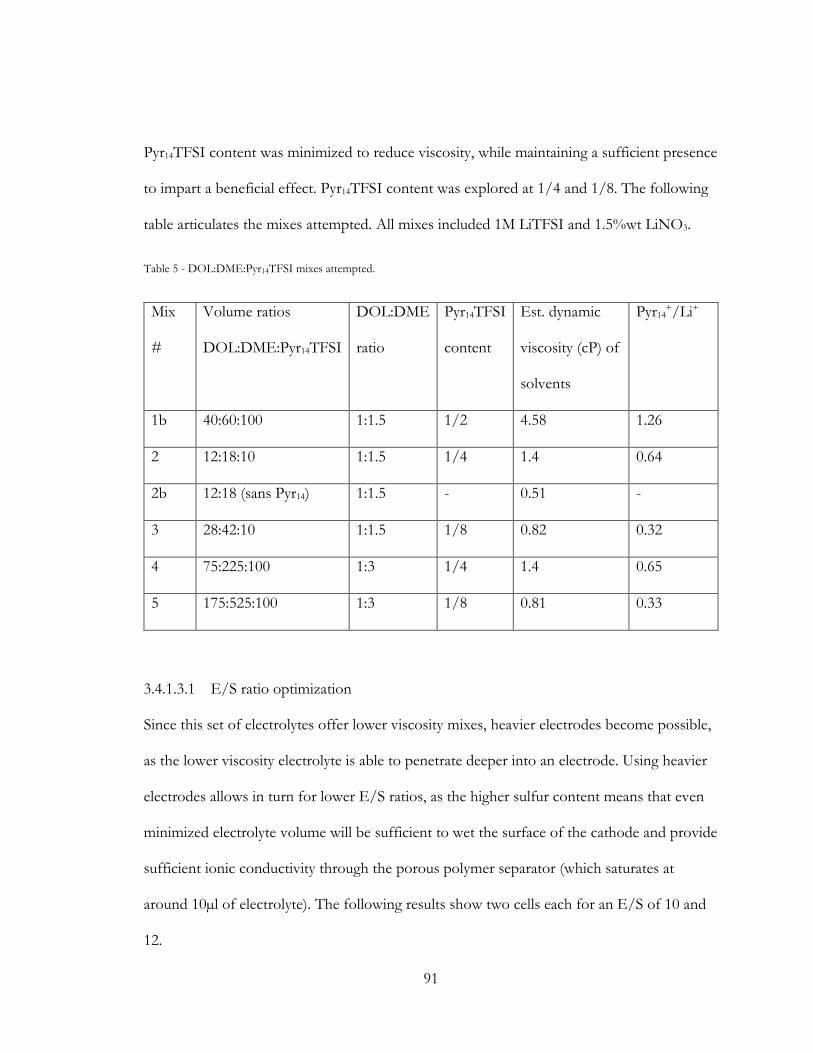
91
Pyr14TFSI content was minimized to reduce viscosity, while maintaining a sufficient presence
to impart a beneficial effect. Pyr14TFSI content was explored at 1/4 and 1/8. The following
table articulates the mixes attempted. All mixes included 1M LiTFSI and 1.5%wt LiNO3.
Table 5 - DOL:DME:Pyr14TFSI mixes attempted.
Mix
#
Volume ratios
DOL:DME:Pyr14TFSI
DOL:DME
ratio
Pyr14TFSI
content
Est. dynamic
viscosity (cP) of
solvents
Pyr14+/Li+
1b 40:60:100 1:1.5 1/2 4.58 1.26
2 12:18:10 1:1.5 1/4 1.4 0.64
2b 12:18 (sans Pyr14) 1:1.5 - 0.51 -
3 28:42:10 1:1.5 1/8 0.82 0.32
4 75:225:100 1:3 1/4 1.4 0.65
5 175:525:100 1:3 1/8 0.81 0.33
3.4.1.3.1 E/S ratio optimization
Since this set of electrolytes offer lower viscosity mixes, heavier electrodes become possible,
as the lower viscosity electrolyte is able to penetrate deeper into an electrode. Using heavier
electrodes allows in turn for lower E/S ratios, as the higher sulfur content means that even
minimized electrolyte volume will be sufficient to wet the surface of the cathode and provide
sufficient ionic conductivity through the porous polymer separator (which saturates at
around 10µl of electrolyte). The following results show two cells each for an E/S of 10 and
12.
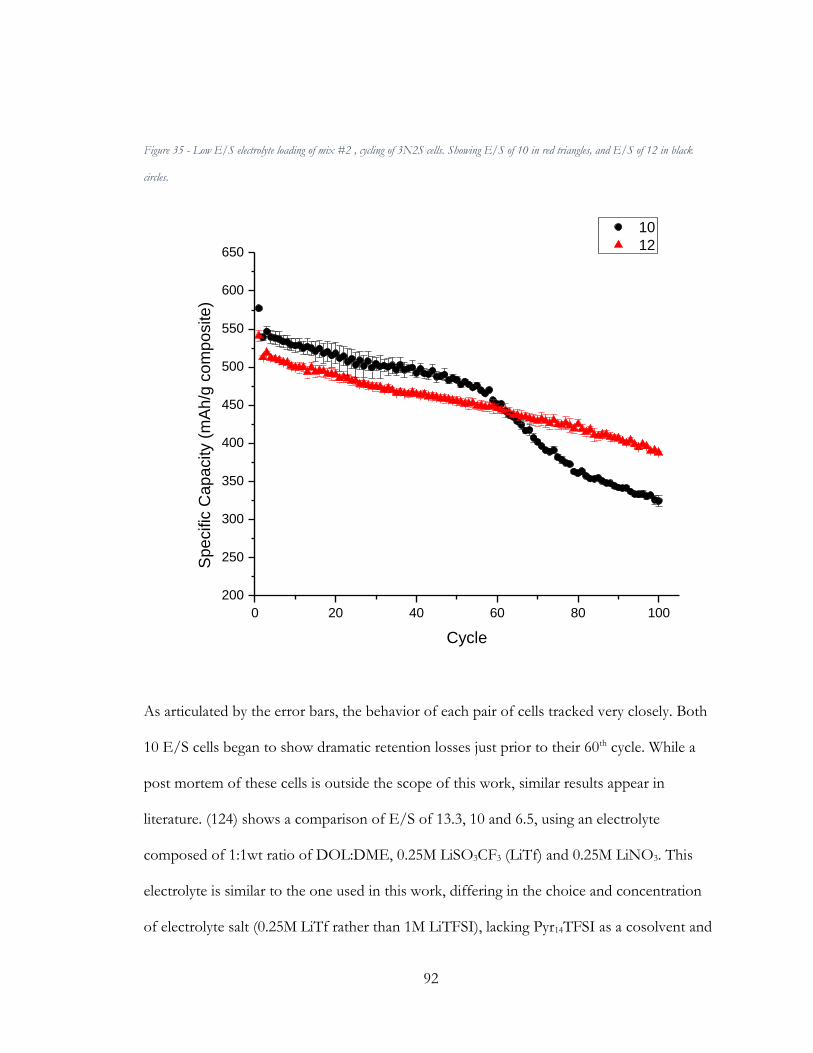
92
Figure 35 - Low E/S electrolyte loading of mix #2 , cycling of 3N2S cells. Showing E/S of 10 in red triangles, and E/S of 12 in black
circles.
0 20 40 60 80 100
200
250
300
350
400
450
500
550
600
650
10
12
Sp
ecific
Ca
pa
city (
mA
h/g
co
mp
osite
)
Cycle
As articulated by the error bars, the behavior of each pair of cells tracked very closely. Both
10 E/S cells began to show dramatic retention losses just prior to their 60th cycle. While a
post mortem of these cells is outside the scope of this work, similar results appear in
literature. (124) shows a comparison of E/S of 13.3, 10 and 6.5, using an electrolyte
composed of 1:1wt ratio of DOL:DME, 0.25M LiSO3CF3 (LiTf) and 0.25M LiNO3. This
electrolyte is similar to the one used in this work, differing in the choice and concentration
of electrolyte salt (0.25M LiTf rather than 1M LiTFSI), lacking Pyr14TFSI as a cosolvent and
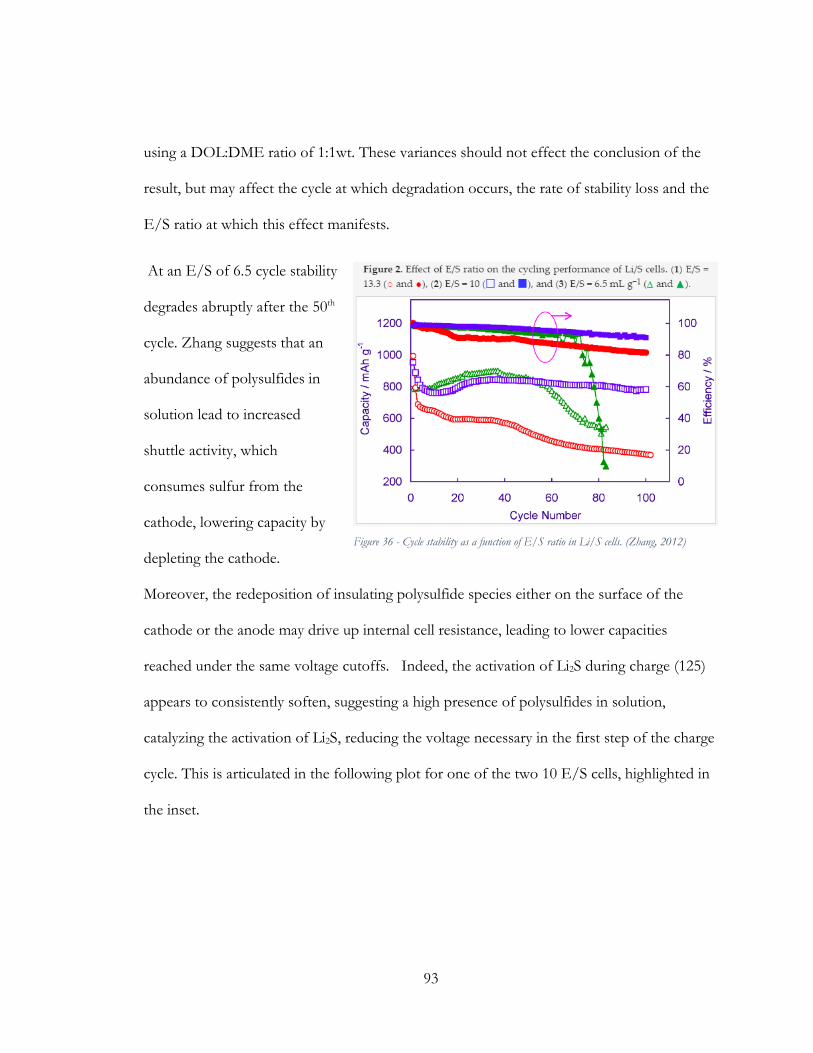
93
using a DOL:DME ratio of 1:1wt. These variances should not effect the conclusion of the
result, but may affect the cycle at which degradation occurs, the rate of stability loss and the
E/S ratio at which this effect manifests.
At an E/S of 6.5 cycle stability
degrades abruptly after the 50th
cycle. Zhang suggests that an
abundance of polysulfides in
solution lead to increased
shuttle activity, which
consumes sulfur from the
cathode, lowering capacity by
depleting the cathode.
Moreover, the redeposition of insulating polysulfide species either on the surface of the
cathode or the anode may drive up internal cell resistance, leading to lower capacities
reached under the same voltage cutoffs. Indeed, the activation of Li2S during charge (125)
appears to consistently soften, suggesting a high presence of polysulfides in solution,
catalyzing the activation of Li2S, reducing the voltage necessary in the first step of the charge
cycle. This is articulated in the following plot for one of the two 10 E/S cells, highlighted in
the inset.
Figure 36 - Cycle stability as a function of E/S ratio in Li/S cells. (Zhang, 2012)
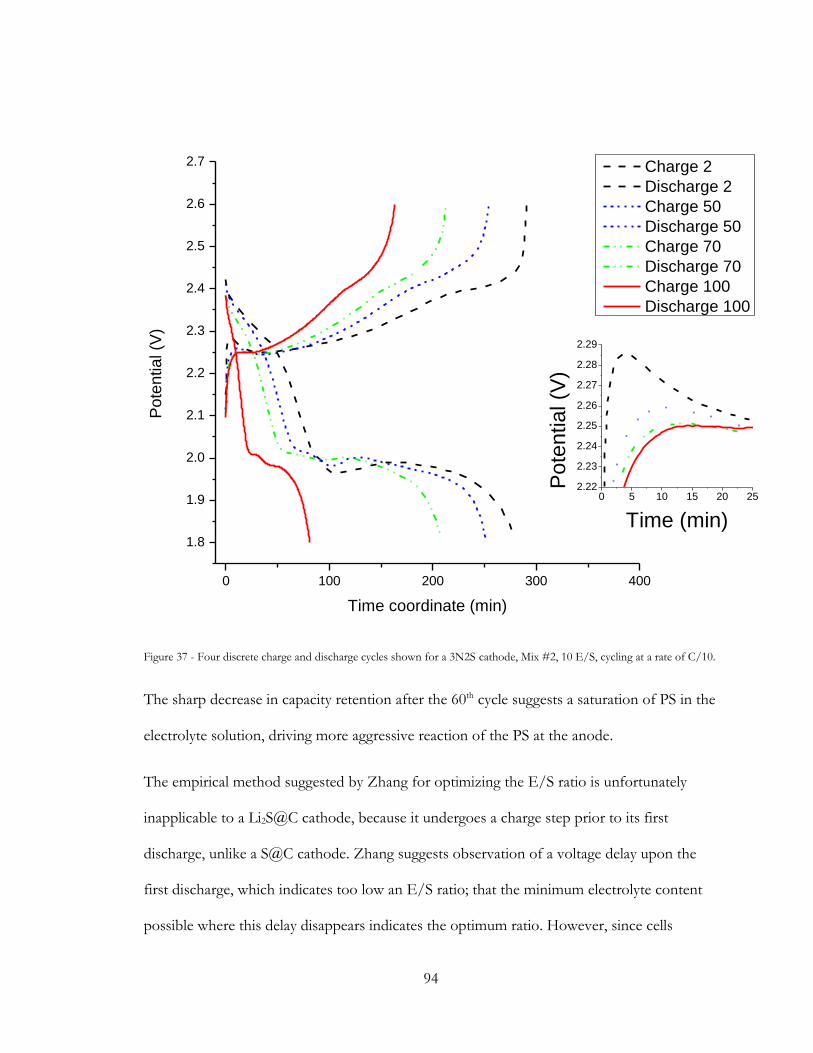
94
0 100 200 300 400
1.8
1.9
2.0
2.1
2.2
2.3
2.4
2.5
2.6
2.7P
ote
ntia
l (V
)
Time coordinate (min)
Charge 2
Discharge 2
Charge 50
Discharge 50
Charge 70
Discharge 70
Charge 100
Discharge 100
0 5 10 15 20 252.22
2.23
2.24
2.25
2.26
2.27
2.28
2.29
Pote
ntial (V
)
Time (min)
Figure 37 - Four discrete charge and discharge cycles shown for a 3N2S cathode, Mix #2, 10 E/S, cycling at a rate of C/10.
The sharp decrease in capacity retention after the 60th cycle suggests a saturation of PS in the
electrolyte solution, driving more aggressive reaction of the PS at the anode.
The empirical method suggested by Zhang for optimizing the E/S ratio is unfortunately
inapplicable to a Li2S@C cathode, because it undergoes a charge step prior to its first
discharge, unlike a S@C cathode. Zhang suggests observation of a voltage delay upon the
first discharge, which indicates too low an E/S ratio; that the minimum electrolyte content
possible where this delay disappears indicates the optimum ratio. However, since cells

95
assembled with Li2S@C cathodes experience a charge step first, the phenomenon indicated
by Zhang, of resistive diffusion of Li2S8 which appears only upon first charge, does not
appear in Li2S@C cells, as first-cycle processes have already occurred by the time the cell is
discharged. 3N2S cells assembled with an E/S of 8, (even lower than the 10 we see the
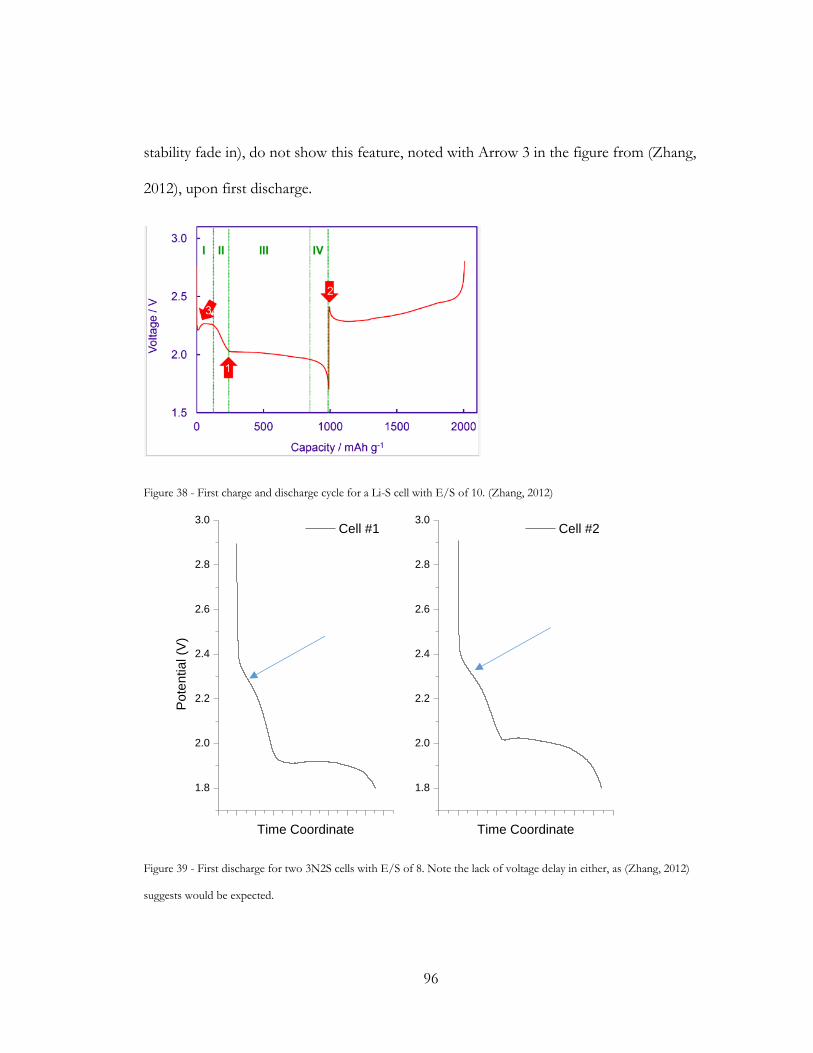
96
stability fade in), do not show this feature, noted with Arrow 3 in the figure from (Zhang,
2012), upon first discharge.
Figure 38 - First charge and discharge cycle for a Li-S cell with E/S of 10. (Zhang, 2012)
1.8
2.0
2.2
2.4
2.6
2.8
3.0 Cell #1
Po
ten
tia
l (V
)
Time Coordinate
1.8
2.0
2.2
2.4
2.6
2.8
3.0 Cell #2
Time Coordinate
Figure 39 - First discharge for two 3N2S cells with E/S of 8. Note the lack of voltage delay in either, as (Zhang, 2012)
suggests would be expected.
97
As such, barring the technique suggested by Zhang, the optimal electrolyte to sulfur ratio is a
question of staying ahead of PS saturation in the electrolyte. As such, given DME as the
highest PS solubility component of the electrolyte, an unknown PS solubility in the
electrolyte mixes, an optimal mix will not necessarily have the same E/S ratio throughout
this study. A combination of 10 and 12 E/S were attempted for various mixes,
accommodating for either high DME content, or low cathode masses available in the limited
batch size.
3.4.1.3.2 Voltage Efficiency as a performance metric
When comparing poor performing cells, the differences tend to be sufficiently high to offer
easy distinction. High performing cells however, represent the apex of performance that can
be extracted by manipulating a particular variable. The difference between high performers
may be difficult to ascertain, as the optimal selection may only incrementally better than
alternate selections. This begs quantification. As a metric, Coulombic Efficiency (CE) in a
Li-S cell can be interpreted to consider the activity of irreversible side reactions; as
inefficiency here represents more reactions occurring upon charge than in discharge. This
inefficiency is born out of the shuttle effect, where higher order PS react with the lithium
anode to form lower order PS, drawing out further sulfur content form the cathode.
Coulombic Efficiency is calculated as such,
CE =Discharge Current(Ah)
Charge Current (Ah)
98
Since current is a direct measurement of electron count, any difference in current between
charge and discharge represents a difference in the quantity of reaction. CE does not directly
describe the reactions occurring, merely that they are occurring.
Overall energy efficiency offers a broader context of the efficiency of the cell, considering
the total energy invested in the cell, upon charge, versus the energy retrieved from the cell,
upon discharge. Overall energy is calculated as such,
Overall Energy Efficiency =Discharge Energy (Wh)
Charge Energy (Wh)
A consideration of overall energy efficiency envelopes both losses to irreversible reactions as
well as losses to an overpotential. As such, by assessing cells by their overall energy
efficiency, one cannot ask about losses to the overpotential alone.
As articulated by the Tafel Equation, to get the true potential of a cell, the current applied to
it must be very low. This is an impractical proposition in Li-S cells, as such a low current
would lag behind the diffusion of PS in the electrolyte, leading to extensive shuttling. As
such, the Voltage Efficiency of these cells, is not reasonably assessed. Moreover, such a test
does not represent C rates relevant to real world applications. As such, rather than measure
the voltage efficiency of charge or discharge, as the ratio of the actual voltage to the
thermodynamic voltage for each half cycle; we measure the voltage of discharge versus that
of charge, suggesting the voltage efficiency of a full cycle (FCVE). This can conceptually be
considered equivalent, as such,
99
Full Cycle Voltage Eff. (FCVE) =Discharge Voltage Eff.
Charge Voltage Eff.=
Measured Discharge (V)Thermodynamic (V)
Measured Charge (V)Thermodynamic (V)
Considering that the thermodynamic voltage of a fully reversible reaction should be
equivalent going backwards or forwards, we can conceptually cancel the Thermodynamic
Voltage term. We are then left with the following,
Full Cycle Voltage Eff. (FCVE) =
Measured Discharge (V)Thermodynamic (V)
Measured Charge (V)Thermodynamic (V)
=Measured Discharge (V)
Measured Charge (V)
Measured voltage across a half cycle (charge or discharge) is not however a single average
value. Indeed, a half cycle in a Li-S is replete with several reaction regimes. Arguably, a ratio
of discharge over charge should be an apples to apples comparison. Due to the shuttle effect
however, this is not the case. Comparing a charge that occurred over a longer period than a
discharge, which is invariably the situation in a Li-S cell, makes for an inappropriate ratio in
terms of voltage. As such, we may want to arrive at the FCVE through a different route.
Consider that work is the product of current and voltage, as such,
Work (W) = Voltage (V) ∗ Current(A)
Multiplying both sides by time we yield,
Energy (Wh) = Voltage (V) ∗ Charge(Ah)
100
Rearranged we have,
Voltage (V) =Energy (Wh)
Charge(Ah)
A further leap allows us to consider, within significant limitations, the following ratio of
discharge versus charge ratio,
Quasi Voltaic Eff. (VD/VC) =Overall Energy Eff. (WhD/WhC)
Coulombic Eff. (AhD/AhC)
The limitations of this metric warrant the term “quasi” as a qualifier. The act of dividing by
the Coulombic Efficiency essentially collapses the capacity axis, so that charge and discharge
capacity (in units Ah) are matched. This inherently ignores the presence of irreversible
reactions as a part of the charge and discharge half cycles. The shuttle effect specifically, an
irreversible reaction that occurs at relatively high voltage, effects the value derived in the
above calculation. As such, deriving the Quasi Voltaic Efficiency (QVE) does not inherently
qualify a cell as “excellent” overall. The QVE may however serve as a compressed metric for
tracking the evolution of cell resistance as born out of cell capacity retention with cycling.
Electrochemical impedance spectroscopy (EIS) is the standard of ascertaining resistance
sources in a cell, and can be applied at different points during cell life, often in the rest
periods prior to the beginning of charge or discharge cycles. EIS however takes a snapshot
of resistance in an infinitesimally active cell, via rapid pulses, which are not representative of
currents applied during charge and discharge; as such EIS does not effectively describe an
actively cycling cell. As shown by Carbone et al, (126), EIS can be taken at several steps
during a cycle, thus comparing the changing environment throughout, rather than the same

101
point at multiple cycles. Even then however, the cell is relatively at rest. QVE describes the
relation of discharge voltage over charge voltage, albeit imprecisely, during cycling. It is a
useful tool for describing the resistance environment of cells as they cycle and how this
environment evolves.
Another advantage of QVE is that data can be extracted from low capacity cells as well high
capacity cells. Since significant variation is present among cathodes, due to incomplete
mixing of the active material, carbon additive and binder; as well as varying levels of
conversion and degradation in the H2S post treatment. With QVE, the relationship in
question is a unitless ratio of voltage to voltage, irrespective of actual capacity observed.
Resistances related to electrolyte viscosity would theoretically be the same in a 300mAh/g
cell as they are in a 500mAh/g cell; as would SEI evolution, polarization, etc.
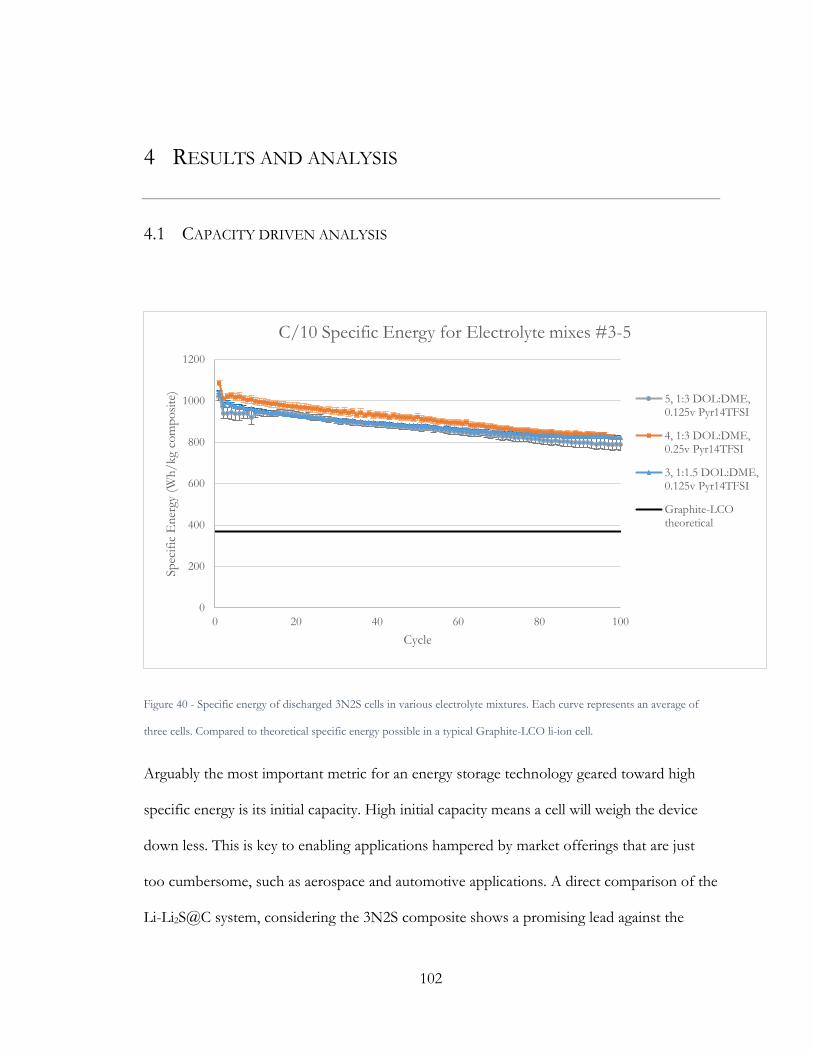
102
4 RESULTS AND ANALYSIS
4.1 CAPACITY DRIVEN ANALYSIS
Figure 40 - Specific energy of discharged 3N2S cells in various electrolyte mixtures. Each curve represents an average of
three cells. Compared to theoretical specific energy possible in a typical Graphite-LCO li-ion cell.
Arguably the most important metric for an energy storage technology geared toward high
specific energy is its initial capacity. High initial capacity means a cell will weigh the device
down less. This is key to enabling applications hampered by market offerings that are just
too cumbersome, such as aerospace and automotive applications. A direct comparison of the
Li-Li2S@C system, considering the 3N2S composite shows a promising lead against the
0
200
400
600
800
1000
1200
0 20 40 60 80 100
Sp
ecif
ic E
ner
gy (
Wh
/kg
com
po
site
)
Cycle
C/10 Specific Energy for Electrolyte mixes #3-5
5, 1:3 DOL:DME,0.125v Pyr14TFSI
4, 1:3 DOL:DME,0.25v Pyr14TFSI
3, 1:1.5 DOL:DME,0.125v Pyr14TFSI
Graphite-LCOtheoretical
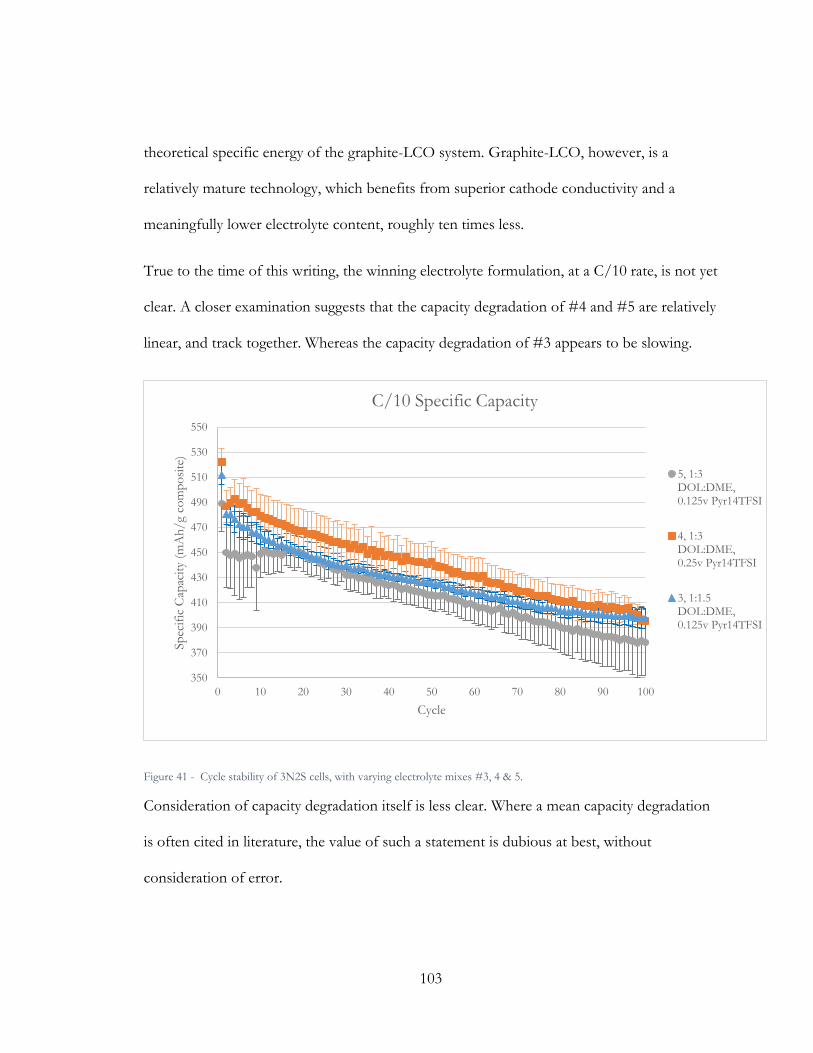
103
theoretical specific energy of the graphite-LCO system. Graphite-LCO, however, is a
relatively mature technology, which benefits from superior cathode conductivity and a
meaningfully lower electrolyte content, roughly ten times less.
True to the time of this writing, the winning electrolyte formulation, at a C/10 rate, is not yet
clear. A closer examination suggests that the capacity degradation of #4 and #5 are relatively
linear, and track together. Whereas the capacity degradation of #3 appears to be slowing.
Figure 41 - Cycle stability of 3N2S cells, with varying electrolyte mixes #3, 4 & 5.
Consideration of capacity degradation itself is less clear. Where a mean capacity degradation
is often cited in literature, the value of such a statement is dubious at best, without
consideration of error.
350
370
390
410
430
450
470
490
510
530
550
0 10 20 30 40 50 60 70 80 90 100
Sp
ecif
ic C
apac
ity
(mA
h/
g co
mp
osi
te)
Cycle
C/10 Specific Capacity
5, 1:3DOL:DME,0.125v Pyr14TFSI
4, 1:3DOL:DME,0.25v Pyr14TFSI
3, 1:1.5DOL:DME,0.125v Pyr14TFSI
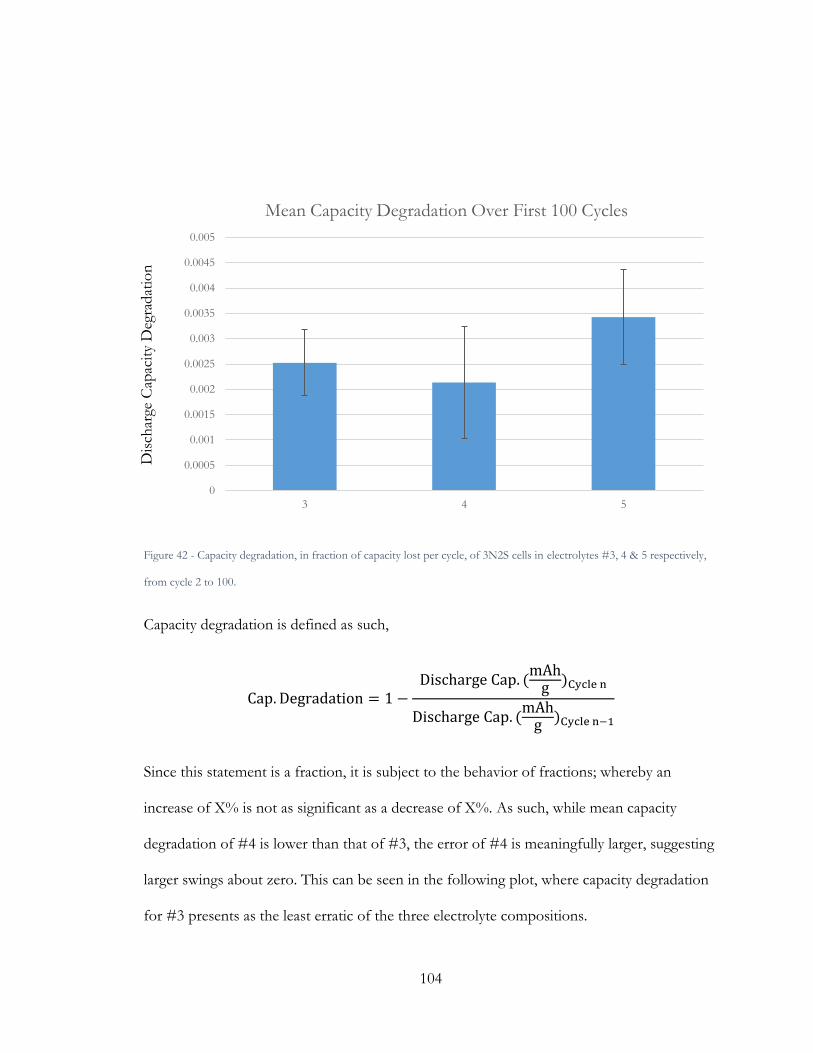
104
Figure 42 - Capacity degradation, in fraction of capacity lost per cycle, of 3N2S cells in electrolytes #3, 4 & 5 respectively,
from cycle 2 to 100.
Capacity degradation is defined as such,
Cap. Degradation = 1 −Discharge Cap. (
mAhg )Cycle n
Discharge Cap. (mAhg )Cycle n−1
Since this statement is a fraction, it is subject to the behavior of fractions; whereby an
increase of X% is not as significant as a decrease of X%. As such, while mean capacity
degradation of #4 is lower than that of #3, the error of #4 is meaningfully larger, suggesting
larger swings about zero. This can be seen in the following plot, where capacity degradation
for #3 presents as the least erratic of the three electrolyte compositions.
0
0.0005
0.001
0.0015
0.002
0.0025
0.003
0.0035
0.004
0.0045
0.005
3 4 5
Mean Capacity Degradation Over First 100 Cycles
Dis
char
ge C
apac
ity
Deg
radat
ion
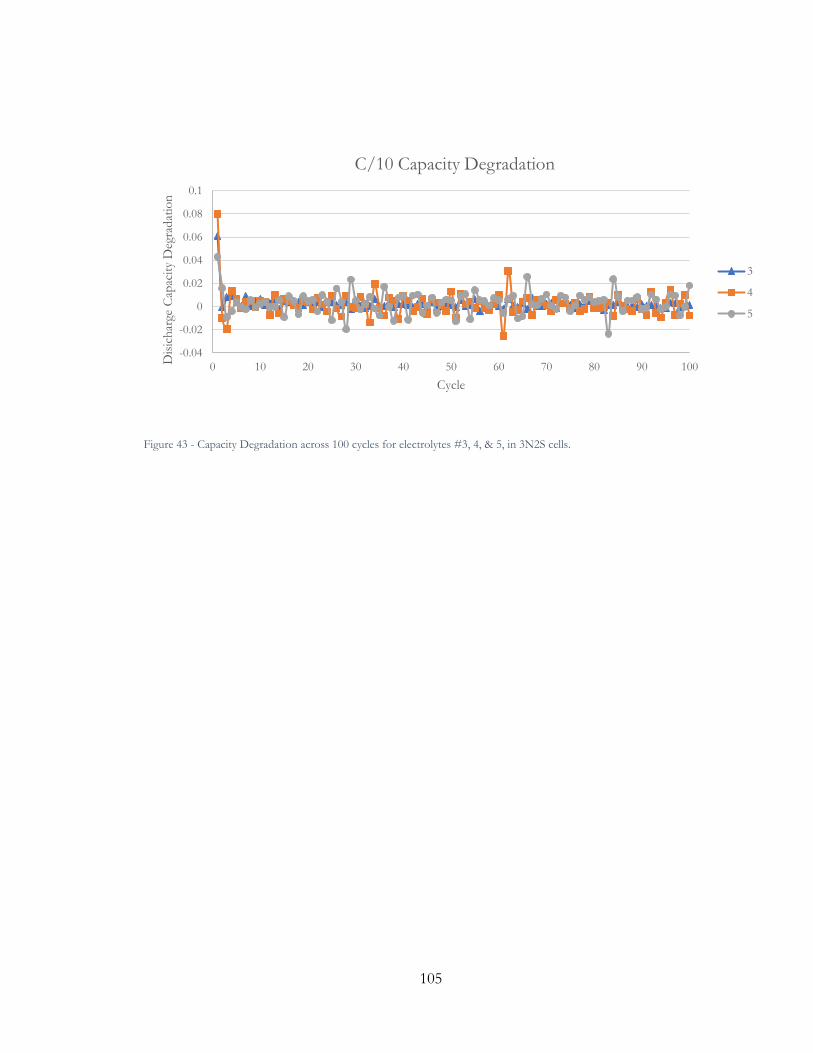
105
Figure 43 - Capacity Degradation across 100 cycles for electrolytes #3, 4, & 5, in 3N2S cells.
-0.04
-0.02
0
0.02
0.04
0.06
0.08
0.1
0 10 20 30 40 50 60 70 80 90 100
Dis
ich
arge
Cap
acit
y D
egra
dat
ion
Cycle
C/10 Capacity Degradation
3
4
5
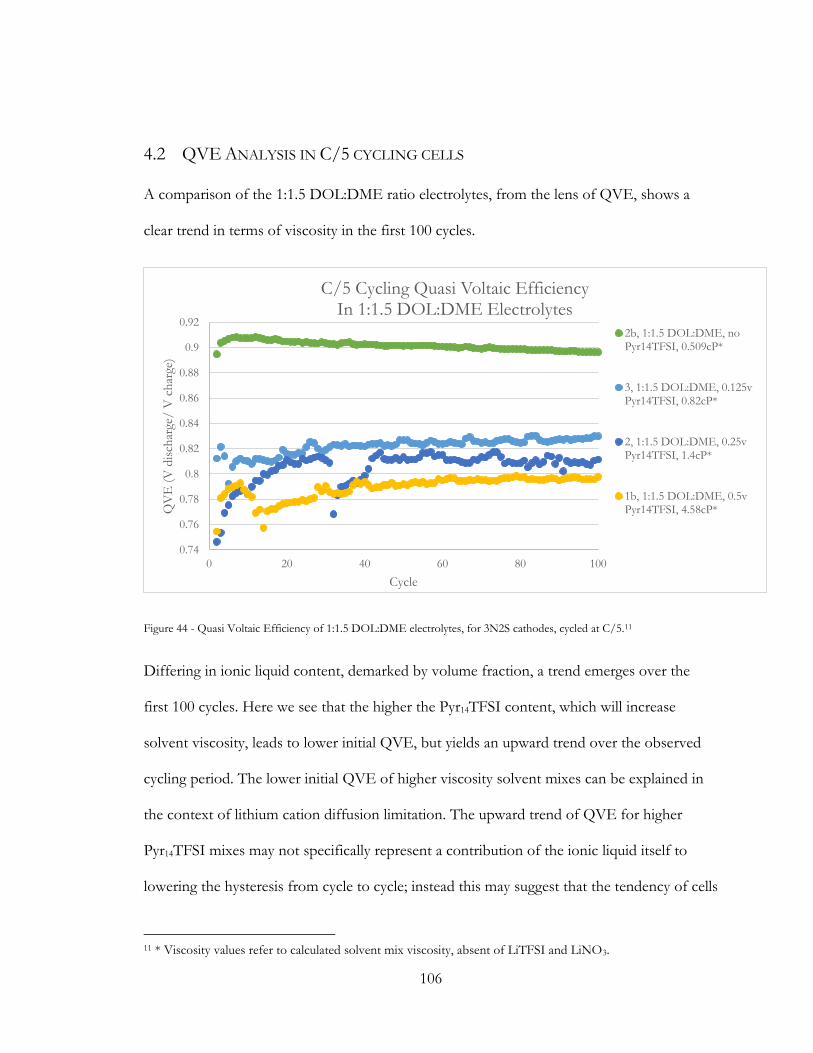
106
4.2 QVE ANALYSIS IN C/5 CYCLING CELLS
A comparison of the 1:1.5 DOL:DME ratio electrolytes, from the lens of QVE, shows a
clear trend in terms of viscosity in the first 100 cycles.
Figure 44 - Quasi Voltaic Efficiency of 1:1.5 DOL:DME electrolytes, for 3N2S cathodes, cycled at C/5.11
Differing in ionic liquid content, demarked by volume fraction, a trend emerges over the
first 100 cycles. Here we see that the higher the Pyr14TFSI content, which will increase
solvent viscosity, leads to lower initial QVE, but yields an upward trend over the observed
cycling period. The lower initial QVE of higher viscosity solvent mixes can be explained in
the context of lithium cation diffusion limitation. The upward trend of QVE for higher
Pyr14TFSI mixes may not specifically represent a contribution of the ionic liquid itself to
lowering the hysteresis from cycle to cycle; instead this may suggest that the tendency of cells
11 * Viscosity values refer to calculated solvent mix viscosity, absent of LiTFSI and LiNO3.
0.74
0.76
0.78
0.8
0.82
0.84
0.86
0.88
0.9
0.92
0 20 40 60 80 100
QV
E (
V d
isch
arge
/ V
ch
arge
)
Cycle
C/5 Cycling Quasi Voltaic EfficiencyIn 1:1.5 DOL:DME Electrolytes
2b, 1:1.5 DOL:DME, noPyr14TFSI, 0.509cP*
3, 1:1.5 DOL:DME, 0.125vPyr14TFSI, 0.82cP*
2, 1:1.5 DOL:DME, 0.25vPyr14TFSI, 1.4cP*
1b, 1:1.5 DOL:DME, 0.5vPyr14TFSI, 4.58cP*
107
at this stage of cycling is inherently to drop in hysteresis, and that the higher viscosity of
these cells inhibits a QVE degradation mechanism.
In low viscosity cells, the diffusion of PS would be less inhibited, allowing faster migration
and shuttling, leading to an increasingly thickening and resistive SEI at the anode. In high
viscosity cells, this migration is relatively limited; allowing for the cells to mature without
increasing internal resistance.
Increasing QVE over time is possibly associated with incremental redistribution of Li2S at
the cathode. While elemental sulfur has been shown to dissolve in DOL:DME electrolytes
(5), Li2S does not. Cathode material precipitates out of the electrolyte solution at the end of
discharge (Li2S), the film formed by deposition may vary from cycle to cycle (127), (113),
(128); beginning with the crystalline Li2S resultant from the H2S treatment, to a thinning,
more disperse film, as the cycles proceed.
Figure 45 - Quasi Voltaic Efficiency of 1:3 DOL:DME electrolytes, for 3N2S cathodes, cycled at C/5.
The 1:3 DOL:DME electrolytes tell a similar story, relative to each other. Whereby the
lower the solvent system viscosity, the higher the initial QVE.
0.82
0.83
0.84
0.85
0.86
0.87
0.88
0.89
0.9
0 20 40 60 80 100QV
E (
V d
isch
arge
/ V
ch
arge
)
Cycle
C/5 Cycling Quasi Voltaic EfficiencyIn 1:3 DOL:DME Electrolytes
5, 1:3 DOL:DME, 0.125vPyr14TFSI, 0.81cP*
4, 1:3 DOL:DME, 0.25vPyr14TFSI, 1.4cP*
108
Figure 46 - Quasi Voltaic Efficiency of 1.5 and 1:3 DOL:DME electrolytes, for 3N2S cathodes, cycled at C/5.
Taken as a whole, however, another context emerges. By comparing 1:1.5 and the 1:3
DOL:DME electrolytes, we see a staggering in terms of viscosity, whereby #4, with a higher
viscosity than #3, begins with a higher QVE. This suggests that viscosity is not the only
factor in QVE. (Zhang, 2012) suggests that the higher the DME content relative to DOL,
the greater the PS solubility. As such, the 1:3 electrolytes would hold a higher PS content
than the 1:1.5 electrolytes, offering higher availability of PS in solution, for reaction and
eventual deposition at the cathode. Here a higher concentration gradient PS expresses as
sulfur availability at the cathode, just as it would at the anode; rather than deposit cathode
0.74
0.76
0.78
0.8
0.82
0.84
0.86
0.88
0.9
0.92
0 20 40 60 80 100
QV
E (
V d
isch
arge
/ V
ch
arge
)
Cycle
C/5 Cycling Quasi Voltaic EfficiencyIn 1:1.5 and 1:3 DOL:DME Electrolytes
2b, 1:1.5 DOL:DME, noPyr14TFSI, 0.509cP*
5, 1:3 DOL:DME, 0.125vPyr14TFSI, 0.81cP*
4, 1:3 DOL:DME, 0.25vPyr14TFSI, 1.4cP*
3, 1:1.5 DOL:DME, 0.125vPyr14TFSI, 0.82cP*
2, 1:1.5 DOL:DME, 0.25vPyr14TFSI, 1.4cP*
1b, 1:1.5 DOL:DME, 0.5vPyr14TFSI, 4.58cP*

109
material at the anode, which represents an irreversible loss of capacity, it aids in the
redeposition of cathode material at the cathode, which results in healthy cell cycling.
This higher PS solubility for the 1:3 DOL:DME electrolytes comes at an obvious cost of
degrading QVE over time. Just as the high concentration of PS makes for robust
redeposition at the cathode, so too does it offer robust deposition at the anode (129).
110
Note that since QVE would drop with extensive shuttle activity, which is known to occur at
a relatively high voltage during the charge cycle, higher QVEs in high PS mobility
electrolytes (2b, 4 and 5)
suggests that extensive
periods of end of charge
shuttling do not in fact occur.
Instead, deposition over time,
as a result of the
concentration gradient appear
to be the case. The following
figure displays a typical low
resistance cell over the course
of one charge an discharge
cycle. In this cell, vigorous
shuttle activity would appear
above 2.4V during charge
(38), in the segment that
appears to flatten out. The
following curve, from (130),
comparing a Li2S@C
composite with physically
mixed Li2S and C illustrated this clearly. While in curve (a) shuttle activity is relatively
Figure 47 - Charge and discharge curves for (a) Li2S@C vs (b) Li2S mixed with C. Performed in an electrolyte of 1M LiTFSI in tetraglyme. Green box added here to point out the region where shuttle effect is most vigorous. (130)
111
suppressed, the lack of rationally designed protection in curve (b) shows vigorous shuttle
activity above 2.4V and the subsequent dramatic loss of capacity.
This period is dominated by the formation of S8, presumably by consumption of Li2S8,
suggesting the predominance of Li2S8 in solution, relative to other PS species at this moment
in the cycle. This bears out from in-situ XRD as shown in (131).
Figure 48 - Charge and discharge curve for a Li-S cell. Red highlight marks the indication of elemental sulfur during in-situ
XRD, while blue indicates the presence of Li2S. The dashed section indicates a period where neither specie is observed.
(131)
Li2S8 is recognized as the most soluble of PS species, leading to high relative concentration in
electrolyte and vigorous shuttle activity. It is the high voltage of this conversion step, and the
prevalence of Li2S8 at this time, that would drop QVE values. Since high PS mobility
electrolytes show high relative QVE, this suggests shuttling is not robust during this step.
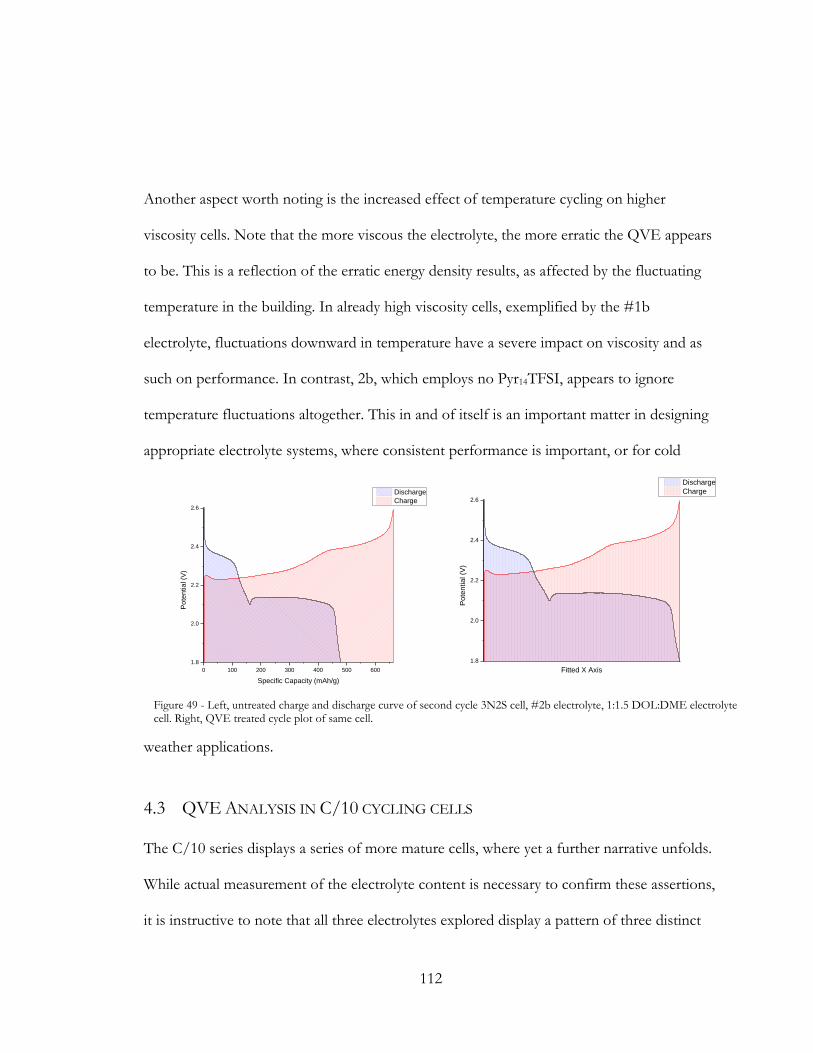
112
Another aspect worth noting is the increased effect of temperature cycling on higher
viscosity cells. Note that the more viscous the electrolyte, the more erratic the QVE appears
to be. This is a reflection of the erratic energy density results, as affected by the fluctuating
temperature in the building. In already high viscosity cells, exemplified by the #1b
electrolyte, fluctuations downward in temperature have a severe impact on viscosity and as
such on performance. In contrast, 2b, which employs no Pyr14TFSI, appears to ignore
temperature fluctuations altogether. This in and of itself is an important matter in designing
appropriate electrolyte systems, where consistent performance is important, or for cold
weather applications.
4.3 QVE ANALYSIS IN C/10 CYCLING CELLS
The C/10 series displays a series of more mature cells, where yet a further narrative unfolds.
While actual measurement of the electrolyte content is necessary to confirm these assertions,
it is instructive to note that all three electrolytes explored display a pattern of three distinct
0 100 200 300 400 500 600
1.8
2.0
2.2
2.4
2.6
Po
ten
tia
l (V
)
Specific Capacity (mAh/g)
Discharge
Charge
1.8
2.0
2.2
2.4
2.6
Po
ten
tia
l (V
)
Fitted X Axis
Discharge
Charge
Figure 49 - Left, untreated charge and discharge curve of second cycle 3N2S cell, #2b electrolyte, 1:1.5 DOL:DME electrolyte cell. Right, QVE treated cycle plot of same cell.
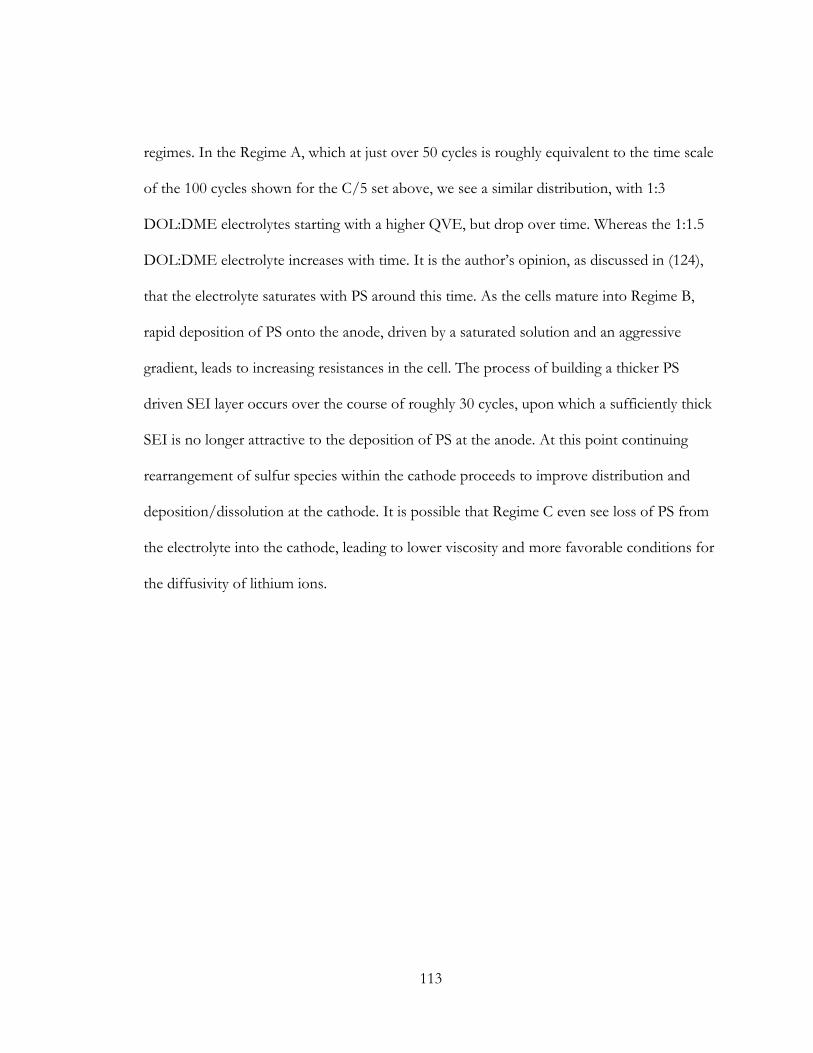
113
regimes. In the Regime A, which at just over 50 cycles is roughly equivalent to the time scale
of the 100 cycles shown for the C/5 set above, we see a similar distribution, with 1:3
DOL:DME electrolytes starting with a higher QVE, but drop over time. Whereas the 1:1.5
DOL:DME electrolyte increases with time. It is the author’s opinion, as discussed in (124),
that the electrolyte saturates with PS around this time. As the cells mature into Regime B,
rapid deposition of PS onto the anode, driven by a saturated solution and an aggressive
gradient, leads to increasing resistances in the cell. The process of building a thicker PS
driven SEI layer occurs over the course of roughly 30 cycles, upon which a sufficiently thick
SEI is no longer attractive to the deposition of PS at the anode. At this point continuing
rearrangement of sulfur species within the cathode proceeds to improve distribution and
deposition/dissolution at the cathode. It is possible that Regime C even see loss of PS from
the electrolyte into the cathode, leading to lower viscosity and more favorable conditions for
the diffusivity of lithium ions.
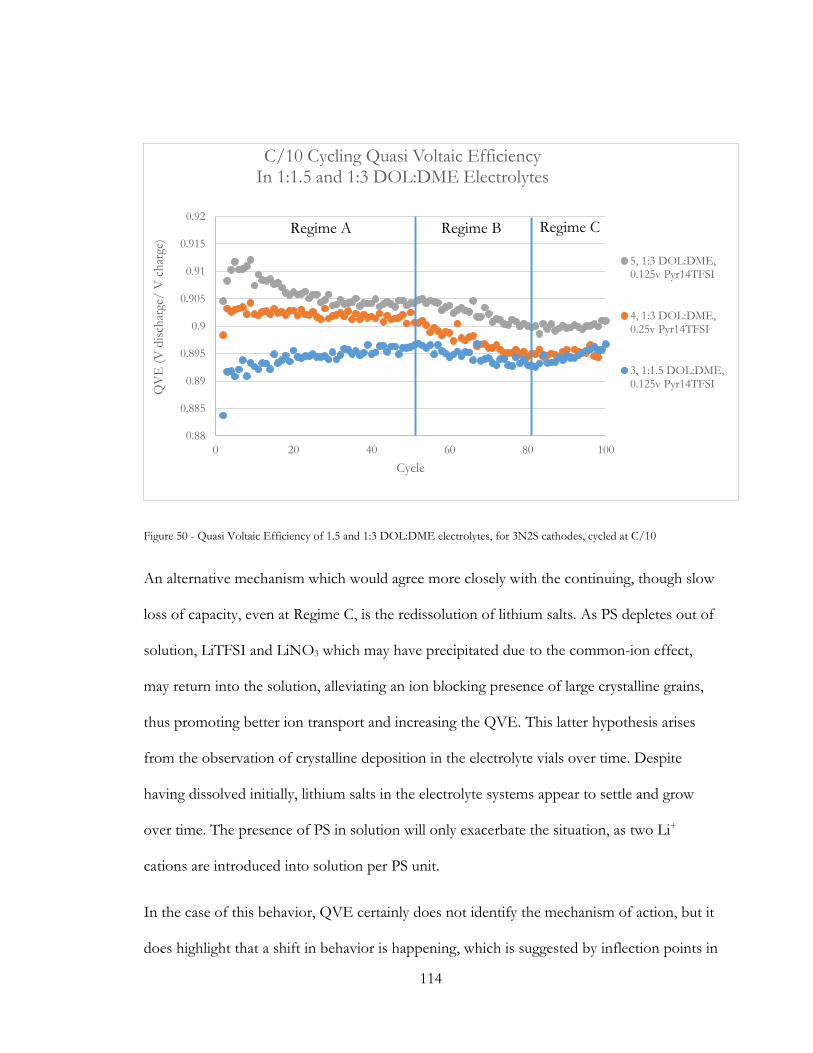
114
Figure 50 - Quasi Voltaic Efficiency of 1.5 and 1:3 DOL:DME electrolytes, for 3N2S cathodes, cycled at C/10
An alternative mechanism which would agree more closely with the continuing, though slow
loss of capacity, even at Regime C, is the redissolution of lithium salts. As PS depletes out of
solution, LiTFSI and LiNO3 which may have precipitated due to the common-ion effect,
may return into the solution, alleviating an ion blocking presence of large crystalline grains,
thus promoting better ion transport and increasing the QVE. This latter hypothesis arises
from the observation of crystalline deposition in the electrolyte vials over time. Despite
having dissolved initially, lithium salts in the electrolyte systems appear to settle and grow
over time. The presence of PS in solution will only exacerbate the situation, as two Li+
cations are introduced into solution per PS unit.
In the case of this behavior, QVE certainly does not identify the mechanism of action, but it
does highlight that a shift in behavior is happening, which is suggested by inflection points in
0.88
0.885
0.89
0.895
0.9
0.905
0.91
0.915
0.92
0 20 40 60 80 100
QV
E (
V d
isch
arge
/ V
ch
arge
)
Cycle
C/10 Cycling Quasi Voltaic EfficiencyIn 1:1.5 and 1:3 DOL:DME Electrolytes
5, 1:3 DOL:DME,0.125v Pyr14TFSI
4, 1:3 DOL:DME,0.25v Pyr14TFSI
3, 1:1.5 DOL:DME,0.125v Pyr14TFSI
Regime A Regime B Regime C
115
the curve; suggesting that a new regime of phenomena prominence has initiated. Observing
the same cycle in specific capacity data displays none of this narrative.
4.3.1 Performance comparison
Cycling data at rates of C/10 and C/5 comparing the three compositions show distinct
differences in performance.
Figure 51 - Discharge Specific Capacity in Electrolyte 5 for cells produced with 3N2S, 1C085S and 3A015S precursor
systems, cycled at C rate of C/10.
0
100
200
300
400
500
600
0 10 20 30 40 50 60 70 80 90 100
Dis
char
ge C
apac
ity
(mA
h/g
po
wd
er)
Cycle
Capacity Retention in discharge curvesElectrolyte #5, C/10
3A015S
1C085S
3N2S
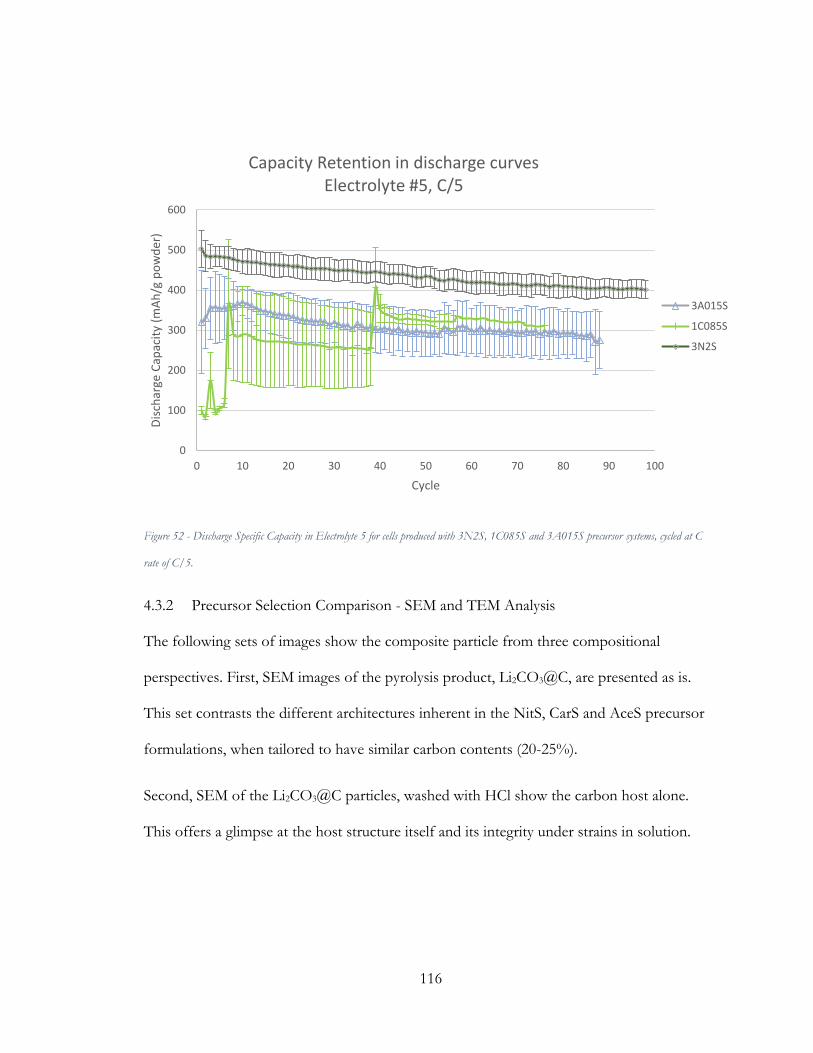
116
Figure 52 - Discharge Specific Capacity in Electrolyte 5 for cells produced with 3N2S, 1C085S and 3A015S precursor systems, cycled at C
rate of C/5.
4.3.2 Precursor Selection Comparison - SEM and TEM Analysis
The following sets of images show the composite particle from three compositional
perspectives. First, SEM images of the pyrolysis product, Li2CO3@C, are presented as is.
This set contrasts the different architectures inherent in the NitS, CarS and AceS precursor
formulations, when tailored to have similar carbon contents (20-25%).
Second, SEM of the Li2CO3@C particles, washed with HCl show the carbon host alone.
This offers a glimpse at the host structure itself and its integrity under strains in solution.
0
100
200
300
400
500
600
0 10 20 30 40 50 60 70 80 90 100
Dis
char
ge C
apac
ity
(mA
h/g
po
wd
er)
Cycle
Capacity Retention in discharge curvesElectrolyte #5, C/5
3A015S
1C085S
3N2S
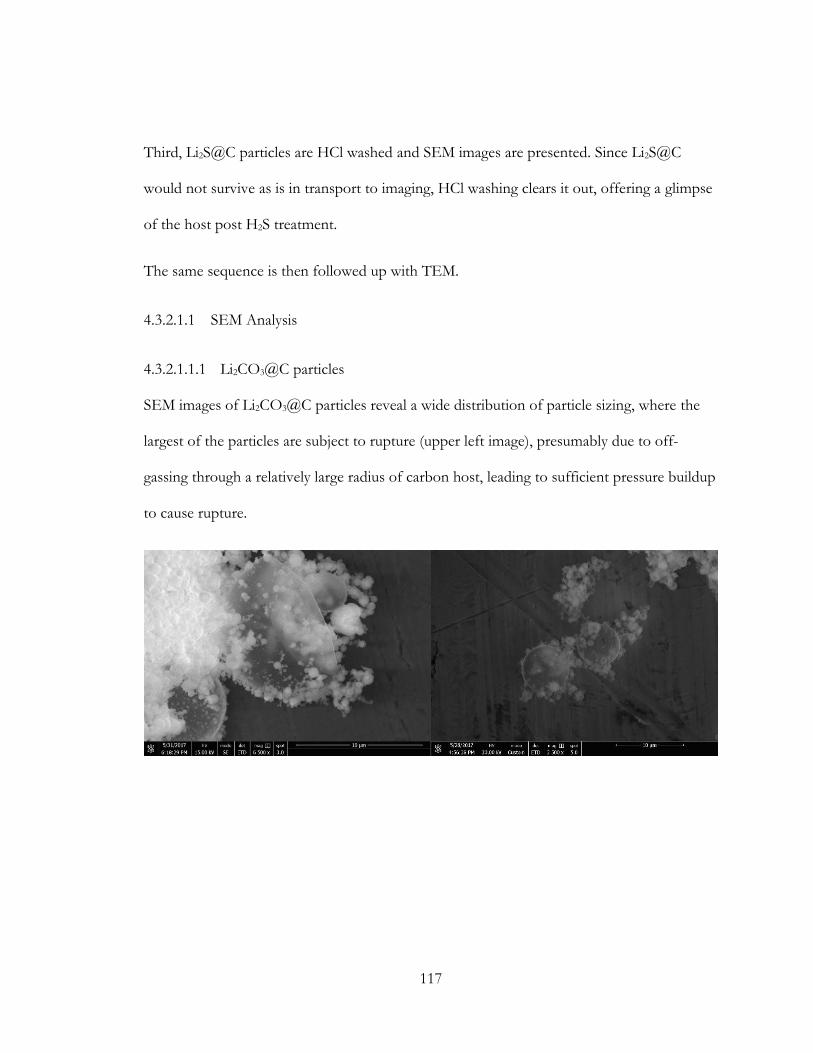
117
Third, Li2S@C particles are HCl washed and SEM images are presented. Since Li2S@C
would not survive as is in transport to imaging, HCl washing clears it out, offering a glimpse
of the host post H2S treatment.
The same sequence is then followed up with TEM.
4.3.2.1.1 SEM Analysis
4.3.2.1.1.1 Li2CO3@C particles
SEM images of Li2CO3@C particles reveal a wide distribution of particle sizing, where the
largest of the particles are subject to rupture (upper left image), presumably due to off-
gassing through a relatively large radius of carbon host, leading to sufficient pressure buildup
to cause rupture.
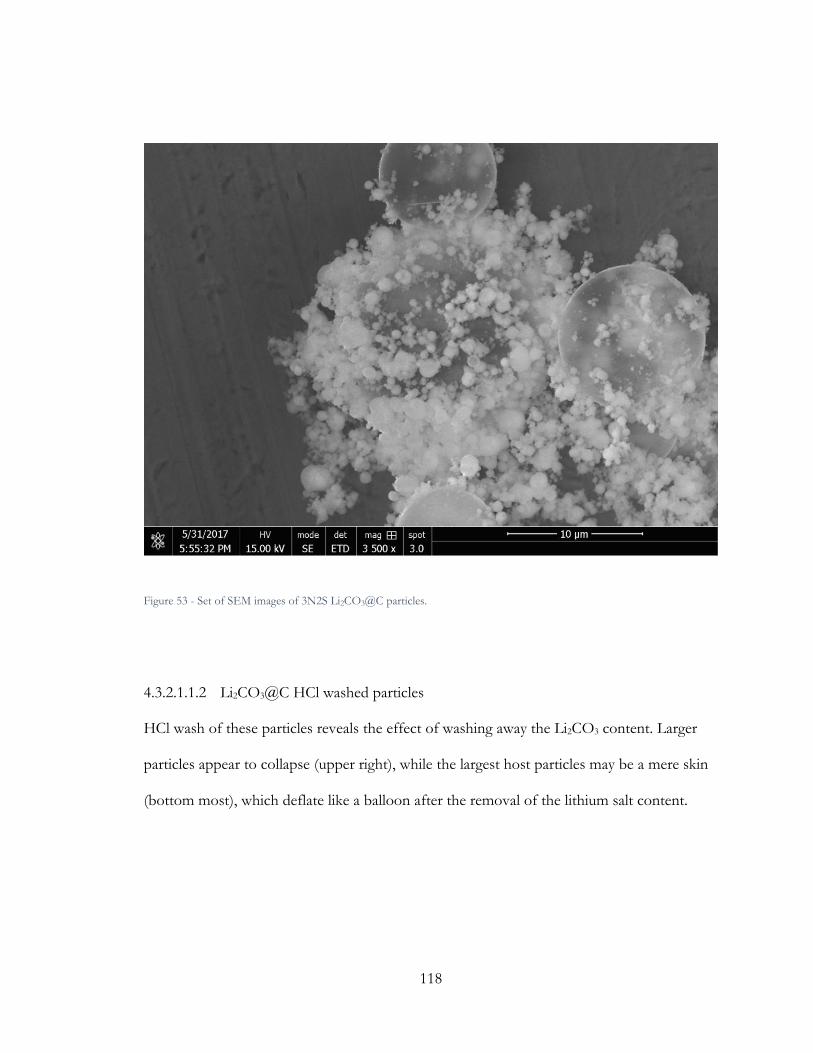
118
Figure 53 - Set of SEM images of 3N2S Li2CO3@C particles.
4.3.2.1.1.2 Li2CO3@C HCl washed particles
HCl wash of these particles reveals the effect of washing away the Li2CO3 content. Larger
particles appear to collapse (upper right), while the largest host particles may be a mere skin
(bottom most), which deflate like a balloon after the removal of the lithium salt content.

119
Figure 54 - Figure 43 - SEM images of 3N2S derived Li2CO3@C particles, after HCl wash
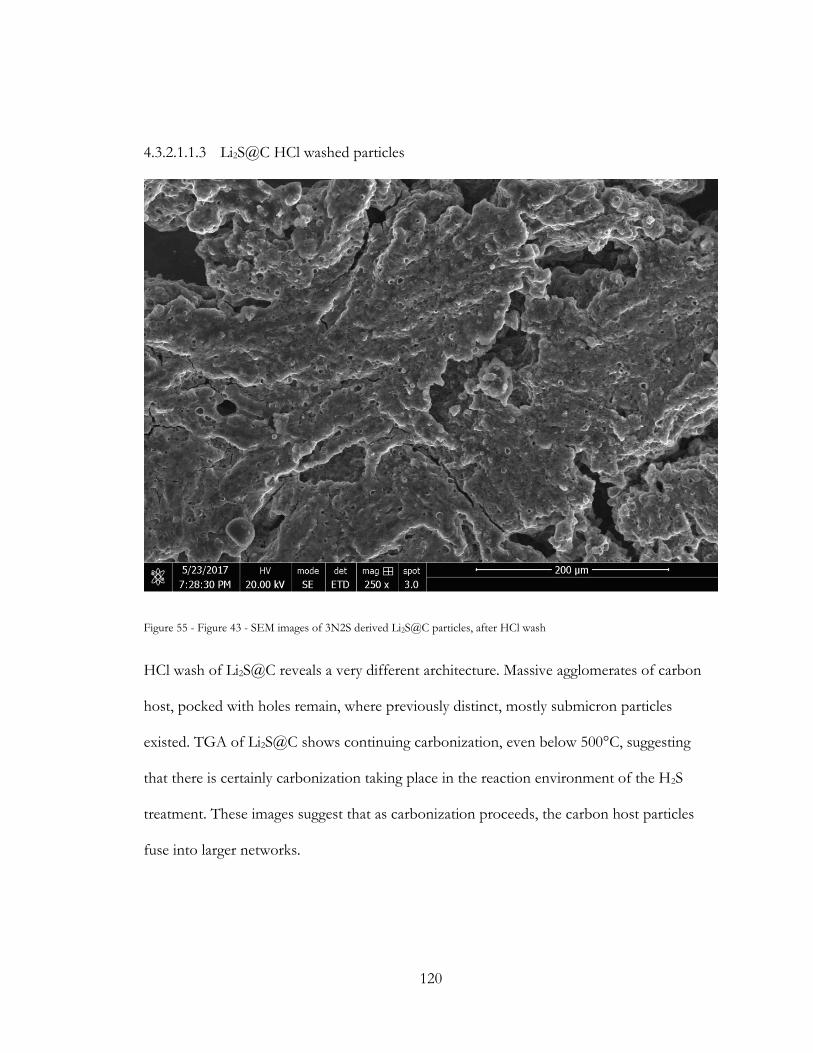
120
4.3.2.1.1.3 Li2S@C HCl washed particles
Figure 55 - Figure 43 - SEM images of 3N2S derived Li2S@C particles, after HCl wash
HCl wash of Li2S@C reveals a very different architecture. Massive agglomerates of carbon
host, pocked with holes remain, where previously distinct, mostly submicron particles
existed. TGA of Li2S@C shows continuing carbonization, even below 500°C, suggesting
that there is certainly carbonization taking place in the reaction environment of the H2S
treatment. These images suggest that as carbonization proceeds, the carbon host particles
fuse into larger networks.
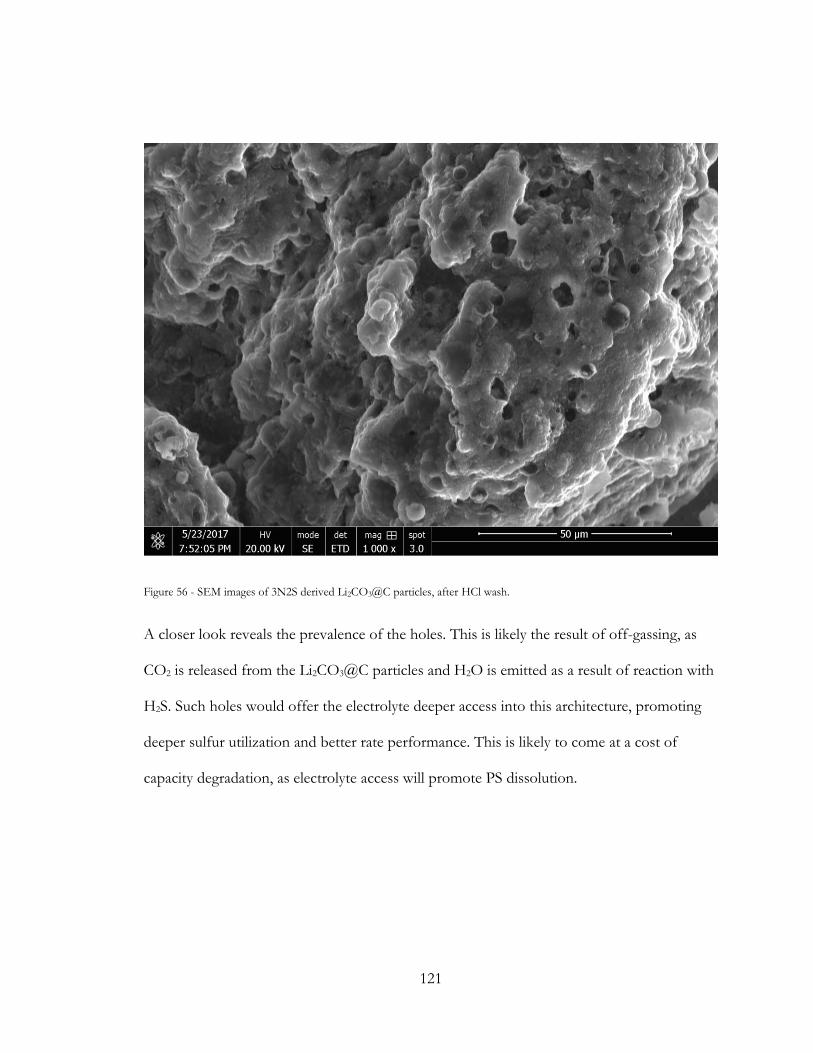
121
Figure 56 - SEM images of 3N2S derived Li2CO3@C particles, after HCl wash.
A closer look reveals the prevalence of the holes. This is likely the result of off-gassing, as
CO2 is released from the Li2CO3@C particles and H2O is emitted as a result of reaction with
H2S. Such holes would offer the electrolyte deeper access into this architecture, promoting
deeper sulfur utilization and better rate performance. This is likely to come at a cost of
capacity degradation, as electrolyte access will promote PS dissolution.
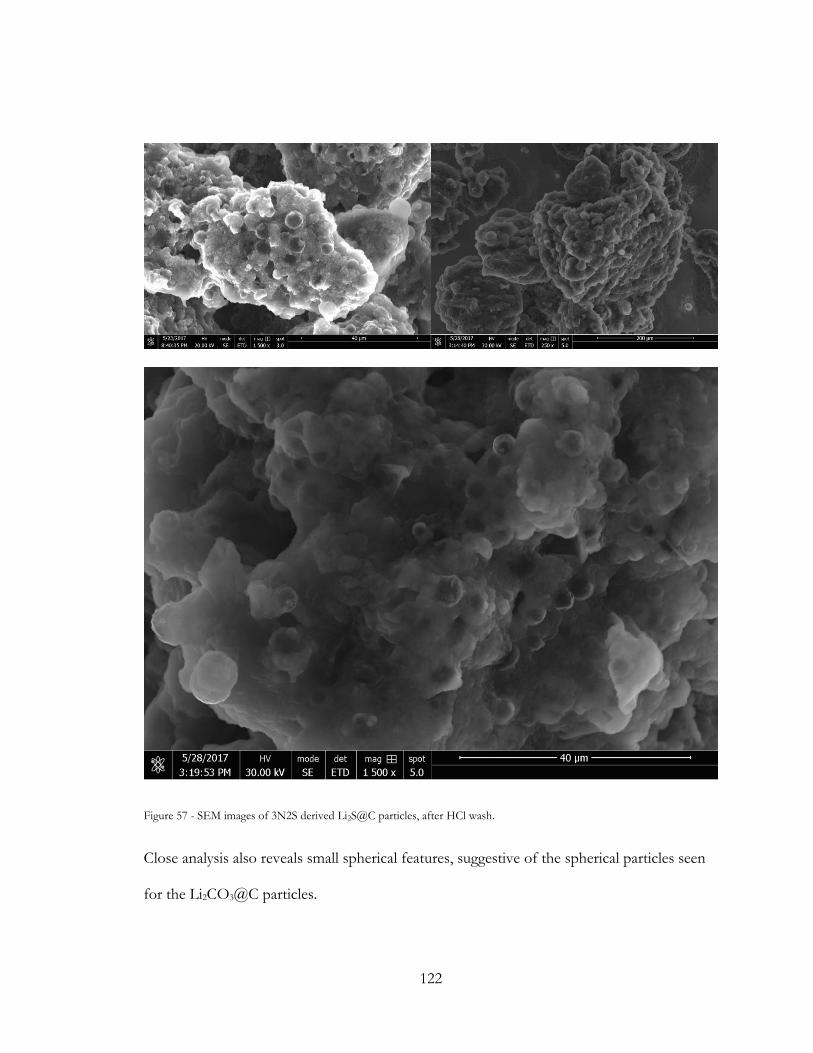
122
Figure 57 - SEM images of 3N2S derived Li2S@C particles, after HCl wash.
Close analysis also reveals small spherical features, suggestive of the spherical particles seen
for the Li2CO3@C particles.
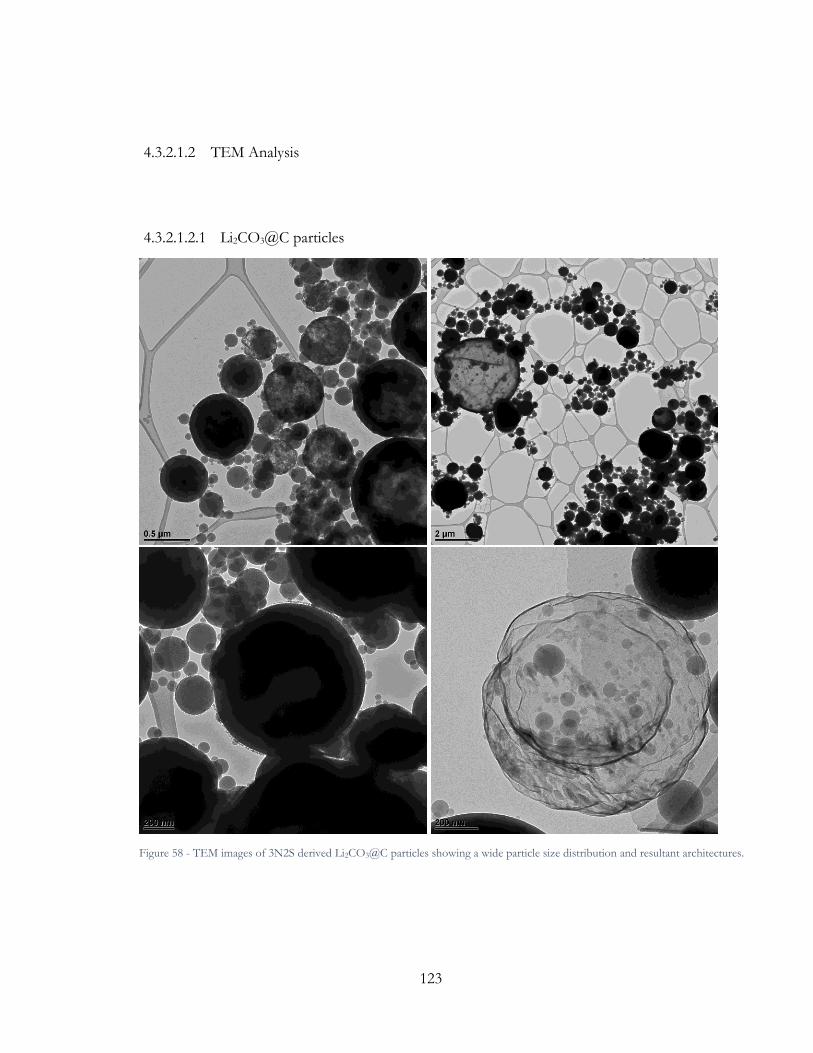
123
4.3.2.1.2 TEM Analysis
4.3.2.1.2.1 Li2CO3@C particles
Figure 58 - TEM images of 3N2S derived Li2CO3@C particles showing a wide particle size distribution and resultant architectures.
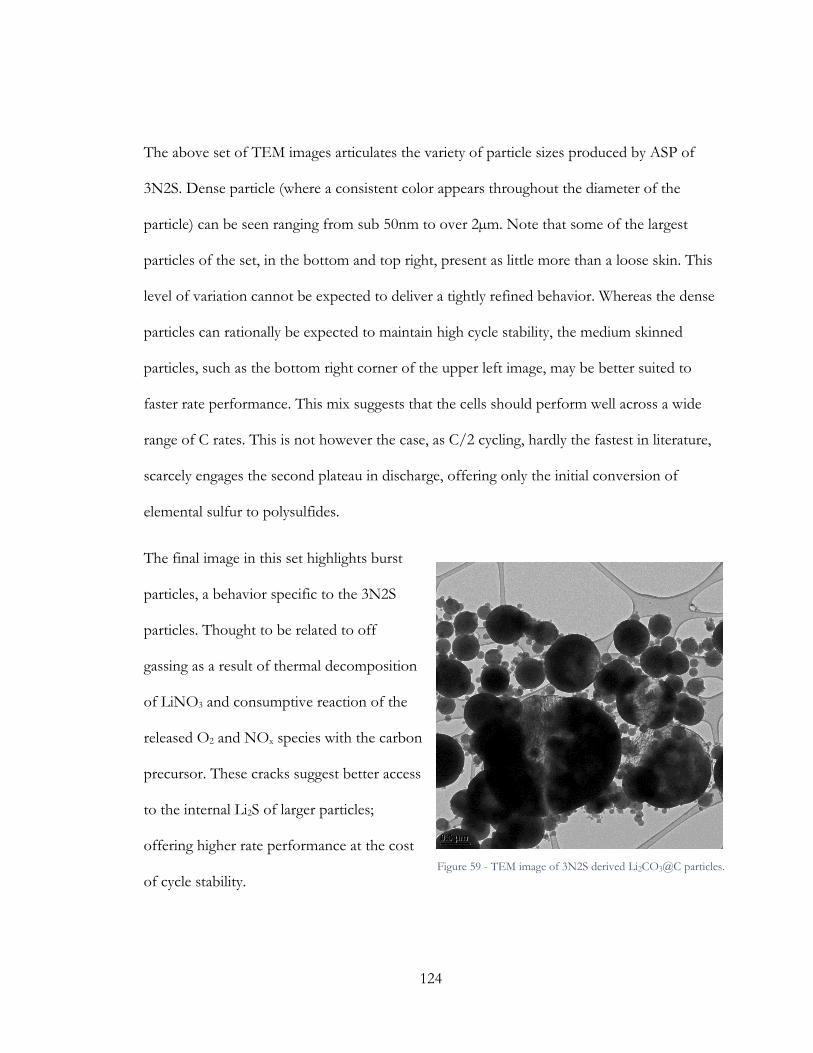
124
The above set of TEM images articulates the variety of particle sizes produced by ASP of
3N2S. Dense particle (where a consistent color appears throughout the diameter of the
particle) can be seen ranging from sub 50nm to over 2µm. Note that some of the largest
particles of the set, in the bottom and top right, present as little more than a loose skin. This
level of variation cannot be expected to deliver a tightly refined behavior. Whereas the dense
particles can rationally be expected to maintain high cycle stability, the medium skinned
particles, such as the bottom right corner of the upper left image, may be better suited to
faster rate performance. This mix suggests that the cells should perform well across a wide
range of C rates. This is not however the case, as C/2 cycling, hardly the fastest in literature,
scarcely engages the second plateau in discharge, offering only the initial conversion of
elemental sulfur to polysulfides.
The final image in this set highlights burst
particles, a behavior specific to the 3N2S
particles. Thought to be related to off
gassing as a result of thermal decomposition
of LiNO3 and consumptive reaction of the
released O2 and NOx species with the carbon
precursor. These cracks suggest better access
to the internal Li2S of larger particles;
offering higher rate performance at the cost
of cycle stability.
Figure 59 - TEM image of 3N2S derived Li2CO3@C particles.
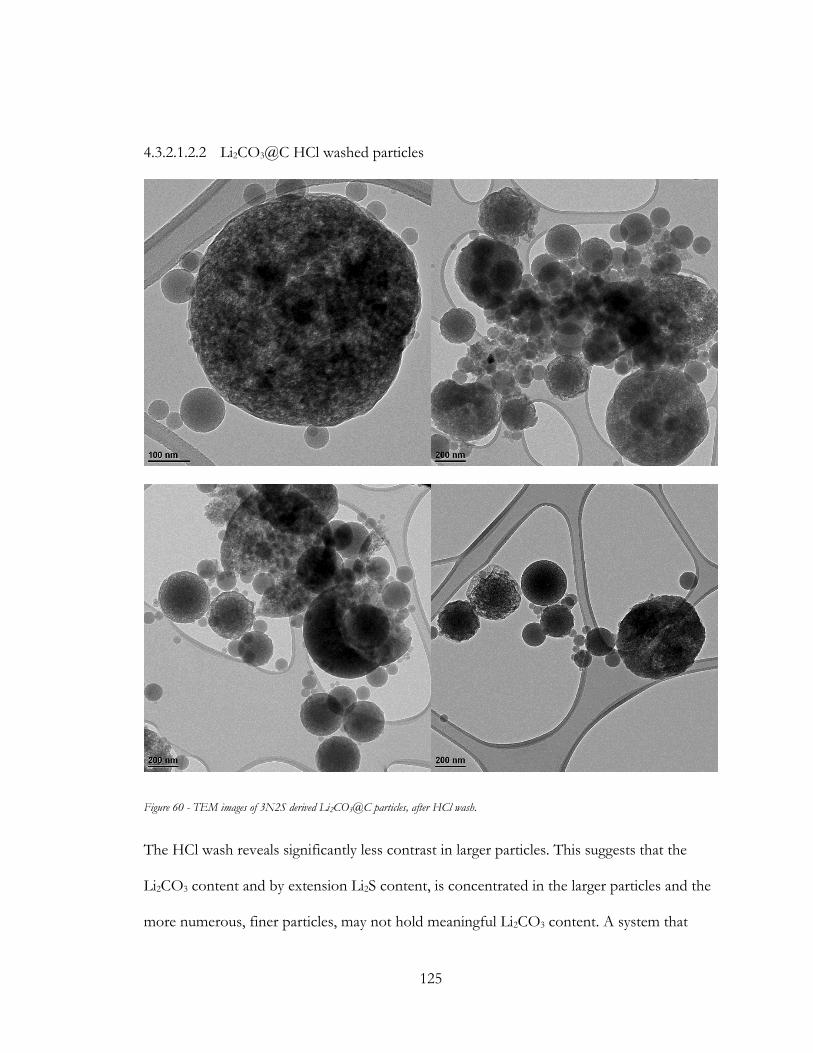
125
4.3.2.1.2.2 Li2CO3@C HCl washed particles
Figure 60 - TEM images of 3N2S derived Li2CO3@C particles, after HCl wash.
The HCl wash reveals significantly less contrast in larger particles. This suggests that the
Li2CO3 content and by extension Li2S content, is concentrated in the larger particles and the
more numerous, finer particles, may not hold meaningful Li2CO3 content. A system that
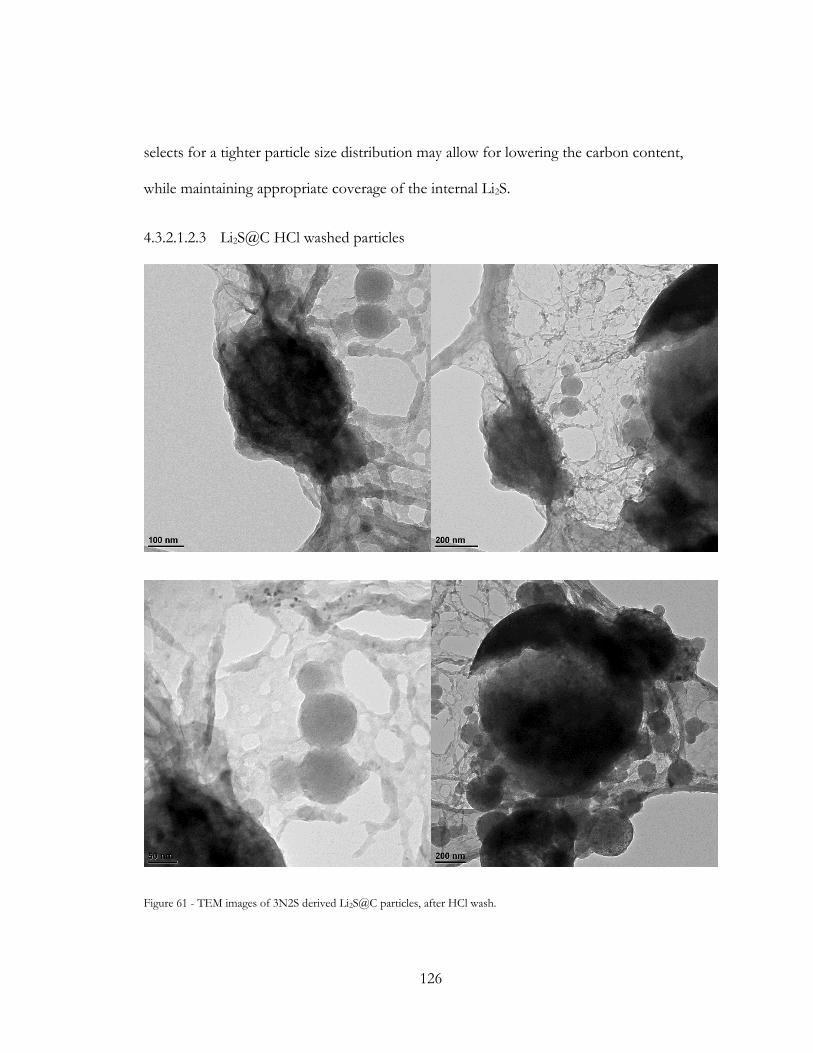
126
selects for a tighter particle size distribution may allow for lowering the carbon content,
while maintaining appropriate coverage of the internal Li2S.
4.3.2.1.2.3 Li2S@C HCl washed particles
Figure 61 - TEM images of 3N2S derived Li2S@C particles, after HCl wash.
127
The final set of 3N2S TEM images articulates a mix of small spherical particles, a predictably
ruptured large particle, and what appears to be a sloughed skin of carbon material draped
across the population. Differences between this set and that observed under SEM may come
down to biases in application and selection of field. In TEM the lacey carbon of the grid may
cause the deposited population to spread across the film more evenly. Moreover, to get a
useful image in TEM, a thinner cluster of particles yields clearer images. This suggests that
the massive clusters seen in SEM may well be a population of ruptured and intact spheres,
draped with the skins of the larger, balloon like particles. What is clear is that the H2S
treatment does not leave neat spherical particles behind; suggesting either that the H2S
treatment reaction environment is too severe, by time and or temperature, or that the
particles as placed in the H2S treatment environment are ill-suited for such a severe
treatment.
128
5 CONCLUSION
5.1 SUMMARY
The above work has shown how a Li2S@C composite can be generated and utilized as
cathode in an electrochemical cell. Observation of cycle stability suggests that the Li2S@C
composite, as delivered in this work, does not in and of itself effectively entrap polysulfides,
resulting in performance that is largely dependent on electrolyte composition and content.
Performance of the composite cannot be taken as a standalone fact, but must be considered
against the physicochemical environment in which the composite functions. As such,
continuing improvements to the electrolyte in particular, as well as electrode pasting and cell
assembly techniques, may show improved performance from the Li2S@C composites
delivered herein.
The performance driven focus of this project and the complexity involved, have contributed
to the difficulty to translate literature suggestions into practice within the work. Since
conclusions delivered in literature are specific to a particular cathode architecture, sulfur areal
loading, electrode thickness, binder selection, cycling rate, electrolyte composition, etc.;
conclusions derived from one system will scarcely be applicable to another. As such,
techniques relevant to advancing a project, on its own steam, become more relevant. To this
end, QVE analysis may be helpful in identifying moments where the internal environment of
the cell experiences a shift in predominant phenomena, suggesting opportune moments for
the performance of lengthy or destructive tests on a cell.
129
Given the inherent limitations of measuring Li2S directly, the devised TGA method allows
for the measurement of a cathode’s lithium content and as such ascertain the composition of
a Li2S composite powder; placing the product into sharper focus in comparison to
performance described in literature. This method is particularly powerful for the estimation
of composite carbon content, as the fate of this component, in post treatment, is difficult to
gauge.
5.2 FUTURE WORK AND OUTLOOK
Much remains to be improved on, surrounding the cathode material itself. Incremental
improvements in electrochemically inactive components offer mass reduction, bringing the
cell ever closer to the theoretical capacity offered by lithium and sulfur.
The inclusion of CVD carbon coating may improve performance (132), (133), while allowing
the overall reduction of cathode carbon content by decreasing carbon precursor (e.g.
Sucrose, PVP, citric acid, etc.) in the initial solution and reducing the need for carbon
additive (e.g. C65, Super P, Ketjen Black, etc.) content. Modification to the electrolyte
chemistry, leading to more stable SEI (64) (118) (121), reducing the incidence of dendrite
growth (134) (135) (136) (137) (138) (139) (140) (141) (142), preventing parasitic reactions
(143) (144), conditioning cycle protocols (145) (143), or alternative reaction pathways (146)
(147), or the adoption of solid state electrolytes (148) (149) (150) (151), suggest the
possibility of greater capacity retention. Lower viscosity and lower interference with interface
conductivity may offer better rate performance.
130
6 APPENDIX
6.1 PRODUCTION
6.1.1 Electrode compounding
After post treatment, both ASP and FD yield a Li2S@C composite and as such must be
handled in a glovebox, in a low moisture (≤0.5ppm) and low oxygen (≤0.1ppm), Argon
environment. The Li2S@C active material is mixed with a carbon additive and binder, at a
mass ratio of 70:20:10 respectively, in sufficient toluene to allow for stir bar mixing. Mixing
proceeds for 24 hours, in a sealed vial. The mixed slurry is smeared onto carbon coated
aluminum foil (MTIXTL inc.) using a spatula, limiting the pasting area to yield cathodes of a
desirable loading. The film is allowed to dry in the glove box environment, for ten minutes.
An upper limit of around 3mg composite material loading (translating to a potential
maximum 2.1mg sulfur) per cathode is realized in this method, as a result flaking of the
cathode material off of the foil. This is addressed in (152) whereby above a critical thickness
of film of certain properties, the energy barrier associated with cracking is finally overcome
by the stresses induced during drying. A slower evaporating solvent than toluene may
alleviate these stresses and allow for a thicker, uncracked film. This upper limit suggests the
methods used (compounding ratio, toluene as compounding solvent, type of binder, spatula
pasting, glovebox temperature drying before oven baking) are inappropriate for
commercially relevant loadings. As discussed in (153), the areal loading of sulfur (mg/cm2)
has a dramatic effect on commercial viability of a Li-S system. In Hagen’s study, with a
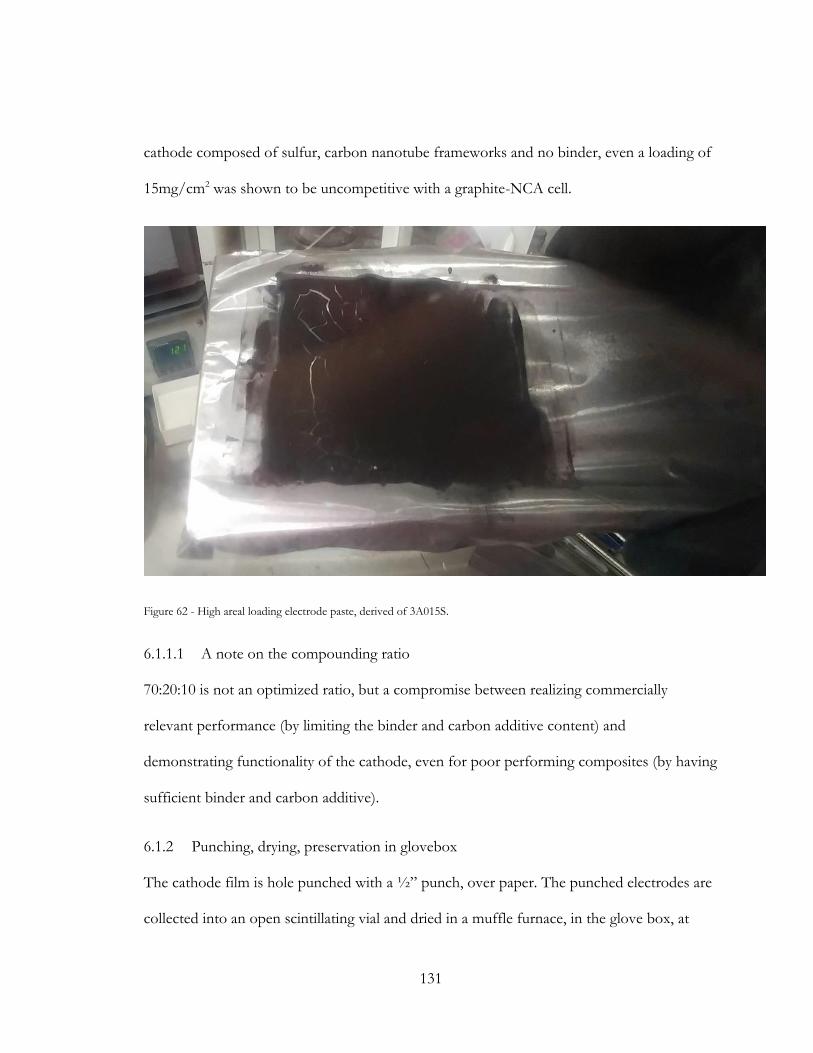
131
cathode composed of sulfur, carbon nanotube frameworks and no binder, even a loading of
15mg/cm2 was shown to be uncompetitive with a graphite-NCA cell.
Figure 62 - High areal loading electrode paste, derived of 3A015S.
6.1.1.1 A note on the compounding ratio
70:20:10 is not an optimized ratio, but a compromise between realizing commercially
relevant performance (by limiting the binder and carbon additive content) and
demonstrating functionality of the cathode, even for poor performing composites (by having
sufficient binder and carbon additive).
6.1.2 Punching, drying, preservation in glovebox
The cathode film is hole punched with a ½” punch, over paper. The punched electrodes are
collected into an open scintillating vial and dried in a muffle furnace, in the glove box, at
132
120°C for two hours, to remove any remaining toluene. The dried cathodes are then sealed
in the vial and kept in a glovebox. Cathode performance appears to degrade, with time in
glovebox, suggesting that even in the protective environment of the glovebox, Li2S@C is
still reactive and as such suffers from a limited shelf life.
6.1.3 2032 cell assembly
The ½” cathode is weighed four times on a microbalance. The weight of the cathode itself is
given by,
Avg.Mass of 1/2" punch − 0.0054g = Mass of Cathode
This calculation subtracts the mass of the foil (ascertained as 0.0054g on average, from 29
measurements) from that of the entire 1/2” punch. The cathode is loaded face up into the
bottom cap of the coin cell. A volume of electrolyte is dropped onto the cathode, at a ratio
of 10-15µl electrolyte per 1mg Sulfur. Sulfur content is calculated by assuming the entirely of
the active material is Li2S, then stoichiometrically converted to Sulfur. A 3/4”, diameter
25µm thick PP-PE-PP (poly-propylene poly-ethylene poly-propylene) porous separator
(MTIXTL inc.) is placed quickly over of the wetted cathode. A 5/8” punch of lithium metal
is pressed onto the separator.
Steel spacer is placed on top of the lithium, and can be used to press the lithium into the
separator. A steel spring is placed above the spacer. The top cap is placed atop the spring
and closes the cell. The cell is flipped over and placed into a crimper (MTIXTL inc.). The
crimper is pumped to 900psi. The crimper is then relaxed and the cell is removed.
133
6.1.3.1 Notes on assembly
For a sulfur based cathode, it is important to limit the electrolyte loading so as to reduce the
solvent’s ability to dissolve polysulfides and as such present capacity fade during cycling. As
such the lower the electrolyte to active material ratio (here, 10:1), the better. Indeed, to be
competitive with lithium ion cells on a gravimetric energy (Wh/kg) basis, the ratio should be
close to 1:4. Dropping this ratio bellow 10:1 however, resulted in poor engagement of the
cathode and a recurrent failure of the cells to charge. The minimal ratio was arrived at with
12:1 (roughly equivalent to 10:1 with DOL:DME in, (124)). Note that optimization would
require significant lowering of this ratio, as both weight of the electrolyte and its costs at
such a high volume adversely affect the $/kWh metric.
The use of a 3/4” separator and a 5/8” lithium metal foil were arrived at as a way of
standardizing and control the assembly. This configuration leads to a folding over of the
separator around the lithium, and their firm lodging within the bottom cap. While this
repeatable arrangement lead to a greater fraction of the assembled cells functioning, by
preventing short circuits, it also means that the area of the separator is 225% that of the
cathode itself, while the area of the lithium punch is above 150% that of the cathode.
Separators this size were measured to hold roughly 10µl of electrolyte, after being patted dry.
This means that a significant amount of electrolyte was used just to ensure good ion
transport through excessive separator area, making it difficult to test cathodes of lower mass,
below an E/S ratio of 30. Such a large lithium punch, moreover, leads to increased surface
area for the consumptive reaction of PS on the lithium surface, expediting capacity loss. An
optimized cell, such as a pouch configuration, where both electrodes and the separator are
134
roughly matched in size, would show cells with lower PS consumption and as such, better
capacity retention. It would also allow the testing of lower loading cathodes, to study
behavior at low E/S ratios more closely. This may be helpful in studying aspects which
would be affected by thicker cathodes, such as diffusion characteristics.
6.2 ERROR
The error bars provided in the cycling capacity calculations represent the error of two
dimensions: the deviation in capacities within a sample, which describes reproducibility of
the material’s behavior; and the error associated with weighing the cathodes, which describes
the accuracy of estimation of cathode material.
For the former, this speaks to the reproducibility associated with the electrolyte (which may
change properties over time due to lithium-salt precipitation, uneven cosolvent evaporation
and solvent evaporation resulting in changes in solute concentration) as well as the
reproducibility resulting from a particular composition (which speaks to how consistent a
pyrolysis product is yielded, by architecture and sizing, the level of conversion in post
treatment and the any inherent reproducibility issues stemming from the particular
precursors used).
The latter describes the accuracy of teasing out the actual active material mass, which is a
calculation based on the following two values: the 1/2” cathode punch of the battery
measured (of which four measurements are taken on a microbalance) and a representative
sample of clean aluminum foil 1/2” punches (a set of 60 such foils). The variation of the
cathode punch is calculated as a function of (n) with excel’s VAR.P function, while the latter
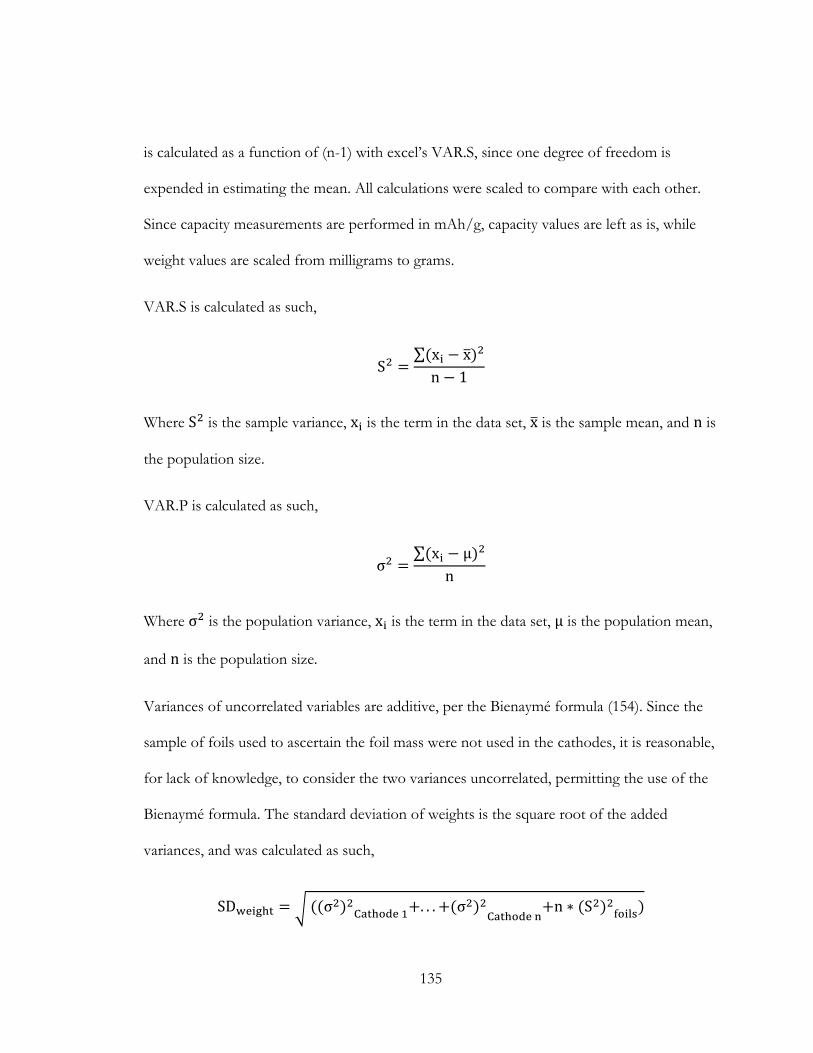
135
is calculated as a function of (n-1) with excel’s VAR.S, since one degree of freedom is
expended in estimating the mean. All calculations were scaled to compare with each other.
Since capacity measurements are performed in mAh/g, capacity values are left as is, while
weight values are scaled from milligrams to grams.
VAR.S is calculated as such,
S2 =∑(xi − x̅)
2
n − 1
Where S2 is the sample variance, xi is the term in the data set, x̅ is the sample mean, and n is
the population size.
VAR.P is calculated as such,
σ2 =∑(xi − μ)
2
n
Where σ2 is the population variance, xi is the term in the data set, μ is the population mean,
and n is the population size.
Variances of uncorrelated variables are additive, per the Bienaymé formula (154). Since the
sample of foils used to ascertain the foil mass were not used in the cathodes, it is reasonable,
for lack of knowledge, to consider the two variances uncorrelated, permitting the use of the
Bienaymé formula. The standard deviation of weights is the square root of the added
variances, and was calculated as such,
SDweight = √ ((σ2)2Cathode 1+. . . +(σ2)2
Cathode n+n ∗ (S2)2
foils)
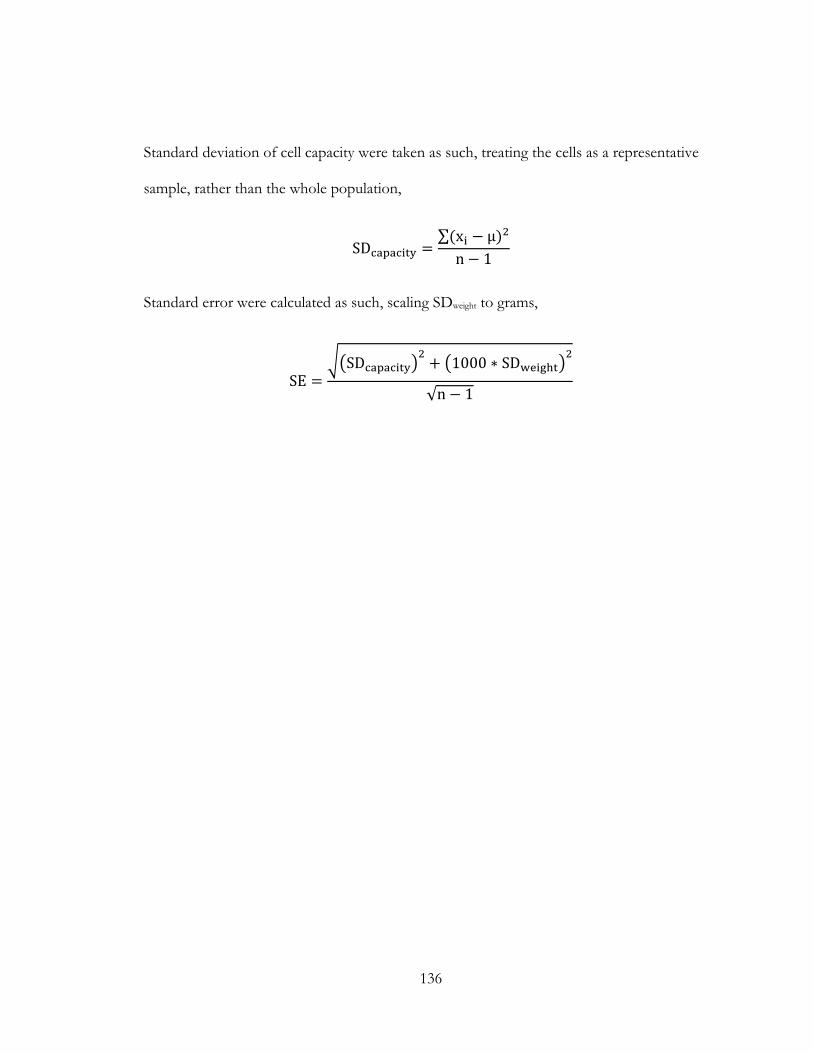
136
Standard deviation of cell capacity were taken as such, treating the cells as a representative
sample, rather than the whole population,
SDcapacity =∑(xi − μ)
2
n − 1
Standard error were calculated as such, scaling SDweight to grams,
SE =√(SDcapacity)
2+ (1000 ∗ SDweight)
2
√n − 1
137
7 REFERENCES
1. Fletcher, Seth. Bottled Lightning: Superbatteries, Electric Cars, and the New Lithium Economy.
New York, New York : Hill and Wang, 2011.
2. Lithium–Sulfur Batteries: Electrochemistry, Materials, and Prospects. Yin, Ya-Xia, et al. 50, 2013,
Angewandte Chemie, Vol. 52, pp. 13186 - 13200.
3. Recent progress and remaining challenges in sulfur-based lithium secondary batteries–a review. Bresser,
Dominc, Passerini, Stefano and Scrosati, Bruno. 90, 2013, Chem. Comm., Vol. 49, pp.
10545 - 10562.
4. Carbon-sulfur composites for Li-S batteries: status and prospects. Wang, Da-Wei, et al. 2013, J.
Mat. Chem. A, Vol. 1, pp. 9382-9394.
5. A review of electrolytes for lithium–sulphur batteries. Scheers, Johan, Fantini, Sébastien and
Johansson, Patrik. 2014, J. Power Sources, pp. (255) 204-218.
6. Challenges and Prospects of Lithium–Sulfur Batteries. Manthiram, Arumugam, Fu, Yongzhu
and Su, Yu-Sheng. 5, 2013, Acc. Chem. Res., Vol. 46, pp. 1125 - 1134.
7. Lithium sulfur batteries, a mechanistic review. Wild, M., et al. 12, 2015, Energy Environ. Sci.,
Vol. 8, pp. 3477 - 3494.
8. Sulfur Composite Cathode Materials for Rechargeable Lithium Batteries. Wang, J., et al. 6, 2003,
Adv. Functional Mater., Vol. 13, pp. 487 - 492.
9. Park, Jun-Ki. Principles and Applications of Lithium Secondary Batteries. s.l. : Wiley-VCH, 2012.

138
10. Surface-Modified Membrane as A Separator for Lithium-Ion Polymer Battery. Kim, Jun Young
and Lim, Dae Young. 2010, Energies, pp. 866-885.
11. Microprobe study of the effect of Li intercalation on the structure of graphite. Kostecki, Robert and
McLarnon, Frank. 2003, J. Power Sources, Vols. 119-121, pp. 550 - 554.
12. Degradation of carbon materials by intercalation. Tanaike, Osamu and Inagaki, Michio. 11,
1999, Carbon, Vol. 37, pp. 1759 - 1769.
13. Unravelling the Impact of Reaction Paths on Mechanical Degradation of Intercalation Cathodes for
Lithium-Ion Batteries. Li, Juchuan, et al. 43, 2015, J. Am. Chem. Soc., Vol. 137, pp. 13732 -
13735.
14. Engineering nanostructured electrodes and fabrication of film electrodes for efficient lithium ion
intercalation. Liu, Dawei and Cao, Guozhong. 3, 2010, Energy Environ. Sci., pp. 1218 -
1237.
15. Overcharge-induced capacity fading analysis for large format lithium-ion batteries with
LiyNi1/3Co1/3Mn1/3O2 + LiyMn2O4 composite cathode. Ouyang, Minggao, et al. 2015, J
Power Sources, Vol. 279, pp. 626 - 635.
16. Overcharge reaction of lithium-ion batteries. Ohsaki, Takahisa, et al. 1-2, 2005, J. Power
Sources, Vol. 146, pp. 97 - 100.
17. Thermal and electrochemical behaviour of C/LixCoO2 Cell during safety test. Doh, Chil-Hoon, et
al. 2, 2008, J. Power Sources, Vol. 175, pp. 881 - 885.
18. Beyond Intercalation-Based Li-Ion Batteries: The State of the Art and Challenges of Electrode
Materials Reacting Through Conversion Reactions. Cabana, Jordi, et al. 35, 2010, Adv. Mater.,
Vol. 22, pp. E170 - E192.
139
19. Li-ion battery materials: present and future. Nitta, Naoki, et al. 5, 2015, Mater. Today, Vol.
18, pp. 252-264.
20. In Situ XRD and Electrochemical Study of the Reaction of Lithium with Amorphous Silicon.
Hatcard, T. D. and Dahn, J. R. 6, 2004, J. Electrochem. Soc., Vol. 151, pp. A838 - A842.
21. A review of the electrochemical performance of alloy anodes. Zhang, Wei-Jun. 2011, J. Power
Sources, Vol. 196, pp. 13 - 24.
22. Determination of the diffusion coefficient of lithium ions in nano-Si. Ding, N., et al. 2-3, 2009,
Solid State Ionics, Vol. 180, pp. 222 - 225.
23. Enhanced reversible lithium storage in a nanosize silicon/graphene composite. Chou, Shu-Lei, et al.
2, 2010, Electrochem. Comm., Vol. 12, pp. 303 - 306.
24. Expansion of Lithium Ion Pouch Cell Batteries: Observations from Neutron Imaging. Siegel, Jason,
et al. Washington, USA : s.n., 2013, J. Electrochem Soc., pp. (160, 8) A1031-A1038.
25. SnLi4.4 nanoparticles encapsulated in carbon matrix as high performance anode material for lithium-ion
batteries. Fan, Xiulin, et al. 2014, Nano Energy, pp. (9) 196-203.
26. Porous Si anode materials for lithium rechargeable batteries. Cho, Jaephil. 2010, J. Mater. Chem.,
pp. (20) 4009-4014.
27. Solid state lithiation–delithiation of sulphur in sub-nano confinement: a new concept for designing
lithium–sulphur batteries. Fu, Chengyin, et al. 2016, Chem. Sci., pp. 1224-1232.
28. Giant Raman Response to the Encapsulation of Sulfur in Narrow Diameter Single-Walled Carbon
Nanotubes. Li, Guanghui, et al. 2015, J. Am. Chem. Soc., pp. 40-43.
140
29. Sulfur-impregnated disordered carbon nanotubes cathode for lithium–sulfur batteries. Guo, J., Xu, Y.
and Wang, C. 2011, Nano Letters, pp. 4288-4294.
30. Electrochemical Lithiation of Covalently Bonded Sulfur in Vulcanized Polyisoprene. Fu, Chengyin,
et al. 2016, ACS Energy Letters, pp. 115-120.
31. Nanoarchitectured Graphene/CNT@Porous Carbon with Extraordinary Electrical Conductivity and
Interconnected Micro/Mesopores for Lithium-Sulfur Batteries. Peng, Hong-Jie, et al. 19, 2014, Adv.
Functional Mater., Vol. 24, pp. 2772 - 2781.
32. Graphene-enveloped sulfur in a one pot reaction: a cathode with good coulombic efficiency and high
practical sulfur content. Evers, Scott and Nazar, Linda F. 9, 2012, Chem. Commun., Vol. 48,
pp. 1233 - 1235.
33. High capacity micro-mesoporous carbon–sulfur nanocomposite cathodes with enhanced cycling stability
prepared by a solvent-free procedure. Thieme, Sören, et al. 32, 2013, J. Mater. Chem. A, Vol. 1,
pp. 9225 - 9234.
34. A new route for the preparation of mesoporous carbon materials with high performance in lithium–
sulphur battery cathodes. Oschatz, Martin, et al. 2013, Chem. Commun., Vol. 49, pp. 5832-
5834.
35. New Approaches for High Energy Density Lithium–Sulfur Battery Cathodes. Evers, Scott and
Nazar, Linda F. 5, 2013, Acc. Chem. Res., Vol. 46, pp. 1135 - 1143.
36. High capacity vertical aligned carbon nanotube/sulfur composite cathodes for lithium–sulfur batteries.
Dörfler, Susanne, et al. 34, 2012, Chem. Commun., Vol. 48, pp. 4097 - 4099.
37. Sulfur-Infiltrated Micro- and Mesoporous Silicon Carbide-Derived Carbon Cathode for High-
Performance Lithium Sulfur Batteries. Lee, Jung Tae, et al. 2013, Adv. Mater., Vol. 25, pp. 4573
- 4579.

141
38. Lithium–sulfur batteries—the solution is in the electrolyte, but is the electrolyte a solution?
Barghamadi, Marzieh, et al. 2014, Energy & Envir. Sci., pp. 3902-3920.
39. Recent Advances in Lithium Sulfide Cathode Materials and Their Use in Lithium Sulfur Batteries.
Son, Yoonkook, et al. 16, 2015, Adv. Energy Mat., Vol. 5.
40. Li2S -Carbon Sandwiched Electrodes with Superior Performance for Lithium-Sulfur Batteries. Fu,
Yongzhu, Su, Yu-Sheng and Manthiram, Arumugam. 2014, Adv. Energy. Mater., Vol.
4.
41. Towards high performance lithium-ion sulfur battery based on Li2S cathode using dual-phase electrolyte.
Wang, Lina, Wang, Yonggang and Xia, Yongyao. 2015, Energy Environ. Sci.
42. Nanoporous Li2S and MWCNT-linked Li2S powder cathodes for lithium-sulfur and lithium-ion
battery chemistries. Wu, Feixiang, Magasinski, Alexandre and Yushin, Gleb. 2014, J.
Mater. Chem. A.
43. High-Performance All-Solid-State Lithium−Sulfur Battery Enabled by a Mixed-Conductive Li2S
Nanocomposite. Han, Fudong, et al. 2016, ACS Nano Letters.
44. Lithium Sulfide (Li2S)/Graphene Oxide Nanospheres with Conformal Carbon Coating as a High-
Rate, Long-Life Cathode for Li/S Cells . Hwa, Yoon, Zhao, Juan and Cairns, Elton J. 2015,
Nano Lett., Vol. 15, pp. 3479-3486.
45. Li2S encapsulated by nitrogen-doped carbon for lithium sulfur batteries. Chen, Lin, et al. 2014, J.
Mater. Chem. A, Vol. 2, p. 18026.
46. High-capacity Li2S–nanocarbon composite electrode for all-solid-state. Nagao, Motohiro,
Hayashi, Akitoshi and Tatsumisago, Masahiro. 2012, J. Mater. Chem., Vol. 22, p. 10015.
47. Nanostructured Li2S–C Composites as Cathode Material for High-Energy Lithium/Sulfur Batteries.
Cai, Kunpeng, et al. 12, 2012, Nano Lett., Vol. 12, pp. 6474 - 6479.
142
48. All-Solid-State Lithium Secondary Battery with Li2S–C Composite Positive Electrode Prepared by
Spark-Plasma Sintering Process. Takeuchi, Tomonari, et al. 2010, J. Electrochem. Soc., Vol.
11, pp. A1196 - A1201.
49. Shaw, Leon L. US 20140356705 A1 United States, 2014.
50. Li2S-reduced graphene oxide nanocomposites as cathode material for lithium sulfur batteries. Han,
Kai, et al. 2014, J. Power Sources, Vol. 251, pp. 331-337.
51. Highly Reversible Lithium/Dissolved Polysulfide Batteries with Carbon Nanotube Electrodes. Fu,
Yongzhu, Su, Yu-Sheng and Manthiram, Arumugam. 2013, Angew. Chem., pp. 7068 -
7073.
52. In Situ-Formed Li2S in Lithiated Graphite Electrodes for Lithium–Sulfur Batteries. Fu,
Yongzhu, Zu, Chenxi and Manthiram, Arumugam. 48, 2013, J. Am. Chem. Soc., Vol.
135, pp. 18044 - 18047.
53. Lithium-Sulfur Battery Cathode Enabled by Lithium-Nitrile Interaction. Guo, Juchen, et al. J.
Am. Chem. Soc. : s.n., 2012.
54. One-pot pyrolysis of lithium sulfate and graphene nanoplatelet aggregates: in situ formed Li2S/ graphene
composite for lithium–sulfur batteries. Li, Zhe, et al. 2015, Nanoscale.
55. Facile synthesis of Li2S–polypyrrole composite structures for high-performance Li2S cathodes. Seh,
Zhi Wei, et al. 2013, Energy Environ. Sci.
56. Li-S Batteries with Li2S Cathodes and Si/C Anodes. Jha, Himendra, et al. 9, 2015, J.
Electrochem. Soc., Vol. 162, pp. A1829 - A1835.
57. New Nanostructured Li2S/Silicon Rechargeable Battery with High Specific Energy. Yang, Yuan,
et al. 4, 2010, Nano Lett., Vol. 10, pp. 1486 - 1491.

143
58. Si/Li2S Battery with Solvate Ionic Liquid Electrolyte. Li, Zhe, et al. 11, 2016, Electrochem.,
Vol. 84, pp. 887 - 890.
59. A Lithium-Ion Sulfur Battery Based on a Carbon-Coated Lithium-Sulfide Cathode and an
Electrodeposited Silicon-Based Anode. Agostini, M., et al. 14, 2014, ACS Appl. Mater. Interfaces,
Vol. 6, pp. 10924 - 10928.
60. Lithium metal anodes for rechargeable batteries. Xu, Wu, et al. 2014, Energy Environ. Sci, Vol.
7, pp. 513 - 537.
61. Inhibition of Lithium Dendrites by Fumed Silica-Based Composite Electrolytes. Zhang, Xiang-Wu,
et al. 8, 2004, J. Electrochem. Soc., Vol. 151, pp. A1257 - A1263.
62. Understanding abnormal potential behaviors at the 1st charge in Li2S cathode material for rechargeable
Li–S batteries. Jung, Yongjo and Kang, Byoungwoo. 31, 2016, Phys. Chem. Chem. Phys.,
Vol. 18, pp. 21500 - 21507.
63. Liquid electrolyte based on lithium bis-fluorosulfonyl imide salt: Aluminum corrosion studies and lithium
ion battery investigations. Abouimrane, A., Ding, J. and Davidson, I. J. 1, 2009, J Power
Sources, Vol. 189, pp. 693 - 696.
64. Analysis of the solid electrolyte interphase formed with an ionic liquid electrolyte for lithium-sulfur
batteries. Xiong, Shizhao, et al. 2014, J. Power Sources, Vol. 252, pp. 150 - 155.
65. Lithium-Sulfur Cells: The Gap between the State-of-the-Art and the Requirements for High Energy
Battery Cells. Hagen, Markus, et al. 16, 2015, Adv. Energy Mat., Vol. 5.
66. Kodas, Toivo T and Hampden-Smith, Mark J. Aerosol Processing of Materials. s.l. :
Wiley-VCH, 1999.
67. On the mechanism of catalysis of the Boudouard reaction by alkali-metal compounds. Rao, Y. K.,
Adjorlolo, A. and Haberman, J. H. 1982, Carbon, pp. 20(3), 207-212.
144
68. Thermal and carbothermic decomposition of Na2CO3 and Li2CO3. Kim, Jong-Wan and Lee,
Hae-Geon. 2001 Vol. 32 Issue 1, Metallurgical and Materials Transactions B, pp. 17-24.
69. Electrochemical performance of lithium–sulfur batteries based on a sulfur cathode obtained by H2S gas
treatment of a lithium salt. Dressel, Carina B., et al. 2016, J. Power Sources, pp. (307) 844-848.
70. Reed, Thomas B. Free Energy of Binary Compounds. Cambridge, MA : MIT Press, 1971.
71. Table of Acids and Base Strength. Dalton Research Group, Dept. of Chem.
[Online] 4 4, 2017. http://depts.washington.edu/eooptic/links/acidstrength.html.
72. Greenwood, Norman N. and Earnshaw, Alan. Chemistry of the Elements.
Oxford : Pergamon Press, 1984, pp. 97-99.
73. A Long-Life, High-Rate Lithium/Sulfur Cell: A Multifaceted Approach to
Enhancing Cell Performance. Song, Min-Kyu, Zhang, Yuegang and Cairns, Elton J.
2013, ACS Nano Letters.
74. A Hierarchical Particle–Shell Architecture for Long-Term Cycle Stability of Li2S
Cathodes. Wu, Feixiang, et al. 2015, Adv. Mater. Mater. Views, pp. (27) 5579-5586.
75. Mujumdar, Arun. Handbook of Industrial Drying. s.l. : CRC Press, 2015, 4th Ed.
76. Ceramic Powder Synthesis by Spray Pyrolysis. Jayanthi, Gopal, Zhang, Shi-Chang
and Messing, Gary L. s.l. : J. of A, 1996, J. Am. Ceramics Soc., pp. (73) 2707-2726.
77. Optimization of the synthesis conditions of LiCoO2 for lithium secondary battery
by ultrasonic spray pyrolysis process. Kwan Young Choia, Ki Do Kima, Ji Won Yang.
1, s.l. : J. Material Processing Technology, 2006, Vol. 171.
145
78. Fabrication of LiCoO2 thin film cathodes for rechargeable lithium battery by
electrostatic spray pyrolysis. C.H. Chen, A.A.J. Buysman, E.M. Kelderm J.
Schoonman. s.l. : Solid State Ionics, 1995, Vol. 80.
79. Synthesis of Lithium-Cobalt Oxide Nanoparticles by Flame Spray Pyrolysis. Hee
Jang, Chun Seong, Yong Suh, Heon Kim & Churl Lee. 10, s.l. : Aerosol Science and
Technology, 2004, Vol. 38.
80. Thin-film cathodes for secondary lithium batteries. P. Fragnaud, R. Nagarajan,
D.M. Schleich, D. Vujic. 2, s.l. : J. Power Sources, 1995, Vol. 54.
81. Characterization of sprayed and sputter deposited LiCoO2 thin films for
rechargeable microbatteries. P. Fragnaud, T. Brousse, D.M. Schleich. 2, s.l. : J.
Power Sources, 1996, Vol. 63.
82. Unique porous LiCoO2 thin layers prepared by electrostatic spray deposition. C.
H. Chen, E. M. Kelder, J. Schoonman. 20, s.l. : J. Material Science, 1996, Vol. 31.
83. Effects of ratios of Li2MnO3 and Li(Ni1/3Mn1/3Co1/3)O2 phases on the
properties of composite cathode powders in spray pyrolysis. Mun Yeong Son, Young
Jun Hong, Seung Ho Choi, Yun Chan Kang. 30, s.l. : Electrochimica Acta, 2013, Vol.
103.
84. Synthesis of spherical LiMn2O4 microparticles by a combination of spray
pyrolysis and drying method. Izumi Taniguchi, Norifumi Fukuda, Muxina
Konarova. 3, s.l. : Powder Technology, 2008, Vol. 181.
85. Novel Lithium-Ion Cathode Materials Based on Layered Manganese Oxides. B.
Ammundsen, J. Paulsen. 12-13, s.l. : Advanced Materials, 2001, Vol. 13.
86. Nanocrystalline LiMn2O4 thin film cathode material prepared by polymer spray
pyrolysis method for Li-ion battery. S.N. Karthick, S. Richard Prabhu Gnanakan, A.
Subramania, Hee-Je Kim. 2, s.l. : J. Alloys and Compounds, 2010, Vol. 489.
146
87. Particle morphology and electrochemical performances of spinel LiMn2O4
powders synthesized using ultrasonic spray pyrolysis method. I Taniguchi, C.K Lim,
D Song, M Wakihara. 3-4, s.l. : Solid State Ionics, 2002, Vol. 146.
88. Relationship between the electrochemical and particle properties of LiMn2O4
prepared by ultrasonic spray pyrolysis. K. Matsuda, I. Taniguchi. 1-2, s.l. : J. Power
Sources, 2004, Vol. 132.
89. Yolk–shelled cathode materials with extremely high electrochemical
performances prepared by spray pyrolysis. Seung Ho Choi, Young Jun Hong, Yun
Chan Kang. 17, s.l. : Nanoscale, 2013, Vol. 5.
90. Preparation and electrochemical characteristics of spherical spinel cathode
powders via an ultrasonic spray pyrolysis process. Chung-Hsin Lu, Tai-Yuan Wu,
Hung-Chun Wu, Mo-Hua Yang, Zheng-Zhao Guo, Izumi Taniguchi. 1, s.l. : Mater.
Chem. and Phys., 2008, Vol. 112.
91. Spray pyrolysis synthesis of nanostructured LiFexMn2−xO4 cathode materials for
lithium-ion batteries. Izumi Taniguchi, Zhumabay Bakenov. 2, s.l. : Powder
Technology, 2005, Vol. 159.
92. Effects of synthesis condition on LiNi1/2Mn3/2O4 cathode material for prepared
by ultrasonic spray pyrolysis method. S.-H. Park, S.-W. Oh, S.-T. Myung, Y.C. Kang,
Y.-K. Sun. 5-6, s.l. : Solid State Ionics, 2005, Vol. 176.
93. Electrochemical properties of LiM1/6Mn11/6O4 (M = Mn, Co, Al and Ni) as
cathode materials for Li-ion batteries prepared by ultrasonic spray pyrolysis method.
I. Taniguchi, D. Song, M. Wakihara. 2, s.l. : J. Power Sources, 2002, Vol. 109.
94. Preparation of carbon coated LiFePO4 by a combination of spray pyrolysis with
planetary ball-milling followed by heat treatment and their electrochemical
properties. Konarova, Muxina and Taniguchi, Izumi. 2009, Powder Technology, pp.
(191) 111-116.
147
95. Preparation of LiFePO4/C composite powders by ultrasonic spray pyrolysis
followed by heat treatment and their electrochemical properties. Muxina Konarova,
Izumi Taniguchi. 12, s.l. : Materials Research Bulletin, 2008, Vol. 43.
96. Physical and electrochemical properties of LiFePO4 nanoparticles synthesized by
a combination of spray pyrolysis with wet ball-milling. Muxina Konarova, Izumi
Taniguchi. 2, s.l. : J. Power Sources, 2009, Vol. 194.
97. New approach for synthesis of carbon-mixed LiFePO4 cathode materials. K.
Konstantinov, S. Bewlay, G.X. Wang, M. Lindsay, J.Z. Wang, H.K. Liu, S.X. Dou, J.-
H. Ahn. 2-3, s.l. : Electrochimica Acta, 2004, Vol. 50.
98. LiFePO4/C cathode powders prepared by spray pyrolysis from the colloidal spray
solution containing nano-sized carbon black. Seo Hee Ju, Yun Chan Kang. 2-3, s.l. :
Materials Chem. and Phys., 2008, Vol. 107.
99. LiFePO4/carbon cathode materials prepared by ultrasonic spray pyrolysis. Mu-
Rong Yang, Tsung-Hsien Teng, She-Hung Wu. 1, s.l. : J. Power Sources, 2006, Vol.
159.
100. Electrochemical properties of LiNi0.8 Co0.2−x Alx O2 (0≤x≤0.1) cathode
particles prepared by spray pyrolysis from the spray solutions with and without
organic additives. S. H. Ju, J. H. Kim, Y. C. Kang. 2, s.l. : Metals and Materials
International, 2010, Vol. 16.
101. Ceramic Powder Synthesis by Spray Pyrolysis. Messing, G., Zhang, S. and
Jayanthi, G. 1993, J. Am. Ceram. Soc.
102. Aerosol-based self-assembly of nanoparticles into solid or hollow mesospheres.
Wu, C., Lee, D. and Zachariah, M. R. 2010, Langmuir : the ACS journal of surfaces
and colloids, pp. 26(6), 4327-4330.
148
103. Aerosol assisted synthesis of hierarchical tin–carbon composites and their
application as lithium battery anode materials. Guo, Juchen, Yang, Zichao and
Archer, Lyden A. 2013, J. Mater. Chem. A, Vol. 1, pp. 8710 - 8715.
104. Porous Carbon Powders Prepared by Ultrasonic Spray Pyrolysis. Skrabalak, Sara
E. and Suslick, Kenneth S. 39, 2006, J. Am. Chem. Soc., Vol. 128, pp. 12642-12643.
105. Nanostructured carbons prepared by ultrasonic spray pyrolysis. Fortunato,
Maria E., Rostam-Abadi, Massoud and Suslick, Kenneth S. 5, 2010, Chem. of Mater.,
Vol. 22, pp. 1610-1612.
106. A highly ordered nanostructured carbon–sulphur cathode for lithium–sulphur
batteries. Ji, Xiulei, Lee, Kyu Tae and Nazar, Linda F. 2009, Nature Mater., Vol. 8,
pp. 500 - 506.
107. Sulfur–mesoporous carbon composites in conjunction with a novel ionic liquid
electrolyte for lithium rechargeable batteries. Wang, J., et al. 2, 2008, Carbon, Vol. 46,
pp. 229 - 235.
108. Optimization of mesoporous carbon structures for lithium–sulfur battery
applications. Li, Xiaolin, et al. 41, 2011, RSC J. of Mater. Chem, Vol. 21, pp. 16603 -
16610.
109. Encapsulating Sulfur into Hierarchically Ordered Porous Carbon as a High-
Performance Cathode for Lithium–Sulfur Batteries. Ding, Bing, et al. 3, 2013, Chem.
- A European J., Vol. 19, pp. 1013 - 1019.
110. Hydrothermal nanocasting: Synthesis of hierarchically porous carbon monoliths
and their application in lithium–sulfur batteries. Yu, Linghui, et al. 2013, Carbon,
Vol. 61, pp. 245 - 253.
149
111. Enhancement of long stability of sulfur cathode by encapsulating sulfur into
micropores of carbon spheres. Zhang, B., et al. 10, 2012, Energy Environ. Sci., Vol. 3,
pp. 1531 - 1537.
112. The Isotope Effect II, Pyrolysis of Lithium Acetate 1-C14. Arthur Roe, J. B.
Finlay. 9, s.l. : J. Am. Chem. Soc., 1952, Vol. 74.
113. Liquid electrolyte lithium/sulfur battery: Fundamental chemistry, problems, and
solutions. Zhang, Sheng S. 2013, J. Power Sources, pp. (231) 153-162.
114. Nonaqueous Liquid Electrolytes for Lithium-Based Rechargeable Batteries. Xu,
Kang. 2004, ACS Chem. Rev., pp. 104 (10) 4303-4418.
115. In Situ Formation of Protective Coatings on Sulfur Cathodes in Lithium
Batteries with LiFSI-Based Organic Electrolytes. Kim, Hyea, et al. 2015, Advanced
Energy Materials, p. 5 (6).
116. Restricting the Solubility of Polysulfides in Li-S Batteries Via Electrolyte Salt
Selection. Chen, Junzheng, et al. 2016, Adv. Energy Mat., pp. (6), 1600160.
117. Effect of chemical reactivity of polysulfide toward carbonate-based electrolyte on
the electrochemical performance of Li-S batteries. Yim, Taeeun, et al. 2013,
Electrochimica Acta, pp. (107) 454-460.
118. Ionic liquid-enhanced solid state electrolyte interface (SEI) for lithium–sulfur
batteries. Zheng, Jianming, et al. 2013, J. Mater. Chem. A, pp. (1) 8464-8470.
119. Effect of LiNO3 and Pyrrolidinium ionic liquid on the solid electrolyte
interphase in the lithium-sulfur battery. Barghamadi, Marzieh, et al. 2015, J. Power
Sources, pp. (295) 212-220.
150
120. Maples, R. E. PetroleumRefinery Process Economics. Tulsa, Oklahoma :
PennWell, 2000.
121. Properties of surface film on lithium anode with LiNO 3 as lithium salt in
electrolyte solution for lithium-sulfur batteries. Xiong, S., et al. 2012, Electrochimica
Acta, pp. (83), 78-86.
122. On the surface chemical aspects of very high energy density, rechargeable Li-
sulfur batteries. Aurbach, D., et al. 2009, J. Electrochem. Soc., pp. (156, 8) A694-A702.
123. The electrochemical performance of lithium–sulfur batteries with LiClO4
DOL/DME electrolyte. Wang, Weikun, et al. 2010, J. Appl. Electrochem, pp. (40)
321-325.
124. Improved Cyclability of Liquid Electrolyte Lithium/Sulfur Batteries by
Optimizing Electrolyte/Sulfur Ratio. Zhang, Sheng S. 2012, Energies, pp. 5(12), 5190-
5197.
125. Lithium-sulfur batteries. Nazar, Linda F., Cuisinier, Marine and Pang, Quan.
2014, MRS Bulletin, pp. (39) 436-442.
126. Insight on the Li2S electrochemical process in a composite configuration
electrode. Carbone, Lorenzo, et al. 3, 2016, New J. Chem., Vol. 40, pp. 2935 - 2943.
127. A proof-of-concept lithium/sulfur liquid battery with exceptionally high capacity
density. Zhang, Sheng S. and Tran, Dat T. 2012, J. Power Sources, pp. (211) 169-172.
128. Lithium/Sulfur Cell Discharge Mechanism: An Original Approach for
Intermediate Species Identification. Barchasz, Céline, et al. 2012, Anal. Chem., pp.
(9), 3973-3980.
151
129. A highly ordered nanostructured carbon–sulphur cathode for lithium-sulphur
batteries. Ji, Xiulei, Lee, Kyu Tae and Nazar, Linda F. 2009, Nature Mater., Vol. 8.
130. In situ synthesis of lithium sulfide–carbon composites as cathode materials for
rechargeable lithium batteries. Zichao, Yang, et al. 2013, J. Mater. Chem. A., pp. (1)
1433-1440.
131. New insight into working mechanism of Lithium/Sulfur batteries: in situ and
operando X-ray diffraction characterization. Waluś, Sylwia, et al. 2013, RSC Chem.
Comm., pp. (49.72) 7899-7901.
132. Graphene–Li2S–Carbon Nanocomposite for Lithium–Sulfur Batteries. Wu,
Feixiang, et al. 2016, ACS Nano, pp. (1) 1333-1340.
133. Durable Carbon-Coated Li2S Core–Shell Spheres for High Performance
Lithium/Sulfur Cells. Nan, Caiyun, et al. 2014, J. Amer. Chem. Soc., pp. (12) 4659-
4663.
134. Stable lithium electrodeposition in liquid and nanoporous solid electrolytes. Lu,
Yingying, Tu, Zhengyuan and Archer, Lynden A. 2014, Nature Mater., Vol. 13, pp.
961-969.
135. Stable Cycling of Lithium Metal Batteries Using High Transferece Number
Electrolytes. Lu, Yingying, et al. 2015, Adv. Energy Mater. Mater. Views, p. 1402073.
136. Dendrite-free Li deposition using trace-amounts of water as an electrolyte
additive. Qian, Jiangfeng, et al. 2015, Nano Energy, pp. 135-144.
137. Regulating Li deposition at artificial solid electrolyte interphases. Fan, Lei, et al.
2017, RSC J. Mater. Chem. A, Vol. 5, pp. 3483-3492.
152
138. High voltage LIB cathodes enabled by salt-reinforced liquid electrolytes. Lu,
Yingying, et al. 2015, Electrochem. Comm., Vol. 51, pp. 23-26.
139. Design principles for electrolytes and interfaces for stable lithium-metal
batteries. Tekikar, Mukul, et al. 2016, Nature Energy, Vol. 1, p. 16114.
140. Lithium Fluoride Additives for Stable Cycling of Lithium Batteries at High
Current Densities. Choudhury, Snehashis and Archer, Lynden A. 2016, Advanced
Electronic Mater.
141. Stable lithium electrodeposition in salt-reinforced electrolytes. Lu, Yingying, et
al. 2015, J. Power Sources, Vol. 279, pp. 413-418.
142. High rate and stable cycling of lithium metal anode. Qian, Jiangfeng, et al. 6,
2015, Nature Comm., p. 6362.
143. Stabilized Lithium−Metal Surface in a Polysulfide-Rich Environment of
Lithium−Sulfur Batteries. Zu, Chenxi and Manthiram, Arumugam. 2014, ACS J.
Phys. Chem. Lett., pp. 2522-2527.
144. Polysulfide dissolution control: the common ion effect. Shin, Eon Sung, et al.
2013, Chem. Commun., Vol. 49, pp. 2004-2006.
145. In Situ Formation of Protective Coatings on Sulfur Cathodes in Lithium
Batteries with LiFSI-Based Organic Electrolytes. Kim, Hyea, et al. 2014, Adv. Energy
Mater.
146. High capacity of lithium-sulfur batteries at low electrolyte/sulfur ratio enabled
by an organosulfide containing electrolyte. Chen, Shuru, et al. 2017, Nano Energy,
pp. (31), 418-423.
153
147. A highly efficient polysulfide mediator for lithium–sulfur batteries. Liang, Xiao,
et al. 2015, Nature Comm., Vol. 6:5682.
148. Moving to a Solid-State Configuration: A Valid Approach to Making Lithium-
Sulfur Batteries Viable for Practical Applications. Hassoun, Jusf and Scrosati, Bruno.
2010, Adv. Mater., Vol. 22, pp. 5198 - 5201.
149. All-solid-state lithium–sulfur batteries based on a newly designed
Li7P2.9Mn0.1S10.7I0.3 superionic conductor. Xu, Ruo-chen, et al. 13, 2017, J. Mater.
Chem. A, Vol. 5, pp. 6310 - 6317.
150. Alternative Strategy for a Safe Rechargeable Battery. Braga, M. H., et al. 1, 2017,
ENergy Environ. Sci., Vol. 10, pp. 331 - 336.
151. Changing Outlook for Rechargeable Batteries. Goodenough, John B. 2, 2016,
ACS Catal., Vol. 7, pp. 1132 – 1135.
152. The Phenomena of Rupture and Flow in Solids. Griffith, A. A. 1922,
Philosophical Transactions of the Royal Society of London. Series A, Containing
Papers of a Mathematical or Physical Character, pp. (221) 163-198.
153. Development and costs calculation of lithium-sulfur cells with high sulfur load
and binder free electrodes. Hagen, M., et al. 2013, J. Power Sources, pp. (224) 260-
268.
154. Papoulis, Athanasios and Pillai, S. Unnikrishna. Probability, Random Variables,
an Stochastic Processes. s.l. : McGraw-Hill Europe, 2002.
155. Dean, J. A. Lange's Handbook of Chemistry, 3rd Ed. New York : McGraw-Hill,
1985.
154
156. Role of carbon porosity and ion size in the development of ionic liquid based
supercapacitors. Lazzari, M., et al. 2010, J. Electrochem. Soc., pp. (158) A22-A25.
157. The electrochemical performance of lithium–sulfur batteries with LiClO4
DOL/DME electrolyte. Wang, Weikun, et al. 2010, J. Appl. Electrochem., pp. (40)
321-325.
158. Lithium and sodium battery cathode materials: computational insights into
voltage, diffusion and nanostructural properties. Islam, M. Saiful and Fisher, Craig
A. J. 2014, Chem. Soc. Rev., pp. (43) 185-204.
159. Improved Performance of the Silicon Anode for Li-Ion Batteries: Understanding
the Surface Modification Mechanism of Fluoroethylene Carbonate as an Effective
Electrolyte Additive. Xu, Chao, et al. 2015, J. Chem. Mater., pp. (27) 2591-2599.
160. On the Surface Chemical Aspects of Very High Energy Density Rechargeable
Li-Sulfur Batteries. Aurbach, Doron, et al. 2009, J. Electrochem. Soc., pp. 156 (8)
A694-A702.
161. Pyrrolidinium Imides: A New Family of Molten Salts and Conductive Plastic
Crystal Phases. MacFarlane, D. R., et al. 1999, J. Phys. Chem. B, pp. (103) 4164-4170.
162. Recent developments in the ENEA lithium metal battery project. Shin, J. H., et
al. 2005, Electrochimica Acta, pp. (50) 3859-3865.
163. Functional Inorganic Materials: From Precursors to Applications. Jin Ho Bang,
Yuri T. Didenko, Richard J. Helmich, Kenneth S. Suslick. s.l. : Material Matters,
Aldrich Material Science, 2012.
164. High-Capacity Micrometer-Sized Li2S Particles as Cathode Materials for
Advanced Rechargeable Lithium-Ion Batteries. Yang, Yuan, et al. 2012, J. Am.
Chem. Soc., Vol. 134, pp. 15387 - 15394.