Anisotropic diffusion of energetic particles in galactic and ...
Upload
khangminh22Category
view
0download
0
Study of the aerodynamic and energetic
impact of the solar panel’s installation on
a commercial plane’s wing
Content: Report
Author: Nil Barcons Ventura
Director: Santiago Bogarra Rodríguez
Co-director: David Del Campo Sud
Degree: Grau en Enginyeria en Vehicles Aeroespacials
Release date: 10/1/2018
Announcement (convocatòria): 2017/2018 - 1

10/1/2018
i
Abstract The purpose of this study is to determine the feasibility of installing solar panels on a commercial
aircraft. In order to achieve this objective, energetic and aerodynamic analysis have been
developed to quantify the environmental and economic benefits of the installation.
Several stages have been required before reaching the results. First of all, an exhaustive
evaluation of the solar market has been carried out to select the photovoltaic technology that
best suits the demands claimed by this installation. Then, the energetic analysis has been
performed to determine the production capacity of the photovoltaic system on the aircraft. In
addition, a reference flight has been established to compare the energy produced by the
photovoltaic system contrasted with the energy needs of the plane. The aerodynamic analysis
has examined the effects caused by the geometry alteration of the installation, guaranteeing
that the energy gain eclipses the predictably small aerodynamic loss. Finally, all these results
have been assembled to determine the economic and environmental impact of the installation.

10/1/2018
ii
Acknowledgements I am very thankful to my tutors and advisors, Prof. Santiago Bogarra Rodrigez and Prof. David
Del Campo Sud, who have guided, supported and encouraged me during the development of
this study. In addition, I must thank Mr. Oscar Aceves for his unconditional help when I was in
need. The three of them have provided me with their extended knowledge in their respective
professional areas of electrics, aerodynamics and photovoltaics. Whenever I doubted, they
showed me the way and whenever I required some specific data, they gave me the key to find
the information.
I would also like to thank my family for their support. Without them I would be a lesser person.
In addition, I am grateful to my cherished girlfriend, who is always giving me energies wherever
she is to ensure I progress in every aspect of my life. Without her I couldn’t smile and feel alive.
Finally, I greatly appreciate the good times with my friends, who have been the best method to
unwind and relax from the work. They have channelled my energy recovery in every break I’ve
made.
So, to all of you and once again, thank you very much for your help.

10/1/2018
iii
vii
x
xi
xiii
1
1
2
3
4
4
4
4
6
6
8
9
10
10
11
11
13
14
14
15
16
16
17
17
17
Table of contents List of figures……………………………………………………………………………………………………………….
List of tables…………………………………………………………………………………………………………………
List of Abbreviations………………………………………………………………………………………………………
List of Equations……………………………………………………………………………………………………………………..
1 Introduction………………………………………………………………………………………………………….….
1.1 Population and degradation growths………………………………………………………………
1.2 Commercial aviation evolution and emissions………………………………………………….
1.3 PV systems on commercial aircrafts………………………………………………………………..
2 What are solar panels? ……………………………………………………………………………………………
2.1 Functioning of solar cells……………………………………………………………………………….
2.1.1 The photovoltaic effect……………………………………………………………………….
2.1.2 How does a solar cell generate an electrical field? …………………………………….
2.2 Solar panel internal structure…………………………………………………………………………
2.2.1 Layers list and description……………………………………………………………………
2.3 Solar panel external structure…………………………………………………………………………
2.4 Complementary elements………………………………………………………………………………
2.5 Basic solar power concepts……………………………………………………………………………
2.5.1 Air mass and solar spectrum…………………………………………………………………
2.5.2 Solar irradiance and solar constant…………………………………………………………
2.5.3 Solar insolation………………………………………………………………………………….
2.5.4 Daylight hours……………………………………………………………………………………
2.5.5 Temperature conditions………………………………………………………………………
2.5.6 Standard Test Conditions…………………………………………………………………….
2.5.7 How much power does a solar panel produce?.…………………………………………
3 State of the art of solar panels…………………………………………………………………………………
3.1 Evolution……………………………………………………………………………………………………..
3.2 Solar markets……………………………………………………………………………………………….
3.2.1 Specialized market…………………………………………………………………………….
3.2.2 Mass market…………………………………………………………………………………….
10/1/2018
iv
18
20
21
22
23
24
24
24
24
25
26
26
27
27
29
31
31
32
32
33
33
34
35
36
36
38
38
39
40
40
3.3 Types of technologies……………………………………………………………………………………
3.3.1 Junction Cells……………………………………………………………………………………
3.3.2 Crystalline Silicon Cells………………………………………………………………………..
3.3.3 Thin-Film technology………………………………………………………………………….
3.3.4 Emerging PV…………………………………………………………………………………….
4 State of the art of sun-powered aircrafts…………………………………………………………………
4.1 Sun-powered aircrafts history…………………………………………………………………………
4.1.1 Solar One…………………………………………………………………………………………
4.1.2 Gossamer Penguin and Solair 1…………………………………………………………….
4.1.3 Sunseeker………………………………………………………………………………………..
4.1.4 Icaré II…………………………………………………………………………………………….
4.1.5 Helios………………………………………………………………………………………………
4.2 Solar Impulse……………………………………………………………………………………………….
4.2.1 Solar Impulse 2 aerodynamics ………………………………………………………………
4.2.2 Solar impulse 2 design features…………………………………………………………….
5 PV technology selection……………………………………………………………………………………………
5.1 Solar panels dimensions………………………………………………………………………………..
5.1.1 Mass market………………........................................................................
5.2.2 Specialized market………………................................................................
5.2 Characteristics evaluated in the selection……………………………………………………….
5.2.1 Essential characteristics………………………………………………………………………
5.2.2 Variable characteristics………………………………………………………………………..
5.2.3 Discarded technologies……………………………………………………………………….
5.3 Selected technology and product……………………………………………………………………
5.3.1 Maxeon Gen III specific characteristics……………………………………………………
5.3.2 Operating features of Maxeon Gen III…………………………………………………….
5.3.3 Dimensions of Maxeon Gen III………………………………………………………………
6 Airbus A320……………………………………………………………………………………………………………..
6.1 A320 vs Solar Impulse 2……………………………………………………………………………….
6.1.1 Numerical comparison………………………………………………………………………..

10/1/2018
v
42
43
43
45
45
48
49
49
51
51
51
52
52
53
53
53
54
56
57
59
59
62
62
63
65
65
65
66
66
70
6.1.2 Chapter conclusions…………………………………………………………………………..…
7 Adapting PV systems on A320……………………………………………………………………………………
7.1 PV adaptation analysis on A320………………………………………………………………………
7.2 Determining Maxeon Gen III panel design ………………………………………………….……
7.2.1 Front sheet material selection………………………………………………………………
7.2.2 Encapsulating material selection……………………………………………………………..
7.2.3 Back sheet material selection………………………………………………………….………
7.3 A320-PV assembly …………………………………………………………………………………….……
8 Electric generation in A320…………………………………………………………………………………………
8.1 APU………………………………………………………………………………………………………………
8.1.1 Functions on the ground……………………………………………………………………….
8.1.2 Functions during take-off………………………………………………………………………
8.1.3 Functions in flight…………………………………………………………………………….....
8.2 GPU………………………………………………………………………………………………………………
8.3 CFM56…………………………………………………………………………………………………………..
8.3.1 Main features……………………………………………………………………………….…….
8.3.2 Principle of functioning…………………………………………………………………………
8.4 Electromagnetic induction of the engine generators…………………………………………..
8.5 Electric system of A320…………………………………………………………………………………….
9 Energetic consumption of A320…………………………………………………………………………………
9.1 Fuel consumption of A320……………………………………………………………………………….
9.1.1 Total fuel calculation…………………………………………………………………………….
9.2 Total A320 energy consumption in the RF………………………………………………………….
9.3 A320 electric consumption in the RF…………..…………………………………………………….
10 MGIII energy generation on A320…….……………………………………………………………
10.1 Factors affecting solar irradiance on a plane ……………………………………………………
10.1.1 Operating temperature……………………………………………………………………….
10.1.2 Air mass and weather……………………………………………………………….…………
10.1.3 Latitude of the flight..………………………………………………………………………….
10.2 Solar irradiance reaching A320 during the reference flight………………………………..

10/1/2018
vi
70
73
74
74
75
76
76
77
77
79
79
83
85
86
87
88
88
88
90
90
92
93
93
94
94
94
95
98
99
101
102
10.2.1 Cruise………………………………………………………………………………………………
10.2.2 TR + taxi…………………………………………………………………………………………….
10.2.3 Climb and descent…………………………………………………………………………….
10.3 Maxeon Gen III energy quantification…………………………………………………………….
10.3.1 TR + taxi………………………………………………………………………………………….
10.3.2 Climb……………………………………………………………………………………………..
10.3.3 Cruise…………………………………………………………………………………………….
10.3.4 Descent…………………………………………………………………………………………..
10.4 Energetic contribution of 1 m2 of SP118 L ………………………………………………………
11 Available A320 surface for Maxeon GIII ………………………………………………………………….
11.1 Wing available surface………………………………………………………………………………….
11.2 Fuselage available surface…………………………………………………………………………….
11.2.1 Fuselage surface up to 30º………………………………………………………………….
11.2.2 Fuselage surface up to 60º……………….…………………………………………………
11.3 Chapter conclusions..……………………………………………………………………………………
12 PV installation impact on A320……………………………………………………………………………….
12.1 Aerodynamic impact……………………………………………………………………………………
12.1.1 Reference airfoil profile ……………………………………………………………………..
12.1.2 Simulation main characteristics……………………………………………………………
12.1.3 Comparative aerodynamic results………………………………………………………….
12.2 Energetic impact………………………………………………………………………………………….
12.2.1 A320 electric consumption over total consumption…………………………………..
12.2.2 PV electric contributions in A320…………………………………………………………..
12.3 Environmental impact……………………………………………………………………………………
12.4 Economic impact………………………………………………………………………………………….
12.4.1 Installation cost………………………………………………………………………………….
12.4.2 Installation payback time…………………………………………………………………….
13 Results analysis…………………………………………………………………………………………………………
14 Conclusions……………………………………………………………………………………………………………….
15 Future work…………………………………………………………………………………………………………….
Bibliography…………………………………………………………………………………………………………………

10/1/2018
vii
1
2
3
5
5
5
5
6
8
9
10
12
12
12
13
13
16
16
19
21
21
22
23
List of figures Figure 1. Population growth over the last 220 years according to Worldometers……………………..
Figure 2. CO2 emissions from 1850 until 2030. Extracted from C2ES…………………………………………
Figure 3. Energy use distribution in the transport sector. Obtained from the Federal
aviation administration.……………………………………………………………………………………………………………
Figure 4. Holes moving from P to N.………………………………………………………………………………………….
Figure 5. Electrons moving from N to P.……………………………………………………………………………………
Figure 6. Free charges diffusion near boundary………………………………………………………………………..
Figure 7. Electrical field appearance………………………………………………………………………………………….
Figure 8. Layers distribution around the cell. Extracted from Sinovoltaics………………………………..
Figure 9. Solar panel surface organization……………………………………………………………………………….
Figure 10. Scheme of the electric distribution net. Image extracted from Solardirect……………….
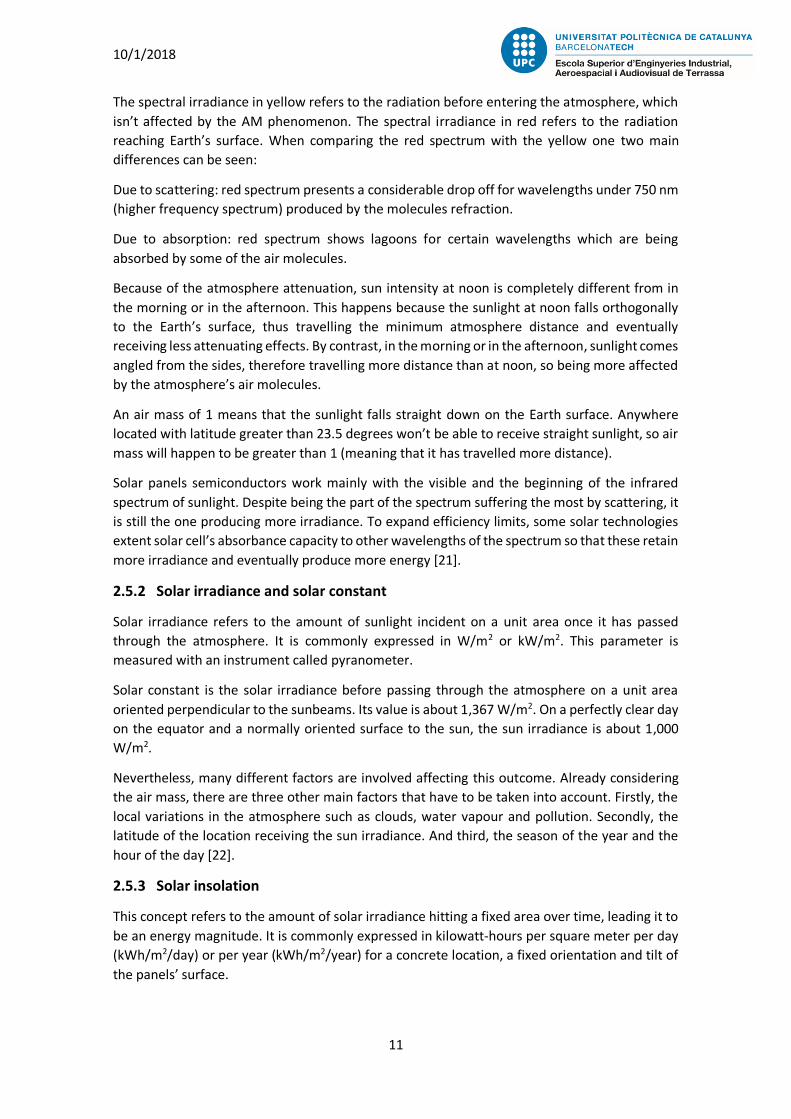
Figure 11. Solar radiation spectrum. In yellow, at the top of the atmosphere. In red, at sea level.
Image extracted from Globalspec.…………………………………………………………………………………………….
Figure 12. Yearly mean of solar insulation over the whole surface. Calculated in W/m2. Image
obtained from Karin Kritzinger’s Industrial and Commercial Use of Energy conference…………….
Figure 13. Angled irradiance effect.………………………………………………………………………………………….
Figure 14. Air Mass angular variation………………………………………………………………………………………..
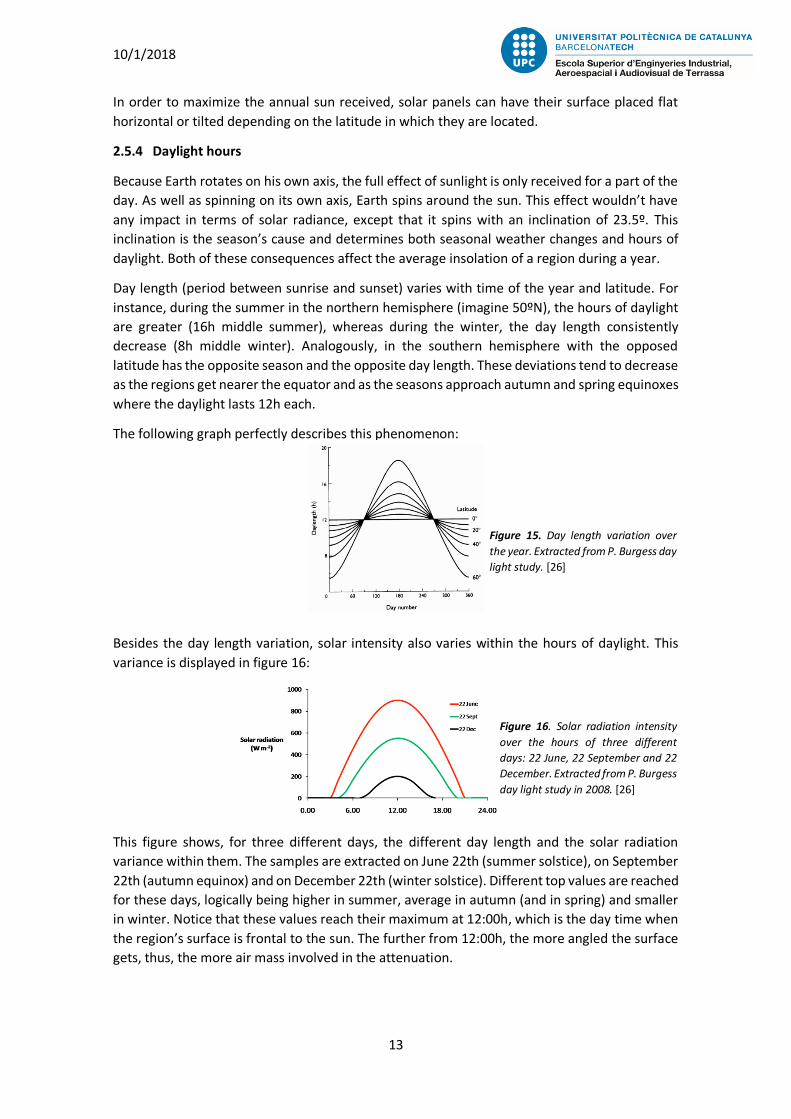
Figure 15. Day length variation over the year. Extracted from P. Burgess day light study…………
Figure 16. Solar radiation intensity over the hours of three different days: 22 June, 22 September
and 22 December. Extracted from P. Burgess day light study in 2008……………………………………….
Figure 17. Vanguard I. First solar powered satellite………………………………………………………………....
Figure 18. Yearly cumulative PV capacity in MW. Extracted from European photovoltaic Industry
association……………………………………………………………………………………………………………………………….
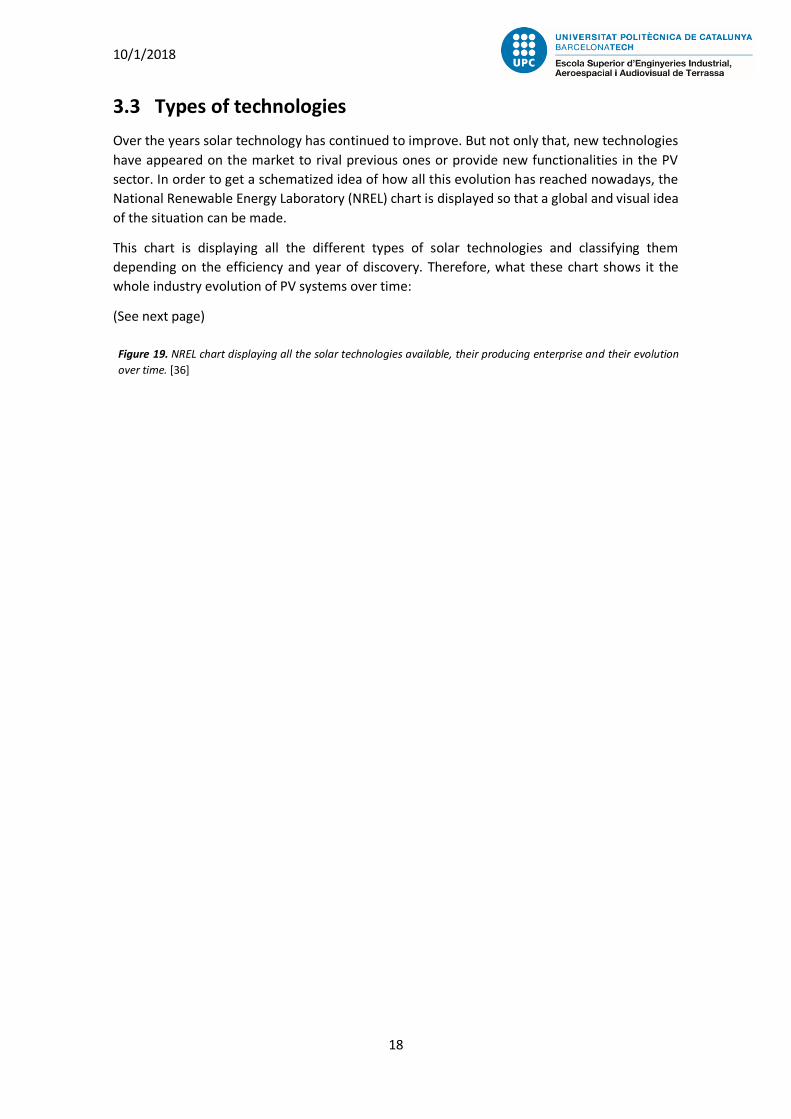
Figure 19. NREL chart displaying all the solar technologies available, their producing enterprise
and their evolution over time…………………………………………………………………………………………………..
Figure 20. Monocrystalline silicon solar panel. Image extracted from BSP………………………………..
Figure 21. Polycrystalline silicon solar panel………………………………………………………………………...…..
Figure 22. Thin-Film solar panel………………………………………………………………………………………………..
Figure 23. Organic solar cell. Extracted from j-net21………………………………………………………………..

10/1/2018
viii
24
25
25
25
26
26
27
29
36
36
37
37
38
39
42
43
45
46
46
49
52
54
54
54
55
Figure 24. Solar One, the world’s first solar aircraft to fly………………………………………………………….
Figure 25. Solar Challenger flying over the sea. Image extracted from soliclima………………………..
Figure 26. Solair 1 museum exposed. Image obtained from ABpic…………………………………………….
Figure 27. Sunseeker landed on an arid surface. Image obtained from solar-flight……………………
Figure 28. Icaré II flying over green fields. Image obtained from icare-solar………………………………
Figure 29. Helios flying over the sea. Image obtained from blogspot…………………………………………
Figure 30. Solar impulse cofounders André Borschberg and Bertrand Piccard with Solar Impulse
2 in the background.………………………………………………………………………………………………………………….
Figure 31. Solar impulse 2 special features location and description.………………………………………..
Figure 32. Slogan of SunPower enterprise…………………………………………………………………………………
Figure 33. Chart extracted from 3rd Generation Maxeon technical sheet. Efficiency comparison
between the common market products..………………………………………………………………………………….
Figure 34. 3rd Generation Maxeon solar cell flexibility demonstration……………………………………….
Figure 35. Chart extracted from 3rd Generation Maxeon technical sheet. Spectral response
comparison between SunPower Maxeon solar cell and conventional solar cells……………………….
Figure 36. 3rd Generation Maxeon dimensions in mm….……………………………………………………………
Figure 37. Airbus A320 external view.……………………………………………………………………………………….
Figure 38. Fuselage applicable surface dimensions. Adapted from the figures in annex E………….
Figure 39. 3rd Generation Maxeon solar cell applications. Images extracted from Sunpower and
Solbian official sites.………………………………………………………………………………………………………………….
Figure 40. Light transmission comparison between toughened glass, ETFE and FEP………………….
Figure 41. Power capacity factors of solar panels using ETFE or FEP front sheets……………………..
Figure 42. Solar transmittance degradation over time of FEP and toughened glass…………………..
Figure 43. PET, PVDF, FEVE and PVF percentage of failures. Results obtained from a global field-
module survey of 71 installations (912,000 modules at 203 MW) in NA, EU and AP. Survey
available upon request………………………………………………………………………………………………………………
Figure 44. APU internal distribution and principles of functioning…………………………………………….
Figure 45. Three views of CFM56-5B6 gradually entering into detail…………………………………………
Figure 46. CFM56-5B6 propeller………………….…………………………………………………………………………….
Figure 47. The 13 CFM56-5B6 core compressors.………………………………………………………………………
Figure 48. CFM56-5B6 combustion chamber……………………………………………………………………………..
10/1/2018
ix
55
55
55
55
56
57
66
67
68
68
69
71
73
79
80
81
83
84
85
89
89
91
91
91
Figure 49. High and low pressure turbines…………………………………………………………………………………
Figure 50. CFM56-5B6 spinning shaft..………………………………………………………………………………………
Figure 51. CFM56-5B6 exhaust assembly…………………………………………………………………………………..
Figure 52. CFM56-5B6 high by-pass turbofan…………………………………………………………………………….
Figure 53. Graphic description of the electromagnetic induction………………………………………………
Figure 54. Schematic view of the electric network inside airbus A320 extracted from FCOM…….
Figure 55. Schematic distribution of the atmosphere………………………………………………………………...
Figure 56. Clouds appearance and distribution according to altitudes……………………………………….
Figure 57. World map displaying yearly flight paths…………………………………………………………………..
Figure 58. Mixture of figures 9 and 43. World map with yearly flight paths and insulation………..
Figure 59. Solar radiation concentration over areas with different inclination…………………………..
Figure 60. Triangle displaying the A320 surface inclination to the sunbeams…………………………….
Figure 61. Zoom of figure 44. In red, Barcelona. In black, London……………………………………………..
Figure 62. A320 wing plan and schematized view. Wing fit chord parameter obtained
from figure 9 in annex 5. Image and rib parameter extracted from Aeroflot…………………………….
Figure 63. A320 wing plan view highlighting outer wing box. Image and rib parameters
extracted from Aeroflot…………………………………………………………………………………………………………….
Figure 64. A320 wing plan view highlighting both wing mean chord and outer wing
box mean chord.……………………………………………………………………………………………………………………….
Figure 65. A320 plan view indicating fuselage length and width. From figure 9 in annex 5………..
Figure 66. A320 plan view indicating fuselage length and width………….…………………………………….
Figure 67. Geometry corresponding to 30 degrees fuselage….…………………………………………………..
Figure 68. Geometry of the airfoil profile Lockheed C-5A BL758.6……………………………………………..
Figure 69. Lockheed C-5A BL758.6 geometry alteration due to the PV installation……………………
Figure 70. Mach velocity contour around the airfoil………………………………………………………………….
Figure 71. Zoom of the Mach velocity contour around the airfoil………………………………………………
Figure 72. Theoretical Cl and Cd curves at Re = 1·106……………….………………………………………………..

10/1/2018
x
22
29
30
38
39
47
59
60
61
63
63
77
90
92
97
98
List of tables Table 1. Features description for each one on of the Thin-Film common materials………………….
Table 2. Solar Impulse 2 main parameters………………………………………………………………………………..
Table 3. Solar Impulse 2 flight data registered during its journey………………………………………….....
Table 4. 3rd Generation Maxeon standard electrical characteristics………………………………………….
Table 5. Airbus A320 general parameters…………………………………………………………………………………
Table 6. FEP and ETFE mechanical properties.………………………………..………………………………………..
Table 7. Climb parameters at FL350 weighting 68 t according to FCOM…………………………………..
Table 8. Cruise parameters at FL350 weighting 66 t according to FCOM……………………………….....
Table 9. Descent parameters at FL350 weighting 65 t according to FCOM……………………………….
Table 10. Engines apparent power output during the different parts of the flight……………………
Table 11. Engines real power output during the different parts of the flight and their respecting
times…………………………………..………………………………..………………………………..………………………………..
Table 12. Power output and energy provided by 1m2 of SP118L for each part of the RF…………..
Table 13. Main features of the simulations carried out…………………………………………………………….
Table 14. Cl and Cd coefficients from XFOIL (theoretical) and the two simulations. ………………...
Table 15. PV economic parameters and payback time for each one of the solutions offered……
Table 16. Compilation of the energetic, environmental and economic PV contributions for each
one of the solutions………………………………………………………………………………………………………………….

10/1/2018
xi
List of Abbreviations A320 Airbus a320-200
AC Alternating current
AM Air mass
APU Auxiliary power unit
BCL Battery charge limiter
BZ Barrier zone
CIGS Copper indium gallium selenide
CPV Concentrating photovoltaics
DC Direct current
EVA Ethylene vinyl acetate
EMF Electromotive force
FAA Federal Aviation Administration
FCOM Flight crew operating manual
FEP Fluorinated ethylene propylene
FEVE Fluor ethylene vinyl ether
FL Flight level
GCU Generator control unit
GPU Ground power unit
IAS Indicated airspeed
IDG Integrated drive generator
ISA International standard atmosphere
KT Knot
MD Machine direction
MGIII Maxeon 3rd generation
NASA National aeronautics and space administration
NM Nautical miles
NREL National renewable energy laboratory
PET Polyethylene terephthalate
PV Photovoltaic
PVF Polyvinyl fluoride
PVDF Polyvinylidene fluoride

10/1/2018
xii
RF Reference Flight
RPM Revolutions per minute
SAT Static air temperature
STC Standard test conditions
TAS True airspeed
TAT Total air temperature
TD Transverse direction
TOW Take of weight
TPT Tedlar polyester Tedlar
TR Turn round
TRT Turn round time

10/1/2018
xiii
14
40
41
41
42
60
60
62
62
64
71
72
72
72
73
73
74
74
75
75
76
77
77
81
81
82
82
82
84
85
List of equations (1) Ratio of efficiency variation…………………………………………………………………………………..……
(2) Mechanical energy……………………………………………………………………………………………………..
(3) Potential energy………………………………………………………………………………………………………….
(4) Kinetical energy………………………………………………………………………………………………………….
(5) Estimated PV total surface………………………………………………………………………………………….
(6) Cruising time………………………………………………………………………………………………………………
(7) Cruise fuel consumption……………………………………………………………………………………………..
(8) RF fuel consumption…………………………………………………………………………………………………..
(9) RF energy consumption………………………………………………………………………………………………
(10) Electric energy consumption……………………………………………………………………………………….
(11) Irradiance concentration…………………………………………………………………………………………….
(12) Air mass calculation…………………………………………………………………………………………………….
(13) Air mass correction on A320………………………………………………………………………………………..
(14) Direct sunlight intensity………………………………………………………………………………………………
(15) Orthogonal solar irradiance…………………………………………………………………………………………
(16) Cruise solar irradiance…………………………………………………………………………………………………
(17) Climb solar irradiance………………………………………………………………………………………………….
(18) Descent solar irradiance………………………………………………………………………………………………
(19) A320 ground time………………………………………………………………………………………………………..
(20) Energy generated by 1m2 of MGIII during ground time……………………………………………….
(21) Energy generated by 1m2 of MGIII during climb time………………………………………………….
(22) Energy generated by 1m2 of MGIII during the RF. ………………………………………………………
(23) Electric energy contribution by 1m2 of MGIII during the RF.……………………………………….
(24) Wing mean chord.………………………………………………………………………………………………….…..
(25) Outer wing box mean chord.………………………………………………………………………………………
(26) Wing available surface for PV systems………………………………………………………………………..
(27) Wing surface energy generation…………………………………………………………………………………
(28) Wing surface energy contribution………………………………………………………………………………
(29) Fuselage perimeter…………………………………………………………………………………………………….
(30) Fuselage arch length…..………………………………………………………………………………………………

10/1/2018
xiv
85
85
86
86
86
86
87
87
88
89
94
(31) Fuselage (30º) available surface for PV systems………………………………………………………….
(32) Dissipation factor “n” …………………………………………………………………………………………………
(33) Fuselage (30º) energy generation……………………………………………………………………………….
(34) Fuselage (30º) energy contribution…………………………………………………………………………….
(35) Fuselage (60º) available surface for PV systems………………………………………………………….
(36) Dissipation factor “m” ……………………………………………………………………………………………….
(37) Fuselage (60º) energy generation……………………………………………………………………………….
(38) Fuselage (60º) energy contribution………………………………………………………………………..…..
(39) Mean chord Reynolds…………………………………………………………………………………………………
(40) Sutherland’s law…………………………………………………………………………………………………………
(41) PV fuel savings……………………………………………………………………………………………………………

10/1/2018
1
Figure 1. Population growth over the last 220 years according to Worldometers. [1]
1 Introduction
1.1 Population and degradation growths
The rate at which human population increases is impressive. According to Worldometers [1],
within the last 60 years, the population has increased from 3 billion to 7.5 billion (Figure 1). This
gain in population is linked to a deterioration in the planet. As time goes by, the needs to
establish sustainable measures to preserve the planet are increasing. In order to prevent this
world from becoming uninhabitable for future generations, sustainability is a key concept in
human existence.
This information is outlined more quantitatively in the following:
List of environmental degradation events extracted from theworldcounts [2]:
- Each year, 55 billion tons of fossil energy, minerals, metals and bio mass are estimated
to be extracted from the Earth.
- In the sea, the trash accumulated can create a floating island with the size of India
Europe and Mexico combined. Besides, 27% of the coral reefs have been destroyed. At
this rate, in the following 30 years they will be completely eradicated.
- 80% of the forests have been destroyed and they continue to be destroyed by humanity
at a rate of 375 km2 every day.
- The rate at which natural resources are being used is 50% larger than what the Earth
can provide. At the current population, humanity would need 1.5 Earths.
- The yearly increasing number of greenhouse emissions. For instance, the following chart
displays the CO2 emissions since 1850 and the predicted emissions until 2030:

10/1/2018
2
Figure 2. CO2 emissions from 1850 until 2030. Extracted from C2ES. [3]
1.2 Commercial aviation evolution and emissions
If human population and the environmental degradation brought with it increase fast,
technology grows at even faster rate. In particular, checking on the commercial aviation industry
evolution over the years is astonishing. In 1908, the first passenger flight took place in history.
Currently, about a hundred and ten years later, nearly 100,000 commercial flights take place
each day [4]. The rapid escalation in commercial flights is a reality.
Unluckily, technological expansion too often means an increase in environmental pollution.
Commercial aviation is no exception:
Aircraft engines create pollutant emissions as a result of the fuel combustion. These polluting
emissions affect the health of our environment. In addition, not only are they main generators
of climate change but also are harmful agents to human health producing severe illnesses or
even death.
Jet engine emissions are composed of several exhaust gases. The main constituents are carbon
dioxide (CO2), comprising roughly a 70% of the total exhaust, water vapor (H2O), which occupies
about 30%. However, these aren’t the only pollutants emitted by fuel combustion. Less than a
1% of the exhaust gases are composed of pollutants such as oxides of sulfur (SOX), nitrogen
oxides (NOx), carbon monoxide (CO), unburned or partially burnt hydrocarbons (HC) and finally
methane (CH4), which is not produced during cruise configuration.
Aircraft emissions are distributed in two stages:
The first one is formed by the emissions emitted between 0 and 3,000 feet from ground level
(roughly 914 meters). This stage constitutes nearly 10% of the total aircraft pollutant emissions.
Despite being a small percentage, the proximity of this emissions to the ground makes them a
big threat for humans near the exhaust gasses emission. According to the data provided by
Aviation Emissions, Impacts & Mitigation from the FAA [5], close range aircraft pollution
contributed to 16,000 deaths in 2015 throughout the planet.

10/1/2018
3
Figure 3. Energy use distribution in the transport sector. Obtained from the Federal aviation administration. [5]
The second stage is composed of the aircraft’s emissions above 3,000 feet, which comprise the
remaining 90% of the pollutants emitted. These aircraft emissions harm both climate change
and air quality. However, when aviation is compared to other transports, commercial planes
contribution to harmful emissions is relatively small. The problem with aviation pollution is that
almost all their emissions are directly made in the climatically sensitive zones of the
troposphere, where these phenomena get accentuated.
According to Lee, David S., et.al. in Aviation and global climate change in the 21st century [6], a
recent global climate research states that aviation’s contribution to human-induced climate
change is between 3.5% and 4.9%. Besides, this result is expected to reach between 4.4% and
6.2% by 2050. In order to prevent aviation from reaching these values, new policies and new
technologies should be implemented in this sector.
1.3 PV systems on commercial aircrafts
In consonance with the main ideas exposed previously, sustainability and aerial transport are
two linked concepts in a state of constant evolution. Both of them will have an outstanding role
in humankind’s future. For this reason, mixing these concepts together in order to bring out a
creative, exciting and sustainable idea is more than a safe bet. Sticking to this objective, this
study focuses on analysing the aerodynamic and energetic consequences of installing PV
modules on a commercial aircraft surface.
Installing PV panels on commercial aircrafts would bring a green solution to the aviation sector.
Reducing the growing emissions of the commercial aircrafts would significantly improve the
sustainability of aerial transport. Considering the amount of flights carried out each day, even a
small improvement would be noticeable in the environmental aspect. Since the skies are
becoming more and more populated by aircrafts, it is pleasant to think of more ecologic planes
which use some or full part of renewable energy to fly.
This study wants to determine the achievability levels of the installation in terms of energy and
aerodynamics. For this reason, whether this idea is proven to be feasible or unfeasible, this study
will have achieved its goal.

10/1/2018
4
2 What are solar panels? Repeatedly every day, the Sun irradiates the Earth with 84 terawatts of power as sunlight [7].
Therefore, the light emitted by the Sun can be categorized as an inexhaustible and a clean source
of energy. Both of these appealing characteristics have always claimed human’s attention.
Eventually, after years of research, science discovered how to benefit from sunlight energy. At
the moment, humanity gave birth to solar panels.
Solar panels are devices which absorb sunlight in order to convert it into electricity. They are
extended flat surfaces composed of small electronic units called solar cells. These elemental
units are the ones capable of transforming the incoming solar energy into DC current. The bigger
the solar panel is, the more solar cells forming it and, eventually, the more electricity being
created.
2.1 Functioning of solar cells
Solar cells’ principle of operation consists in combining the photovoltaic effect and the
generation of an electrical field with a diode implicit in itself.
2.1.1 The photovoltaic effect
The photovoltaic effect is the creation of electric current in a semiconductor when light is
exposed upon it. When a photon is absorbed by the semiconducting material, an electron gets
excited to a higher level of energy. This phenomenon entails a separation of charges by diffusion,
eventually leading to the generation of electric potential (voltage).
The first observation of the photovoltaic effect was made by A. E. Becquerel in 1839 under
empirical experimentation. However, it wasn’t until 1905 that the theoretical explanation was
developed by Albert Einstein, basing the photoelectric formulation in an extension of Max
Planck’s work [8].
2.1.2 How does a solar cell generate an electrical field?
In order to understand how a solar cell produces current, one has to understand how a p-n union
works. A p-n union, as its name indicates, is the union of p and n semiconductors:
-Semiconductor: a material whose electrical conductivity is lower than a conductor and higher
than an insulator. Contrary to the metals, a semiconductor increases its conductivity when its
temperature increases. These semiconductors can be doped in order to modify its chemical
properties and, eventually, their atomic behaviour [9].
- N-semiconductor: is a semiconductor which has been doped by adding certain atoms (P, As,
Sb) which increase the amount of free electrons. Therefore, the material gets an abundance of
electrons (this explains the name of the “n” doping, negative). Despite the excess of electrons,
since the original semiconductor and the doping element are neutral by themselves, the final
charge is neutral too.
- P-semiconductor: analogously to the N-semiconductor, the material gets doped by adding
certain atoms (Al, Ga, B, In) which increase the amount of holes (this is why it’s called “p” doping,
positive). As in the previous case, since both the semiconductor and the doping element are
neutrals, the final charge is again neutral. However, there is abundance in holes.
10/1/2018
5
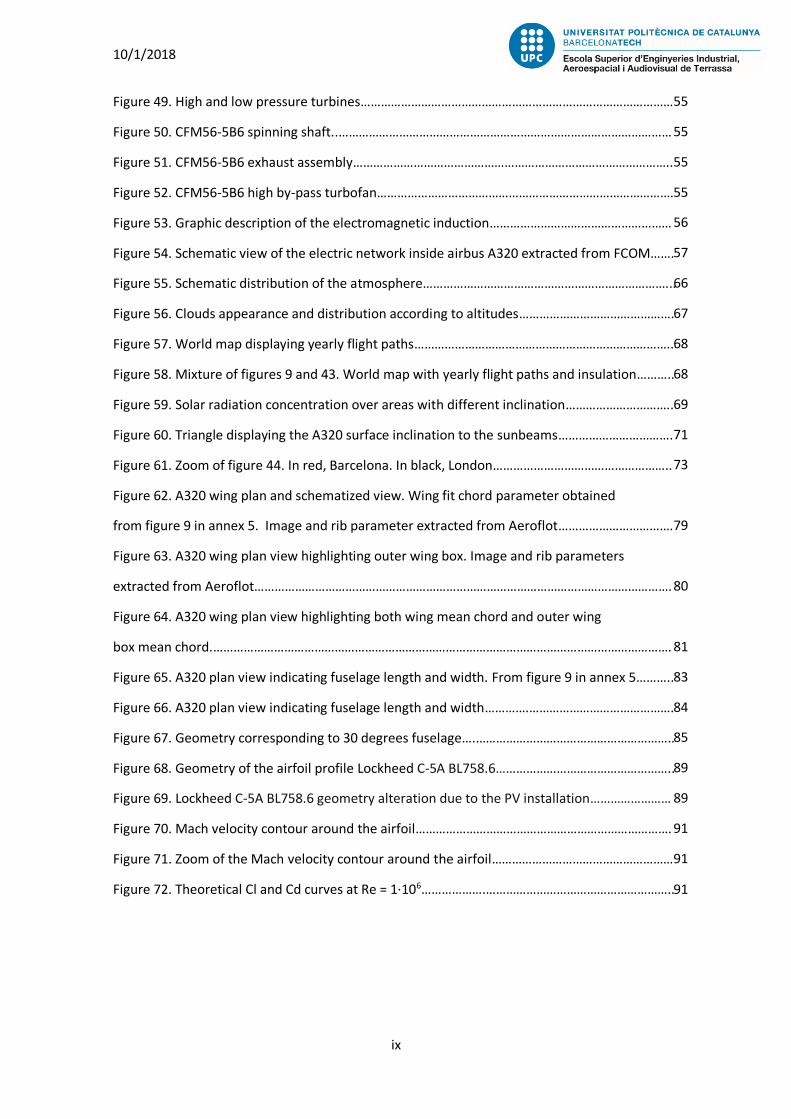
Figure 4. Holes moving from P to N. Figure 5. Electrons moving from N to P.
Figure 6. Free charges diffusion near boundary. Figure 7. Electrical field appearance.
Now that these concepts have been explained, the p-n union can be defined:
When p and n semiconductors come together the free electrons from the N region and the holes
from the P region tend to unify themselves. This recombination takes place near the boundaries
where both semiconductors are united. The further from this boundary, the less unions that
happen. This event generates a “barrier zone” where a magnetic field appears. The following
images, extracted from the docent innovation secrecy of Granada University [10], describe this
phenomenon:
This is the instant in which both doped semiconductors get united. It can be predicted that the
free holes will tend to go to the N region and the free electrons will tend to go to the P region.
As can be seen in figure 3, the free charges (holes and electrons) start diffusing near the
boundary between the two regions. This diffusion unites holes and electrons and eliminates the
ionized impurities until reaching a point where an electrical field appears (figure 7):
Since P region has lost positive charges (holes), it gets charged negatively and, in analogously, N
region has lost negative charges (electrons), so it gets charged positively. Because of this
diffusion it appears the electric field which transforms the barrier zone into a diode which only
allows one-directional moves: electrons can only move from p to n and holes from n to p.
Whenever a pair electron-hole gets unpaired in the barrier zone due to the photovoltaic effect,
the hole will travel to the P region and the electron will travel to the N region. This property is
what will ensure the generation of potential difference, enabling the existence of electrical DC
current.

10/1/2018
6
2.2 Solar panel internal structure
Solar cell semiconductors are very thin. For instance, the
most common technology in the PV market (silicon solar
cell) have an optimal cell thickness of 100 µm, with
excellent light trapping and very good surface
passivation. However, it’s hard to find the optimal
economic point between cutting thinner slices with
expensive technology and cutting wider slices with
cheaper technology. The common thickness are between
200 and 500 µm mainly because of mechanical and
economic issues when cutting the slices [11].
In addition to the semiconductors, the solar cell is
composed of other layers which are added on both sides
of the semiconductors to chemically protect them and
provide structural stability to the unit. With all these
layers added, the solar cell reaches depths between 1.5
and 2 millimetres.
2.2.1 Layers list and description
The solar cell can be divided into several layers. As follows, the list and description of these layers
is made. The information described is in agreement with PVeducation [11] and the PV
independent consultant Oscar A. [13]:
Front sheet: This layer is composed of high transparent (antireflection) materials which
provide protection to the structure. To upgrade the amount of incoming radiation, this
layer usually has a rugose surface finish that allows better light retention than a flat
surface.
Common materials used for this function are toughened glass and fluorinated polymers
such as ETFE or FEP, which are outstanding for being UV resistant, supporting a wide
range of temperatures and having strong chemical, fire and weather endurance. This
pack of properties allow these materials to last over 20 years with proper operating
conditions.
Encapsulating material: Isolating solar cells semiconductors is indispensable to protect
them from chemical threats. It protects the cell from harmful UV radiation, oxidation
and corrosion, eventually preventing semiconductors from quicker degradation.
The most typical encapsulation is done with EVA (ethylene vinyl acetate), a polymer
which outstands for being hard-wearing, transparent and with good corrosion resistance
and flame retardant properties.
Conductor material: Conducting elements are crucial for the proper functioning of a
solar cell. The conductor is the one providing continuity to the electrical current, it
connects the top and the bottom of the cell allowing the flow of the electrons from the
positive electrode to the negative. The better the conductor is, the more electricity is
being produced and the less it gets lost as heat.
Figure 8. Layers distribution around the cell.
Extracted from Sinovoltaics. [12]

10/1/2018
7
A common material used for this function is the best conductor in existence, the silver
(Ag). However, the price of silver is a drawback. This is why researchers are looking for
reasonably efficient but much cheaper substitutes such as copper.
Emitter: This layer is composed by the N-semiconductor material. The N region
semiconductor has a higher surface quality to absorb light due to the fact that it has a
bigger amounts of free electrons. For this reason, it is placed at the front. Therefore, the
top of the cell is the negative terminal and the bottom part is the positive terminal.
If an electron gets unpaired (by a photon’s strike) in the barrier zone there are no ionized
impurities nearby to be recombined with. This fact almost ensures that the hole will
travel to the P region and the electron will travel to the N region generating the desired
potential difference. However, if the electron is unpaired out of the BZ, the chances of
both hole and electron recombining with other ionized impurities is really high and
instead of generating potential difference it only dissipates heat. This fact explains why
is important to have the emitter as a very thin layer, because, aside from generating the
electric field, it’s optimal to increase the amount of photons reaching the barrier zone.
It is also convenient that the N-semiconductor is doped enough to allow the generated
electricity travel without resistive losses, but not so much that the carriers recombine
before reaching the BZ. For this reason the emitter is a very thin layer with less than 1
µm of thickness [14].
Base: Composed by the P-semiconductor, the base depth is larger than the emitter. The
explanation is based on Peer Lambert’s law, which says that the depth of the material is
directly proportional to the absorption coefficient. A too thin layer would lead to the
loss of long wavelength photon absorption. In other words, the solar cell would produce
less electricity.
Conductor and encapsulating material: As for the top part of the semiconductors, so
for the bottom one. Due to the reasons explained for the top conductor, in order to
provide continuity to the current a conducting material is required. In the same way, an
encapsulating material is also needed to protect the semiconductor.
Back sheet: Its function is simpler than the front contact since it doesn’t need to be
transparent. It mainly has two duties: provide compactness by holding the whole
structure and reflect the light that went through the semiconductors so that it has a
second attempt to be absorbed by the semiconductors.
Commonly used materials for this applications are Tedlar composites (TPT, Tedlar
polyester Tedlar) due to its good adhesion to EVA. Some alternative materials for this
function are the combination of opaque glass to provide reflection and stainless steel to
provide global rigidity.

10/1/2018
8
2.3 Solar panel external structure
A solar panel is the composition of several solar cells
which are particularly organized along its surface. This
distribution is closely linked with the grey lines which
can be seen on figure 6. These lines are essential for
the proper operation of a solar panel since they are the
conductors of the electric current produced by the
solar cells. In other words, these lines are the
conductors in charge of providing continuity to the DC
current generated [13].
This conductors are important when deciding the distribution of the cells. Using the proper
proportion of emitter and conductor in the panel design isn’t trivial:
On one hand, placing a lot of conductor filaments provides security, ensuring that the solar cell
will properly transport the current to its destiny. However, filling the surface with too much
conducting material means less emitter surface exposed to the sunlight. Therefore, less solar
cells will be transforming energy and the solar panel will have a low wattage output.
On the other hand, maximizing the surface with emitter endangers the proper work of the solar
cell. If a conducting filament is broken or stops conducting, the emitter surface which has been
isolated won’t be able to provide continuity to the current generated, thus, wasting all the
energy produced. To palliate this problem, apart from placing a proper amount of conductor on
the solar panel, an optimal geometry is required to reduce the emitter surface isolation if the
conductor fails.
For these previous reasons, solar panel designers have found an equilibrium in the amount of
both materials. At the same time, they are both maximizing the amount of emitter surface and
optimizing the conductor distribution so that, if any issue were to happen at the installation, no
major losses would take place.
Figure 9. Solar panel surface organization. [15]

10/1/2018
9
Figure 10. Scheme of the electric distribution
net. Image extracted from Solardirect. [16]
2.4 Complementary elements
The solar or photovoltaic modules are the ones
in charge of converting the energy from light to
DC current. Then, this DC current is transmitted
to the inverter, which is in charge of converting
the DC current into AC current. After, this
inverted current can be stored in batteries, sent
to the distribution net or be directly used.
-Inverter: Is the brain of the system. Although its main duty is to convert DC current from the
solar panel to usable AC current, in its role there can be added other functions. They often get
monitored so users can see the system performance and help them identify and fix potential
issues, eventually improving grid stability and efficiency. Besides, with the solar storage growth,
inverters are also gaining responsibility when managing the battery [17].
-Battery: Stores energy when it isn’t needed and distributes it back out when it’s demanded.
Since renewable energies such as solar power are variable, batteries providing stationary energy
storage are crucial to the stability of the solar power’s grid. In fact, batteries are essential in
many solar power installations. Many system’s working with solar power store energy as much
time as they can, and then release this energy during a certain period of time. Without the
batteries, the energy produced in the time lapse when no energy is required would mean energy
wasted [18].
-Charge controller: Limits the amount of electric current that is absorbed or released from the
battery. This control prevents the battery from overcharging or completely draining, ensuring a
longer use of the battery in proper conditions.

10/1/2018
10
Figure 11. Solar radiation spectrum. In yellow, at the top of the atmosphere. In red, at sea level.
Image extracted from Globalspec. [20]
2.5 Basic solar power concepts
Now, some basic concepts related to photovoltaics are described in order to hasten later
deductions and thoughts.
2.5.1 Air mass and solar spectrum
Solar power is obtained from the radiation carried by the sunbeams. In order for these to reach
the Earth’s surface, they need to travel across the whole atmosphere which acts as a protective
layer and prevents sunlight reaching us with full intensity. Air mass is a unit of length which
indicates the amount travelled of air, it is expressed as a ratio relative to the vertical path
through the atmosphere.
Air mass is minimal when the Earth’s surface is frontal to the sun. The more angled it becomes,
the more air mass attenuating the solar radiation. Therefore, air mass is affected by both latitude
and the hour of the day (due to Earth’s autorotation). This will be explained with more detail in
the next points.
Atmosphere mechanisms to weaken sunbeams consists in scattering and absorbing certain
sunlight’s spectrum. As sunlight advances through the atmosphere, air chemicals interact with
the sunbeams absorbing certain wavelengths. Components such as water vapour, nitrogen,
oxygen and carbon dioxide play an important role when absorbing wavelengths of the spectrum.
Atmospheric scattering is produced by small particles suspended in the air with different index
of refraction. These particles mainly diffuse high frequencies from the incident radiation in
different directions, eventually attenuating the sunbeams heating the surface [19].
The following graph shows the spectrum’s variation before and after passing the atmosphere:
10/1/2018
11
The spectral irradiance in yellow refers to the radiation before entering the atmosphere, which
isn’t affected by the AM phenomenon. The spectral irradiance in red refers to the radiation
reaching Earth’s surface. When comparing the red spectrum with the yellow one two main
differences can be seen:
Due to scattering: red spectrum presents a considerable drop off for wavelengths under 750 nm
(higher frequency spectrum) produced by the molecules refraction.
Due to absorption: red spectrum shows lagoons for certain wavelengths which are being
absorbed by some of the air molecules.
Because of the atmosphere attenuation, sun intensity at noon is completely different from in
the morning or in the afternoon. This happens because the sunlight at noon falls orthogonally
to the Earth’s surface, thus travelling the minimum atmosphere distance and eventually
receiving less attenuating effects. By contrast, in the morning or in the afternoon, sunlight comes
angled from the sides, therefore travelling more distance than at noon, so being more affected
by the atmosphere’s air molecules.
An air mass of 1 means that the sunlight falls straight down on the Earth surface. Anywhere
located with latitude greater than 23.5 degrees won’t be able to receive straight sunlight, so air
mass will happen to be greater than 1 (meaning that it has travelled more distance).
Solar panels semiconductors work mainly with the visible and the beginning of the infrared
spectrum of sunlight. Despite being the part of the spectrum suffering the most by scattering, it
is still the one producing more irradiance. To expand efficiency limits, some solar technologies
extent solar cell’s absorbance capacity to other wavelengths of the spectrum so that these retain
more irradiance and eventually produce more energy [21].
2.5.2 Solar irradiance and solar constant
Solar irradiance refers to the amount of sunlight incident on a unit area once it has passed
through the atmosphere. It is commonly expressed in W/m2 or kW/m2. This parameter is
measured with an instrument called pyranometer.
Solar constant is the solar irradiance before passing through the atmosphere on a unit area
oriented perpendicular to the sunbeams. Its value is about 1,367 W/m2. On a perfectly clear day
on the equator and a normally oriented surface to the sun, the sun irradiance is about 1,000
W/m2.
Nevertheless, many different factors are involved affecting this outcome. Already considering
the air mass, there are three other main factors that have to be taken into account. Firstly, the
local variations in the atmosphere such as clouds, water vapour and pollution. Secondly, the
latitude of the location receiving the sun irradiance. And third, the season of the year and the
hour of the day [22].
2.5.3 Solar insolation
This concept refers to the amount of solar irradiance hitting a fixed area over time, leading it to
be an energy magnitude. It is commonly expressed in kilowatt-hours per square meter per day
(kWh/m2/day) or per year (kWh/m2/year) for a concrete location, a fixed orientation and tilt of
the panels’ surface.

10/1/2018
12
Figure 12. Yearly mean of solar insulation over the whole surface. Calculated in W/m2. Image obtained from Karin Kritzinger’s Industrial and Commercial Use of Energy conference. [23] [23].
Figure 13. Angled irradiance effect. [24]
Figure 14. Air Mass angular variation. [25]
Knowing the importance of this parameter (not only for PV system but also for other issues of
great importance such as comprehending meteorological behaviours) scientists have calculated
the average irradiance per hour over several years for each region of the world. The following
image displays the results obtained:
Intuitively, those regions situated near the equator, which are warmer, are receiving more
irradiance than those regions near the poles, which are colder. This fact can be explained simply
with two concepts:
Geometry of sun angle: when sunbeams fall orthogonally
they irradiate “X” to 1 m2. However, when they fall inclined
the same amount of light is irradiating more surface. This
means that sunbeams falling with 30 degrees inclination
irradiate “X” to 2 m2, thus irradiating “X/2” to 1. In other
words, they irradiate more surface but with less intensity.
Air mass travelled: beams falling orthogonally also imply
that they have travelled the less AM possible, taking the
shortest path through the atmosphere. These beams have
suffered less spectral classification effects than those who
came angled because the last ones have travelled through
more AM, reducing eventually the intensity of the
irradiance coming from the sunlight.
To sum up, in the regions near the equator, where sunlight strikes directly, the irradiance
received is bigger. Contrarily, the regions situated near the poles have their surface inclined. For
this reason, the sunlight emission doesn’t reach the surface directly, thus, the irradiation is
significantly lower.
10/1/2018
13
Figure 15. Day length variation over
the year. Extracted from P. Burgess day
light study. [26]
Figure 16. Solar radiation intensity
over the hours of three different
days: 22 June, 22 September and 22
December. Extracted from P. Burgess
day light study in 2008. [26]
In order to maximize the annual sun received, solar panels can have their surface placed flat
horizontal or tilted depending on the latitude in which they are located.
2.5.4 Daylight hours
Because Earth rotates on his own axis, the full effect of sunlight is only received for a part of the
day. As well as spinning on its own axis, Earth spins around the sun. This effect wouldn’t have
any impact in terms of solar radiance, except that it spins with an inclination of 23.5º. This
inclination is the season’s cause and determines both seasonal weather changes and hours of
daylight. Both of these consequences affect the average insolation of a region during a year.
Day length (period between sunrise and sunset) varies with time of the year and latitude. For
instance, during the summer in the northern hemisphere (imagine 50ºN), the hours of daylight
are greater (16h middle summer), whereas during the winter, the day length consistently
decrease (8h middle winter). Analogously, in the southern hemisphere with the opposed
latitude has the opposite season and the opposite day length. These deviations tend to decrease
as the regions get nearer the equator and as the seasons approach autumn and spring equinoxes
where the daylight lasts 12h each.
The following graph perfectly describes this phenomenon:
Besides the day length variation, solar intensity also varies within the hours of daylight. This
variance is displayed in figure 16:
This figure shows, for three different days, the different day length and the solar radiation
variance within them. The samples are extracted on June 22th (summer solstice), on September
22th (autumn equinox) and on December 22th (winter solstice). Different top values are reached
for these days, logically being higher in summer, average in autumn (and in spring) and smaller
in winter. Notice that these values reach their maximum at 12:00h, which is the day time when
the region’s surface is frontal to the sun. The further from 12:00h, the more angled the surface
gets, thus, the more air mass involved in the attenuation.

10/1/2018
14
Day length and its radiation variance within it are very important factors when calculating a solar
panel’s generation. The longer day length, the more sunlight reaching a solar cell, the more
energy generated.
2.5.5 Temperature conditions
As with the majority of electrical machines, solar panels don’t like working with elevated
temperature. The colder they are the better for their performance. However, solar panels need
to be exposed to the sun in order to generate energy. Unavoidably, their temperature raises and
their efficiency gets partially reduced.
Depending on the solar cell technology and the materials composing it, these temperature effect
affects more or less. Each solar cell has its particular sensitivity and it is quite linear with the
temperature the cell surface is working with [27].
Imagine a solar cell working temperature of 40ºC. To calculate the efficiency variation due to
the temperature, the reference temperature has to be obtained. Since the common
environmental temperature is considered to be 25º C, the reference temperature are 15ºC.
In order to obtain the efficiency variation, the number obtained gets multiplied by a factor which
indicates the solar cell sensitivity and is commonly near the 0.45 value. Thus,
𝑅𝑒𝑣 = 𝑇𝑖 · 𝐶𝑡𝑠
( 1 )
Where 𝑅𝑒𝑣 is the ratio of efficiency variation, 𝑇𝑖 is the increment of temperature of 15ºC and 𝐶𝑡𝑠
is the solar cell thermic sensitivity factor of -0.45%/ºC. With the values of this example, the cell
efficiency decreases a 6.75%.
(Notice that for working temperatures lower than 25 ºC the efficiency of the cell would increase.)
2.5.6 Standard Test Conditions
When testing sun panels, laboratories reproduce concrete atmosphere conditions called STC
(Standard Test Conditions) to test their panels. According to “Solar power for ordinary people”
posted in 2013 [22]:
Reproducing an artificial sun which irradiates the sun panel with 1,000 W/m2.
The panel’s temperature is 25º C.
Air mass has been agreed to be 1.5.
In almost all the situations, these conditions will be way better than what happens in reality. On
one hand, it is very unlikely to receive 1 sun of irradiance, not only because it is hard to get a
perfectly sunny day with a clear sky, but also because it has to be happening in regions where
the sunlight falls orthogonally. On the other hand, because sunnier and bright days tend to be
accompanied by rather high temperatures, thus warming the solar panel up to 35-40º C. Finally,
the AM of 1.5 is a pretty decent value since many regions won’t be receiving sunlight with 1 AM.
In spite of the lack of plausibility STC possess, they have become an international method to
compare solar panels through their nominal power.

10/1/2018
15
2.5.7 How much power does a solar panel produce?
Imagine having a solar panel with an efficiency of 20% and a surface of 1 square meter during
an ideal day hour reproducing precisely STC. The energy produced would be exactly of 200 Wh,
thus, the nominal power of the panel would be expected to equal 200 W. Unfortunately, as
already mentioned, STC conditions are far from the reality. Many factors such as the latitude in
which the panel is located, the season and the atmospheric conditions (clouds, pollution and
temperature) affect the irradiance quality the panel is receiving. To have an idea of how far STC
conditions are from the reality, look back at figure 9 where the averages of sunlight irradiance
per hour move between 50 W/m2/h and 300 W/m2/h depending on the world’s location. This is
between 20 and 3.33 times smaller than STC, respectively. Hence, it is very unlikely to achieve
our solar panel to exactly produce energy with its nominal power.
To give an example, suppose the best average solar irradiation in the whole globe: 300 W/m2/h
per day. Now, considering the panel with an efficiency of 20%, during an hour it would produce
60 W/m2. Nevertheless, its efficiency has been decreased just a bit more due to an operating
temperature of 35 ºC, so the final generation ends up being around 50 W/m2. Of course, this is
a guidance and roughly accurate result for one particular case. Each installation has its own
environmental and geometrical particularities and their generation might be different from this
one.
Further on, the operating conditions of this study’s installation will be analysed.

10/1/2018
16
Figure 17. Vanguard I. First solar powered satellite. [29]
Figure 18. Yearly cumulative PV
capacity in MW. Extracted from
European photovoltaic Industry
association. [30]
3 State of the art of solar panels
3.1 Evolution
Scientists have been aware of the photovoltaic effect since 1839. But it wasn’t until 1954 that
Calvin Souther Fuller and Gerald Pearson invented the first solar cell. A few years later, in 1958,
solar cells gained a lot of prestige thanks to them being incorporated into Vanguard I, the first
solar powered satellite in the human history [28].
After the Vanguard I success, the aerospace industry
invested a considerable amount of resources on
investigating and improving solar cells. Its characteristic
were ideal for many space missions. The fact of having a
renewable source of energy in space and its relatively good
efficiency due to the clean exposure to the sun (without
atmosphere filter), made of them a fabulous invention.
Solar cells kept improving until reaching the point of entering the mass market. In 1970 the first
residential PV system was installed. From that moment, PV market started growing slowly year
after year. At the beginning of this growth, the cost was the main barrier for residential users.
However, as time went by, the economic barrier got reduced, allowing more and more
customers to have their PV installation. From 2007 to 2017, the growth of photovoltaic has been
exponential. During this time, PV market has transformed from a small scale applications market
to a mainstream electricity source [30].
For many years, the United States was at the top of PV
generation. Its total yearly production amounted to
77 MW in 1996. Later, Japan got the lead of PV
production until 2005. In 2016, Germany took the lead
and reached a capacity of more than 40 GW. At
manufacturing levels, in 2015, China became the
world's largest PV producer [31]. China’s rapid growth
has allowed it to triple its PV production to 70 GW in
2017 [32].
In global terms, the stacking photovoltaic capacity reached 302 GW near the end of 2016. An
energy estimated to cover between 1.3% and 1.8% of the world’s total energy demand [33].
Estimations predict than between 2016 and 2020 the global PV generation will reach above 500
GW. In 2050, according to the technologies roadmap of photovoltaics by the International
Energy Agency [34], photovoltaics have been forecasted to become the largest global energy
source contributing about a 27%.
10/1/2018
17
3.2 Solar markets
Solar market is ruled by the efficiency offered by its products (understanding efficiency as the
portion of energy transformed from the sunlight). The more efficient a product is, the more
expensive it becomes. Besides, since the price rises, fewer customers are capable of affording
it. This leads PV systems into a very particular market which can be divided in two groups: the
specialized market and the mass market [35].
3.2.1 Specialized market
The specialized market is designed for enterprises demanding solar power for concrete functions
that require the best PV technology existing: Multi-junction cells. These products provide
notably higher efficiency, often followed by more reliability and endurance than crystalline
silicon and other technologies. However, due to the high accuracy and difficulty of their
fabrication process, they are way more expensive. For this reason, only very few customers opt
to invest in the products offered by this market.
The main customer interested in Multi-junction cells is the aerospace industry. Since the
beginning of the astronautic era, solar devices have been included on every spacecraft. Solar
panels have a high power output over unit mass and don’t need movement for the generation
of energy. This two characteristics are ideal in space. The military industry is also interested in
this technology due to its high power output linked with its lightness and adaptation to many
terrains.
Specialized market demand is so low that only few enterprises create its products. Actually, the
providers aren’t commercial enterprises, they are R+D enterprises which work for the
aeronautical and military sector exclusively. For this reason, not only these products are out of
range due to its cost, but also due to its unavailability to the common market.
3.2.2 Mass market
The mass market sells solar panels with rather moderate properties according to the technology
available nowadays. However, the prices of these products are way more reasonable. Logically,
this market is economically available for much more customers than the specialized market.
These customers are mainly current citizens or enterprises that need moderate quality solar
cells at a reasonable price for their project purposes.
Although the solar technology available in the mass market isn’t the best, the utilities from PV
systems are unique and very useful. Some applications offered by solar power are used for
charging small devices, powering vehicles, powering buildings or places out of the grid’s range
or providing additional green energy to family buildings by installing solar panels on the roof.
Gradually, as the technology advances so does the market. As time goes by, PV systems tend to
get a cost reduction because of new PV products appearing which offer better properties or
services. This phenomena has helped solar power techs a lot because, because with this price
reduction, they have become economically accessible for many customers. This, in turn, is a
great source of income which is invested again in new solar research or products. Expressed
differently, solar products being sold fuels the development of solar technology. This continued
cycle is excellent for the progress and improvement of PV systems.
10/1/2018
18
Figure 19. NREL chart displaying all the solar technologies available, their producing enterprise and their evolution
over time. [36]
3.3 Types of technologies
Over the years solar technology has continued to improve. But not only that, new technologies
have appeared on the market to rival previous ones or provide new functionalities in the PV
sector. In order to get a schematized idea of how all this evolution has reached nowadays, the
National Renewable Energy Laboratory (NREL) chart is displayed so that a global and visual idea
of the situation can be made.
This chart is displaying all the different types of solar technologies and classifying them
depending on the efficiency and year of discovery. Therefore, what these chart shows it the
whole industry evolution of PV systems over time:
(See next page)

10/1/2018
19

10/1/2018
20
The chart from above classifies the available technologies in 4 groups: Junction Cells, Crystalline
Silicon Cells, Thin film Cells and Emerging PV Cells. Next, these technologies are explained:
3.3.1 Junction Cells
Junction cells are solar cells composed of multiple p-n junctions of different semiconductor
materials. This technology is based on the wavelength absorbance capacity. As explained in
chapter 2.5.1, solar cells tend to absorb the visible and part of the infrared spectrum of sunlight.
However, there are several semiconductors which have different response to the wavelengths
of light they receive. Gathering different semiconducting materials with different absorbance
capacities in the same solar cell allows retaining broader range of wavelengths, eventually
improving the efficiency of the cell. They can be divided between single-junction and multi-
junction:
- Single junctions: Mainly made with GaAs, these junctions are reaching efficiencies of 27.5%
and 29.1% with concentrating lens. This technology has reached proximity to its limit, since
theoretical studies indicate that single junction cells can’t go beyond 33.2% due to its bandgap
width limitations [37].
-Multi junctions: These cells are the evolution of single junctions and have a long journey until
reaching their limit. So far, this technology has provided the best PV system’s efficiency ever
created with a 46% in a four junction solar cell. But, actually, multi junction theoretical efficiency
limit is estimated to be 86.8% (absorbing the whole spectrum of light reaching the surface)
considering an infinite number of junctions [38].
Despite being so appealing and encouraging, this technology has very complex fabrication
procedures. Firstly, there is a chemical complexity. The combination of materials selected to
form the junctions must be coherent: selecting materials with compatible bandgaps and placing
them with a certain order in order to optimize the cell. And secondly, fabricating this kind of
cells is a hard task. Junction layers must be cut in amazingly thin slices that later on will be piled
together in a way that, since each layer is producing current, a mechanism between them can
extract it.
These incredibly precise technology requires an even more precise fabrication process that is
only at the reach of the most prestigious laboratories in the world. The expensive cost and the
inaccessibility of this technology makes that it is only produced for the aerospace and military
industry, thus creating the previously mentioned specialized market.
Some of the materials used and its efficiencies for these technologies are [39]:
-Dual junction cells: Usually made on Gallium Arsenide wafers, as the low band gap, and alloyed
with Indium Gallium Phosphide serving as the high band gap. Their best efficiency reaches a
31.1% and, with lens, a 34.1%.
-Triple junction cells: Often they are composed by a top layer of Indium Gallium Phosphide linked
with a Gallium Arsenide layer in the middle and a substrate of Germanium wafers. Their best
efficiency reaches a 37.9% and, with lens, a 44.4%.
-Four junction cells: Same structure as the triple junction cells but with the addition of Indium
Gallium Nitride. These are the solar cells which have reached the current best efficiency. Their
best efficiency reaches a 38.8%, and with lens, a 46%.
10/1/2018
21
3.3.2 Crystalline Silicon Cells
Crystalline silicon is the most popular solar technology existing for PV systems. It doesn’t have
the optimal parameters required for the perfect solar cell. Actually, silicon’s band gap is too low
for an optimal solar cell and it has a low absorption coefficient. Besides, it’s a difficult material
to grow into thin sheets (because of the shape it adopts when grains grow).
However, silicon is one of the most abundant semiconductor existing on Earth. And when
something is abundant, it is also cheap. On balance, despite not having the best properties for
creating the most efficient, reliable, adaptable and durable solar cell, it has a great quality/price
ratio. Leading eventually this technology into the top of the market, being the most sold and
outstanding above the rest of mass market technologies [11].
There are two main kind of crystalline silicon products available on the market. They are
compared as follows [40, 41]:
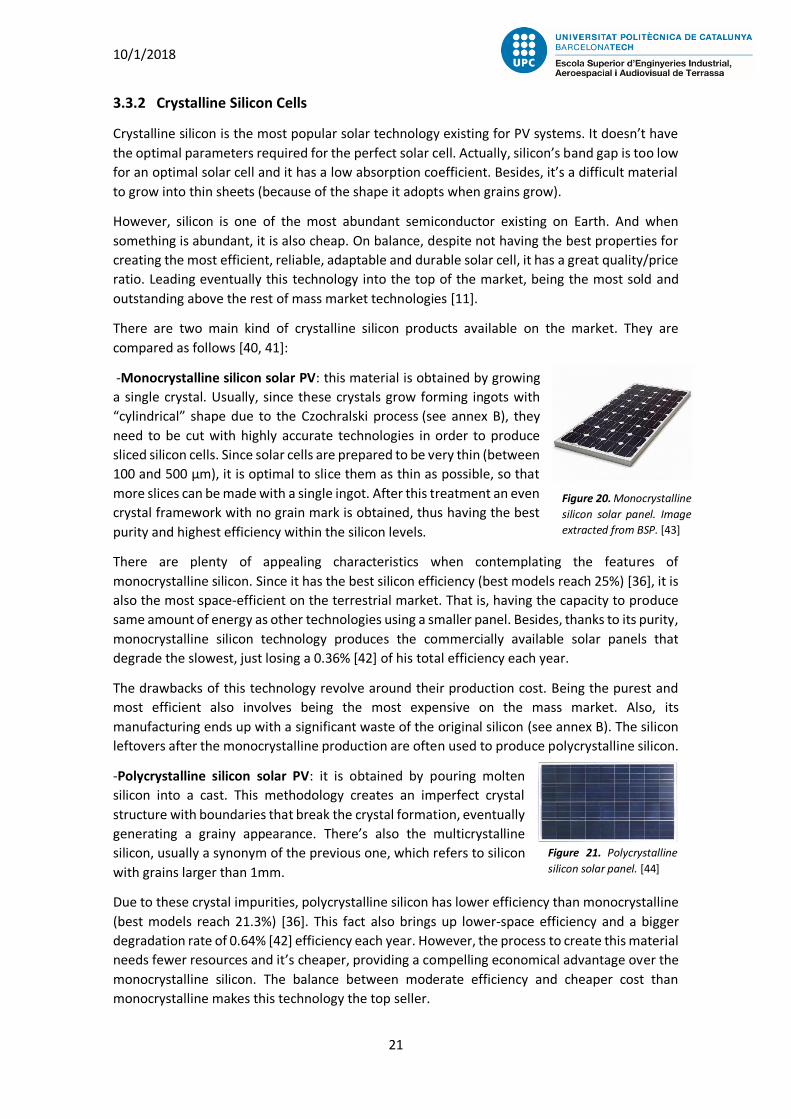
-Monocrystalline silicon solar PV: this material is obtained by growing
a single crystal. Usually, since these crystals grow forming ingots with
“cylindrical” shape due to the Czochralski process (see annex B), they
need to be cut with highly accurate technologies in order to produce
sliced silicon cells. Since solar cells are prepared to be very thin (between
100 and 500 µm), it is optimal to slice them as thin as possible, so that
more slices can be made with a single ingot. After this treatment an even
crystal framework with no grain mark is obtained, thus having the best
purity and highest efficiency within the silicon levels.
There are plenty of appealing characteristics when contemplating the features of
monocrystalline silicon. Since it has the best silicon efficiency (best models reach 25%) [36], it is
also the most space-efficient on the terrestrial market. That is, having the capacity to produce
same amount of energy as other technologies using a smaller panel. Besides, thanks to its purity,
monocrystalline silicon technology produces the commercially available solar panels that
degrade the slowest, just losing a 0.36% [42] of his total efficiency each year.
The drawbacks of this technology revolve around their production cost. Being the purest and
most efficient also involves being the most expensive on the mass market. Also, its
manufacturing ends up with a significant waste of the original silicon (see annex B). The silicon
leftovers after the monocrystalline production are often used to produce polycrystalline silicon.
-Polycrystalline silicon solar PV: it is obtained by pouring molten
silicon into a cast. This methodology creates an imperfect crystal
structure with boundaries that break the crystal formation, eventually
generating a grainy appearance. There’s also the multicrystalline
silicon, usually a synonym of the previous one, which refers to silicon
with grains larger than 1mm.
Due to these crystal impurities, polycrystalline silicon has lower efficiency than monocrystalline
(best models reach 21.3%) [36]. This fact also brings up lower-space efficiency and a bigger
degradation rate of 0.64% [42] efficiency each year. However, the process to create this material
needs fewer resources and it’s cheaper, providing a compelling economical advantage over the
monocrystalline silicon. The balance between moderate efficiency and cheaper cost than
monocrystalline makes this technology the top seller.
Figure 20. Monocrystalline
silicon solar panel. Image
extracted from BSP. [43]
Figure 21. Polycrystalline
silicon solar panel. [44]

10/1/2018
22
Figure 22. Thin-Film solar panel. [45]
Table 1. Features description for each one on of the Thin-Film common materials. [46]
3.3.3. Thin-Film technology
This technology has the particularity of being considerably light, flexible
and portable compared to the previous ones. These interesting
characteristics are accompanied by a medium-low efficiency and a higher
price than silicon cells. Over the years, these characteristics have lead
thin-film technology to only be competitive for a reduced amount of
applications.
Here there are the principal materials that thin-film solar technology works with:
-Amorphous Silicon (a-Si)
-Cadmium telluride (CdTe)
-Copper indium gallium selenide (CIS/CIGS)
The following table describes them:
a-Si CdTe CIGS
Top efficiency
8.1%
14.4%
14.5%
Thin film market share
32%
43%
25%
Advantages
Excellent for small devices
Low cost manufacturing
High efficiency Flexible substrates
Disadvantages
Low efficiency High cost equipment
Rigid glass substrates Cadmium is toxic
Expensive manufacturing
Efficiency degradation rate per year
0.87%
0.4%
0.96%
Thin-film technology brought to the market new features. The amount of available applications
and surfaces where to be installed helped this technology to improve at high rate. Besides, it has
been proved that its simple manufacturing process generates a product with low amount of
defects and, of course, cheaper to produce. It has also been demonstrated that it has a better
low-light performance compared to other technologies and its cells tend to lose less efficiency
when working with higher temperatures.
The inconveniences of this technology are related to its low efficiency. The amount of space
required to produce substantial energy compared between the previous techs increases
considerably. Likewise, more space required means more money invested on the
complementary equipment. Another problem would be the faster degradation rate compared
to the others. Comparing these shortcomings to the numbers of silicon crystalline technology, it
is no wonder why its impact on the market has been strongly reduced over the time. Currently,
this technology is used for small gadgets with a solar energy source and low voltage battery [35].
To sum up, this technology has particular characteristics which sustained it in the market for a
certain amount of time. However, over the years, the clear deficiencies when compared to
silicon crystalline solar technology have reduced it to a secondary role. Still, its parameters linked
to its low efficiency, low voltage output, its lightness and its great flexibility make it suitable for
certain applications.

10/1/2018
23
Figure 23. Organic solar cell. Extracted from j-net21. [49]
3.3.4 Emerging PV
While PV deployment continues to grow year after year, new technologies are being researched
with the potential of improving at a faster rate than the ones already existing and thus achieving
a quicker cost reduction and an improved deployment. Some of these technologies are:
-Dye-sensitized solar cells: these are low cost thin film solar cells which are based on a
semiconductor composed of a photo-sensitized anode and an electrolyte. This type of solar cell
is also called photo-electrochemical (PEC) system and its functioning is a process similar to the
electrolysis of water.
This technology enjoys some interesting features. First of all, it is easy to produce because it can
be created with conventional roll-printing techniques. Furthermore, is semi-flexible and semi-
transparent. Such characteristic allows dye-sensitized cells to be used in several special
applications. In addition, it uses a lot of cheap materials. However, there are some expensive
materials used in this cell which have been proven to be hard to replace or eliminate. Despite
this little drawback and its low efficiency (11.9%) [36], since it’s a low cost product, dye-
sensitized cells production/price ratio is good enough to compete with other products on the
market [47].
-Organic solar cells: also named plastic solar cells, this technology uses conductive organic
polymers or small organic molecules to produce the photovoltaic effect.
Organic cells are cheap and can be fabricated in large amounts. They also suggest concrete
applications in windows, walls or other surfaces thanks to its flexibility and transparency.
Chemically speaking, this technology has a high optical absorption coefficient (large amount of
light absorbed with small amount of materials) and their band gap can be tuned through
molecular engineering. They are also lighter than most of the other solar technologies and their
environmental impact when created or disposed of is the lowest. The main problems with
organic cells are their low efficiency (11.5%) [36], their low stability and their substantial
photochemical degradation [48].
-Perovskite solar cells: these solar cells, as it announces, includes a perovskite structured
compound with the task of doing the light-harvesting process. Perovskite makes reference to
any material with the same crystal structure as calcium titanium oxide.
As with other emerging PV techs, Perovskite cells are easy to manufacture and cheap to produce.
However, the most attractive feature of this type of technology is its fast advance in solar
efficiency. While in 2009 its efficiency was 3.8%, in 2016 it achieved 22.1% [36], making of it the
solar cell with the best efficiency improvement over the years. This technology’s promising
evolution is counterbalanced by the chemical instability it might present [50].
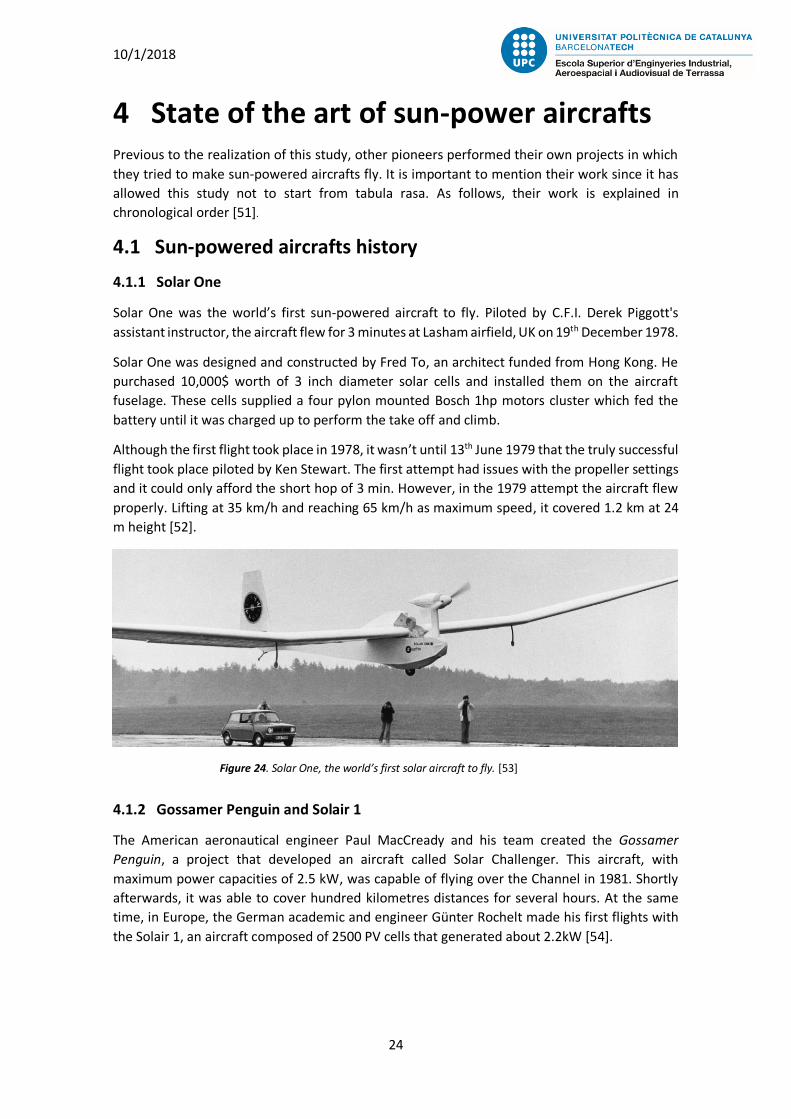
10/1/2018
24
Figure 24. Solar One, the world’s first solar aircraft to fly. [53]
4 State of the art of sun-power aircrafts Previous to the realization of this study, other pioneers performed their own projects in which
they tried to make sun-powered aircrafts fly. It is important to mention their work since it has
allowed this study not to start from tabula rasa. As follows, their work is explained in
chronological order [51].
4.1 Sun-powered aircrafts history
4.1.1 Solar One
Solar One was the world’s first sun-powered aircraft to fly. Piloted by C.F.I. Derek Piggott's
assistant instructor, the aircraft flew for 3 minutes at Lasham airfield, UK on 19th December 1978.
Solar One was designed and constructed by Fred To, an architect funded from Hong Kong. He
purchased 10,000$ worth of 3 inch diameter solar cells and installed them on the aircraft
fuselage. These cells supplied a four pylon mounted Bosch 1hp motors cluster which fed the
battery until it was charged up to perform the take off and climb.
Although the first flight took place in 1978, it wasn’t until 13th June 1979 that the truly successful
flight took place piloted by Ken Stewart. The first attempt had issues with the propeller settings
and it could only afford the short hop of 3 min. However, in the 1979 attempt the aircraft flew
properly. Lifting at 35 km/h and reaching 65 km/h as maximum speed, it covered 1.2 km at 24
m height [52].
4.1.2 Gossamer Penguin and Solair 1
The American aeronautical engineer Paul MacCready and his team created the Gossamer
Penguin, a project that developed an aircraft called Solar Challenger. This aircraft, with
maximum power capacities of 2.5 kW, was capable of flying over the Channel in 1981. Shortly
afterwards, it was able to cover hundred kilometres distances for several hours. At the same
time, in Europe, the German academic and engineer Günter Rochelt made his first flights with
the Solair 1, an aircraft composed of 2500 PV cells that generated about 2.2kW [54].

10/1/2018
25
Figure 27. Sunseeker landed on an arid surface. Image obtained from solar-flight. [58]
Figure 26. Solair 1 museum exposed. Image obtained from ABpic. [56]
Figure 25. Solar Challenger flying over the sea. Image extracted from soliclima. [55]
4.1.3 Sunseeker
In 1990, the pilot, flight instructor and solar-powered planes designer Eric Raymond piloted
Sunseeker over the United States. Sunseeker was a solar motor glider with 30 degrees of glide
angle and an OEW of 89 kg which used amorphous silicon solar cells to generate power. Its
journey over the United States was achieved in 21 stages that lasted almost 2 months. The
longest flight of the journey covered 400 kilometres [57].

10/1/2018
26
Figure 28. Icaré II flying over green fields. Image obtained from icare-solar. [60]
Figure 29. Helios flying over the sea. Image obtained from blogspot. [62]
4.1.4 Icaré II
In the mid-nineties, different solar-powered airplanes were built to participate in the Berblinger
competition. The objective of this challenge was to create a solar aircraft which could climb to
an altitude of 450m and keep a horizontal flight with a minimum of 500W/m2 as solar power.
Finally, in 1996 Professor VoitNitschmann’s team from Stuttgart University won the challenge
with Icaré II. This aircraft had 25 meters wingspan and 26 m² of solar cells [59].
4.1.5 Helios
In 2001, the American company AeroVironment for NASA created and flew Helios. A solar-
powered remote controlled aircraft which was capable of reaching the record of almost 30,000
m altitude within the solar planes family. This 70 m wingspan aircraft was capable of flying 24
hours non-stop powered by its 62,000 solar cells. In 2003, Helios was destroyed during a flight
due to the turbulence suffered and crashed into the Pacific Ocean [61].

10/1/2018
27
Figure 30. Solar impulse cofounders André Borschberg and Bertrand Piccard with Solar Impulse 2 in the background. [64]
4.2 Solar Impulse
Out of all the solar-powered aircrafts created, Solar Impulse models have attained the best
performance so far. For this reason, their design, technology and properties will be set as the
main reference for this study.
In 2003, André Borschberg and Bertrand Piccard started a project called Solar Impulse. This
project’s purpose was to create a fully sun-powered single-seat airplane capable of flying
through day and night thanks to the installation of Solar panels on its wings, fuselage and
horizontal tail plane.
Solar Impulse project has created two planes so far: Solar Impulse 1 (HB-SIA) and Solar Impulse
2 (HB-SIB). The first one was designed to remain airborne for 36 hours. The second one was an
upgraded version of the first, it carried more solar cells and more powerful motors.
Solar Impulse 2 was the first plane to circumnavigate the Earth with only solar power propulsion.
The navigation was made in 17 stages over 16.5 months from Abu-Dhabi on 9 march 2015 to
Abu-Dhabi on 26 July 2016. During this journey, it achieved the longest solar-powered plane
flight ever by flying during 5 days and nights from Japan to Hawaii [63].
4.2.1 Solar Impulse 2 aerodynamics
Solar Impulse 2 is a plane uniquely built to take off and fly as much as possible with only solar
power. For this reason, such plane is structured and aerodynamically designed with the best
configuration possible. In this case, such configuration is the one which reduces the aircraft’s
energy consumption to its minimum and maximizes the surface available for installing solar cells.
In order to optimize the energetic efficiency of an aircraft, an optimal aerodynamic efficiency is
needed. This requires having the best lift over drag (L/D) ratio possible, meaning that, for each
unit of dragging force, the largest amount of lifting force is achieved. Therefore, having the
capacity to keep the flight level with the less thrust consumption possible.

10/1/2018
28
Here there are the general properties that help to improve the aerodynamic efficiency of a
plane:
-Reducing the weight: Lift is generated to counteract the aircraft’s weight. The less weight it
has, the less lift it will be required to sustain the plane in the air. Besides, lift is closely related to
drag. If the lift for a given airfoil needs to be increased, either the speed of the plane or the
wing’s angle of attack need to be increased. Both methods end up increasing the drag too, so
reducing the lift required to fly, indirectly reduces the drag generated and eventually reduces
the consumption.
In order to fulfil this demand, Solar Impulse engineers have built the aircraft with the lightest
materials and elements possible and only generating enough room for one passenger (pilot) on
board. Finally reaching a weight reduction until the point that the plane weighs roughly the same
as car.
-Simplicity on the fuselage: Related to the previous point and speaking of ideal aerodynamics,
the fuselage should be a thin thread of 0 weight but with infinite rigidity that would compactly
link the main wing and the tail wing. However, for physical and purpose issues fuselages aren’t
ideal.
Despite not being ideal, Solar Impulse 2 founds a very interesting balance between the
important functions of the fuselage. On the one hand, it provides a rigid union between wings.
On the other hand, it is structurally simple and very light, without losing robustness. And last
but not least, its shape allows it to have solar panels installed on the top surface.
-Increasing wingspan: The larger the wing’s surface is, the more lift is being produced. However,
when increasing a wing’s surface, it’s always preferable to increase the wingspan rather than
the chord. Thus, increasing the aspect ratio of the wing: 𝑏2
𝑐 (being “b” the wingspan and “c” the
chord). The benefit of having big aspect ratios is based on the existence of the induced drag.
The induced drag reduces the effective angle of attack of the wing, reducing then the amount
of lift generated. This drag is related to the tip vortex generated at the wing’s tip due to the
pressure difference between the upper and lower side of the wing. In order to reduce the
induced drag designers ought to reduce the gradient of pressure produced at the wing’s tip. For
this reason, designers want a slender wing (big aspect ratio): with the same surface, they get to
reduce the chord length at the tip, reducing the amount of section creating tip vortex and finally
reducing the induced drag.
Having understood this aerodynamic phenomenon, it could be thought that the perfect wing
would have infinite wingspan. However, it must be taken into account the structural
compromise. For this reason, it is always important to have aspect ratios which provide
structural integrity. The equilibrium between both the aerodynamic efficiency and the structural
integrity is what makes aircraft designs so exciting and different. When designing Solar Impulse,
not only was a large wing with a long wingspan ideal for the aerodynamics, but also for the
energy generation, providing more surface for solar panels to be installed.

10/1/2018
29
Figure 31. Solar impulse 2 special features location and description. [65]
Table 2. Solar Impulse 2 main parameters.
4.2.2 Solar impulse 2 design features
Creating an aircraft like this requires both a great design and top tier products. According to
Solar impulse foundation [65]. The following list gives the main features of Solar Impulse 2:
Over 17 thousand ultra-thin (135 microns thick) monocrystalline silicon solar mounted
on the wings, fuselage and horizontal tail plane.
Airframe made of composite materials (carbon fibre and honeycomb sandwich) which
provide enough rigidity and compactness to the structure and are 3 times lighter than
paper.
Using solar cells as the covering skin of the upper wing surface.
The wing’s cross section is constructed with 140-carbon fibre ribs separated 50 cm
from each other.
Four electrical brushless motors without sensors generating 17.4 hp with very little
energy loss under the wings.
The excess of energy within the 340 kWh generated each day for the solar cells is stored
in lithium polymer batteries.
All these properties are applied to Solar Impulse 2 finally having this list of parameters [65]:
Capacity
1 pilot
Weight
2.3 tons
Wingspan
72 m
Length
22 m
Number of solar cells
17,248
Solar panel’s technology
High efficiency monocrystalline silicon
Solar cell’s efficiency
23%
Batteries & Propellers
4
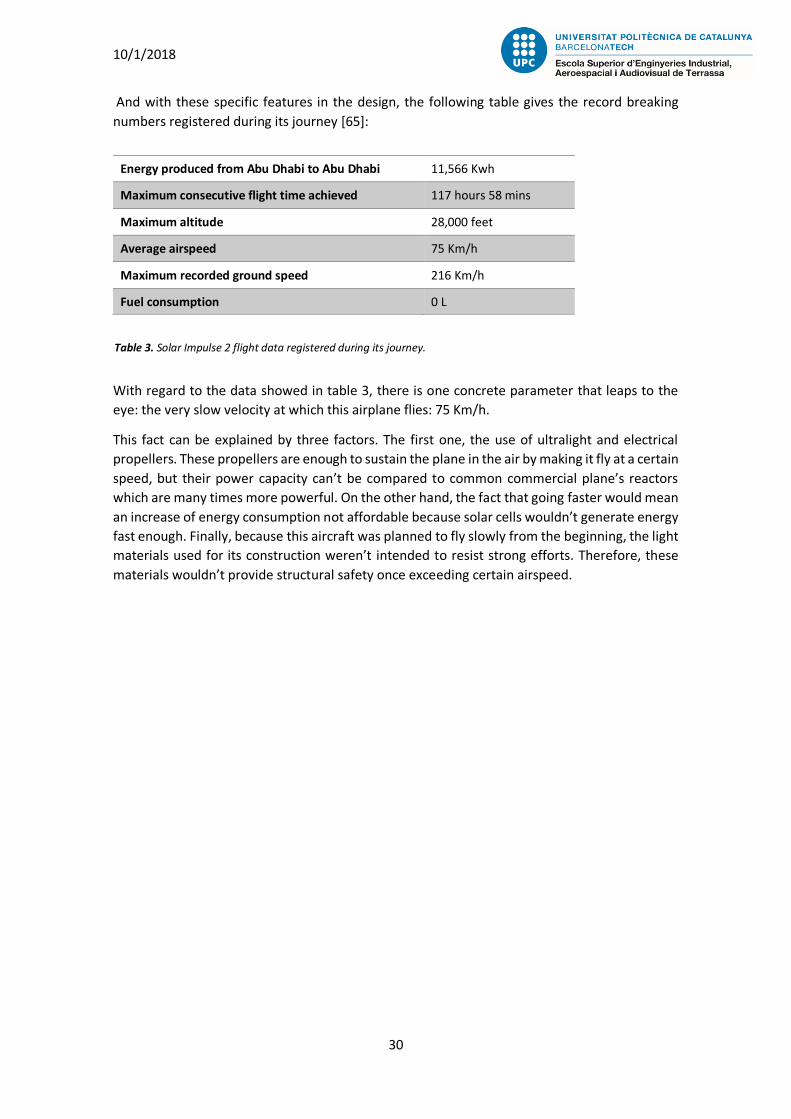
10/1/2018
30
Table 3. Solar Impulse 2 flight data registered during its journey.
And with these specific features in the design, the following table gives the record breaking
numbers registered during its journey [65]:
With regard to the data showed in table 3, there is one concrete parameter that leaps to the
eye: the very slow velocity at which this airplane flies: 75 Km/h.
This fact can be explained by three factors. The first one, the use of ultralight and electrical
propellers. These propellers are enough to sustain the plane in the air by making it fly at a certain
speed, but their power capacity can’t be compared to common commercial plane’s reactors
which are many times more powerful. On the other hand, the fact that going faster would mean
an increase of energy consumption not affordable because solar cells wouldn’t generate energy
fast enough. Finally, because this aircraft was planned to fly slowly from the beginning, the light
materials used for its construction weren’t intended to resist strong efforts. Therefore, these
materials wouldn’t provide structural safety once exceeding certain airspeed.
Energy produced from Abu Dhabi to Abu Dhabi
11,566 Kwh
Maximum consecutive flight time achieved
117 hours 58 mins
Maximum altitude
28,000 feet
Average airspeed
75 Km/h
Maximum recorded ground speed
216 Km/h
Fuel consumption
0 L

10/1/2018
31
5 PV technology selection This chapter focuses on selecting the solar power technology and product used for the purposes
of this study. To do so, different features will be considered during the selection of a PV
technology. In particular, since this study installation is being made on an aircraft surface, which
is extremely susceptible to geometric and roughness changes, some characteristics will require
special attention when defining the product.
5.1 Solar panels dimensions
The bigger a solar panel surface is, the more energy it will generate. However, when defining a
PV system size, energy can’t be the only parameter that needs to be taken into account. There
are several other factors that constrain the size of a solar module.
As follows, there is a list of other restrictive factors that must be considered before selecting a
PV system size:
Structural integrity: Increasing the dimensions of PV systems logically increases its
weight. Therefore, the efforts received by the supporting structure increase as well.
Depending on the installation, the limit the structure can withstand is higher or lower.
Thus, the structural integrity is a factor that must be taken into account when deciding
the solar panel’s size. For instance, household roofs have a limit of weight that they can
resist. In our own study, this is such an important factor, because the weight on the
airplane wings cannot exceed a certain amount. Otherwise it would change the proper
aerodynamic performance of the plane or compromise the structural safety.
Available surface: PV systems require a solid structure that provide them with
compactness. Depending on each installation and purposes, the available surface will
vary and will be a restriction when deciding the solar panel’s size.
Batteries: A considerable amount of the energy generated by PV systems is consumed
almost instantly. However, in some installations this energy is saved in batteries. It is
important to ensure that the battery will have enough capacity to save all the energy
being generated. This can be a restriction when deciding the dimensions of the panel
because generating energy that cannot be stored or used is energy wasted.
Cost: The budget each project has clearly determines the size of the installation. The
more dimensions the solar panel has, the more it will cost the material and the
complementary elements to be installed with. In particular cases, such as NASA projects,
the budget isn’t a limiting factor. However, in many installations in the mass market, the
cost of the installation, strongly linked to the size of it, is certainly a limitation.
Risk of collision: This factor is just considered for spatial PV systems because of the
existence of interplanetary debris. For instance, when designing a satellite powered by
solar energy, the bigger the solar panel’s size is, the more chances of colliding with
spatial debris.

10/1/2018
32
All these variables make the panel size an important parameter when designing a PV system
installation. In projects such as this study the panel’s dimensions are specific depending on the
installation characteristics. It’s important to correctly estimate the needs in order to choose the
optimal size.
5.1.1 Mass market standardized dimensions
In the case of the mass market, many of its projects are very similar to each other, a standard
size has been stipulated for the seller companies. Most terrestrial installations are made on the
building roofs. This size is stablished after taking several factors into consideration, such as how
it will be installed, the panel weight on the roof and if they will require reinforcements during
the installation process. The majority of companies offer two standard sizes for crystalline silicon
technology [66]:
-Residential size: 65” x 39” x 2” (which are approximately: 163 x 100 x 5 cm).
-Commercial size: 78” x 39” x 2” (193 x 100 x 5 cm).
5.1.2 Dimension customizer companies
Besides from the standardized sizes for the common residential customers, there also exist the
demand of solar panels which require customized dimensions among other different
characteristics. For this reason, there have been created solar panel companies which produce
customized products to fulfil specific customers’ demands. These products not only differ from
the residential ones in dimensions and geometry, but also bring other special features such as
ultra-thin and flexible modules (these models can be created with all kind of technologies, they
don’t necessarily have to be from thin film or organic solar technologies).
Some company names which perform this kind of services are: High Flex Solar and Solbian.
The application proposed by this study clearly demands special features. Therefore, the services
offered by these companies will be required. In chapter 7.3, this important topic will be
discussed in a more detailed way and already focusing the product for the application of this
study.

10/1/2018
33
5.2 Characteristics evaluated in the selection
Bearing in mind all the different types of PV technology which have been explained in the solar
power state of the art, the comparison between each other can be made. The objective is to
find the most suitable technology for the requirement of this study. In order to develop this
procedure, a selection technique called PRESS (see annex C) is going to be used.
In order to distinguish and select the optimal PV system for a commercial aircraft, the most
remarkable and impactful characteristics of solar technologies are going to be mentioned,
described and evaluated.
This point contains the characteristics considered for the solar technology selection, which can
be divided in two groups:
Essential characteristics: which are the ones that must be fulfilled in order to suit an
A320 installation. All the selected technologies will be accomplishing these
characteristics.
Variable characteristics: these are the ones which may differ from one model to the
other and, despite not being essential, will determine the best technology for the
commercial plane.
5.2.1. Essential characteristics:
Flexibility: Generally, thin film solar and some of the Emerging PV systems such as
organic cells are outstanding because of their levels of flexibility. By contrast, the
majority of solar panels produced with other technologies, whose installation don’t
require flexibility, are completely rigid. This is related to the inflexibility of their
protecting and structural materials.
In the case of this study, the solar panel technology sought requires the capacity of
adapting to wing slopes, requiring a certain amount of flexibility. Therefore, the
protecting materials used to cover the solar cells won’t prevent flexibility. With this, the
only flexibility limit lays on the own semiconductor flexibility. Later on this flexibility will
be proved to be enough for the structural curvature. Hence, flexibility is a parameter
which is essential for this installation. Due to this fact, it hasn’t been considered for the
press selection since all the candidate technologies will be capable of adapting onto the
required surface.
Thickness: This parameter directly affects wing aerodynamics. Solar panels thickness
may vary between 1.5 and 50 mm approximately. This huge variance between
thicknesses depends on the installation requirements. For instance, roof PV systems are
equipped with special layers providing rigidity and compactness to the whole module,
eventually increasing the thickness considerably. To be straight, all solar cells are very
thin (about 0.1 and 0.5 mm), what makes them thicker are the complementary
protecting layers.
The use of ultra-thin modules is primordial for the aerodynamic feasibility A320
installation. The thinner the module is, the less the geometry getting affected, therefore,
the better for the aerodynamics. For this reason, the technology selected will be

10/1/2018
34
installed with the simplest design possible. This means a thin back sheet, the solar cell
with its encapsulating material and a very thin and protecting front sheet. These
materials will be determined in further chapters.
Again, this is an indispensable requisite. For this reason, all the candidate technologies
will be thin enough for the installation needs.
Weight: The material’s weight is key when reducing the consumption of an aircraft.
Likewise, the weight also influences structurally. For instance, installing solar panels on
a plane’s wing means an increase of weight, leading to an increase of momentum
applied to the wing’s structure. For both reasons, having a PV installation as light as
possible is really important.
Since the thickness of the technology selected is going to be extremely thin, the weight
increase brought by the solar module installation may be neglected as a first approach.
For these reason, this parameter is again essential but won’t be weighting in the PRESS
method.
Product accessibility: The last essential characteristics has to do about the availability
of the technology in the market. For instance, dealing with top tier technologies such as
multi-junction solar cells won’t be possible. As explained previously, this kind of
technologies belong to the specialized market which means they are products extracted
from research labs. This entails two consequences: First, there isn’t enough production
capacity to cover medium-large scale production. Second, the cost increases between
500 and 1,000 times what a technology in the mass market would cost.
Those products which remain out of range for the mass market are not being considered
for the PRESS selection.
5.2.2 Variable characteristics:
Efficiency: This parameter is crucial when selecting our PV technology. Not only for the
energy obtained, but also for the surface required to obtain that energy. As is known,
more efficient panels mean more energy produced in the same surface. When installing
solar panels on an aircraft, the less surface required, the better. Less surface means less
weight, less volume occupied and less alteration on the aerodynamics.
This parameter is so important that it will be crucial when selecting the solar cell.
Ratio: 45%
Price: In economic terms solar panels are an investment. When purchasing and installing
them, flat amounts of money are being paid with no direct gain. At this point, the
purchase is clearly in negative balance. However, as times goes by and the PV systems
starts producing energy, the negative balance gets less negative, slowly tending to zero.
It will reach a point when this balance will begin to be positive and at that moment the
investor will start earning money. In order to make this procedure more appealing and
less risky for the investors, the lower the initial price, the better.

10/1/2018
35
This installation isn’t mainly meant for the sake of the investor’s prosperous economy.
Its main purpose is to reduce the amount of pollutant emitted by planes to the
atmosphere. Therefore, the price is a factor that neither should be overlooked nor be
given too much importance.
Ratio: 35%
Durability: Solar panels generation reduces slowly over time due to the degradation
they suffer from sun radiation. As efficiency, this characteristic is directly related to the
energy generation of the solar cell. In general, the effects of this degradation on PV
systems is slow. But, depending on the technology it is really variable. For instance, while
monocrystalline solar cells lose a 0.36% of the total energy generation, CIGS solar cells
lose nearly a 1%.
In spite of being a sluggish decrease, solar cells functioning last between 25 and 40 years.
Therefore, the degradation effect produces a long term negative impact to the
generation output that must be taken into account when deciding the technology that
suits this study the best. On top of that, an aircraft’s average lifespan is around 30 years,
durability is important because in long term thinking is a direct factor affecting the
efficiency.
Ratio: 20%
5.2.3 Discarded technologies
After contemplating the characteristics involved in the selection process, there are several solar
technologies which can be eliminated in advance. This point of the chapter explains which ones
have been discarded and why.
Junction solar cells: It is well known by now that this technology possesses the most
appealing technical features in the entire market. Nevertheless, since it is not available
commercially, just at laboratory level, its price would increase so much that it wouldn’t
be compensated by its top tier performance. Perhaps in a few years this technology
appears at commercial levels and it can be considered in the selection.
Emerging solar cells: These technologies are in a similar situation to Junction solar cells
but for a different reason. As their name indicates, these technologies are still under an
unsteady evolving stage. As a result, their presence in the market is yet a bit undefined.
In addition, the emerging technologies which have proven to be steady and reliable have
mediocre efficiencies to compete against the emperors of the PV market. Thus, they
have been also excluded of the selection in advance.
Thin-film solar cells: These kind of cells have evolved in parallel to crystalline silicon
technology. However, as time has gone by, this technology has considerably lost the
race against monocrystalline and polycrystalline solar cells. Currently, its impact on the
market is so low that it is barely under production. Thus, it is also being excluded from
the selection process.

10/1/2018
36
Figure 32. Slogan of SunPower enterprise [67].
Figure 33. Chart extracted from 3rd Generation Maxeon technical sheet.
Efficiency comparison between the common market products. [68]
5.3 Selected technology and product
After considering the specific parameters for each candidate (annex 3) and according to the
PRESS selection method results (annex D), high efficiency monocrystalline silicon has scored the
highest mark and has become the most suitable technology for this study.
In order to select the high efficiency monocrystalline product, a solar power company has been
selected. This company selection has been particularly easy because there is a concrete
enterprise in the market which is outstanding for its high efficiency monocrystalline products
quality: SunPower.
So, due to the quality of their high efficiency monocrystalline products their seducing 25 year
warranty, SunPower has been the selected company for this study. They will be the ones
providing the solar cell technology that best fulfils the applications demands. Among SunPower
models, 3rd Generation Maxeon solar cell is the newest high efficiency monocrystalline product.
In consequence, it has the best properties between its category. For this reason, it will be the
product used from now on to keep the development of this study.
5.3.1 Maxeon Gen III specific characteristics
According to 3rd Generation Maxeon technical sheet [68], these are the main advantages it
presents among other products:
Efficiency advantage: This characteristic was expectable since this product has the
greatest efficiency among all the products in the mass market.
Energy advantage: Related to its high efficiency, 3rd Generation Maxeon solar cell
delivers the highest energy per rated watt.

10/1/2018
37
Figure 34. 3rd Generation Maxeon solar cell flexibility demonstration. [68]
Figure 35. Chart extracted from 3rd Generation Maxeon technical sheet. Spectral response
comparison between SunPower Maxeon solar cell and conventional solar cells. [68]
Durability advantage: This solar cell has the capacity to resist extreme conditions in very
different applications, allowing it to maintain its elevated performance for long periods.
These resisting properties are linked to:
- High corrosion resistance: SunPower works with a tin-copper metal system
which has better corrosion resistance than conventional solar cell anti-corrosion
mechanisms.
- High flexibility and crack resistance: Maxeon is thinner and more flexible than
conventional solar cells. Besides, in case of structural crack, Maxeon backside
copper metal foundation protects the cell from losing power output.
Broader spectral response: As explained in chapter 2.5.1, broader spectral response
means more absorbance capacity and, thus, in increase on the efficiency. Maxeon Gen
III is gifted with broader spectral response than many other solar cells on the mass
market.
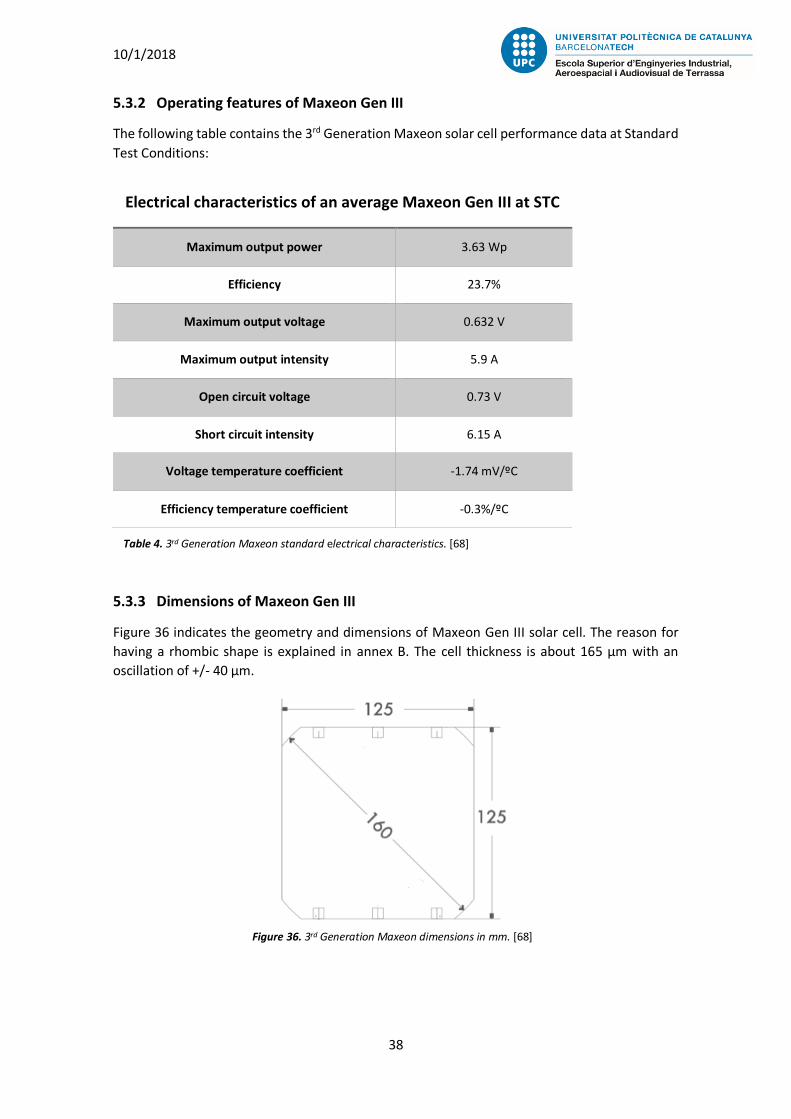
10/1/2018
38
Table 4. 3rd Generation Maxeon standard electrical characteristics. [68]
Figure 36. 3rd Generation Maxeon dimensions in mm. [68]
5.3.2 Operating features of Maxeon Gen III
The following table contains the 3rd Generation Maxeon solar cell performance data at Standard
Test Conditions:
Electrical characteristics of an average Maxeon Gen III at STC
Maximum output power
3.63 Wp
Efficiency
23.7%
Maximum output voltage
0.632 V
Maximum output intensity
5.9 A
Open circuit voltage
0.73 V
Short circuit intensity
6.15 A
Voltage temperature coefficient
-1.74 mV/ºC
Efficiency temperature coefficient
-0.3%/ºC
5.3.3 Dimensions of Maxeon Gen III
Figure 36 indicates the geometry and dimensions of Maxeon Gen III solar cell. The reason for
having a rhombic shape is explained in annex B. The cell thickness is about 165 µm with an
oscillation of +/- 40 µm.
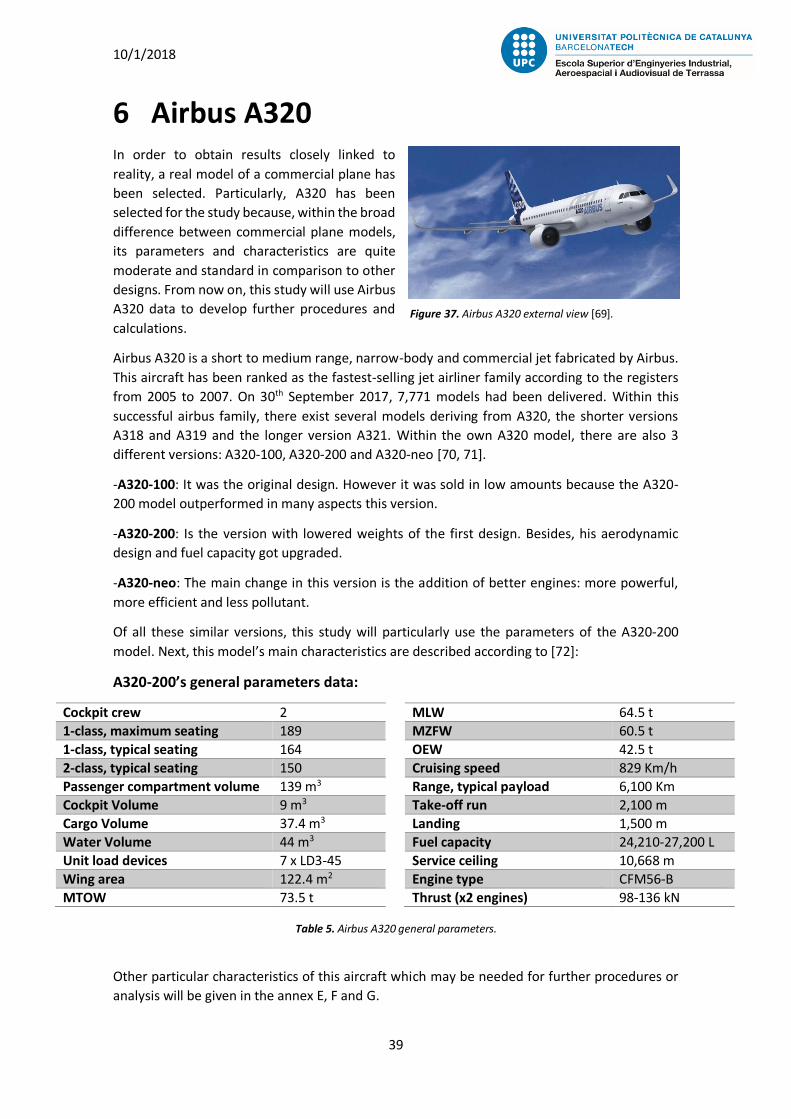
10/1/2018
39
Figure 37. Airbus A320 external view [69].
Table 5. Airbus A320 general parameters.
6 Airbus A320 In order to obtain results closely linked to
reality, a real model of a commercial plane has
been selected. Particularly, A320 has been
selected for the study because, within the broad
difference between commercial plane models,
its parameters and characteristics are quite
moderate and standard in comparison to other
designs. From now on, this study will use Airbus
A320 data to develop further procedures and
calculations.
Airbus A320 is a short to medium range, narrow-body and commercial jet fabricated by Airbus.
This aircraft has been ranked as the fastest-selling jet airliner family according to the registers
from 2005 to 2007. On 30th September 2017, 7,771 models had been delivered. Within this
successful airbus family, there exist several models deriving from A320, the shorter versions
A318 and A319 and the longer version A321. Within the own A320 model, there are also 3
different versions: A320-100, A320-200 and A320-neo [70, 71].
-A320-100: It was the original design. However it was sold in low amounts because the A320-
200 model outperformed in many aspects this version.
-A320-200: Is the version with lowered weights of the first design. Besides, his aerodynamic
design and fuel capacity got upgraded.
-A320-neo: The main change in this version is the addition of better engines: more powerful,
more efficient and less pollutant.
Of all these similar versions, this study will particularly use the parameters of the A320-200
model. Next, this model’s main characteristics are described according to [72]:
A320-200’s general parameters data:
Other particular characteristics of this aircraft which may be needed for further procedures or
analysis will be given in the annex E, F and G.
Cockpit crew 2
1-class, maximum seating 189
1-class, typical seating 164
2-class, typical seating 150
Passenger compartment volume 139 m3
Cockpit Volume 9 m3
Cargo Volume 37.4 m3
Water Volume 44 m3
Unit load devices 7 x LD3-45
Wing area 122.4 m2
MTOW 73.5 t
MLW 64.5 t
MZFW 60.5 t
OEW 42.5 t
Cruising speed 829 Km/h
Range, typical payload 6,100 Km
Take-off run 2,100 m
Landing 1,500 m
Fuel capacity 24,210-27,200 L
Service ceiling 10,668 m
Engine type CFM56-B
Thrust (x2 engines) 98-136 kN

10/1/2018
40
6.1 A320 vs Solar Impulse 2
Since Solar Impulse 2 is an aircraft explicitly constructed to fly with only solar power, it can be
designed optimally for its purpose. Thanks to its light and concrete design, with great
aerodynamic efficiency and large surface for solar panels, this aircraft is able to take off and fly
with just renewable solar energy. However, when Solar Impulse 2 is compared to a common
commercial plane, such as A320, it is easy to realize the huge difference between each.
Commercial planes are designed for transporting people, meaning that all the design will be
focused on optimizing the amount of people the plane can carry at the lowest consumption and
optimal speed possible. For this reason, this type of planes have totally different characteristics.
When compared to Solar Impulse 2, commercial planes are way heavier, faster, bigger, more
expensive and more resistant.
As mentioned before, such planes focus on allowing people to be inside. To make room for
passengers and crew inside a plane, it is not aerodynamically optimal to make the wings bigger
so that people can fit in them. Thus, the alternative is to enlarge the section’s fuselage and make
enough room in it for the whole boarding. Structurally, this requires concrete materials which
can support all the pressure efforts and wearing applied during the flights. Eventually, since
there is an increase of structural volume and the materials used are heavier, the weight of the
plane increases so much that it gets substantially heavier than Solar Impulse 2.
There also the need to take into account the speed at which commercial planes fly, in the case
of A320 its medium cruise speed is 829 Km/h. The main characteristic which makes commercial
flights so attractive are their high velocity. Reducing this feature up to almost 11 times is not
desired. Besides, flying at 829 Km/h requires, again, certain materials capable of resisting the
mechanical efforts applied due to the wind pressure. These materials also increase considerably
the weight of the aircraft.
To make things straight, the consumption required to sustain an airbus A320, considering its
weight and airspeed, can’t be compared by the one required for Solar Impulse 2.
6.1.1 Numerical comparison
Now, in order to have a numerical point of view of the difference between the energetic
demands of each plane, let’s perform some easy calculations. Concretely, the mechanical energy
of both Solar Impulse 2 and A320 when flying at their common cruise airspeed are going to be
compare.
*Notice that this procedure only pretends to give a basic concept of how different this planes
are in terms of structural design, materials and flight parameters.
So, the mechanical energy is the sum of potential and kinetical energy:
𝐸𝑚𝑒𝑐 = 𝐸𝑝𝑜𝑡 + 𝐸𝑘𝑖𝑛 ( 2 )

10/1/2018
41
And these are the expressions which describe them:
Where 𝑚 is the mass of the aircraft, 𝑔 is the gravity in Earth, ℎ is the altitude at which the aircraft
flies and 𝑣 is the velocity at which the aircraft moves.
Solar impulse case:
𝑚 = 2.3 𝑡 = 2,300 𝑘𝑔
𝑣 = 75 𝑘𝑚
ℎ= 20.8
𝑚
𝑠
ℎ = 28,000 𝑓𝑡 = 8,534.4 𝑚
With these values, the potential and the kinetical energy equal 192.5 MJ and 0.5 MJ respectively.
Therefore, the mechanical energy has a value of 193 MJ
A320 case,
𝑚 = 70 𝑡 = 70,000 𝑘𝑔 (a round value near MTOW has been used)
𝑣 = 829 𝑘𝑚
ℎ= 230.3
𝑚
𝑠
ℎ = 35,000 𝑓𝑡 = 10,668 𝑚
With these values, the potential and the kinetical energy equal 7,325 MJ and 1,860 MJ
respectively. Therefore, the mechanical energy has a value of 9,185 MJ.
Now, dividing the mechanical energy values from above, a ratio of 47.6 is obtained. This means
that the mechanical energy of an A320 is 47.6 times bigger than the one of Solar Impulse 2. Such
a big energetic difference proves how different these two aircrafts are. With this result, it can
be safely predicted that nowadays it is unfeasible to build a fully sun-powered commercial plane.
Even if an airbus A320 was designed to have all its sun-exposed surface covered by solar panels,
the energy generated by them would only contribute to a tiny percentage of all the energy
needed to make the plane fly.
Solar Impulse 2 has around 270 m2 of its surface covered by solar cells. This solar cells have an
efficiency of 23.5, collecting 340 kWh per day. Now, to reproduce an optimal PV generation in
A320, the following assumptions are made:
The whole wing is a surface able to house PV systems. Some of the aerodynamic devices
could unable the PV installation. However, for this first approach, all this impediments
are ignored. In chapter 11.1 the real wing surface available will be determined.
The panels installed on the fuselage suffer an efficiency reduction due a significant tilting
angle deviation (check chapter 2.5.3, geometry of sun angle). Since the fuselage section
is round, only one thin row of solar panels is aligned with the sunlight. From that point,
the rest of the panel surface inclines progressively, thus losing efficiency at the same
rate. For this reason, an approximated value of 3 meters will be considered as the
perimeter where solar panels will be installed.
𝐸𝑝𝑜𝑡 = 𝑚 · 𝑔 · ℎ ( 3 )
𝐸𝑘𝑖𝑛 = 1
2· 𝑚 · 𝑣2
( 4 )

10/1/2018
42
3 m
Figure 38. Fuselage applicable surface dimensions. Adapted from the figures in annex E.
Now, considering the A320’s dimensions obtained from annex E, the hypothetical surface is
determined:
Wing surface: 122.4 m2.
Cabin fuselage applicable surface: In agreement with the reasons commented
previously, the surface has 3 meters wide. The length of the fuselage surface comes
determined by the longitude of the cabin broad section, which are 25 meters:
Multiplying width and length, the surface in the fuselage is equal to 75 meters. Therefore,
summing the fuselage surface with the wing surface, the total surface of PV installation is
determined.
𝑆 = 𝑊𝑠 + 𝐹𝑠 ( 5 )
Where 𝑆 is the estimated PV total surface, 𝑊𝑠 is the wing surface and 𝐹𝑠 is the fuselage surface.
Finally, the total surface has a value of 197.4 m.
6.1.2 Chapter conclusions
This fast calculations have shown that A320 has less capacity to house solar panels than Solar
Impulse 2. Again, this was expectable: while Solar Impulse has been specifically design to use PV
panels as unique power source, A320 design has never contemplated the possibility of utilizing
solar panels. This result proves once more the unreliability of a fully sun powered A320. Not only
this aircraft needs way more energy to fly than Solar Impulse 2, but also it has less capacity to
wear PV systems on its surface.
PV systems electric generation is really low compared to the total A320 energy demand. Thus,
PV installations will be understood as an additional supply to the whole A320’s energetic system.
The most effective way to fulfil this duty is providing energy to the electric system of the plane.
Hence, PV systems become fuel consumption reducers. Reducing the amount of fuel jet burnt
during the flight implies a reduction of the pollution emitted and financial rewards for the
company.
From now on, this study will focus on determining the amount of energy provided by the PV
system installed. Calculating the energetic contribution to the aircraft and comparing it with
energetic consumptions during the A320 RF are energetic goals to be quantified.
25 m

10/1/2018
43
Figure 39. 3rd Generation Maxeon solar cell applications. Images extracted from Sunpower and Solbian official
sites. [67, 73]
7 Adapting PV systems on A320 3rd Generation Maxeon solar cell has been designed with a technology which makes it a valid
option for several applications. It can be installed on residential roofs, on business buildings, in
extended solar power plants and even transports (boats, cars, trucks, etc.).
Despite the broad area of applications in which MGIII is used, installing it on a commercial
aircraft is on a different level of compromise. This chapter focus on evaluating the feasibility of
adapting PV systems on commercial aircrafts.
7.1 PV adaptation analysis on A320
As mentioned in the previous chapter, the speed and height at which a commercial plane travels
are much higher than other transports. On the one hand, the high speed entails important
pressure gradients and an increased sensitivity to the roughness the PV installation might bring
to the surface. On the other hand, the great heights involve strong temperature variance
between the cruise flight time and the near land flight time in which solar panels get
considerably heated up. Therefore, both of these operating requirements entail the need for
special materials and techniques will have to be considered to make this installation feasible and
durable in physical and aerodynamic terms.
These are the three peculiarities contemplated when adapting Maxeon Gen III solar cells on
A320:
Pasting/including PV systems on A320 surface: Adding PV devices on A320 surface can
be performed in two ways: Uniting them by pasting methods or directly including it in
the airplane design, taking into account all the additional accessories it will require.
Since determining the detailed PV installation technical procedures on A320 is not part
of the scope, the study won’t provide detailed information regarding this topic.
The first option consists in adapting the solar modules by using an ultra-adhesive
material. Logically, the union created should be resistant to all the pressure and
temperature gradients experienced by the aircraft surface.

10/1/2018
44
If this option became viable, it would allow the already existing commercial aircrafts to
have added the installation, thus, enabling a much faster implementation of the system
on the aerial transport sector. Despite all these interesting advantages, this process also
has several impediments: To begin with, it is unlikely to find a pasting method capable
of resisting the aircraft surface stresses repeatedly for a long time. Another problem
would be the connection between solar panel and batteries inside the aircraft. To
connect them, it would be necessary to create small holes for the feeders, which would
endanger structural safety. And finally, additional room would be required for the
equipment and system redundancies to control the solar energy generation and
distribution. All these reasons seem to indicate that solar panels need to be included in
the design of the plane, not a posteriori.
The second option is about including the PV system as a part of the aircraft design.
Meaning that, during the building process of the aircraft, the PV system and the aircraft
surface are considered a single part. First of all, this option would provide compactness
and protection to the design, eventually providing extended durability. Besides, the
aircraft electric net would already take into account the required elements for the PV
installation.
This possibility brings a more convincing linkage between the aircraft and the PV
module, providing a more compact union and eventually becoming a more feasible
option. The main problem of this solution is that is not applicable for the already existing
aircrafts, thus leading to a slower implementation of the installation.
Significant operating temperature changes: Due to the great heights at which these
machines fly, the temperature of their surface descends a lot during the cruise. As
explained in chapter 2.5.5, this feature is beneficial for the solar cell generation.
Nonetheless, in terms of durability it may become a threat.
During the TRT, an aircraft stands still on the ground being irradiated by the sun. As it
has been explained in previous chapters, solar panels tend to reach between 30 and
45ºC. By contrast, at 35,000 feet the aircraft surface temperature reaches temperatures
near -30ºC (in chapter 10.1.1 the exact temperature is determined according to the
FCOM). According to FCOM (annex G, figure 13) A320 spends around 25 minutes to
climb up to 35,000 feet. Therefore, the solar panel suffers a gradient of 60-75ºC in less
than half an hour. Besides, it must be considered that these thermic changes occur twice
per flight and that an aircraft tends to perform several flights each day. Hence, it is
important that the materials chosen to compose the solar cell structure (encapsulating
and protecting layers) are capable of resisting these temperature gradients cyclically.
Surface finish roughness: PV modules often use antireflection protecting layers with
micro roughness on its surface finish. This discontinuity at its surface improves the
amount of light entering the solar cell and going through the semiconducting materials
[72]. However, in the case of this study, a front sheet with roughness would have a
negative impact on the aircraft aerodynamics. Thus, in order not to harm the
aerodynamics of the wing, a smooth front sheet will be required.
In the section 7.3 the level of roughness of the front sheet material is determined.
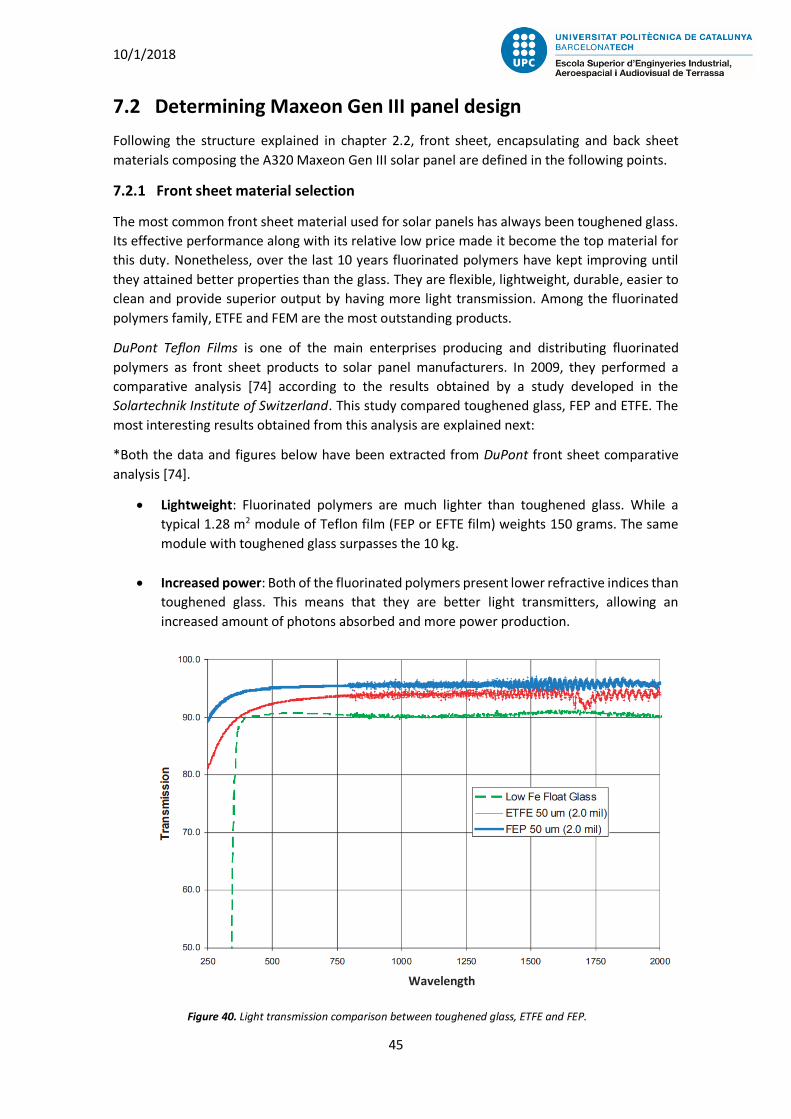
10/1/2018
45
Figure 40. Light transmission comparison between toughened glass, ETFE and FEP.
7.2 Determining Maxeon Gen III panel design
Following the structure explained in chapter 2.2, front sheet, encapsulating and back sheet
materials composing the A320 Maxeon Gen III solar panel are defined in the following points.
7.2.1 Front sheet material selection
The most common front sheet material used for solar panels has always been toughened glass.
Its effective performance along with its relative low price made it become the top material for
this duty. Nonetheless, over the last 10 years fluorinated polymers have kept improving until
they attained better properties than the glass. They are flexible, lightweight, durable, easier to
clean and provide superior output by having more light transmission. Among the fluorinated
polymers family, ETFE and FEM are the most outstanding products.
DuPont Teflon Films is one of the main enterprises producing and distributing fluorinated
polymers as front sheet products to solar panel manufacturers. In 2009, they performed a
comparative analysis [74] according to the results obtained by a study developed in the
Solartechnik Institute of Switzerland. This study compared toughened glass, FEP and ETFE. The
most interesting results obtained from this analysis are explained next:
*Both the data and figures below have been extracted from DuPont front sheet comparative
analysis [74].
Lightweight: Fluorinated polymers are much lighter than toughened glass. While a
typical 1.28 m2 module of Teflon film (FEP or EFTE film) weights 150 grams. The same
module with toughened glass surpasses the 10 kg.
Increased power: Both of the fluorinated polymers present lower refractive indices than
toughened glass. This means that they are better light transmitters, allowing an
increased amount of photons absorbed and more power production.
Wavelength

10/1/2018
46
Figure 41. Power capacity factors of solar panels using ETFE or FEP front sheets.
Figure 42. Solar transmittance degradation over time of FEP and toughened glass.
Figure 40 displays the data comparison on the light transmission between the three
products. The toughened glass (low Fe float glass) clearly has less transmission than both
of the two Teflon products. Between them, FEP shows a 2% higher light transmission
than ETFE.
In order to have a more detailed sample, ETFE and FEP are compared in energetic terms:
The power output difference on solar panels using ETFE and FEP is displayed in figure
41. On average, solar panels with FEP front sheet type generated 5% more power output
than those with ETFE.
Durability: Fluorinated polymers are also long-lasting. A comparative test between FEP
and toughened glass was performed, it compares their solar panel power output over
the years.
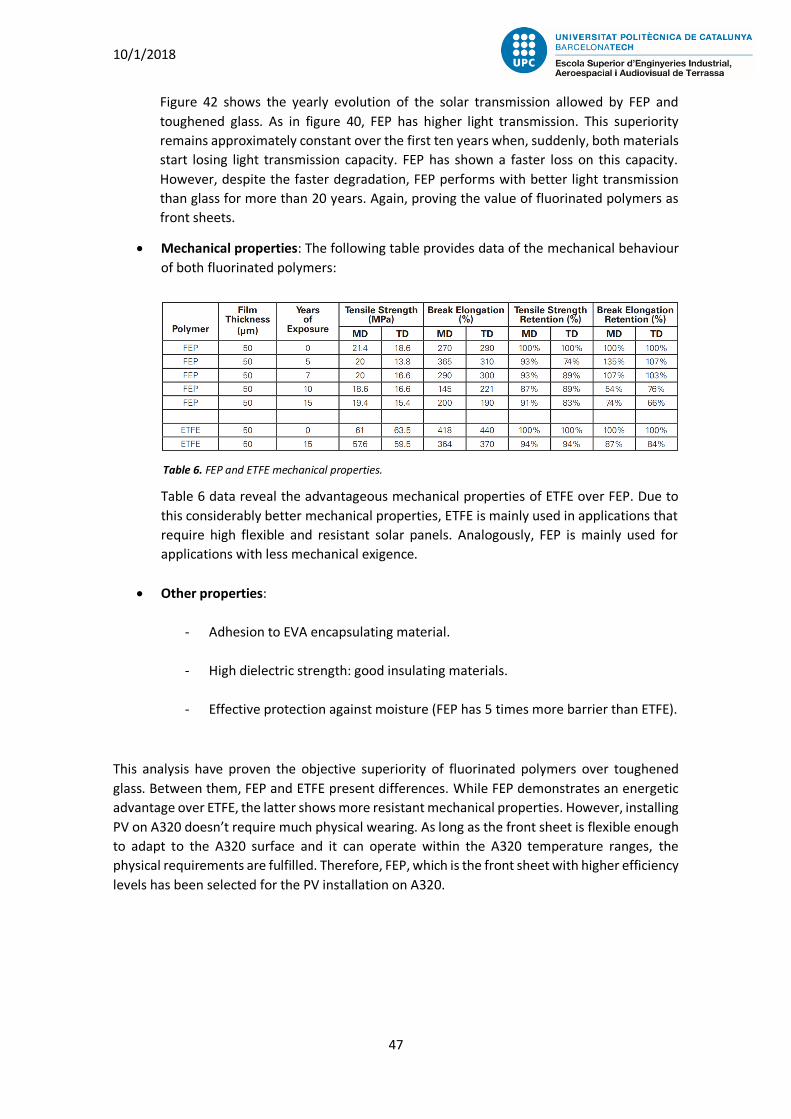
10/1/2018
47
Table 6. FEP and ETFE mechanical properties.
Figure 42 shows the yearly evolution of the solar transmission allowed by FEP and
toughened glass. As in figure 40, FEP has higher light transmission. This superiority
remains approximately constant over the first ten years when, suddenly, both materials
start losing light transmission capacity. FEP has shown a faster loss on this capacity.
However, despite the faster degradation, FEP performs with better light transmission
than glass for more than 20 years. Again, proving the value of fluorinated polymers as
front sheets.
Mechanical properties: The following table provides data of the mechanical behaviour
of both fluorinated polymers:
Table 6 data reveal the advantageous mechanical properties of ETFE over FEP. Due to
this considerably better mechanical properties, ETFE is mainly used in applications that
require high flexible and resistant solar panels. Analogously, FEP is mainly used for
applications with less mechanical exigence.
Other properties:
- Adhesion to EVA encapsulating material.
- High dielectric strength: good insulating materials.
- Effective protection against moisture (FEP has 5 times more barrier than ETFE).
This analysis have proven the objective superiority of fluorinated polymers over toughened
glass. Between them, FEP and ETFE present differences. While FEP demonstrates an energetic
advantage over ETFE, the latter shows more resistant mechanical properties. However, installing
PV on A320 doesn’t require much physical wearing. As long as the front sheet is flexible enough
to adapt to the A320 surface and it can operate within the A320 temperature ranges, the
physical requirements are fulfilled. Therefore, FEP, which is the front sheet with higher efficiency
levels has been selected for the PV installation on A320.

10/1/2018
48
7.2.2 Encapsulating material selection
There are several encapsulating materials for solar panel applications. Each one of them has
particular characteristics. In the list that follows, the main features for each one of these
materials are described according to the article from Research Gate, Overview of PV module
encapsulation materials [75]:
EVA (ethylene vinyl acetate): Has the best ratio quality-price, its projection has made it
improve tremendously over the years thanks to research. It is by far the most popular
choice in the encapsulating role.
PVB (polyvinyl butyral): Similar material costs to EVA but with sensitiveness to
hydrolysis. It has better UV stability than EVA and better adhesion to glass, but worse to
fluorinated polymers. Finally, it has a fast processing time.
TPO (thermoplastic polyolefin elastomer): Currently it is hardly used. It was commonly
applied for vehicles and industry. It has a really cheap cost of fabrication but has lower
stats than the other encapsulating materials in the majority of properties.
Silicon: Very promising as an encapsulating material, it has exceptional properties.
However, due to its high production price it is only used in certain applications such as
spatial solar panels. Its situation as encapsulating material is like the junction technology
as solar cell (chapter 3.3.1).
TPSE (thermoplastic silicon elastomer): Is the combination of silicon supreme
performance along with thermoplastic processing. Its intention is to become a silicon
derivate with lower production prices. But still, they are too expensive to compete
against EVA.
Ionomer: Represent a different and innovative type of encapsulating material which has
been intensively researched over the last two years. It is still expensive but the really
good performance of this encapsulating material makes it promising in the future.
After analysing the principal characteristics of the encapsulating materials on the market, a
selection has been made for this study:
EVA is the most favoured encapsulating material for the A320 PV installation. Firstly, due to its
outstanding characteristics along with its affordable price. In addition, its good adhesive
behaviour with fluorinated polymers makes it a perfect match with the front sheet choice.
However, one last thing needs to be checked: EVA inferior range of temperature needs to be
lower than A320 operating temperatures. According to the Mechanical behaviour and thermal
stability of EVA encapsulant material used in photovoltaic modules [76], EVA can operate down
to -40 ºC, when it begins to suffer structural changes. In chapter 10.1.1, the minimum
temperature reached in A320 surface is stated according to FCOM: -27ºC. Hence, EVA fits A320
operating temperatures during the reference flight, eventually consolidating as the
encapsulating material selected.
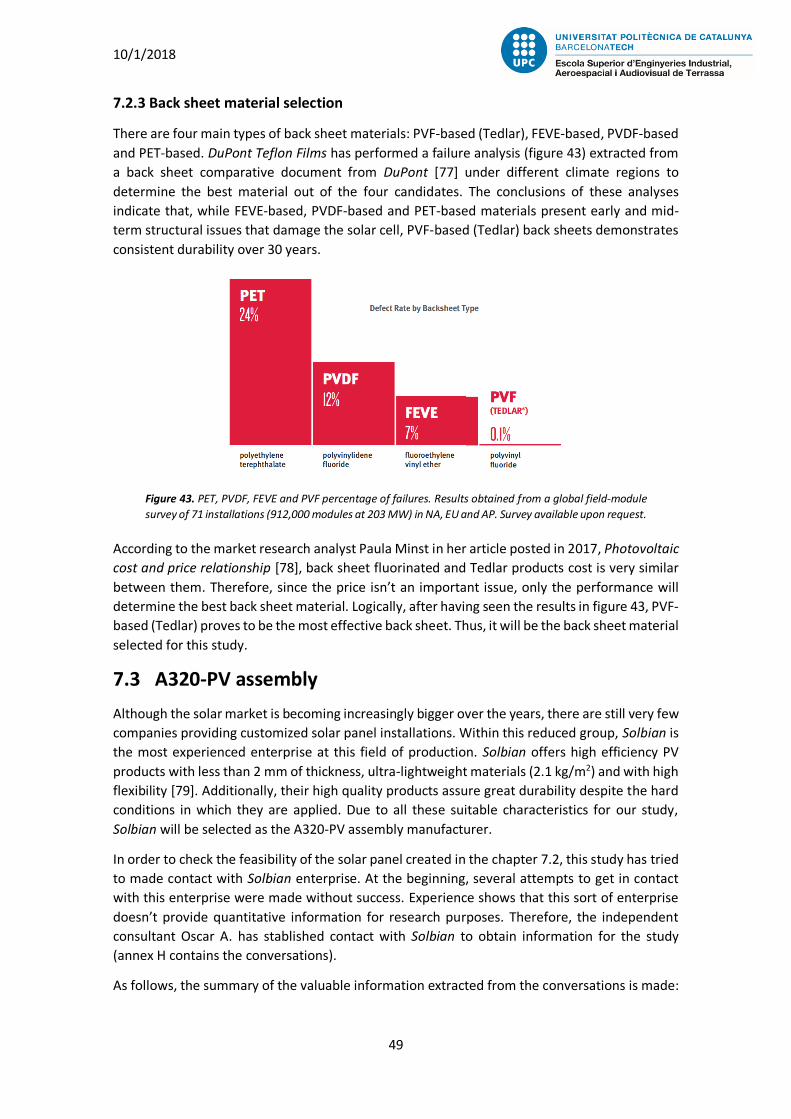
10/1/2018
49
Figure 43. PET, PVDF, FEVE and PVF percentage of failures. Results obtained from a global field-module
survey of 71 installations (912,000 modules at 203 MW) in NA, EU and AP. Survey available upon request.
7.2.3 Back sheet material selection
There are four main types of back sheet materials: PVF-based (Tedlar), FEVE-based, PVDF-based
and PET-based. DuPont Teflon Films has performed a failure analysis (figure 43) extracted from
a back sheet comparative document from DuPont [77] under different climate regions to
determine the best material out of the four candidates. The conclusions of these analyses
indicate that, while FEVE-based, PVDF-based and PET-based materials present early and mid-
term structural issues that damage the solar cell, PVF-based (Tedlar) back sheets demonstrates
consistent durability over 30 years.
According to the market research analyst Paula Minst in her article posted in 2017, Photovoltaic
cost and price relationship [78], back sheet fluorinated and Tedlar products cost is very similar
between them. Therefore, since the price isn’t an important issue, only the performance will
determine the best back sheet material. Logically, after having seen the results in figure 43, PVF-
based (Tedlar) proves to be the most effective back sheet. Thus, it will be the back sheet material
selected for this study.
7.3 A320-PV assembly
Although the solar market is becoming increasingly bigger over the years, there are still very few
companies providing customized solar panel installations. Within this reduced group, Solbian is
the most experienced enterprise at this field of production. Solbian offers high efficiency PV
products with less than 2 mm of thickness, ultra-lightweight materials (2.1 kg/m2) and with high
flexibility [79]. Additionally, their high quality products assure great durability despite the hard
conditions in which they are applied. Due to all these suitable characteristics for our study,
Solbian will be selected as the A320-PV assembly manufacturer.
In order to check the feasibility of the solar panel created in the chapter 7.2, this study has tried
to made contact with Solbian enterprise. At the beginning, several attempts to get in contact
with this enterprise were made without success. Experience shows that this sort of enterprise
doesn’t provide quantitative information for research purposes. Therefore, the independent
consultant Oscar A. has stablished contact with Solbian to obtain information for the study
(annex H contains the conversations).
As follows, the summary of the valuable information extracted from the conversations is made:

10/1/2018
50
Manufacturing feasibility: Solbian enterprise has confirmed the capacity of fabricating
a PV module with the custom characteristics asked: FEP front sheet, EVA encapsulant
and PVF Tedlar back sheet. Actually, the module demanded is identical to one they
already have in stock: SP 118 L.
These are the most important features of SP 118 L for the purposes of this study:
- Thickness of 2 mm.
- Weight of 2 kg/m2.
- Size: 4x9 Maxeon Gen III cells (125x125 mm). Thus, module size: 500x1125 mm.
- Very flexible.
- Available with different front sheet (the smother one will be selected).
- Adaptable to any battery within 5-48 Volt range.
- Operating temperature range: -40/+85ºC.
- 30 years of proper functioning.
All these features ideally suit the requirements demanded to be installed on A320 and
perform the RF.
Cost: Since the photovoltaic market is in constant evolution, companies compete
against each other to offer best products at the best price. This context creates an
environment of confidentiality that makes it really hard to obtain fixed prices without
guaranteeing your will to buy the product. Nonetheless, thanks to the conversation
carried out by Oscar A. with Solbian, this study managed to obtain some specific prices.
Firstly, Solbian offered the modules at 470 €/unit considering a small delivery. Then,
they made a new offer of 330.4 €/unit considering a long term contract. Although this
price is much more reasonable than the first, it is still too expensive.
Regarding the complementary elements of the PV installation, A320 electrical system
already includes batteries, inverters and charge controllers. Therefore, this study
doesn’t contemplate the need to purchase additional ones.
Despite the cost disagreement, this study will stick to Solbian offer due to the higher
compromise level they have shown. Thus, the cost per module is defined as 330.4 €/unit.
Roughness: In agreement with Solbian, the front sheet material roughness has a really
smooth surface finish. They don’t possess the technical values defining the roughness
levels. However, they have suggested that the smoothness level is so high that it won’t
affect the aerodynamics of the aircraft.
Geometry adaptation: While solar modules have rectangular shapes, the aircraft wing
is similar to a triangle. When installing the modules on the wing surface, some of them
will have to be adapted geometrically so that they can fit the diagonals at the edges.
This geometrical adaptation is not a major issue for the installation feasibility. Therefore,
this study won’t analyse this issue any further.
10/1/2018
51
8 Electric generation in A320 During a mission, aircrafts supply electric power to all those instruments and accessories which
require electricity for their functioning. All this equipment implies an additional consumption
that increases fuel demand and must be taken into account.
On the ground, when the engines are off, the electrical energy is provided by the APU or the
GPU. Once the main engines have been turned on, they are the ones in charge of generating
electricity. In further points of this chapter this will be explained more accurately.
The objective in this chapter is to describe the utilities and functioning of all the systems involved
in the A320’s electric energy generation as well as explaining A320’s electric system
components, structure and nominal values.
8.1 APU
The Auxiliary Power Unit (APU) is mainly a single-shaft gas turbine which delivers mechanical
shaft power for driving the accessory gearbox (starter, electrical generator, etc.) and produces
bleed air used for the engine’s starting and the pneumatic supply to the plane. The APU is mainly
designed for activating the plane’s engines and, also, to energetically support the plane in
several situations. In airlines, this device is commonly installed at the rear part of the aircraft.
As follows, the APU functions are listed and described according to the A320 FCOM, chapter
1.49.10 [80]:
8.1.1 Functions on the ground
Start the engines: Because of their heaviness, a lot of torque is required for the engines
to spin. This torque is so big than a starter battery can’t generate enough power to
accomplish it. For this reason, the starter battery, instead of trying to spin up the main
engines without success, spins up the APU which is smaller and requires much less
torque. Once the APU is started, it generates high-speed bleed air (compressed air) that
is directed to the main engines so that these can finally start spinning.
In order to save energy from batteries, during the turn round time APU can be used to
provide electric power to several electric systems of the aircraft. For instance, enabling
air conditioning systems to run while passengers are boarding, or even more important,
running systems to perform pre-flight checks. Some APUs are also connected to a
hydraulic pump allowing the crew to operate with the hydraulic equipment flaps
previous to the main engine start.
From the moment APU has started the main engines, these are the ones in charge of supplying
electric power to the plane during the flight. For this reason, in many flights, APU is turned off.
However, there are other functions APUs can carry out in order to support the aircraft’s energy
requirements.

10/1/2018
52
Figure 44. APU internal distribution and principles of functioning.
8.1.2 Functions during takeoff
During takeoffs, the main engines need most of their power. In some takeoffs APU is
kept on to supply electric power to the aircraft systems so that the main engines can
use all their power to produce thrust.
8.1.3 Functions in flight
During the flight, if an engine were to fail, APU can be turned on in order to restart the
dead engine. However, the APU is a device designed to work within certain altitude
ranges, thus, if an aircraft required to turn APU in flight, a considerable descent to reach
operational APU altitudes would be needed.
Apart from the APU, there are two other systems to restart an engine during the flight:
the cross bleed air system, which consists of providing the bleed air from a working
engine to the dead engine, and the RAM air turbine, which is a wind turbine capable of
generating enough energy for a relight.
As it can be seen on the figure, external air enters the APU system and arrives in a cavity where
air enters the compressors spinning at high RPM. Left compressor leads the air to both the bleed
air conduct (used for starting the engines) and the surge control valve which controls the
working pressure of the APU’s turbine. Right compressor leads the compressed air to the
combustion chamber, where it will be ignited with the aircraft’s fuel to accelerate the flux and
spin up the turbine. Inside the gearbox there is an electromagnetic generator which uses the
RPM to induce an electromagnetic field for the eventual goal of creating electrical current.
APU’s principle of functioning is very similar to the one for main engines. The main difference is
that APU is way smaller, thus being less powerful. When talking about the engine, which has a
very similar functioning, a more accurate description will be made.
10/1/2018
53
8.2 GPU
The Ground Power Unit (GPU) is a vehicle designed to supply electrical power to the aircraft
during TR. The electric energy is sent to the aircraft through an insulated feeder capable of
transporting the electricity with the parameters in which the plane works.
The main advantages of the GPU over the APU are related to the fuel consumption. APU requires
airplane fuel to work, meaning an additional fuel consumption for the company and additional
emissions to the atmosphere. Besides, these emissions are sent right in the middle of the airport
where many jet bridge workers are directly exposed to it. GPU is clean of fuel consumption, so
it is a cleaner way to supply power during the TR.
In the case of using a GPU instead of the APU, the air bleed to start the engines can be supplied
by a ground unit called huffer cart. If neither a huffer cart nor APU were available, pilots would
leave one engine on to start the other one when departing.
8.3 CFM56
Commercial aircrafts are propelled by turbofan engines which generate thrust by ejecting the
exhaust gases at high speed. Apart from propelling the plane, these engines are capable of
creating electrical power for the airplane’s systems using electromagnetic generators (same as
in the APU).
A320’s engine uses different CFM56 models from the CFM international. This company
develops, produces and sells advanced-technology engines, in which CFM56 is the world’s best-
selling engine. Specifically, this study will focus on the CFM56-5B6 model, which is one of the
most typical used in A320-200 series.
8.3.1 Main features
Here there are the CFM56-5B6 principal features according to the official CFM site [81]:
Take of thrust range: between 98kN and 147kN. The maximum CFM56-5B6’s thrust is
higher than the maximum A320 thrust (in table 6 is pointed as 136kN). This difference
with the maximum thrust values is due to structural and ergonomic issues.
Bypass ratio: can reach values up to 6. This parameter refers to the amount of mass flux
entering the core and the mass flux bypassing it.
Overall pressure ratio: 34.4. Indicates the pressure difference between the inlet and the
outlet.
Fan diameter: 1.73 m
Compressor stages: CFM56-5B6 has a total of 14 compressions. One in the fan, four in
the booster and nine in the HPC (high pressure compressor).
Turbine stages: So, the turbine has 5 stages: one in the HPT (high pressure turbine) and
four in the LPT (low pressure turbine).

10/1/2018
54
Figure 45. Three views of CFM56-5B6 gradually entering into detail.
Figure 46. CFM56-5B6 propeller.
Figure 47. The 13 CFM56-5B6 core compressors.
8.3.2 Principle of functioning
Turbofans accelerate the air between the front and the back of the engine to generate thrust.
In order to produce this acceleration, the air entering the engine goes through a huge fan
spinning at high RPM which compresses and speeds up the air ejecting it at high speed. Part of
the entering air goes through the turbofan’s core, where it will be charged with kinetic energy.
This kinetic energy is absorbed by the turbines which transform it into mechanical energy
(spinning motion). Now, a detailed description of this procedure is explained:
*CFM official site is the source of the figures and information [81].
These are CFM56-5B6’s external, internal and core views:
These are the parts constituting the core:
The fan, which is a large diameter propeller, absorbs air at a high rate compressing and
accelerating it:
After this air has entered the engine it can enter the core or bypass it. Inside the core, the air
passes through 13 compressors (4 in the booster and 9 in the high pressure compressor) which
gradually increase the pressure of the air as it flows through them. The air temperature when
compressed reaches around 450 ºC.

10/1/2018
55
Figure 48. CFM56-5B6 combustion chamber.
Figure 49. High and low pressure turbines.
Figure 50. CFM56-5B6 spinning shaft.
Figure 51. CFM56-5B6 exhaust assembly.
Figure 52. CFM56-5B6 high by-pass turbofan.
Once it has been compressed, the air enters the combustion chamber. Inside it the air gets mixed
with the aircraft’s fuel and, once mixed, it gets ignited, reaching temperatures of 1700 ºC. This
chemical reaction generates a lot of energy which increases the speed of the flowing air
enormously.
This fast airflow now enters the high and low pressure turbines which gradually decompress the
air and transform its kinetic energy into mechanical energy by making the shaft spin. This
spinning shaft, at the same time, is the one that rides the fan and the compressors which lead
the air into the combustion chamber.
After the air passes through the turbines it gets into the exhaust assembly to eventually reach
the primary duct joining the fan stream.
CFM56-5B6 is a high bypass turbofan which has two flows:
-The primary flow, which enters the core providing continuity to the turbofan cycle and
contributing to a 20% of the thrust generated.
-The secondary flow or fan stream, which bypasses the core (thus only being compressed and
accelerated by the fan) and contributes to 80% of the total thrust generated.
Due to the reciprocity this system, a turbofan can be described as a flow cycling engine.
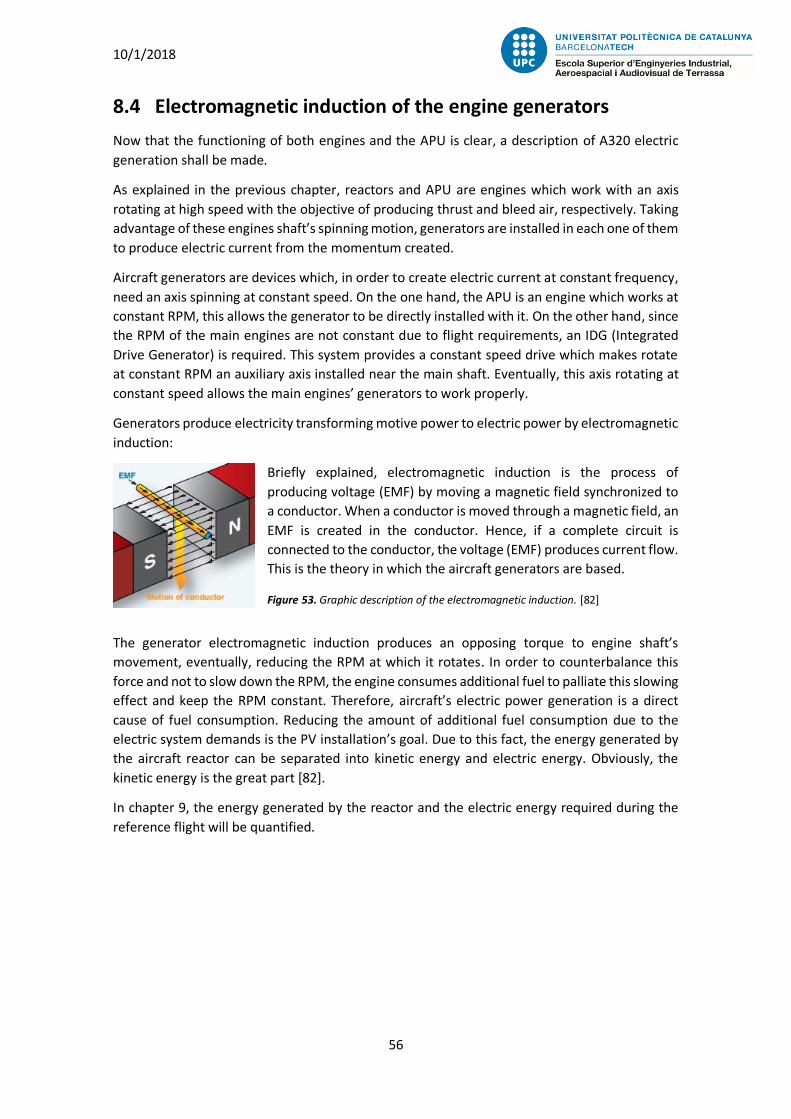
10/1/2018
56
Figure 53. Graphic description of the electromagnetic induction. [82]
8.4 Electromagnetic induction of the engine generators
Now that the functioning of both engines and the APU is clear, a description of A320 electric
generation shall be made.
As explained in the previous chapter, reactors and APU are engines which work with an axis
rotating at high speed with the objective of producing thrust and bleed air, respectively. Taking
advantage of these engines shaft’s spinning motion, generators are installed in each one of them
to produce electric current from the momentum created.
Aircraft generators are devices which, in order to create electric current at constant frequency,
need an axis spinning at constant speed. On the one hand, the APU is an engine which works at
constant RPM, this allows the generator to be directly installed with it. On the other hand, since
the RPM of the main engines are not constant due to flight requirements, an IDG (Integrated
Drive Generator) is required. This system provides a constant speed drive which makes rotate
at constant RPM an auxiliary axis installed near the main shaft. Eventually, this axis rotating at
constant speed allows the main engines’ generators to work properly.
Generators produce electricity transforming motive power to electric power by electromagnetic
induction:
Briefly explained, electromagnetic induction is the process of
producing voltage (EMF) by moving a magnetic field synchronized to
a conductor. When a conductor is moved through a magnetic field, an
EMF is created in the conductor. Hence, if a complete circuit is
connected to the conductor, the voltage (EMF) produces current flow.
This is the theory in which the aircraft generators are based.
The generator electromagnetic induction produces an opposing torque to engine shaft’s
movement, eventually, reducing the RPM at which it rotates. In order to counterbalance this
force and not to slow down the RPM, the engine consumes additional fuel to palliate this slowing
effect and keep the RPM constant. Therefore, aircraft’s electric power generation is a direct
cause of fuel consumption. Reducing the amount of additional fuel consumption due to the
electric system demands is the PV installation’s goal. Due to this fact, the energy generated by
the aircraft reactor can be separated into kinetic energy and electric energy. Obviously, the
kinetic energy is the great part [82].
In chapter 9, the energy generated by the reactor and the electric energy required during the
reference flight will be quantified.
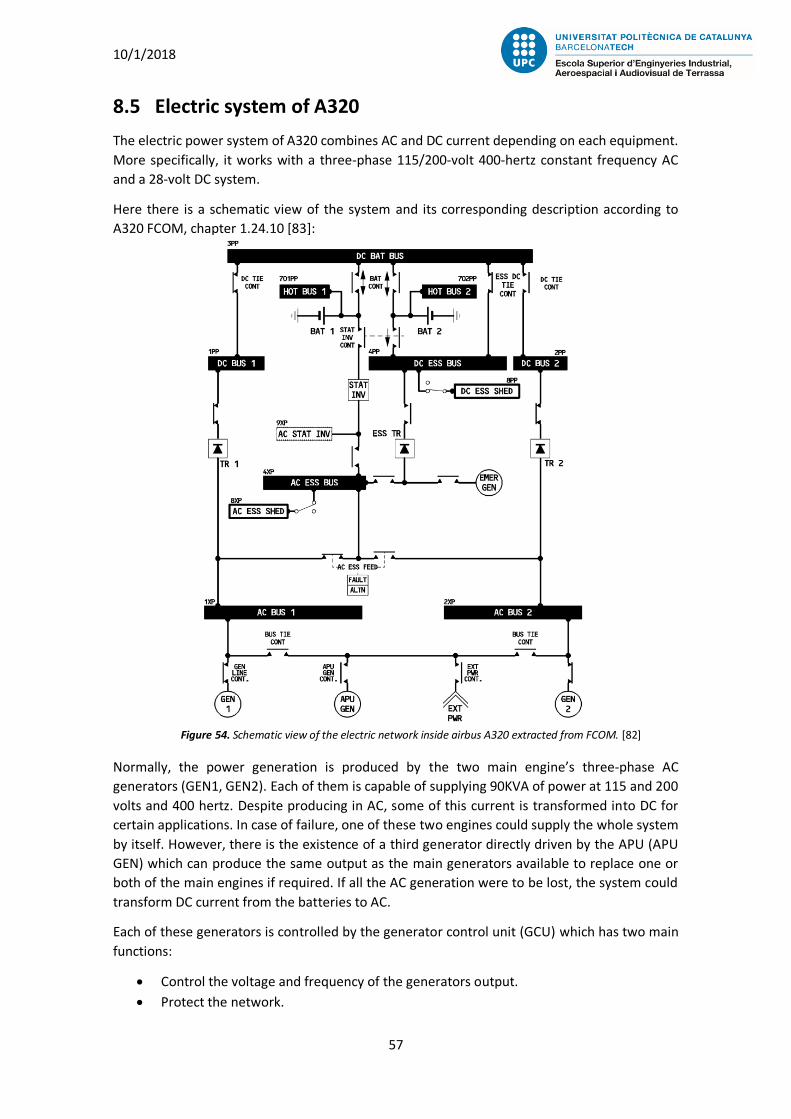
10/1/2018
57
Figure 54. Schematic view of the electric network inside airbus A320 extracted from FCOM. [82]
8.5 Electric system of A320
The electric power system of A320 combines AC and DC current depending on each equipment.
More specifically, it works with a three-phase 115/200-volt 400-hertz constant frequency AC
and a 28-volt DC system.
Here there is a schematic view of the system and its corresponding description according to
A320 FCOM, chapter 1.24.10 [83]:
Normally, the power generation is produced by the two main engine’s three-phase AC
generators (GEN1, GEN2). Each of them is capable of supplying 90KVA of power at 115 and 200
volts and 400 hertz. Despite producing in AC, some of this current is transformed into DC for
certain applications. In case of failure, one of these two engines could supply the whole system
by itself. However, there is the existence of a third generator directly driven by the APU (APU
GEN) which can produce the same output as the main generators available to replace one or
both of the main engines if required. If all the AC generation were to be lost, the system could
transform DC current from the batteries to AC.
Each of these generators is controlled by the generator control unit (GCU) which has two main
functions:
Control the voltage and frequency of the generators output.
Protect the network.

10/1/2018
58
In the worst case scenario, if all the previous generators were to fail, there is also of an
emergency generator (EMER GEN) (Ram air turbine). In cases of emergency, this generator
activates automatically and supplies AC power of 5 kVA of three-phase 115/200-volt and 400-
hertz power.
In order to transform DC power from BAT1 to AC, the system has a static inverter which
transforms the DC current into one kVA single-phase 115-volt 400-hertz AC current.
Analogously, to create DC power, two transformer rectifiers (TR1 and TR2) can convert the AC
current into a 200-ampere DC current. In addition, a third transformer rectifier identical to the
previous one (ESS TR) shall be used to power the essential DC circuit from the emergency
generator when it applies.
With regard to the energy storage, two main batteries with a 23 amperes-hour capacity are
presently connected to their respective hot buses. These batteries are monitored and controlled
by a battery charge limiter (BCL).

10/1/2018
59
Table 7. Climb parameters at FL350 weighting 68 t according to FCOM.
9 Energetic consumption of A320 In this chapter a flight plan of a typical A320 flight will be defined. The objective of doing this
procedure is to estimate the A320’s total energy consumption during a common international
flight. This means quantifying the aircraft’s energy consumption from the moment it starts to
taxi until the moment it stops after landing. Once the consumption has been determined, the
PV installation characteristics will be based on the aircraft energetic demands.
9.1 Fuel consumption of A320
As a typical A320 operation, a Barcelona to London flight with an approximate endurance of 2
hours and 20 min from start-up to landing has been selected. For this flight, A320 will depart
with a TOW of 68 tones and will be operating at M.78 cruise speed and FL350. To simplify the
calculations, ISA deviations won’t be considered.
Here below, according to the A320 FCOM flight planning and in flight performance data (chapter
2.05 and 3.05, respectively [84, 85]) fuel consumption and time spent calculations are made for
every one of the steps A320 will have to carry out during the stipulated flight:
Start-up and taxi: Fuel quantity required for the start-up and taxi are 10 kg/min. The
usual time spent for taxying are around 12 minutes. So, the fuel needed during the taxi
are near 120 kg.
Take-off and climb: This part of the flight is the one which requires the most fuel. The
engines need top power to make the plane climb, not only opposing to the drag force
but also overcoming the A320’s weight. Logically, depending on TOW and FL the climb
performance varies. According to FCOM, the climb speed profile is defined like this:
Normal air conditioning and anti-ice off.
Centre of gravity located at 33%.
250kt from 500 m to FL100.
300kt from FL100 up to the cruise FL.
In figure 13 of annex G, the climb features corresponding to the flight values of FL350
and 68 t are given:
From break release
Time (min) Fuel (kg) Distance (NM) TAS (KT)
22 1686 137 378
Thus, for these flight parameters, A320 requires 1,606 kg of fuel and 21 minutes from
break release until reaching FL350. Also, the aircraft advances approximately 129 NM
(239 km), during this stage with a true airspeed (TAS) of 377 KT (698 km/h).

10/1/2018
60
Table 8. Cruise parameters at FL350 weighting 66 t according to FCOM.
Cruise: Once the plane has reached its operating altitude, it develops the cruise
configuration. This is the part of the flight which lasts the most and the plane travels
more distance. In the interest of performing an optimal flight in terms of fuel
consumption and time spent, the aircraft develops a configuration in which it can fly at
a reasonable speed with a good distance/fuel ratio.
According to FCOM, the cruise tables are established under these features:
Normal air conditioning and anti-ice off.
Cruise speed of M.78
Centre of gravity located at 33%.
In the following table, extracted from figure 14 in annex G, there are the cruise
parameters that suit this flight (notice that the aircraft weight has been considered 66t
because of the fuel consumed during the climb):
For this cruise features, A320’s engines are working at 83% of their maximum power.
The fuel consumption are 1,199 kg/h per engine, in other words the aircraft is travelling
a distance of 347.43 km for each ton of fuel consumed. The indicated airspeed (IAS) and
the true airspeed (TAS) are 264 KT (488.9 km/h) and 450 KT (833.4 km/h), respectively.
The time spent on cruising can’t be precisely estimated without knowing the descending
time. However, it is hypothesized that the descending time is going to be approximately
15 minutes. Then, cruise time is obtained next:
𝑐𝑟𝑡 = 𝐹𝑡 − 𝑡𝑡 − 𝑐𝑙𝑡 − 𝑑𝑡
( 6 )
Where 𝑐𝑟𝑡 is the cruising time, 𝐹𝑡 is the Total flight time (140 min), 𝑡𝑡 is the taxiing time
(12 min), 𝑐𝑙𝑡 is the climbing time (21 min) and 𝑑𝑡 is the descending time (15 min). With
these values a cruise time of 92 min is obtained.
Now, to calculate the total cruise fuel consumption the following equation is used:
𝑐𝑟𝑓 = 𝑓 · 𝑁𝑒 · ℎ
( 7 )
Where 𝑐𝑟𝑓 is the cruise fuel consumption, 𝑓 is the fuel consumption per hour per engine
determined in table 8, 𝑁𝑒 is the number of engines, 2 in the case of A320 and ℎ is the
time of cruise in hours (92/60). Thus, a total amount of 3,677 kg of jet fuel are burnt
during the cruise.
Descent and landing: This part of the flight consumes low amount of fuel since the
power of the engines can be reduced significantly, in many cases reaching the idle
thrust. The aircraft sets a configuration that allows it to plan with just the wing’s
aerodynamics and a low engine thrust.
N1 (%)
MACH
KG/H/ENG
IAS (KT)
NM/1000KG
TAS (KT)
83
0.78
1,199
264
187.6
450

10/1/2018
61
Table 9. Descent parameters at FL350 weighting 65 t according to FCOM.
In agreement with the previous calculations, the weight of the plane when starting the
descent is around 62t. Nevertheless, FCOM only provides descent features for the
weights of 45t and 65t. Since these procedure is an estimated quantification of the fuel
consumption and the fuel variance between weights is very low, this small distortion
will be neglected. Thus, the 65t values will be considered valid for this part of the flight.
In consonance with FCOM, the descent tables are established under these features:
Normal air conditioning and anti-ice off.
Centre of gravity located at 33%.
Maximum rate of descent 350 feet per minute.
This is the table providing the values for the descent features of this flight, extracted
from figure 14 in annex G:
As can be seen, the total descent time is of 16.2 minutes (near the assumption made for
the cruise fuel calculation). The amount of fuel consumed is 165 kg and the distance
travelled is 97 NM (180 km). Finally, the indicated airspeed are 264 KT (489 km/h).
Taxi (arrival): Once the plane has landed it taxies to the location where the turn round
procedure will be performed.
The estimated land taxi time endurance for this flight is 5 minutes. Considering the same
fuel consumption rate as the taxiing before departing: 10 kg/min, land taxi’s fuel
consumption is 50 kg.
Turn round: A full servicing turn round for an airbus A320 lasts 44 minutes (see annex
F). Despite not being an explicit part of the flight, since the turn round is a procedure
required for every flight, it will be included in the energy consumption calculation.
During turn round time, an energy source provides power to the whole electric system
to enable several turn round procedures. This source usually comes from the APU and,
in some cases, from the GPU.
To simplify the procedure, the APU will be considered the unique and continued source
during the turn round. It supplies 90 kVA to the electrical system for the different testing
procedures (engines need to be shut down to recharge fuel and perform several tests).
APU’s energy consumption will be added to the total energy consumption after the fuel
consumed during the reference flight has been transformed into energy.
TIME (MIN)
FUEL (KG)
DIST. (NM)
N1
IAS (KT)
16.2
165
97
IDLE
264
10/1/2018
62
9.1.1 Total fuel calculation
Now that the fuel required for the different parts of the flight has been determined, the total
fuel can be obtained by summing them all:
𝐹𝑅𝐹 = 𝑡𝑓 + 𝑐𝑙𝑓 + 𝑐𝑟𝑓 + 𝑑𝑓 + 𝑡𝑙𝑓 ( 8 )
Being 𝐹𝑅𝐹 the RF fuel consumption, 𝑡𝑓 the calculated taxi fuel consumption of 120 kg, 𝑐𝑙𝑓 the
climbing fuel consumption of 1,686 kg, 𝑐𝑟𝑓 the cruise fuel consumption of 3,677 kg, 𝑑𝑓 the
descent fuel consumption of 165 kg and 𝑡𝑙𝑓 the landing taxi fuel consumption of 50 kg. Finally,
the sum of all these values equals a total amount of 5,698 kg of jet fuel burnt during the RF.
9.2 Total A320 energy consumption in the RF
This point focus on quantifying the total amount of energy required for A320 to perform its RF.
In an energetic point of view, this value is really interesting. It will indicate the contribution of
the PV system in front of the whole energy demand of the aircraft. Besides, value will be crucial
in further stages to calculate the amount of fuel savings due to the PV installation.
In the interests of obtaining the total energy used by A320 during the RF, the following formula
is required:
𝑅𝐹𝑇𝐸 = 𝑄 · 𝐾𝑐𝑎𝑙 · 𝜂𝑡𝑜𝑡𝑎𝑙 ( 9 )
Where 𝑅𝐹𝑇𝐸 is the RF energy consumption, 𝑄 is the total fuel burnt during the RF, 5,698 kg,
𝐾𝑐𝑎𝑙 is the calorific power of the kerosene, which is 43 MJ/kg, and 𝜂𝑡𝑜𝑡𝑎𝑙 is the reactor
performance. This last parameter is really hard to identify. Not only does it depend on the
atmospheric conditions and the operating thrust, but also its values are classified by the selling
company. Therefore, it hasn’t been possible for this study to directly obtain it. Nonetheless, to
continue with the procedure, an estimative value will be required. According to A.G. Ribas,
Motor de turbina de gas [86], the calorific performances of an engine range between 20 and 30.
Therefore, the mean value of 0.25 will be the value used as the reactor performance.
Therefore, the A320 energy RF can be calculated and it equals to 61,253.5 MJ.
This energy can be broke down in two parts: kinetic energy and electric energy. A great part of
the total energy is used as kinetic energy. However, the generator absorbs part of the total
energy to create electricity for the electric system, as it has been explained in chapter 8. The
following goal of this study is to determine the percentage of electric energy used by A320
opposed to all the energy required to perform the RF. In this way, once the PV energy generated
is determined, it will be compared to both the electric energy demand and the total A320 energy
demand.
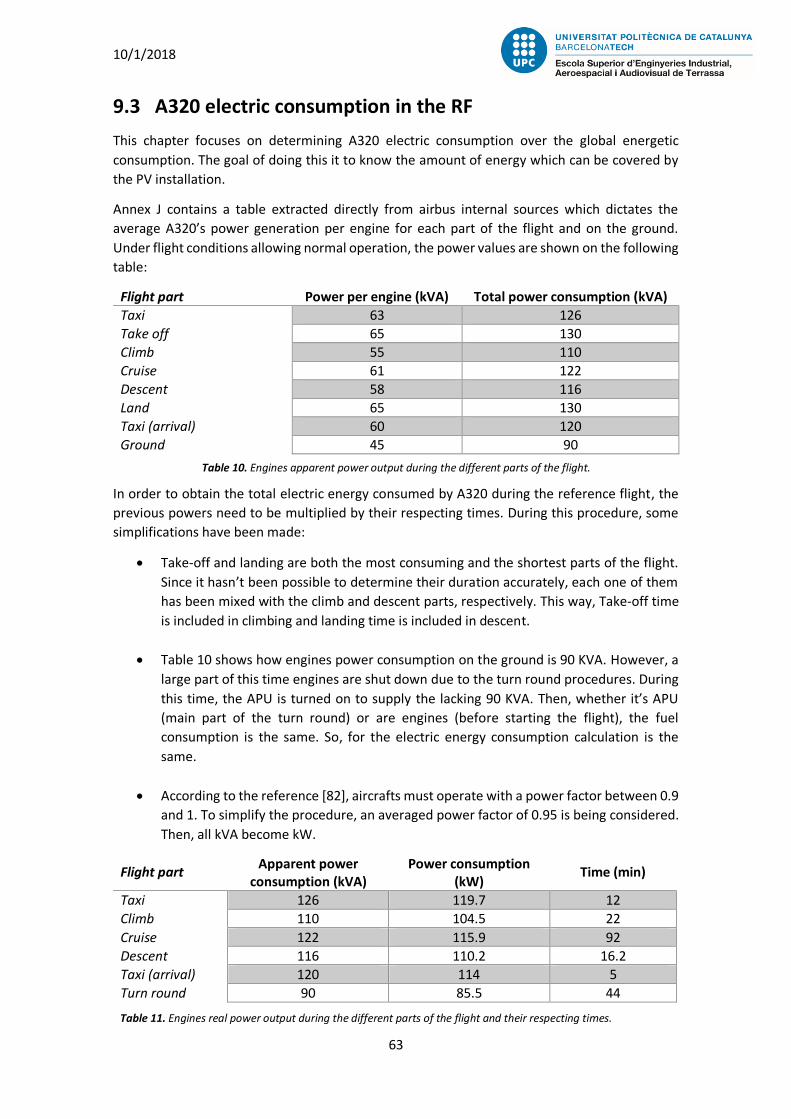
10/1/2018
63
Table 10. Engines apparent power output during the different parts of the flight.
Table 11. Engines real power output during the different parts of the flight and their respecting times.
9.3 A320 electric consumption in the RF
This chapter focuses on determining A320 electric consumption over the global energetic
consumption. The goal of doing this it to know the amount of energy which can be covered by
the PV installation.
Annex J contains a table extracted directly from airbus internal sources which dictates the
average A320’s power generation per engine for each part of the flight and on the ground.
Under flight conditions allowing normal operation, the power values are shown on the following
table:
Flight part Power per engine (kVA) Total power consumption (kVA)
Taxi 63 126
Take off 65 130
Climb 55 110
Cruise 61 122
Descent 58 116
Land 65 130
Taxi (arrival) 60 120
Ground 45 90
In order to obtain the total electric energy consumed by A320 during the reference flight, the
previous powers need to be multiplied by their respecting times. During this procedure, some
simplifications have been made:
Take-off and landing are both the most consuming and the shortest parts of the flight.
Since it hasn’t been possible to determine their duration accurately, each one of them
has been mixed with the climb and descent parts, respectively. This way, Take-off time
is included in climbing and landing time is included in descent.
Table 10 shows how engines power consumption on the ground is 90 KVA. However, a
large part of this time engines are shut down due to the turn round procedures. During
this time, the APU is turned on to supply the lacking 90 KVA. Then, whether it’s APU
(main part of the turn round) or are engines (before starting the flight), the fuel
consumption is the same. So, for the electric energy consumption calculation is the
same.
According to the reference [82], aircrafts must operate with a power factor between 0.9
and 1. To simplify the procedure, an averaged power factor of 0.95 is being considered.
Then, all kVA become kW.
Flight part Apparent power
consumption (kVA) Power consumption
(kW)
Time (min)
Taxi 126 119.7 12
Climb 110 104.5 22
Cruise 122 115.9 92
Descent 116 110.2 16.2
Taxi (arrival) 120 114 5
Turn round 90 85.5 44
10/1/2018
64
With the knowledge of these parameters, the energy consumption for each part of the flight is
obtained following the next equation:
𝐸𝑒𝑐 = 𝑃𝑐 · 𝑡
( 10 )
Where 𝐸𝑒𝑐 is the Electric energy consumption, 𝑃𝑐 is the power consumption and 𝑡 is the time of
the flight part.
Now, in consonance for the power and time values of each flight part, the Electric energy
consumption is calculated for each part of the flight:
Taxi: 86 MJ
Climb: 138 MJ
Cruise: 640 MJ
Descent: 107 MJ
Taxi (arrival): 34 MJ
Turn round: 226 MJ
Summing all the values obtained, the RF electric energy (𝑅𝐹𝑒𝑐) is obtained and equals 1,231 MJ.
𝑅𝐹𝑒𝑐 = 𝟏, 𝟐𝟑𝟏 𝑴𝑱

10/1/2018
65
10 MGIII energy generation on A320 This chapter will be focused on analysing the factors affecting the solar panel’s installation as
well as deciding its location and surface on the A320’s wing. The fact that this installation is being
made on an aircraft and not at a fixed location on the Earth’s surface implies significant changes
on the features affecting solar irradiance. These peculiarities will be affecting the generation of
the PV system and are important when determining its dimensions.
10.1 Factors affecting solar irradiance on a plane
Aircrafts are flying machines which move at high speed and altitude in the atmosphere. Both of
this features allow them to fly over regions really fast. Atmospheric conditions and solar
irradiance vary depending on the region. These external changes during flights will affect the
solar power generation. For this reason, they need to be studied.
10.1.1 Operating temperature:
A320, as all the other commercial planes existing, spend the majority of their flight time
on cruise configuration. This mode is activated when the plane is already settled at the
optimal altitude for its flight. Cruise configuration usually remains at constant speed and
altitude if there are no specific demands to change parameters.
In A320’s reference flight, the cruise speed was M0.78 at FL350, which are 829 Km/h at
10,668 m. At this altitude, according to the A320 FCOM, check figure 12 in annex G, the
atmospheric temperature is around -54.3 ºC (SAT). However, since the aircraft is moving
at high speed, the air is strongly compressed near the plane surface and the temperature
increases considerably (TAT). Hence, TAT is the temperature at which our solar cells will
be working. According to the A320 FCOM, for the given cruise characteristics, the TAT
raises to -27 ºC (see figure 16 in annex G).
In chapter 2.5.5, it was explained the importance of the temperature for solar panel
efficiency. The solar technology selected for this study has a coefficient of -0.30%/ºC as
it was revealed in its technical sheet (chapter 5.3.2, table 4). So, considering that the
linearity remains constant even for such drastic working temperatures, the result is
calculated as follows.
Following the same procedure as in chapter 2.5.5 example, the operating temperature
of -27ºC is subtracted by the STC temperature of 25ºC. Thus, obtaining a temperature
increment of -52ºC. Now, applying equation 1, the ratio of efficiency variation is equal
to +15.6%.
Due to the great difference between the STC temperature and the operating
temperature of the cell at 10,668 Km the solar cell’s ratio of efficiency increase is very
high. Clearly, this is an advantageous parameter for the prosperity of this PV installation.
Considering that the regular efficiency of the Maxeon GIII solar cell is 23.7%, applying
the thermic increase the efficiency rises up to 27.4%.

10/1/2018
66
Figure 55. Schematic distribution of the atmosphere. [87]
10.1.2 Air mass and weather:
Temperature is not the only thing varying because of the altitudes at which A320 flies.
Air mass (explained in chapter Y) is a measure of distance which indicates the amount
of attenuation sunbeams have suffered through the atmosphere. This phenomenon
directly affects the irradiance reaching the Earth’s surface. Nonetheless, A320 would be
receiving the sun irradiance at nearly 11 Km from the Earth’s surface. Thus, the
attenuating effect produced by the air mass is significantly reduced.
So as to quantify how much air mass is being avoided at 10,668 Km it would be needed
the density gradient by way of the atmosphere. However, this density gradient varies
considerably depending on the region. For this reason, the air mass at FL350 will be
calculated in a simpler way.
This is the atmosphere distribution:
Due to the low air density as a consequence of temperature reduction, the majority of
commercial planes optimally fly between the tropopause and the beginning of the
stratosphere. Tropopause altitude varies from 20,000 feet above the poles to 60,000
feet over the equator. However, the ISA dictates that the average altitude for the
troposphere is near 36,000 feet, which will be considered the altitude at which A320
flies [88].
Flying at this altitude provides several climatological peculiarities. These characteristics
aren’t only beneficial in terms of aerodynamics and fuel consumption but also in terms
of PV operating conditions:
Low air mass: The higher an aircraft flies, the less air mass above it attenuating
the sunlight. This effect gains strength at low atmosphere levels where density
is reasonably higher because all the air above pushes down and compresses the
molecules. According to skybrary [88], the magnitude of this effect is such that
troposphere (lower atmosphere) contains the 75% of the total atmosphere
mass. Therefore, the fact that A320 is flying at the tropopause will be
considered as if solar cells would be receiving sunlight irradiation with just the
25% of the air mass attenuation they would receive on the ground.

10/1/2018
67
Figure 56. Clouds appearance and distribution according to altitudes. [89]
Avoiding weather: Another important benefit of flying at the tropopause is
related to the weather. Again, in agreement with skybrary, the majority of the
weather takes place at the troposphere, below the tropopause. Closely related
to this fact, barely no clouds reach the tropopause. Only some cirrus,
cirrocumulus and sometimes big cumulonimbus which eventually transform
into cirrostratus can reach these heights. However, despite being high clouds,
the likelihood of finding them at this altitudes is pretty low.
Once more, solar cells get benefited from these events. Weather and, more
specifically, clouds play a really important role when dissipating the sunlight
irradiation (can reduce it between 15% and 85% depending on the clouds
covering) [90]. Being out of reach of these climatological phenomena is a big
deal when thinking of photovoltaic power generation.
So, since the majority of weather conditions affecting the solar irradiance are
avoided at these altitudes, the intensity at which sunbeams irradiate solar cells
at the tropopause will be permanently considered the same which irradiates the
ground on a clear sunny day.
10.1.3 Latitude of the flight:
When an aircraft’s flight path is drawn on a map, the intuitive thought for flying the
shortest distance is to draw a straight line from departure to arrival. However, despite
seeming so logical, that wouldn’t be correct.
Since Earth is shaped similarly to a sphere, the shortest distance between two points is
not a straight line but an arc. These arcs are called the great circle route and all long
distance navigations follow great circles to minimize the distance travelled.

10/1/2018
68
Figure 57. World map displaying yearly flight paths. [91]
Figure 58. Mixture of figures 12 and 57. World map with yearly flight paths and insulation.
The following image shows the different flight paths performed during a month in the
entire globe:
After watching this image and extracting its content, two main conclusions can be
extracted:
Firstly, it can be seen how the majority of flights travelling horizontal distances follow
the great circles. While flights travelling mainly vertical distances are straight, because
they don’t need to follow great circles. Second of all, there is a flight path concentration
in the north hemisphere. This is so because the airports with higher flux of flights are
located above the equator.
Following the great circle routes, directly has an impact in terms of solar irradiance.
Commercial aircraft’s flight paths (especially for long distances) significantly change
latitude during the flight time. In chapter 2.5.3, it was explained the latitude’s
importance over the insolation through the globe (Figure 12). The result obtained by
mixing both of these concepts is shown in the following image:

10/1/2018
69
Figure 59. Solar radiation concentration over areas with different inclination.
Because of the great circle route phenomenon, flight paths tend to fly over low insulated
regions. The solar irradiance’s average at the latitude these planes flight oscillates
between 60 and 140 W/m2. These low irradiance values are adverse to the PV
generation. However, these values of low irradiance are calculated on the ground. Once
more, due to the height at which A320 performs its RF, the low irradiation
disadvantageous effect might get partially mitigated. Later on this mitigation will be
quantified.
There are four main factors reducing the yearly average of solar irradiance over these
regions. The first two factor are related to the angle at which sunbeams fall from the
sun. This inclined angle both dissipates the sunlight intensity (figure 13) and increases
the amount of air mass travelled (figure 14). These factors considerably dissipate and
attenuate sunlight intensity. The third factor has to do with the day length and its
respective daylight intensity (chapter 2.5.4). Day length is directly related to the daylight
hours and eventually ends up affecting the solar irradiance. Finally, the fourth factor is
related with the average climatic behaviour over a year. Clime is the main threat for
sunlight radiation intensity. Bad climatic behaviour entails cloud coverage, rain, grey
days, etc., these weather phenomena penalize a lot the solar irradiance, thus reducing
the amount of days with high sunlight intensity to a low number.
Then, the importance of the factors contemplated above is defined:
Angle of the sunbeams: this factor is the most significant affecting solar
irradiance. It determines the amount of sunlight concentration on a surface as
well as the degree of direct sunlight hitting it. The more tilted, the less direct
sunlight, the less solar irradiance (see chapter 2.5.3).
Air mass increase: due to the oblique incidence of the light, the path travelled
through the atmosphere is longer than the orthogonal one. Thus, it increases
the attenuation suffered. However, this negative effect loses a lot of strength
at the troposphere, where 75% of the air mass is avoided.
Day length: Commercial aircrafts can operate in any time of the day. However,
depending on the latitude where they fly, aircrafts will have larger or shorter
range of daylight according to the season of the year. Besides, latitude will also
affect the PV surface inclination, consequently altering the sunlight’s intensity
reaching the panels.
Low irradiance climate: this factor is neglected due to the weather avoidance
provided by the altitudes.

10/1/2018
70
To sum up, it can be seen that the latitude at which the plane flies clearly changes the
irradiance it receives. The factors brought by latitudes have proven to significantly
change the insolation levels over the regions, and these increase the further they are
from the equator. Commercial aircrafts use paths which cross these latitudes constantly
and this fact affect the irradiance they receive. However, it has also been stated that
thanks to the altitudes at which aircraft fly, the impact produced by the latitude effect
is reduced considerably.
Returning to the focus of this study, A320’s reference flight goes from Barcelona to
London. Since it is a flight with small horizontal distances, the great circle route effect is
depreciable. Thus, the latitude effects involved in this flight are the surface’s degree of
inclination, the corresponding air mass increase and the day length with its linked sun
intensity depending on the season.
10.2 Solar irradiance reaching A320 during the reference flight
Now that all the main factors influencing sunlight intensity have been considered and evaluated,
it has been proven the degree of difficulty to precisely quantify solar irradiance over A320’s
surface. On top of that, for each different flight, many of these factors change their features,
eventually changing the final amount of solar irradiance. For this reason, a reference flight was
selected, it allows fixing all the parameters involved in the different factors affecting A320 solar
irradiance.
In order to quantify an average irradiance during a flight, it is not enough only to fix a reference
flight. Other assumptions such as the season of the year and the hour of the day, as well as
atmospheric and mathematical approaches are required.
Bearing in mind all these previous requirements, A320’s solar irradiance shall be calculated. To
do so, since there are different stages during the reference flight, the procedure has been
fragmented in three parts:
Cruise
TR + taxi
Climb and Descent
10.2.1 Cruise
The next list contains the hypothesis in which the procedure to calculate A320’s cruise solar
irradiance will be based:
Cruise hypothesis:
1. The operating cell’s temperature will be considered -27ºC and constant during the
whole flight.
2. Air mass attenuation received by A320 will be rated as 25% of the air mass attenuation
on the ground (considering the same angle).
3. No weather phenomena affects A320 solar irradiation.

10/1/2018
71
Figure 60. Triangle displaying the A320 surface inclination to the sunbeams.
4. A320 departure (Barcelona) and arrival (London) latitudes are roughly 41ºN and 51ºN,
respectively. Thus, the average latitude considered will be 46ºN.
5. A320 flies during full daylight, supposing a constant irradiance which will be specified
later.
6. All the cruise flight will be considered to be constant (altitude, speed, temperature, etc.)
The first value to be estimated will be the average solar irradiance reaching A320 during the RF.
To do so, two different types of solar irradiances will be considered:
Orthogonal solar irradiance, which is the irradiance received by A320 considering its
surface is tilted orthogonally to the sunlight.
Cruise solar irradiance, which is the actual irradiance received by A320. This value will
be smaller than the previous one since the surface is angled due to A320 latitude (check
flight’s latitude, angle of the sunbeams).
Then, since the flight’s average latitude is 46ºN, the surface increase produced by the inclination
of the Earth’s surface is calculated as follows with basic trigonometry:
In figure 60, the blue line (orthogonal) represents a unit of area being reached by a certain
amount of sunlight and the green line (angled 46º) represents a larger area being heat by the
same amount. Thus, the green line receives less sunlight intensity on its surface. These are the
numbers:
𝐼𝑐 = cos(𝑙) ( 11 )
In which 𝐼𝑐 is the amount of irradiance concentration and 𝑙 is the average RF latitude of 46º.
Applying equation 11, the amount of irradiance concentration reaching the A320 during the RF
equals 0.695. This means that the cruise solar irradiance is a 69.5% of the orthogonal solar
irradiance. Now, to obtain the real amount of solar irradiance reaching A320, the orthogonal
solar irradiance needs to be calculated.
Before entering the atmosphere, solar radiation are 1367 W/m2. Then, due to daylight, air mass
and weather conditions this irradiance loses strength:
46º

10/1/2018
72
Daylight: In order to simplify and idealize the procedure, the daylight will be considered
full during all the flight (as if it was 12.00h during all the flight). This means that the solar
radiation won’t be affected by daylight intensity.
Air mass: Due to the daylight simplification, air mass is only affected by latitude. It is
calculated as follows:
𝐴𝑀 = 1
cos(𝑙) ( 12 )
Where 𝐴𝑀 is the air mass and 𝑙 is the average RF latitude of 46º. The air mass value
obtained equals 1.44.
However, fulfilling the 2nd hypothesis, the air mass affecting A320 is 25% of the
calculated air mass for the ground. Thus,
𝐴𝑀𝐴320 = 0.25 · 𝐴𝑀 ( 13 )
Thus, an air mass value of 0.36 is attenuating and dissipating the incoming solar radiation
on the A320 surface.
Weather conditions: As it was assumed in the 4th hypothesis, weather is neglected since
A320 flying altitude avoids it.
So, orthogonal solar irradiance strength is only affected by the air mass affecting A320.
According to F. Kasten and Young, A. T. in Revised optical air mass tables and approximation
formula [92], solar irradiance is obtained following these steps:
Firstly, direct sunlight’s intensity, 𝐼𝐷 is quantified, which is a function of the Air Mass:
𝐼𝐷 = 𝐾 · 𝑏𝐴𝑀𝑛 ( 14 )
Where:
𝐾 is the amount of solar irradiance before entering the atmosphere, which equals 1.367
kW/m2.
𝑏 makes reference to the fact that about 70% of the incident radiation reaching the
outer atmosphere is transmitted to the Earth. Thus, it is equals to 0.7.
𝐴𝑀 is the air mass affecting A320.
𝑛 is an empirical value which considers the atmospheric layers’ non-uniformities. Its
value equals 0.678.
Hence, applying equation 14 with the corresponding value of each parameter a direct sunlight
intensity of 1.144 𝑘𝑊
𝑚2 is obtained.
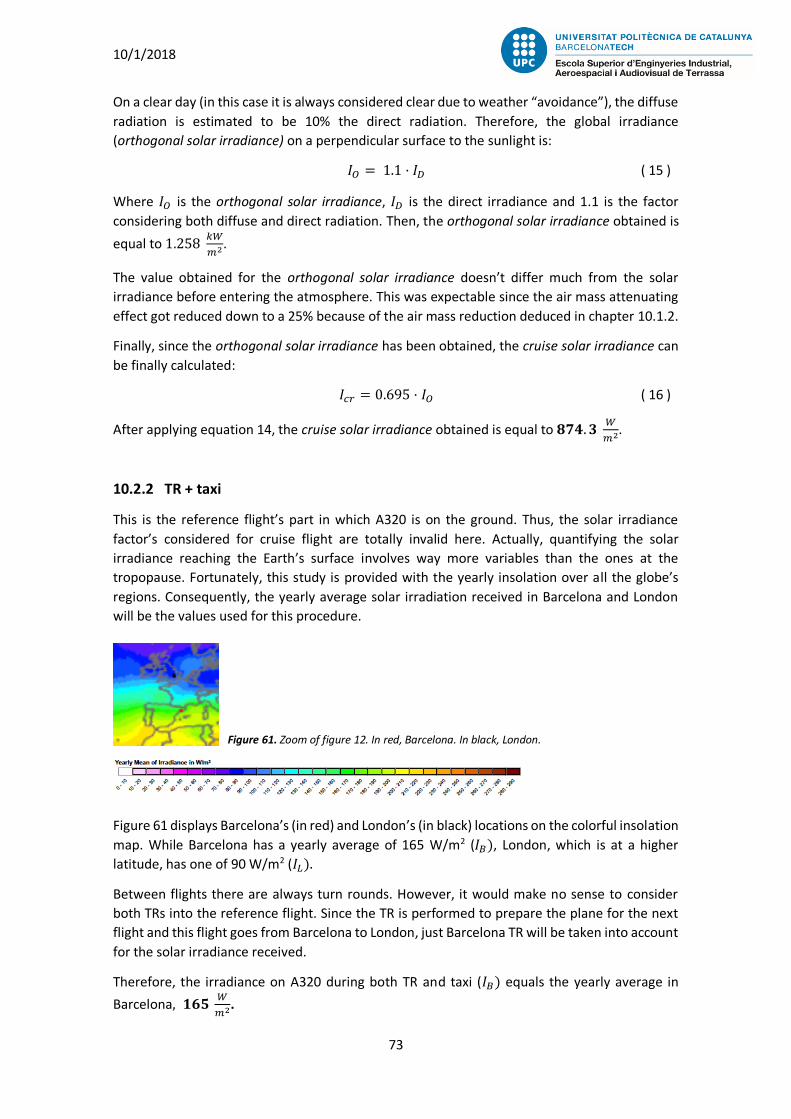
10/1/2018
73
Figure 61. Zoom of figure 12. In red, Barcelona. In black, London.
On a clear day (in this case it is always considered clear due to weather “avoidance”), the diffuse
radiation is estimated to be 10% the direct radiation. Therefore, the global irradiance
(orthogonal solar irradiance) on a perpendicular surface to the sunlight is:
𝐼𝑂 = 1.1 · 𝐼𝐷 ( 15 )
Where 𝐼𝑂 is the orthogonal solar irradiance, 𝐼𝐷 is the direct irradiance and 1.1 is the factor
considering both diffuse and direct radiation. Then, the orthogonal solar irradiance obtained is
equal to 1.258 𝑘𝑊
𝑚2.
The value obtained for the orthogonal solar irradiance doesn’t differ much from the solar
irradiance before entering the atmosphere. This was expectable since the air mass attenuating
effect got reduced down to a 25% because of the air mass reduction deduced in chapter 10.1.2.
Finally, since the orthogonal solar irradiance has been obtained, the cruise solar irradiance can
be finally calculated:
𝐼𝑐𝑟 = 0.695 · 𝐼𝑂 ( 16 )
After applying equation 14, the cruise solar irradiance obtained is equal to 𝟖𝟕𝟒. 𝟑 𝑊
𝑚2.
10.2.2 TR + taxi
This is the reference flight’s part in which A320 is on the ground. Thus, the solar irradiance
factor’s considered for cruise flight are totally invalid here. Actually, quantifying the solar
irradiance reaching the Earth’s surface involves way more variables than the ones at the
tropopause. Fortunately, this study is provided with the yearly insolation over all the globe’s
regions. Consequently, the yearly average solar irradiation received in Barcelona and London
will be the values used for this procedure.
Figure 61 displays Barcelona’s (in red) and London’s (in black) locations on the colorful insolation
map. While Barcelona has a yearly average of 165 W/m2 (𝐼𝐵), London, which is at a higher
latitude, has one of 90 W/m2 (𝐼𝐿).
Between flights there are always turn rounds. However, it would make no sense to consider
both TRs into the reference flight. Since the TR is performed to prepare the plane for the next
flight and this flight goes from Barcelona to London, just Barcelona TR will be taken into account
for the solar irradiance received.
Therefore, the irradiance on A320 during both TR and taxi (𝐼𝐵) equals the yearly average in
Barcelona, 𝟏𝟔𝟓 𝑊
𝑚2.
10/1/2018
74
10.2.3 Climb and descent
Predicting the solar irradiance reaching A320 during the climb and the descent with exactitude
is almost impossible. During these parts of the flight, the aircraft is neither on the ground nor in
the tropopause, so none of the previous factors considered are valid. Besides, since the plane is
constantly changing altitude, all the relative atmospheric conditions and weather impact are
unsteady. Therefore the only way to precisely quantify the solar irradiance received during these
manoeuvres is empirically. Nevertheless, this study doesn’t have enough resources to obtain
this data.
In order to get a first approach value, climb and descent solar irradiance will be calculated by
the following arithmetic means:
Climb: between Barcelona yearly average solar irradiance and Cruise solar irradiance.
𝐼𝑐𝑙 =𝐼𝐵 + 𝐼𝑐𝑟
2
( 17 )
Thus, a climb solar irradiance of 𝟓𝟏𝟗. 𝟔 𝑊
𝑚2 is obtained.
Descent: between Cruise solar irradiance and London’s yearly average solar irradiance.
𝐼𝑑 =𝐼𝐿 + 𝐼𝑐𝑟
2
( 18 )
Thus, a descent solar irradiance of 𝟒𝟖𝟐. 𝟐 𝑊
𝑚2 is obtained.
Performing an arithmetic mean to calculate solar irradiance can be considered an inelegant
procedure with low accuracy. However, there is a logic behind it. Since the yearly average solar
irradiance in each location is obtained with empirical data, there is full certainty that those are
reliable values. Besides, the solar irradiance at the tropopause was calculated with a criteria
which, indeed, has some approximations, but in general terms can be considered faithful to
reality. Thus, since the A320 goes from one stage to the other increasing altitude linearly,
considering the arithmetic mean as the average of these flight parts is reasonable. On top of
that, these parts compared with the cruise are short timewise. For this reason, this approach is
being considered enough.
Despite being calculated with an arithmetic mean, these values have been obtained performing
a logical reasoning. Hence, this study will use them to proceed with further calculations.
10.3 Maxeon Gen III energy quantification
Knowing the solar irradiance reaching A320 in each part of the flight, Maxeon GIII energetic
generation can be calculated during the entire reference flight. Nonetheless, the solar
technology dimensions haven’t been established yet. So, in order to quantify the generation,
1m2 of solar panel will be used as the reference to proceed with the calculations.
To determine Maxeon GIII energy generation, the following data is required: solar irradiance,
time, operating temperature and efficiency. Starting from the TR + taxi and ending with the
landing, the energy generation values for each part of the flight are determined next:
10/1/2018
75
10.3.1 TR + taxi
Solar irradiance: 𝑰𝒈 = 165 W/m2.
Time:
A320 remains on the ground during TRT and the pre-flight taxiing time. Thus, since both
durations have been previously defined, the number of minutes A320 spends on the
ground is:
𝑡𝑔 = 𝑇𝑅𝑇 + 𝑡𝑡 ( 19 )
Where 𝑡𝑔 is the A320 ground time, 𝑇𝑅𝑇 is the turn round time of 44 minutes and 𝑡𝑡 is
the taxiing time of 12 minutes. Therefore, A320 spends 𝟓𝟔 𝒎𝒊𝒏 (𝒕𝒈 = 𝟑, 𝟑𝟔𝟎 𝒔) on the
ground.
Operating temperature: 45ºC (obtained from Oscar A. [93]).
Operating efficiency:
Developing the same procedure as in chapter 2.5.5:
Considering a temperature increment of 20ºC (from 45ºC to 25ºC) and a thermic
sensitivity that equals −0.30%
º𝐶, the ratio of efficiency variance shall be calculated
applying equation 1. Therefore, the ratio of efficiency variation reduces down to 94%
the standard cell efficiency.
Thus, the efficiency of Maxeon GIII solar cell on the ground (𝑒𝑔) is the product of the
standard efficiency (23.7) and the ratio of efficiency variation (0.94), which equals 22.3%
(𝒆𝒈 = 𝟎. 𝟐𝟐𝟑).
The equation to calculate energy generated by 1m2 of Maxeon during the TR + taxi is:
𝐸𝑔 = 𝐼𝑔 · 𝑡𝑔 · 𝑒𝑔 ( 20 )
Where all the parameters have been already determined.
Finally, the energy generated by 1m2 of Maxeon GIII solar cell during the time spent on the
ground equals 𝟏𝟐𝟑. 𝟔𝐾𝐽
𝑚2. Dividing this value by the TR+taxi time, the power generation for the
respective part of the flight is obtained: 𝑃𝑔 = 36.8 𝑊
𝑚2.

10/1/2018
76
10.3.2 Climb
Solar irradiance: 𝑰𝒄𝒍 = 𝟓𝟏𝟗. 𝟔 W/m2.
Time: 22 min (𝒕𝒄𝒍 = 1,320 s)
Operating temperature: -27 ºC (approximation: considered the same as cruise).
Operating efficiency:
Considering a temperature increment of -52ºC (from -27ºC to 25ºC) and a thermic
sensitivity that equals −0.30%
º𝐶, the ratio of efficiency variance shall be calculated
applying equation 1. Therefore, the ratio of efficiency variation increases up to 115.6%
the standard cell efficiency.
Thus, the efficiency of Maxeon GIII solar cell during the climb (𝑒𝑐𝑙) is the product of the
standard efficiency (23.7) and the ratio of efficiency variation (1.156), which equals
27.4% (𝒆𝒄𝒍 = 𝟎. 𝟐𝟕𝟒).
Now, applying equation 18 but replacing the ground parameters for the climb ones, the energy
generated by 1m2 of Maxeon during the climb is calculated:
𝐸𝑐𝑙 = 𝐼𝑐𝑙 · 𝑡𝑐𝑙 · 𝑒𝑐𝑙 ( 21 )
Where all the parameters have been previously determined.
Finally, the energy generated by 1m2 of Maxeon GIII solar cell during the time spent on the climb
equals 𝟏𝟖𝟖𝐾𝐽
𝑚2, and its power is: 𝑃𝑐𝑙 = 142.4 𝑊
𝑚2.
10.3.3 Cruise
Solar irradiance: 𝑰𝒄𝒓 = 874.3 W/m2.
Time: 92 min (𝒕𝒄𝒓 = 5520 s)
Operating temperature: -27 ºC (Chapter “operating temperature”).
Operating efficiency: 𝟐𝟕. 𝟒% (𝒆𝒄𝒓 = 𝟎. 𝟐𝟕𝟒).
Now, the energy generated by 1m2 of Maxeon during the cruise is calculated and equals
𝟏, 𝟑𝟐𝟐. 𝟒𝐾𝐽
𝑚2, and its power is: 𝑃𝑐𝑟 = 239.6 𝑊
𝑚2.

10/1/2018
77
Table 12. Power output and energy provided by 1m2 of SP118L for each part of the RF.
10.3.4 Descent
Solar irradiance: 𝑰𝒅 = 𝟒𝟖𝟐. 𝟐 W/m2.
Time: 16.2 min (𝒕𝒅 = 972 s)
Operating temperature: -27 ºC (approximation: considered the same as cruise)
Operating efficiency: 𝟐𝟕. 𝟒% (𝒆𝒅 = 𝟎. 𝟐𝟕𝟒).
Now, applying equation 18 but using the cruise parameters, the energy generated by 1m2 of
Maxeon during the climb is calculated and equals 𝟏𝟐𝟖. 𝟒𝐾𝐽
𝑚2, and its power is: 𝑃𝑐𝑟 = 132.1 𝑊
𝑚2.
10.4 Energetic contribution of 1 m2 of SP118 L
The following table gives the power and energy provided by 1m2 of SP118 L for each part of the
RF:
Power (W/m2) Energy (KJ/m2) TR+taxi 123.6 36.8
Climb 188 142.4
Cruise 1,322.4 239.6
Descent 132.1 128.4
The most remarkable curiosity extracted from table 12 has to do with the PV power variation depending
on the part of the flight. Due to all the solar radiation advantages brought by the high altitude at which
A320 flies, the PV power output during the cruise is 6.5 times higher than on the ground. This is the key
point of installing PV panels on aircrafts.
Summing the values obtained with the previous procedures for each part of the reference flight,
the total amount of energy produced is calculated:
𝑅𝐹𝑔𝑚2 = 𝐼𝑔 + 𝐼𝑐𝑙 + 𝐼𝑐𝑟 + 𝐼𝑑
( 22 )
Now, since all the parameters have already been obtained, the RF generation per square meter
(𝑅𝐹𝑔𝑚2) can be obtained and equals 𝟏, 𝟕𝟔𝟐. 𝟒𝐾𝐽
𝑚2.
𝑅𝐹𝑔𝑚2 ≅ 𝟏. 𝟕𝟔 𝑴𝑱
𝒎𝟐
Comparing this value with A320 electric energy consumed during the flight (𝑅𝐹𝑒𝑐 = 1231 𝑀𝐽,
calculated in chapter 9.3), the electric energy contribution by 1 m2 of solar panel installed on the
aircraft is determined:
𝐸𝑃𝑉𝑐 =𝑅𝐹𝑔𝑚2
𝑅𝐹𝑒𝑐 ( 23 )

10/1/2018
78
Applying equation 20 with the indicated values, the electric energy contribution of 1 m2 of solar
panel equals 𝟎. 𝟏𝟒𝟑% of the total electric energy consumption during the RF.
𝐸𝑃𝑉𝑐 = 𝟎. 𝟏𝟒𝟑%
𝑚2
With this value, the total surface required to cover A320 electric energy demand with PV energy
generation can be deduced and is about 700 𝑚2. Logically, neither A320 nor any commercial
plane has such an extended surface. Therefore, since the electric energy consumption is
nowhere near to be covered by just PV generation, the next best thing is to install solar panels
on all the A320 available surface. The following chapter focuses on this issue.

10/1/2018
79
6.07 m
1.64 m
Figure 62. A320 wing plan and schematized view. Wing fit chord parameter obtained from
figure 9 in annex E. Image and rib parameter extracted from Aeroflot. [94]
11 Available A320 surface for Maxeon GIII This chapter focuses on selecting the available surfaces in A320 external structures to install PV
systems. Defining this surfaces will enable the quantification of the electric energy generated.
In order not to provide just one surface installation option, this study suggests three different
surface combinations: wing, wing and fuselage (30º) and wing and fuselage (60º). These
different possibilities have different energy generation outputs. Later on they will be analysed
one by one in order to determine their advantages and disadvantages among them.
Before starting, it is important to mention that all the energy calculations have been performed
with the same hypothesis used to calculate the energy generation of one square meter in
chapter 10.3.
11.1 Wing available surface
Due to the low percentage of electric energy covered by 1 m2, it is necessary to use all the
available A320’s wing surface to install solar panels. However, just a portion of the wing’s surface
is available for this kind of installation.
A significant part of the wing is composed of control surfaces which include devices such as flaps
and spoilers. These devices modify their geometry during the flight depending on the
aerodynamic requirements. Therefore, installing solar panels on these elements would require
a complexity which is neither in the scope of the study nor in the interest of aircraft companies.
Having suppressed this wing’s area portion, the outer wing box remains. This is the wing part
which doesn’t modify geometry during the flight (delimited by discontinuous lines in figure 62).
The aim of the following procedure is to find the percentage of total wing area occupied by the
outer wing box. With this value obtained, the available wing surface will be obtained:

10/1/2018
80
2.7 m
0.6 m
Figure 63. A320 wing plan view highlighting outer wing box. Image and rib parameters
extracted from Aeroflot. [94]
The objective now is to obtain the surface of the outer wing box. Unfortunately, the only values
known to perform this calculation are the lengths of ribs 1 and 27, which are 6.07m and 1.64m,
respectively (annex E planes geometry). Thus, an approximation method will be required to go
on with the procedure.
Figure 63 displays the lineal approximation made to calculate the outer wing box area. Orange
lines indicate wing limits and yellow lines indicate outer wing box limits. Notice that both wing
and outer box wing real areas do not coincide with the orange and yellow lines, respectively.
Their geometry has been linearized as a simplification for the procedure.
Since figure 63 is made at scale 1:100, the outer wing box real lengths in ribs 1 and 27 can be
calculated by measuring their distances on the image and multiplying by 100:
On the image (1:100):
- Rib 1 outer wing box length: 2.7 cm
- Rib 27 outer wing box length: 0.6 cm
Real scale (x100):
- Rib 1 outer wing box length: 270 cm = 2.7 m
- Rib 27 outer wing box length: 60 cm = 0.6 m

10/1/2018
81
1.65 m
3.85 m
Figure 64. A320 wing plan view highlighting both wing mean chord and outer wing box mean chord.
The following step is to obtain the mean chord lengths of both the whole wing and the outer
wing box.
Mean wing chord:
𝐶𝑚𝑤 = 𝑅1 + 𝑅27
2
( 24 )
Where 𝐶𝑚𝑤 is the wing mean chord, “𝑅1” is the 1st rib of the wing and 𝑅27 is the 27th rib.
Both rib parameters have already been determined in figures 63. Thus, the wing mean
chord is 3.85 meters long.
*Note that the mean wing chord has been calculated under a geometrical approximation which
has neglected the fact that the trailing edge line isn’t constantly straight.
Mean outer wing box chord:
𝐶𝑚𝑜𝑤𝑏 = 𝑅𝑜𝑤𝑏1 + 𝑅𝑜𝑤𝑏27
2
( 25 )
Where 𝐶𝑚𝑜𝑤𝑏 is the outer wing box mean chord, 𝑅𝑜𝑤𝑏1 is the 1st rib of the outer wing
box chord and 𝑅27 is the 27th rib of the outer wing box chord. Both rib parameters have
already been determined in figure 63. Thus, the wing mean chord can be calculated and
equals 1.65 meters long.

10/1/2018
82
Once the mean chord for both areas has been obtained, the wing available surface for PV
systems can be deduced with the following expression:
𝑆𝑃𝑉𝑤𝑎 = 𝐶𝑚𝑜𝑤𝑏
𝐶𝑚𝑤· 𝑆𝑤 ( 26 )
Where 𝑆𝑃𝑉𝑤𝑎 is the wing available surface for PV systems, 𝐶𝑚𝑜𝑤𝑏 is the outer wing box mean
chord, 𝐶𝑚𝑤 is the wing mean chord and 𝑆𝑤 is the wing surface, which is 122.4 m2 according to
the A320 data given in table 5. Therefore, applying equation 23, the wing available surface for
PV systems 52.46 𝑚2 equals.
𝑺𝑷𝑽𝒘𝒂 ≅ 𝟓𝟐. 𝟓 𝒎𝟐
Then, if this surface is multiplied by the energy generation per m2 (𝑅𝐹𝑔𝑚2), the wing PV
generation is obtained:
𝑊𝑃𝑉𝑔 = 𝑅𝐹𝑔𝑚2 · 𝑆𝑃𝑉𝑤𝑎 ( 27 )
𝑾𝑷𝑽𝒈 = 𝟗𝟐. 𝟒 𝑴𝑱
Similarly, if the wing available surface is multiplied by the % of energy covered per m2 (𝐸𝑃𝑉𝑐),
the wing PV energy contribution to A320 total electric energy demand is obtained:
𝑊𝑃𝑉% = 𝐸𝑃𝑉𝑐 · 𝑆𝑃𝑉𝑤𝑎 ( 28 )
𝑾𝑷𝑽% = 𝟕. 𝟓𝟏 %
The values obtained indicate the energy that would produce the solar panels installed on the
wing available surface and the percentage of electric energy covered by all them, respectively.
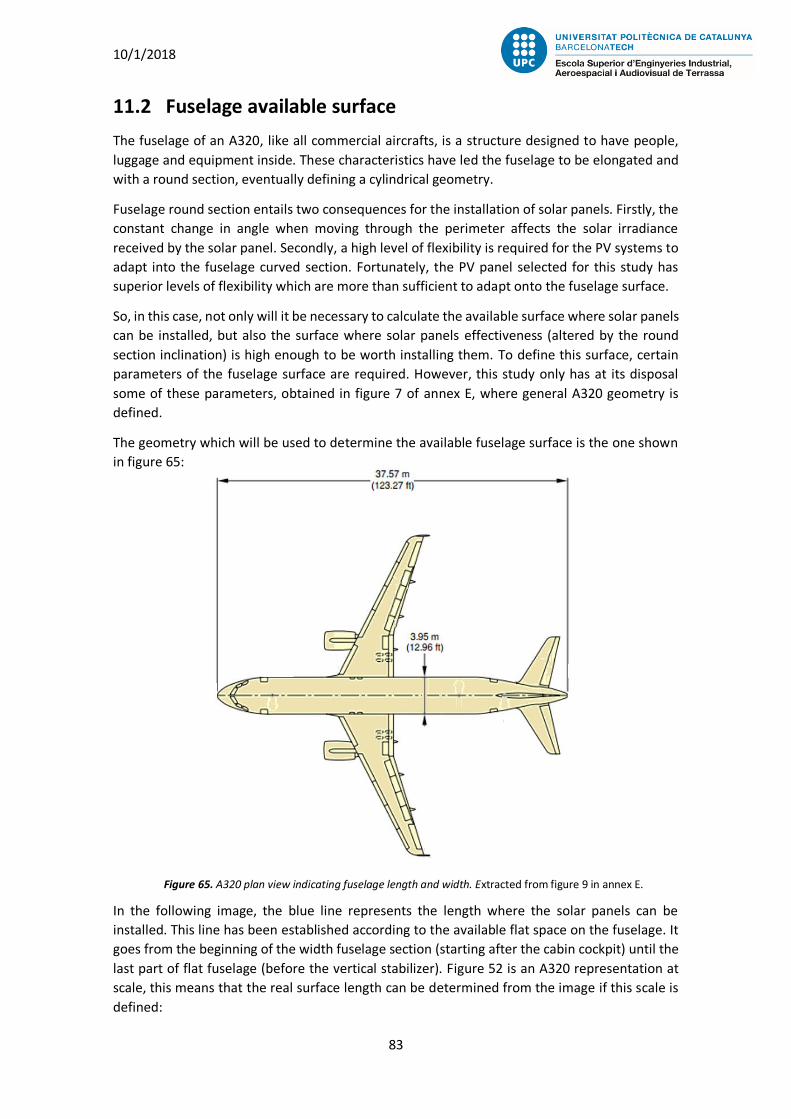
10/1/2018
83
Figure 65. A320 plan view indicating fuselage length and width. Extracted from figure 9 in annex E.
11.2 Fuselage available surface
The fuselage of an A320, like all commercial aircrafts, is a structure designed to have people,
luggage and equipment inside. These characteristics have led the fuselage to be elongated and
with a round section, eventually defining a cylindrical geometry.
Fuselage round section entails two consequences for the installation of solar panels. Firstly, the
constant change in angle when moving through the perimeter affects the solar irradiance
received by the solar panel. Secondly, a high level of flexibility is required for the PV systems to
adapt into the fuselage curved section. Fortunately, the PV panel selected for this study has
superior levels of flexibility which are more than sufficient to adapt onto the fuselage surface.
So, in this case, not only will it be necessary to calculate the available surface where solar panels
can be installed, but also the surface where solar panels effectiveness (altered by the round
section inclination) is high enough to be worth installing them. To define this surface, certain
parameters of the fuselage surface are required. However, this study only has at its disposal
some of these parameters, obtained in figure 7 of annex E, where general A320 geometry is
defined.
The geometry which will be used to determine the available fuselage surface is the one shown
in figure 65:
In the following image, the blue line represents the length where the solar panels can be
installed. This line has been established according to the available flat space on the fuselage. It
goes from the beginning of the width fuselage section (starting after the cabin cockpit) until the
last part of flat fuselage (before the vertical stabilizer). Figure 52 is an A320 representation at
scale, this means that the real surface length can be determined from the image if this scale is
defined:

10/1/2018
84
Figure 66. A320 plan view indicating
fuselage length and width.
With the same zoom, 14 cm in the figure are 37.57 m in the reality. For this frame, the scale
calculated is: 𝑆𝑐𝑎𝑙𝑒 =14
3757 ≈
𝟏
𝟐𝟕𝟎
Knowing this, since the blue line measures 10 cm, its real distance can be obtained. Dividing the
10 cm by the scale defined, the fuselage available length is obtained and equals 27 meters (𝑙𝑓𝑎).
The next step is to determine the perimeter of the fuselage section which solar panels should
cover. To do so, first of all the geometry of the section is required. Although this section isn’t a
perfect circumference, this procedure will contemplate it as if it was perfectly round with a
diameter of 3.95 meters defined in figure 66.
First, the perimeter is obtained:
𝑝 = 𝜋𝐷
( 29 )
Where 𝑝 is the perimeter and 𝐷 is the diameter of the fuselage section, which is 3.95 meters.
Therefore, a perimeter of 12.41 meters is obtained.
Now it is necessary to define the arch of circumference which solar panels will cover. Selecting
this parameter is not trivial. Extending the perimeter means more surface but with less average
generation. In other words, since increasing the perimeter means an increase of the surface
inclination, solar panels at the arch extremes will produce considerably less amount of energy
than the ones installed at the top of the fuselage. This geometric effect depends on many flight
variables which will be discussed in further chapters.
14 cm
10 cm

10/1/2018
85
0º 30º -30º
Figure 67. Geometry corresponding to 30
degrees fuselage.
(30)
For now, this study focuses on considering two different fuselage installations:
11.2.1 Fuselage surface up to 30º
Considering an angle of 30 degrees means that the irradiance received at the arch extremes is
about an 87%. Thus, the dissipation is near 13%, which apparently is a small loss. However, fixing
this value with a low dissipation makes sense because, since the section is round, from 0 degrees
until 30 degrees of inclination the dissipation increases constantly. Meaning that before
reaching the 30 degrees angle, the surface goes through all the previous grades of inclination,
producing an accumulative dissipation. For this reason, 30 degrees is considered as an adequate
inclination limit which prefers quality over quantity.
Now that the inclination limit has been fixed, the circumference arch length in which solar panels
shall be installed can be obtained:
𝐴𝑙(𝛼) = 2 · 𝛼
360𝜋𝐷
Where 𝐴𝑙(𝛼) is the arch length according to the angle 𝛼. α α
In this case, since 𝛼 equals 30º, 𝐴𝑙(30) = 2.07 𝑚𝑒𝑡𝑒𝑟𝑠
Finally, operating with the parameters that define the fuselage available surface for solar panels
installation:
𝑆𝑓𝑎(30) = 𝑙𝑓𝑎 𝑥 𝐴𝑙(30) ( 31 )
Applying equation 28 with the parameters already defined, the fuselage available surface up to
30º inclination is obtained:
𝑆𝑓𝑎(30) = 55.9 𝑚𝑒𝑡𝑒𝑟𝑠
(Notice that for this procedure the communication devices installed at the top of commercial
aircrafts have been neglected when quantifying the fuselage available surface. Thus, in practice
the available fuselage area would be slightly reduced).
In order to quantify the percentage of energy covered with the fuselage available surface, it
must be taken into account the dissipation due to angle variation on the fuselage surface. To do
so, the following procedure is performed:
𝑛 =cos 0º + 2 ∑ cos𝑖 𝜃30
𝑖=1
𝑁𝑐𝑜𝑠 ( 32 )
Where 𝑛 is the dissipation factor and 𝑁𝑐𝑜𝑠 is the number of cosines which equals to 61. Applying
equation 29, the dissipation factor “𝑛” is obtained and is equal to 0.953.

10/1/2018
86
Then, if the fuselage available surface up to 30º inclination (𝑆𝑓𝑎(30)) is multiplied by the energy
generation per m2 (𝑅𝐹𝑔𝑚2) and the dissipation factor (𝑛), the fuselage (30º) PV generation
(𝐹(30)𝑃𝑉𝑔) is obtained:
𝐹(30)𝑃𝑉𝑔 = 𝑅𝐹𝑔𝑚2 · 𝑆𝑓𝑎(30) · 𝑛 ( 33 )
𝑭(𝟑𝟎)𝑷𝑽𝒈 = 𝟗𝟑. 𝟖 𝑴𝑱
Similarly, if the fuselage available surface up to 30º inclination (𝑆𝑓𝑎(30)) is multiplied by the %
of energy covered per m2 (𝐸𝑃𝑉𝑐) and the dissipation factor (𝑛), the fuselage (30º) PV energy
contribution to A320 total electric energy demand (𝐹(30)𝑃𝑉%) is obtained:
𝐹(30)𝑃𝑉% = 𝐸𝑃𝑉𝑐 · 𝑆𝑓𝑎(30) · 𝑛 ( 34 )
𝑭(𝟑𝟎)𝑷𝑽% = 𝟕. 𝟔𝟐%
11.2.2 Fuselage surface up to 60º
Contrary to the 30º choice, considering 60º seeks increasing the energy produced by the PV
systems on A320. However, this production increase has a drawback: the effectiveness of solar
panels located near the extremes of the 120º circumference arch is significantly reduced by the
strong inclination.
In order to calculate the fuselage surface inclined up to 60º, an analogous procedure to the one
made for fuselage (30º) is performed.
In this case, since the circumference arch length is doubled, the fuselage (60º) available surface
is double too:
𝑆𝑓𝑎(60) = 2 · 𝑆𝑓𝑎(30)
( 35 )
𝑆𝑓𝑎(60) = 111.8 𝑚2
The following step consists in calculating the angle dissipation factor for this new geometry. As
cosines function is not lineal, the dissipation increase is considerably higher than for 30º:
𝑚 =cos 0º + 2 ∑ cos𝑖 𝜃60
𝑖=1
𝑁𝑐𝑜𝑠 ( 36 )
Where 𝑚 is the dissipation factor and 𝑁cos is the number of cosines which, in this new case,
equals to 121. Applying equation 33, the dissipation factor 𝑚 is obtained and is equal to
0.824.
Finally, if the fuselage available surface up to 60º inclination (𝑆𝑓𝑎(60)) is multiplied by the
energy generation per m2 (𝑅𝐹𝑔𝑚2) and the dissipation factor (𝑚), the fuselage (60º) PV
generation (𝐹(60)𝑃𝑉𝑔) is obtained:

10/1/2018
87
𝐹(60)𝑃𝑉𝑔 = 𝑅𝐹𝑔𝑚2 · 𝑆𝑓𝑎(60) · 𝑚 ( 37 )
𝑭(𝟑𝟎)𝑷𝑽𝒈 = 𝟏𝟔𝟐. 𝟏 𝑴𝑱
Similarly, if the fuselage available surface up to 60º inclination (𝑆𝑓𝑎(60)) is multiplied by the %
of energy covered per m2 (𝐸𝑃𝑉𝑐) and the dissipation factor (𝑚), the fuselage (60º) PV energy
contribution to A320 total electric energy demand (𝐹(60)𝑃𝑉%) is obtained:
𝐹(60)𝑃𝑉% = 𝐸𝑃𝑉𝑐 · 𝑆𝑓𝑎 (60) · 𝑚 ( 38 )
𝑭(𝟑𝟎)𝑷𝑽% = 𝟏𝟑. 𝟐%
11.3 Chapter conclusions
This surface analysis, whose objective has been to determine how many square meters of solar
panels could be installed on A320, has provided valuable data. To begin with, it has shown that
installing solar panels on the wing available surface allows PV systems to cover 7.51% of the
total A320 electric energy demand during the reference flight. This value is big enough to be
considered as a good result. However, from the demanding perspective, is logical to expect a
bigger percentage of electric energy covered.
With intention of increasing PV systems energy generation, the fuselage has also been
considered as a surface able of housing PV systems. Despite the fact that its geometry inclines
the solar panels on it, which ends up reducing their effectivity, the results have shown that the
surface is still able to produce a noticeable amount of energy. Two possible configurations have
been carried out: installing PV systems up to 30º of inclination or installing PV systems up to 60º
of inclination. The 30º configuration contributes with a 7.62% out of the total A320 electric
demand during the reference flight. Panels installed with this configuration will have a higher
average efficiency, but less power output. Analogously the second configuration contributes
with a 13.2%. Panels installed with the 60º fuselage configuration will have lower efficiency due
to the increased tilting. However, the amount of energy produced is substantially bigger than
the first option.
From now on, this study will analyse the aerodynamic, environmental, economic and energetic
impact the PV installations on the following surfaces:
Wing.
Wing and fuselage (30º).
Wing and fuselage (60º).
Separating the analysis with these three different groups will allow a better understanding of
the PV installation impact. From the energetic point of view, installing over more surface clearly
means an increase of electric generation. However, adding PV systems on an aircraft wing and
fuselage also changes the aerodynamic, environmental and economic outcome. Therefore,
comparing the three configurations among them will bring different interesting results.

10/1/2018
88
12 PV installation impact on A320
This chapter gathers all the information collected in the previous stages of the study and
analyses them. The PV installation impact on A320 can be separated in 4 subgroups: Energetic,
aerodynamic, economic and environmental. As follows, each of these impacts are reviewed and
commented one by one.
12.1 Aerodynamic impact
In this point, the study will focus on analysing the aerodynamic consequences entailed by the
PV installation. Despite the really small solar panel thickness, the geometry variation can cause
aerodynamic changes which need to be studied. Whether or not this installation reduces the
aerodynamic quality of the aircraft, has to be confirmed by the following analysis.
Computational fluid dynamics have been used to develop this procedure. Particularly, a 2D grid
simulation of an A320 average airfoil profile has been created. Firstly, the behaviour of the
profile without PV installation has been registered. Secondly, the same simulation has been
made with the addition of the PV installation, taking into account the geometry changes created.
Finally, both results have been compared and conclusions have been extracted from them.
12.1.1 Reference airfoil profile
Commercial aircrafts airfoil profiles information is considered highly confidential when it comes
to construction and concrete geometric parameters. Only basic information is available for
unclassified people. This is all due to copyright and proprietary issues because companies
compete with each other. Moreover, these profiles are obtained with complex CFD which makes
them change constantly along their span. Unfortunately, as a result, obtaining the exact A320
profile geometry will be impossible.
Given the impossibility to obtain the real A320 profile, to analyse the aerodynamic impact of the
PV installation, this study will select an airfoil profile with common characteristics and similar
Reynolds values to the A320 cruise flight. If this profile ends being considerably different from
the A320 profile, it doesn’t matter. For this study CFD analysis, the concrete geometry of the
profile doesn’t affect too much. However, what does matter is the change of behaviour once
the geometry is altered by the PV installation.
Reynolds number is expressed as follows:
𝑅𝑒𝑐 = 𝜌 · 𝑈 · 𝑐
µ ( 39 )
Being 𝜌 the density of the fluid, 𝑈 its non-perturbed speed, 𝑐 the profile average chord and µ
the dynamic viscosity. During cruise flight these parameters have the following values:
According to figure 12 in annex G, the relative density (σ) equals to 0.3099. Multiplying
it by the sea level density (ρ0) which equals to 1.225 kg/m3, the density (ρ) at cruise
altitude is obtained and equals 0.38 kg/m3.
The mean chord 𝑐 has previously been calculated in chapter 11.1 and is 3.85 m.

10/1/2018
89
Figure 68. Geometry of the airfoil profile Lockheed C-5A BL758.6. [96]
Figure 69. Lockheed C-5A BL758.6 geometry alteration due to the PV installation.
The non-perturbed speed of the fluid is M0.78. Figure 12 in annex G indicates that at
35,000 feet the speed of sound is 576 knots. Then, considering that 1 knot is 1.852 km/h,
M0.78 equals 832.1 km/h, which are 231.1 m/.
To calculate the dynamic viscosity µ, Sutherland’s law has to be applied. This law takes
into account the temperature when determining the “µ” value of an ideal gas.
According to cfd-online [95], Sutherland’s law can be expressed as:
𝜇 = 𝐶1 · 𝑇
32
𝑇 + 𝑆
( 40 )
In which 𝑇 is the absolute temperature of the air, 218.85 K (-54.3º C), 𝑆 is the
Sutherland’s temperature, 110.4 K, and 𝐶1 is a constant which equals 1.458 x 10⁻⁶
kg/m·s·k1/2.
Therefore, the dynamic viscosity is calculated: 𝜇 = 1.434 · 10−5 𝑃𝑎 · 𝑠.
Finally, applying equation 36, the RF Reynolds can be calculated:
𝑅𝑒𝑅𝐹 = 23.6 · 106
Bearing in mind all the previous considerations and the Reynolds obtained, Lockheed C-5A BL758.6 has been the profile selected:
This profile geometry has been used to perform the first simulation, which has provided the
reference operating values of the airfoil. After completing this first simulation, the second
simulation with the geometry alteration due to the PV installation has been carried out. With
the new data obtained, a comparison between the behaviour of the profiles has been done.
The following image displays the geometry alteration caused by the solar panels:
The original airfoil geometry has been modified by adding an additional layer of points. This layer
has been included in a distance which is proportional to 2 mm in the reality.

10/1/2018
90
Table 13. Main features of the simulations carried out.
12.1.2 Simulation main characteristics
This chapter indicates and describes the main characteristics of the simulation carried out. To
have more detailed information, see annex J. The main features defining the simulations are
shown on the following table:
Main features of the simulations
Mesh generator
ANSYS Icem CFD 15.0
Solver
ANSYS Fluent 15.0
Numeric method
Finite Volumes
Mesh size
55,000 cells
Simulation type
Pressure-based
Time type
Unsteady
Pressure-velocity coupling
Coupled
Spatial discretization order
Second
Temporal discretization order
First
Model used
k-e standard
Time step size
1·10-5 s
Running a simulation with the characteristics from above lasts about 12 hours until consistently
converging. The PC in which the simulation has been launched has the following characteristics:
- Processor: Intel(R) Core™ i5-3450 CPU @ 3.10GHz 3.50 Ghz.
- Installed memory (RAM): 8.00 GB.
- System type: OS 64 bits.
To see more CFD simulation details check annex J.
12.1.3 Comparative aerodynamic results
Now that both of the simulations have been carried out, a comparative analysis can be
performed with them. These results are really important for the feasibility of the installation.
Without the aerodynamic acceptance of the installation, the chances of the PV systems being
practicable on commercial aircrafts are very unlikely.
First of all, to confirm that the simulation has been carried out adequately and its results are
credible, the Mach velocity contour around the airfoil is displayed:
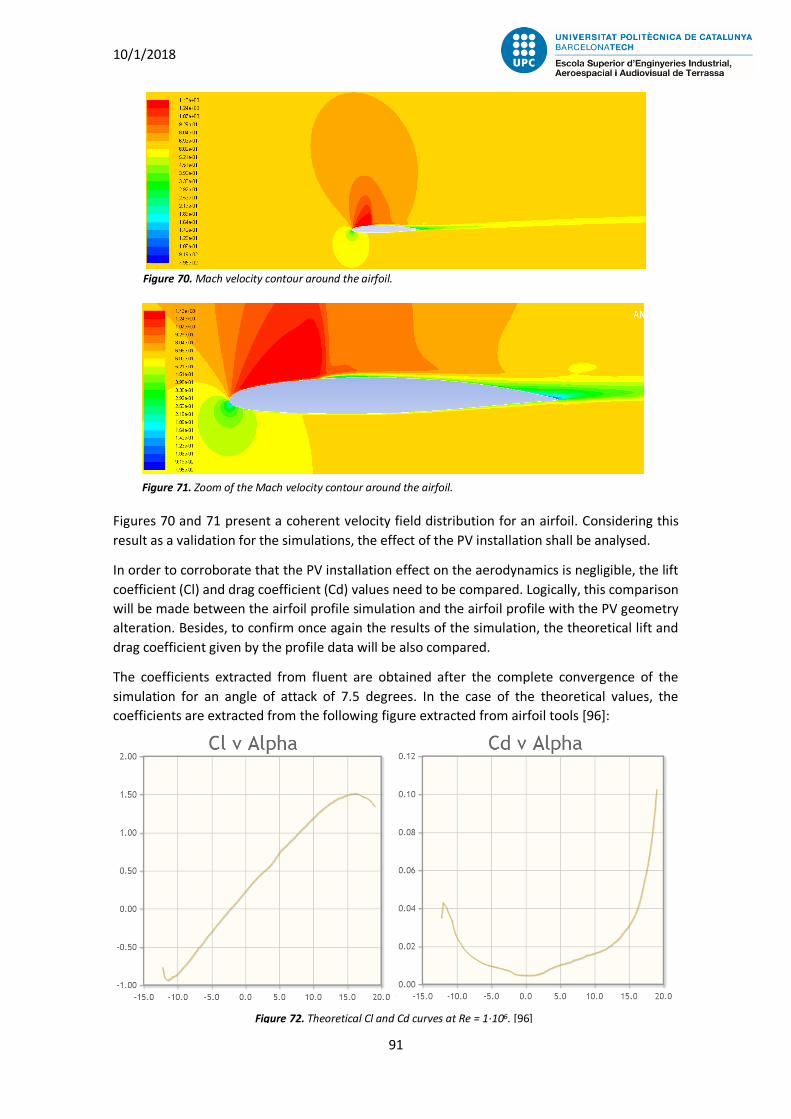
10/1/2018
91
Figure 70. Mach velocity contour around the airfoil.
Figure 71. Zoom of the Mach velocity contour around the airfoil.
Figure 72. Theoretical Cl and Cd curves at Re = 1·106. [96]
Figures 70 and 71 present a coherent velocity field distribution for an airfoil. Considering this
result as a validation for the simulations, the effect of the PV installation shall be analysed.
In order to corroborate that the PV installation effect on the aerodynamics is negligible, the lift
coefficient (Cl) and drag coefficient (Cd) values need to be compared. Logically, this comparison
will be made between the airfoil profile simulation and the airfoil profile with the PV geometry
alteration. Besides, to confirm once again the results of the simulation, the theoretical lift and
drag coefficient given by the profile data will be also compared.
The coefficients extracted from fluent are obtained after the complete convergence of the
simulation for an angle of attack of 7.5 degrees. In the case of the theoretical values, the
coefficients are extracted from the following figure extracted from airfoil tools [96]:

10/1/2018
92
Table 14. Cl and Cd coefficients from XFOIL (theoretical) and the two simulations.
According to figure 72, for an angle of attack of 7.5º, the lift coefficient is roughly 1 and the drag
coefficient is nearly 0.012.
Is important to bear in mind that the coefficients provided by airfoiltools [96] are based on
XFOIL, which is a panel method with analytic models. Since these theoretical coefficients have
been obtained through a different method, the theoretical results are expected to differ a bit
from the simulation. However, these analytical values are just a reference to validate the
simulation once again. Therefore, as long as the theoretic and numeric coefficients are in the
same order of magnitude, the simulation can be considered valid.
The following table contains the lift coefficient (Cl) and drag coefficient (Cd) values for each one
of the simulations. Also, the theoretical Cl and Cd values are given to validate the results of the
simulation:
Theoretical Airfoil Airfoil with PV
Lift
/
42,630
43,000
Lift coefficient
1
1.092
1.102
Drag
/
-2,648
-2,680
Drag coefficient
0.012
0.068
0.069
As table 14 indicates, the simulation lift coefficient doesn’t differ too much from the theory.
Regarding the drag coefficient, although the difference is bit more noticeable, the values are still
in the same order of magnitude. Hence, with the similarity between theoretical and numerical
results, the simulation can be relied.
Now, focusing on the simulation results comparison, lift and drag coefficient values present
almost no difference. A 2 mm increase on the wing width hardly represents 0.5% of the airfoil
profile maximum thickness. The geometrical alterations produced by this change are
inconsequential. This results demonstrate that commercial aircrafts aerodynamics are
unharmed by the PV installation. These are truly favourable results for the integration of PV
systems on planes.
Wing aerodynamics, don’t present even a slight variation when PV systems are installed on
them. Following the logic of these results, this study considers that the solutions including PV
installation on the fuselage surface are also completely feasible aerodynamically.
12.2 Energetic impact
This study has quantified, for the reference flight defined, the following parameters:
-A320 total energy consumption.
-A320 electric energy consumption.
-PV generation on A320 depending on the three different options analysed.
Next, these three PV installing solutions mentioned in chapter 11.3 will be compared
energetically.

10/1/2018
93
12.2.1 A320 electric consumption over total consumption
In order to compare the A320 electric energy demand in front of the A320 total energy, the data
obtained in chapter 9.2 and 9.3 will be used. According to the calculations made in those
chapters, during the RF, A320 total energy consumption equals to 61,253.5 MJ and A320 electric
energy consumption equals to 1231 MJ. Dividing these values, the results obtained indicates
that the electric energy consumption during the RF is just a 2.01% in front of the A320 total
energy demand.
A320 total energy consumption can be broken down as propulsive energy and electric energy.
The fact that the A320 electric needs only suppose roughly 2% of the total energy proves how
huge the difference is between the propulsive and electric requirements of commercial aircrafts.
Out of all the energy generated, almost 98% of it is destined to propulsion.
12.2.2 PV electric contributions in A320
As follows, the energetic generation of the PV installation for each one of the surface
combinations proposed is described:
Wing: During the RF it produces 92.4 MJ. This amount of energy equals 7.51% of the
total A320 electric demand during the RF. Out of the total A320 energy required to fly,
the 92.4 MJ only represent 0.15%.
Wing and 30º fuselage: This option generates 186.2 MJ during the RF. This energy
represents 15.13% of the total A320 electric demand during the RF, which doubles the
energy output of installing only on the wing. The PV energetic generation of this option
equals 0.30% of the total A320 energy required to perform the RF.
Wing and 60º fuselage: Although being the less efficient, this is the most energy
producing solution. It provides 254.5 MJ to the system during the RF. This equals 20.68%
of the A320 electric demand during the RF, which is a 36.6% more energy than the
second option. The PV energy production of this solution represents 0.42% of the total
A320 energy required to perform the RF.
Regarding the A320 electric demand, all of the three solutions proposed provide a significant
amount of energy to the electric system. However, the energy needs of the electric system are
so small contrasted with the propulsive energetic needs. Therefore, the A320 electric demand
requirements represent a very small portion of the total A320 energy demand (2.01%). This
explains why the energy provided by the PV installations is tiny compared to the total A320
energy requirements.
When comparing the three different solutions, the more surface installation, the more energy
generated and, therefore, the greater the energetic impact on the A320 energy demands.
According to this, the third solution would be the best one because it provides a bigger portion
of the A320 electric energy demand during the RF. However, energy isn’t be the only factor to
take into consideration regarding the feasibility of these installations. Each solution implies
different costs and different paybacks. Also, each one of them has different aerodynamic and
environmental impacts. For these reasons, the proper evaluation of these solutions requires the
analysis of the other impacts.
10/1/2018
94
12.3 Environmental impact
This point focuses on determining the emissions reduced by the PV installation during the RF.
Aircraft emissions are directly linked to the kerosene burnt to generate momentum. Thus, by
determining the kerosene saved, the emissions avoided are obtained straight forwardly.
As it has been calculated in chapter 9.1, the total fuel burnt in the RF is about 5,698 kg of
Kerosene. This propellant generates 61,253.5 MJ. In point 12.1, the PV generation was
represented as a portion of energy obtained with the propellant. Thus, by relating these
concepts the amount of fuel saved can be quantified easily.
Equation 38 obtains the amount of fuel saved due to the PV energy input:
𝐹(𝑠) = 𝐾 · 𝑝(𝑠)
100
( 41 )
Where 𝐹(𝑠) is the fuel saved by the PV installation analysed, 𝐾 is the Kerosene burnt during the
RF and 𝑝(𝑠) the percentage of energy provided by the PV installation analysed to the total
energy required for the RF.
As follows, the fuel saved is calculated for each one of the three installations proposed by the
study:
Wing: This solution contributes to 0.15% of the total A320 energy required during the
flight. Consequently, 0.15% of the total Kerosene used during the RF won’t be burnt if
A320 has PV panels on the wing. The amount of fuel saved with this solution during the
RF are 8.74 Kg of Kerosene.
Wing and 30º fuselage: The PV energetic generation of this option equals 0.31% of the
total A320 energy required to perform the RF. Therefore, the reduction in emissions will
also be 0.30% which mean that 17.09 kg of Kerosene won’t be burnt during the RF if this
solution is applied.
Wing and 60º fuselage: Although being the less efficient, this is the most energy
producing solution and, consequently, the one that reduces emissions the most. It
reduces 0.42% of the total A320 emissions. According to equation 38, 23.93 kg of
Kerosene are saved during the RF.
12.4 Economic impact
So far, the feasibility of the PV installation has been demonstrated aerodynamically,
energetically and environmentally. However, to confirm the feasibility of this installation an
affordable budget and payback time are required.
12.4.1 Installation cost
Installing solar modules on a plane surface demands a complexity beyond the reach of this study.
This uncertainty doesn’t allow quantifying the adaptation/assembly costs into the aircraft
design. Therefore, only the material costs will be taken into account.

10/1/2018
95
According to what has been stated in chapter 7.3, the following list of materials determine the
cost:
Solar panel: 330.4 €/unit.
Feeders: neglected.
Battery: already included in A320 design.
Inverter: already included in A320 design.
Charge controllers: already included in A320 design.
Thus, only the solar panel cost will be involved in the budget of the installation.
Each solar panel unit covers 500 x 1125 mm, which are 0.5625 m2/unit. Knowing the surface
covered for each solar panel unit, the total amount of units required can be defined.
Wing: This solution allows solar panels to be installed on 52.5 m2. A quantity of 93 solar
panel units are needed to cover this amount of surface. Thus, the cost to install solar
panels on the wing surface is approximately 30,700 €.
Wing and 30º fuselage: This option houses 108.4 m2. This surface is covered with 193
panels which increases the cost to 63,800 €.
Wing and 60º fuselage: Being the solution offering more housing surface, wing and 60º
fuselage cover 164.3 m2. 292 units are required to cover the whole surface offered by
this solution and the total cost of these units goes up to 96,500 €.
It is important to recall that this installation might change some of the aircraft parts design. All
the capital invested for this purpose (research, machines, additional materials, etc.) are not
being contemplated within the installation cost.
12.4.2 Installation payback time
In economic terms, PV panels on aircrafts have the duty of reducing the amount of Jet fuel used
in each flight. Each kilogram of kerosene saved earns the company a quantity of money. This
small but continued gain slowly increases and becomes bigger and bigger. The objective of this
point is to determine payback time required to recoup the initial investment of the installation.
To begin the procedure, the flight hour’s average needs to be determined. This value will
quantify the number of reference flights (RF) performed each day by A320. Once this is done,
the maintenance breaks of the aircraft will also be considered. In this way, the number of
operative days each year will be realistically reduced. Finally, the average jet fuel price will be
defined so that the kerosene savings can be traduced to economic gain.
Average flight hours per day
There are several factors affecting the daily effective hours of an aircraft. First of all,
depending on the company the flight hours of a plane differ. Low-cost companies tend
to increase the flight hours of their aircrafts so that they earn more money. By contrast,
regional airlines, which prefer quality over quantity, tend to fly fewer hours per day.
10/1/2018
96
Another factor affecting this parameter has to do with the aircraft model. Long-haul
international wide-bodies have different flight times and TRT than short haul narrow
bodies.
Despite the variances presented by the daily effective hours of an aircraft, an average
value can be defined. In agreement with the annual registers of different companies in
airline data project [97], an aircraft tends to have about 10 effective flight hours per day.
This averaged value includes the different kind of companies. While regional airlines use
their aircraft 8-9 hours per day, low-cost companies use them 11-12 hours. Therefore, it
seems logic for the mean value to be 10 hours per day.
The RF determined by this study has a duration of 2 hours and 20 minutes. Thus, 4 RF
per day will be approximated for this procedure.
This is the most unreal approximation made during the whole study. Depending on the
hour of the flight, the sunlight intensity varies a lot. Notice that the irradiation reaching
A320 during the RF has been calculated under several hypotheses. Out of all these
hypotheses, the one considering that A320 is being reach by full day light intensity
during the whole flight is the most unreal of them all. Now, if 4 RF flight are being
estimated each day, it would mean that sun is always perfectly oriented to the aircraft.
Logically, this is an ideal scenario that isn’t reliable to reality. It is true that the RF and
similar type of flights tend to be performed during the day. However, in terms of sunlight
irradiance, in chapters 2.5.4 and 10.1 has been proven that departing at 9:00h isn’t the
same that departing at 12:00 or 20:00.
This study focuses on carrying out a basic feasibility analysis. Unfortunately, applying the
flight hour correction isn’t in the scope of the research. Therefore, bearing in mind the
magnitude of the hypothesis made, the study will continue the analysis.
Average operative days per year
Periodically, an aircraft requires maintenance breaks to inspect the conditions of its
systems. Without going too deeply into the matter, there are four main types of
maintenance: A-check, B-check, C-check and D-check [98]. These checks become more
extended, more specific and longer from A to B. However, the heavier the check is, the
less often it happens.
- A-check: Approximately, this sort of check happens every 500 flight hours and
lasts half a day. Consequently, since the aircraft flies 10 hours a day, every 50
days it will be inoperative half a day. In other words, every 100 days being
operative, it will lose 1 day.
- B-check: This check takes place every 6-8 months (rounded to 200 days) and
lasts 1-3 days (averaged to 2 days).
- C-check: Taking place every 22-24 months (650 days), the C-check lasts 1-2
weeks (10 days).
- D-check: Finally, the heaviest check takes place every 6-10 years (8 years, 2900
days approximately) and it takes 2 months (60 days) to be completed.

10/1/2018
97
Table 15. PV economic parameters and payback time for each one of the solutions offered.
In order to quantify the amount of operative days per year, the following calculations
are applied. Every 2900 operating days:
- A-check disables A320 for 29 days.
- B-check disables A320 for 29 days.
- C-check disables A320 for 45 days.
- D-check disables A320 for 60 days.
A total amount of 163 additional days an aircraft remains inoperative.
With these values, it can be stated that every 3063 days an aircraft remains inoperative
163 days due to maintenance. Expressed differently, a 5.32% of an aircraft lifetime is
dedicated to maintenance. Roughly 19 days each year the aircraft doesn’t fly.
Average kerosene price
According to IATA [99] the average jet fuel (jet-A1, which according to the FCOM, 3.01.28
is the main propellant for A320) price in 2017 were 181.3 cents/gallon. With the
convenient unit modifications and considering an average density of 0.804 kg/l [100],
jet-A1 costs 0.496 €/kg.
Considering the previous values, 4 flights per day and 346 operating days per year give a number
of 1384 RF per year. Adding to this calculation the cost of jet-A1, the yearly economic savings
for reducing 1 kilogram of jet fuel consumption is 687 €/kg/year.
According to this value, the payback time for each one of the solutions offered by this study are
given in the following table:
Installation cost (€) Fuel saving per RF (kg) Money savings (€/year)
Payback time
Wing
30,700 €
8.74
6,000
5 years and 1 month
Wing and 30º fuselage
63,800 €
17.09
11,700
5 years and 5 months
Wing and 60º fuselage
93,500 €
23.93
16,400
5 years and 8 months
All the comments about the results of this table are made in the following chapter: Results
analysis.

10/1/2018
98
Table 16. Compilation of the energetic, environmental and economic PV contributions for each one of the solutions.
13 Results analysis The following table shows, for each one of the three solutions, the energetic, environmental and
economic contributions of SP 118 L on A320:
Wing
Wing and fuselage (30º)
Wing and fuselage (60º)
Energy generated per RF
94 MJ
189.36 MJ
258.9 MJ
Aerodynamic feasibility
Confirmed
Confirmed
Confirmed
Contribution to electric part
7.51%
15.13%
20.68%
Contribution to total
0.15%
0.30%
0.42%
Jet fuel mass saved per RF
8.74 kg
17.09 kg
23.93 kg
Yearly Jet fuel mass saved
12,100 kg
23,700 kg
33,100 kg
Emissions reduction
0.15%
0.30%
0.42%
Cost
30,700 €
63,800 €
93,500 €
Earnings per RF
4,34 €
8.45 €
11.88 €
Yearly earnings
6,000 €
11,700 €
16,400 €
Taking a detailed look at the values, a curious phenomenon can be distinguished. At a RF scale,
the impact of the PV systems is minuscule. For instance, the energetic contributions of the
installations to the whole energetic demand of A320 don’t even reach 0.5%. These little
energetic impact was predictable after the results obtained in chapter 6.1, where the
photovoltaic energy levels were compared to the A320 energy levels. The short energetic
contribution can only save a limited amount of jet fuel. Accordingly, the money earned in every
RF is barely noticeable for a commercial aircraft company. However, aircrafts are tied to the sky.
To produce money they need to be as much in the air as possible (an aircraft on the ground is a
waste of money). This commitment entails that, during a year, aircrafts carry out a great number
of flights. Therefore, the apparently negligible contributions of the PV installation stack up,
becoming considerably significant over time. That is, briefly said, the essence of this installation.
It takes advantage of aeronautical sector immensity and extracts big gains from small impacts.
There is one particular feature that makes PV installation on aircrafts so appealing. The
fundamental convenience of installing PV systems on A320 is based on the energy-generation
levels reached in cruise configuration. As has been demonstrated throughout chapter 10, the PV
systems gets strongly favoured when flying at high altitudes. Not only do the sunbeams reaching
the solar panels irradiate with great intensity, but also the climatological agents, which are the
main PV threat, get out of range. According to chapter 10.2.5, while 1 m2 of SP 118 L has an
average power output of 36.8 W/m2 on the ground, the same surface of SP 118 L under cruise
conditions has a power output of 243 W/m2 (6.6 times more power). This extraordinarily high
generation level must be fomented.

10/1/2018
99
Aerodynamically, A320 has also proven the acceptance of the PV installation. The simulations
have shown that the geometrical variation introduced by the PV systems on the A320 surface
are unimportant for the aerodynamics on the wing. Since the wing, which is the most
aerodynamically susceptible element in the whole aircraft, is unaffected by the PV installation,
the fuselage has been considered as a valid PV surface too.
All the solutions proposed by this study have proven to be feasible. Each one of them offers
different economic, environmental and energetic levels of performance. From a commercial
point of view, having different options to choose is very useful. Investors will be able to select
the level of implication they want to have with the PV installation. As a first approach, they can
opt for the first option. On the one hand, it demands a lower initial investment and, therefore,
a decreased economical risk if the installation were to fail. On the other hand, the installation
succeeds according to the estimations made. At this point, once the installation has proved to
be profitable, investors will have the chance of investing in bigger surface installations such as
the solutions that involve both the wing and the fuselage.
Regarding the payback time, despite the abrupt difference between the installations cost, all the
solutions achieve their respective payback times without much difference. This is because, as
the initial cost increases, so does the earnings in jet fuel. Therefore, the more kerosene earned
per year, the more money is being earned and the faster the economic recovery. If all panels
were producing the same amount of energy, the payback times would be exactly equal. The
difference between them is due to the loss in efficiency caused by the inclination of the fuselage
panels. Notice how the 60º fuselage installation presents more payback time than the 30º. This
is because, as demonstrated in chapter 11.2, it has a lower average of efficiency.
Although the initial investments imply big economic expenses, the accumulative jet fuel savings
returns capital at a fast rate. On the one hand, this installation payback time, which is around 5-
6 years, can be considered brief. Short payback times are an excellent product characteristic to
persuade investors. Moreover, PV products costs are in constant reduction due to its growth on
the market. On the other hand, some idealistic hypotheses (especially hypothesis 5 in chapter
10.2.1 and the 4 RF per day assumption) have been made during the PV generation calculations.
Due to this fact, the energy output of the solar panel should decrease a noticeable amount.
Therefore, being realistic, the good results given in table 16 should be partially deflated.
Another big advantage carried by the PV systems is that they don’t require particular
maintenance. These devices are outstanding for their autonomous and lengthened useful lives.
According to chapter 7.3, PV systems endure about 30 years without having major performance
decreases. Besides, aircrafts tend to operate during a similar amount of time. The rapport in
these characteristics is an additional good reason to consider the installation.
To sum up, the results obtained after studying the different installation impacts are quite
satisfactory. Aerodynamically, the simulations have demonstrated that the PV installation isn’t
harmful for the aerodynamics of the aircraft. Energetically, the PV installations reach ultra-
efficient performances which cannot be harmed by climatological agents. And, despite the
energetic contribution compared to A320 energy levels are very small, the number of flights
over the years activate the value of the PV installation. The jet fuel savings are linked to the
energetic savings. Therefore, the avoided quantities of jet-fuel burnt generate a significant
benefit to the environment health. Economically, the gains obtained are associated with the fuel
savings. The more the aircraft flies, the more PV generated and the more kerosene saved,
consequently, the more money earned.

10/1/2018
100
14 Conclusions This study has analysed the feasibility state of PV systems on commercial aircrafts. The results
obtained indicate that this installation is valid and has huge potential. According to the path of
human evolution, the future holds a world in which sustainability and aerial transport will
outstand. Appealingly, this PV installation is at the same time created and propelled by the need
of renewable energies and the immensity of commercial transport. In other words, not only the
importance of these concepts have created this idea, but also their growth accompanies the
development of this technology.
In order to perform a proper feasibility analysis, an exhaustive process of the matter has been
required. To begin the process, an extensive investigation to the state of the art has contributed
to set the basics of the study. On the one hand, it has helped highlighting the most important
characteristics required for installing PV on aircrafts. On the other hand, the inquiry of all the
existing technologies has established the best scenario to cautiously select the best PV
technology: high efficiency monocrystalline solar cells. Due to the suitable characteristics of its
products, Solbian has been selected as the potential PV module fabricant for this application.
Among their offers, SP 118 L has been the solar panel selected whose cost and operating
features have been provided by the company itself.
In contemplation of quantifying the PV energetic impact on a commercial plane, a reference
aircraft (A320) and a reference flight (Barcelona-London) have been defined. Based on this flight,
the radiation on A320 has been calculated taking into account all the atmospheric factors
affecting it. The PV generation during the cruise configuration has been estimated to reach
nearly 6.6 times more power output than the same system on the ground. Also, the RF has
worked as starting point to quantify the A320 energetic requirements. The study has revealed
that the PV energetic contribution becomes tiny in comparison to the enormous energetic
demand of the plane. Therefore, to obtain the maximal power output of the PV installation, the
fuselage has been considered as an additional surface where to install PV apart from the wing.
As a result, two additional surface configurations composed by both wing and fuselage have
been contemplated as optional installations to maximize the PV energy generation.
The final stage of the study has focused on analysing the impacts of the PV installation
depending on the three solutions established. In order to inspect the aerodynamic effects of the
installation, CFD simulations have been carried out to validate the aerodynamic feasibility of the
system. With them, the geometry and roughness alteration brought by the installation have
been proven to be negligible. Regarding the energetic, environmental and economic benefits,
none of the options have shown to have substantial impact in short terms. Nevertheless, in the
long term, the large number of flights performed by a commercial aircraft accumulate the
installation small contributions eventually becoming reasonably significant. This effect gains so
much intensity over time that the installation paybacks its initial cost after 5-6 years.
This study has demonstrated that installing PV systems on commercial aircrafts is
aerodynamically, energetically and economically feasible. Although there are still certain issues
about the installation that need to be analysed and certain hypotheses which result too
idealistic, all the results obtained in the study indicate that installing PV systems on commercial
aircrafts is promising. Considering the colossal expansion of aerial transport, the importance of
sustainability in human’s future and the constant evolution of PV technology, solar panels might
become part of commercial aircrafts in the near future.

10/1/2018
101
15 Future work
As a first approach, this study has developed its feasibility analysis performing several
assumptions to simplify the procedure. This final chapter of the study gathers the two most
important assumptions made, checks their effect on the result and proposes realistic solutions
that should be carried out to improve the accuracy of the study.
The reference flight has been a great tool for this study, but its approach to reality is limited.
Among all the assumptions made during the feasibility analysis, the most significant ones are
closely related to the development of the reference flight. Fixing the flight variables has allowed
this study to focus on the energetic requirements of the aircraft during the established flight.
Since all the energetic quantifications in the study have been based on these fixed variables, all
the results obtained are according to the Barcelona-London flight. However, aircrafts perform
flights with many different characteristics than the reference selected. In chapters 10.1 and
2.5.4, the effect of the factors affecting the PV generation were demonstrated to change
substantially with the location and hour of the flight. For instance, the average insulation, the
incidence angle on the surface and the air mass are factors which vary significantly depending
on the regions and times in which the aircraft flies.
In order to have a greater approach to reality, this study should consider several flights with
completely different characteristics: location, duration, departure time, aircraft model, great
circle path, season of the year, etc. This way, the study would obtain way more realistic results
and a global perspective that would point out for which type of flight this PV installation
outstands the most and the less. In agreement with the results that would be obtained, it could
be analysed for which kind of flights it would be worth installing PV systems and for which not.
This would be without doubt an interesting yet tedious task. The large amount of variables and
possibilities entail an even larger number of available combinations.
Another important assumption made during the study has to do with the installation cost of the
PV system. As it is commented in chapter 7.3, only the complementary elements of the system
such as inverters, batteries, charge controllers and feeders have been taken into account in the
cost calculation. Since this study has proposed a pioneer idea, there are no previous references
from which there can be extracted indicative designs and budgets. Therefore, there is no realistic
way to estimate the real cost of the installation. For this reason, the PV installation budget has
been created only with the solar panel cost.
The additional costs coming from the changes in the design might damage the economic
feasibility of the installation. Depending on the extra charge imposed by the design
requirements, the installation payback time will increase accordingly. It is important, in a future
perspective, to find a design able to house the PV panels without requiring too many changes to
the structure. Setting an optimal equilibrium between simplicity (cheap design), safety and
quality.

10/1/2018
102
Bibliography
[1] Worldometers (January, 2018) - World Population Clock: 7.6 Billion People. Retrieved from
http://www.worldometers.info/world-population/. Consulted on September 10th.
[2] The World Counts (April, 2014) - Are we destroying our environment?. Retrieved from
http://www.theworldcounts.com/stories/environmental-degradation-facts. Consulted on
September 10th.
[3] Center for Climate and Energy Solutions (March, 2017) - Global emissions. Retrieved from
https://www.c2es.org/content/international-emissions/. Consulted on Consulted on
September 10th.
[4] The Garfors globe, Gunnar Garfors (June, 2014) - 100,000 Flights a Day. Retrieved from:
https://garfors.com/2014/06/100000-flights-day-html/. Consulted on September 12th.
[5] Federal aviation administration (January, 2015) - Aviation Emissions, Impacts & Mitigation: A
Primer, Emission Impacts, 10-15. Consulted on September 12th.
[6] Lee, David S., et.al. (July 2009) Aviation and global climate change in the 21st century,
Atmospheric Environment Volume 43, Issues 22–23, pages 3520–3537. Consulted on September
12th.
[7] The mind unleashed (May, 2015) - This area would be enough to power the whole world with
solar energy. Retrieved from: http://themindunleashed.com/2015/05/this-area-would-be-
enough-to-power-the-whole-world-with-solar-energy.html. Consulted on September 15th.
[8] Chemistry Explained (November, 2013) - Solar cells. Retrieved from
http://www.chemistryexplained.com/Ru-Sp/Solar-Cells.html. Consulted on September 15th.
[9] Wikipedia (December, 2017) - Semiconductors. Retrieved from
https://es.wikipedia.org/wiki/Semiconductor. Consulted on September 16th.
[10] Teaching Innovation Secretariat of the University of Granada (May, 2013) – PN union.
Retrieved from https://www.youtube.com/watch?v=hsJGw_c-Nn4. Consulted on September
16th.
[11] PVeducation (January, 2017) - Basic cell design compromises. Retrieved from
http://pvcdrom.pveducation.org/DESIGN/DESSUM.HTM. Consulted on September 18th.
[12] Sinovoltaics, Dricus (October, 2011) - EVA (ethylene vinyl acetate) Film: composition and
application. Retrieved from: http://sinovoltaics.com/learning-center/materials/ethylene-vinyl-
acetate-eva-film-composition-and-application/. Consulted on September 18th.
[13] Oscar A. (2017, September 13) - Personal interview.
[14] Solar love, Shivananda Pukhrem (May, 2013) - How solar cells work. Retrieved from
http://solarlove.org/how-solar-cells-work-components-operation-of-solar-cells/. Consulted on
September 19th.
[15] Union of concerned scientists (December, 2015) - How solar panels work. Retrieved from
https://www.ucsusa.org/clean-energy/renewable-energy/how-solar-panels-
work#.WlP6bq7iaUk. Consulted on September 19th.

10/1/2018
103
[16] Solar direct (September, 2016) - Complete photovoltaic systems. Retrieved from
http://www.solardirect.com/pv/systems/systems.htm. Consulted on September 20th.
[17] SMA solar technology (February, 2017) - PV inverters – Basic facts for planning PV systems.
Retrieved from https://www.sma.de/en/partners/knowledgebase/pv-inverters-basic-facts-for-
planning-pv-systems.html. Consulted on September 20th.
[18] Solar direct (September, 2016) - Solar PV electric, PV battery. Retrieved from
http://www.solardirect.com/pv/systems/systems.htm. Consulted on September 21th.
[19] Wikipedia (July, 2017) - Air mass (Solar energy). Retrieved from
https://en.wikipedia.org/wiki/Air_mass_(solar_energy). Consulted on September 21th.
[20] Globalspec (April, 2014) - Solar radiation instruments information. Retrieved from
http://www.globalspec.com/learnmore/sensors_transducers_detectors/weather_sensing/sola
r_radiation_instruments. Consulted on September 22th.
[21] Oscar A. (2017, September 18) - Personal interview.
[22] Living on solar power (March, 2013) - Solar power for ordinary people. Retrieved from
https://livingonsolarpower.wordpress.com/2013/03/23/basic-solar-energy-math/. Consulted
on September 23th.
[23] Karin Kritzinger (August, 2010) - The insurance industry as a solar water heater driver in the
commercial and domestic markets in South Africa. Figure 2. Consulted on September 23th.
[24] Wikipedia (October, 2017) - Effect of Sun angle on climate. Retrieved from
https://en.wikipedia.org/wiki/Effect_of_Sun_angle_on_climate. Consulted on September 25th.
[25] Newport (2017) - Introduction to Solar Radiation. Figure 4. Retrieved from
https://www.newport.com/t/introduction-to-solar-radiation. Consulted on September 25th.
[26] P. Burgess (2016) - Conference Day light. Day length variation. Consulted on Sptember 25th.
[27] Oscar A. (2017, September 25) - Personal interview.
[28] NASA (March, 2015) - Vanguard Satellite, 1958. Retrieved from
https://www.nasa.gov/content/vanguard-satellite-1958. Consulted on September 28th.
[29] Wikipedia (October, 2017) - Vanguard I. Retrieved from
https://es.wikipedia.org/wiki/Vanguard_1. Consulted on September 28th.
[30] Wikipedia (December, 2017) - Growth of photovoltaics. Retrieved from
https://en.wikipedia.org/wiki/Growth_of_photovoltaics. Consulted on September 28th.
[31] Reuters, Adam Rose (January, 2016) - China’s solar capacity overtakes Gemany in 2015,
industry data show. Retrieved from https://www.reuters.com/article/china-solar-
idUSL3N15533U. Consulted on September 29th.
[32] Clean Technica, James Ayre (March, 2015) - China's National Energy Administration: 17.8
GW Of New Solar PV In 2015 (~20% Increase). Retrieved from
https://cleantechnica.com/2015/03/19/chinas-national-energy-administration-17-8-gw-new-
solar-pv-2015/. Consulted on September 29th.
10/1/2018
104
[33] BP global (January, 2017) - Solar energy. Retrieved from
http://www.bp.com/en/global/corporate/energy-economics/statistical-review-of-world-
energy/renewable-energy/solar-energy.html. Consulted on September 29th.
[34] International Energy Agency (2014) - Technology Roadmap: Solar Photovoltaic Energy.
[35] Oscar A. (2017, September 30) - Personal interview.
[36] NREL, photovoltaic research (2017) - Efficiency chart. Retrieved from
https://www.nrel.gov/pv/assets/images/efficiency-chart.png. Consulted on October 1st.
[37] Solar mango (October, 2014) Single junction solar cells. Retrieved from
http://www.solarmango.com/scp/single-junction-solar-cells-the-plain-and-simple-solar-cell-
technology/. Consulted on October 1st.
[38] NREL, photovoltaic research (2017) - High concentration III-V multijunction solar cells.
Retrieved from https://www.nrel.gov/pv/high-concentration-iii-v-multijunction-solar-
cells.html. Consulted on October 2ond.
[39] Wikipedia (October, 2017) - Multi-junction solar cell. Retrieved from
https://en.wikipedia.org/wiki/Multi-junction_solar_cell. Consulted on October 4th.
[40] Solar reviews, Andrew Sendy (April 2016) - Pros and cons of Mono vs. Poly solar panels.
Retrieved from https://www.solarreviews.com/solar-energy/pros-and-cons-of-
monocrystalline-vs-polycrystalline-solar-panels/. Consulted on October 5th.
[41] Energy informative, Mathias Aarre Maehlum (August, 2017) - Which solar panel type is
best? Mono. Vs Poly vs. thin film. Retrieved from http://energyinformative.org/best-solar-
panel-monocrystalline-polycrystalline-thin-film/. Consulted on October 5th.
[42] Energy informative, Mathias Aarre Maehlum (May, 2017) - The real lifespan of solar panels.
Retrieved from http://energyinformative.org/lifespan-solar-panels/. Consulted on October 5th.
[43] BSP (2012) - 12v 80w Monocrystalline solar panel rigid. Retrieved from
http://www.bsp.lt/en/12v-sauls-elementai/25-12v-80w-monocrystalline-solar-panel-
rigid.html. Consulted on October 5th.
[44] Low energy supermarket (2017) - Poly 100W solar panel. Retrieved from
https://www.lowenergysupermarket.com/energy-saving-products/saving-electricity/solar-
electricity/1137/poly-100w-solar-panel-only-rigid-les. Consulted on October 5th.
[45] Alibaba (2017) - Thin film solar module. Retrieved from https://www.alibaba.com/product-
detail/thin-film-solar-module_237593422.html. Consulted on October 7th.
[46] Energy informative, Mathias Aarre Maehlum (April, 2015) - Best thin fil solar panels:
amorphous, cadmium telluride or CIGS?. Retrieved from http://energyinformative.org/best-
thin-film-solar-panels-amorphous-cadmium-telluride-cigs/. Consulted on October 7th.
[47] Wikipedia (October 2017) - Dye-sensitized solar cell. Retrieved from
https://en.wikipedia.org/wiki/Dye-sensitized_solar_cell. Consulted on October 9th.
[48] Wikipedia (September 2017) - Organic solar cell. Retrieved from
https://en.wikipedia.org/wiki/Organic_solar_cell. Consulted on October 9th.

10/1/2018
105
[49] J-net21 (2017) - Organic solar cell. Retrieved from http://j-
net21.smrj.go.jp/develop/energy/company/2013022801.html. Consulted on October 9th.
[50] Wikipedia (September 2017) - Perovskite solar cell. Retrieved from
https://en.wikipedia.org/wiki/Perovskite_solar_cell. Consulted on October 9th.
[51] Solar Impulse foundation (2017) - Our adventure, solar aviation history. Retrieved from
http://aroundtheworld.solarimpulse.com/adventure. Consulted on October 10th.
[52] Wikipedia (September 2017) - Solar-powered aircraft developments Solar One. Retrieved
from https://en.wikipedia.org/wiki/Solar-Powered_Aircraft_Developments_Solar_One.
Consulted on October 10th.
[53] Insultantable (April, 2014) - Documentary of the development of the world’s first solar
powered aircraft “Solar One”. Retrieved from
https://www.youtube.com/watch?v=LDZRVlLH6QI. Consulted on October 10th.
[54] Solar Impulse foundation (2017) - 1981: Gossamer penguin & Solair 1. Retrieved from
http://aroundtheworld.solarimpulse.com/adventure/aviation-history-gossamer. Consulted on
October 10th.
[55] Soliclima (2015) - Breve historia fotovoltaica. Retrieved from
https://http://news.soliclima.com/divulgacion/solar-fotovoltaica/breve-historia-fotovoltaica.
Consulted on October 10th.
[56] ABPic (September, 2014) - Rochelt Solair 1. Retrieved from
https://abpic.co.uk/pictures/model/Rochelt%20Solair%201. Consulted on October 10th.
[57] Solar flight (2013) - Sunseeker I, across America. Retrieved from http://www.solar-
flight.com/projects/sunseeker-i/. Consulted on October 10th.
[58] Solar flight (2013) - Sunseeker II, Europe tour and first alps corssing. Retrieved from
http://www.solar-flight.com/projects/sunseeker-ii/. Consulted on October 10th.
[59] Solar Impulse foundation (2017) - 1996: Icaré II. Retrieved from
http://aroundtheworld.solarimpulse.com/adventure/aviation-history-icare-2. Consulted on
October 10th.
[60] Icare 2 (2017) - Icare takes off (1996). Retrieved from http://www.icare-
solar.de/index.php/galleries/icare-takes-off-1996. Consulted on October 10th.
[61] NASA (February, 2014) - NASA Armstrong fact sheet: Helios Prototype. Retrieved from
https://www.nasa.gov/centers/armstrong/news/FactSheets/FS-068-DFRC.html. Consulted on
October 10th.
[62] Tododeaviones (October, 2013) - Helios (Solar plane prototype). Retrieved from
http://tododeaviones.blogspot.com.es/2013/10/helios-prototipo-de-avion-solar.html.
Consulted on October 10th.
[63] Wikipedia (October, 2017) - Solar Impulse. Retrieved from
https://es.wikipedia.org/wiki/Solar_Impulse. Consulted on October 12th.

10/1/2018
106
[64] CriEnglish (March, 2015) - Things you need to know about the first around-the-world solar
flight. Retrieved from http://english.cri.cn/12394/2015/03/09/1261s869243.htm. Consulted on
October 12th.
[65] Solar Impulse foundation (2017) - Historic Flight. Retrieved from
http://aroundtheworld.solarimpulse.com/. Consulted on October 12th.
[66] Energy sage (June, 2017) - What is the average solar panel size and weight? Retrieved from
https://news.energysage.com/average-solar-panel-size-weight/. Consulted on October 14th.
[67] Sunpower (2017) - Demand better solar. Retrieved from https://us.sunpower.com/.
Consulted on October 17th.
[68] Sunpower (2017) - Maxeon Gen III solar cells technical sheet. Retrieved from
https://us.sunpower.com/sites/sunpower/files/media-library/spec-sheets/sp-sunpower-
maxeon-solar-cells-gen3.pdf. Consulted on October 17th.
[69] Aeronoticias (February, 2017) - Every 7 hours a new A320 is created. Retrieved from
http://aeronoticias.com.pe/noticiero/index.php?option=com_content&view=article&id=58502
:cada-siete-horas-sale-un-a320-de-la-linea-de-montaje-final-de-
airbus&catid=26:26&Itemid=579. Consulted on October 18th.
[70] Airbus (2017) - A320 family. Retrieved from http://www.airbus.com/aircraft/passenger-
aircraft/a320-family.html. Consulted on October 19th.
[71] Wikipedia (October, 2017) - Airbus A320 family. Retrieved from
https://en.wikipedia.org/wiki/Airbus_A320_family. Consulted on October 20th.
[72] Airbus (2017) - Airbus A320 characteristics. Retrieved from
http://www.airbus.com/aircraft/support-services.htmlairport-operations/aircraft-
characteristics/. Consulted on October 20th.
[73] Solbian (2017) - Energy has new horizons. Retrieved from https://www.solbian.eu/en/.
Consulted on October 23th.
[74] DuPont (2009) - DuPont frontsheet materials. Retrieved from
https://www.chemours.com/Teflon_Industrial/en_US/assets/downloads/k23269_Teflon_films
.pdf. Consulted on October 22th.
[75] Cornelia Wiesmeier, et.al. (January, 2013) - Overview of PV module encapsulation materials.
Pages 89-90. Consulted on October 24th.
[76] Radek Polanský, et. al. (2013) - Mechanical behavior and thermal stability of EVA
encapsulant material used in photovoltaic modules. Vol. 64. No.6. pages 361-365. Retrieved
from http://iris.elf.stuba.sk/jeeec/data/pdf/6_113-04.pdf. Consulted on October 23th.
[77] DuPont (2017) - Because the world can’t wait, Tedlar. Retrieved from
http://www.dupont.com/content/dam/dupont/products-and-services/solar-photovoltaic-
materials/solar-photovoltaic-materials-landing/documents/DPVS-Brochure.pdf. Consulted on
October 25th.
[78] Renewable energy world, Paula Mints (April, 2017) - Photovoltaic cost and price
relationship. Retrieved from:

10/1/2018
107
http://www.renewableenergyworld.com/articles/2017/04/photovoltaic-cost-and-price-
relationship.html. Consulted on October 25th.
[79] Solbian (2017) - Why choose us, driven by noble energy. Retrieved from
https://www.solbian.eu/en/content/22-why-choose-us. Consulted on October 26th.
[80] Retrieved from A320 FCOM, chapter 1.49.10. Consulted on October 28th.
[81] CFM engines (2017) - CFM56-brochure. Retrieved from
https://www.cfmaeroengines.com/engines/cfm56/cfm56-brochure/. Consulted on October
30th.
[82] Federal aviation administration (2017) Aircraft handbook, Chapter 9: aircraft electrical
system. Pages 9.5-9.6. Consulted on November 1st.
[83] Retrieved from A320 FCOM, chapter 1.24.10. Consulted on November 3rd.
[84] Retrieved from A320 FCOM, chapter 2.05. Consulted on November 6th.
[85] Retrieved from A320 FCOM, chapter 3.05. Consulted on November 6th.
[86] A.G. Ribas (2013) – “Motor de turbina de gas, rendimiento del Motor”. Volume 15.2.
Consulted on November 10th.
[87] Ucar, center for science education. (2015) – Layers of earth’s atmosphere. Retrieved from
https://www.google.es/search?biw=1536&bih=779&tbm=isch&q=atmosphere+layers&sa=X&v
ed=0ahUKEwiL0uKa8aTXAhUF2qQKHUrbCEEQhyYIJg#imgrc=28lKzC_c3rdhbM. Consulted on
November 12th.
[88] Skybrary (October, 2017) - Tropopause. Retrieved from
https://www.skybrary.aero/index.php/Tropopause. Consulted on November 13th.
[89] Alexandrakapodistria (April, 2012) - Cloud heights. Retrieved from
https://alexandrakapodistria.files.wordpress.com/2012/04/cloud-heights.jpg. Consulted on
November 13th.
[90] FTexploring (2009) - Solar energy. Retrieved from http://www.ftexploring.com/solar-
energy/clouds-and-pollution.htm. Consulted on November 14th.
[91] Bestablefor (2017) Openflights airport and airline data world flight map. Retrieved from
http://besttabletfor.me/world-flight-map.html/openflights-airport-and-airline-data-world-
flight-map. Consulted on November 15th.
[92] F. Kasten and Young, A. T. (1989) - Revised optical air mass tables and approximation
formula, Applied Optics, vol. 28, pp. 4735–4738. Consulted on November 17th.
[93] Oscar A. (2017, December 21) - Personal interview.
[94] Aeroflot (2015) - A320 structure. Retrieved from
Ahttp://lms.aeroflot.ru/data/Part145/Structure_Reapair/Structure%20description.pdf.
Consulted on November 18th.
[95] Sutherland, W. (1893) - The viscosity of gases and molecular force, Philosophical Magazine,
S. 5, 36, pp. 507-531. Consulted on December 27th

10/1/2018
108
[96] Airfoiltools (2017) - LOCKHEED C-5A BL758.6 AIRFOIL. Retrieved from
http://airfoiltools.com/airfoil/details?airfoil=c5d-il. Consulted on December 28th.
[97] Mit, airline data project (2017) – Aircraft and related. Retrieved from
http://web.mit.edu/airlinedata/www/Aircraft&Related.html. Consulted on January 2ond.
[98] Wikipedia (December, 2017) – Aircraft maintenance checks. Retrieved from
https://en.wikipedia.org/wiki/Aircraft_maintenance_checks. Consulted on January 2omd.
[99] IATA (2017) – Jet fuel Price monitor. Retrieved from
http://www.iata.org/publications/economics/fuel-monitor/Pages/index.aspx. Consulted on
January 3rd.
[100] Wikipedia (January, 2018) – Jet fuel. Retrieved from
https://en.wikipedia.org/wiki/Jet_fuel#Jet_A. Consulted on January 4th.
Copyright © 2022 FDOKUMEN