Energetic performances of an optimized passive Solar Heating Prototype used for Tunisian buildings...
12
Energetic performances of an optimized passive Solar Heating Prototype used for Tunisian buildings air-heating application Farah Mehdaoui, Majdi Hazami ⇑ , Nabiha Naili, Abdelhamid Farhat Laboratoire des Procédés Thermique, Centre de Recherches des Technologies de l’Energie, Hammam Lif, B.P. 95, 2050 Tunis, Tunisia article info Article history: Received 24 February 2014 Accepted 5 July 2014 Keywords: TRNSYS 16 Floor heating Auxiliary heating Solar fraction abstract This paper deals with the energetic performances of a Solar Heating Prototype (SHP) conceived in our laboratory to prevail the Tunisian households’ air-heating needs. The conceived SHP mainly consists of a flat-plate solar collector, solar hot water tank and an active layer integrated inside a single room. Firstly, a complete model is formulated taking into account various modes of heat transfer in the SHP by means of the TRNSYS simulation program. To validate the TRNSYS model, experimental tests under local weather conditions were performed for 2 days spread over 2 months (March and April 2013). Predicted results were compared to the measurements in order to determine the accuracy of the simulation pro- gram. A parametric study was then achieved by means of the TRNSYS program in order to optimize SHP design parameters (Collector area, collector mass flow rate, floor mass flow rate, storage tank volume and thickness of the active layer). The optimization of all design parameters shows that to achieve a max- imum performances from the SHP it is essential to use a solar collector with an area equal to 6 m 2 area, a collector mass flow rate equal to 100 kg h 1 and a hot water storage tank with a capacity equal to 450 l. Concerning the floor heating, the optimal values of mass flow rate and the active layer thickness are 200 kg h 1 and 0.06 m, respectively. The long-term SHP performances were afterward evaluated by means of the Typical Meteorological Year (TMY) data relative to Tunis, Tunisia. Results showed that for an annual total solar insolation of about 6493.37 MJ m 2 the average solar fraction obtained is about 84%. The results show also that the request of auxiliary energy is limited to the cold months of the year chiefly from December to Mars. The results show also that the SHP reduce the relative humidity inside the monozone room of about 40%. Ó 2014 Elsevier Ltd. All rights reserved. 1. Introduction 1.1. Literature review Tunisia does not much natural resources (only an average amount of Petroleum and gas in the south) and it depends mainly on what it imports of fuel for its industrial energy requirements. A major part of these demands, in fact are used for heating, cooling, ventilation and sanitary hot water used in households heating for taking showers and washing clothes in both urban and rural areas. In Tunisia, Surveys conducted by STEG [1] highlight the growing numbers of the electricity consumption in Tunisia, the rate of elec- tricity consumption as a function of time follows a rising curve. Fig. 1 shows that in 1990 electricity consumption is equal to 4930 GW h and reaches 8960 GW h in 2000. In 2010, this value reaches 13,800 GW h. Henceforth, the use of solar energy through domestic solar water heating (DSWH) systems would likely pres- ent great chance for decreasing the amount of conventional energy needed .Besides, DSWH systems have a significant capability to diminish environmental pollution arising from the use of fossil fuels. Various studies and researches on domestic hot water (DHW) production were introduced and developed. The most pop- ular of these studies aims to evaluate the energetic potential obtainable by the management and the vulgarization of DSWH sys- tems all over the world [2–4]. The using of DSWH system in build- ings air-heating application has also solicited a greater request from researchers from all over the world. Recently, solar floor heating systems has received more atten- tion because of its advantages of the thermal regulation in the building, less pollution and easily integrated with solar system. It provides very comfortable, uniform heat, owing to the relatively low temperature and the large surface area from which the heat is radiated. It does not interfere with furnishings in a home as most other heat distribution systems do. It can be achieved with tubing embedded in a slab; hot water is pumped through the tubing. The http://dx.doi.org/10.1016/j.enconman.2014.07.024 0196-8904/Ó 2014 Elsevier Ltd. All rights reserved. ⇑ Corresponding author. Tel.: +216 71430044/71430215; fax: +216 71430934. E-mail address: [email protected] (M. Hazami). Energy Conversion and Management 87 (2014) 285–296 Contents lists available at ScienceDirect Energy Conversion and Management journal homepage: www.elsevier.com/locate/enconman
Transcript of Energetic performances of an optimized passive Solar Heating Prototype used for Tunisian buildings...

Energy Conversion and Management 87 (2014) 285–296
Contents lists available at ScienceDirect
Energy Conversion and Management
journal homepage: www.elsevier .com/ locate /enconman
Energetic performances of an optimized passive Solar Heating Prototypeused for Tunisian buildings air-heating application
http://dx.doi.org/10.1016/j.enconman.2014.07.0240196-8904/� 2014 Elsevier Ltd. All rights reserved.
⇑ Corresponding author. Tel.: +216 71430044/71430215; fax: +216 71430934.E-mail address: [email protected] (M. Hazami).
Farah Mehdaoui, Majdi Hazami ⇑, Nabiha Naili, Abdelhamid FarhatLaboratoire des Procédés Thermique, Centre de Recherches des Technologies de l’Energie, Hammam Lif, B.P. 95, 2050 Tunis, Tunisia
a r t i c l e i n f o
Article history:Received 24 February 2014Accepted 5 July 2014
Keywords:TRNSYS 16Floor heatingAuxiliary heatingSolar fraction
a b s t r a c t
This paper deals with the energetic performances of a Solar Heating Prototype (SHP) conceived in ourlaboratory to prevail the Tunisian households’ air-heating needs. The conceived SHP mainly consists ofa flat-plate solar collector, solar hot water tank and an active layer integrated inside a single room. Firstly,a complete model is formulated taking into account various modes of heat transfer in the SHP by meansof the TRNSYS simulation program. To validate the TRNSYS model, experimental tests under localweather conditions were performed for 2 days spread over 2 months (March and April 2013). Predictedresults were compared to the measurements in order to determine the accuracy of the simulation pro-gram. A parametric study was then achieved by means of the TRNSYS program in order to optimizeSHP design parameters (Collector area, collector mass flow rate, floor mass flow rate, storage tank volumeand thickness of the active layer). The optimization of all design parameters shows that to achieve a max-imum performances from the SHP it is essential to use a solar collector with an area equal to 6 m2 area, acollector mass flow rate equal to 100 kg h�1 and a hot water storage tank with a capacity equal to 450 l.Concerning the floor heating, the optimal values of mass flow rate and the active layer thickness are200 kg h�1 and 0.06 m, respectively. The long-term SHP performances were afterward evaluated bymeans of the Typical Meteorological Year (TMY) data relative to Tunis, Tunisia. Results showed thatfor an annual total solar insolation of about 6493.37 MJ m�2 the average solar fraction obtained is about84%. The results show also that the request of auxiliary energy is limited to the cold months of the yearchiefly from December to Mars. The results show also that the SHP reduce the relative humidity insidethe monozone room of about 40%.
� 2014 Elsevier Ltd. All rights reserved.
1. Introduction
1.1. Literature review
Tunisia does not much natural resources (only an averageamount of Petroleum and gas in the south) and it depends mainlyon what it imports of fuel for its industrial energy requirements. Amajor part of these demands, in fact are used for heating, cooling,ventilation and sanitary hot water used in households heating fortaking showers and washing clothes in both urban and rural areas.In Tunisia, Surveys conducted by STEG [1] highlight the growingnumbers of the electricity consumption in Tunisia, the rate of elec-tricity consumption as a function of time follows a rising curve.Fig. 1 shows that in 1990 electricity consumption is equal to4930 GW h and reaches 8960 GW h in 2000. In 2010, this valuereaches 13,800 GW h. Henceforth, the use of solar energy through
domestic solar water heating (DSWH) systems would likely pres-ent great chance for decreasing the amount of conventional energyneeded .Besides, DSWH systems have a significant capability todiminish environmental pollution arising from the use of fossilfuels. Various studies and researches on domestic hot water(DHW) production were introduced and developed. The most pop-ular of these studies aims to evaluate the energetic potentialobtainable by the management and the vulgarization of DSWH sys-tems all over the world [2–4]. The using of DSWH system in build-ings air-heating application has also solicited a greater requestfrom researchers from all over the world.
Recently, solar floor heating systems has received more atten-tion because of its advantages of the thermal regulation in thebuilding, less pollution and easily integrated with solar system. Itprovides very comfortable, uniform heat, owing to the relativelylow temperature and the large surface area from which the heatis radiated. It does not interfere with furnishings in a home as mostother heat distribution systems do. It can be achieved with tubingembedded in a slab; hot water is pumped through the tubing. The

Nomenclature
Ac total collector area (m2)Ai surface area of the ith tank segment (m2)Cp specific heat of the fluid (kJ kg�1 k�1)FR overall collector heat removal efficiency factorI global (total) horizontal radiation (kJ h�1 m�2)Mi mass of fluid in the ith section (kg h�1)_m flow rate at use conditions (kg h�1)
md1 collector mass flow rate (kg h�1)md2 floor mass flow rate (kg h�1)_mh fluid mass flow rate to tank from the heat source
(kg h�1)_mL fluid mass flow rate to the load and/or of the makeup
fluid (kg h�1)N number of fully mixed (uniform temperature) tank
segmentsq global heat transfer coefficient (W K�1)QAux auxiliary energy (MJ m�2)Qc useful energy gain (MJ m�2)QL energy rate to load (MJ m�2)Q0 heat output upwards from the floor (W)Qi rate of energy input by the heating element to the ith
segment (MJ m�2)SF solar fraction (%)Sh number of the tank segment to which the fluid from the
heat source enters 1 6 Sh 6 NSL number of the tank segment to which the fluid replacing
that extracted to supply the load enters 1 6 SL 6 NTa ambient (air) temperature (K)
Tc inlet temperature of fluid to collector (K)Tenv temperature of the environment surrounding the tank
(K)Tf surface floor temperature (K)Th temperature of the fluid entering the storage tank from
the heat source (K)TL temperature of the fluid replacing that extracted to sup-
ply the load (K)Ti temperature of the ith tank segment (K)T0 outlet temperature of fluid from collector (K)Tr inside design room temperature (K)U loss coefficient between the ith tank node and its envi-
ronment (kJ h�1 m�2 k�1)UL Overall thermal loss coefficient of the collector per unit
area (kJ h�1 m�2 k�1)UL/T Thermal loss coefficient dependency on T (kJ h�1 m�2
k�1)
Greek symbols(sa) product of the cover transmittance and the absorber
absorptance(sa)n (sa) at normal incidenceai a control function defined by ai ¼ 1 if i = Sh; 0 otherwisebi a control function defined by bi ¼ 1 if i = SL; 0 otherwiseci a control function defined by ci ¼ _mh
Pj¼i�1j¼1 aj
� _mLPj¼N
j¼iþ1bj (kg h�1)
g collector efficiency (%)
286 F. Mehdaoui et al. / Energy Conversion and Management 87 (2014) 285–296
slab warms up and slowly radiates heat into the room. Nematollahiet al. [5] investigate a purposed solar heating system used fordomestic and buildings air-heating. The system consists of a flat-plate solar collector that provides hot water connected to a verticalwater storage tank and floor heating active layer integrated insidea tested room. The results indicate that the average efficiency ofthe purposed system is about 68%. In 2012, Will et al. [6] outlinesthe strengths of two modeling tools, TRNSYS and ESP-r, through anew co-simulator in order to evaluate the potential contributionsof a seasonal solar thermal system at a single-house scal. This sys-tem uses a small shortterm tank for DHW loads and a second, lar-ger seasonal tank for space heating. Zhao et al. [7] proposed anumerical study for a solar combi-system (DHW and space heat-ing). This system was modeled through TRNSYS for a 3319 m2
building area in china. The TRNSYS model has been validated bydata from the literature. Results showed that the designed solarsystem can meet 32.8% of the thermal energy demand in the
Fig. 1. Electricity consumption in Tunisia.
heating season and 84.6% of the energy consumption in non-heat-ing season, with a yearly average solar fraction of 53.04%
In 2011 Xi et al. [8] designed a solar-assisted ground-coupledheat pump (SAGCHP) system with heat storage for space heatingand domestic hot water (DHW) supply. Simulation by TRNSYSaimed at achieving an advantage over a ground coupled heat pump(GCHP) system in climatic conditions in the region of Beijing. Opti-mization of the design shows that the heating efficiency isimproved by 26.3%.
In order to increase the fraction of solar energy used in supply-ing energy for the operation of a building, many studies are consid-ered in literature: Li et al. [9] simulates a solar desiccant coolingand heating system. During this simulation, the seasonal totalheating load is about 49.0% is handled by solar energy. Kemalet al. [10] studied the performance of the solar-powered floor heat-ing system in a building designed in Shanghai. With respect to thewhole heating period, the solar fraction was 56%. In 2012 Kacanet al. [11] has done an experimental study to improve the existingsolar space heating systems in Turkey. The system includes twoclosed flow cycle. The results show that energy saving ratio is per-formed between 59% and 89% monthly. Also fractional solar con-sumption (FSC) change is investigated daily, monthly andannually. Annual FSC value of the established system is approxi-mately 83%.
A technical and an economic viability of a combined solar boilerintegrated system that can run alternately, or simultaneously toreduce the yearly energy invoice was proposed by Al-Salaymehet al., in 2010 [12]. He shows that the space and the water heatingby using a DSWH system may reduce about 39% of home energyconsumption. In this context Chargui et al. [13] developed a modelfor solar water heaters with a coupling of a thermosiphon collectorand a single house. The results obtained by TRNSYS software showthat the designed system could provide 40–70% of the hot waterdemands in winter by utilizing solar energy. In 2012, Mokhtari

Jan Feb Mar Apr May Jun Jul Aug Sep Oct Nov Dec200
300
400
500
600
700
800
900 I Tamb
Months
inso
latio
n (M
J/m
2 ,mon
th)
10
12
14
16
18
20
22
24
26
28
tem
pera
ture
(°C
)
Fig. 3. Monthly weather data for borj-cedria.
F. Mehdaoui et al. / Energy Conversion and Management 87 (2014) 285–296 287
et al. [14] presented the study of the thermal behavior of a houseprovided with a heating system per solar floor, it concludes thatthe control strategy taken, (the mode on/off of the pump), is a goodstrategy for radiant heat control since, it allowed the control of thefloor temperature and makes it possible to keep the room air tem-perature in desired range. In 2011, Elmaleh et al. [15] has installeda solar system design floor heating. The surface temperature of theroom and the temperature of the heating tube were measured.Experimental results were compared with the theoretical resultsgiven by TRNSYS. He noticed that the insulation has saved about40% of the consumed fuel annually.
Elmaleh et al. [16] presented a numerical study of a local ther-mal comportment integrating it under floor heating based on TRN-SYS. The results showed that when the flow was reduced from90 kg/h to 55 kg/h a slight changing happened on the room tem-perature between (20 �C and 22 �C) and can be overcome by reduc-ing the step between the pipes.
1.2. Context and endeavor of this paper
By the virtue of its position Tunisia has an important potentialof solar energy with a monthly average global radiation varies from2 kW h m�2 day�1 for the month less sunny winter to 8 kW h m�2
day�1 for about the sunniest month of the summer [17]. Theclimate in Tunis, Tunisia is characterized by a relatively coldwinters and relatively warm summers. In Fig. 2 is representedthe annual external ambient temperature variation. The profile ofthe plot show that in cold months (October to Mars) the ambienttemperature ranges between 7 and 18 �C. In Fig. 3 is representedthe monthly average ambient temperature same as the averagemonthly insolation. We notice that August is the hottest monthof the year with an average temperature of 26.8 �C and an insola-tion about 747 MJ m�2 while January is the coldest month withan average temperature of 11.51 �C and an insolation about280.16 MJ m�2. The average annual temperature and insolationreached in the site are 18.35 �C and 541.11 MJ m�2, respectively.Therefore, there is a necessity to uphold another type of heatingsystems based on solar energy. The most important advantage ofsolar energy compared to the usage of fossil fuels for DSWH pro-duction is that it does not pollute the environment. In this contextwe propose in this paper the study of the long-term performancesof a prototype used for bulidings air-heating. The system is com-posed of a flat-plate solar collector, a storage hot water tank andan active layer integrated inside the heated room (Fig. 4).
The endeavor of this paper is to achieve a long-term perfor-mances investigation of an air-heating solar prototype (SHP) usedfor Tunisian households by developing a simulation model by TRN-
Fig. 2. Annual variation of the external temperature.
SYS program. To accomplish this investigation the TRNSYS modelneed various inputs especially the SHP characteristics like thedimensions of all components (e.g. flat-plate solar collector (FPC)and hot water storage tank size), the FPC efficiency and storagetank energy losses. The methodology in this work consists in:
– The determination of the experimental inputs of the TRNSYSsimulation model of the FPC.
– The carry out of an experimental tests during selected days ofMars and April 2013 by using TRNSYS model. The objective ofthese tests is the determination of the thermal behavior of theSHP during a short-term period.
– The validation TRNSYS model presents suitable results by com-paring the simulated and the experimental results during theselected days of Mars and April 2013, The evaluation of thelong-term/annual performances of the SHP by introductionthe meteorological year for Tunis, Tunisia. The long-term/annual performances investigation includes: energy collectedfrom the FPC, energy load, auxiliary energy and solar fraction(SF).
2. TRNSYS system simulation
2.1. Description of the TRNSYS program
The SHP model was developed by using TRNSYS simulation pro-gram (Fig. 5) (Table 1). The description of the building componentsis assumed by Type 56. This Type permits the specification of thewalls composition, orientation and types of glazing used. This Typedefines also the initial conditions of the studied area (indoor tem-perature and relative humidity), the control parameters of heatingand cooling as well as frees contributions. The different levels ofthe building are reconstituted through cutting the thermal homo-geneous areas. The characteristics of the walls, windows, doors,floors and ceilings (dimensions, materials, orientation, etc.), in eacharea, were obtained from architectural drawings [18]. Thermophysical properties of each wall layer (thermal conductivity, den-sity, specific heat, thickness, etc.) are either entered by the useror chosen from an existing library. The beginning of the work isto model home with a subroutine TRNBuild to define the structureand size of the buildings (Table 2).
2.2. Procedure followed
The studies of the thermal performances of the SHP wereachieved conferring to the following approaches:

Fig. 4. Schematic description of the experimental prototype.
Fig. 5. TRNSYS diagram relative to the SHP.
288 F. Mehdaoui et al. / Energy Conversion and Management 87 (2014) 285–296
– The first approach consists in the achieving of an experimentalinvestigation during the same selected days of March and April2013 in view of determining the solar collector instantaneousefficiency and the storage tank heat loss coefficient. Theseparameters are used as TRNSYS program inputs. The experi-ments were also used to validate the TRNSYS simulationprogram.
– The second approach consists in performing a simulation of theSHP behavior by using TRNSYS program [18]. The simulationwas accomplished during selected days of March and April 2013.
– When the numerical results present an acceptable accuracywith the experimental results, we study the evaluation of thelong-term/annual performances of the SHP according to Tunis,Tunisia weather data.

Table 1The main components of the TRNSYS simulation program.
Components Symbol Description
Type 1b (flat-plate solar collector) Fluid(water) is usually circulated through tubing to transfer heat from the absorber to an insulated water tank
Type 56a (multizone building) an active layer integrated inside the monozne room
Type 4c (storage tank) A stratified storage tank having 2 inlets and 2 outlets. It includes an auxiliary electric heaters in order to havethe desired hot water temperature
Type 3b (pump) Computes a mass flow rate using a variable control function, which must have a value between 1 and 0, and afixed maximum flow capacity
Type 2b (control function) Generates a control function which can have a value of 1 or 0. The value of the control signal is chosen as afunction of the difference between upper and lower temperatures
Type 65c (online plotter) Display selected system variables while the simulation is progressing. The selected variables will be displayedin a separate plot window on the screen
Type 69b (Sky temperature) Determines an effective sky temperature
Type 33e (psychrometric) Calculate the corresponding moist air properties
Type 109 (TMY-2 weather data) A Typical Meteorological Year (TMY) data bank (Type 109) is used to simulate Tunisian weather andMeteorological data changes
Type 57 (converter) A unit conversion routine utilized to accustomed users to working with English units
Table 2Structure and size of the buildings.
Category Area (m2) Layer Thickness (m) Conductivity (kJ h�1 m�1 K�1) Density (kg m�3) Capacity (kJ kg�1 K�1)
External north 16 Brick 0.15 3.2 1800 1Concrete 0.05 7.56 2400 0.8Gypsum 0.05 0.75 1200 1
External south 12 Brick 0.15 3.2 1800 1Concrete 0.05 7.56 2400 0.8Gypsum 0.05 0.75 1200 1
External east 16 Brick 0.15 3.2 1800 1Concrete 0.05 7.56 2400 0.8Gypsum 0.05 0.75 1200 1
External west 12 Brick 0.15 3.2 1800 1Concrete 0.05 7.56 2400 0.8Gypsum 0.05 0.75 1200 1
Boundary 12 Concretes 0.06 4.068 1400 1Active layer 0.06 4.068 1400 1Concretes 0.05 0.144 40 0.8Insulation
Boundary 12 Concrete 0.240 7.56 2400 0.8
F. Mehdaoui et al. / Energy Conversion and Management 87 (2014) 285–296 289
3. Mathematical description
3.1. Solar collector
A general equation for solar thermal collector efficiency can beobtained from the Hottel-Whillier equation (Attar I [19]) as:
g ¼ Q c
I � Ac¼ _mCp
T0 � Tc
I � Ac¼ FRðsaÞn � FRUL
Tc � Ta
Ið1Þ
The loss coefficient UL is not exactly constant, so a betterexpression is obtained by taking into account a linear dependencyof UL versus (Tc � Ta):

Fig. 6. Stratification hot water cylinder.
290 F. Mehdaoui et al. / Energy Conversion and Management 87 (2014) 285–296
g ¼ Q c
I � Ac¼ FRðsaÞn � FRUL
Tc � Ta
I� FRUL=T
ðTc � TaÞ2
Ið2Þ
Eq. (2) can be rewritten as:
g ¼ Q c
I � Ac¼ a0 � a1
Tc � Ta
I� a2
ðTc � TaÞ2
Ið3Þ
Which is the general solar collector thermal efficiency equationused in Type 1. The thermal efficiency is defined by 3 parameters:a0, a1 and a2 determined from the g plot by using the least squaremethod. Those 3 parameters are available for collectors rated byHazami et al. [20,21].
3.2. Storage tank
In this study, the cylindrical hot water storage tank is simulatedby Type 4c. The thermal performance of a fluid-filled sensibleenergy storage tank, subject to thermal stratification, is modeledby assuming that the tank consists of N fully-mixed equal volumesegments, as shown in Fig. 6. An assumption, employed in thismodel, is to assume that the fluid streams flowing up and downfrom each node are fully mixed before they enter each segment[18]. An energy balance written about the ith tank segment isexpressed
MiCpdTi
dt¼ ai _mhCpðTh � TiÞ þ bi _mLCpðTL � TiÞ þ UAiðTenv � TiÞ
þ ciðTi�1 � TiÞCp þ Q i ð4Þ
The temperatures of each of the N tank segments are deter-mined by the integration of their time derivatives expressed inthe above equation. At the end of each time step, temperatureinversions are eliminated by mixing appropriate adjacentnodes.
3.3. Heating loads
The under floor heating model is based on one-dimensionalheat transfer concepts for internal flow in pipes as well as heattransfer through a horizontal plate heated from its lower surface.The amount of energy heating the space per unit floor area is rep-resented by Attar et al. [19]:
Q 0 ¼ qðTf � TrÞ ð5Þ
4. Experimental study
4.1. Experimental apparatus
An experimental device (Fig. 7) is mounted in CRTEn, BorjCedria, Tunis (Located in the north of Tunisia) in order to test thereliability of the TRNSYS simulation program. The experimentaldevice consist of a flat-plate solar collector, FPC, (1) with a totalabsorber surface of 2 m2, oriented N–S and tilted 45� towards thesouth. The FPC is connected to a stainless steel hot water tank(2) with 200 l storage capacity insulated with 5 cm thick ofArmaflex. Inside the hot water tank is placed two immersion heat-ers of 3.0 kW. The electric heaters function of the heaters is con-trolled by a thermostat placed inside the hot water storage tank.The experimental device consists also of a monozone room(3 � 4 � 4 m) (3). The floor (4) consists of concrete slab traversedby a winding system composed of copper tubes. The floor is iso-lated from the ground by a layer of 50 mm of polystyrene. Theheating flow is assured by a pump (5) a solenoid valve (6) and aflow-meter (7) integrated at the experimental loop. A data acquisi-tion system was installed in the laboratory to track all experimen-tal parameters changes during the tests. Thus, 2 Pt100 sensors (8)are used to measure the inlet and outlet temperature of the FPC vslocal time variation. Another Pt100 sensor (9) was placed out of thesolar collector to measure the ambient air temperature. The inci-dent solar radiation was measured with a Kipp and Zonen pyrano-metre (11) installed such that its aperture is leveled with theaperture of the collector without casting shadow on the collector.The profile of temperature inside the tested room is measured by4 Type K thermocouples (10) positioned vertically in the room(Fig. 7). All the measuring sensors were connected to a multi-chan-nel data acquisition (12) system type HP Agilent, which werestocked in a PC station (13).
4.2. Experimental tests
To validate the TRNSYS simulation program of the SHP thermalbehavior a number of experiments are conducted in our laboratory
– A primary outdoor experimental test was achieved in order todetermine the characteristics parameters of the solar collector.The test begins at 9:00 h (Local solar time) and finished at18:00 h (The end of the solar journey). During the tests, the fol-lowing conditions have been taken into account in order toenhance the feasibility of results: (i) a total solar energy higherthan 16 MJm�2; (ii) the average wind speed should be lowerthan 1.5 ms�1 without periods of more than 30 min with con-stant velocities higher than 3 ms�1 (out of this range, the collec-tors performance is sensitive to air speed); (iii) the water inlettemperature in the system will be at 20 ± 2 �C and (iv) averageambient temperature between 20 �C and 30 �C. The test consistsin varying the solar collector inlet water temperature by using awater/water heat pump and following the outside water tem-perature. The difference of water temperature between the inletand the outlet of the solar collector permit the evaluation of theuseful energy gain and then instantaneous efficiency g changesof the solar collector (Eq. (3)) (Hazami et al. [20,21]).
– The second test is conducted in order to evaluate the heat losscoefficient (Uc) of the hot water storage cylinder is determinedby an independent test (Hazami et al. [19,20]). It consists in: (i)heating the water inside the stainless steel storage tank to thevalue of 70 �C, then the immersion heaters were set to turn-off,(ii) measuring the temperature decrease of the hot waterin the stainless steel storage tank while the hot water is leftto cool down during Dt = 24 h. UC rate is calculated as:

Fig. 7. Schematic description of the experimental prototype.
Table 3Trnsys i
Para
TesteInterFirstFirstHot
F. Mehdaoui et al. / Energy Conversion and Management 87 (2014) 285–296 291
g ¼ Cp
V :Dtln
Ti � Text
Tf � Textð6Þ
The characteristics parameters of the solar collector and the heatloss coefficient of the hot water storage cylinder presented inTable 3 are used as inputs parameters of the TRNSYS model.– Another experimental test is accomplished in order to track the
SHP inlet and outlet temperature changes vs local time and theenergy supplied from the SHP. These experiments were carriedout for two selected days: (i) (07/03/2012), characterized byheavily overcast and intermittent cloud covered sky and (ii)(07/04/2012) characterized by a clear sky. The test begins at0:00 h (Local solar time) when the data acquisition system isswitched on. After 24 h the test is finished.
4.3. Uncertainty analysis
In order to appraisal the accurateness of the experimental mea-surements, an uncertainty analysis is achieved. In this study, weevaluate the errors due to the sensitiveness of equipment and mea-surements explained in the section 4.2. Experimental errors camechiefly from measurement of temperature and the flow rate. Theerrors are evaluated as below:
– Sensitiveness and measurement error of data acquisition sys-tem and Pt-100 sensor are respectively, about ±0.1 �C and ±0.2%.
nput parameters.
meters Value Unit
d flow rate 100 kg h�1 m�2
cept efficiency, a0 0.71 %order efficiency coefficient, a1 1.03 W m�2 K�1
order efficiency coefficient, a2 0.02 W m�2 K�2
water cylinder loss coefficient 1.6 W m�2 K�1
– Sensitiveness and errors measurement of the flow meter arerespectively about ±0.1 �C and ±0.1%. In total, errors of measure-ment of the flow rate are about ±0.2%.
5. Results and discussions
5.1. Sensibility of TRNSYS simulation program
In Fig. 8a and b is represented the variations of the inlet and theoutlet temperature of the storage tank given by the experimentaltest and TRNSYS simulation program during 07/03/2013. We notethat the TRNSYS model flows, with an acceptable inaccuracy, themeasured values given by the experimental test. Indeed, the differ-ence between the simulated and the measured values of the stor-age tank inlet temperature is about 2–4 �C whilst the differencebetween the modeled and the measured values of outlet tempera-ture is about 1–5 �C.
A comparison between the energy supplied from the SHPrespectively given by the experimental test and TRNSYS simulationprogram during the same selected days (07/03/2013) and (07/04/2013). We note that, for the overcast cloud sky days (07/03/2013) (Fig. 9a) and for a clear sky day (07/04/2013) (Fig. 9b), themodel slightly underestimates the measured values with accuracythat ranges between 5% and 7% points. However, the profile of theexperimental and the TRNSYS simulation of the energy suppliedfrom the SHP system vs local time represent a great similitude.The gap between the experimental and simulated results observedin Fig. 9 can be attributed to experimental errors that are a functionof unstable weather conditions. Hence we conclude that theTRNSYS simulation program could reproduce with an acceptableaccuracy the real behavior of the SHP.
5.2. Optimization of the SHP parameters
The optimization of the SHP (the solar collector, the storagetank and flow among the prototype and the heating floor)

Fig. 8. Measured and simulated temperature at: (a) inlet water storage tank and (b)outlet water storage tank.
Fig. 9. Variation of simulated and measured energy supplied from the DSWHsystem during: (a) (07/03/2013) and (b) (07/04/2013).
292 F. Mehdaoui et al. / Energy Conversion and Management 87 (2014) 285–296
performances was achieved by considering the TRNSYS simulationmonthly/annual solar fraction, SF, changes. The SF is defined as[20,21]:
SF ¼ Q L � Q Aux
QL¼ 1� Q Aux
Q Lð7Þ
where QAux is the total auxiliary energy supplied to the system tosupport the portion of the total load that is not provide by the solarenergy.
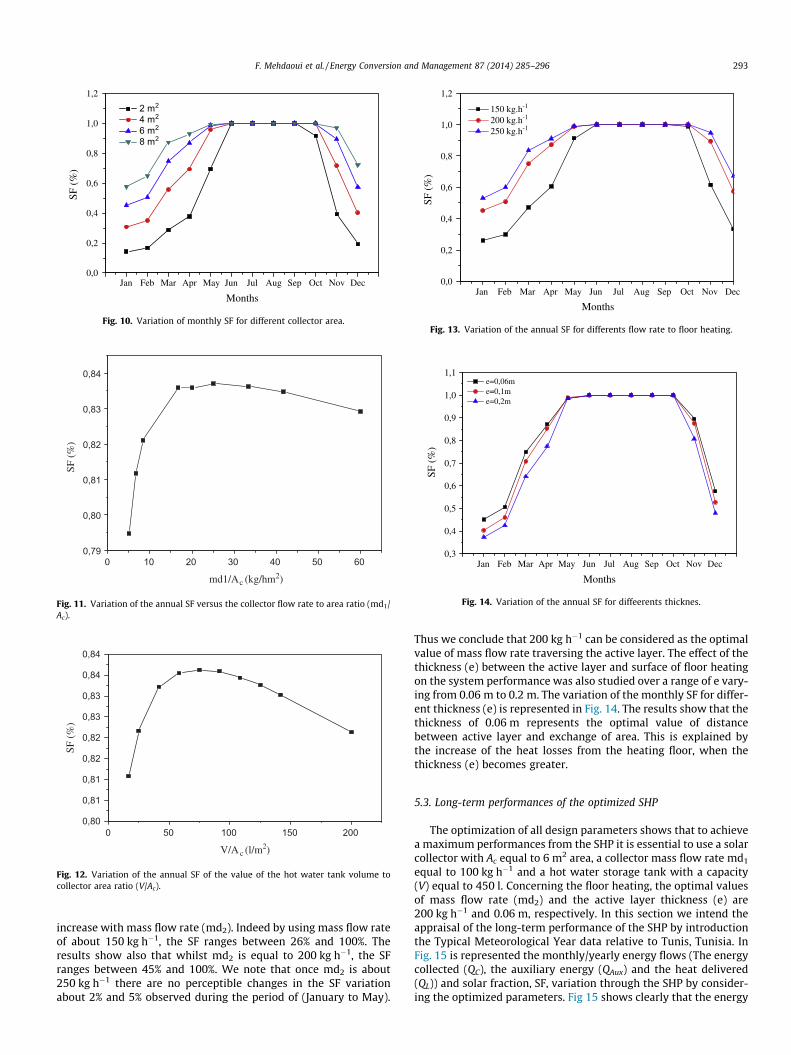
The first set of simulation is accomplished in order to evaluatethe suitable solar collector area (Ac). It consists in the estimationof the monthly and annual SF value according to Ac changes. Theset of simulations are achieved for; (i) one solar collector with anarea of 2 m2, (ii) two coupled solar collectors with a total area ofabout 4 m2, (iii) three coupled solar collectors with a total area ofabout 6 m2 and (iv) four coupled solar collectors with a total areaof about 8 m2. During the simulation, the modification of the col-lector areas is accomplished taking into account the initial valuethe hot water cylinder volume-to-collector area ratio (V/Ac) whichis 75 l/m2 (Hazami et al. [21]). The monthly SF changes for eachtotal collectors area is presented in Fig. 10. The results of the firstsimulation achieved for only one solar collector of 2 m2 of collectedarea shows that the SF ranges between 18% and 100%. The secondrang of simulation is accomplished for a combination of 2, 3 and 4coupled solar collectors with a total collector area equal to 4 m2,6 m2 and 8 m2, respectively. The results of the simulation showsthat, for 4 m2, 6 m2 and 8 m2 of total collectors area, the SF rangesbetween and 30–100%, 45–100% and 58–100%, respectively.Considering the cost, space requirements and reliability issues,
6 m2 of area can be considered as the adequate size for the presentapplication study.
The second set of simulation is accomplished in order to deter-mine the adequate the solar collector’s mass flow rate (md1) rela-tively to the optimal collector area of 6 m2. The annual SF wassimulated for md1/Ac ranging from 5 to 60 kg h�1 m�2 (Fig. 11).The plot shows that SF rises rapidly as md1/Ac increases from 5to 20 kg h�1 m�2. Indeed SF increases from 79% at 5 kg h�1 m�2
to a maximum value of approximately 84% in the range 16–25 kg h�1.m�2. Then SF starts to decrease and becomes in the orderof 82% once md1/Ac is of about 60 kg h�1 m�2. Hence, to promise amaximum value of SF, the flow rate md1 traversing the 6 m2 ofsolar collector should be equal to the optimal value of about100 kg h�1.
Another set of simulation is accomplished in order to estimatethe optimal value of storage tank volume (V) allowing for the opti-mal solar collector area (6 m2) and the adequate solar collector’smass flow rate (100 kg h�1). Various ratios of (V/Ac) (16–200 l m�2) are considered during the TRNSYS simulation. InFig. 12 is resumed the outcome of the variation of the hot watertank volume on SF changes. We note that, for the SHP, the annualSF increases rapidly as V/Ac increases from 20 to 75 l m�2 andbeyond the value of 140 l m�2 the SF decreases. It was found thatfor the values of 75 l m�2 the annual SF reaches the maximumvalue of about 83.6%. Considering the optimal value of the solarcollector area (6 m2), the optimal value of 75 l m�2 correspondsto 450 l which represents the optimal capacity of the storage tankthat permit the attempt of the maximum rate of SF.
The effect of floor heating’s mass flow rate (md2) on the annualand monthly SF was also simulated for md2 ranging from 100 to250 kg h�1 (Fig. 13). The results indicate that the monthly SF
Jan Feb Mar Apr May Jun Jul Aug Sep Oct Nov Dec0,0
0,2
0,4
0,6
0,8
1,0
1,2
SF (
%)
Months
2 m2
4 m2
6 m2
8 m2
Fig. 10. Variation of monthly SF for different collector area.
0 10 20 30 40 50 600,79
0,80
0,81
0,82
0,83
0,84
SF (
%)
md1/Ac (kg/hm2)
Fig. 11. Variation of the annual SF versus the collector flow rate to area ratio (md1/Ac).
0 50 100 150 2000,80
0,81
0,81
0,82
0,82
0,83
0,83
0,84
0,84
SF (
%)
V/A c (l/m2)
Fig. 12. Variation of the annual SF of the value of the hot water tank volume tocollector area ratio (V/Ac).
Jan Feb Mar Apr May Jun Jul Aug Sep Oct Nov Dec0,0
0,2
0,4
0,6
0,8
1,0
1,2
SF (
%)
Months
150 kg.h-1
200 kg.h-1
250 kg.h-1
Fig. 13. Variation of the annual SF for differents flow rate to floor heating.
0,3
0,4
0,5
0,6
0,7
0,8
0,9
1,0
1,1
SF (
%)
e=0,06m e=0,1m e=0,2m
Jan Feb Mar Apr May Jun Jul Aug Sep Oct Nov Dec
Months
Fig. 14. Variation of the annual SF for diffeerents thicknes.
F. Mehdaoui et al. / Energy Conversion and Management 87 (2014) 285–296 293
increase with mass flow rate (md2). Indeed by using mass flow rateof about 150 kg h�1, the SF ranges between 26% and 100%. Theresults show also that whilst md2 is equal to 200 kg h�1, the SFranges between 45% and 100%. We note that once md2 is about250 kg h�1 there are no perceptible changes in the SF variationabout 2% and 5% observed during the period of (January to May).
Thus we conclude that 200 kg h�1 can be considered as the optimalvalue of mass flow rate traversing the active layer. The effect of thethickness (e) between the active layer and surface of floor heatingon the system performance was also studied over a range of e vary-ing from 0.06 m to 0.2 m. The variation of the monthly SF for differ-ent thickness (e) is represented in Fig. 14. The results show that thethickness of 0.06 m represents the optimal value of distancebetween active layer and exchange of area. This is explained bythe increase of the heat losses from the heating floor, when thethickness (e) becomes greater.
5.3. Long-term performances of the optimized SHP
The optimization of all design parameters shows that to achievea maximum performances from the SHP it is essential to use a solarcollector with Ac equal to 6 m2 area, a collector mass flow rate md1
equal to 100 kg h�1 and a hot water storage tank with a capacity(V) equal to 450 l. Concerning the floor heating, the optimal valuesof mass flow rate (md2) and the active layer thickness (e) are200 kg h�1 and 0.06 m, respectively. In this section we intend theappraisal of the long-term performance of the SHP by introductionthe Typical Meteorological Year data relative to Tunis, Tunisia. InFig. 15 is represented the monthly/yearly energy flows (The energycollected (QC), the auxiliary energy (QAux) and the heat delivered(QL)) and solar fraction, SF, variation through the SHP by consider-ing the optimized parameters. Fig 15 shows clearly that the energy

Fig. 15. SHP’s Monthly and yearly energy flows and solar fraction variation.
Table 4Energetic analysis and monthly temperature.
Time (month) I (MJ m�2 month�1) Tam (�C) Qc (MJ m�2 month�1) QL (MJ m�2 month�1) Qaux (MJ m�2 month�1) Tair (�C) SF (%)
January 280.16 11.51 180.88 328.54 180.28 25.56 0.45February 320.93 11.96 174.62 283.02 139.75 25.68 0.51March 502.48 13.20 249.92 293.57 73.69 26.61 0.75April 589.54 15.40 245.38 251.17 32.40 27.43 0.87May 748.63 19.26 299.88 276.19 3.60 28.79 0.99June 810.20 22.86 329.20 308.74 0.00 29.67 1.00July 848.59 26.40 395.84 377.01 0.00 30.39 1.00August 747.81 26.81 410.03 390.69 0.00 30.76 1.00September 594.52 24.19 388.58 367.01 0.00 30.12 1.00October 459.10 20.45 337.91 309.79 0.00 29.25 1.00November 322.03 15.71 248.73 246.78 25.87 27.40 0.90December 269.38 12.50 202.80 301.20 127.93 25.87 0.58
Total 6493.37 – 3463.77 3733.71 583.52 – –Annual average 541.11 18.35 288.65 311.14 48.63 28.13 0.84
10
12
14
16
18
20
22
24
26
28
30
32
Tem
pera
ture
(°C
)
Tamb Tair (unheated room) Tair (without auxiliary energy) Tair (with auxiliary energy)
Jan Feb Mar Apr May Jun Jul Aug Sep Oct Nov Dec
Months
Fig. 16. Internal air temperature changes vs months.
294 F. Mehdaoui et al. / Energy Conversion and Management 87 (2014) 285–296
collected (QC) during the summer season is more important com-pared to the cold season. The annual total and annual average ofQC are respectively about 3436.77 MJ m�2 and 288.65 MJ m�2
(Table 4). On the other hand we noted that the monthly averagequantity of auxiliary energy added varied respectively between180 MJ m�2 and 0 MJ m�2 in January and July and with a yearlytotal estimated to 583.52 MJ m�2 (Table 4). QAux represents about17% of collected energy and about 15.6% of total annual energy
load. During the summer months (Jun, July and August) the heatrequirements are fully met by solar, hence no auxiliary is needed.Indeed during the hot months (May, Jun, July, August September),about 100% with an annual average of SF about 84%. The compar-aison between this value of annual solar fraction and those givenby literature [22–25] shows that the proposed SHP presente manyadvantages shiftly in reducing the use of auxiliary energy in spaceheating. In fact, the SHP increase the solar fraction of about 20%.Also the SF achieved by the proposed SHP is slightly superior tothe solar faction given by Kacan et al. [11], this is explained bythe similar meteorological data of Tunisia and Turkey [26]. How-ever, the SF is lower during the cold months (December, Januaryand February), ranging from 45% to 50%. We perceive also thatthe heat delivered Q L is maximized in the month of August, about390 MJ m�2 (Fig. 15). Table 4 shows that the annual total value ofthe energy load (Q L) calculated by TRNSYS program is equal to3733.71 MJ m�2.
5.4. Building temperature and relative humidity evolution
In order to study the influence of SHP on the thermal behaviorof the simulated room, another series of simulations was accom-plished. Fig. 16 illustrates the air temperature changes of the sim-ulated room with and without auxiliary heating system applies.We notice that without making appeal to the auxiliary heating sys-tem the monthly average internal temperature during cold months(from December to Mars) ranges between 22 and 25 �C. When theauxiliary heating system is activated the temperature ranges

0
10
20
30
40
50
60
70
80
90
100
Rel
ativ
e hu
mud
ity (%
)
outdoor humidityindoor humidity
Jan Feb Mar Apr May Jun Jul Aug Sep Oct Nov Dec
Months
Fig. 17. Variation of the monthly relative humidity indoor and inside the room.
F. Mehdaoui et al. / Energy Conversion and Management 87 (2014) 285–296 295
during the same period from 25 to 28 �C. This result confirms thatthe request of auxiliary energy is limited to the cold months of theyear chiefly from December to Mars. We perceive that the auxiliaryenergy permit the gain of about 4 �C compared to the air temper-ature inside the room without using auxiliary heating system.The Fig. 16 shows also that from April to November there is no req-uisite of auxiliary heating system. Compared to the simulatedinside air temperature variation whilst the room is not heated,we perceive that the SHP guaranteed the gain of about 6 to 10 �Crespectively without and with auxiliary heating system.
In Fig. 17 is represented the monthly indoor and outdoor rela-tive humidity evolution vs months. Fig. 17 schows that the outdoorrelative humidity ranges between 72% and 78% during cold months(From October to Mars). Fig. 17 shows that use of the SHP reducesobviously the relative humidity inside the tested room. Indeed therelative humidity inside the tested room ranges during coldmonths between 35% and 38%. The comparaison between theseresults and those given by literature ([5,13]) shows that the pro-posed SHP presente many advantages shiftly in reducing the exces-sive humidity in Tunisian houses. In fact, the SHP reduce therelative humidity inside the the monozone room of about 40%.
6. Conclusion
In this study, the long-term thermal and energy performancesof new passive SHP used for buldings air-heating during coldmonths. This SHP mainly consists of a flate plate collector, storagetank and an active layer integrated in a single house. A TRNSYSsimulation program was proposed in order to optimize the SHP siz-ing design. In order to validate the TRNSYS simulation program anexperimental test was achived. The results shows that, the profileof the experimental and the TRNSYS simulation of the energy sup-plied from the SHP system vs local time represent a great simili-tude. Therefore we conclude that TRNSYS simulation programcould reproduce with an acceptable accuracy the real behavior ofthe SHP. Then the sizing and the optimization of the SHP (the solarcollector, the storage tank and flow among the prototype and theheating floor) was achieved by considering the monthly/annualsolar fraction, SF, changes. The results of simulation show thatthe optimal sizing of the SHP system that allows the supply of amaximum rate of the solar fraction consist on using a collectorwith Ac equal to 6 m2 area, a hot water storage cylinder with acapacity of V equal to 450 l and a collector mass flow rate md1
equal to 100 kg h�1. Concerning the floor heating, the optimal val-ues of mass flow rate (md2) and thickness (e) between active layerand exchange of area are 200 kg h�1 and 0.06 m, respectively.
The long-term performances of the optimized SHP show thatthe annual average SF is about 84%. The annual total and annualaverage of energy collected by the solar energy collector arerespectively about 3436.77 MJ m�2 and 288.65 MJ m�2. We noticethat without making appeal to the auxiliary heating system themonthly average internal temperature during cold months (fromDecember to Mars) ranges between 22 and 25 �C. The long-termperformances simulation of the SHP shows also that when the aux-iliary heating system is activated the temperature ranges duringthe same period from 25 to 28 �C. This result confirms that therequest of auxiliary energy is limited to the cold months of the yearchiefly from December to Mars. We perceive that the auxiliaryenergy permit the gain of about 4 �C compared to the air temper-ature inside the room without using auxiliary heating system.From April to November there is no requisite of auxiliary heatingsystem. Compared to the simulated inside air temperature varia-tion whilst the room is not heated, we perceive that the SHP guar-anteed the gain of about 6 to 10 �C respectively without and withauxiliary heating system. We found also that use of the SHPreduces obviously the relative humidity inside the tested room.Indeed the relative humidity inside the tested room ranges duringcold months between 35% and 38%.
Acknowledgments
The authors would like to thank the Laboratoire des ProcédésThermiques (LPT) and the Centre de Recherches et des Technologiesde l’Energie (CRTEn), Tunis, Tunisia for financially supporting theproject and for supplying some useful data.
References
[1] STEG: Tunisian company of electricity and gas. RAPPORT D’ACTIVITE. 2012[2] Zhang X, You S, Xu W, Wang M, He T, Zheng X. Experimental investigation of
the higher coefficient of thermal performance for water-in-glass evacuatedtube solar water heaters in China. Energy Convers Manage 2014;78:386–92.
[3] Zelzouli K, Guizani A, Kerkeni C. Numerical and experimental investigation ofthermosyphon solar water heater. Energy Convers Manage 2014;78:913–22.
[4] Ayompe LM, Duffy A, McCormack SJ, Conlon M. Validated TRNSYS model forforced circulation solar water heating systems with flat plate and heat pipeevacuated tube collectors. Appl Therm Eng 2011;31:1536–42.
[5] Nematollahi O, Alamdari P, Assari MR. Experimental investigation of a dualpurpose solar heating system. Energy Convers Manage 2014;78:359–66.
[6] Wills A, Cruickshank CA, Morrison IB. Application of the ESP-r/TRNSYS co-simulator to study solar heating with a single-house scale seasonal storage.Energy Procedia 2012;30:715–22.
[7] Zhao DL, Li Y, Dai YJ, Wang RZ. Optimal study of a solar air heating system withpebble bed energy storage. Energy Convers Manage 2011;52:2392–400.
[8] Xi C, Lin L, Hongxing Y. Long term operation of a solar assisted ground coupledheat pump system for space heating and domestic hot water. Energy Build2011;43:1835–44.
[9] Li H, Dai YJ, Köhler M, Wang RZ. Simulation and parameter analysis of a two-stage desiccant cooing/heating system driven by solar air collectors. EnergyConvers Manage 2013;67:309–17.
[10] Kemal Ç, Ugur Ç, Mehmet K, Kadir B. The relation of collector and storage tanksize in solar heating systems. Energy Convers Manage 2012;63:112–7.
[11] Kacan E, Ulgen K. Energy analysis of solar combisystems in Turkey. EnergyConvers Manage 2012;64:378–86.
[12] Al-Salaymeh A, Al-Rawabdeh I, Emran S. Economical investigation of anintegrated boiler–solar energy saving system in Jordan. Energy ConversManage 2010;51:1621–8.
[13] Chargui R, Sammouda H. Effects of different collector’s area on the coupling ofa thermosiphon collector and a single zone. Energy Convers Manage 2014;77:356–68.
[14] Mokhtari F, Loukarfi L, Belhamel M. Use of on/off mode for regulation of a solarheating system for building. Procedia Eng 2012;33:313–20.
[15] Elmaleh H, Tine HA. Studying, testing and simulating floor heating solarsystem. Energy Procedia 2011;6:337–46.
[16] Elmaleh H, Tine HA, Naimeh W. Studying and simulating low flow floorheating solar system. Energy Procedia 2012;19:23–9.
[17] Attar I, Naili N, Khalifa N, Hazami M, Farhat A. Parametric and numerical studyof a solar system for heating a greenhouse equipped with a buried exchanger.Energy Convers Manage 2013;70:163–73.
[18] TRNSYS 16: A transient system simulation program, pp. 367–373 (Chapter 5).

296 F. Mehdaoui et al. / Energy Conversion and Management 87 (2014) 285–296
[19] Attar I, Naili N, Khalifa N, Hazami M, Lazaar M, Farhat A. Experimental study ofan air conditioning system to control a greenhouse microclimate. EnergyConvers Manage 2014;79:543–53.
[20] Hazami M, Naili N, Attar I, Farhat A. Solar water heating systems feasibility fordomestic requests in Tunisia: thermal potential and economic analysis. EnergyConvers Manage 2013;76:599–608.
[21] Hazami M, Kooli S, Naili N, Farhat A. Long-term performances prediction of anevacuated tube solar water heating system used for single-family householdsunder typical Nord-African climate (Tunisia). Sol Energy 2013;94:283–98.
[22] Lixin G, Hua B, Shufeng M. Potential application of glazed transpired collectorsto space heating in cold climates. Energy Convers Manage 2014;77:690–9.
[23] Faizal M, Saidur R, Mekhilef S, Alim MA. Energy, economic and environmentalanalysis of metal oxides nanofluid for flat-plate solar collector. Energy ConversManage 2013;76:162–8.
[24] Jabbar A, Khalifa N, Abdul Jabbar Raid A. Conventional versus storage domesticsolar hot water systems: a comparative performance study. Energy ConversManage 2010;51:265–70.
[25] Hamed M, Fellah A, Ben Brahim A. Parametric sensitivity studies on theperformance of a flat plate solar collector in transient behavior. EnergyConvers Manage 2014;78:938–47.
[26] Kemal Ç, Ugur Ç, Mehmet K, Kadir B. The relation of collector and storage tanksize in solar heating systems. Energy Convers Manage 2012;63:112–7.