Experimental Study on Aerodynamic Characteristics of ... - MDPI
21
applied sciences Article Experimental Study on Aerodynamic Characteristics of a Gurney Flap on a Wind Turbine Airfoil under High Turbulent Flow Condition Junwei Yang 1,2,3 , Hua Yang 1,2, *, Weijun Zhu 1,2 , Nailu Li 1,2 and Yiping Yuan 4 1 College of Electrical, Energy and Power Engineering, Yangzhou University, Yangzhou 225127, China; [email protected] (J.Y.); [email protected] (W.Z.); [email protected] (N.L.) 2 New Energy Research Center, Yangzhou University, Yangzhou 225009, China 3 College of Hydraulic Science and Engineering, Yangzhou University, Yangzhou 225009, China 4 Jiangsu Key Laboratory of Hi-Tech Research for Wind Turbine Design, Nanjing University of Aeronautics and Astronautics, Nanjing 210016, China; [email protected] * Correspondence: [email protected]; Tel.: +86-138-1583-8009 Received: 20 September 2020; Accepted: 14 October 2020; Published: 16 October 2020 Abstract: The objective of the current work is to experimentally investigate the effect of turbulent flow on an airfoil with a Gurney flap. The wind tunnel experiments were performed for the DTU-LN221 airfoil under different turbulence level (T.I. of 0.2%, 10.5% and 19.0%) and various flap configurations. The height of the Gurney flaps varies from 1% to 2% of the chord length; the thickness of the Gurney flaps varies from 0.25% to 0.75% of the chord length. The Gurney flap was vertical fixed on the pressure side of the airfoil at nearly 100% measured from the leading edge. By replacing the turbulence grille in the wind tunnel, measured data indicated a stall delay phenomenon while increasing the inflow turbulence level. By further changing the height and the thickness of the Gurney flap, it was found that the height of the Gurney flap is a very important parameter whereas the thickness parameter has little influence. Besides, velocity in the near wake zone was measured by hot-wire anemometry, showing the mechanisms of lift enhancement. The results demonstrate that under low turbulent inflow condition, the maximum lift coefficient of the airfoil with flaps increased by 8.47% to 13.50% (i.e., thickness of 0.75%), and the Gurney flap became less effective after stall angle. The Gurney flap with different heights increased the lift-to-drag ratio from 2.74% to 14.35% under 10.5% of turbulence intensity (i.e., thickness of 0.75%). However, under much a larger turbulence environment (19.0%), the benefit to the aerodynamic performance was negligible. Keywords: wind tunnel experiment; wind turbine airfoil; turbulence; Gurney flap; aerodynamic characteristics 1. Introduction Wind power generation technology has been maturely developed in the past decades. Airfoil is a basic element of a wind turbine blade, and its aerodynamic characteristics have a major influence on the wind energy conversion efficiency. Among the conventional rotor aerodynamic design strategy, the blade add-ons were of particular interest to further improve wind energy efficiency. Therefore, mounting flap to the airfoil trailing edge was one of the most feasible methods to improve the aerodynamic performance of wind turbines. In addition to power production, such a technique can also effectively reduce the aerodynamic loads both of wind turbine blades and tower. If a sophisticated controller was implemented, the flap can further reduce turbulence-induced fatigue loads, so that longer lifetime was guaranteed. After the pioneering work of Liebeck [1], a large number of studies have been conducted to explain the phenomena induced by the presence of this device. More recently, Appl. Sci. 2020, 10, 7258; doi:10.3390/app10207258 www.mdpi.com/journal/applsci
-
Upload
khangminh22 -
Category
Documents
-
view
0 -
download
0
Transcript of Experimental Study on Aerodynamic Characteristics of ... - MDPI
applied sciences
Article
Experimental Study on Aerodynamic Characteristicsof a Gurney Flap on a Wind Turbine Airfoil underHigh Turbulent Flow Condition
Junwei Yang 1,2,3 , Hua Yang 1,2,*, Weijun Zhu 1,2 , Nailu Li 1,2 and Yiping Yuan 4
1 College of Electrical, Energy and Power Engineering, Yangzhou University, Yangzhou 225127, China;[email protected] (J.Y.); [email protected] (W.Z.); [email protected] (N.L.)
2 New Energy Research Center, Yangzhou University, Yangzhou 225009, China3 College of Hydraulic Science and Engineering, Yangzhou University, Yangzhou 225009, China4 Jiangsu Key Laboratory of Hi-Tech Research for Wind Turbine Design, Nanjing University of Aeronautics
and Astronautics, Nanjing 210016, China; [email protected]* Correspondence: [email protected]; Tel.: +86-138-1583-8009
Received: 20 September 2020; Accepted: 14 October 2020; Published: 16 October 2020�����������������
Abstract: The objective of the current work is to experimentally investigate the effect of turbulent flowon an airfoil with a Gurney flap. The wind tunnel experiments were performed for the DTU-LN221airfoil under different turbulence level (T.I. of 0.2%, 10.5% and 19.0%) and various flap configurations.The height of the Gurney flaps varies from 1% to 2% of the chord length; the thickness of the Gurneyflaps varies from 0.25% to 0.75% of the chord length. The Gurney flap was vertical fixed on the pressureside of the airfoil at nearly 100% measured from the leading edge. By replacing the turbulence grillein the wind tunnel, measured data indicated a stall delay phenomenon while increasing the inflowturbulence level. By further changing the height and the thickness of the Gurney flap, it was foundthat the height of the Gurney flap is a very important parameter whereas the thickness parameterhas little influence. Besides, velocity in the near wake zone was measured by hot-wire anemometry,showing the mechanisms of lift enhancement. The results demonstrate that under low turbulentinflow condition, the maximum lift coefficient of the airfoil with flaps increased by 8.47% to 13.50%(i.e., thickness of 0.75%), and the Gurney flap became less effective after stall angle. The Gurney flapwith different heights increased the lift-to-drag ratio from 2.74% to 14.35% under 10.5% of turbulenceintensity (i.e., thickness of 0.75%). However, under much a larger turbulence environment (19.0%),the benefit to the aerodynamic performance was negligible.
Keywords: wind tunnel experiment; wind turbine airfoil; turbulence; Gurney flap;aerodynamic characteristics
1. Introduction
Wind power generation technology has been maturely developed in the past decades. Airfoil isa basic element of a wind turbine blade, and its aerodynamic characteristics have a major influenceon the wind energy conversion efficiency. Among the conventional rotor aerodynamic designstrategy, the blade add-ons were of particular interest to further improve wind energy efficiency.Therefore, mounting flap to the airfoil trailing edge was one of the most feasible methods to improvethe aerodynamic performance of wind turbines. In addition to power production, such a technique canalso effectively reduce the aerodynamic loads both of wind turbine blades and tower. If a sophisticatedcontroller was implemented, the flap can further reduce turbulence-induced fatigue loads, so thatlonger lifetime was guaranteed. After the pioneering work of Liebeck [1], a large number of studieshave been conducted to explain the phenomena induced by the presence of this device. More recently,
Appl. Sci. 2020, 10, 7258; doi:10.3390/app10207258 www.mdpi.com/journal/applsci

Appl. Sci. 2020, 10, 7258 2 of 21
research objects were most focused on airfoil attached various shapes of flaps, such as Gurneyflaps [2,3], triangular flaps [4], separate trailing edge flaps [5,6] and deformable trailing edge flaps [7,8].For experiment tests, Zhang et al. [9] and Amini et al. [10] studied the aerodynamic effect of a Gurneyflap based on the airfoil through wind tunnel experiments. T Lee et al. [11] carried out a wind tunneltest of the lift force and pitching moment coefficients of both trailing edge flaps and Gurney flapswith different shape parameters. Based on a 5 MW reference wind turbine, Chen et al. [12] designedand optimized a trailing edge flaps such that the blade mass can be further reduced but still maintainthe desired power performance. Medina et al. [13] explored the flow mechanisms of a flap at a highdeflection angle. When the flap works in a separated flow region, he provided some ideas for realizinginstantaneous action or alleviating extra aerodynamic loads on wind turbines. Elsayed et al. [14]studied the flap tip vortexes and characterized the flow structures behind a flap in a low-speed windtunnel by using particle image velocimetry. Little et al. [15] designed a trailing edge flap by usinga single medium plasma driver which resulted in a higher lift force. Bergami et al. [16] designedan active controller of a trailing edge flap on a 5 MW reference wind turbine and proved that theflap could effectively control aerodynamic loads. Edward et al. [17] also conducted experiments ona flaps noise drop. According to the wind tunnel tests based on a full-size rotor, Straub et al. [18]found that flaps could also be used to control noise and vibration such that the noise generated byblade vortex interaction could be reduced by 6 dB. For numerical simulations and theoretical analyses,Traub et al. [19] fitted a semi-empirical equation by summarizing the performance of a large numberof flaps. Lario et al. [20] numerically solved the unsteady flow field of Gurney flaps at high Reynoldsnumbers through the discontinuous Galerkin method. By analyzing dynamic characteristics of anairfoil with Gurney flaps through the numerical simulation, Li et al. [21] found that flaps were capableto reduce unsteady aerodynamic loads of wind turbines. Zhu et al. [22] numerically simulated theairfoil with trailing edge flaps using the immersed boundary method and found that flaps couldbe combined with the paddle movement to adjust the aerodynamic loads of a wind turbine airfoil.Ng et al. [23] investigated the trailing edge flap together with an aeroelastic analysis. It was noted thatthe trailing edge flap could be a smart device to control aeroelastic deformation.
All the above researches on the flaps were built on the uniform inflow of low turbulenceintensity. In the past, there were few studies carried out by flow over flaps under high turbulenceintensity [24,25], however, such a flow condition often occurs on wind turbines operating in a windfarm. Considering wind turbines operate in a turbulence environment, the conclusions obtained fromthe previous studies might not be accurate. Therefore, to simulate wind turbines under turbulenceenvironment, active and passive wind tunnel turbulence generation methods can be used. The activetechnology includes a vibrating grille and multi-fan wind tunnel; the maximum turbulence intensity canreach more than 20% [26]. The passive control structure was relatively simple, which can be divided intogrille, wedge, and rough square types among the passive turbulence generators, it was more convenientto construct grilles, which have gain very popular use. In this experiment, specific turbulence levelswere passively controlled by a grille with proper grid size.
The investigations presented in this paper were focused on the coupled effects of Gurneyflap and turbulence inflow. The Gurney flaps were experimentally investigated under variousturbulence intensities and flap configurations. The desired turbulent flow passes the airfoil wasachieved by changing the grille size as well as the distance between the grille and the airfoil model.The hot-wire anemometer was used to record the wind speed and turbulence intensity in a flowcross-section. The quantitative information obtained during the experiment includes: (1) turbulentfield descriptions, (2) airfoil pressure coefficients, (3) lift-to-drag coefficients, (4) wake measurements.On that basis, the aerodynamic performance of Gurney flaps with different heights and thicknesseswas researched. The values of lift and pitching-moment coefficients were obtained through theintegration of surface pressures. The wake rake array was also used to determine the values of dragcoefficient. Furthermore, the flow fields near the trailing edge of airfoil were tested which could further
Appl. Sci. 2020, 10, 7258 3 of 21
verify the reason for lift improvement. Finally, concluding remarks accompany the discussion of theexperimental investigations.
2. Experimental Setup
The experiments were carried out in a wind tunnel located at Yangzhou University. It was aclose-loop type wind tunnel which contains two experimental sections. The measurements wereconducted in the smaller section with the cross-section parameters of 3 m × 1.5 m, and the lengthis 3 m. The operational wind speed range was 0~50 m/s and the calibrated maximum turbulenceintensity in the free stream was 0.2%. The DTU-LN221 airfoil model [27], as shown in Figure 1,was adopted which has a chord length of 0.6 m and a span length of 1.5 m. The airfoil model wasvertically placed in the test section. The bottom part of the airfoil section was connected by the rotatingshaft, which was fixed on a rotational plate, as demonstrated in Figure 2. Therefore, the angle of attackcan be remotely controlled via a shaft connection with a motor below the wind tunnel. The airfoilmodel was made of aluminum alloy where small taps were drilled on the surface of the middle section,with the location sketched in Figure 1. The arc length between the taps was approximately spacedevery 2.5% of chord length starting from the leading edge to 90% of the trailing edge. The hollowplastic hoses were connected on the reverse side of the airfoil surface which has an outer diameter of1.2 mm. Thus, a total of 77 pressure taps were arranged for the pressure measurement on the surfaceof the airfoil. The pressures on the airfoil surface were sensed by the electronic pressure acquisitionsystem of PSI (Pressure Systems Inc., Hampton, VA, USA). The pressure system used in the experimenthas a sampling frequency of 333.3 Hz, a measuring range of ±2.5 kPa and a measuring accuracy of±0.05%. Figure 1 also shows the chord-wise position, so the lift and pitching-moment of the test airfoilwere achieved by integrating the pressure and the position of the taps on the surface. The lift coefficientand pitching-moment coefficients were given by
Cl = Cn cosα−Ct sinα
Cm =1∫
0
(Cpl −Cpu
)(0.25− x)dx
(1)
where
Cn =1∫
0
(Cpl −Cpu
)dx
Ct =yu max∫
yl max
(Cp,be −Cp,a f
)dy
(2)
where Cl and Cm are the lift coefficient and pitching-moment coefficient, respectively; αrepresentsthe angle of attack; x is the relative chord length; y is the thickness value relative to the chord length;Cpu and Cpl are the pressure coefficient on the suction and pressure sides of the airfoil, respectively;Cn and Ct are the normal force coefficient and tangential force coefficient, respectively. Cp,be andCp,af are the pressure coefficient before and after the maximum thickness of airfoil; yu max and yl maxrepresent the maximum thickness values of the suction and pressure sides relative to chord length.

Appl. Sci. 2020, 10, 7258 4 of 21Appl. Sci. 2020, 10, 7258 4 of 21
600mm
150mm
Chord line
Inflow
Angle of
attack
Drag (pressure drag)lift
Pitching
moment
Connect with
servo motor
through a shaft
lift, pitching-
moment obtained
Pressure taps
Rotating center
∫integral
Chord-wise position x/c0 0.1 0.2 0.3 0.4 0.5 0.6 0.7 0.8 0.9 1.0
Th
ick
nes
s y/c
tangential force
normal force
Drag obtained
(pressure drag +
frictional drag)
wake rake array
Figure 1. Schematic diagram of measuring position.
rotary plate
Airfoil section
pressure taps
Gurney flap
Wake rake array
Grilles
Airfoil section
Pitot tube1600mm
3000mm
1500mmincoming flow
420mm Wake rake array
Figure 2. Experimental test device.
At a small angle of attack, the aerodynamic drag largely consists of frictional drag, while the
data measured by surface pressure taps cannot accurately represent the drag force, so the drag can
be measured by the momentum method more precisely. As shown in Figure 2, a wake rake array
was placed at 0.7 chord length behind the trailing edge of the airfoil and at the same vertical level as
the pressure taps. The measurement range of the wake probes was 80.8 cm, 102 total pressure pipes
(with an outer diameter of 1.2 mm) and 4 static pressure pipes (with an outer diameter of 2 mm)
were averagely arranged, with an 20 cm apart for the static pressure pipes. To prevent air leakage, all
pressure tubes were connected by plastic hoses to the pressure measurement device. Besides, two
Pitot tubes were installed at 1.6 m measured from the downstream of grilles where the free stream
velocity was recorded. The drag coefficients were given as follows
01 01
0 0
21d
w
P P P PC ds
c P P P P
(3)
where Cd is the drag coefficient; c is the chord length, w is the range of integration; s is the
coordinate along the thickness direction of the wake rake array; P∞ and P0 are the static
pressure and total pressure measured by the Pitot tubes; P and P01 are the static pressure and
total pressure measured by the wake rake array. It should be noted that there is a total pressure
loss along the Pitot tubes to the wake rake array, therefore the total pressure loss should be
added to each total pressure measuring point of the wake rake array.
Figure 3 presents the schematic diagram of the grille geometry. The grilles assembled with
many squared alloys with geometry specified by four parameters a, b, c and d. These small squares
were bolted together and on top of the grille the rubber pads were attached. During the
measurements, two types of grilles were implemented. The dimensions of the two grilles were
Figure 1. Schematic diagram of measuring position.
Appl. Sci. 2020, 10, 7258 4 of 21
600mm
150mm
Chord line
Inflow
Angle of
attack
Drag (pressure drag)lift
Pitching
moment
Connect with
servo motor
through a shaft
lift, pitching-
moment obtained
Pressure taps
Rotating center
∫integral
Chord-wise position x/c0 0.1 0.2 0.3 0.4 0.5 0.6 0.7 0.8 0.9 1.0
Th
ick
nes
s y/c
tangential force
normal force
Drag obtained
(pressure drag +
frictional drag)
wake rake array
Figure 1. Schematic diagram of measuring position.
rotary plate
Airfoil section
pressure taps
Gurney flap
Wake rake array
Grilles
Airfoil section
Pitot tube1600mm
3000mm
1500mmincoming flow
420mm Wake rake array
Figure 2. Experimental test device.
At a small angle of attack, the aerodynamic drag largely consists of frictional drag, while the
data measured by surface pressure taps cannot accurately represent the drag force, so the drag can
be measured by the momentum method more precisely. As shown in Figure 2, a wake rake array
was placed at 0.7 chord length behind the trailing edge of the airfoil and at the same vertical level as
the pressure taps. The measurement range of the wake probes was 80.8 cm, 102 total pressure pipes
(with an outer diameter of 1.2 mm) and 4 static pressure pipes (with an outer diameter of 2 mm)
were averagely arranged, with an 20 cm apart for the static pressure pipes. To prevent air leakage, all
pressure tubes were connected by plastic hoses to the pressure measurement device. Besides, two
Pitot tubes were installed at 1.6 m measured from the downstream of grilles where the free stream
velocity was recorded. The drag coefficients were given as follows
01 01
0 0
21d
w
P P P PC ds
c P P P P
(3)
where Cd is the drag coefficient; c is the chord length, w is the range of integration; s is the
coordinate along the thickness direction of the wake rake array; P∞ and P0 are the static
pressure and total pressure measured by the Pitot tubes; P and P01 are the static pressure and
total pressure measured by the wake rake array. It should be noted that there is a total pressure
loss along the Pitot tubes to the wake rake array, therefore the total pressure loss should be
added to each total pressure measuring point of the wake rake array.
Figure 3 presents the schematic diagram of the grille geometry. The grilles assembled with
many squared alloys with geometry specified by four parameters a, b, c and d. These small squares
were bolted together and on top of the grille the rubber pads were attached. During the
measurements, two types of grilles were implemented. The dimensions of the two grilles were
Figure 2. Experimental test device.
At a small angle of attack, the aerodynamic drag largely consists of frictional drag, while thedata measured by surface pressure taps cannot accurately represent the drag force, so the drag canbe measured by the momentum method more precisely. As shown in Figure 2, a wake rake arraywas placed at 0.7 chord length behind the trailing edge of the airfoil and at the same vertical level asthe pressure taps. The measurement range of the wake probes was 80.8 cm, 102 total pressure pipes(with an outer diameter of 1.2 mm) and 4 static pressure pipes (with an outer diameter of 2 mm) wereaveragely arranged, with an 20 cm apart for the static pressure pipes. To prevent air leakage, all pressuretubes were connected by plastic hoses to the pressure measurement device. Besides, two Pitot tubeswere installed at 1.6 m measured from the downstream of grilles where the free stream velocity wasrecorded. The drag coefficients were given as follows
Cd =2c
∫w
√P01 − PP0 − P∞
1− √P01 − P∞P0 − P∞
ds (3)
where Cd is the drag coefficient; c is the chord length, w is the range of integration; s is the coordinatealong the thickness direction of the wake rake array; P∞ and P0 are the static pressure and total pressuremeasured by the Pitot tubes; P and P01 are the static pressure and total pressure measured by the wakerake array. It should be noted that there is a total pressure loss along the Pitot tubes to the wake rakearray, therefore the total pressure loss should be added to each total pressure measuring point of thewake rake array.
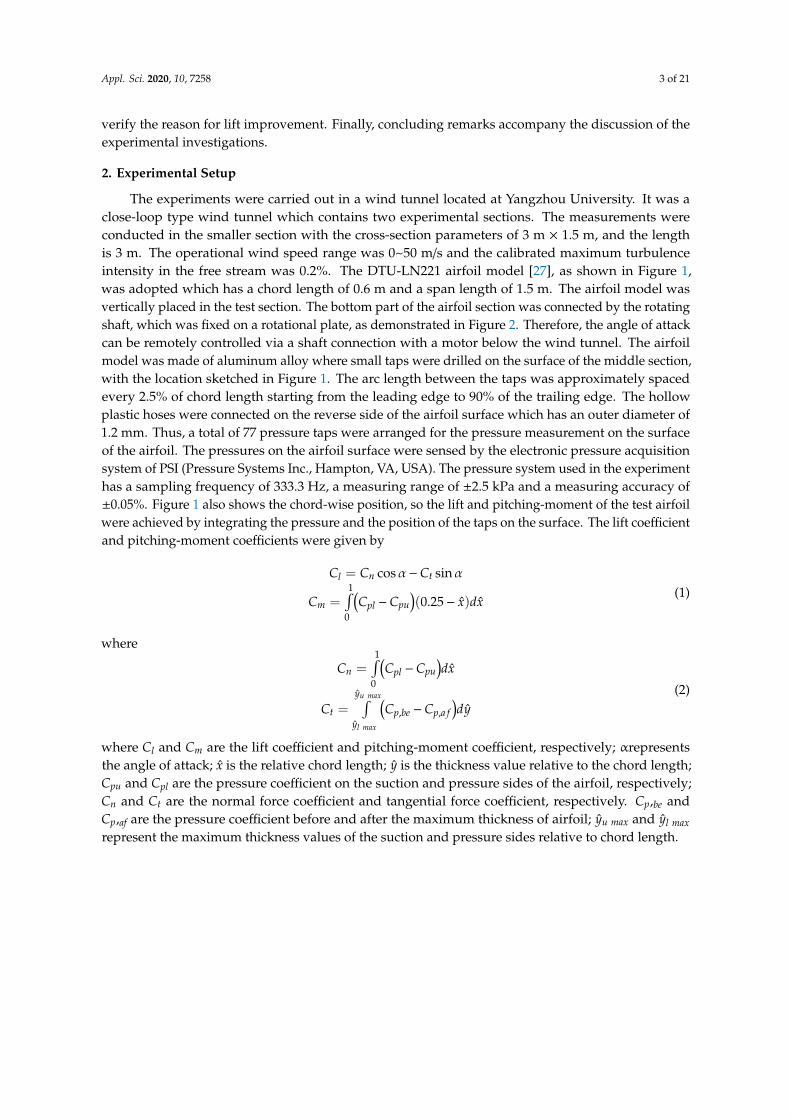
Figure 3 presents the schematic diagram of the grille geometry. The grilles assembled with manysquared alloys with geometry specified by four parameters a, b, c and d. These small squares were
Appl. Sci. 2020, 10, 7258 5 of 21
bolted together and on top of the grille the rubber pads were attached. During the measurements,two types of grilles were implemented. The dimensions of the two grilles were provided in Table 1.The width of the longitudinal grille and the transverse grille were denoted by a and c, respectively;the width and the height of the spacing were denoted by b and d, respectively, the thickness along theflow direction was e.
Appl. Sci. 2020, 10, 7258 5 of 21
provided in Table 1. The width of the longitudinal grille and the transverse grille were denoted by a
and c, respectively; the width and the height of the spacing were denoted by b and d, respectively,
the thickness along the flow direction was e.
Table 1. Dimensions of the experiment grilles.
a (cm) b (cm) c (cm) d (cm) e (cm)
Scheme 1 3 34 3 32 3
Scheme 2 6 31.4 6 29.8 3
b d
a
c
Rubber pads
Anchor bolts
(a)
Anchor bolts
Grille
1000mm1000mm
200mm
Section1Section8
100mm
200mm
200mm
100mm
100mm
100mm
(b)
Figure 3. Schematic diagram of experimental grille. (a) Front view; (b) side view.
Behind the grille, there were eight measurement sections designed for velocity recording. At
each of the section, 15 measurement points were uniformly spaced. The center of the topmost
measurement point corresponds to the geometrical center of the wind tunnel section. The horizontal
and vertical spacing of measuring points were 10 cm, as displayed by the black spots in Figure 3a. In
addition, we set eight measurement sections one to two meters behind the grille, as shown in Figure
3b. The wind speed was measured through a Dantec hot-wire probe (type 55P61). The sampling
frequency was 5 kHz, and the test wind speeds were consistent with that in the airfoil experiment.
Figure 4 displays the device of turbulence measurement. Besides, wake measurements in this paper
were carried out on an electronically controlled traverser consisting of a two-dimensional probe, as
displayed in Figure 5.
Figure 3. Schematic diagram of experimental grille. (a) Front view; (b) side view.
Table 1. Dimensions of the experiment grilles.
a (cm) b (cm) c (cm) d (cm) e (cm)
Scheme 1 3 34 3 32 3
Scheme 2 6 31.4 6 29.8 3
Behind the grille, there were eight measurement sections designed for velocity recording. At eachof the section, 15 measurement points were uniformly spaced. The center of the topmost measurementpoint corresponds to the geometrical center of the wind tunnel section. The horizontal and verticalspacing of measuring points were 10 cm, as displayed by the black spots in Figure 3a. In addition,we set eight measurement sections one to two meters behind the grille, as shown in Figure 3b. The windspeed was measured through a Dantec hot-wire probe (type 55P61). The sampling frequency was5 kHz, and the test wind speeds were consistent with that in the airfoil experiment. Figure 4 displaysthe device of turbulence measurement. Besides, wake measurements in this paper were carried out onan electronically controlled traverser consisting of a two-dimensional probe, as displayed in Figure 5.

Appl. Sci. 2020, 10, 7258 6 of 21
Appl. Sci. 2020, 10, 7258 6 of 21
Figure 4. Grille turbulence generated device.
Figure 5. Wake measurements.
The influence of the flap height and thickness were two key parameters which influence the
overall aerodynamic performance of the airfoil. For this reason, a total of nine types of flaps were
designed in the experiments, namely, the flap with heights h of 1%, 1.5% and 2% chord length (6
mm, 9 mm and 12 mm, respectively) and with relative thicknesses d of 0.25%, 0.5% and 0.75% chord
length (1.5 mm, 3 mm and 4.5 mm, respectively). The diagram of the flap used in the experiment was
given in Figure 6. As shown, the flap has an L shape; the bottom part has a width of 7 mm which was
attached to the pressure side of the airfoil trailing edge. During the experiments, the flap was
vertically attached near the position of 100% of the chord length, see Figure 2 with the specific
experimental setup. The coordinate system behind the trailing edge was defined for subsequent
wake measurements, also the x and y axis were set in the vertical and the forward directions,
respectively. The black spots in the Figure 6 represented the hot-wire measuring positions set at
downstream of the trailing edge.
Figure 6. Flap geometry.
2mm
7mm
h
d
x
y
Figure 4. Grille turbulence generated device.
Appl. Sci. 2020, 10, 7258 6 of 21
Figure 4. Grille turbulence generated device.
Figure 5. Wake measurements.
The influence of the flap height and thickness were two key parameters which influence the
overall aerodynamic performance of the airfoil. For this reason, a total of nine types of flaps were
designed in the experiments, namely, the flap with heights h of 1%, 1.5% and 2% chord length (6
mm, 9 mm and 12 mm, respectively) and with relative thicknesses d of 0.25%, 0.5% and 0.75% chord
length (1.5 mm, 3 mm and 4.5 mm, respectively). The diagram of the flap used in the experiment was
given in Figure 6. As shown, the flap has an L shape; the bottom part has a width of 7 mm which was
attached to the pressure side of the airfoil trailing edge. During the experiments, the flap was
vertically attached near the position of 100% of the chord length, see Figure 2 with the specific
experimental setup. The coordinate system behind the trailing edge was defined for subsequent
wake measurements, also the x and y axis were set in the vertical and the forward directions,
respectively. The black spots in the Figure 6 represented the hot-wire measuring positions set at
downstream of the trailing edge.
Figure 6. Flap geometry.
2mm
7mm
h
d
x
y
Figure 5. Wake measurements.
The influence of the flap height and thickness were two key parameters which influence theoverall aerodynamic performance of the airfoil. For this reason, a total of nine types of flaps weredesigned in the experiments, namely, the flap with heights h of 1%, 1.5% and 2% chord length (6 mm,9 mm and 12 mm, respectively) and with relative thicknesses d of 0.25%, 0.5% and 0.75% chord length(1.5 mm, 3 mm and 4.5 mm, respectively). The diagram of the flap used in the experiment was givenin Figure 6. As shown, the flap has an L shape; the bottom part has a width of 7 mm which wasattached to the pressure side of the airfoil trailing edge. During the experiments, the flap was verticallyattached near the position of 100% of the chord length, see Figure 2 with the specific experimentalsetup. The coordinate system behind the trailing edge was defined for subsequent wake measurements,also the x and y axis were set in the vertical and the forward directions, respectively. The black spots inthe Figure 6 represented the hot-wire measuring positions set at downstream of the trailing edge.
Appl. Sci. 2020, 10, 7258 6 of 21
Figure 4. Grille turbulence generated device.
Figure 5. Wake measurements.
The influence of the flap height and thickness were two key parameters which influence the
overall aerodynamic performance of the airfoil. For this reason, a total of nine types of flaps were
designed in the experiments, namely, the flap with heights h of 1%, 1.5% and 2% chord length (6
mm, 9 mm and 12 mm, respectively) and with relative thicknesses d of 0.25%, 0.5% and 0.75% chord
length (1.5 mm, 3 mm and 4.5 mm, respectively). The diagram of the flap used in the experiment was
given in Figure 6. As shown, the flap has an L shape; the bottom part has a width of 7 mm which was
attached to the pressure side of the airfoil trailing edge. During the experiments, the flap was
vertically attached near the position of 100% of the chord length, see Figure 2 with the specific
experimental setup. The coordinate system behind the trailing edge was defined for subsequent
wake measurements, also the x and y axis were set in the vertical and the forward directions,
respectively. The black spots in the Figure 6 represented the hot-wire measuring positions set at
downstream of the trailing edge.
Figure 6. Flap geometry.
2mm
7mm
h
d
x
y
Figure 6. Flap geometry.

Appl. Sci. 2020, 10, 7258 7 of 21
3. Experimental Results and Analysis
In the experiment, the free stream flow velocity was 20 m/s, and the corresponding Reynoldsnumber based on the airfoil chord length was 0.8 × 10⁶, although wind turbines often operate atwind speed below 20 m/s, but the magnitude of the Reynolds number was up to an order of 106.Therefore, the experimental value of the Reynolds number was chosen to approach an order ofmagnitude corresponding to those obtained from full-scale wind turbines. Two types of grilles generatedifferent turbulence levels in the wind tunnel, such that the experiments were mainly separated intolow and high turbulence cases. To be specific, a grille was placed at the upstream of the airfoil testsection which results in different aerodynamic characteristics of flow over the airfoil with and withouta Gurney flap.
3.1. Experimental Results of Grille Turbulence Generator
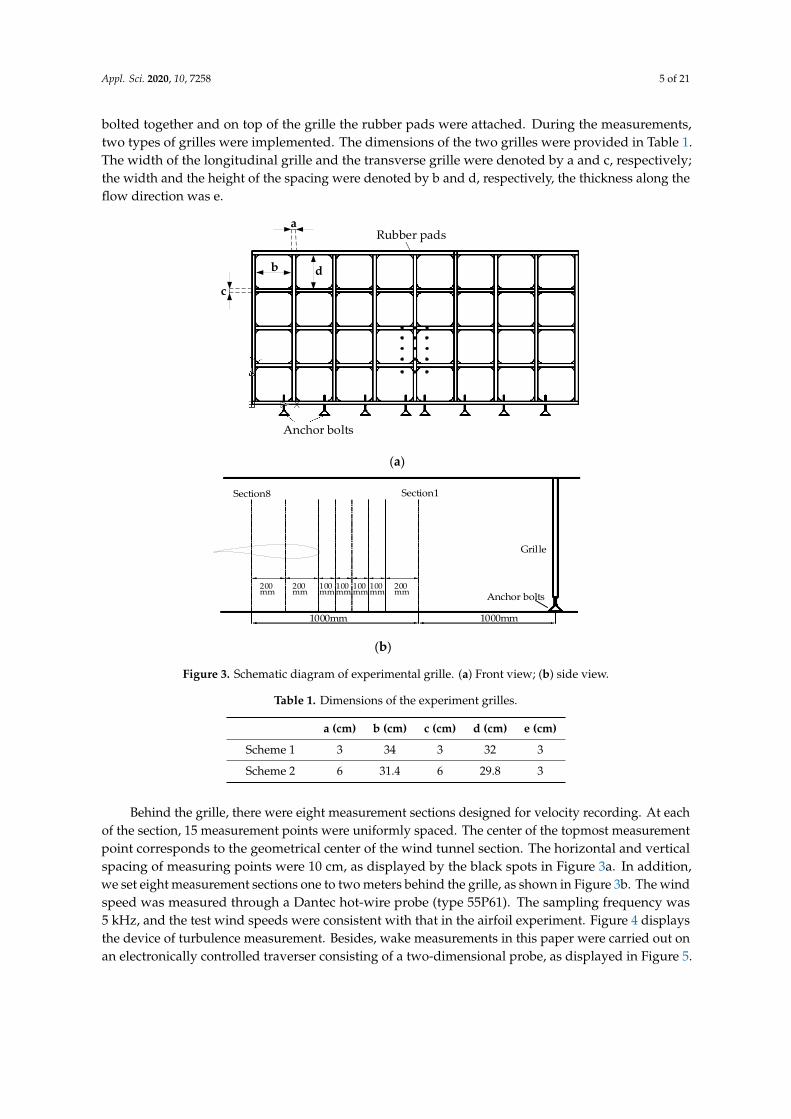
The measurements were first conducted for the two grilles. Figure 7 illustrates the time seriesof the instantaneous velocity at the central measuring point of the 6th section. As shown in Figure 7,the incoming wind became highly disturbed, for this reason, a statistical analysis was done for theflow field. The decay of turbulence intensity from the grilles towards the airfoil test section wasreported in Figure 8a. Within the scope of the test, the averaged turbulence intensity was recordedalong 8 downstream sections (each measured with 15 points). Besides, the margin of error in Figure 8awas expressed as the standard deviation of each section data. According to Figure 8a, the averageturbulence intensity of downstream in scheme one dropped from 13.5% at the position of 1.0 m behindthe grille to 9.4% at the position of 2.0 m; the average turbulence intensity of the downstream in schemetwo was higher than scheme 1, which decreased from 27.7% at the position of 1.0 m behind the grille to15.9% at the position of 2.0 m. The standard deviations of turbulence intensity of the two schemesdrops quickly towards the test section. The change in turbulence level indicates that there were veryhigh turbulence fluctuations just behind the grille which yielded very unstable flow field. The flowbecame gradually stabilized owing to the mutual dissipation over a propagation distance. To ensure ahomogeneous and isotropic turbulent field, so the distance 1.6 m (from the leading edge of the airfoilto the grille) was selected for placing the leading edge of the airfoil. The turbulence intensity measuredat the 6th section of the two schemes was 10.5% and 19.0%, respectively. Figure 8b illustrates the powerspectral density (PSD) of the wind speed at the two grille schemes measured at the central measuringpoint of the 6th section (1.6 m measured from grille to the hot-wire probes). Obviously, the largerthe turbulence intensity was generated, the larger the amplitude of the power spectral density wasobserved. Moreover, the power spectra amplitude in the downstream direction was consistent withthe corresponding Karman spectra, and it dropped down rapidly after the frequency over 30 Hz,which suggests that the grille distance was more proportional to the turbulent kinetic energy.
Appl. Sci. 2020, 10, 7258 7 of 21
3. Experimental Results and Analysis
In the experiment, the free stream flow velocity was 20 m/s, and the corresponding Reynolds
number based on the airfoil chord length was 0.8 × 10⁶, although wind turbines often operate at wind
speed below 20 m/s, but the magnitude of the Reynolds number was up to an order of 106. Therefore,
the experimental value of the Reynolds number was chosen to approach an order of magnitude
corresponding to those obtained from full-scale wind turbines. Two types of grilles generate
different turbulence levels in the wind tunnel, such that the experiments were mainly separated into
low and high turbulence cases. To be specific, a grille was placed at the upstream of the airfoil test
section which results in different aerodynamic characteristics of flow over the airfoil with and
without a Gurney flap.
3.1. Experimental Results of Grille Turbulence Generator
The measurements were first conducted for the two grilles. Figure 7 illustrates the time series of
the instantaneous velocity at the central measuring point of the 6th section. As shown in Figure 7, the
incoming wind became highly disturbed, for this reason, a statistical analysis was done for the flow
field. The decay of turbulence intensity from the grilles towards the airfoil test section was reported
in Figure 8a. Within the scope of the test, the averaged turbulence intensity was recorded along 8
downstream sections (each measured with 15 points). Besides, the margin of error in Figure 8a was
expressed as the standard deviation of each section data. According to Figure 8a, the average
turbulence intensity of downstream in scheme one dropped from 13.5% at the position of 1.0 m
behind the grille to 9.4% at the position of 2.0 m; the average turbulence intensity of the downstream
in scheme two was higher than scheme 1, which decreased from 27.7% at the position of 1.0 m
behind the grille to 15.9% at the position of 2.0 m. The standard deviations of turbulence intensity of
the two schemes drops quickly towards the test section. The change in turbulence level indicates that
there were very high turbulence fluctuations just behind the grille which yielded very unstable flow
field. The flow became gradually stabilized owing to the mutual dissipation over a propagation
distance. To ensure a homogeneous and isotropic turbulent field, so the distance 1.6 m (from the
leading edge of the airfoil to the grille) was selected for placing the leading edge of the airfoil. The
turbulence intensity measured at the 6th section of the two schemes was 10.5% and 19.0%,
respectively. Figure 8b illustrates the power spectral density (PSD) of the wind speed at the two
grille schemes measured at the central measuring point of the 6th section (1.6 m measured from
grille to the hot-wire probes). Obviously, the larger the turbulence intensity was generated, the
larger the amplitude of the power spectral density was observed. Moreover, the power spectra
amplitude in the downstream direction was consistent with the corresponding Karman spectra, and
it dropped down rapidly after the frequency over 30 Hz, which suggests that the grille distance was
more proportional to the turbulent kinetic energy.
0 2 4 6 8 10
8
10
12
14
16
18
20
22
24
Scheme 1
Scheme 2
win
d v
elo
city
(m
/s)
Time (s)
Figure 7. The time series of the instantaneous streamwise velocity (the 6th section, central measuring
point).
Figure 7. The time series of the instantaneous streamwise velocity (the 6th section, centralmeasuring point).
Appl. Sci. 2020, 10, 7258 8 of 21Appl. Sci. 2020, 10, 7258 8 of 21
1.0 1.2 1.4 1.6 1.8 2.0
0.1
0.2
0.3
0.4
Do
wn
win
d t
urb
ule
nce
in
ten
sity
Distance (m)
T.I. of scheme 1
T.I. of scheme 2
10
12
14
16
18
20
aver
age
win
d v
elo
city
(m
/s)Average velocity of scheme 1
Average velocity of scheme 2
1 10 100 10001E-5
1E-4
0.001
0.01
0.1
Po
wer
spectr
al
den
sity
Su
Frequency(Hz)
Experiment (Scheme 1, 1.6m)
Karman(Scheme 1, 1.6m)
Experiment(Scheme 2, 1.6m)
Karman (Scheme 2, 1.6m)
(a) (b)
Figure 8. Description of the flow field behind the grilles. (a) Turbulence intensity and average
velocity (Re: 0.8 × 10⁶); (b) Comparison of the PSD (1.6 m behind the grille).
3.2. Experimental Results of the Baseline Airfoil
To verify the accuracy of the experiment, the experimental data from the wind tunnel of LM
Wind Power were selected as a reference [28]. The aerodynamic data of the DTU-LN221 airfoil
under uniform inflow were measured in the LM wind tunnel experiment at the approximate
Reynolds number of 1.5 × 10⁶. The lift and drag data were selected as a cross-validation case. In
consideration of the interference effect of wind tunnel wall, the maximum blockage ratio in this
experiment was about 8.4%, so the experiment measured data of the airfoil were corrected by after
the reference [29], and the experimental data analyzed below were all corrected. In order to perform
a comparison, Figure 9 shows the comparison of experimental data of the DTU-LN221 airfoil under
uniform inflow condition. To minimize the uncertainty, measurements were performed several
times for comparison test at the approximate Reynolds number of 1.5 × 10⁶, YZU1, YZU2, YZU3
represents the results of the repeated experiments. As shown in Figure 9, the lift and drag
coefficients were very similar before the stall angle, while there were some discrepancies in the stall
state. Consider the cause of flow separation, the deviation of results of drag is quite considerable, but
the stall angles tested in the two wind tunnels were nearly the same. The reason for this may be that
although the airfoils were of the same type, they were individually manufactured, for example the
roughness of the airfoil surface may affect the experimental results. Besides, there were some
differences in drag measurements, LM adopted the model surface pressure distribution in a certain
range of the angle of attack, while YZU used the wake probes at all angles. Similar phenomena were
seen in different wind tunnel laboratories [30–32]. In the following, for reason of comparisons, the
measured data are averaged.
-15 -10 -5 0 5 10 15 20-1.0
-0.5
0.0
0.5
1.0
1.5
Cl
α/ (°)
LM
YZU
YZU-2
YZU-3
-10 -5 0 5 10 15 20
0.00
0.02
0.04
0.06
0.08
0.10
0.12
0.14
0.16
Cd
α/ (°)
LM
YZU
YZU-2
YZU-3
(a) (b)
Figure 9. Comparison of experimental data of the DTU-LN221 airfoil (uniform inflow, Re: 1.5 × 10⁶).
(a) Lift coefficient comparison; (b) drag coefficient comparison.
Figure 8. Description of the flow field behind the grilles. (a) Turbulence intensity and average velocity(Re: 0.8 × 10⁶); (b) Comparison of the PSD (1.6 m behind the grille).
3.2. Experimental Results of the Baseline Airfoil
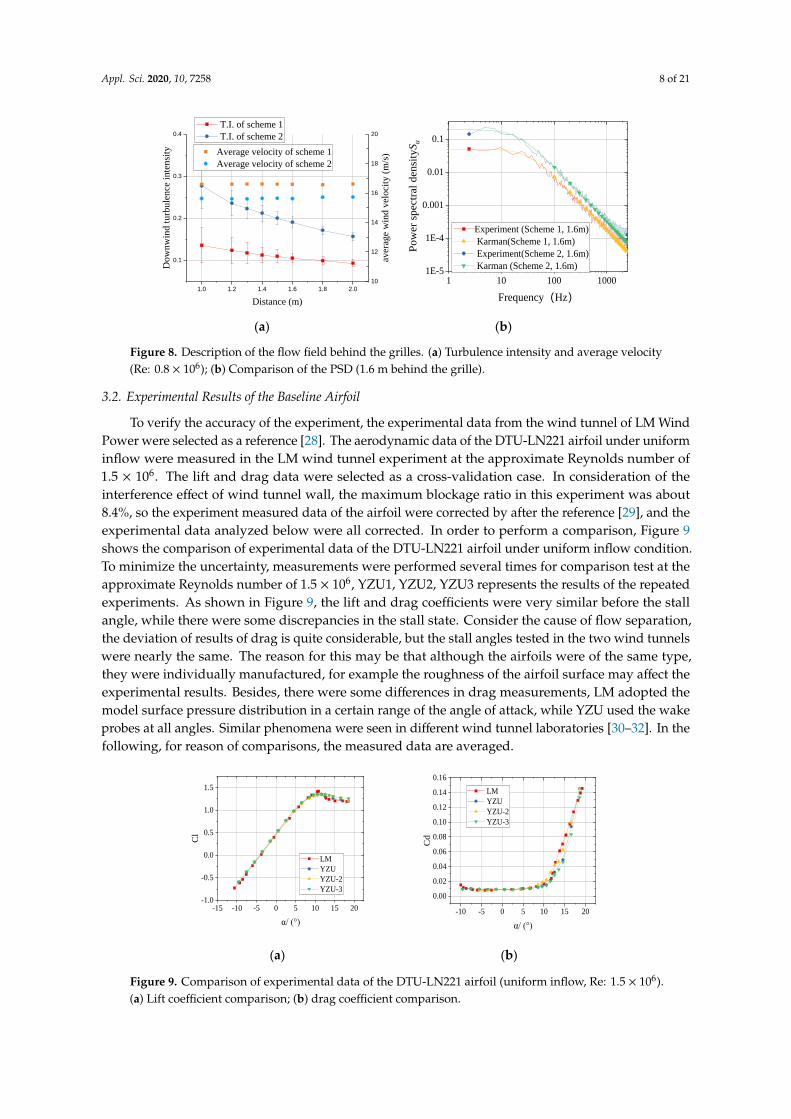
To verify the accuracy of the experiment, the experimental data from the wind tunnel of LM WindPower were selected as a reference [28]. The aerodynamic data of the DTU-LN221 airfoil under uniforminflow were measured in the LM wind tunnel experiment at the approximate Reynolds number of1.5 × 106. The lift and drag data were selected as a cross-validation case. In consideration of theinterference effect of wind tunnel wall, the maximum blockage ratio in this experiment was about8.4%, so the experiment measured data of the airfoil were corrected by after the reference [29], and theexperimental data analyzed below were all corrected. In order to perform a comparison, Figure 9shows the comparison of experimental data of the DTU-LN221 airfoil under uniform inflow condition.To minimize the uncertainty, measurements were performed several times for comparison test at theapproximate Reynolds number of 1.5 × 10⁶, YZU1, YZU2, YZU3 represents the results of the repeatedexperiments. As shown in Figure 9, the lift and drag coefficients were very similar before the stallangle, while there were some discrepancies in the stall state. Consider the cause of flow separation,the deviation of results of drag is quite considerable, but the stall angles tested in the two wind tunnelswere nearly the same. The reason for this may be that although the airfoils were of the same type,they were individually manufactured, for example the roughness of the airfoil surface may affect theexperimental results. Besides, there were some differences in drag measurements, LM adopted themodel surface pressure distribution in a certain range of the angle of attack, while YZU used the wakeprobes at all angles. Similar phenomena were seen in different wind tunnel laboratories [30–32]. In thefollowing, for reason of comparisons, the measured data are averaged.
Appl. Sci. 2020, 10, 7258 8 of 21
1.0 1.2 1.4 1.6 1.8 2.0
0.1
0.2
0.3
0.4
Do
wn
win
d t
urb
ule
nce
in
ten
sity
Distance (m)
T.I. of scheme 1
T.I. of scheme 2
10
12
14
16
18
20
aver
age
win
d v
elo
city
(m
/s)Average velocity of scheme 1
Average velocity of scheme 2
1 10 100 10001E-5
1E-4
0.001
0.01
0.1
Po
wer
spectr
al
den
sity
Su
Frequency(Hz)
Experiment (Scheme 1, 1.6m)
Karman(Scheme 1, 1.6m)
Experiment(Scheme 2, 1.6m)
Karman (Scheme 2, 1.6m)
(a) (b)
Figure 8. Description of the flow field behind the grilles. (a) Turbulence intensity and average
velocity (Re: 0.8 × 10⁶); (b) Comparison of the PSD (1.6 m behind the grille).
3.2. Experimental Results of the Baseline Airfoil
To verify the accuracy of the experiment, the experimental data from the wind tunnel of LM
Wind Power were selected as a reference [28]. The aerodynamic data of the DTU-LN221 airfoil
under uniform inflow were measured in the LM wind tunnel experiment at the approximate
Reynolds number of 1.5 × 10⁶. The lift and drag data were selected as a cross-validation case. In
consideration of the interference effect of wind tunnel wall, the maximum blockage ratio in this
experiment was about 8.4%, so the experiment measured data of the airfoil were corrected by after
the reference [29], and the experimental data analyzed below were all corrected. In order to perform
a comparison, Figure 9 shows the comparison of experimental data of the DTU-LN221 airfoil under
uniform inflow condition. To minimize the uncertainty, measurements were performed several
times for comparison test at the approximate Reynolds number of 1.5 × 10⁶, YZU1, YZU2, YZU3
represents the results of the repeated experiments. As shown in Figure 9, the lift and drag
coefficients were very similar before the stall angle, while there were some discrepancies in the stall
state. Consider the cause of flow separation, the deviation of results of drag is quite considerable, but
the stall angles tested in the two wind tunnels were nearly the same. The reason for this may be that
although the airfoils were of the same type, they were individually manufactured, for example the
roughness of the airfoil surface may affect the experimental results. Besides, there were some
differences in drag measurements, LM adopted the model surface pressure distribution in a certain
range of the angle of attack, while YZU used the wake probes at all angles. Similar phenomena were
seen in different wind tunnel laboratories [30–32]. In the following, for reason of comparisons, the
measured data are averaged.
-15 -10 -5 0 5 10 15 20-1.0
-0.5
0.0
0.5
1.0
1.5
Cl
α/ (°)
LM
YZU
YZU-2
YZU-3
-10 -5 0 5 10 15 20
0.00
0.02
0.04
0.06
0.08
0.10
0.12
0.14
0.16
Cd
α/ (°)
LM
YZU
YZU-2
YZU-3
(a) (b)
Figure 9. Comparison of experimental data of the DTU-LN221 airfoil (uniform inflow, Re: 1.5 × 10⁶).
(a) Lift coefficient comparison; (b) drag coefficient comparison.
Figure 9. Comparison of experimental data of the DTU-LN221 airfoil (uniform inflow, Re: 1.5 × 10⁶).(a) Lift coefficient comparison; (b) drag coefficient comparison.

Appl. Sci. 2020, 10, 7258 9 of 21
3.3. Experimental Results of the Gurney Flap under Uniform Inflow
This subsection starts to investigate the aerodynamic characteristics of the effect of Gurney flapin low turbulent inflow condition, the Reynolds number was decreased to 0.8 × 10⁶. Seen from theFigure 10, three lift and drag curves were compared with the original at the angle of attack ranged from−9.6◦ to 14.4◦. As shown, the lift coefficients increased with the increase of the height of the Gurneyflap before the stall angle, while it was also realized that the effect of the Gurney flap was limitedat a high angle of attack. The lift coefficient slopes and the stall angles of the flapped airfoil remainessentially unchanged compared to the baseline airfoil, but the flapped airfoil caused a leftward shiftcompared to the baseline airfoil. In order to show the changes of aerodynamic characteristics clearly,the following lift and drag differences were defined:
∆cl =
∣∣∣clbs − clgf∣∣∣
clbs× 100% (4)
∆cd =
∣∣∣cdbs − cdgf∣∣∣
cdbs× 100% (5)
∆cld =
∣∣∣cldbs − cldgf∣∣∣
cldbs× 100% (6)
where clbs and cdbs are the lift and drag coefficients obtained from the baseline airfoil, respectively.clgf and cdgf are the lift and drag coefficients obtained from the flapped airfoil. cldbs and cldbs are thelift-to-drag ratio obtained from the baseline airfoil and flapped airfoil.
Appl. Sci. 2020, 10, 7258 9 of 21
3.3. Experimental Results of the Gurney Flap under Uniform Inflow
This subsection starts to investigate the aerodynamic characteristics of the effect of Gurney flap
in low turbulent inflow condition, the Reynolds number was decreased to 0.8 × 10⁶. Seen from the
Figure 10, three lift and drag curves were compared with the original at the angle of attack ranged
from −9.6° to 14.4°. As shown, the lift coefficients increased with the increase of the height of the
Gurney flap before the stall angle, while it was also realized that the effect of the Gurney flap was
limited at a high angle of attack. The lift coefficient slopes and the stall angles of the flapped airfoil
remain essentially unchanged compared to the baseline airfoil, but the flapped airfoil caused a
leftward shift compared to the baseline airfoil. In order to show the changes of aerodynamic
characteristics clearly, the following lift and drag differences were defined:
bs gf
bs
-= 100%
cl clcl
cl (4)
bs gf
bs
-= 100%
cd cdcd
cd (5)
bs gf
bs
-= 100%
cld cldcld
cld (6)
where bscl and
bscd are the lift and drag coefficients obtained from the baseline airfoil,
respectively.gfcl and
gfcd are the lift and drag coefficients obtained from the flapped airfoil.
bscld and bscld are the lift-to-drag ratio obtained from the baseline airfoil and flapped airfoil.
-10 -5 0 5 10 15
-0.5
0.0
0.5
1.0
1.5
2.0
Cl
α/ (°)
Flap 12mm*4.5mm
Flap 9mm*4.5mm
Flap 6mm*4.5mm
Baseline airfoil
-10 -5 0 5 10 15
0.00
0.02
0.04
0.06
0.08
0.10
0.12
0.14
0.16
Cd
α/ (°)
Flap 12mm*4.5mm
Flap 9mm*4.5mm
Flap 6mm*4.5mm
Baseline airfoil
(a) (b)
-10 -5 0 5 10 15-0.16
-0.14
-0.12
-0.10
-0.08
-0.06
Flap 12mm*4.5mm
Flap 9mm*4.5mm
Flap 6mm*4.5mm
Baseline airfoil
α/ (°)
Cm
-10 -5 0 5 10 15
-90
-60
-30
0
30
60
90
120
Flap 12mm*4.5mm
Flap 9mm*4.5mm
Flap 6mm*4.5mm
Baseline airfoil
Cl/
Cd
α/ (°)
(c) (d)
Figure 10. Variation of the aerodynamic characteristics with different heights of Gurney flaps
(uniform flow, Re: 0.8 × 10⁶). (a) Lift coefficient comparison; (b) drag coefficient comparison; (c)
pitching-moment coefficient comparison; (d) lift-to-drag ratio comparison.
Figure 10. Variation of the aerodynamic characteristics with different heights of Gurney flaps(uniform flow, Re: 0.8 × 10⁶). (a) Lift coefficient comparison; (b) drag coefficient comparison;(c) pitching-moment coefficient comparison; (d) lift-to-drag ratio comparison.

Appl. Sci. 2020, 10, 7258 10 of 21
When the flap height changes to 6 mm, 9 mm and 12 mm, the maximum lift coefficients wereincreased by 8.47%, 9.56% and 13.50% at 9.4 degrees, respectively. Looking into the drag coefficientsshown in Figure 10b, within the range of −9.6~10.4◦, the drag coefficients show regular change wherethe frictional drag dominates as expected. The drag coefficients rise rapidly in the stall state, at thistime the change in drag coefficient was dominated by pressure drag. For example, at an angle ofattack of 12.4◦, with the flap heights of 6 mm, 9 mm, 12 mm the drag coefficients were increasedby 39.67%, 59.92% and 113.43%, respectively. According to Figure 10c, the Gurney flap generateda prominent increase in the pitching-moment coefficient compared to the baseline airfoil, the valueincreased with the heights of the Gurney flaps and reached negative peak values at approximately4.4◦. Based on Figure 10d, the lift-to-drag ratios were compared. When the angle of attack was lessthan 8.4◦, the lift-to-drag ratios were all larger than the baseline airfoil. However, the maximumlift-to-drag ratios of the Gurney flap at three heights were smaller than the baseline airfoil. When theflap heights were 6 mm, 9 mm and 12 mm, the corresponding maximum lift-to-drag ratios weredecreased by 17.16%, 22.79% and 24.47%, respectively. In the range after the stall angle, the presenceof the Gurney flap reduces the lift-to-drag ratios and the higher the flap height, the more the liftefficiency decreases. When the angle of attack was 12.4◦, for example, the lift-to-drag ratios of the flapwith heights of 6 mm, 9 mm and 12 mm were decreased by 26.55%, 38.11% and 52.20%, respectively.Meanwhile, we observed the same trend from the other thicknesses of the Gurney flaps (i.e., of 1.5 mm),When the flap height changes to 6 mm, 9 mm and 12 mm, the maximum lift coefficients were increasedby 9.27%, 9.78% and 14.08% at 9.4 degrees.
The following study in this section will be focused on the effect of the thickness of the Gurney flap.Figure 11 illustrates the changes in the aerodynamic characteristics of the baseline airfoil and airfoilwith a height of 9 mm of Gurney flaps under uniform flow. As seen from the figure, by changing thethickness of the Gurney flap, the lift-to-drag curves of the flapped airfoils with different thicknessesalmost overlaps, it seems that the flap thickness does not have obvious effect in the aerodynamicperformance. The results imply that the small increase of the flap thickness does not change the degreeof downward turning of the mean flow and recirculation flow around the trailing edge of the airfoil.
Appl. Sci. 2020, 10, 7258 10 of 21
When the flap height changes to 6 mm, 9 mm and 12 mm, the maximum lift coefficients were
increased by 8.47%, 9.56% and 13.50% at 9.4 degrees, respectively. Looking into the drag coefficients
shown in Figure 10b, within the range of −9.6~10.4°, the drag coefficients show regular change where
the frictional drag dominates as expected. The drag coefficients rise rapidly in the stall state, at this
time the change in drag coefficient was dominated by pressure drag. For example, at an angle of
attack of 12.4°, with the flap heights of 6 mm, 9 mm, 12 mm the drag coefficients were increased by
39.67%, 59.92% and 113.43%, respectively. According to Figure 10c, the Gurney flap generated a
prominent increase in the pitching-moment coefficient compared to the baseline airfoil, the value
increased with the heights of the Gurney flaps and reached negative peak values at approximately
4.4°. Based on Figure 10d, the lift-to-drag ratios were compared. When the angle of attack was less
than 8.4°, the lift-to-drag ratios were all larger than the baseline airfoil. However, the maximum
lift-to-drag ratios of the Gurney flap at three heights were smaller than the baseline airfoil. When the
flap heights were 6 mm, 9 mm and 12 mm, the corresponding maximum lift-to-drag ratios were
decreased by 17.16%, 22.79% and 24.47%, respectively. In the range after the stall angle, the presence
of the Gurney flap reduces the lift-to-drag ratios and the higher the flap height, the more the lift
efficiency decreases. When the angle of attack was 12.4°, for example, the lift-to-drag ratios of the
flap with heights of 6 mm, 9 mm and 12 mm were decreased by 26.55%, 38.11% and 52.20%,
respectively. Meanwhile, we observed the same trend from the other thicknesses of the Gurney flaps
(i.e., of 1.5 mm), When the flap height changes to 6 mm, 9 mm and 12 mm, the maximum lift
coefficients were increased by 9.27%, 9.78% and 14.08% at 9.4 degrees.
The following study in this section will be focused on the effect of the thickness of the Gurney
flap. Figure 11 illustrates the changes in the aerodynamic characteristics of the baseline airfoil and
airfoil with a height of 9 mm of Gurney flaps under uniform flow. As seen from the figure, by
changing the thickness of the Gurney flap, the lift-to-drag curves of the flapped airfoils with
different thicknesses almost overlaps, it seems that the flap thickness does not have obvious effect in
the aerodynamic performance. The results imply that the small increase of the flap thickness does
not change the degree of downward turning of the mean flow and recirculation flow around the
trailing edge of the airfoil.
-10 -5 0 5 10 15
-0.5
0.0
0.5
1.0
1.5
2.0
Cl
α/ (°)
Flap 9mm*4.5mm
Flap 9mm*3mm
Flap 9mm*1.5mm
Baseline airfoil
-10 -5 0 5 10 15
0.00
0.02
0.04
0.06
0.08
0.10
0.12
0.14
0.16
Flap 9mm*4.5mm
Flap 9mm*3mm
Flap 9mm*1.5mm
Baseline airfoil
Cd
α/ (°)
(a) (b)
Figure 11. Cont.

Appl. Sci. 2020, 10, 7258 11 of 21Appl. Sci. 2020, 10, 7258 11 of 21
-10 -5 0 5 10 15-0.16
-0.14
-0.12
-0.10
-0.08
-0.06
Flap 9mm*4.5mm
Flap 9mm*3mm
Flap 9mm*1.5mm
Baseline airfoil
Cm
α/ (°)
-10 -5 0 5 10 15-90
-60
-30
0
30
60
90
120
Flap 9mm*4.5mm
Flap 9mm*3mm
Flap 9mm*1.5mm
Baseline airfoil
Cl/
Cd
α/ (°)
(c) (d)
Figure 11. Variation of the aerodynamic characteristics with different thicknesses of Gurney flaps
(uniform flow, Re: 0.8 × 10⁶). (a) Lift coefficient comparison; (b) drag coefficient comparison; (c)
pitching-moment coefficient comparison; (d) lift-to-drag ratio comparison.
3.4. Experimental Results of Gurney Flap under 10.5% Turbulence Intensity
This subsection starts to investigate the aerodynamic characteristics of the Gurney flap under a
turbulent inflow with an intensity of 10.5%. Figure 12 shows the changes in the aerodynamic
characteristics of the baseline airfoil and the Gurney flaps with a thickness of 4.5 mm when the
turbulence intensity of the incoming flow was 10.5%. The measured angle of attack ranged from
−9.6° to 20.4°. As shown, under the present turbulence intensity of 10.5%, all cases induced a stall
delay. The stall angle was nearly delayed from the original 9.4° to about 16.4° under turbulent flow.
In Figure 12a, with the increase of turbulence intensity, the maximum lift coefficient of the baseline
airfoil reaches 1.611 and increases by 17.59% as compared with uniform inflow condition. An
interesting observation was that in such a turbulence environment, the lift coefficients were not
significantly different from each other under the current three flapped configurations. For the flap
heights of 6 mm, 9 mm and 12 mm, the maximum lift coefficients were increased by 15.21%, 17.19%
and 17.26% at 18.4 degrees, respectively. The increase rate was found larger than that under the
uniform turbulence condition. The margin of error in Figure 12a was expressed as the variance of the
time-averaged lift coefficient. As can be seen from the Figure 12a, the pressure uncertainty increased
with the increase of the angle of attack, and the lift coefficient fluctuations caused by the pressure
fluctuations were the most obvious pronounced when the attack angle reaches the stall angle.
According to Figure 12b, the increase in the lift of the flapped airfoil was at a cost of increasing drag.
The drag coefficient of the flapped airfoils was also non-linearly raised in the stall state. For example,
when the angle of attack was 20.4°, the drag coefficients were increased by 12.50%, 37.50% and
44.53%, respectively. As can be seen from Figure 12c, compared with the baseline airfoil, the Gurney
flap also generated a prominent increase in the pitching-moment coefficient, the negative peak
values delay to about 6.4°compared with the uniform inflow condition. As demonstrated in Figure
12d, the peak value of the lift-to-drag ratio becomes less as compared with the uniform flow
condition in all cases. Unlike the low turbulence condition, the maximum lift-to-drag of Gurney flap
with different heights slightly increased relative to the baseline airfoil. The maximum lift-to-drag
raised 14.35%, 9.15% and 2.74% respectively when the flap heights were 6 mm, 9 mm, and 12 mm,
respectively, with the maximum lift-to-drag ratio occurred at the smallest flap height. Besides, in
contrast to the situations of 1.5 mm thickness of the Gurney flaps, the Gurney flaps also achieved a
lift increase under 10.5% turbulence intensity. The maximum lift coefficient was increased by
14.77%, 14.83%, and 16.44% for height equals to 6 mm, 9 mm and 12 mm, respectively. The two
thickness configurations both had maximum lift-to-drag efficiency at 6 mm height, for the three
heights, respectively.
Figure 11. Variation of the aerodynamic characteristics with different thicknesses of Gurney flaps(uniform flow, Re: 0.8 × 10⁶). (a) Lift coefficient comparison; (b) drag coefficient comparison;(c) pitching-moment coefficient comparison; (d) lift-to-drag ratio comparison.
3.4. Experimental Results of Gurney Flap under 10.5% Turbulence Intensity
This subsection starts to investigate the aerodynamic characteristics of the Gurney flap undera turbulent inflow with an intensity of 10.5%. Figure 12 shows the changes in the aerodynamiccharacteristics of the baseline airfoil and the Gurney flaps with a thickness of 4.5 mm when theturbulence intensity of the incoming flow was 10.5%. The measured angle of attack ranged from−9.6◦ to 20.4◦. As shown, under the present turbulence intensity of 10.5%, all cases induced a stalldelay. The stall angle was nearly delayed from the original 9.4◦ to about 16.4◦ under turbulent flow.In Figure 12a, with the increase of turbulence intensity, the maximum lift coefficient of the baselineairfoil reaches 1.611 and increases by 17.59% as compared with uniform inflow condition. An interestingobservation was that in such a turbulence environment, the lift coefficients were not significantlydifferent from each other under the current three flapped configurations. For the flap heights of 6 mm,9 mm and 12 mm, the maximum lift coefficients were increased by 15.21%, 17.19% and 17.26% at18.4 degrees, respectively. The increase rate was found larger than that under the uniform turbulencecondition. The margin of error in Figure 12a was expressed as the variance of the time-averaged liftcoefficient. As can be seen from the Figure 12a, the pressure uncertainty increased with the increase ofthe angle of attack, and the lift coefficient fluctuations caused by the pressure fluctuations were themost obvious pronounced when the attack angle reaches the stall angle. According to Figure 12b,the increase in the lift of the flapped airfoil was at a cost of increasing drag. The drag coefficient of theflapped airfoils was also non-linearly raised in the stall state. For example, when the angle of attackwas 20.4◦, the drag coefficients were increased by 12.50%, 37.50% and 44.53%, respectively. As can beseen from Figure 12c, compared with the baseline airfoil, the Gurney flap also generated a prominentincrease in the pitching-moment coefficient, the negative peak values delay to about 6.4◦comparedwith the uniform inflow condition. As demonstrated in Figure 12d, the peak value of the lift-to-dragratio becomes less as compared with the uniform flow condition in all cases. Unlike the low turbulencecondition, the maximum lift-to-drag of Gurney flap with different heights slightly increased relative tothe baseline airfoil. The maximum lift-to-drag raised 14.35%, 9.15% and 2.74% respectively when theflap heights were 6 mm, 9 mm, and 12 mm, respectively, with the maximum lift-to-drag ratio occurredat the smallest flap height. Besides, in contrast to the situations of 1.5 mm thickness of the Gurneyflaps, the Gurney flaps also achieved a lift increase under 10.5% turbulence intensity. The maximumlift coefficient was increased by 14.77%, 14.83%, and 16.44% for height equals to 6 mm, 9 mm and12 mm, respectively. The two thickness configurations both had maximum lift-to-drag efficiency at6 mm height, for the three heights, respectively.
Appl. Sci. 2020, 10, 7258 12 of 21Appl. Sci. 2020, 10, 7258 12 of 21
-10 -5 0 5 10 15 20 25
-0.5
0.0
0.5
1.0
1.5
2.0
2.5
Flap 12mm*4.5mm
Flap 9mm*4.5mm
Flap 6mm*4.5mm
Baseline airfoil
Cl
α/ (°)
-10 -5 0 5 10 15 20 25
0.02
0.04
0.06
0.08
0.10
0.12
0.14
0.16
0.18
0.20
Flap 12mm*4.5mm
Flap 9mm*4.5mm
Flap 6mm*4.5mm
Baseline airfoil
Cd
α/ (°)
(a) (b)
-10 -5 0 5 10 15 20 25-0.16
-0.14
-0.12
-0.10
-0.08
-0.06 Flap 12mm*4.5mm
Flap 9mm*4.5mm
Flap 6mm*4.5mm
Baseline airfoil
Cm
α/ (°)
-10 -5 0 5 10 15 20 25
-20
-10
0
10
20
30
40
50
Flap 12mm*4.5mm
Flap 9mm*4.5mm
Flap 6mm*4.5mm
Baseline airfoil
Cl/
Cd
α/ (°)
(c) (d)
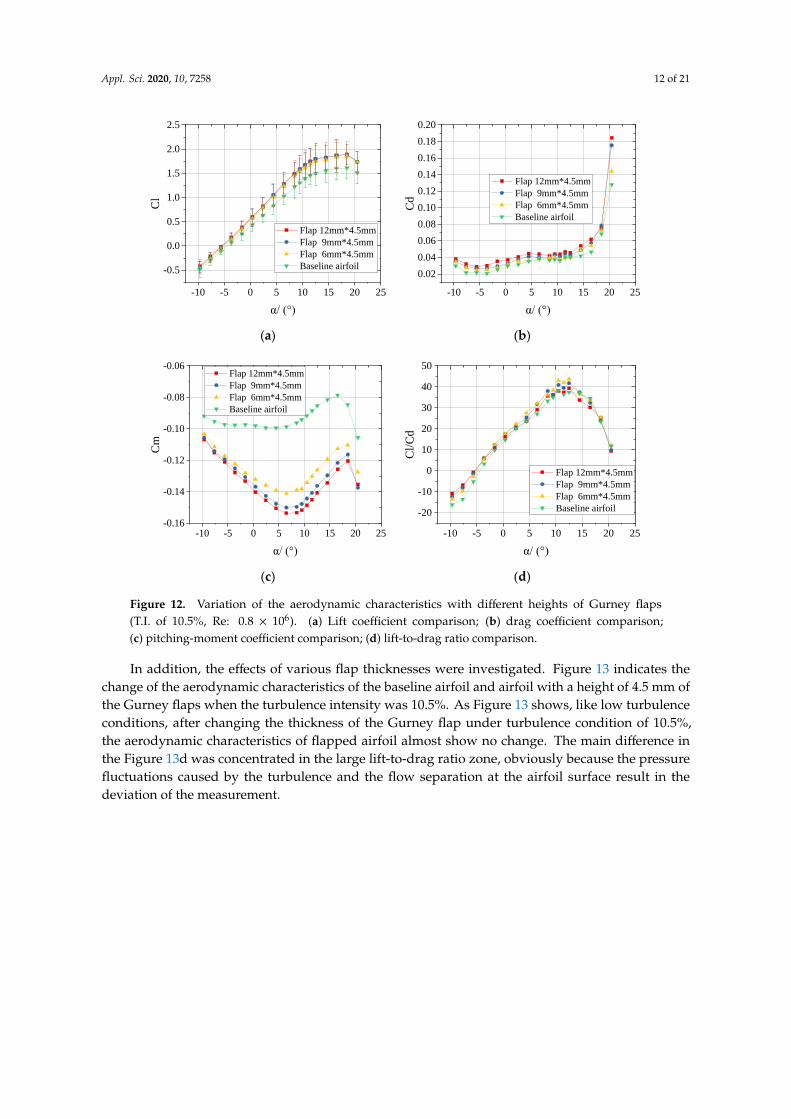
Figure 12. Variation of the aerodynamic characteristics with different heights of Gurney flaps (T.I. of
10.5%, Re: 0.8 × 10⁶). (a) Lift coefficient comparison; (b) drag coefficient comparison; (c)
pitching-moment coefficient comparison; (d) lift-to-drag ratio comparison.
In addition, the effects of various flap thicknesses were investigated. Figure 13 indicates the
change of the aerodynamic characteristics of the baseline airfoil and airfoil with a height of 4.5 mm
of the Gurney flaps when the turbulence intensity was 10.5%. As Figure 13 shows, like low
turbulence conditions, after changing the thickness of the Gurney flap under turbulence condition of
10.5%, the aerodynamic characteristics of flapped airfoil almost show no change. The main
difference in the Figure 13d was concentrated in the large lift-to-drag ratio zone, obviously because
the pressure fluctuations caused by the turbulence and the flow separation at the airfoil surface
result in the deviation of the measurement.
-10 -5 0 5 10 15 20 25
-0.5
0.0
0.5
1.0
1.5
2.0
2.5
Flap 9mm*4.5mm
Flap 9mm*3mm
Flap 9mm*1.5mm
Baseline airfoil
Cl
α/ (°) -10 -5 0 5 10 15 20 25
0.02
0.04
0.06
0.08
0.10
0.12
0.14
0.16
0.18
0.20
Flap 9*4.5mm
Flap 9*3mm
Flap 9*1.5mm
Baseline airfoil
Cd
α/ (°)
(a) (b)
Figure 12. Variation of the aerodynamic characteristics with different heights of Gurney flaps(T.I. of 10.5%, Re: 0.8 × 10⁶). (a) Lift coefficient comparison; (b) drag coefficient comparison;(c) pitching-moment coefficient comparison; (d) lift-to-drag ratio comparison.
In addition, the effects of various flap thicknesses were investigated. Figure 13 indicates thechange of the aerodynamic characteristics of the baseline airfoil and airfoil with a height of 4.5 mm ofthe Gurney flaps when the turbulence intensity was 10.5%. As Figure 13 shows, like low turbulenceconditions, after changing the thickness of the Gurney flap under turbulence condition of 10.5%,the aerodynamic characteristics of flapped airfoil almost show no change. The main difference inthe Figure 13d was concentrated in the large lift-to-drag ratio zone, obviously because the pressurefluctuations caused by the turbulence and the flow separation at the airfoil surface result in thedeviation of the measurement.

Appl. Sci. 2020, 10, 7258 13 of 21
Appl. Sci. 2020, 10, 7258 12 of 21
-10 -5 0 5 10 15 20 25
-0.5
0.0
0.5
1.0
1.5
2.0
2.5
Flap 12mm*4.5mm
Flap 9mm*4.5mm
Flap 6mm*4.5mm
Baseline airfoil
Cl
α/ (°)
-10 -5 0 5 10 15 20 25
0.02
0.04
0.06
0.08
0.10
0.12
0.14
0.16
0.18
0.20
Flap 12mm*4.5mm
Flap 9mm*4.5mm
Flap 6mm*4.5mm
Baseline airfoil
Cd
α/ (°)
(a) (b)
-10 -5 0 5 10 15 20 25-0.16
-0.14
-0.12
-0.10
-0.08
-0.06 Flap 12mm*4.5mm
Flap 9mm*4.5mm
Flap 6mm*4.5mm
Baseline airfoil
Cm
α/ (°)
-10 -5 0 5 10 15 20 25
-20
-10
0
10
20
30
40
50
Flap 12mm*4.5mm
Flap 9mm*4.5mm
Flap 6mm*4.5mm
Baseline airfoil
Cl/
Cd
α/ (°)
(c) (d)
Figure 12. Variation of the aerodynamic characteristics with different heights of Gurney flaps (T.I. of
10.5%, Re: 0.8 × 10⁶). (a) Lift coefficient comparison; (b) drag coefficient comparison; (c)
pitching-moment coefficient comparison; (d) lift-to-drag ratio comparison.
In addition, the effects of various flap thicknesses were investigated. Figure 13 indicates the
change of the aerodynamic characteristics of the baseline airfoil and airfoil with a height of 4.5 mm
of the Gurney flaps when the turbulence intensity was 10.5%. As Figure 13 shows, like low
turbulence conditions, after changing the thickness of the Gurney flap under turbulence condition of
10.5%, the aerodynamic characteristics of flapped airfoil almost show no change. The main
difference in the Figure 13d was concentrated in the large lift-to-drag ratio zone, obviously because
the pressure fluctuations caused by the turbulence and the flow separation at the airfoil surface
result in the deviation of the measurement.
-10 -5 0 5 10 15 20 25
-0.5
0.0
0.5
1.0
1.5
2.0
2.5
Flap 9mm*4.5mm
Flap 9mm*3mm
Flap 9mm*1.5mm
Baseline airfoil
Cl
α/ (°) -10 -5 0 5 10 15 20 25
0.02
0.04
0.06
0.08
0.10
0.12
0.14
0.16
0.18
0.20
Flap 9*4.5mm
Flap 9*3mm
Flap 9*1.5mm
Baseline airfoil
Cd
α/ (°)
(a) (b)
Appl. Sci. 2020, 10, 7258 13 of 21
-10 -5 0 5 10 15 20 25-0.16
-0.14
-0.12
-0.10
-0.08
-0.06 Flap 9mm*4.5mm
Flap 9mm*3mm
Flap 9mm*1.5mm
Baseline airfoil
Cm
α/ (°)
-10 -5 0 5 10 15 20 25
-20
-10
0
10
20
30
40
50
Flap 9mm*4.5mm
Flap 9mm*3mm
Flap 9mm*1.5mm
Baseline airfoil
Cl/
Cd
α/ (°)
(c) (d)
Figure 13. Variation of the aerodynamic characteristics with different thicknesses of Gurney flaps
(T.I. of 10.5%, Re: 0.8 × 10⁶). (a) Lift coefficient comparison; (b) drag coefficient comparison; (c)
pitching-moment coefficient comparison; (d) lift-to-drag ratio comparison.
3.5. Experimental Results of Gurney Flap under the 19.0% Turbulence Intensity
To study the aerodynamic characteristics of the Gurney flap under high turbulence conditions,
Figure 14 shows the changes of aerodynamic characteristics under the turbulence condition of 19.0%.
The measured angle of attack ranged from −9.6° to 24.4°. As seen in Figure 14, the presence of
turbulence enhanced the lift coefficient and drag coefficient for all cases. In Figure 14a, with the
increase of turbulence intensity, the maximum lift coefficient continually increased, and the
maximum lift coefficient of the baseline airfoil reaches 1.781 at 18.5 degree, with a 30.00% increase
relative to that under low turbulence condition. The maximum lift coefficients increased by 2.13%,
3.37%, 5.39% at 18.5 degrees, respectively relative to the baseline airfoil, when the heights of the flaps
were 6 mm, 9 mm, and 12 mm. Furthermore, since the pressure fluctuations were determined by the
fluctuation’s energy of the turbulent flow, the fluctuations of lift coefficient were increased relative
to that under the turbulence condition of 10.5%. According to Figure 14b, the drag coefficient of the
baseline airfoil changes more obvious than those under the low turbulence condition. The drag
coefficients were no longer gentle within the range before stall, and it also rises sharply in the stall
state. Such a trend was more noticeable after adding the Gurney flap. For example, at the angle of
attack was 22.4°, the drag coefficients increased by 32.11%, 37.22% and 37.96%, when the flap heights
were 6 mm, 9 mm, and 12 mm respectively. As can be seen from Figure 14c, the Gurney flap also
produced a significant increase in the pitching-moment coefficient and such situation still existed in
turbulent flow condition. Based on Figure 14d, unlike that under the condition of 10.5%, the lift gain
obtained with Gurney flap is, unfortunately, coupled to a larger increase in drag. Adding Gurney
flap with different heights at most of the angles reduces the lift-to-drag relative to the baseline
airfoil, and the Gurney flap doesn’t show obvious effect under the turbulence condition of 19.0%. At
the same time the same situation occurred at other thicknesses of the Gurney flaps.
Figure 13. Variation of the aerodynamic characteristics with different thicknesses of Gurney flaps(T.I. of 10.5%, Re: 0.8 × 10⁶). (a) Lift coefficient comparison; (b) drag coefficient comparison;(c) pitching-moment coefficient comparison; (d) lift-to-drag ratio comparison.
3.5. Experimental Results of Gurney Flap under the 19.0% Turbulence Intensity
To study the aerodynamic characteristics of the Gurney flap under high turbulence conditions,Figure 14 shows the changes of aerodynamic characteristics under the turbulence condition of 19.0%.The measured angle of attack ranged from −9.6◦ to 24.4◦. As seen in Figure 14, the presence ofturbulence enhanced the lift coefficient and drag coefficient for all cases. In Figure 14a, with theincrease of turbulence intensity, the maximum lift coefficient continually increased, and the maximumlift coefficient of the baseline airfoil reaches 1.781 at 18.5 degree, with a 30.00% increase relative to thatunder low turbulence condition. The maximum lift coefficients increased by 2.13%, 3.37%, 5.39% at18.5 degrees, respectively relative to the baseline airfoil, when the heights of the flaps were 6 mm,9 mm, and 12 mm. Furthermore, since the pressure fluctuations were determined by the fluctuation’senergy of the turbulent flow, the fluctuations of lift coefficient were increased relative to that underthe turbulence condition of 10.5%. According to Figure 14b, the drag coefficient of the baseline airfoilchanges more obvious than those under the low turbulence condition. The drag coefficients were nolonger gentle within the range before stall, and it also rises sharply in the stall state. Such a trendwas more noticeable after adding the Gurney flap. For example, at the angle of attack was 22.4◦,the drag coefficients increased by 32.11%, 37.22% and 37.96%, when the flap heights were 6 mm, 9 mm,and 12 mm respectively. As can be seen from Figure 14c, the Gurney flap also produced a significantincrease in the pitching-moment coefficient and such situation still existed in turbulent flow condition.Based on Figure 14d, unlike that under the condition of 10.5%, the lift gain obtained with Gurney flapis, unfortunately, coupled to a larger increase in drag. Adding Gurney flap with different heights atmost of the angles reduces the lift-to-drag relative to the baseline airfoil, and the Gurney flap doesn’t

Appl. Sci. 2020, 10, 7258 14 of 21
show obvious effect under the turbulence condition of 19.0%. At the same time the same situationoccurred at other thicknesses of the Gurney flaps.
Appl. Sci. 2020, 10, 7258 14 of 21
-10 -5 0 5 10 15 20 25
-0.5
0.0
0.5
1.0
1.5
2.0
2.5
Flap 12mm*4.5mm
Flap 9mm*4.5mm
Flap 6mm*4.5mm
Baseline airfoil
Cl
α/ (°)
-10 -5 0 5 10 15 20 250.00
0.04
0.08
0.12
0.16
0.20
0.24
0.28
Flap 12mm*4.5mm
Flap 9mm*4.5mm
Flap 6mm*4.5mm
Baseline airfoilCd
α/ (°)
(a) (b)
-10 -5 0 5 10 15 20 25
-0.18
-0.16
-0.14
-0.12
-0.10
-0.08
Flap 12mm*4.5mm
Flap 9mm*4.5mm
Flap 6mm*4.5mm
Baseline airfoil
Cm
°
-10 -5 0 5 10 15 20 25
-20
-10
0
10
20
30
40
50
Flap 12mm*4.5mm
Flap 9mm*4.5mm
Flap 6mm*4.5mm
Baseline airfoil
Cl/
Cd
α/ (°)
(c) (d)
Figure 14. Variation of the aerodynamic characteristics with different heights of Gurney flaps (T.I. of
19%, Re: 0.8 × 10⁶). (a) Lift coefficient comparison; (b) drag coefficient comparison; (c)
pitching-moment coefficient comparison; (d) lift-to-drag ratio comparison.
Figure 15 exhibits the changes in the aerodynamic characteristics of the baseline airfoil and
airfoil with Gurney flaps of height 4.5mm under the turbulence condition of 19.0%. As can be seen
from it, with the increase of turbulence intensity, obviously, there were more pressure fluctuations.
The curves of flapped airfoils with different thickness no longer overlap totally, in the majority of
angles, the difference from 2% to 5%, though it may sometimes reach 20%.
-15 -10 -5 0 5 10 15 20 25
-0.5
0.0
0.5
1.0
1.5
2.0
2.5
Flap 9mm*4.5mm
Flap 9mm*3mm
Flap 9mm*1.5mm
Baseline airfoil
Cl
α/ (°)
-15 -10 -5 0 5 10 15 20 250.00
0.04
0.08
0.12
0.16
0.20
0.24
0.28
Flap 9mm*4.5mm
Flap 9mm*3mm
Flap 9mm*1.5mm
Baseline airfoil
Cd
α/ (°)
(a) (b)
Figure 14. Variation of the aerodynamic characteristics with different heights of Gurney flaps (T.I. of19%, Re: 0.8 × 10⁶). (a) Lift coefficient comparison; (b) drag coefficient comparison; (c) pitching-momentcoefficient comparison; (d) lift-to-drag ratio comparison.
Figure 15 exhibits the changes in the aerodynamic characteristics of the baseline airfoil andairfoil with Gurney flaps of height 4.5mm under the turbulence condition of 19.0%. As can be seenfrom it, with the increase of turbulence intensity, obviously, there were more pressure fluctuations.The curves of flapped airfoils with different thickness no longer overlap totally, in the majority ofangles, the difference from 2% to 5%, though it may sometimes reach 20%.
Appl. Sci. 2020, 10, 7258 14 of 21
-10 -5 0 5 10 15 20 25
-0.5
0.0
0.5
1.0
1.5
2.0
2.5
Flap 12mm*4.5mm
Flap 9mm*4.5mm
Flap 6mm*4.5mm
Baseline airfoil
Cl
α/ (°)
-10 -5 0 5 10 15 20 250.00
0.04
0.08
0.12
0.16
0.20
0.24
0.28
Flap 12mm*4.5mm
Flap 9mm*4.5mm
Flap 6mm*4.5mm
Baseline airfoilCd
α/ (°)
(a) (b)
-10 -5 0 5 10 15 20 25
-0.18
-0.16
-0.14
-0.12
-0.10
-0.08
Flap 12mm*4.5mm
Flap 9mm*4.5mm
Flap 6mm*4.5mm
Baseline airfoil
Cm
°
-10 -5 0 5 10 15 20 25
-20
-10
0
10
20
30
40
50
Flap 12mm*4.5mm
Flap 9mm*4.5mm
Flap 6mm*4.5mm
Baseline airfoil
Cl/
Cd
α/ (°)
(c) (d)
Figure 14. Variation of the aerodynamic characteristics with different heights of Gurney flaps (T.I. of
19%, Re: 0.8 × 10⁶). (a) Lift coefficient comparison; (b) drag coefficient comparison; (c)
pitching-moment coefficient comparison; (d) lift-to-drag ratio comparison.
Figure 15 exhibits the changes in the aerodynamic characteristics of the baseline airfoil and
airfoil with Gurney flaps of height 4.5mm under the turbulence condition of 19.0%. As can be seen
from it, with the increase of turbulence intensity, obviously, there were more pressure fluctuations.
The curves of flapped airfoils with different thickness no longer overlap totally, in the majority of
angles, the difference from 2% to 5%, though it may sometimes reach 20%.
-15 -10 -5 0 5 10 15 20 25
-0.5
0.0
0.5
1.0
1.5
2.0
2.5
Flap 9mm*4.5mm
Flap 9mm*3mm
Flap 9mm*1.5mm
Baseline airfoil
Cl
α/ (°)
-15 -10 -5 0 5 10 15 20 250.00
0.04
0.08
0.12
0.16
0.20
0.24
0.28
Flap 9mm*4.5mm
Flap 9mm*3mm
Flap 9mm*1.5mm
Baseline airfoil
Cd
α/ (°)
(a) (b)
Figure 15. Cont.

Appl. Sci. 2020, 10, 7258 15 of 21Appl. Sci. 2020, 10, 7258 15 of 21
-15 -10 -5 0 5 10 15 20 25
-0.18
-0.16
-0.14
-0.12
-0.10
-0.08
Flap 9mm*4.5mm
Flap 9mm*3mm
Flap 9mm*1.5mm
Baseline airfoil
Cm
(°)
-15 -10 -5 0 5 10 15 20 25
-20
-10
0
10
20
30
40
50
Flap 9mm*4.5mm
Flap 9mm*3mm
Flap 9mm*1mm
Baseline airfoil
Cl/
Cd
α/ (°)
(c) (d)
Figure 15. Variation of the aerodynamic characteristics with different thicknesses of Gurney flaps
(T.I. of 19%, Re: 0.8 × 10⁶). (a) Lift coefficient comparison; (b)drag coefficient comparison; (c)
pitching-moment coefficient comparison; (d) lift-to-drag ratio comparison.
3.6. Surface Pressure Characteristics
To analyze the mechanism of turbulent inflow coupled with Gurney flap, Figure 16 illustrates
the pressure coefficient distribution of the baseline airfoil and airfoil attached with the Gurney flap
under different turbulent inflow when Reynolds number Re = 0.8 × 10⁶. The x-axis shows the
chord-wise position x/c and the y-axis shows the pressure coefficients Cp. The pressure coefficients
Cp on the airfoil surface were given
i 0
p 2
0
-=
0.5
p pC
U
(7)
where ip is the pressure at the pressure tap of i (i = 1:77),
0p is the free stream static pressure at the
airfoil tested by the Pitot tube, ρ is the air density and0U is the free stream velocity.
Figure 16 illustrates that the pressure coefficients of the baseline airfoil under different
turbulence conditions with small angles were similar to each other. However, with the increase of
angle of attack, the differences become more pronounced at the leading edge. In contrast to the
Gurney flaps, Figure 16a shows that at the angle = −9.6°, the differences between the flapped airfoils
were small. With the increase of the angle of attack, as the angle of −3.6°, compared with the baseline
airfoils, the intersection of the airfoil with Gurney flap moves to the leading edge under different
conditions. Besides, the pressure coefficients (with the angle = −3.6° and 2.4°), the pressure
distribution indicate a larger the pressure difference in the range of 0.8 < x/c < 0.9. When the angle of
attack was 2.4° and 8.4°, both the pressure coefficient absolute values of the baseline airfoil and the
Gurney flap tendency to increase with the increase of turbulence intensity, and the flapped airfoil
becomes more obvious than the baseline airfoil. At a large angle of attack, due to the condition of
stalling (Figure 16e,f), there was significant flow separation both on the suction side of flapped
airfoil and baseline airfoil under uniform inflow. The larger the turbulent inflow, the larger the peak
value on the leading edge of the suction side, and also the larger pressure coefficient on the pressure
side.
Figure 15. Variation of the aerodynamic characteristics with different thicknesses of Gurney flaps (T.I. of19%, Re: 0.8 × 10⁶). (a) Lift coefficient comparison; (b)drag coefficient comparison; (c) pitching-momentcoefficient comparison; (d) lift-to-drag ratio comparison.
3.6. Surface Pressure Characteristics
To analyze the mechanism of turbulent inflow coupled with Gurney flap, Figure 16 illustrates thepressure coefficient distribution of the baseline airfoil and airfoil attached with the Gurney flap underdifferent turbulent inflow when Reynolds number Re = 0.8 × 10⁶. The x-axis shows the chord-wiseposition x/c and the y-axis shows the pressure coefficients Cp. The pressure coefficients Cp on the airfoilsurface were given
Cp =pi − p0
0.5ρU20
(7)
where pi is the pressure at the pressure tap of i (i = 1:77), p0 is the free stream static pressure at theairfoil tested by the Pitot tube, ρ is the air density and U0 is the free stream velocity.Appl. Sci. 2020, 10, x FOR PEER REVIEW 16 of 21
0.0 0.2 0.4 0.6 0.8 1.01.51.00.50.0-0.5-1.0-1.5-2.0-2.5-3.0
Baseline, T.I.=0.2% Baseline, T.I.=10.5% Baseline, T.I.=19.0%
AOA=-9.6°
Cp
x/c 0.0 0.2 0.4 0.6 0.8 1.0
1.51.00.50.0-0.5-1.0-1.5-2.0-2.5-3.0
Baseline, T.I.=0.2% Flap 9mm*4.5mm,T.I.=0.2%
AOA=-9.6°
Cp
x/c0.0 0.2 0.4 0.6 0.8 1.0
1.51.00.50.0-0.5-1.0-1.5-2.0-2.5-3.0
Baseline, T.I.=10.5% Flap 9mm*4.5mm,T.I.=10.5%
AOA=-9.6°
Cp
x/c0.0 0.2 0.4 0.6 0.8 1.0
1.51.00.50.0-0.5-1.0-1.5-2.0-2.5-3.0
Baseline, T.I.=19.0% Flap 9mm*4.5mm,T.I.=19.0%
AOA=-9.6°
Cp
x/c (a)
(b)
(c)
(d)
(e)
Figure 16. Cont.
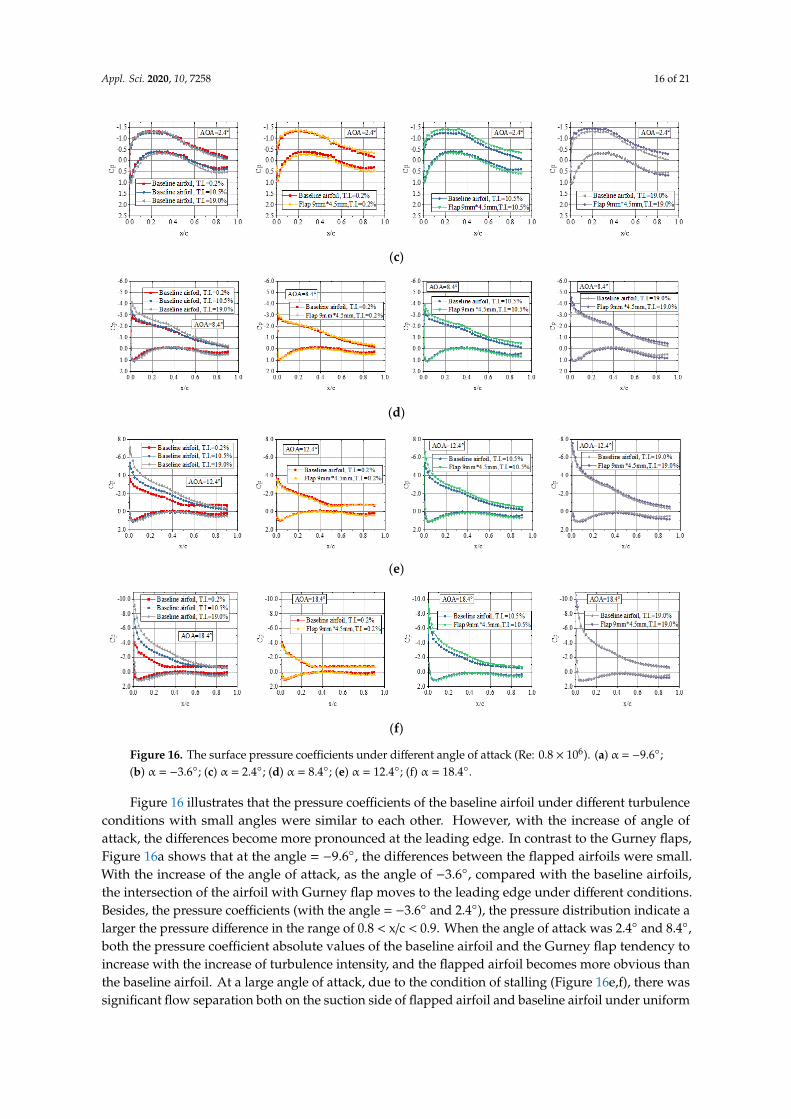
Appl. Sci. 2020, 10, 7258 16 of 21
Appl. Sci. 2020, 10, 7258 16 of 21
0.0 0.2 0.4 0.6 0.8 1.01.51.00.50.0-0.5-1.0-1.5-2.0-2.5-3.0
Baseline, T.I.=0.2% Baseline, T.I.=10.5% Baseline, T.I.=19.0%
AOA=-9.6°
Cp
x/c0.0 0.2 0.4 0.6 0.8 1.0
1.51.00.50.0-0.5-1.0-1.5-2.0-2.5-3.0
Baseline, T.I.=0.2% Flap 9mm*4.5mm,T.I.=0.2%
AOA=-9.6°
Cp
x/c0.0 0.2 0.4 0.6 0.8 1.0
1.51.00.50.0-0.5-1.0-1.5-2.0-2.5-3.0
Baseline, T.I.=10.5% Flap 9mm*4.5mm,T.I.=10.5%
AOA=-9.6°
Cp
x/c0.0 0.2 0.4 0.6 0.8 1.0
1.51.00.50.0-0.5-1.0-1.5-2.0-2.5-3.0
Baseline, T.I.=19.0% Flap 9mm*4.5mm,T.I.=19.0%
AOA=-9.6°
Cp
x/c (a)
(b)
(c)
(d)
(e)
(f)
Figure 16. The surface pressure coefficients under different angle of attack (Re: 0.8 × 10⁶). (a) α = −9.6◦;(b) α = −3.6◦; (c) α = 2.4◦; (d) α = 8.4◦; (e) α = 12.4◦; (f) α = 18.4◦.
Figure 16 illustrates that the pressure coefficients of the baseline airfoil under different turbulenceconditions with small angles were similar to each other. However, with the increase of angle ofattack, the differences become more pronounced at the leading edge. In contrast to the Gurney flaps,Figure 16a shows that at the angle = −9.6◦, the differences between the flapped airfoils were small.With the increase of the angle of attack, as the angle of −3.6◦, compared with the baseline airfoils,the intersection of the airfoil with Gurney flap moves to the leading edge under different conditions.Besides, the pressure coefficients (with the angle = −3.6◦ and 2.4◦), the pressure distribution indicate alarger the pressure difference in the range of 0.8 < x/c < 0.9. When the angle of attack was 2.4◦ and 8.4◦,both the pressure coefficient absolute values of the baseline airfoil and the Gurney flap tendency toincrease with the increase of turbulence intensity, and the flapped airfoil becomes more obvious thanthe baseline airfoil. At a large angle of attack, due to the condition of stalling (Figure 16e,f), there wassignificant flow separation both on the suction side of flapped airfoil and baseline airfoil under uniform

Appl. Sci. 2020, 10, 7258 17 of 21
inflow. The larger the turbulent inflow, the larger the peak value on the leading edge of the suctionside, and also the larger pressure coefficient on the pressure side.
As seen from the above, the influence of turbulent inflow coupled with Gurney flap on thepressure coefficients of airfoil was complicated. Turbulent inflow changes the flow around the airfoilsurface and restrains the flow separation, after attaching the Gurney flap, the pressure distribution onboth suction and pressure sides changed more significantly. Especially in the turbulence condition,the trailing edge pressure distributions were farther apart for the flapped airfoil. In these situations,the increased peak values of pressure coefficients at the leading edge increased the integral area of thepressure coefficients, so the lift force was therefore increased.
3.7. Wake Profile Characteristics
Figure 17 presents the distribution of wake velocity measured by the wake rake array underuniform inflow. As can be observed, when the angle of attack was 8.4◦, which was before the stallangle of attack, the wake of airfoil with the Gurney flap was inclined to the pressure side of the airfoil.When the angle of attack was 11.4◦, which was after the stall angle, the Gurney flap weaken the abilityof the wake position deflection. Moreover, the wake velocity deficit was significantly increased, and theGurney flap began to have side effects on the aerodynamic characteristics of the airfoil. The higher theGurney flap is, the larger the wake velocity deficit is, so it indicates a higher mean drag.
Appl. Sci. 2020, 10, 7258 17 of 21
Figure 16. The surface pressure coefficients under different angle of attack (Re: 0.8 × 10⁶). (a) α =
−9.6°; (b) α = −3.6°; (c) α = 2.4°; (d) α = 8.4°; (e) α = 12.4°; (f) α = 18.4°.
As seen from the above, the influence of turbulent inflow coupled with Gurney flap on the
pressure coefficients of airfoil was complicated. Turbulent inflow changes the flow around the airfoil
surface and restrains the flow separation, after attaching the Gurney flap, the pressure distribution
on both suction and pressure sides changed more significantly. Especially in the turbulence
condition, the trailing edge pressure distributions were farther apart for the flapped airfoil. In these
situations, the increased peak values of pressure coefficients at the leading edge increased the
integral area of the pressure coefficients, so the lift force was therefore increased.
3.7. Wake Profile Characteristics
Figure 17 presents the distribution of wake velocity measured by the wake rake array under
uniform inflow. As can be observed, when the angle of attack was 8.4°, which was before the stall
angle of attack, the wake of airfoil with the Gurney flap was inclined to the pressure side of the
airfoil. When the angle of attack was 11.4°, which was after the stall angle, the Gurney flap weaken
the ability of the wake position deflection. Moreover, the wake velocity deficit was significantly
increased, and the Gurney flap began to have side effects on the aerodynamic characteristics of the
airfoil. The higher the Gurney flap is, the larger the wake velocity deficit is, so it indicates a higher
mean drag.
-0.4 -0.2 0.0 0.2 0.4
0.5
0.6
0.7
0.8
0.9
1.0
Baseline airfoil,T.I.=0.2%
Flap 6mm*4.5mm,T.I.=0.2%
Flap 9mm*4.5mm,T.I.=0.2%
Flap 12mm*4.5mm,T.I.=0.2%
AOA=8.4°
u/U
X(m)
-0.4 -0.2 0.0 0.2 0.4
0.5
0.6
0.7
0.8
0.9
1.0
Baseline airfoil,T.I.=0.2%
Flap 6mm*4.5mm,T.I.=0.2%
Flap 9mm*4.5mm,T.I.=0.2%
Flap 12mm*4.5mm,T.I.=0.2%
AOA=11.4°
u/U
X(m)
(a) (b)
Figure 17. The wake velocity measured by the wake rake array (uniform inflow, Re: 0.8 × 10⁶). (a) α =
8.4°; (b) α = 11.4°.
By comparing the flows in the near trailing edge region of the airfoil with Gurney flap. The
resultant velocity distribution of the baseline airfoil and the airfoil attached with Gurney flap (9 mm
in height and 4.5 mm in thickness) at the angle of attack 8.4° (before the stall angle) and 11.4° (after
the stall angle) under uniform inflow were depicted in Figure 18. The vertical direction Y denoted
the forward distance from the hot-wire probe to the trailing edge, and the horizontal direction X
denoted the lateral distance from the hot-wire probe to the trailing edge. As shown in Figure 18, the
black solid spots were the actual measurement positions by using the electronically controlled
traverser. As shown, the wake flows shift to the pressure side in both the two situations. When the
angle of attack was 8.4°, the airfoil with Gurney flap had a larger velocity deficit than the baseline
airfoil, which suggests an increased drag. When the angle of attack was 11.4°, the velocity deficit of
the baseline airfoil was also less than the Gurney flap, but there was no obvious difference between
the offset direction caused by the flapped airfoil and the baseline airfoil which were being similar to
the far field results measured by the wake rake array.
Figure 17. The wake velocity measured by the wake rake array (uniform inflow, Re: 0.8 × 10⁶).(a) α = 8.4◦; (b) α = 11.4◦.
By comparing the flows in the near trailing edge region of the airfoil with Gurney flap. The resultantvelocity distribution of the baseline airfoil and the airfoil attached with Gurney flap (9 mm in heightand 4.5 mm in thickness) at the angle of attack 8.4◦ (before the stall angle) and 11.4◦ (after the stallangle) under uniform inflow were depicted in Figure 18. The vertical direction Y denoted the forwarddistance from the hot-wire probe to the trailing edge, and the horizontal direction X denoted the lateraldistance from the hot-wire probe to the trailing edge. As shown in Figure 18, the black solid spotswere the actual measurement positions by using the electronically controlled traverser. As shown,the wake flows shift to the pressure side in both the two situations. When the angle of attack was 8.4◦,the airfoil with Gurney flap had a larger velocity deficit than the baseline airfoil, which suggests anincreased drag. When the angle of attack was 11.4◦, the velocity deficit of the baseline airfoil was alsoless than the Gurney flap, but there was no obvious difference between the offset direction caused bythe flapped airfoil and the baseline airfoil which were being similar to the far field results measured bythe wake rake array.

Appl. Sci. 2020, 10, 7258 18 of 21Appl. Sci. 2020, 10, 7258 18 of 21
-3 -2 -1 0 1 2 3
4.0
3.5
3.0
2.5
2.0
1.5
1.0
0.5
0.0
Y(c
m)
X(cm)
-3 -2 -1 0 1 2 3
4.0
3.5
3.0
2.5
2.0
1.5
1.0
0.5
0.0
m/s
Y(c
m)
X(cm)
2.500
4.625
6.750
8.875
11.00
13.13
15.25
17.38
19.50
(a) (b)
-3 -2 -1 0 1 2 3 4 5 6
4.0
3.5
3.0
2.5
2.0
1.5
1.0
0.5
0.0
Y(c
m)
X(cm) -3 -2 -1 0 1 2 3 4 5 6
4.0
3.5
3.0
2.5
2.0
1.5
1.0
0.5
0.0
m/s
Y(c
m)
X(cm)
7.000
8.500
10.00
11.50
13.00
14.50
16.00
17.50
19.00
(c) (d)
Figure 18. Velocity distribution of the region behind trailing edge (uniform inflow, Re: 0.8 × 10⁶). (a)
α = 8.4°, baseline airfoil; (b) α = 8.4°, Gurney flap 9 mm × 4.5 mm; (c) α = 11.4°, baseline airfoil; (d) α =
11.4°, Gurney flap 9 mm × 4.5 mm.
Figure 19 presents the power density spectrum measured by the region 1 cm directly behind the
trailing edge under uniform inflow. As can be observed, at the angle of attack 8.4°, both along-wind
and across-wind display an obvious peak in the power density spectrum, meanwhile the
across-wind energy increased in the flapped airfoil. It indicates there are counter rotating vortices
generated by the Gurney flap, while the wake of baseline airfoil does not show the existence of
vortex shedding [33]. Gurney flaps also have a wake structure similar to the Karman vortex street
behind the cylinder at bigger Reynolds number (i.e., of 0.8 × 10⁶), the flow oscillations were caused
by the separating of the shear layer on the pressure side and suction side of the trailing edge. The
Karman vortex street both can be found in uniform flow and turbulent flow, so the increased lift
produced by the Gurney flap seems can be explained in turbulent flow condition, either. Moreover,
from the lift coefficients shown above, the size of structures was affected by turbulence level.
Besides, as compared with the reference data under similar condition [33], with the increase of the
Reynolds number, from Re = 1 × 10⁵ to 0.8 × 10⁶, the Strouhal number decreased from 0.151 (Re: 1 ×
105, 2% chord length) to 0.128 (Re: 2 × 10⁵, 2% chord length) and to 0.088 (Re: 0.8 × 10⁶, 1.5% chord
length).
Figure 18. Velocity distribution of the region behind trailing edge (uniform inflow, Re: 0.8 × 10⁶).(a) α = 8.4◦, baseline airfoil; (b) α = 8.4◦, Gurney flap 9 mm × 4.5 mm; (c) α = 11.4◦, baseline airfoil;(d) α = 11.4◦, Gurney flap 9 mm × 4.5 mm.
Figure 19 presents the power density spectrum measured by the region 1 cm directly behind thetrailing edge under uniform inflow. As can be observed, at the angle of attack 8.4◦, both along-windand across-wind display an obvious peak in the power density spectrum, meanwhile the across-windenergy increased in the flapped airfoil. It indicates there are counter rotating vortices generated by theGurney flap, while the wake of baseline airfoil does not show the existence of vortex shedding [33].Gurney flaps also have a wake structure similar to the Karman vortex street behind the cylinder atbigger Reynolds number (i.e., of 0.8 × 10⁶), the flow oscillations were caused by the separating of theshear layer on the pressure side and suction side of the trailing edge. The Karman vortex street bothcan be found in uniform flow and turbulent flow, so the increased lift produced by the Gurney flapseems can be explained in turbulent flow condition, either. Moreover, from the lift coefficients shownabove, the size of structures was affected by turbulence level. Besides, as compared with the referencedata under similar condition [33], with the increase of the Reynolds number, from Re = 1 × 10⁵ to0.8 × 106, the Strouhal number decreased from 0.151 (Re: 1 × 10⁵, 2% chord length) to 0.128 (Re: 2 × 105,2% chord length) and to 0.088 (Re: 0.8 × 10⁶, 1.5% chord length).
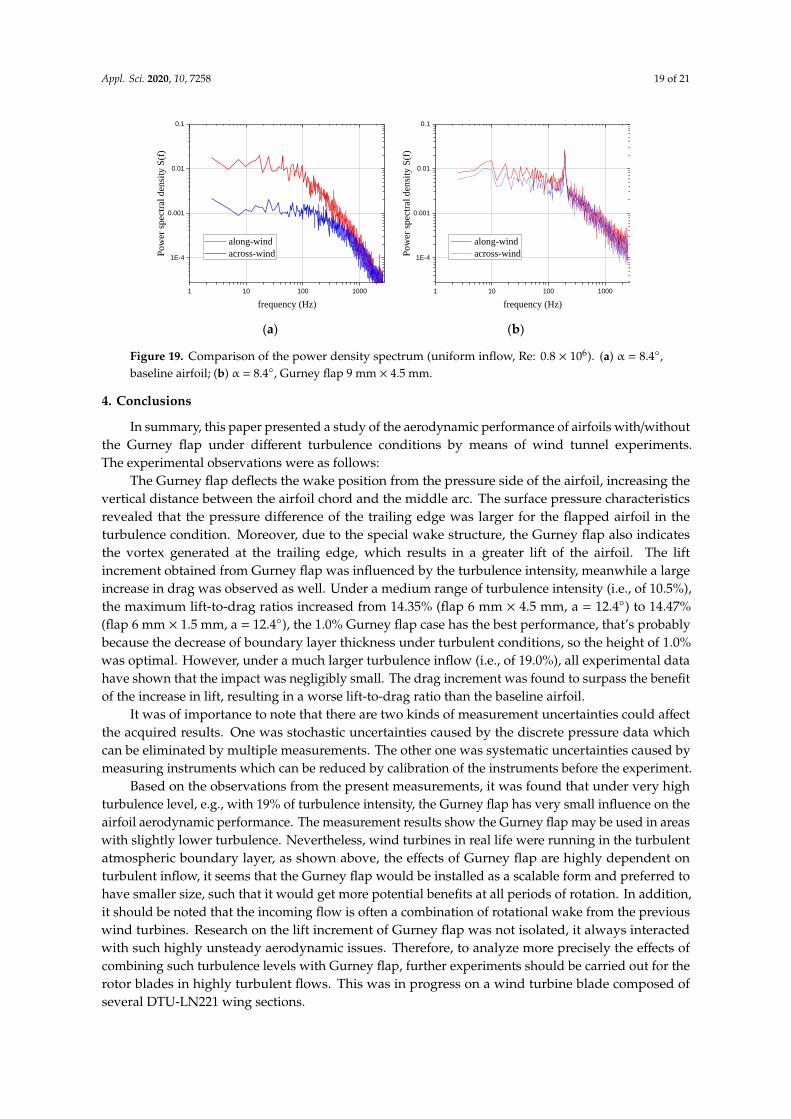
Appl. Sci. 2020, 10, 7258 19 of 21Appl. Sci. 2020, 10, 7258 19 of 21
1 10 100 1000
1E-4
0.001
0.01
0.1
Po
wer
sp
ectr
al d
ensi
ty S
(f)
frequency (Hz)
along-wind
across-wind
1 10 100 1000
1E-4
0.001
0.01
0.1
Po
wer
sp
ectr
al d
ensi
ty S
(f)
frequency (Hz)
along-wind
across-wind
(a) (b)
Figure 19. Comparison of the power density spectrum (uniform inflow, Re: 0.8 × 10⁶). (a) α = 8.4°,
baseline airfoil; (b) α = 8.4°, Gurney flap 9 mm × 4.5 mm.
4. Conclusions
In summary, this paper presented a study of the aerodynamic performance of airfoils
with/without the Gurney flap under different turbulence conditions by means of wind tunnel
experiments. The experimental observations were as follows:
The Gurney flap deflects the wake position from the pressure side of the airfoil, increasing the
vertical distance between the airfoil chord and the middle arc. The surface pressure characteristics
revealed that the pressure difference of the trailing edge was larger for the flapped airfoil in the
turbulence condition. Moreover, due to the special wake structure, the Gurney flap also indicates the
vortex generated at the trailing edge, which results in a greater lift of the airfoil. The lift increment
obtained from Gurney flap was influenced by the turbulence intensity, meanwhile a large increase in
drag was observed as well. Under a medium range of turbulence intensity (i.e., of 10.5%), the
maximum lift-to-drag ratios increased from 14.35% (flap 6 mm × 4.5 mm, a = 12.4°) to 14.47% (flap 6
mm × 1.5 mm, a = 12.4°), the 1.0% Gurney flap case has the best performance, that’s probably because
the decrease of boundary layer thickness under turbulent conditions, so the height of 1.0% was
optimal. However, under a much larger turbulence inflow (i.e., of 19.0%), all experimental data have
shown that the impact was negligibly small. The drag increment was found to surpass the benefit of
the increase in lift, resulting in a worse lift-to-drag ratio than the baseline airfoil.
It was of importance to note that there are two kinds of measurement uncertainties could affect
the acquired results. One was stochastic uncertainties caused by the discrete pressure data which can
be eliminated by multiple measurements. The other one was systematic uncertainties caused by
measuring instruments which can be reduced by calibration of the instruments before the
experiment.
Based on the observations from the present measurements, it was found that under very high
turbulence level, e.g., with 19% of turbulence intensity, the Gurney flap has very small influence on
the airfoil aerodynamic performance. The measurement results show the Gurney flap may be used
in areas with slightly lower turbulence. Nevertheless, wind turbines in real life were running in the
turbulent atmospheric boundary layer, as shown above, the effects of Gurney flap are highly
dependent on turbulent inflow, it seems that the Gurney flap would be installed as a scalable form
and preferred to have smaller size, such that it would get more potential benefits at all periods of
rotation. In addition, it should be noted that the incoming flow is often a combination of rotational
wake from the previous wind turbines. Research on the lift increment of Gurney flap was not
isolated, it always interacted with such highly unsteady aerodynamic issues. Therefore, to analyze
more precisely the effects of combining such turbulence levels with Gurney flap, further
experiments should be carried out for the rotor blades in highly turbulent flows. This was in
progress on a wind turbine blade composed of several DTU-LN221 wing sections.
Figure 19. Comparison of the power density spectrum (uniform inflow, Re: 0.8 × 10⁶). (a) α = 8.4◦,baseline airfoil; (b) α = 8.4◦, Gurney flap 9 mm × 4.5 mm.
4. Conclusions
In summary, this paper presented a study of the aerodynamic performance of airfoils with/withoutthe Gurney flap under different turbulence conditions by means of wind tunnel experiments.The experimental observations were as follows:
The Gurney flap deflects the wake position from the pressure side of the airfoil, increasing thevertical distance between the airfoil chord and the middle arc. The surface pressure characteristicsrevealed that the pressure difference of the trailing edge was larger for the flapped airfoil in theturbulence condition. Moreover, due to the special wake structure, the Gurney flap also indicatesthe vortex generated at the trailing edge, which results in a greater lift of the airfoil. The liftincrement obtained from Gurney flap was influenced by the turbulence intensity, meanwhile a largeincrease in drag was observed as well. Under a medium range of turbulence intensity (i.e., of 10.5%),the maximum lift-to-drag ratios increased from 14.35% (flap 6 mm × 4.5 mm, a = 12.4◦) to 14.47%(flap 6 mm × 1.5 mm, a = 12.4◦), the 1.0% Gurney flap case has the best performance, that’s probablybecause the decrease of boundary layer thickness under turbulent conditions, so the height of 1.0%was optimal. However, under a much larger turbulence inflow (i.e., of 19.0%), all experimental datahave shown that the impact was negligibly small. The drag increment was found to surpass the benefitof the increase in lift, resulting in a worse lift-to-drag ratio than the baseline airfoil.
It was of importance to note that there are two kinds of measurement uncertainties could affectthe acquired results. One was stochastic uncertainties caused by the discrete pressure data whichcan be eliminated by multiple measurements. The other one was systematic uncertainties caused bymeasuring instruments which can be reduced by calibration of the instruments before the experiment.
Based on the observations from the present measurements, it was found that under very highturbulence level, e.g., with 19% of turbulence intensity, the Gurney flap has very small influence on theairfoil aerodynamic performance. The measurement results show the Gurney flap may be used in areaswith slightly lower turbulence. Nevertheless, wind turbines in real life were running in the turbulentatmospheric boundary layer, as shown above, the effects of Gurney flap are highly dependent onturbulent inflow, it seems that the Gurney flap would be installed as a scalable form and preferred tohave smaller size, such that it would get more potential benefits at all periods of rotation. In addition,it should be noted that the incoming flow is often a combination of rotational wake from the previouswind turbines. Research on the lift increment of Gurney flap was not isolated, it always interactedwith such highly unsteady aerodynamic issues. Therefore, to analyze more precisely the effects ofcombining such turbulence levels with Gurney flap, further experiments should be carried out for therotor blades in highly turbulent flows. This was in progress on a wind turbine blade composed ofseveral DTU-LN221 wing sections.
Appl. Sci. 2020, 10, 7258 20 of 21
Author Contributions: Conceptualization, J.Y.; conducted the data collection, J.Y. and Y.Y.; funding acquisition,H.Y.; supervision, N.L., H.Y. and W.Z.; formal analysis, J.Y., H.Y., W.Z.; writing—original draft preparation,J.Y.; writing—review and editing, H.Y., W.Z.; All authors have read and agreed to the published version ofthe manuscript.
Funding: This research was funded by Postgraduate Research & Practice Innovation Program of Jiangsu Provinceunder grant number KYCX19_2104 and Youth Fund Project of Jiangsu Natural Science Foundation under grantnumber BK20170510.
Acknowledgments: The authors wish to express acknowledgement to the Postgraduate Research &PracticeInnovation Program of Jiangsu Province under grant number KYCX19_2104 and Youth Fund Project of JiangsuNatural Science Foundation under grant number BK20170510.
Conflicts of Interest: The authors declare no conflict of interest.
References
1. Liebeck, R.H. Design of subsonic airfoils for high lift. J. Aircr. 1978, 15, 547–561. [CrossRef]2. Amini, Y.; Emdad, H.; Farid, M. Adjoint shape optimization of airfoils with attached Gurney flap.
Aerosp. Sci. Technol. 2015, 41, 216–228. [CrossRef]3. Xu, H.R.; Yang, H.; Liu, C. Numerical value analysis on aerodynamic performance of DU series airfoil with
thickened trailing edge. Trans. Chin. Soc. Agric. Eng. 2014, 30, 101–108.4. Yashodhar, V.; Humrutha, G.; Kaushik, M.; Khan, S.A. CFD Studies on Triangular Micro-Vortex Generators
in Flow Control. In IOP Conference Series: Materials Science and Engineering; IOP Publishing: Bristol, UK, 2017;Volume 184, p. 012007.
5. Lee, T.; Su, Y.Y. Unsteady airfoil with a harmonically deflected trailing-edge flap. J. Fluids Struct. 2011, 27,1411–1424. [CrossRef]
6. Seyednia, M.; Masdari, M.; Vakilipour, S. The influence of oscillating trailing-edge flap on the dynamic stallcontrol of a pitching wind turbine airfoil. J. Braz. Soc. Mech. Sci. Eng. 2019, 41, 192. [CrossRef]
7. Lu, W.S.; Tian, Y.; Liu, P.P. Aerodynamic optimization and mechanism design of flexible variable cambertrailing-edge flap. Chin. J. Aeronaut. 2017, 30, 988–1003. [CrossRef]
8. Zhang, W.G.; Bai, X.J.; Wang, Y.F.; Han, Y.; Hu, Y. Optimization of sizing parameters and multi-objectivecontrol of trailing edge flaps on a smart rotor. Renew. Energy 2018, 129, 75–91. [CrossRef]
9. Zhang, H.; Zhao, Z.D.; Zhou, G.X.; Kang, S. Experimental investigation of the effect of Gurney flap onDU93-W-210 airfoil aerodynamics performance. Acta Energ. Solaris Sinica 2017, 38, 601–606.
10. Amini, Y.; Liravi, M.; Izadpanah, E. The effects of Gurney flap on the aerodynamic performance of NACA0012 airfoil in the rarefied gas flow. Comput. Fluids 2018, 170, 93–105. [CrossRef]
11. Lee, T.; Su, Y.Y. Lift enhancement and flow structure of airfoil with joint trailing-edge flap and Gurney flap.Exp. Fluids 2011, 50, 1671–1684. [CrossRef]
12. Chen, Z.J.; Stol, K.A.; Mace, B.R. Wind turbine blade optimization with individual pitch and trailing edgeflap control. Renew. Energy 2016, 103, 750–765. [CrossRef]
13. Medina, A.; Ol, M.V.; Mancini, P.; Jones, A. Revisiting Conventional Flaps at High Deflection Rate. AIAA J.2017, 55, 1–10. [CrossRef]
14. Elsayed, O.A.; Asrar, W.; Omar, A.A.; Kwon, K.; Jung, H.J. Experimental Investigation of Plain andFlapped-Wing Tip Vortex. J. Aircr. 2009, 46, 254–262. [CrossRef]
15. Little, J.; Nishihara, M.; Adamovich, I.; Saminy, M. High-lift airfoil trailing edge separation control using asingle dielectric barrier discharge plasma actuator. Exp. Fluids 2010, 48, 521–537. [CrossRef]
16. Bergami, L.; Poulsen, N.K. A smart rotor configuration with linear quadratic control of adaptive trailingedge flaps for active load alleviation. Wind Energy 2015, 18, 625–641. [CrossRef]
17. Edward, T.; Christoph, B. Upstream shear-layer stabilization via self-oscillating trailing edge flaplets.Exp. Fluids 2018, 59, 145.
18. Straub, F.K.; Anand, V.R.; Lau, B.H.; Birchette, T.S. Wind Tunnel Test of the SMART Active Flap Rotor. J. Am.Helicopter Soc. 2018, 63, 012002. [CrossRef]
19. Traub, L.W. Prediction of Gurney-Flap Lift Enhancement for Airfoils and Wings. AIAA J. 2014, 52, 2087–2090.[CrossRef]
20. Lario, A.; Arina, R. Discontinuous Galerkin Method for the Study of Active Gurney Flaps. J. Aircr. 2017, 54,1–11. [CrossRef]
Appl. Sci. 2020, 10, 7258 21 of 21
21. Li, C.F.; Xu, Y.; Zhao, X.L.; Xu, J.Z. Analysis on Dynamic Performance Trailing Edge Flap on WindTurbine Airfoil. J. Eng. Thermophys. 2014, 35, 883–887.
22. Zhu, W.J.; Behrens, T.; Shen, W.Z.; Sørensen, J.N. Hybrid Immersed Boundary Method for Airfoils with aTrailing-Edge Flap. AIAA J. 2013, 51, 30–41. [CrossRef]
23. Ng, B.F.; Palacios, R.; Kerrigan, E.C.; Graham, J.M.R.; Hesse, H. Aerodynamic load control in horizontal axiswind turbines with combined aeroelastic tailoring and trailing edge flaps. Wind Energy 2016, 19, 243–263.[CrossRef]
24. Colman, J.; Marañón Di Leo, J.; Delnero, J.S.; Martinez, M.; Boldes, U.; Bacchi, F. Lift and drag coefficientsbehaviour at low Reynolds number in an airfoil with Gurney flap submitted to a turbulent flow: Part 1.Lat. Am. Appl. Res. 2008, 38, 195–200.
25. Di Leo, J.M.; Martínez, M.A.; Delnero, J.S.; Saínz, M.G. Experimental study of the effect of the wake generatedby oscillating Gurney flap. Lat. Am. Appl. Res. 2019, 49, 289–296.
26. Li, W.J.; Zhang, P.; Yang, S.F.; Fu, X.H.; Xiao, Y. An Experimental Method for Generating Shear-Free TurbulenceUsing Horizontal Oscillating Grids. Water 2020, 12, 591. [CrossRef]
27. Cheng, J.T.; Zhu, W.J.; Fischer, A.; García, N.R.; Madsen, J.; Chen, J.; Shen, W.Z. Design and validation of thehigh performance and low noise CQU-DTU-LN1 airfoils. Wind Energy 2013, 17, 1817–1833. [CrossRef]
28. ROHA. LSWT Campaign Report on DTU-C21; LM Internal Report: Jupitervej, Denmark, 2012.29. Allen, H.J.; Vlncenti, W.G. Wall Interference in a Two-Dimensional Flow Wind Tunnel, with Consideration of
the effect of Compressibility. NACA Rep. 1944, 782, 155–184.30. Timmer, W.A.; van Rooij, R.P.J.O.M. Summary of the Delft University Wind Turbine Dedicated Airfoils. J. Sol.
Energy Eng. 2003, 125, 11–21. [CrossRef]31. Llorente, E.; Gorostidi, A.; Jacobs, M.; Timmer, W.A.; Munduate, A.; Pires, A. Wind Tunnel Tests of Wind
Turbine Airfoils at High Reynolds Numbers. J. Phys. Conf. 2014, 524, 012012. [CrossRef]32. Pires, O.; Munduate, X.; Ceyhan, O.; Jacobs, M.; Madsen, J.; Schepers, J.G. Analysis of the high Reynolds
number 2D tests on a wind turbine airfoil performed at two different wind tunnels. J. Phys. Conf. Ser. 2016,749, 012014. [CrossRef]
33. Troolin, D.R. A Quantitative Study of the Lift-Enhancing Flow Field Generated by an Airfoil with aGurney Flap. Ph.D. Dissertation, University of Minnesota, Minnesota, MN, USA, 2009.
Publisher’s Note: MDPI stays neutral with regard to jurisdictional claims in published maps and institutionalaffiliations.
© 2020 by the authors. Licensee MDPI, Basel, Switzerland. This article is an open accessarticle distributed under the terms and conditions of the Creative Commons Attribution(CC BY) license (http://creativecommons.org/licenses/by/4.0/).