Experimental Study of Aerodynamic Performance for Finite Wing at Low Reynolds Numbers
13
Experimental Study of Aerodynamic Performance for Finite Wing at Low Reynolds Numbers Fei-Bin Hsiao 1 , Chia-Yuan Chang 2 , Cheng-Chiang Hsu 3 and Di-Bao Wang 4 1,2,4 Institute of Aeronautics and Astronautics National Chen Kung University, Tainan, Taiwan, R.O.C. 3 Air Force Aeronautic Technique School, Kaohsiung, Taiwan, R.O.C. ABSTRACT This paper studies the aerodynamic performance of a finite wing at low Reynolds numbers through wind tunnel experiments. The 3-component force/moment balance and surface oil-flow technique are respectively used to investigate the aerodynamic performance and flow field characteristics about the wing. Results indicate that three different Reynolds number modes of the aerodynamic performance are found as functions of the Reynolds number and the angle of attack in the operating ranges. That is, the subcritical, critical and supercritical behavior of the aerodynamic performance of the wing can be characterized in terms of the Reynolds number and angle of attack. For the tested wings of lower aspect ratio, the 3-dimensional, tip-vortex effect is more significant in influencing the aerodynamic performance, and this is also witnessed by the oil-flow visualization. Key Words: Low Reynolds number, Finite wing aerodynamics, Aerodynamic performance Nomenclature Re = Reynolds number of wing chord α = angle of attack L C = lift coefficient [lift force/ (dynamic pressure* wing area) ] D C = drag coefficient [drag force/ (dynamic pressure* wing area) ] M C = pitching moment coefficient [drag force/ (dynamic pressure* wing area* wing chord) ] (L/D) = lift-to–drag ratio [ / C ] L C D AR = aspect ratio [ square of wing span / wing area ] α L C = slope of lift coefficient [ ∂ ] α ∂ / L C
Transcript of Experimental Study of Aerodynamic Performance for Finite Wing at Low Reynolds Numbers

Experimental Study of Aerodynamic Performance for Finite Wing at Low Reynolds Numbers
Fei-Bin Hsiao1, Chia-Yuan Chang2, Cheng-Chiang Hsu3 and Di-Bao Wang4
1,2,4 Institute of Aeronautics and Astronautics National Chen Kung University, Tainan, Taiwan, R.O.C.
3Air Force Aeronautic Technique School, Kaohsiung, Taiwan, R.O.C. ABSTRACT
This paper studies the aerodynamic performance of a finite wing at low Reynolds numbers through wind tunnel experiments. The 3-component force/moment balance and surface oil-flow technique are respectively used to investigate the aerodynamic performance and flow field characteristics about the wing. Results indicate that three different Reynolds number modes of the aerodynamic performance are found as functions of the Reynolds number and the angle of attack in the operating ranges. That is, the subcritical, critical and supercritical behavior of the aerodynamic performance of the wing can be characterized in terms of the Reynolds number and angle of attack. For the tested wings of lower aspect ratio, the 3-dimensional, tip-vortex effect is more significant in influencing the aerodynamic performance, and this is also witnessed by the oil-flow visualization. Key Words: Low Reynolds number, Finite wing aerodynamics, Aerodynamic performance
Nomenclature Re = Reynolds number of wing chord α = angle of attack
LC = lift coefficient [lift force/ (dynamic pressure* wing area) ]
DC = drag coefficient [drag force/ (dynamic pressure* wing area) ]
MC = pitching moment coefficient [drag force/ (dynamic pressure* wing area* wing chord) ]
(L/D) = lift-to–drag ratio [ /C ] LC D
AR = aspect ratio [ square of wing span / wing area ]
αLC = slope of lift coefficient [∂ ] α∂/LC

1. INTRODUCTION
In recent years, Micro Aerial Vehicle (MAV) has become one of the most important research topics in the field of aerodynamics (Gad-el-Hak,2001). In the early development of MAV, their general size was about 60 cm in wingspan. However, MAV nowadays can be as small as 15 cm or less in all dimensions. According to the definition given by Defense Advanced Research Program Agency (DARPA), MAV is a palm-size unmanned aerial vehicle, which is smaller than 15 cm, and the flight speed varies from 10 to 20m/s, causing the flight Reynolds number to be as low as 105 or less. Inevitably, the flow characteristics, wing performance and vehicle stability in this low Reynolds numbers and low aspect ratios are of great importance in the research and development of the MAVs for practical applications (Torres, G.E., and Mueller, T.J.,2000)( Hsiao, F. B. et al, 2000).
According to the flow behavior and the existence of the separation bubble on the surface of an airfoil in the low Reynolds number ranges, one can characterize three different Reynolds-number modes with corresponding aerodynamic properties ( Ward, J. W.,1963)( LeBalanc, P. et al, 1986),( Mueller, T. J. and Jansen, B. J.,1982) (Hsiao, F. B., Liu, C. F. and Shyu,1990), as following:
(a) Subcritical Reynolds number (Re < 104): The laminar boundary layer separation may occur without reattachment in the region of adverse pressure gradient.
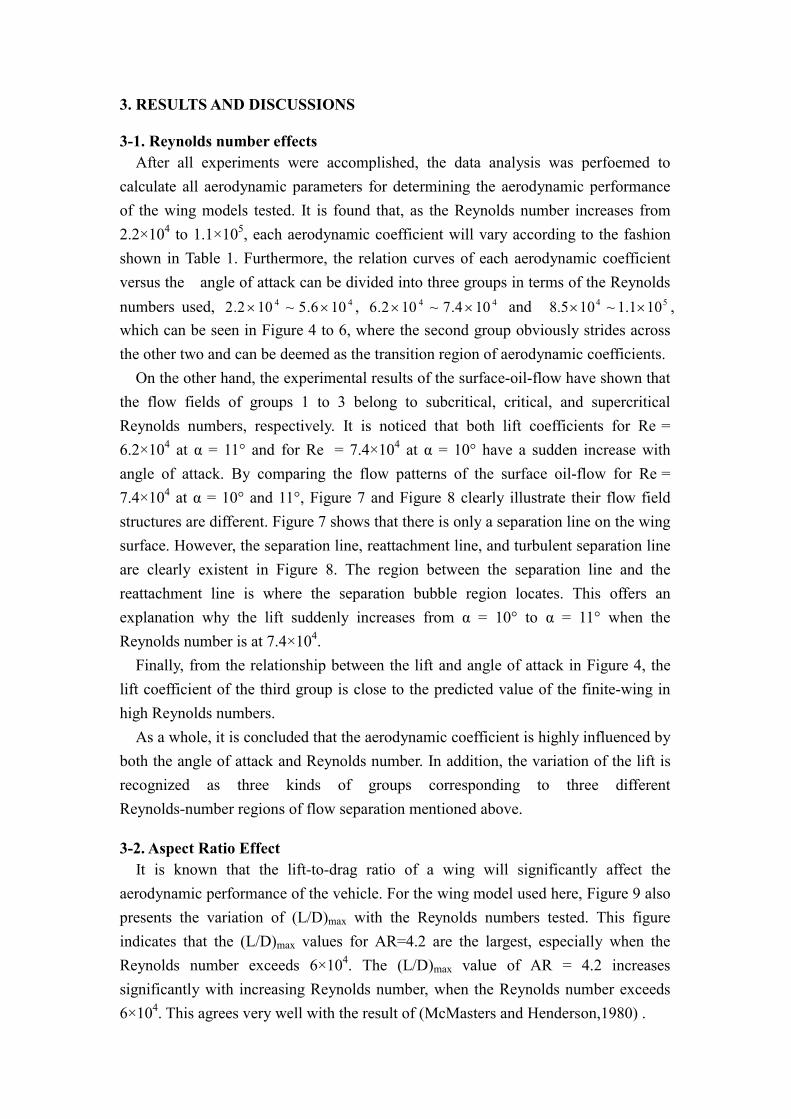
(b) Critical Reynolds number (104 < Re < 106): In the low angles of attack, the flow starts to accelerate from the separation point along the airfoil surface until the minimum pressure point is reached. When the flow momentum on the upper surface cannot overcome the severe adverse pressures gradient, the flow separates from the surface. The separated flow forms a free shear layer, which is extremely unstable, and transition to turbulence is readily realized. If the momentum exchanges between the boundary layer and the free stream are large enough, the high-speed flow entrained into the wall region supplies sufficient energy to maintain the circulating motion against the dissipation, and the fluid would reattach to the airfoil surface. The location of the flow reattachment is called the reattachment point. After the reattachment point, the turbulence boundary layer forms on the airfoil surface and may suffer the adverse pressure gradient continuously. The region from the laminar separation point to the reattachment point is called separation bubble. This kind of flow structures is depicted in Figure 1 (Muller, T. J.,1985).
(c) Supercritical Reynolds number (Re > 106): The laminar-to-turbulent flow transition usually takes place around the leading edge, ensuring an attached flow for a longer distance downstream as illustrated in Figure 2 (Hsiao, F. B., Liu, C. F. and Shyu, J. Y,1990).
Several literatures have indicated that the separation bubble has a significant effect

on the lift properties of an airfoil in low-Reynolds-number flow ( Mueller, T. J.,1985) (Althaus, D.,1986)( Marchman, J.F.,1987). In addition, the existence of the separation bubble governed by the flow separation and transition over the wing is obviously the dominating mechanism in aerodynamic stall. On the other hand, the bubble results in
different aerodynamic performance, which includes the important properties of ,
, and . Thus, it substantially affects the static, dynamic, and
aeroelastic stabilities of the entire vehicle.
max,LC
min,DC max)/( DL
Based on the achievement of flow researches mentioned above, this paper is hence intended to investigate the flow phenomenon and aerodynamic performance of a finite wing in low Reynolds numbers. With a three-component force balance in a wind tunnel, the aerodynamic performance including lift, drag, and pitching moment of an airfoil is obtained in the Reynolds numbers ranging from 2.2×10⁴ to 1.1×10⁵. The oil-flow visualization technique is also employed to investigate the flow patterns over the 3-D wing surfaces at the low Reynolds number ranges.
2. EXPERIMENTAL APPARATUS AND MODELS
The experiments of the present study were conducted in an open type wind tunnel, which has a contraction ratio of 9:1, as shown in Figure 3. By varying the frequency inverter of the electric motor, the tunnel speed changes from 2 m/s to 35 m/s with the turbulence level of about 0.3%. The test section of the wind tunnel is 50 cm in diameter and 140 cm in length. The measurement equipment for aerodynamic performance of the test models is a three-component external force/moment balance, which provides the measurements of lift, drag and pitching moment. The force/moment data are obtained from the A/D converter, which is a 16 bits, 8 channels device with maximum sampling rate of 1 MHz.
The AF37 cross-section profile is used as the airfoil section of the test models. In all test cases, two kinds of models are adopted and made. For the basic aerodynamic performance measurements of the finite wing, the models are respectively made of acrylic and balsawood. The chord length of both models is 9 cm with the aspect ratios of 1, 2, and 4.2. For the surface oil-flow visualization, the model is built of aluminum alloy with the aspect ratio of 4.2. The surface of the model is painted with black lacquer to facilitate the surface pattern visualization.
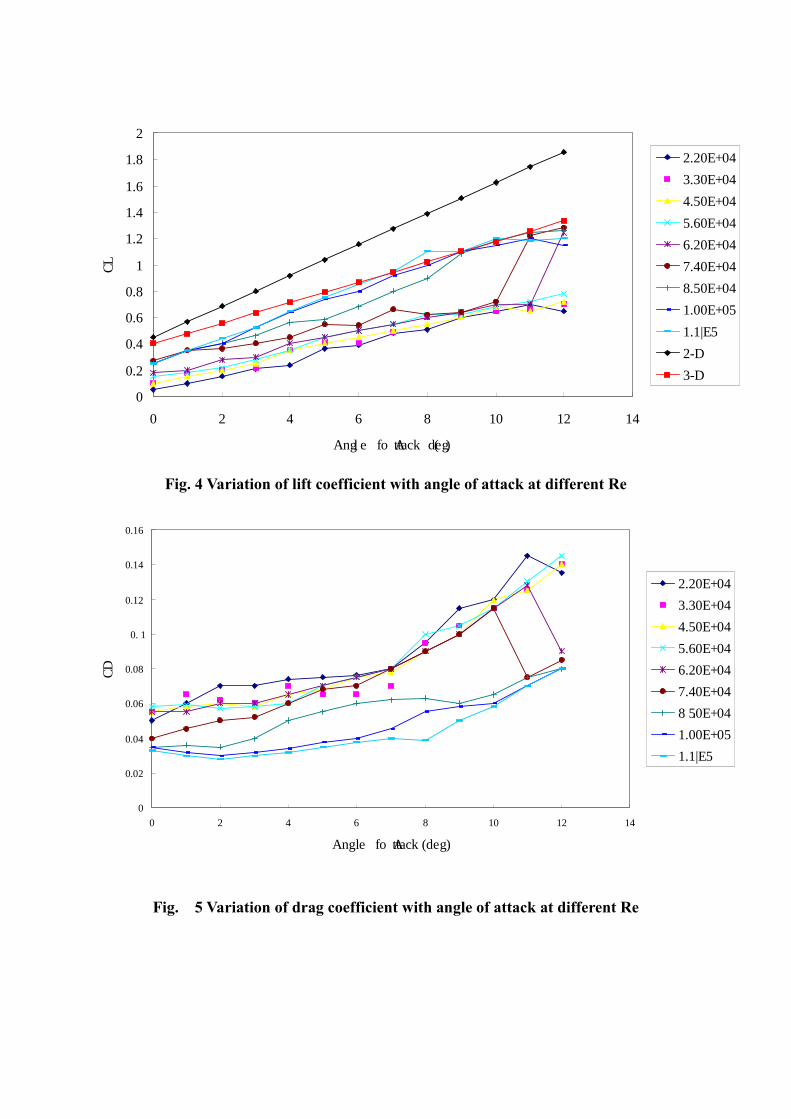
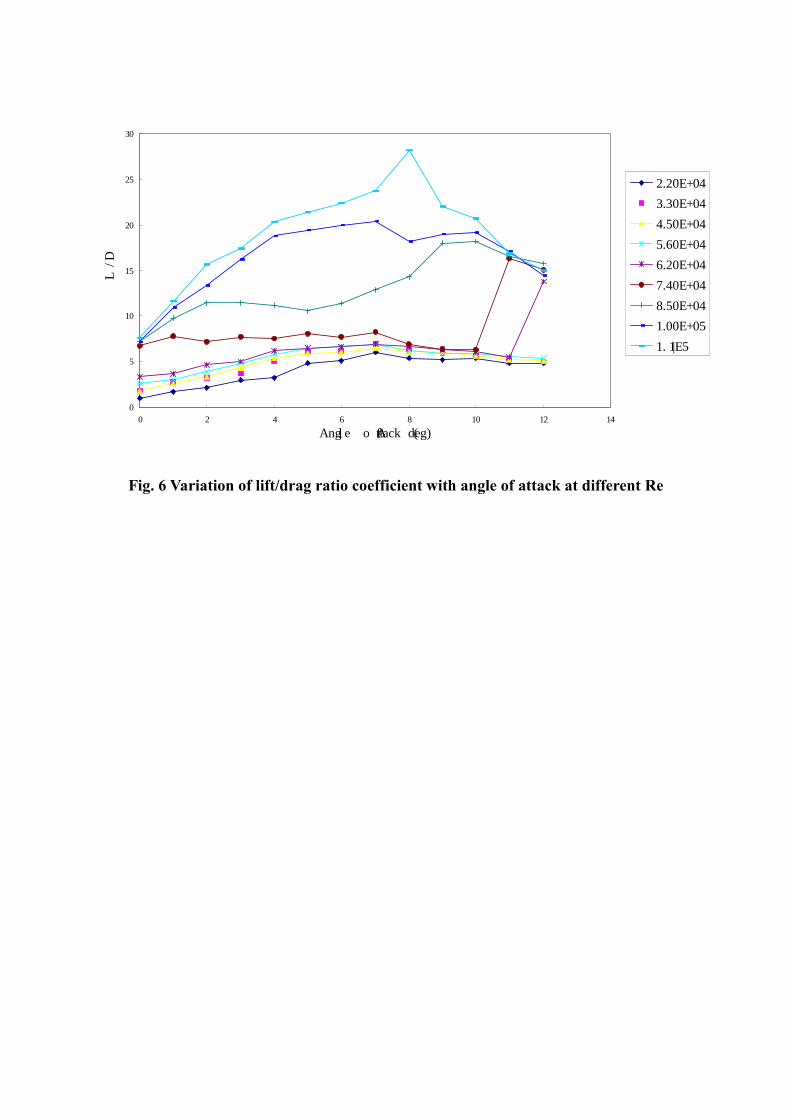
3. RESULTS AND DISCUSSIONS 3-1. Reynolds number effects After all experiments were accomplished, the data analysis was perfoemed to calculate all aerodynamic parameters for determining the aerodynamic performance of the wing models tested. It is found that, as the Reynolds number increases from 2.2×10⁴ to 1.1×10⁵, each aerodynamic coefficient will vary according to the fashion shown in Table 1. Furthermore, the relation curves of each aerodynamic coefficient versus the angle of attack can be divided into three groups in terms of the Reynolds numbers used, , and , which can be seen in Figure 4 to 6, where the second group obviously strides across the other two and can be deemed as the transition region of aerodynamic coefficients.
44 106.5~102.2 ×× 44 104.7~102.6 ×× 54 101.1~105.8 ××
On the other hand, the experimental results of the surface-oil-flow have shown that the flow fields of groups 1 to 3 belong to subcritical, critical, and supercritical Reynolds numbers, respectively. It is noticed that both lift coefficients for Re = 6.2×10⁴ at α = 11° and for Re = 7.4×10⁴ at α = 10° have a sudden increase with angle of attack. By comparing the flow patterns of the surface oil-flow for Re = 7.4×10⁴ at α = 10° and 11°, Figure 7 and Figure 8 clearly illustrate their flow field structures are different. Figure 7 shows that there is only a separation line on the wing surface. However, the separation line, reattachment line, and turbulent separation line are clearly existent in Figure 8. The region between the separation line and the reattachment line is where the separation bubble region locates. This offers an explanation why the lift suddenly increases from α = 10° to α = 11° when the Reynolds number is at 7.4×10⁴. Finally, from the relationship between the lift and angle of attack in Figure 4, the lift coefficient of the third group is close to the predicted value of the finite-wing in high Reynolds numbers.
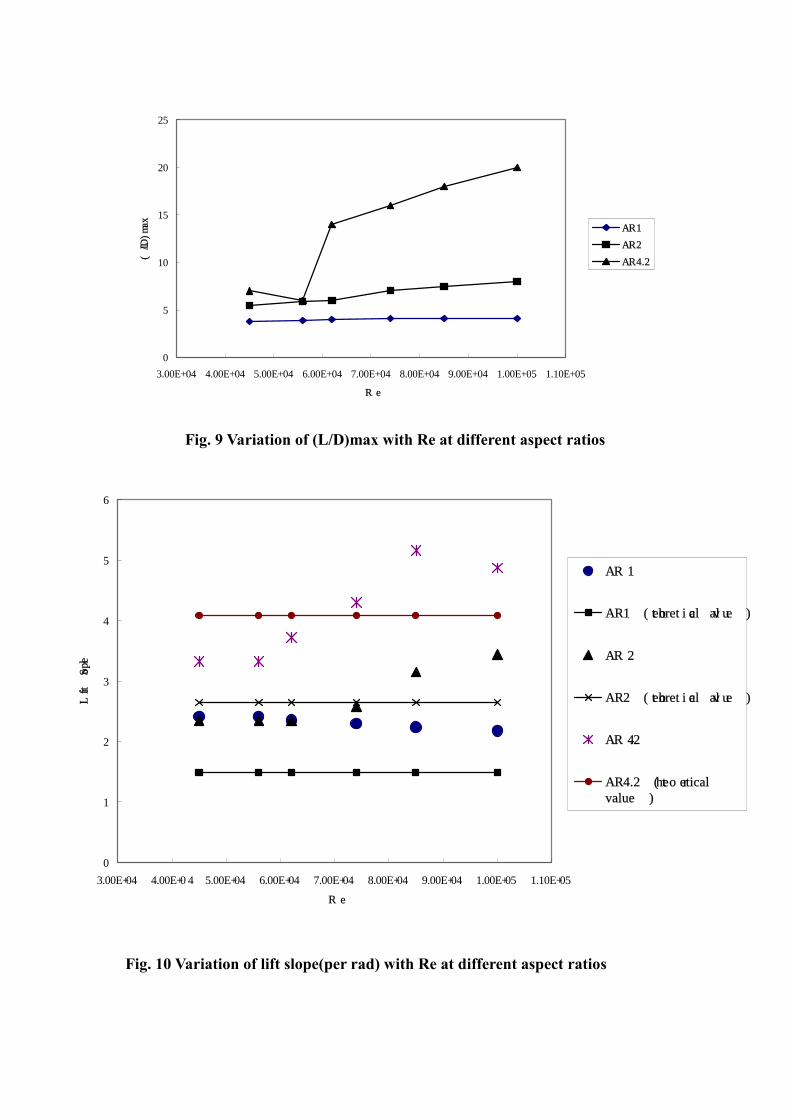
As a whole, it is concluded that the aerodynamic coefficient is highly influenced by both the angle of attack and Reynolds number. In addition, the variation of the lift is recognized as three kinds of groups corresponding to three different Reynolds-number regions of flow separation mentioned above. 3-2. Aspect Ratio Effect It is known that the lift-to-drag ratio of a wing will significantly affect the aerodynamic performance of the vehicle. For the wing model used here, Figure 9 also presents the variation of (L/D)max with the Reynolds numbers tested. This figure indicates that the (L/D)max values for AR=4.2 are the largest, especially when the Reynolds number exceeds 6×10⁴. The (L/D)max value of AR = 4.2 increases significantly with increasing Reynolds number, when the Reynolds number exceeds 6×10⁴. This agrees very well with the result of (McMasters and Henderson,1980) .

In Figure 10 when the aspect ratio is equal to 4.2, the CLα value is constant in the Reynolds-number ranges of 2.2×10⁴ ~ 5.6×10⁴ , and the CLα value increases with the Reynolds number gradually. Finally, when the Reynolds number reaches 8.5×10⁴, the CLα value remains constant again. In this figure, three different characteristic Reynolds-number modes are found and they agree well with the result of the curve analysis of lift coefficient. When the aspect ratio has the value of 2, the CLα value perhaps remains constant before reaching Re = 6.2×10⁴. The CLα value increases with the increase of the Reynolds number gradually. Different from those from AR = 4.2 and AR = 2, the CLα value remains almost constant for AR = 1 4. CONCLUDING REMARKS
In the present study, the following conclusions are obtained:
1. From the experiments of the finite wing models in the wind tunnel, the aerodynamic coefficient is a function of the angle of attack, Reynolds number, and the aspect ratio in low Reynolds number range. In the same Reynolds number, the Reynolds number modes could transit from the subcritical Reynolds number mode to the critical Reynolds number mode at different angles of attack. When the chord Reynolds number is higher, the angle of attack for sudden change of aerodynamic coefficient is smaller. 2. By comparing the experimental results of AR = 4.2 and AR = 2, the Reynolds- number mode transition occurs early in the same Reynolds number for AR = 2. For the finite wing, the tip vortices could promote the occurrence of Reynolds-number transition. 3. In the surface oil-flow experiments, the bubble length scale is strongly affected by the tip vortices. The bubble at the tip is smaller than that at the middle of the wing. The laminar separation point, reattachment point, turbulent separation point all move toward the leading edge with increasing angle of attack, wherein the bubble also shrinks in size.

REFERENCES 1. Althaus, D., ”Recent Wind Tunnel Experiments at Low Reynolds Numbers,”
Proceedings of the Conference on Aerodynamics at Low Reynolds Numbers, The Royal Aeronautical Society, Vol. 2, Paper 18, 15th-18th Oct. 1986.
2. Gad-el-Hak, M. “Micro-Air-Vehicle: Can they be controlled Better?”, Journal of Aircraft, Vol. 38, No. 3 , May-June 2001.
3. Hsiao, F. B., Yang, M.H., Hsu, C.C., Chen, C. Y. and Liang, P. F. “Experimental Study of Aerodynamic Characteristics about a Fixed-Wing Micro Aerial Vehicle”, 1st International Conference on Heat Transfer, Fluid Dynamics and Thermodynamics, Kruger National Park, South Africa, 8-10 April 2002.
4. Hsiao, F. B., Liu, C. F. and Shyu, J. Y., "Control of Wall-Separated Flow by Internal Acoustic Excitation," AIAA Journal, Vol. 28, No. 8, Aug. 1990, pp. 1440-1446.
5. LeBalanc, P., Liebeck, R. H. & Balackwelder, R., ”Boundary Layer and Performance Characteristics from Wind Tunnel Tests of a Low Reynolds Number Liebeck Airfoil,” Proceeding of the Aerodynamics at Low Reynolds Numbers, The Royal Aeronautical Society, Vol. 1, Paper 8, 15th-18th, Oct. 1986.
6. Mueller, T. J. and Jansen, B. J., “Aerodynamic Measurements at Low Reynolds Numbers,” AIAA paper 82-0598, March 1982.
7. Muller, T. J., ”Low Reynolds Number Vehicles,” Edited by E. Reshotko, AGARD-AG-288, Feb. 1985.
8. Marchman, J.F., ”Aerodynamic Testing at Low Reynolds Numbers,” Journal of Aircraft, Vol. 24, No. 2, Feb. 1987.
9. Mueller, T. J., “The Influence of Laminar Separation and Transition on Low Reynolds Number Airfoil Hysteresis,” Journal of Aircraft, Vol. 22, No. 9, pp. 7632, sep. 1985.
10. McMaster, J. H., and Henderson, M. L., ”Low Speed single Element Airfoil Synthesis,” Technical Soaring, Vol. 6, pp. 1-21, 1980.
11. Torres, G.E., and Mueller, T.J., “Aerodynamic Characteristics of Low-Aspect Ratio Wings at Low Chord-Reynolds-Numbers,” Proceedings of the Conference on Fixed, Flapping and Rotary Wing Vehicle at very Low Reynolds Number, edited by Mueller, T.J., Univ. of Notre Dame, Notre Dame, IN, 2000.
12. Ward, J. W., ”The Behavior and Effects of Laminar Separation Bubbles on Airfoils in Incompressible Flow,” Journal of the Royal Aeronautical Society, Vol. 67,pp.783-790, December 1963.
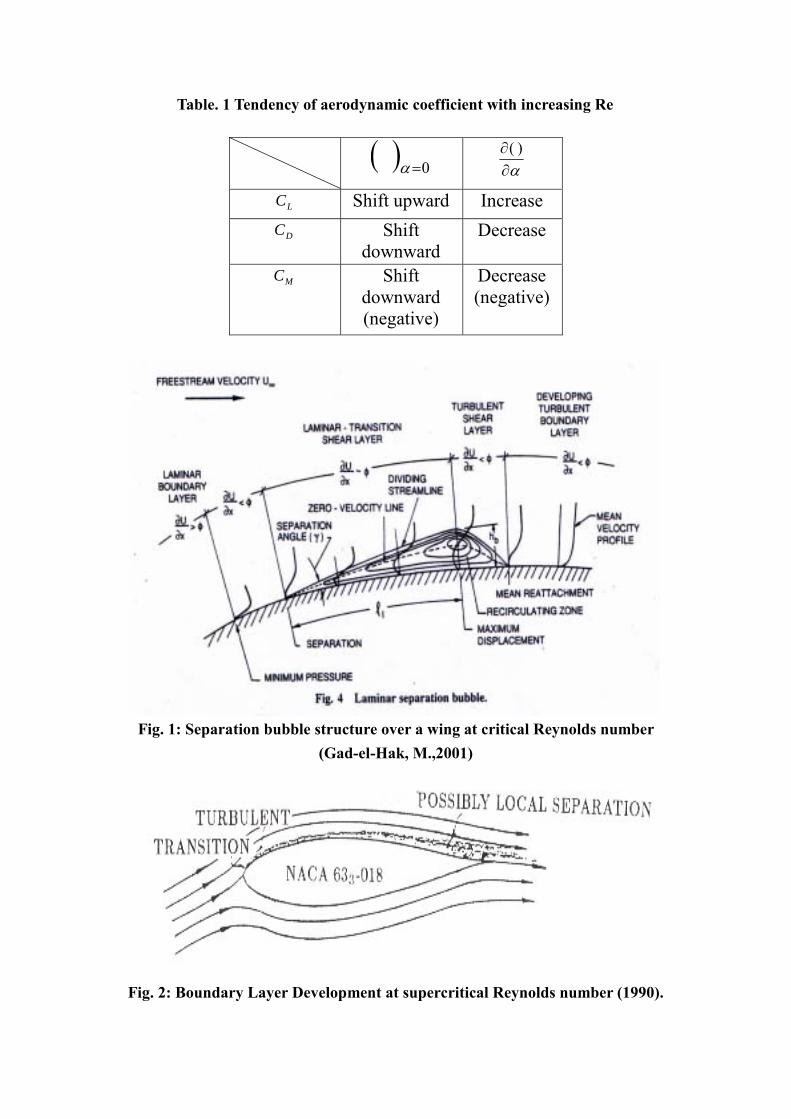
Table. 1 Tendency of aerodynamic coefficient with increasing Re
( ) 0=α α∂∂ ) (
LC Shift upward Increase
DC Shift downward
Decrease
MC Shift downward (negative)
Decrease (negative)
Fig. 1: Separation bubble structure over a wing at critical Reynolds number
(Gad-el-Hak, M.,2001)
Fig. 2: Boundary Layer Development at supercritical Reynolds number (1990).
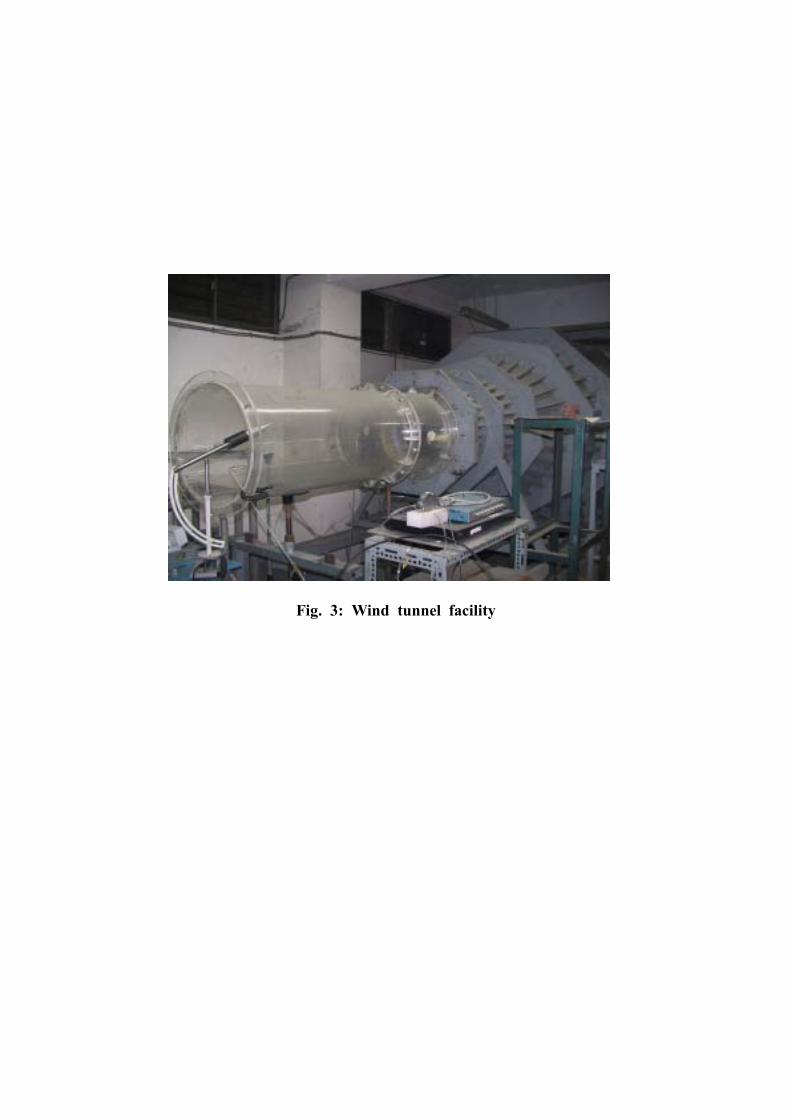
Fig. 3: Wind tunnel facility
0
0.2
0.4
0.6
0.8
1
1.2
1.4
1.6
1.8
2
0 2 4 6 8 10 12 14
Angle of Attack (deg)
CL
2.20E+04
3.30E+04
4.50E+04
5.60E+04
6.20E+04
7.40E+04
8.50E+04
1.00E+05
1.1|E5
2-D
3-D
Fig. 4 Variation of lift coefficient with angle of attack at different Re
0
0.02
0.04
0.06
0.08
0.1
0.12
0.14
0.16
0 2 4 6 8 10 12 14
Angle of Attack (deg)
CD
2.20E+04
3.30E+04
4.50E+04
5.60E+04
6.20E+04
7.40E+04
8.50E+04
1.00E+05
1.1|E5
Fig. 5 Variation of drag coefficient with angle of attack at different Re
0
5
10
15
20
25
30
0 2 4 6 8 10 12 14
Angle of Attack (deg)
L/D
2.20E+04
3.30E+04
4.50E+04
5.60E+04
6.20E+04
7.40E+04
8.50E+04
1.00E+05
1.1|E5
Fig. 6 Variation of lift/drag ratio coefficient with angle of attack at different Re
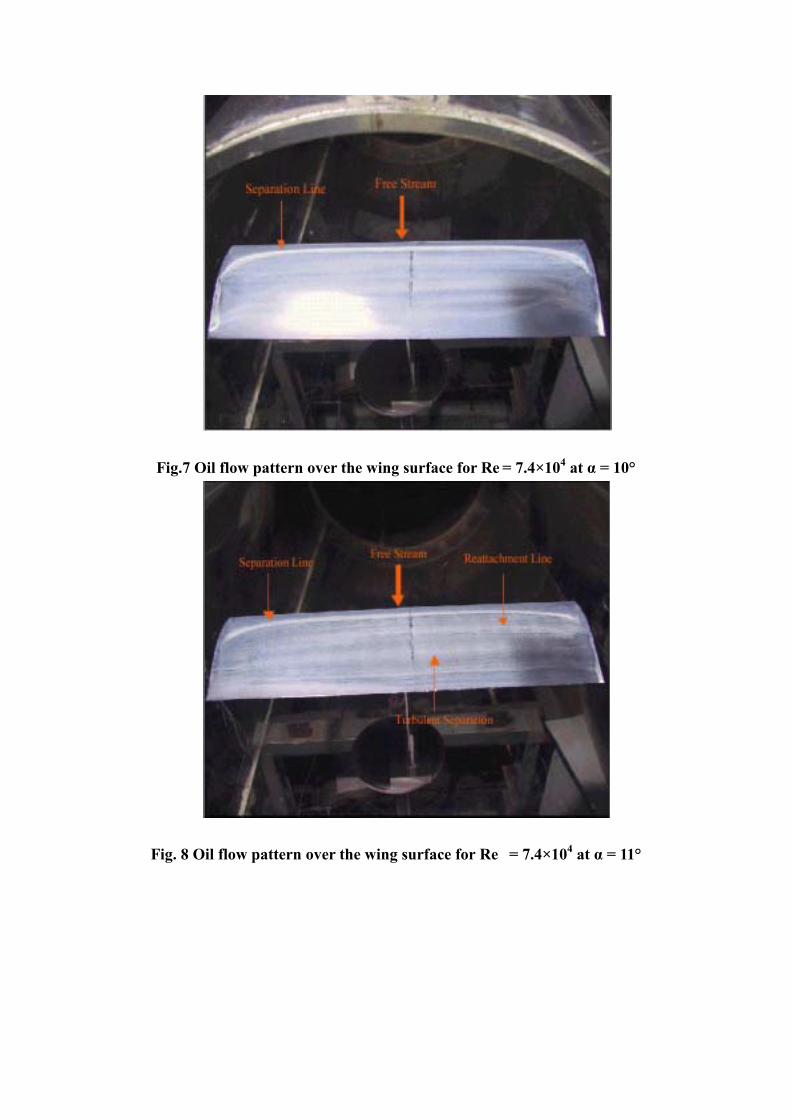
Fig.7 Oil flow pattern over the wing surface for Re = 7.4×10⁴ at α = 10°
Fig. 8 Oil flow pattern over the wing surface for Re = 7.4×10⁴ at α = 11°
0
5
10
15
20
25
3.00E+04 4.00E+04 5.00E+04 6.00E+04 7.00E+04 8.00E+04 9.00E+04 1.00E+05 1.10E+05
Re
(L/D)max
AR1
AR2
AR4.2
Fig. 9 Variation of (L/D)max with Re at different aspect ratios
0
1
2
3
4
5
6
3.00E+044.00E+04 5.00E+046.00E+047.00E+048.00E+049.00E+041.00E+051.10E+05
Re
Lift Slope
AR1
AR1 ( theoretical value )
AR2
AR2 ( theoretical value )
AR4.2
AR4.2 ( theoreticalvalue )
Fig. 10 Variation of lift slope(per rad) with Re at different aspect ratios

以實驗方法研究在低雷諾數下有限翼展之氣動力特性
蕭飛賓 1 張嘉原2 許掙強3 王地寶4
1,2,4國立成功大學航空太空研究所
3空軍航空技術學院
摘要
本論文主要利用風洞實驗探討有限機翼在低展弦比以及低雷諾數下的氣動
力特性。在氣動力參數量測方面,機翼的升力、阻止以及俯仰力距利用三力平衡
儀量得,為了輔證所得到的資料,也利用表面油流實驗去觀察翼表面的流場變
化。實驗結果顯示,在低雷諾數下的流場會存在有三種雷諾數模態,它們分別是
次臨界、臨界、以及超臨界雷諾數模態,在不同的雷諾數模態下會有很不同的氣
動力特徵,而這模態會隨雷諾數以及攻角而變化;當雷諾數愈高時,由次臨界雷
諾數轉換至臨界雷諾數所需的攻角愈低,而不同模態下的流場情形也可經由油流
實驗中觀察得知。除此之外,在表面油流實驗中,也可以發現在翼尖端的分離泡
很明顯受到翼尖渦流的影響,此時在翼尖端的分離泡會比翼中央來的小。從展弦
比為1的氣動力參數分析,可以發現此時的流場特性很明顯的受到翼尖渦流的影
響,即三維效應變的很明顯,雖然翼尖渦流可能促進雷諾數模態的提早發生,但
是整體的氣動力性能會相對的降低很多。
關鍵詞: 低雷諾數、有限翼、展弦比、氣動特性