Effect of the wing trailing-edge flaps and spoilers ... - eucass
Upload
khangminh22Category
view
0download
0
AERODYNAMIC PERFORMANCE
OF LOW FORM FACTOR SPOILERS
A thesis submitted to the University of Manchester for the degree of
Doctor of Philosophy
in the Faculty of Engineering and Physical Sciences
2010
Christopher Donald Harley
School of Mechanical, Aerospace and Civil Engineering

LIST OF CONTENTS
C.D. HARLEY 2
LIST OF CONTENTS
LIST OF CONTENTS .......................................................................................................... 2 LIST OF FIGURES ............................................................................................................. 4 LIST OF TABLES ............................................................................................................... 8 NOMENCLATURE ............................................................................................................. 9 ABSTRACT ...................................................................................................................... 13
DECLARATION ............................................................................................................... 14 COPYRIGHT STATEMENT .............................................................................................. 14 ACKNOWLEDGEMENTS .................................................................................................. 16
1 INTRODUCTION ...................................................................................................... 17 1.1 LOW FORM FACTOR SPOILERS FOR FLIGHT CONTROL ........................................ 17 1.2 AIMS AND OBJECTIVES ..................................................................................... 22
2 THEORY ................................................................................................................. 23 2.1 QUALITATIVE MODEL FOR THE EFFECT OF CAMBER .......................................... 23
2.2 COMPARISON OF FLOW TOPOLOGY MODELS FOR GEOMETRIC AND FLUIDIC
SPOILERS ..................................................................................................................... 24 2.3 GEOMETRIC SPOILER FLOWFIELD AND GLOBAL AERODYNAMIC COEFFICIENTS . 25 2.4 SPOILER PRESSURE DISTRIBUTION MODEL ........................................................ 27
3 LITERATURE REVIEW ............................................................................................ 29 3.1 GEOMETRIC SPOILERS FOR AIRCRAFT FLIGHT CONTROL ................................... 29
3.1.1 DEVELOPMENT OF SPOILERS FOR AIRCRAFT CONTROL .............................. 29 3.1.2 EFFECTIVENESS OF SPOILERS APPLIED TO SWEPT WINGS ........................... 38
3.1.3 USE OF SPOILERS ON MODERN CIVIL TRANSPORT AIRCRAFT ...................... 39 3.1.4 APPLICATION OF SPOILER TYPE DEVICES TO TAILLESS AIRCRAFT .............. 41
3.2 FLUIDIC SPOILER CONCEPTS FOR AIRCRAFT FLIGHT CONTROL .......................... 45 3.2.1 INTRODUCTION.......................................................................................... 45 3.2.2 ROLL CONTROL ......................................................................................... 46
3.2.3 YAW CONTROL .......................................................................................... 48 3.3 SUMMARY OF LITERATURE REVIEW AND CONCLUDING REMARKS .................... 50
4 EXPERIMENTAL METHODS ................................................................................... 52 4.1 EXPERIMENTAL APPARATUS ............................................................................. 52
4.1.1 PROJECT WIND TUNNEL ............................................................................. 52 4.1.2 WIND TUNNEL MODEL CONFIGURATIONS AND MANUFACTURE .................. 53
4.1.3 MIGS DESIGN AND MANUFACTURE ........................................................... 55 4.1.4 CFFS DESIGN AND MANUFACTURE ........................................................... 56 4.1.5 EXPERIMENTAL SET UP .............................................................................. 59 4.1.6 WAKE SURVEY .......................................................................................... 60 4.1.7 DIRECT FORCE AND MOMENT MEASUREMENTS.......................................... 61
4.1.8 PRESSURE MEASUREMENTS ....................................................................... 62 4.1.9 DATA ACQUISITION SYSTEM ...................................................................... 63
4.2 EXPERIMENTAL PROCEDURE ............................................................................. 63 4.2.1 PHASE 1 – PRELIMINARY AND MODEL BASELINE CONFIGURATION TESTS .. 63
4.2.2 PHASE 2 & 3 – BASELINE AND BULK TESTING ............................................ 64 4.2.3 WIND TUNNEL TEST PROCEDURE ............................................................... 64
4.3 DATA REDUCTION ............................................................................................ 65
4.3.1 BOUNDARY CORRECTIONS ........................................................................ 65 4.3.2 AEROFOIL SURFACE PRESSURE DISTRIBUTION CALCULATION .................... 66

LIST OF CONTENTS
C.D. HARLEY 3
4.3.3 FORCE AND MOMENT TRANSFER ................................................................ 67 4.3.4 AERODYNAMIC COEFFICIENT CALCULATED FROM THE FORCE/TORQUE
BALANCE ................................................................................................................. 68 4.3.5 LIFT COEFFICIENT CALCULATED FROM THE SURFACE PRESSURE
DISTRIBUTION.......................................................................................................... 68
4.3.6 PROFILE DRAG COEFFICIENT CALCULATED FROM THE WAKE SURVEY ....... 69 4.3.7 CFFS JET BLOWING COEFFICIENT CALCULATION ...................................... 69 4.3.8 AEROFOIL PROFILE DRAG CALCULATION ................................................... 70 4.3.9 CONTROL VOLUME ANALYSIS FOR CFFS WIND TUNNEL MODEL
CONFIGURATION ...................................................................................................... 72
4.4 MEASUREMENT VALIDATION METHODS ............................................................ 74
4.4.1 CFFS END EFFECTS INVESTIGATION .......................................................... 74 4.4.2 SAMPLING PERIOD INVESTIGATION ............................................................ 75
4.4.3 FORCED BOUNDARY LAYER TRANSITION ................................................... 76 4.4.4 CFFS PLENUM VALIDATION ...................................................................... 77
4.5 MEASUREMENT UNCERTAINTY ......................................................................... 78 4.5.1 AN OVERVIEW OF MEASUREMENT UNCERTAINTY ...................................... 78 4.5.2 UNCERTAINTY IN LIFT COEFFICIENT MEASUREMENT ................................. 80
5 COMPUTATIONAL METHODS ................................................................................ 82 5.1 COMPUTATION APPARATUS AND CASE SET-UP .................................................. 82
5.1.1 NUMERICAL SOLVER ................................................................................. 82 5.1.2 CONVERGENCE CRITERIA .......................................................................... 82
5.1.3 SOLUTION MONITORING AND CONVERGENCE ............................................ 83
5.1.4 TURBULENCE MODEL ................................................................................ 83 5.1.5 CALCULATION OF THE LIFT AND DRAG COEFFICIENT ................................. 84 5.1.6 MESH DEFINITION ..................................................................................... 84
5.1.7 MESH INDEPENDENCE STUDY .................................................................... 85 5.2 COMPUTATIONAL METHOD VALIDATION .......................................................... 86
5.2.1 SECTION OVERVIEW .................................................................................. 86 5.2.2 GEOMETRIC SPOILER CASE ........................................................................ 87 5.2.3 NORMAL BLOWING FLUIDIC SPOILER CASE ................................................ 89
6 RESULTS & DISCUSSION ........................................................................................ 93 6.1 COMPARISON OF BASELINE RESULTS ................................................................ 93
6.2 MICRO GEOMETRIC SPOILER RESULTS............................................................... 94
6.3 COUNTER-FLOW FLUIDIC SPOILER RESULTS .................................................... 100 6.4 COMPARISON OF MIGS AND CFFS ................................................................. 104 6.5 UPPER AND LOWER SURFACE CFFS BLOWING ................................................ 107
7 CONCLUSIONS & FUTURE RESEARCH OPPORTUNITIES ..................................... 110 7.1 CONCLUSIONS ................................................................................................ 110 7.2 FUTURE RESEARCH OPPORTUNITIES ................................................................ 114
8 REFERENCES ........................................................................................................ 119 9 APPENDIX ............................................................................................................. 123
9.1 CHANGE IN LIFT DUE TO THE DEFLECTION OF A PLAIN FLAP............................ 123
Final word count: 25,874

LIST OF FIGURES
C.D. HARLEY 4
LIST OF FIGURES
FIGURE 1.1: PHOTO OF AN AIRBUS A380 DURING LANDING PHASE WITH SPOILERS AND
HIGH LIFT DEVICES FULLY DEPLOYED. TAKEN FROM [6] ..................................... 18
FIGURE 1.2: COMPARISON OF MACRO GEOMETRIC (MAGS), MICRO GEOMETRIC (MIGS)
AND COUNTER-FLOW FLUIDIC SPOILERS (CFFS). ................................................ 19
FIGURE 2.1: QUALITATIVE ILLUSTRATION OF THE EFFECT OF AEROFOIL CAMBER ON LIFT
DRAG AND PITCHING MOMENT ............................................................................. 24
FIGURE 2.2: STEADY TIME-AVERAGED TWO-DIMENSIONAL STREAMLINE TOPOLOGY FOR
THREE SPOILER DEVICES, A) GEOMETRIC SPOILER AND B) I) NORMAL BLOWING
FLUIDIC SPOILER, AND B) II) COUNTER-FLOW FLUIDIC SPOILER. .......................... 25
FIGURE 2.3: TYPICAL FLOWFIELD DUE TO A REARWARD MOUNTED MACRO GEOMETRIC
SPOILER ............................................................................................................... 26
FIGURE 2.4: TYPICAL REARWARD MOUNTED (APART FROM WHERE STATED) SPOILER
EFFECT ON LIFT, DRAG, PITCHING MOMENT AND CHANGE IN SURFACE PRESSURE
WITH DEFLECTION. A) AND B) ADAPTED FROM ESDU DATA SHEET [2]. C)
ADAPTED FROM MCLACHLAN ET AL [16] ............................................................ 27
FIGURE 2.5: EFFECT OF INCREASING SPOILER DEFLECTION/HEIGHT ON THE WING SECTION
SURFACE PRESSURE DISTRIBUTION ...................................................................... 28
FIGURE 3.1: ONE OF THE FIRST APPLICATIONS OF A FORWARD MOUNTED AND FORWARD
HINGED SPOILER TO AIRCRAFT WINGS TAKEN FROM WEICK AND WENZINGER [21]
............................................................................................................................ 30
FIGURE 3.2: COMPARISON OF ROLLING AND YAWING MOMENT COEFFICIENTS OBTAINED
WITH AILERONS AND SPOILERS DURING WIND TUNNEL TESTING, TAKEN FROM
WEICK ET AL [24]. .............................................................................................. 32
FIGURE 3.3: LATERAL CONTROL DEVICE CONFIGURATIONS ON THE FAIRCHILD 22
AIRPLANE DURING FLIGHT TESTS. TAKEN FROM WEICK ET AL [23]. .................... 33
FIGURE 3.4: TIME HISTORY CURVES SHOWING THE LAG CHARACTERISTICS OF VARIOUS
CONTROL SYSTEMS. INDICATED AIR SPEED, 22M/S, FULL CONTROL DEFLECTION
TAKEN FROM WEICK ET AL [23]. ......................................................................... 34
FIGURE 3.5: SUMMARY OF A SELECTION OF SPOILER AND DEFLECTOR COMBINATIONS
INVESTIGATED BY WENZIGNER AND ROGALLO. [25]........................................... 35
FIGURE 3.6: THREE QUARTER REAR-VIEW OF THE TEST AIRPLANE AS INSTRUMENTED FOR
FLIGHT SHOWING DEFLECTED FLAP, DROOPED AILERON, DEFLECTED SPOILER AND
OPEN SLOT. TAKEN FROM [26] ............................................................................ 36
FIGURE 3.7: EFFECT OF CHORDWISE LOCATION ON PITCHING MOMENTS FOR FLAPS AND
SPOILERS, TAKEN FROM PURSER AND MCKINNEY [28]. ...................................... 38
FIGURE 3.8: EFFECT OF ANGLE OF SWEEPBACK ON ROLLING-MOMENT COEFFICIENTS
PRODUCED BY FLAP-TYPE AILERONS AND SPOILERS. FLAP DEFLECTION AND
SPOILER PROJECTION MEASURED IN PLANE PERPENDICULAR TO LEADING EDGE.
TAKEN FROM LETKO ET AL [30]. ......................................................................... 39

LIST OF FIGURES
C.D. HARLEY 5
FIGURE 3.9: PHOTO TAKEN FROM INSIDE A BOEING 737 DURING THE APPROACH PHASE . 40
FIGURE 3.10: SPOILER DEPLOYED DURING A) CRUISE CONDITIONS OF AN AIRBUS A333
AND B) LANDING PHASE OF AN AIRBUS A380. ..................................................... 41
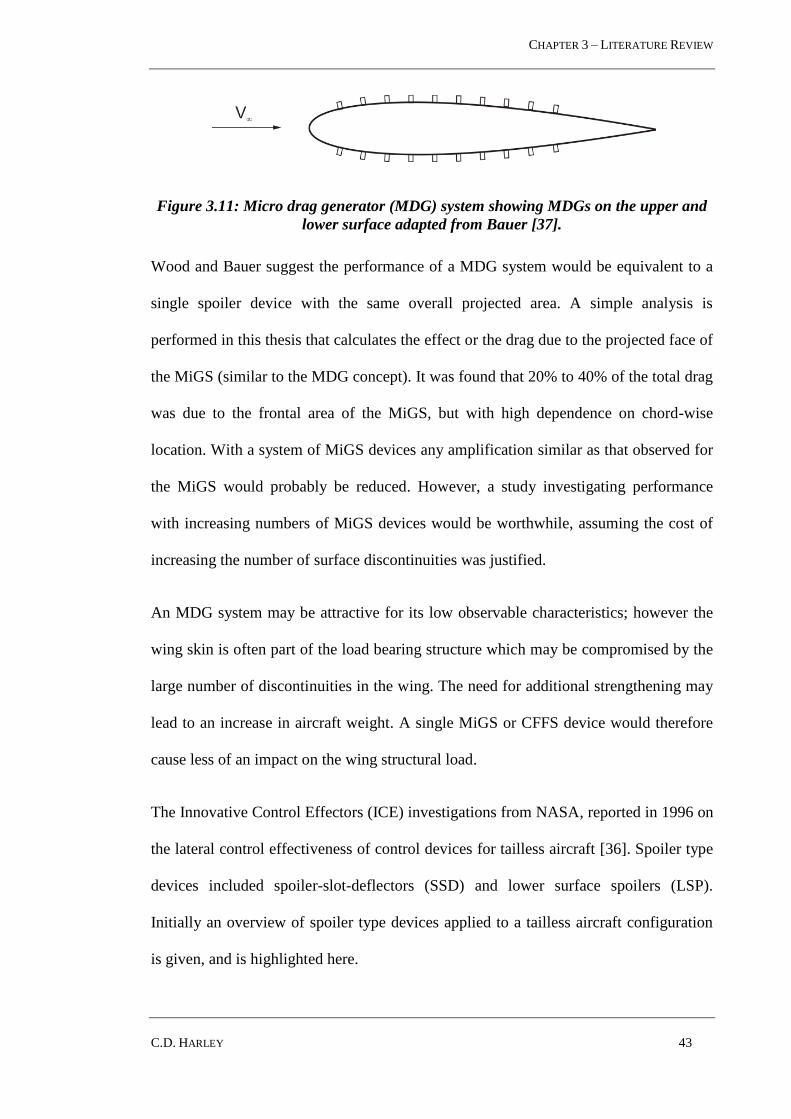
FIGURE 3.11: MICRO DRAG GENERATOR (MDG) SYSTEM SHOWING MDG‟S ON THE UPPER
AND LOWER SURFACE ADAPTED FROM BAUER [37]. ............................................ 43
FIGURE 3.12: EFFECT OF SPOILER SWEEP ON THE LATERAL CONTROL POWER OF A 60O
SWEPT TAILLESS AIRCRAFT CONFIGURATION. TAKEN FROM DORSET AND MEHL
[36] ..................................................................................................................... 44
FIGURE 3.13: LATERAL CONTROL POWER OF A SPOILER AND SSD APPLIED TO A 60O SWEPT
TAILLESS AIRCRAFT CONFIGURATION. TAKEN FROM DORSET AND MEHL [36] .... 45
FIGURE 3.14: NORMAL BLOWING FLUIDIC SPOILER CONCEPT TAKEN FROM LEOPOLD ET
AL [40]. ............................................................................................................... 46
FIGURE 3.15: PRESSURE DISTRIBUTION OF THE NORMAL BLOWING FLUIDIC SPOILER
TAKEN FROM LEOPOLD ET AL [40]. BLOWING COEFFICIENT, C = 0.48, ANGLE OF
ATTACK, = 0O, REYNOLDS NUMBER, RE = 2X10
5. ............................................. 47
FIGURE 3.16: DIAGRAM OF ,A) CROSS-SECTIONAL VIEW OF THE MODEL AT THE SLOT MID-
SPAN AND B) TOP VIEW OF THE SEMI-SPAN WIND TUNNEL MODEL USED BY
TAVELLA ET AL [42]. .......................................................................................... 49
FIGURE 4.1: OVERVIEW OF THE PROJECT TUNNEL TEST SECTION SHOWING MAJOR
DIMENSIONS AND MODEL ORIENTATION. ............................................................. 53
FIGURE 4.2: CROSS-SECTIONAL VIEWS OF THE A) MIGS, B) CFFS WIND TUNNEL MODEL
CONFIGURATIONS, AND C) WIND TUNNEL MODEL DETAILS. ................................. 54
FIGURE 4.3: WIND TUNNEL MODEL INTERNAL STEEL „SKELETON‟ LAYOUT ..................... 55
FIGURE 4.4: PHOTO OF THE WIND TUNNEL MODEL IN CFFS CONFIGURATION ................. 56
FIGURE 4.5: CFFS DESIGN USED IN THE WIND TUNNEL MODEL ....................................... 57
FIGURE 4.6: PHOTO OF THE WIND TUNNEL SETUP WITH VERTICALLY MOUNTED MODEL, 6-
COMPONENT FORCE BALANCE, SCANIVALVES FOR SURFACE PRESSURE AND WAKE
RAKE FOR DRAG MEASUREMENT. ........................................................................ 59
FIGURE 4.7: LAYOUT OF THE WIND TUNNEL SETUP. SOLID ARROWS SHOW THE DIRECTION
OF AIRFLOW FROM THE COMPRESSED SUPPLY, DASHED LINES INDICATE 0.35C
CFFS LOCATION AND PRESSURE SUPPLY PIPING. ................................................. 60
FIGURE 4.8: PHOTO OF THE WAKE RAKE USED DURING WIND TUNNEL EXPERIMENTS ...... 61
FIGURE 4.9: FLOW CHART OF EXPERIMENTAL PROCEDURE .............................................. 65
FIGURE 4.10: MIGS NORMAL TO A WALL PARTIALLY SUBMERGED BY A BOUNDARY LAYER
OF THICKNESS, 0.99. ............................................................................................ 71
FIGURE 4.11: CONTROL VOLUME FOR A CFFS AEROFOIL ................................................ 74
FIGURE 4.12: THE EFFECT OF SAMPLING PERIOD ON WAKE SURVEY DRAG COEFFICIENT
MEASUREMENTS AT A SAMPLING RATE OF 1KHZ. ................................................ 76
FIGURE 4.13: RESULTS OF A TRANSITION STUDY USING A SERIES OF TWO-DIMENSIONAL
TAPE (OR PINKED TAPE) OF INCREASING THICKNESS LOCATED AT 0.1C FROM THE
LEADING EDGE ON THE UPPER AND LOWER SURFACES OF THE MODEL. THE DRAG

LIST OF FIGURES
C.D. HARLEY 6
COEFFICIENT VALUES SHOWN ARE MEASURED FROM THE FORCE BALANCE AND
MOMENTUM LOSS IN THE WAKE. .......................................................................... 77
FIGURE 4.14: SPANWISE VARIATION OF STATIC PRESSURE IN THE CFFS PLENUM ........... 78
FIGURE 5.1: COMPUTATIONAL GRID USED FOR THE FLUIDIC SPOILER STUDY. CASE SHOWN
IS FOR SPOILER AT 0.65X/C .................................................................................. 85
FIGURE 5.2: EFFECT OF GRID REFINEMENT ON AEROFOIL LIFT COEFFICIENT, FOR UPPER
SURFACE CFFS AT 0.65C, WITH MAX. C, AND = 6O. ........................................ 86
FIGURE 5.3: CLOSE-UP OF THE MESH AROUND THE RA16SC AEROFOIL WITH INLAY
SPOILER ............................................................................................................... 88
FIGURE 5.4: GEOMETRIC SPOILER VALIDATION CASE FOR A 16% SUPERCRITICAL WING
WITH INLAY SPOILER, = 20O, = 0
O, AND RE = 1.9X10
6 [61]. ........................... 89
FIGURE 5.5: CLOSE-UP OF THE MESH AROUND THE NACA 0018 AEROFOIL WITH NORMAL
BLOWING FLUIDIC SPOILER .................................................................................. 90
FIGURE 5.6: FLUIDIC SPOILER VALIDATION CASE FOR A NACA 0018 AIRFOIL WITH JET
ISSUING FROM THE LOWER SURFACE; = 0O, AND RE = 2X10
5, EXPERIMENTAL C
= 0.48, SIMULATED C = 0.24.[40] ...................................................................... 92
FIGURE 6.1: COMPARISON OF THE BASELINE EXPERIMENTAL AND NUMERICAL LIFT, DRAG
AND SURFACE PRESSURE DISTRIBUTIONS. ............................................................ 94
FIGURE 6.2: EFFECT OF MICRO GEOMETRIC SPOILER (MIGS) LOCATION ON THE CHANGE
IN EXPERIMENTAL LIFT, DRAG AND PITCHING MOMENT WITH SPOILER HEIGHT.
ANGLE OF ATTACH RANGE: ○ = 0O, ∆ = 3
O, □ = 6
O. CORRESPONDING SURFACE
PRESSURE DISTRIBUTION PLOTS (IN FIG. 6.3) INDICATED IN VERTICAL AXIS (ACP,
BCP, CCP, DCP). .................................................................................................... 98
FIGURE 6.3: EFFECT OF 0.03C MIGS LOCATION ON CHANGE IN SURFACE PRESSURE
DISTRIBUTIONS AT = 6O. ................................................................................... 99
FIGURE 6.4: GAIN (EFFICIENCY) OF MIGS FOR BOTH LOWER AND UPPER SURFACES, AND
BOTH CHORDWISE LOCATIONS ............................................................................. 99
FIGURE 6.5: EFFECT OF COUNTER-FLOW FLUIDIC SPOILER (CFFS) LOCATION ON THE
CHANGE IN EXPERIMENTAL LIFT, DRAG AND PITCHING MOMENT WITH BLOWING
COEFFICIENT. ANGLE OF ATTACH RANGE: ○ = 0O, ∆ = 3
O, □ = 6
O. CORRESPONDING
SURFACE PRESSURE DISTRIBUTION PLOTS (IN FIG. 6.6) INDICATED IN VERTICAL
AXIS (ACP, BCP, CCP, DCP).(Z IS THE MOMENT ARM FOR THE JET)....................... 102
FIGURE 6.6: EFFECT OF C=0.05 BLOWN CFFS LOCATION ON CHANGE IN SURFACE
PRESSURE DISTRIBUTIONS AT = 6O. ................................................................. 103
FIGURE 6.7: GAIN (EFFICIENCY) OF CFFS FOR BOTH LOWER AND UPPER SURFACES, AND
BOTH CHORDWISE LOCATIONS ........................................................................... 103
FIGURE 6.8: EXPERIMENTAL LIFT-DRAG POLAR PLOTS COMPARED WITH DATA SHEET
(MIGS) AND CFD (CFFS) RESULTS .................................................................. 106
FIGURE 6.9: EXPERIMENTAL PITCHING MOMENT – LIFT POLAR PLOTS........................... 106
FIGURE 6.10: FORCE BALANCE DRAG COEFFICIENT FROM DUAL SURFACE BLOWING FOR
YAW CONTROL. UPPER SURFACE CFFS = 0.35X/C. LOWER SURFACE CFFS =
0.65X/C. ZERO PITCHING MOMENT (CM) AND LIFT (CL) LOCI INDICATED. .......... 109

LIST OF FIGURES
C.D. HARLEY 7
FIGURE 9.1: GEOMETRIC DEFINITION OF AN AEROFOIL WITH A PLAIN FLAP CONTROL
SURFACE FOR THE DETERMINATION OF THE THEORETICAL LIFT COEFFICIENT .... 124

LIST OF TABLES
C.D. HARLEY 8
LIST OF TABLES
TABLE 4.1: WIND TUNNEL BALANCE FORCE AND TORQUE NOMINAL RANGES, IN FORCE
BALANCE AXES. ................................................................................................... 62
TABLE 4.2: UNCERTAINTY CALCULATION OF THE FORCE BALANCE LIFT COEFFICIENT. THE
EXPANDED UNCERTAINTY AT THE 95% CONFIDENCE LEVEL FOR CL = 0.6197 IS
9.15%. ................................................................................................................ 81
TABLE 5.1: OVERVIEW OF THE IMPORTANT MESH PARAMETERS USED IN THE MESH
REFINEMENT STUDY ............................................................................................ 86
TABLE 5.2: VALIDATION CASES CONDUCTED FOR THE CFD PROCESS ............................. 87
TABLE 9.1: PARAMETER RANGES FOR TEST DATA FOR PLAIN TRAILING-EDGE FLAPS .... 124

NOMENCLATURE
C.D. HARLEY 9
NOMENCLATURE
a Speed of sound m/s
A Axial force N
c Chord length m
ci Functional relationship in uncertainty analysis -
CL Lift coefficient -
CM Pitching moment coefficient -
CP Pressure coefficient -
C Blowing coefficient =𝜌∞ ℎ𝑗𝑉𝑗
2
𝑞∞ 𝑐
-
D Drag force N
F Force N
Fx Balance drag force N
Fy Balance side force N
Fz Balance lift force N
h Slot height m
heff Effective height of spoiler in the freestream m
hs MiGS height m
k Coverage factor -
L Lift force N
M Pitching moment Nm
𝑚 Mass flow rate Kg/s
n Flat plate velocity profile constant -
N Normal force N

NOMENCLATURE
C.D. HARLEY 10
P Static pressure Pa
PT Total pressure Pa
q Dynamic pressure Pa
R Slot radius of curvature m
Re Reynolds number -
Rx Reactionary force N
s(x) Standard deviation of the sample -
S Area m2
t Time s
Tx Balance rolling moment Nm
Ty Balance pitching moment Nm
Tz Balance yawing moment Nm
u(𝑥 ) Standard uncertainty of the measurement -
ucal(x) Standard uncertainty of the calibration file -
Vx X component of the velocity m/s
U(x) Expanded uncertainty -
V Velocity m/s
x/c Non-dimenionalised chord length -
Y Side force N
y+ Non-dimensional wall distance -
Angle of attack Degrees
Spoiler deflection Degrees
Laminar boundary layer thickness m
Ratio of specific heats of air (1.4) -

NOMENCLATURE
C.D. HARLEY 11
Jet ext angle relative to mean chord line Degrees
Air density Kg/m3
c FLAP 0.2c Flap deflection Degrees
Subscripts
1 Properties related to station 1 conditions
2 Properties related to station 2 conditions
∞ Properties related to freestream conditions
aerofoil Properties related to the aerofoil
BL Properties related to effective boundary layer conditions
CFFS Properties related to the counter-flow fluidic spoiler
CP Properties related to surface pressure distribution
j Properties related to the fluidic spoiler jet conditions
MiGS Properties related to Micro Geometric Spoiler
plate Properties related to flat plate
s Properties related to a geometric spoiler
Wake Properties related to wake conditions
y Properties related to boundary layer conditions at y above the wall
Abbreviations
2D Two-Dimensional
3D Three-Dimensional
ACE Advanced Control Effector
CC Circulation Control

NOMENCLATURE
C.D. HARLEY 12
CFD Computation Fluid Dynamics
CFFS Counter-Flow Fluidic Spoiler
DAQ Data Acquisition
EPSRC Engineering and Physical Sciences Research Council
ESDU Engineering Sciences Data Unit
FLAVIIR Flapless Air Vehicle Integrated Industrial Research
ICE Innovative Control Effector
LE Leading Edge
LES Large Eddy Simulation
MaGS Macro Geometric Spoiler
MDG Micro Drag Generator
MiGS Micro Geometric Spoiler
NACA National Advisory Committee for Aeronautics
NBFS Normal Blowing Fluidic Spoiler
RANS Reynolds-Averaged Navier-Stokes
SIMPLE Semi-Implicit Method for Pressure-Linked Equations
SSD Spoiler-Slot-Deflector
SST Shear Stress Transport
TE Trailing Edge
UAV Unmanned Aerial Vehicle
URANS Unsteady Reynolds-Averaged Navier-Stokes

ABSTRACT
C.D. HARLEY 13
ABSTRACT
ABSTRACT OF THESIS submitted by Christopher Donald Harley for the Degree
of Doctor of Philosophy and entitled „Aerodynamic Performance of Low Form
Factor Spoilers‟. Submitted September 2010
The development of low form factor flight controls is driven by the benefits of reducing
the installed volume of the control device and/or minimising the change in external
geometry, with particular application to flight control of low observable aircraft. For
this work, the term „low form factor‟ does not refer to the aspect ratio of the control
device rather the overall installed volume. This thesis compares the use of low form
factor geometric and fluid devices on a NACA 0015 aerofoil section through two-
dimensional numerical analysis and low speed wind tunnel experiments. The geometric
spoiler is implemented as a small (boundary layer scale) variable height tab oriented
normal to the local surface, referred to as a Micro Geometric Spoiler (MiGS). The
fluidic spoiler is implemented as an air jet tangential to the local surface acting in the
forward direction, referred to as a Counter-Flow Fluidic Spoiler (CFFS). Two
chordwise spoiler locations were considered: 0.35c and 0.65c. Numerical analysis was
undertaken using a commercial CFD code using an unsteady solver and k-omega shear-
stress-transport turbulence model. Experimental forces and moments were measured
via an overhead force balance, integrated surface pressures and pressure wake survey.
Device performance is assessed against the magnitude of control achievable compared
to macro scale spoilers and trailing edge controls (effectiveness), the ratio of
aerodynamic output to control input (efficiency or gain), the shape of control response
curve (linearity), and the degree of control cross coupling.
Results show that the MiG and CFF spoilers work by a similar mechanism based on
inducing flow separation that increases the pressure ahead of the spoiler and reduces
the pressure downstream. Increasing control input increases drag and reduces lift,
however the change in pitching moment is dependent on chordwise location.
Chordwise location has a significant effect on effectiveness, efficiency, linearity and
separability. Forward MiGS location gives the largest drag gain however the control
response is strongly nonlinear with angle of attack and there is a significant undesirable
coupling of drag with pitching moment. Aft MiGS location significantly improves
control linearity and reduces pitching moment coupling however the drag gain is much
reduced. For the CFFS, the control linearity with respect to control input and angle of
attack is good for both forward and aft locations, with the aft location giving the largest
gain for lift and drag. The control response trends predicted from numerical analysis are
good, however a calibration factor of around ½ has to be applied to the control input
momentum to match the experimentally observed gains. Furthermore numerical control
drag polars under predict the change in lift with change in drag at low blowing rates.
Through the use of a CFFS device on both the upper and lower surfaces of a wing
section it is possible to generate control drag inputs fully decoupled from both lift and
pitching moment, thus potentially simplifying device control law implementation
within an integrated yaw control system.

DECLARATION AND COPYRIGHT STATEMENTS
C.D. HARLEY 14
DECLARATION
No portion of the work referred to in the thesis has been submitted in support of an
application for another degree or qualification of this or any other university or other
institute of learning.
Christopher Harley, September 2010
COPYRIGHT STATEMENT
The author of this thesis (including any appendices and/or schedules to this thesis)
owns certain copyright or related rights in it (the “Copyright”) and s/he has given The
University of Manchester certain rights to use such Copyright, including for
administrative purposes.
Copies of this thesis, either in full or in extracts and whether in hard or electronic copy,
may be made only in accordance with the Copyright, Designs and Patents Act 1988 (as
amended) and regulations issued under it or, where appropriate, in accordance with
licensing agreements which the University has from time to time. This page must form
part of any such copies made.
The ownership of certain Copyright, patents, designs, trademarks and other intellectual
property (the “Intellectual Property”) and any reproductions of copyright works in the
thesis, for example graphs and tables (“Reproductions”), which may be described in
this thesis, may not be owned by the author and may be owned by third parties. Such
Intellectual Property and Reproductions cannot and must not be made available for use
without the prior written permission of the owner(s) of the relevant Intellectual
Property and/or Reproductions.
DECLARATION AND COPYRIGHT STATEMENTS
C.D. HARLEY 15
Further information on the conditions under which disclosure, publication and
commercialisation of this thesis, the Copyright and any Intellectual Property and/or
Reproductions described in it may take place is available in the University IP Policy
(see http://documents.manchester.ac.uk/DocuInfo.aspx?DocID=487), in any relevant
Thesis restriction declarations deposited in the University Library, The University
Library‟s regulations (see http://www.manchester.ac.uk/library/aboutus/regulations)
and in The University‟s policy on Presentation of Theses.

ACKNOWLEDGMENTS
C.D. HARLEY 16
ACKNOWLEDGEMENTS
I would like to start by thanking Dr Bill Crowther, firstly for offering me the
opportunity to do this PhD, secondly for his supervision throughout and finally for his
brutally honest critique where necessary. I would like to thank Dr Alistair Revell for his
CFD knowledge and support, and Dr Rodger Edwards for his guidance and support. I
must also thank the BAE Systems/EPSRC sponsored FLAVIIR project for funding this
work.
I have been fortunate enough to spend part of the PhD career at the now closed offsite
facility, Barton. I would like to thank the long serving lab technicians, Mike, Ken and
Dave who gave a wealth of engineering knowledge and general advice. This was a true
research facility where I learnt the art of research with the help of my fellow PhD
students: Russell, Ken, Steve Michie, Chip, Phil, Matt, Steve Liddle, and Paul Wilde. A
group tea break solved many problems.
The second part of my PhD has been spent at the George Begg Building, where my
University career began. I would like to thank the technicians Mike, Dave and Lee who
collectively helped me put the wind tunnel experiment together, and where there was
always an open ear willing to listen. I would also like to thank John Ashley, Ben,
Johnny Potts, Phil and Matt who were always willing to discuss research over a brew.
I would like to thank my closest family and friends and especially Kate, who has
supported me throughout this process, but who I have undoubtedly neglected over the
past few years, especially since I have been writing and working. Finally, to my Mum
and Dad, thank you being there every step of the way over the past 28 years.

CHAPTER 1 – INTRODUCTION
C.D. HARLEY 17
1 INTRODUCTION
The aim of this chapter is to introduce the “low form-factor” spoiler class
and set it in context within the broader field of aircraft spoilers for flight
control. The low form factor devices investigated during this study are
introduced and a description of the motivation behind the work is given.
Finally, the aim and objectives for this thesis are defined.
1.1 Low form factor spoilers for flight control
Whilst much of aerodynamic design is concerned with maximising the efficiency with
which attached air flows around a solid surface, there are specific operational
incidences where the flow is required to depart from or 'separate' from the surface.
Typically a device used to cause flow separation is referred to as a 'spoiler', in the sense
that it 'spoils' the smooth flow around an aerodynamically contoured body. An aircraft
spoiler is a type of geometric flight control typically mounted on the upper surface of a
wing that when deflected causes the flow to separate. This results in an increase in
drag, a loss in lift and a change in pitching moment, with the sign of the pitching
moment dependent on the chord wise location of the spoiler.
Aircraft require control about three axis for flight control, which can be grouped under
longitudinal control (changes to rate of pitch), and lateral control (changes to rate of
roll and rate of yaw). Spoiler devices are suitable for lateral aircraft control due to their
ability to rapidly deploy, produce favourable yawing moments and typically cause
lower changes in pitching moment compared to ailerons. Spoilers deployed
independently on either aircraft wing, asymmetric operation, can be used to provide the
majority of the lateral control authority required during flight [1]. Spoilers deployed

CHAPTER 1 – INTRODUCTION
C.D. HARLEY 18
simultaneously on either wing, symmetric operation, can provide a method of lift
dumping, and air braking, typically used during landing [2]. Spoilers can also provide
active control for flutter suppression [3], direct lift control [4] and gust load alleviation
[5]. Figure 1.1 shows a photo of an Airbus A380 during the landing phase with all eight
spoilers fully (per wing) deployed for lift dumping and air braking.
Figure 1.1: Photo of an Airbus A380 during landing phase with spoilers and high lift
devices fully deployed. Taken from [6]
The motivation for the work in this thesis is based on the development of low 'form
factor' spoiler-like flight controls on lifting surfaces located in between of the leading
and trailing edges. Low form factor devices are defined by utilising minimum wing
volume for installation of the control devices and systems, and are compatible with best
practice for low observable design [69]. For the purposes of this work „low form factor‟
should not be confused with „low aspect ratio‟ controls. Two types of low form factor
spoiler are considered in the work: Micro Geometric Spoilers (MiGS) and Counter-
Spoilers
Aileron
Trailing edge flaps

CHAPTER 1 – INTRODUCTION
C.D. HARLEY 19
Flow Fluidic Spoilers (CFFS). A schematic comparing the main flow field features of
each of the spoiler types compared with a macro geometric spoiler is shown in Figure
1.2.
Figure 1.2: Comparison of macro geometric spoiler (MaGS), micro geometric spoiler
(MiGS) and counter-flow fluidic spoiler (CFFS).
For the purposes of this work a micro geometric spoiler is defined as a device whose
deployed length scale is of a similar order to the local boundary layer thickness at the
point of operation. This contrasts with conventional 'macro geometric spoilers' where
the deployed length scale is much larger than the local boundary layer thickness. The
Micro Geometric Spoilers considered here are similar in function to what are referred
to as micro geometric tabs, which have been variously used for load alleviation on
aircraft wings [7], load alleviation on helicopter rotor blades [8], and load alleviation on
wind turbine blades [9]. The work in this thesis is distinct in that it considers the use of
MiGS and CFFS as flight control devices directly in comparison with macro geometric
spoilers, and trailing edge controls.
A Counter-flow Fluidic Spoiler is a device that produces a thin tangential jet of air on
the surface of a wing in a direction opposing the local flow direction. Tangential
blowing in general for flow control has been widely studied with applications mainly

CHAPTER 1 – INTRODUCTION
C.D. HARLEY 20
focussing on the area of Circulation Control (CC) which is based on control of
separation location on a curved trailing edge [10] or, less commonly leading edge
blowing which is based on vortex modification [11]. CC applications are historically
concerned with increasing lift for high lift applications, however there have been recent
applications where CC has been used as control effectors [12], [13]. In this work a
trailing edge dual upper/lower surface co-flow slot device is used to provide lift
modulation in a positive and negative sense. The present work is distinct to the
foregoing in that a counter-flow tangential jet is used and the aim is primarily to
produce drag through flow separation, with change in lift a secondary (but still
important) consideration. In the same way that flow topology generated by suction is
structurally different to the topology of blowing, co-flow and counter-flow topology are
also structurally different, with counter-flow introducing distinct separation structures
in the flow whereas no additional structures are produced by co-flow.
Whilst MiGS and CFFS are very different from a practical implementation point of
view, there are strong similarities in the nature of the flow control input they provide, in
that they both introduce a forcing in a counter-flow tangential direction. A MiGS does
this by effective reduction of momentum in the co-flow direction, whereas a CFFS
achieves this by addition of momentum in the counter-flow direction. As such, it is
instructive to compare these devices in the same study since this sheds light on the
fundamental fluid mechanism common to both.
An aim of this work is to show that the mechanism of flow control of MiGS and CFFS
devices is similar to that of macro geometric spoilers, based on aerodynamic
investigations of MiGS and CFFS. Two–dimensional wind tunnel investigations of
MiGS and CFFS and two-dimensional numerical analyses of CFFS have been

CHAPTER 1 – INTRODUCTION
C.D. HARLEY 21
performed and are presented in later chapters of this thesis. The independent variables
used in the investigations are the actuation input (height for MiGS, and blowing
coefficient for CFFS), angle of attack, and chordwise geometric location of the device.
The dependent variables are lift, drag and pitching moment. Aerodynamic performance
is discussed in terms of effectiveness, efficiency, linearity and cross coupling.
Effectiveness considers the relative magnitude of the control output for a particular
configuration, whereas efficiency (or gain) describes the ratio of aerodynamic output to
control input (where the control input for MiGS is the spoiler height
nondimensionalised with wing chord, hs/c, and for CFFS is blowing coefficient, C).
Effectiveness and efficiency are linked in the absence of control saturation.
Effectiveness is typically determined by the control gain at the test condition. Control
linearity refers to the degree to which control outputs are simply proportional to control
inputs. Whilst some degree of nonlinear control is acceptable, increasing nonlinearity
increases the complexity of the control system implementation and may limit the
ultimate authority of the control. Control cross coupling refers to the degree to which
changes in lift, drag and pitching moment due to control inputs are correlated. Ideally,
from an implementation point of view, the control outputs should be fully uncorrelated.
For a single control device this is not possible, however by the use of an upper and
lower surface device it is possible to remove the correlation between drag and lift, and
drag and pitching moment.

CHAPTER 1 – INTRODUCTION
C.D. HARLEY 22
1.2 Aims and objectives
The aim of this thesis is:
To develop and demonstrate an understanding of the aerodynamic performance of
Micro Geometric and Counter-Flow Fluidic Spoilers for flight control applications.
The objectives of this thesis are to:
Set the work in context within the broader field of aircraft flight control devices
and establish the motivation of the work (Chapter 1)
Describe the aerodynamics of aircraft control devices, in particular spoilers and
introduce the qualitative aerodynamic models used in this work (Chapter 2)
To provide a relevant literature review, focusing on the historical development
of aircraft geometric and fluidic spoiler technology (Chapter 3)
Describe the experimental and computational research methods used in this
work (Chapter 4 and 5)
Present and discuss the computational and experimental results (Chapter 6)
Present conclusions and propose areas for future research (Chapter 7)

CHAPTER 2 – THEORY
C.D. HARLEY 23
2 THEORY
The aim of this chapter is to build understanding of the aerodynamic
characteristics of spoiler devices. A qualitative model which collects
conventional trailing edge and spoiler devices into equivalent
modifications of camber to predict their aerodynamic response is
presented. The similarities and differences of the flow topology of
geometric and fluidic spoilers are then discussed, followed by a description
of a geometric spoiler flow field. Finally the effect of a geometric spoiler
on the surface pressure distribution is described.
2.1 Qualitative model for the effect of camber
A very simple but useful model for predicting the qualitative performance of flight
controls on lifting surfaces can be derived by considering the effect of the control on
the camber of the local aerofoil section. For a two-dimensional symmetrical aerofoil
section at a fixed low angle of attack (below the stall angle), a positive increment in
camber produces a positive increment in lift, positive increment in drag and a negative
increment in pitching moment (taken about the aerodynamic centre). A negative
increment in camber at the same conditions produces a negative increment in lift, a
positive increment in drag and a positive increment in pitching moment. This behaviour
is summarised in Figure 2.1. Note that for camber change through rearward mounted
spoiler deflection, the model is qualitatively correct for lift and drag, however the sign
of the pitching moment will in general depend on the chordwise location of the spoiler
(forward spoiler locations will tend to produce a pitching moment change in the
opposite sense to aft located devices). The drag considered in this case is the profile

CHAPTER 2 – THEORY
C.D. HARLEY 24
drag, however one could also consider the pressure drag which does not take into
account the effect of the skin friction.
Figure 2.1: Qualitative illustration of the effect of aerofoil camber on lift drag and
pitching moment
2.2 Comparison of flow topology models for geometric and fluidic
spoilers
Figure 2.2 shows the steady time-averaged two-dimensional streamline topology for
three spoiler devices, a) a micro geometric spoiler (MiGS), b) i) a normal blowing
fluidic spoiler (NBFS, a jet exhausts from a slot normal to the local surface) and b) ii) a
counter-flow fluidic spoiler (CFFS). These diagrams are based on streamline data from
CFD analyses; refer to Chapter 5 for details on CFD methodology used. It can be seen
in Figure 2.2 that the flow field from a geometric and fluidic spoiler is broadly similar,
but with a number of detailed differences regarding the number and location of the

CHAPTER 2 – THEORY
C.D. HARLEY 25
separation and attachment points. Upstream of all spoiler locations there is a separation
point, however the fluidic spoiler cases also have an attachment point due to the jet
momentum causing a recirculating region upstream of the jet. Downstream of the
spoiler locations a large recirculating region is formed, however unlike the geometric
and normal blowing spoilers the CFF spoiler does not have a small recirculating region.
From the above observations it is expected that the control response of micro geometric
and fluidic spoiler devices is similar. However, for macro geometric devices at large
deflection angles the control drag response is dominated by the increase in projected
area of the spoiler, so it is likely that there will be significant differences with fluidic
devices in this case.
Figure 2.2: Steady time-averaged two-dimensional streamline topology for three
spoiler devices, a) geometric spoiler and b) i) normal blowing fluidic spoiler, and b)
ii) counter-flow fluidic spoiler.
2.3 Geometric spoiler flowfield and global aerodynamic coefficients
This section discusses the flow field around a two-dimensional aerofoil with deflected
geometric spoiler and presents the effect of spoiler deflection on the global
aerodynamic coefficients of a lifting surface. It is based mainly on information from the

CHAPTER 2 – THEORY
C.D. HARLEY 26
ESDU data sheet item on spoiler aerodynamics [2] and with some additional material
from standard aerodynamics texts [14].
A deflected spoiler will generally cause the flow over a lifting surface to separate. The
extent and detailed characteristics of the separation will in general depend on the
effective height of the spoiler (projected frontal height), the chordwise position, the
aerofoil section, the aerofoil incidence, and the free stream Mach number and Reynolds
number. Figure 2.3 shows the typical steady flow field features around an aerofoil with
deflected rearward mounted (macro) geometric spoiler at a low positive angle of attack,
adapted from Lee and Bodapati [15]. There are two main regions of separation
identified in the figure. One termed the hinge bubble is located just ahead of the spoiler
hinge position and encompasses the lower region of the spoiler. The second region of
separation originates from the spoiler tip and emanates aft of the spoiler as a free shear
layer. If this separation stays completely detached from the aerofoil surface an
approximately constant base pressure is formed. At low spoiler deflections and/or a
forward located spoiler the separated flow from the spoiler tip can reattach ahead of the
trailing edge. This can cause a non-linear change in lift with spoiler deflection, as
shown in Figure 2.4 a).
Figure 2.3: Typical flowfield due to a rearward mounted macro geometric spoiler
Figure 2.4 shows the effect of a deflected spoiler on the global aerodynamic
coefficients of a wing. A rearward mounted deflected spoiler causes a loss in lift,
consistent with the qualitative model of Figure 2.1 a), an increase in drag, consistent
with the qualitative model of Figure 2.1 b), and an increase in pitching moment,

CHAPTER 2 – THEORY
C.D. HARLEY 27
consistent with the qualitative model of Figure 2.1 c). Chordwise location is an
interesting variable, such that a forward mounted upper surface spoiler at low
deflections can cause an increase in lift, due to flow reattaching downstream of the
spoiler, and generally causes a reduction in pitching moment.
a) Lift change with spoiler deflection b) Drag change with spoiler
deflection
c) Pitching moment change with spoiler deflection
Figure 2.4: Typical rearward mounted (apart from where stated) spoiler effect on
lift, drag, pitching moment and change in surface pressure with deflection. a) and
b) adapted from ESDU data sheet [2]. c) adapted from McLachlan et al [16]
2.4 Spoiler pressure distribution model
Separation of the flow over a lifting surface causes a modification of the surface
pressure distribution and therefore changes the overall forces and moments. A
qualitative model for the change in surface pressure distribution for an aerofoil with
deflected upper surface rearward mounted spoiler is shown in Figure 2.5. There is an
increase in pressure ahead of the spoiler and a decrease in pressure downstream of the
spoiler. The pressure on the lower surface decreases with spoiler deflection. This
decrease is relatively small compared to the changes on the upper surface and is
associated with the reduction in circulation around the aerofoil, due to a change in the
effective camber of the aerofoil.

CHAPTER 2 – THEORY
C.D. HARLEY 28
Figure 2.5: Effect of increasing spoiler deflection/height on the wing section surface
pressure distribution

CHAPTER 3 – LITERATURE REVIEW
C.D. HARLEY 29
3 LITERATURE REVIEW
The first part of this section will review the early development of geometric
spoilers for lateral aircraft control. This will be followed by the application
of spoilers for lateral control of tailless aircraft. The section will then
conclude with a review of fluidic spoiler type devices for lateral aircraft
control.
3.1 Geometric spoilers for aircraft flight control
3.1.1 Development of spoilers for aircraft control
Hinged flight controls on the trailing edges of aerodynamic surfaces are relatively
simple to implement, are effective in producing the control moment magnitudes needed
for flight control, and the control response characteristics are generally linear over a
useful range of angle of attack and control surface deflection. As such, most aircraft in
the early part of the 20th Century used combinations of aileron, elevator and rudder for
flight control. One issue with ailerons for roll control is the drag on the down going
aileron generates a yawing moment in the adverse sense, in that it generates a yaw rate
of opposite sense to that required for a coordinated turn [17]. A further issue with use
of ailerons is that control deflection generates significant pitching moment, which tends
to twist the wing in the opposite sense to the deflection of the control. In the first
instance this leads to a reduction in aileron effectiveness, moreover with slender wings
and high speed flight this may lead to control reversal [18]. In light of these issues, a
number of studies were initiated in the 1920‟s looking at the use of alternative flight
controls for lateral control, in particular, spoiler type controls for which the yawing

CHAPTER 3 – LITERATURE REVIEW
C.D. HARLEY 30
moment is pro turn and there is significantly less pitching moment for a given change
in lift compared to trailing edge controls.
Some of the earliest spoiler type devices included “Baffle flaps” [19] and “Projecting
flaps” [20]. Baffle flaps were leading edge spoilers on the upper surface of a wing,
aimed at decreasing lift, increasing drag and thereby causing a rolling moment and a
pro turn yawing moment. Projecting flaps were very similar to baffle flaps, however,
were not limited to only forward chordwise location, but various locations across the
wing surface. Figure 3.1 shows a typical forward mounted spoiler from the early
1930‟s. References for both forms of spoiler terminology can be traced back to the
early 1920‟s. Around the early 1930‟s these terms were quickly dropped for the more
common “spoiler” terminology, but it is unclear who first used the term.
Figure 3.1: One of the first applications of a forward mounted and forward hinged
spoiler to aircraft wings taken from Weick and Wenzinger [21]
Eliminating adverse yaw was an important driving factor in the first spoiler
investigations of the 1930‟s and 1940‟s. A number of investigations were performed by
NACA during this period aiming to gain a full understanding of spoiler devices for
lateral aircraft control[17], [22], [23], [19-21], [24-33], the main findings of which were
reported to the state of congress in NACA‟s 18th
annual report [22]. The report states
the overall aim of the investigations is to obtain “Satisfactory stability and

CHAPTER 3 – LITERATURE REVIEW
C.D. HARLEY 31
controllability…attained throughout the entire range of speed or of angle of attack”.
An actual definition of satisfactory stability and control was not provided in the report
and was not attempted until flight investigations a few years later [23]. The flight
investigations tested control devices for their lateral aircraft control potential, in
particular ailerons and spoilers. The required flight characteristics for lateral aircraft
control were defined as:
The production of a rolling moment that corresponds to a lateral movement of
the centre of pressure by 7.5 percent of the span.
The maximum rolling rate is aircraft and pilot sensitive but was not given a
definitive limit.
The response of the aircraft to any movement of the lateral control surface
should be immediate, any noticeable delay or hesitation in the action is
objectionable.
Finally, the action should be graduated so that the acceleration and maximum
rate of roll increase smoothly and regularly as the stick deflection is increased.
Wind tunnel tests performed by Weick et al [24] showed forward mounted spoilers to
be effective, especially at high angles of attack where the effectiveness of ailerons
reduces significantly. Figure 3.2 compares the rolling and yawing moments of a spoiler
deflected on the upper surface of a starboard wing, with a positively deflected aileron
on the starboard wing, as the angle of attack is increased. The aileron rolling moment is
independent of angle of attack up to 12 degrees, while the spoiler rolling moment
increases with angle of attack up to 16 degrees. The opposite is observed in the yawing
moment response, where the spoiler yawing moment is independent of angle of attack
up to 12 degrees and the aileron yawing moment decreases with angle of attack. The

CHAPTER 3 – LITERATURE REVIEW
C.D. HARLEY 32
constant positive yawing moment of the spoiler is a favourable (pro turn) yawing
moment. However, this report lacks any comparison of the effect of pitching moment
due to control deflection.
Figure 3.2: Comparison of rolling and yawing moment coefficients obtained with
ailerons and spoilers during wind tunnel testing, taken from Weick et al [24].
An investigation into the in-flight characteristics of lateral control devices is presented
by Weick et al [23]. The Fairchild 22 aircraft was used with the configurations shown
in Figure 3.3, consisting of three types of forward mounted spoiler; a rearward hinged
spoiler, a forward hinged spoiler and a retractable spoiler.

CHAPTER 3 – LITERATURE REVIEW
C.D. HARLEY 33
Figure 3.3: Lateral control device configurations on the Fairchild 22 airplane during
flight tests. Taken from Weick et al [23].
The aircraft time response due to inputs from these spoiler configurations and an
aileron control input is shown in Figure 3.4. Pilots reported a delay in aircraft response
to a control input from these forward mounted spoilers. The figure shows the aircraft
control response due to an aileron deflection has a lag of 0.1s and a spoiler deflection
has a lag of between 0.4s and 0.6s, based on a rate of roll of 0.1rad/s. The time lag can
be transformed into a time constant dependent on the aircraft velocity and chord length
to be, 𝑡𝑉 𝑐 = 5.9 𝑡𝑜 8.8. The spoiler lag was only observed in the rate of roll, whereas

CHAPTER 3 – LITERATURE REVIEW
C.D. HARLEY 34
no lag was observed in the rate of yaw. Whilst the authors don‟t suggest a reason for
this, it could be due to the change of local wing section surface pressure caused by the
separated flow downstream of the spoiler, whereas the main component of the drag is
probably caused by the pressure drag on the front face of the spoiler which would
adjust more quickly than the local wing section surface pressure. Subsequent research
focused on the lateral control performance of spoilers in a more rearward chordwise
location.
Figure 3.4: Time history curves showing the lag characteristics of various control
systems. Indicated air speed, 22m/s, full control deflection Taken from Weick et al
[23].
Wenzigner and Rogallo [25] showed the lag time of the rolling moment coefficient of a
spoiler deflection reduced by a half when a spoiler was moved from 0.29c to 0.55c, and
the maximum rolling moment reduced by ~20%. Wenzigner and Rogallo also
performed investigations on a number of other types of spoiler devices such as lower

CHAPTER 3 – LITERATURE REVIEW
C.D. HARLEY 35
surface spoilers or deflectors, upper surface spoilers and deflector combinations, and
upper surface spoilers and deflector combinations with a slot allowing airflow in
between, more commonly known as spoiler-slot-deflectors (SSD). Figure 3.5 shows
some of the investigated spoilers in combination with ailerons and split flaps. The
following provides a summary of the main conclusions found is the study.
Figure 3.5: Summary of a selection of spoiler and deflector combinations
investigated by Wenzigner and Rogallo. [25].
In terms of effect on lift, it was observed that spoilers or deflectors alone were not as
effective as the combination of a spoiler and deflector. This effectiveness was increased
i) Forward hinged spoiler, in
combination with spilt flap
ii) Forward hinged spoiler, in
combination with aileron
a) Conventional upper surface spoiler combinations
i) Retractable deflector, in
combination with spilt flap ii) Rearward hinged deflector, in
combination with spilt flap
iii) Rearward hinged deflector, in
combination with aileron
iv) Forward hinged deflector at 0.11c, in
combination with aileron
iii) Retractable spoiler, in
combination with split flap
b) Deflector combinations
iii) Retractable spoiler and
Deflector, in combination
with split flap
i) Spoiler and Deflector, in
combination with split flap
ii) Spoiler and Deflector, in
combination with split flap
c) Spoiler Deflector combinations

CHAPTER 3 – LITERATURE REVIEW
C.D. HARLEY 36
further by adding a slot in between the spoiler and deflector such that airflow from the
lower surface is fed through the aerofoil to the upper surface behind the spoiler. This
causes a loss of pressure on the lower surface of the aerofoil, and an increase in
pressure on the upper surface, and therefore an overall reduction in lift.
Following the improvement in lag time for a rearward mounted spoiler, a series of
flight investigations were performed, aiming to test a number of lateral control
configurations. One such lateral control configuration, shown in Figure 3.6, is the use
of a spoiler and aileron at the same spanwise station. This configuration in the form of
high lift flap and spoiler went on to become the standard configuration for transport
aircraft.
Figure 3.6: Three quarter rear-view of the test airplane as instrumented for flight
showing deflected flap, drooped aileron, deflected spoiler and open slot. Taken from
[26]
With the advent of the Second World War, aircraft technology advanced dramatically
and with it the requirements for lateral control changed. Investigations of lateral control
performance of a 0.75c spoiler on a tapered wing at high speed showed an increase in

CHAPTER 3 – LITERATURE REVIEW
C.D. HARLEY 37
effectiveness with speed. The overall performance of which was stated “suitable to
replace ailerons”, however, with the caveat that a time response investigation were
required to show a negligible lag [34].
As aircraft speeds increased, wing twist due to aileron deflection became large enough
to cause an appreciable loss in rolling effectiveness, known as control reversal. This
high speed effect once again made spoilers attractive as lateral control devices due to
their lower associated pitching moments. An investigation on the effect of wing twist
caused by a spoiler deflection was performed by Fitzpatrick and Furlong [27]. Figure
3.7 shows a comparison of the effect of flaps and spoilers on the pitching moment with
the hinge point of the control surface at various chord-wise locations. The change in
pitching moment from the flap and spoiler deflection is of the same orientation; in this
case a negative flap deflection and upper surface spoiler deflection cause a nose up or
positive pitching moment. The figure shows that the negative flap deflection causes a
positive pitching moment, nose up, at all hinge locations, whereas a spoiler deflected
and located ahead of 0.4c causes a negative or nose down pitching moment. The overall
effect of a spoiler deflection on the aircraft pitching moment will depend on the spoiler
longitudinal location with respect to the aircraft centre of gravity. However, a spoiler
deflection produces half of the pitching moment change compared to a flap at
approximately 0.75c, which is advantageous for a reduced wing twist compared to
ailerons and is therefore capable of a higher control reversal speed.

CHAPTER 3 – LITERATURE REVIEW
C.D. HARLEY 38
Figure 3.7: Effect of chordwise location on pitching moments for flaps and spoilers,
taken from Purser and McKinney [28].
3.1.2 Effectiveness of spoilers applied to swept wings
This thesis reports and discusses the two dimensional aerodynamic performance of a
MiGS and CFFS device. For future research directions it is important to highlight the
effect of wing sweep on the control performance of a spoiler device.
Figure 3.8 shows the effect of wing sweep on the lateral control power of spoilers and
flaps taken from Letko [30]. The spoilers and flaps span the same amount of semi-span,
with the spoilers hinged at a constant 0.7c, and the flaps hinged at a constant 0.75c.
There is a loss in rolling-moment with angle of sweepback at a fixed Mach number and
angle of attack for both the flaps and spoilers. The rate of loss in rolling moment with
increasing sweep angle is similar for both flap and spoiler. Both the flap and spoiler
have an inherent directional stability mechanism, whereby the windward wing is more
effective at producing an increase in drag with control deflection, therefore a control
deflection increases directional stability.

CHAPTER 3 – LITERATURE REVIEW
C.D. HARLEY 39
Figure 3.8: Effect of angle of sweepback on rolling-moment coefficients produced by
flap-type ailerons and spoilers. Flap deflection and spoiler projection measured in
plane perpendicular to leading edge. Taken from Letko et al [30].
3.1.3 Use of spoilers on modern civil transport aircraft
Conventional wing/tail transport aircraft design has converged to the use of upper
surface spoilers typically mounted on the wing rear spar. Civil transport aircraft today,
such as the Boeing B737, use asymmetric aileron deflection and or spoiler deflection to
minimise any adverse yawing moment for roll control. Figure 3.9 shows a control
surface deployment comparison between cruise, roll manoeuvre and landing on

CHAPTER 3 – LITERATURE REVIEW
C.D. HARLEY 40
approach. Conventional spoilers are suitable lateral aircraft control devices particularly
during the approach phase where a reduction in lift and an increase in drag are required.
Figure 3.9 b) shows the spoilers deflected for the production of roll rate modification,
while Figure 3.9 c) shows all spoilers fully deployed for lift dumping and drag increase
on landing. What is not apparent from these pictures is that spoilers are deflected
asymmetrically for a roll manoeuvre, and deflected symmetrically for lift dumping and
air braking.
Figure 3.9: Photo taken from inside a Boeing 737 during the approach phase
Figure 3.10 shows spoilers deployed during a) cruise conditions for roll manoeuvre and
b) the landing phase for lift dumping and air braking. The Airbus A380 deploys a total
of 8 spoiler control surfaces on each wing covering 60% of the wing span during the
landing phase.
a) Cruise configuration b) Roll manoeuvre during
approach
c) landing with full high-
lift devices

CHAPTER 3 – LITERATURE REVIEW
C.D. HARLEY 41
Figure 3.10: Spoiler deployed during a) cruise conditions of an Airbus A333 and b)
landing phase of an Airbus A380.
3.1.4 Application of spoiler type devices to tailless aircraft
For tailless/finless aircraft where spoilers may be the only means of yaw control,
implementation is more varied compared to aircraft with vertical lifting surfaces for
yaw control. Tailless/finless aircraft such as the B2-spirit and diamond planform
Pegasus UCAV use split flaps, and upper and lower surface spoiler devices respectively
for yaw control.
There have been a number of studies investigating innovative control effectors for
tailless aircraft [35], [36]. These studies aimed to implement control effectors that could
reduce weight, improve reliability, reduce radar signature, improve aerodynamic
a) Airbus A333 during cruise roll manoeuvre
b) Airbus A380 during landing phase

CHAPTER 3 – LITERATURE REVIEW
C.D. HARLEY 42
efficiency and improve aircraft manoeuvrability. These control aims have moved on
since the requirement for “satisfactory stability and controllability” in the 1930‟s.
Wood and Bauer in 1998 performed an investigation on a number of control concepts
that focused on “micro flow management” for aircraft control [35]. Micro flow
management refers to the use of micro geometric/fluidic devices for flow control that
can provide sufficient changes to the global aerodynamic coefficients for aircraft flight
control. Micro geometric flow devices include micro drag bumps or micro drag
generators (MDG), spoilers and splitter plates, which due to having heights of the order
of the local boundary layer, are attractive for low observable military applications.
Alone, micro flow devices may not provide comparable effectiveness compared to
conventional controls, however, surface contouring technologies that alter the pressure
field over a wing such that only a small disturbance is required to cause a control
response may provide an indirect method of improving the effectiveness of micro
controls devices .
The micro drag generator (MDG) concept consists of a number of micro tabs with
heights similar to the local boundary layer, distributed at regular chordwise intervals
across a spanwise station of a wing [37]. These MDG‟s extrude from the wing surface
to cause a local surface flow separation, which in turn causes an increase in wing drag.
A high profile drag modulating system such as the MDG‟s would also lend itself to a
steep-descent manoeuvre for transport aircraft where high profile drag is very
beneficial as discussed by Filippone [38]. The MDG concept is shown in Figure 3.11.
CHAPTER 3 – LITERATURE REVIEW
C.D. HARLEY 43
Figure 3.11: Micro drag generator (MDG) system showing MDGs on the upper and
lower surface adapted from Bauer [37].
Wood and Bauer suggest the performance of a MDG system would be equivalent to a
single spoiler device with the same overall projected area. A simple analysis is
performed in this thesis that calculates the effect or the drag due to the projected face of
the MiGS (similar to the MDG concept). It was found that 20% to 40% of the total drag
was due to the frontal area of the MiGS, but with high dependence on chord-wise
location. With a system of MiGS devices any amplification similar as that observed for
the MiGS would probably be reduced. However, a study investigating performance
with increasing numbers of MiGS devices would be worthwhile, assuming the cost of
increasing the number of surface discontinuities was justified.
An MDG system may be attractive for its low observable characteristics; however the
wing skin is often part of the load bearing structure which may be compromised by the
large number of discontinuities in the wing. The need for additional strengthening may
lead to an increase in aircraft weight. A single MiGS or CFFS device would therefore
cause less of an impact on the wing structural load.
The Innovative Control Effectors (ICE) investigations from NASA, reported in 1996 on
the lateral control effectiveness of control devices for tailless aircraft [36]. Spoiler type
devices included spoiler-slot-deflectors (SSD) and lower surface spoilers (LSP).
Initially an overview of spoiler type devices applied to a tailless aircraft configuration
is given, and is highlighted here.

CHAPTER 3 – LITERATURE REVIEW
C.D. HARLEY 44
The effect of spoiler sweep angle on a diamond wing planform is shown in Figure 3.12.
At high angles of attack (>20o), the figure shows that aircraft response from a spoiler
deflection is dependent on spoiler sweep angle. It is not clear whether this result is
planform specific, however due to the lack of literature on effectiveness due to spoiler
sweep angle no general conclusions on spoiler performance can be made.
Figure 3.12: Effect of spoiler sweep on the lateral control power of a 60o swept
tailless aircraft configuration. Taken from Dorset and Mehl [36]
A spoiler-slot-deflector (SSD) can improve the overall effectiveness of a simple upper
surface spoiler configuration for tailless aircraft lateral control. The lateral effectiveness
of a spoiler and SSD applied to the same 60o swept tailless aircraft configuration is
shown in Figure 3.13. The figure shows the SSD provides nearly 50% improvement in
lateral control power compared to conventional spoilers at 20o angle of attack. SSD‟s
were also shown to remove the non-linear control response of an upper surface spoiler
at small deflections.

CHAPTER 3 – LITERATURE REVIEW
C.D. HARLEY 45
The SSD device benefits from greater effectiveness than a conventional spoiler,
however the implications with airflow movement between the upper and lower wing
surfaces provides other engineering problems that have hindered further development
of SSD‟s.
Figure 3.13: Lateral control power of a spoiler and SSD applied to a 60o swept
tailless aircraft configuration. Taken from Dorset and Mehl [36]
3.2 Fluidic spoiler concepts for aircraft flight control
3.2.1 Introduction
This section reviews a number of studies investigating fluidic spoilers for lateral
aircraft control. Jets of air issuing from the lower wing surfaces were initially
investigated for VSTOL applications during the 1970‟s [39]. Particular focus was on
hover and the transition phases (from forward flight to hover, or from hover to forward
flight). Both favourable and unfavourable effects can be identified during these phases

CHAPTER 3 – LITERATURE REVIEW
C.D. HARLEY 46
of the VSTOL process. For example, during hover, a loss of lift due to jet thrust can be
caused by the jet entraining the freestream air, and during the transition phase an
increase in lift can be caused by effects of the jet-cross flow interaction on the
aerodynamics of the wing. The favourable effect during the transition phase has
motivated a number of studies investigating the potential use of jets issuing from the
wing surfaces to cause a change to the aerodynamic characteristics and ultimately
lateral aircraft control.
3.2.2 Roll control
Leopold et al [40] presents the data from a two-dimensional wind tunnel investigation
of a normal blowing fluidic spoiler (NBFS) concept, previously mentioned in the
theory section when comparing the flow topology of geometric and fluidic spoilers.
Figure 3.14 shows a jet issuing from the lower surface of the wing with the aim of
causing an increase in lift and therefore a roll control.
Figure 3.14: Normal blowing fluidic spoiler concept taken from Leopold et al [40].
The model consisted of a NACA 0018 aerofoil with a slot running 90% of the span to
minimise three-dimensional effects, and located at a 0.5c. A uniform flow along the slot
was obtained by the use of a plenum and internal vanes, for which there are no
schematics.
The results show that at zero angle of attack and for a blowing coefficient, C = 0.48,
the sectional lift coefficient increases by ~1.0 (this does not include the lift due to the

CHAPTER 3 – LITERATURE REVIEW
C.D. HARLEY 47
jet thrust). A sectional lift coefficient of 1.0 is approximately equal to an angle of attack
of 10o for a NACA 0018 aerofoil. The lift was calculated from the aerofoil surface
pressure distribution, which with a low density of pressure tapping‟s can be a source of
error, however there appears to be sufficient data to capture the changes in surface
pressure. Figure 3.15 shows the model pressure distribution due to a blowing
coefficient of 0.48. The effect of a NBFS is very similar to that of a geometric spoiler,
with an increase in pressure ahead of the jet, a reduction in pressure downstream of the
jet, and a reduction in pressure on the aerofoil surface opposite to the jet.
Leopold et al presents a wake profiles at various distances downstream of the model,
but does not calculate the associated drag from these results. There are also no force
balance measurements and therefore no reference to jet blowing effect on the model
pitching moment coefficient. Although achieving impressive lift gains with the use of a
jet, without understanding the effect of normal blowing on drag and pitching moment
there cannot be a valid conclusion on the potential of normal blowing for lateral aircraft
control from this work.
Figure 3.15: Pressure distribution of the normal blowing fluidic spoiler taken from
Leopold et al [40]. Blowing coefficient, C = 0.48, angle of attack, = 0o, Reynolds
number, Re = 2x10⁵.
-2.5
-2
-1.5
-1
-0.5
0
0.5
1
1.5
0 0.2 0.4 0.6 0.8 1
CP
X/C
Spoiler located at
mid chord, 0.5c

CHAPTER 3 – LITERATURE REVIEW
C.D. HARLEY 48
Walchli and Langan [41] applied the NBFS concept to a highly swept semi-span high
aspect ratio wing in high subsonic and transonic regimes. The normal blowing spoiler
configuration consisted of a row of holes just ahead of the flap hinge line. In all cases
tested, increasing the blowing coefficient reduced the lift with the exception at a Mach
number of 0.9, where the lift increased. This change in lift is due to influencing the
shock location. The effectiveness of blowing appears to plateaux after a small amount
of blowing. This is the only experimental investigation of fluidic spoiler devices
applied to a realistic wing planform in the transonic regime, known to the author.
3.2.3 Yaw control
Yaw control using a NBFS was investigated by Tavella et al [42]. The concept is very
similar to that of Leopold et al and appears to be from the same research group.
Leopold et al showed that a lower surface NBFS can cause a substantial increase in
aerofoil lift. Tavella et al targets an increase in drag to cause a yawing moment, with
minimal changes in lift. A NBFS was applied to the outboard region of a rectangular
semi-span wing of constant NACA 0018 cross-section. The blowing concept is shown
in Figure 3.16 a) and the wind tunnel model is shown in b).

CHAPTER 3 – LITERATURE REVIEW
C.D. HARLEY 49
Figure 3.16: Diagram of ,a) cross-sectional view of the model at the slot mid-span
and b) top view of the semi-span wind tunnel model used by Tavella et al [42].
Results show that the overall effect on lift is negligible over the angle of attack range of
-4o to +4
o up to a blowing coefficient of 0.0375. The change in drag due to a blowing
coefficient was constant over the angle of attack range of -4o to +4
o. It appears that the
NBFS is sensitive to wing tip effects, however this cannot be confirmed due to the lack
of lift and drag data from a comparable NBFS study. This study also does not present
the effect normal blowing on the pitching moment of this model, therefore a conclusion
on the relative effectiveness of a NBFS for aircraft lateral control cannot be made.
V∞
b) Top view of the model identifying
important features
a) Normal blowing jet spoiler concept

CHAPTER 3 – LITERATURE REVIEW
C.D. HARLEY 50
For aircraft control systems it is important to understand the effect on the lift, drag and
pitching moment due to actuation. Currently there is no literature known to the author
that combines this information for a fluidic spoiler device, and also compares the
aerodynamic performance of a fluidic and geometric spoiler.
3.3 Summary of literature review and concluding remarks
Spoilers were initially investigated for their production of a favourable (pro
turn) yawing moment with deflection, and relatively higher control reversal
speeds compared to trailing edge devices.
Early wind tunnel testing showed that forward mounted spoilers were capable
of replacing ailerons for lateral control. However, flight testing of forward
mounted spoilers showed a substantial lag in aircraft response compared with
ailerons. Moving the spoiler further aft reduced the aircraft response time, but
also reduced the effectiveness of the spoiler.
Micro flow management devices such as micro drag generators may be
attractive for low observable military applications, however implementation for
flight control may require further understanding on the potential cost to the
wing structural design.
The effectiveness of macro geometric spoilers and ailerons as lateral control
devices reduces with increasing wing sweep angle.
A two-dimensional wind tunnel study of a NBFS located at the mid-chord on
the lower surface of a NACA0018 aerofoil section can increase the lift by a CL
= 1.0 for a blowing coefficient, C = 0.48, at constant angle of attack.
A NBFS located in near the wing tip of a semi span wing can provide increases
in drag while producing negligible changes in lift at a blowing coefficient, C =

CHAPTER 3 – LITERATURE REVIEW
C.D. HARLEY 51
0.0375.
A general observation of most of the papers reviewed here is the lack of lift,
drag and pitching moment (for two-dimensional studies, or rolling moment,
yawing moment and pitching moment for three-dimensional studies) results
from a single control input. Therefore a full picture of the control characteristics
cannot be performed.

CHAPTER 4 – RESEARCH METHODS
C.D. HARLEY 52
4 EXPERIMENTAL METHODS
This chapter presents the experimental research methods employed to
obtain the two-dimensional aerodynamic performance of Micro Geometric
Spoilers (MiGS) and Counter-Flow Fluidic Spoilers (CFFS). The wind
tunnel model configurations are described, along with the measurement
techniques, data reduction performed and the experimental validation and
uncertainties.
4.1 Experimental apparatus
4.1.1 Project wind tunnel
Wind tunnel tests were performed in the open circuit Project Wind Tunnel at the
University of Manchester. The tunnel has an octagonal test section with maximum
dimensions of 1m x 1.1m and a length of 2m, Figure 4.1. The maximum test section
velocity is ~50m/s. The test section velocity was measured using calibrated static
pressure tappings in the tunnel settling chamber ahead of the contraction cone and just
ahead of the test section. The tunnel overhead six-component force/torque balance was
used to measure forces and moments. The tests were conducted at a velocity of 24.5m/s
corresponding to a Reynolds number based on model chord length of 6x10⁵. Whilst this
Reynolds number is clearly lower than that expected for full scale application, it is
sufficiently high to avoid gross low Reynolds number effects within the angle of attack
range tested [43].

CHAPTER 4 – RESEARCH METHODS
C.D. HARLEY 53
Figure 4.1: Overview of the project tunnel test section showing major dimensions and
model orientation.
4.1.2 Wind tunnel model configurations and manufacture
Details of the wind tunnel model geometry are shown in Figure 4.2. The wind tunnel
model has a NACA 0015 aerofoil section, constant chord of 350mm and a span of
730mm. Use of a symmetrical aerofoil section and upper and lower surface spoilers
locations removed the need to test at negative angles of attack. A relatively thick (15%)
section was used to increase the likely changes in drag obtained from the spoiler and
hence improve measurement accuracy.
The model core was manufactured from 'blue' polyurethane foam using an outsourced
CNC hot wire cutting service. Recesses were cut out of the surface of the foam for 28
thin tube pipes for surface pressure measurement. The model skin was made from
obechi veneer skins bonded with epoxy to the foam core and finished with carbon fibre
composite sheet for surface finish and strength.
End plates
grounded to
test section
Vertically
mounted
model
V∞
6 component
force/torque
balance mount
1.1
m 2m
1m
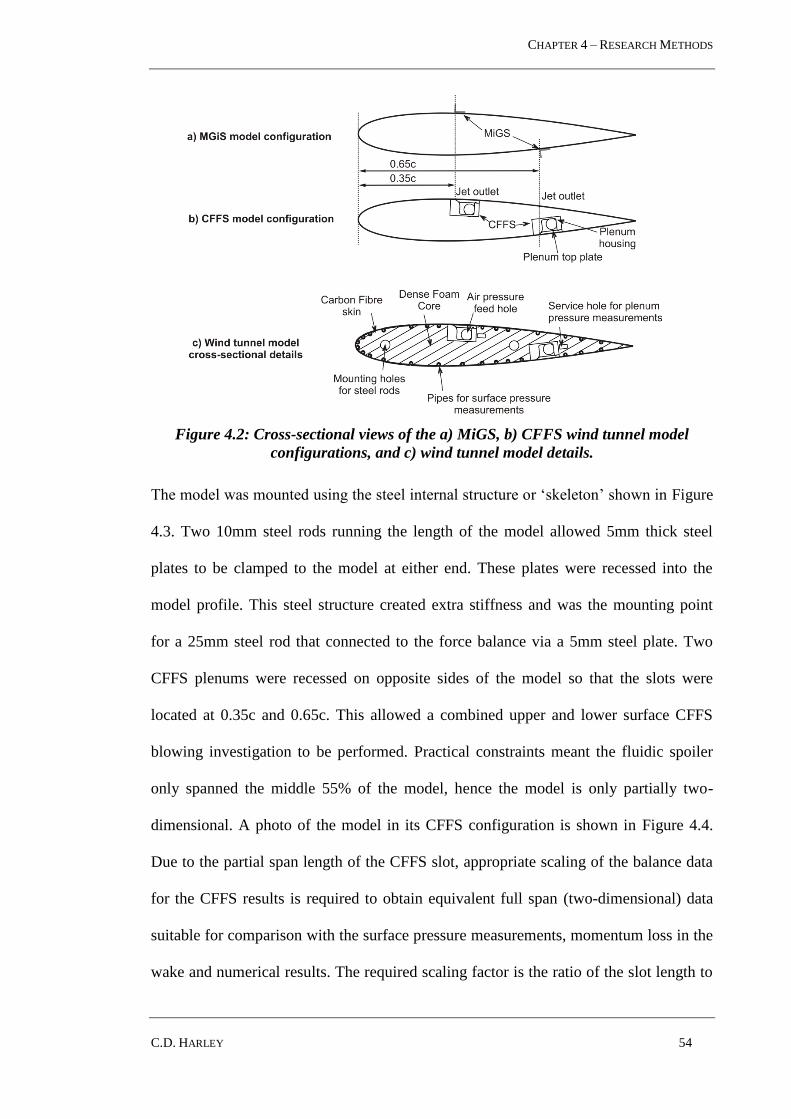
CHAPTER 4 – RESEARCH METHODS
C.D. HARLEY 54
Figure 4.2: Cross-sectional views of the a) MiGS, b) CFFS wind tunnel model
configurations, and c) wind tunnel model details.
The model was mounted using the steel internal structure or „skeleton‟ shown in Figure
4.3. Two 10mm steel rods running the length of the model allowed 5mm thick steel
plates to be clamped to the model at either end. These plates were recessed into the
model profile. This steel structure created extra stiffness and was the mounting point
for a 25mm steel rod that connected to the force balance via a 5mm steel plate. Two
CFFS plenums were recessed on opposite sides of the model so that the slots were
located at 0.35c and 0.65c. This allowed a combined upper and lower surface CFFS
blowing investigation to be performed. Practical constraints meant the fluidic spoiler
only spanned the middle 55% of the model, hence the model is only partially two-
dimensional. A photo of the model in its CFFS configuration is shown in Figure 4.4.
Due to the partial span length of the CFFS slot, appropriate scaling of the balance data
for the CFFS results is required to obtain equivalent full span (two-dimensional) data
suitable for comparison with the surface pressure measurements, momentum loss in the
wake and numerical results. The required scaling factor is the ratio of the slot length to

CHAPTER 4 – RESEARCH METHODS
C.D. HARLEY 55
span length and has been applied to all CFFS force balance measurements presented in
this thesis. This is explained in section Error! Reference source not found..
Figure 4.3: Wind tunnel model internal steel ‘skeleton’ layout
4.1.3 MiGS design and manufacture
The MiGS test articles are implemented as variable height tabs oriented normal to the
local surface. Tabs were machined from aluminium box section to give heights of
0.01c, 0.02c and 0.03c. The MiGS span was set as the same as that for the CFFS, i.e.
55% of the model span so that the same correction factor was applied to both sets of
results.
300x50x5mm
Force balance
mounting plate
Leading edge of
vertically
mounted model
Steel rods
running the
model span,
725mm long,
10mm diameter
Steel plate recessed
in model tip,
5x150x20mm
Steel plate recessed in
model tip, nuts on end
used to clamp the model
between the steel plates,
5x150x20mm
Mounting cylinder,
25mm diameter

CHAPTER 4 – RESEARCH METHODS
C.D. HARLEY 56
Figure 4.4: Photo of the wind tunnel model in CFFS configuration
4.1.4 CFFS design and manufacture
The design objective for the CFFS system is to provide maximum efficiency from a
given pneumatic supply with minimum installed volume. Crowther et al [44] provides a
useful discussion of the design variables for two fluidic control devices. The paper
identifies the important design features of fluidic devices, which provided the starting
point for the design of an efficient CFFS system.
Pneumatic
supply pipe for
0.65c CFFS
Pneumatic
supply pipe for
0.35c CFFS
CFFS in 0.65c
position
Pressure
tapping
piping
Model
leading edge
Clamping rod

CHAPTER 4 – RESEARCH METHODS
C.D. HARLEY 57
Figure 4.5: CFFS design used in the wind tunnel model
The CFFS device produces a thin uniform velocity jet sheet from a slot within a
pressurised plenum. The slot is recessed within the aerodynamic mould line of the
model in keeping with the practical aim of minimising the installed drag penalty when
the device is not operating. Once leaving the slot the jet sheet remains attached to the
curved surface that starts as tangent to the slot exit and ends as tangent to the wing
surface Figure 4.5 c). The jet sheet is encouraged to stay attached to the wing surface
downstream of the slot exit through the so called Coanda effect [45-47]. A number of
flight control applications make use of the Coanda effect including circulation control
[48], [49] and fluidic thrust vectoring [50]. The reader may refer to these references for
a detailed discussion of the Coanda effect and its applications.
CHAPTER 4 – RESEARCH METHODS
C.D. HARLEY 58
Figure 4.5 shows the design of the CFFS plenum for the wind tunnel test. The key
features of the CFFS design are:
1. The top plate is located in position using the housing knuckle and top plate
groove. Application of a small amount of silicone in the top plate knuckle
groove provided an airtight seal. The top plate was secured by two rows of
2.5mm counter-sunk screws.
2. The support pillars were located just behind the point at which the top plate
begins to taper from 2mm to 0.5mm. This helps the formation of a uniform
exit velocity along the entire slot length.
3. Good practice suggests that a contraction ratio defined by the slot height to
internal plenum height of at least 10 should be used to obtain good slot flow
quality. At the location where the pillars meet the top plate the contraction
ratio is ~25. A contraction ratio of at least 10 also implies that the plenum
static pressure will be 99% of the total pressure in the flow, which allows a
method of jet velocity calculation from the plenum static pressure [44].
4. The slot lip height was defined by the limit of manufacturability as 0.2mm ±
0.05mm. Due to manufacturing tolerances and the potential for deformation,
the plenum top plate was manufactured from steel sheet, while the plenum
housing was manufactured from aluminium.
5. The angular range over which a coanda jet will remain attached to a curved
surface is strongly dependent on the slot curvature (h/R), with smaller values
improving attachment. However from an implementation point of view it is
desirable to minimise R hence a compromise is necessary. Based on practical
considerations and the investigation by S. Frith [51], it was decided to use a
slot curvature of 5 per cent for the CFFS slots in this study.

CHAPTER 4 – RESEARCH METHODS
C.D. HARLEY 59
4.1.5 Experimental set up
Recognising the challenge of obtaining accurate measurement of drag in wind tunnel
experiments, both force balance and wake pressure techniques were used to improve
measurement robustness by providing independent measurements. An annotated photo
of the wind tunnel set-up is shown in Figure 4.6 and a diagram of the model installation
shown in Figure 4.7.
Figure 4.6: Photo of the wind tunnel setup with vertically mounted model, 6-
component force balance, scanivalves for surface pressure and wake rake for drag
measurement.
Flexible
pneumatic
supply
piping
Scanivalves and
traverse for the
wake survey
6-component
force/torque
balance
Wake
Rake and
mounting
Vertically
mounted
model
Pneumatic
supply valve

CHAPTER 4 – RESEARCH METHODS
C.D. HARLEY 60
Figure 4.7: Layout of the wind tunnel setup. Solid arrows show the direction of airflow
from the compressed supply, dashed lines indicate 0.35c CFFS location and pressure
supply piping.
4.1.6 Wake survey
The drag coefficient is calculated from the momentum loss in the wake caused by the
model drag. The wake rake technique uses integrated total pressure measurements in
the wake of a body to determine the momentum loss in the wake. For the present
experiments, the survey location was one chord length downstream of the trailing edge
of the model. This is far enough downstream that the static pressure variation across the
wake can be assumed to be negligible [52]. The wake rake consisted of 40 total
pressure tubes (single tube shown on fig 21) with a centre distance of 3mm. Two static
pressure tubes were located at the extremities of the total pressure tube array. The static
pressure holes were located eight tube diameters downstream of the tube tip as
described as best practice in Krause et al [53]. To reduce measurement errors caused by

CHAPTER 4 – RESEARCH METHODS
C.D. HARLEY 61
closely adjacent tubes the tips of the total pressure tubes were flattened perpendicular to
the tube array axis, as suggested in [54].
The wake rake was mounted to a vertical rod that was attached to a manual traverse
underneath the test section. Once the Scanivalve had stepped through each total and
static pressure probe, the manual traverse was used to move the mounting rod to the
next location, such that each wake survey overlapped the previous by at least 20% of
the wake rake measurement length (120mm). The number of movements of the wake
rake was defined by the size of the wake, a total of 2-3 movements was sufficient for
the baseline aerofoil at all angles of attack measured. Figure 4.8 shows a close up of the
wake rake Pitot and static tube array mounted in the wind tunnel.
Figure 4.8: Photo of the wake rake used during wind tunnel experiments
4.1.7 Direct force and moment measurements
Direct force and moment measurements were taken using the overhead 6-component
force/torque balance. The load ranges of the force balance are shown in Table 4.1.
Static
pressure
tubes
Total
pressure
tubes
Flexible
pressure
tubing
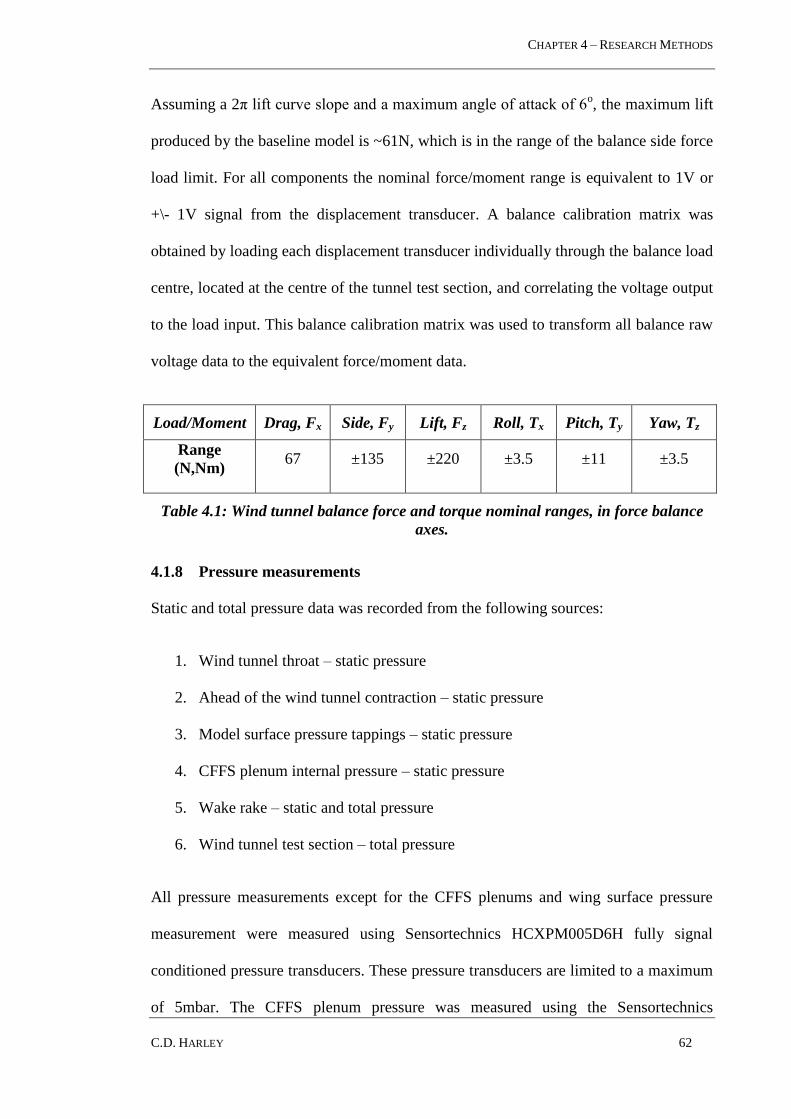
CHAPTER 4 – RESEARCH METHODS
C.D. HARLEY 62
Assuming a 2π lift curve slope and a maximum angle of attack of 6o, the maximum lift
produced by the baseline model is ~61N, which is in the range of the balance side force
load limit. For all components the nominal force/moment range is equivalent to 1V or
+\- 1V signal from the displacement transducer. A balance calibration matrix was
obtained by loading each displacement transducer individually through the balance load
centre, located at the centre of the tunnel test section, and correlating the voltage output
to the load input. This balance calibration matrix was used to transform all balance raw
voltage data to the equivalent force/moment data.
Load/Moment Drag, Fx Side, Fy Lift, Fz Roll, Tx Pitch, Ty Yaw, Tz
Range
(N,Nm) 67 ±135 ±220 ±3.5 ±11 ±3.5
Table 4.1: Wind tunnel balance force and torque nominal ranges, in force balance
axes.
4.1.8 Pressure measurements
Static and total pressure data was recorded from the following sources:
1. Wind tunnel throat – static pressure
2. Ahead of the wind tunnel contraction – static pressure
3. Model surface pressure tappings – static pressure
4. CFFS plenum internal pressure – static pressure
5. Wake rake – static and total pressure
6. Wind tunnel test section – total pressure
All pressure measurements except for the CFFS plenums and wing surface pressure
measurement were measured using Sensortechnics HCXPM005D6H fully signal
conditioned pressure transducers. These pressure transducers are limited to a maximum
of 5mbar. The CFFS plenum pressure was measured using the Sensortechnics

CHAPTER 4 – RESEARCH METHODS
C.D. HARLEY 63
HCXM350D6 pressure transducer limited to a maximum range of 350mbar. The wing
surface static pressure was measured using the HCXM020D6 pressure transducer limited to
a maximum range of ±20mbar. All pressure transducers were powered by a locally
regulated 5V supply.
4.1.9 Data acquisition system
Data was sampled using the National Instruments PCI-6229 card which is capable of
sampling up to 80 analogue channels at a sampling rate of 250kS/s, as well as driving
up to 4 analogue output channels. The PCI-6229 card was controlled through the
National Instruments LabVIEW software. A series of simple programmes driven from
the same user interface read all channels required. Scanivalves were driven by a 5V
signal from the PCI card that switched the Scanivalve to the next pressure port after
which a pressure measurement was taken before switching to the next pressure port. A
delay of 1 second was left between switching ports and taking readings to allow for a
settling time.
4.2 Experimental procedure
4.2.1 Phase 1 – preliminary and model baseline configuration tests
The following tests were performed with the aim of providing measurement calibration
and validation:
1. Wind tunnel force balance calibration
2. Wind tunnel test-section velocity calibration
3. Wake rake calibration
4. Model baseline configuration measurements without trip strip
5. Comparison of surface pressure distribution and force balance at zero
CHAPTER 4 – RESEARCH METHODS
C.D. HARLEY 64
incidence. The outcome of this test was that the model surface pressure
distribution was not symmetric at the model zero incidence. This was caused
by a slightly non-symmetric model due to manufacturing tolerances. For
results comparisons it was decided to use a zero incidence as the location that
gave a symmetric surface pressure distribution. The offset angle in this case
was ~0.6o nose up.
6. A trip strip analysis was performed to find the trip strip height that would be
just sufficient to cause a turbulent boundary layer over the model surface. This
is discussed in section 4.4.3.
4.2.2 Phase 2 & 3 – baseline and bulk testing
These phases were split into two due to time requirements for initial validation of test
measurements. The first measurements included the model at zero lift incidence in
MiGS and CFFS configurations. This allowed measurement validation before the bulk
of the testing was completed in phase 3.
4.2.3 Wind tunnel test procedure
A flow chart of the experimental procedure (shown in Figure 4.9) is described below.
1. The model was set to the required configuration and incidence. The first zero
reading (1) was taken. For the CFFS cases the pneumatic supply was turned to
the required pressure.
2. Once the required pressure had settled, a second zero measurement was taken.
This zero was taken so that the thrust of the jet could be calculated if required.
(For the baseline and MiGS tests no extra zero is required was taken). The
tunnel was then set to a test-section velocity of 24.5m/s.
3. Once the velocity was stable, the scanivalves were started at the current wake

CHAPTER 4 – RESEARCH METHODS
C.D. HARLEY 65
rake location.
4. Once the Scanivalve results were obtained the wake rake was moved to the
next position, and the wake rake Scanivalve was started again (3). This loop
was performed until the entire model wake was recorded. The wind tunnel
velocity was then turned off and allowed to settle
5. A tunnel off zero reading was taken. For the CFFS cases then pneumatic
supply was then turned off and allowed to settle.
6. A final zero reading was then taken.
Figure 4.9: Flow chart of experimental procedure
For the results, the zero readings of 2) and 5) were average and subtracted from the
baseline and MiGS readings to allow for bias in measurements over the testing time.
For the CFFS cases the zero readings of 1) and 6) were used.
4.3 Data Reduction
4.3.1 Boundary corrections
The flow conditions in a wind tunnel are not the same as real flight conditions because
the air is bounded by walls. However, a wind tunnel aims to simulate actual flight
conditions and therefore requires boundary corrections that take the effect of the walls
into account. Boundary corrections for two-dimensional cases can be split into
horizontal buoyancy, solid blockage, wake blockage, streamline curvature [54].

CHAPTER 4 – RESEARCH METHODS
C.D. HARLEY 66
Horizontal buoyancy is the static pressure variation in the wind tunnel test section in
the streamwise direction due to the thickening of the boundary layer at the walls. The
horizontal buoyancy is usually insignificant for wing models, however, this variation is
minimised even further in the Project tunnel due to a test-section that expands in the
longitudinal axis.
The solid blockage is the ratio of the frontal area of the model to the test section area.
Using the maximum model angle of attack and assuming a constant test section area the
solid blockage comes out to 0.1. This is at the higher end of a typical solid blockage but
still within the typical range.
The wake blockage is similar to the solid blockage but in terms of the effect of the
wake of a body in the test section. Pope et al [54] provide a two-dimensional wind
tunnel test example to show the impact of the solid and wake blockages. Applying the
blockage corrections to a representative case was found to cause <1% change in the
drag measured. Since this is small compared to other measurement uncertainties basis,
corrections due to blockage effects have not been applied to wind tunnel results.
The streamline curvature refers to the alteration of the streamline curvature due to the
flow around a body in the wind tunnel. If the wing chord is less than 0.7 times the
tunnel height this effect on the distribution of lift may be neglected, the value in this
experiment was 0.35 hence it has been neglected.
4.3.2 Aerofoil surface pressure distribution calculation
The static pressure was measured at 28 locations around the surface of the wind tunnel
model at a constant spanwise location (distribution shown in Figure 4.2 c). The
spanwise location was offset 1/8c from the model centre line to avoid potential

CHAPTER 4 – RESEARCH METHODS
C.D. HARLEY 67
symmetry effects caused by three-dimensional structures in the wind tunnel. The
pressure coefficient at each location on the wing surface was calculated [14] using:
𝐶𝑝 =
𝑃 − 𝑃∞𝑞∞
( 4.1 )
Where: q∞, is the dynamic pressure in the test section, P∞, is the freestream static
pressure, and P is the static pressure measured on the wing surface.
4.3.3 Force and moment transfer
The wind tunnel force/torque balance default set up is to measure forces and moments
with respect to a horizontally mounted model. The current investigation uses a
vertically mounted wing which means an initial reordering of forces and moments is
required:
𝐴𝑌𝑁𝑇𝑥𝑇𝑦𝑇𝑧
𝑚𝑜𝑑𝑒𝑙 𝑎𝑥𝑒𝑠
=
𝐹𝑥𝐹𝑧𝐹𝑦𝑇𝑥𝑇𝑧𝑇𝑦
𝑏𝑎𝑙𝑎𝑛𝑐𝑒 𝑎𝑥𝑒𝑠
The drag, lift and pitching moment can then be transformed from the model axes to the
wind axes by performing a rotation of alpha about the model y axis:
𝐷𝐿𝑀
𝑤𝑖𝑛𝑑 𝑎𝑥𝑒𝑠
=
𝑁 sin𝛼 + 𝐴 cos𝛼𝑁 cos𝛼 − 𝐴 sin𝛼
𝑇𝑦
( 4.2 )
The balance centre is located at c/2 on the model chord line. Moments at c/4 are thus
obtained by:
CHAPTER 4 – RESEARCH METHODS
C.D. HARLEY 68
𝑀𝑐4
= 𝑀 − 𝐿𝑐
2 ( 4.3 )
4.3.4 Aerodynamic coefficient calculated from the force/torque balance
The forces and moments in wind axes calculated from equations ( 4.2 ) and ( 4.3 ) are
nondimensionalised using the wind tunnel dynamic pressure and appropriate reference
length/area:
𝐶𝐿 =
𝐿
𝑞∞𝑐
𝐶𝐷 =𝐷
𝑞∞𝑐
𝐶𝑀𝑐 4 =𝑀𝑐
4
𝑞∞𝑐2
( 4.4 )
4.3.5 Lift coefficient calculated from the surface pressure distribution
The following equation is used to calculate the lift due to model surface pressure
distribution [14]:
𝐶𝑁𝐶𝑃 = 𝐶𝑃𝑙𝑜𝑤𝑒𝑟 𝑑𝑥
𝑐
𝑇𝐸
𝐿𝐸
− 𝐶𝑃𝑢𝑝𝑝𝑒𝑟 𝑑𝑥
𝑐
𝑇𝐸
𝐿𝐸
( 4.5 )
Where, lower and upper refer to the lower and upper surface of the model, and LE and
TE refer to the leading and trailing edges of the model respectively.
Note that calculation of the lift coefficient from the surface pressure distribution does
not take into account any lift due to shear stress (which is very small compared to the
lift due to pressure).
CHAPTER 4 – RESEARCH METHODS
C.D. HARLEY 69
4.3.6 Profile drag coefficient calculated from the wake survey
For a configuration without any blowing from the model the wake drag is calculated
using [54]:
𝐶𝐷𝑊𝑎𝑘𝑒 = 2 𝑃𝑇 − 𝑃
𝑃𝑇∞ − 𝑃∞−
𝑃𝑇 − 𝑃
𝑃𝑇∞ − 𝑃∞ 𝑑
𝑦
𝑐
( 4.6 )
4.3.7 CFFS jet blowing coefficient calculation
The CFFS jet velocity is calculated from the plenum pressure using isentropic flow
relations:
𝑉𝑗 = 𝑎 𝑃∞𝑃𝐶𝐹𝐹𝑆
𝛾−1 −𝛾
− 1 2
𝛾 − 1 ( 4.7 )
Where a is the speed of sound, P∞ is the free stream static pressure, PCFFS is the mean
pressure in the CFFS plenum and γ is the ratio of specific heats of air (=1.4). The two-
dimensional blowing coefficient can then be calculated using:
𝐶𝜇 =
𝜌∞ℎ𝑗𝑉𝑗2
𝑞∞𝑐 ( 4.8 )
Where ρ∞ is the freestream air density, hj is the slot height, Vj is the velocity of the jet
calculated using equation ( 4.7 ), and c is the wing local chord length. This calculation
does not allow for total pressure losses in the contraction and assumes a top hat velocity
profile at the slot exit. In practice there will be some pressure losses and the exit profile
will include a boundary layer at each side. Both these effects will mean that the
calculated blowing coefficient is slightly higher than the actual delivered blowing
coefficient, however the effect is likely to be small and the level of uncertainty from

CHAPTER 4 – RESEARCH METHODS
C.D. HARLEY 70
ignoring these effects is considered to be acceptable. Another potential error source is
the impact the wing surface pressure has on the jet velocity and therefore the blowing
coefficient. For an upper surface CFFS, as the wing angle of attack increases, the
pressure on the surface would decrease, causing the jet expansion and therefore an
increase in jet velocity. This complex correlation between plenum pressure, surface
pressure and jet velocity has been studied in a number of articles in [71]. Due to the
small angle of attack range over which measurements were performed in this thesis, the
impact of the surface pressure modification on the jet velocity has been assumed
negligible.
4.3.8 Aerofoil profile drag calculation
As part of the experimental analysis it is of interest to separate the aerofoil profile drag
from the drag directly due to the projected area of the spoiler. To achieve this, the MiG
spoiler drag was estimated using a combination of empirical [55] and theoretical
methods [56]. The empirical method is used to calculate the drag on a plate normal to a
wall submerged in a boundary layer, thickness of the boundary layer thickness is
calculated from laminar boundary layer theory. This approach assumes a laminar
boundary layer, however the flow is turbulent. Therefore this approach is not accurate,
but does allow one to estimate the impact of the MiGS drag due to the frontal area, and
therefore provide a method of calculating the aerofoil profile drag. The total drag of the
MiGS is equal to the drag on the MiGS within the boundary layer and the drag on the
MiGS within the freestream. Figure 4.10 shows a partially submerged MiGS by a shear
layer and the effective height in the freestream.

CHAPTER 4 – RESEARCH METHODS
C.D. HARLEY 71
Figure 4.10: MiGS normal to a wall partially submerged by a boundary layer of
thickness, 0.99.
From empirical methods the effective velocity in the boundary layer is:
𝑉𝐵𝐿2 =
𝑛
𝑛 + 2𝑉∞
2 ( 4.9 )
Where n = 6, for a flat plate velocity profile constant, V∞ is the velocity in the
freestream.
The force on a plate normal to a wall is equal to the force due to the boundary layer,
and the force due to the freestream:
𝐹𝑝𝑙𝑎𝑡𝑒 = 𝐶𝐷𝑝𝑙𝑎𝑡𝑒1
2𝜌𝑉∞
2ℎ𝑒𝑓𝑓 + 𝐶𝐷𝑝𝑙𝑎𝑡𝑒1
2𝜌𝑉𝐵𝐿
2 𝛿0.99 ( 4.10 )
Where CDplate is the drag on the flat plate, taken from boundary layer theory, and heff is
the effective height of the MiGS outside of the boundary layer thickness, shown in
Figure 4.10Figure 4.10: MiGS normal to a wall partially submerged by a boundary
layer of thickness, 0.99.. Rearranging in terms of drag coefficient and dynamic pressure
by substituting in ( 4.9 ) gives:
𝐹𝑝𝑙𝑎𝑡𝑒 = 𝐶𝐷𝑝𝑙𝑎𝑡𝑒1
2𝜌𝑉∞
2 ℎ𝑒𝑓𝑓 + 𝛿0.99𝑛
𝑛+2 ( 4.11 )

CHAPTER 4 – RESEARCH METHODS
C.D. HARLEY 72
Using the force on the plate, the drag coefficient due to the plate can be calculated:
𝐶𝐷𝑀𝑖𝐺𝑆 =
𝐹𝑝𝑙𝑎𝑡𝑒12𝜌𝑉∞2𝑐
=𝐶𝐷𝑝𝑙𝑎𝑡𝑒
12𝜌𝑉∞
2 ℎ𝑒𝑓𝑓 + 𝛿0.99𝑛𝑛+2
12𝜌𝑉∞2𝑐
( 4.12 )
𝐶𝐷𝑀𝑖𝐺𝑆 =
𝐶𝐷𝑝𝑙𝑎𝑡𝑒 ℎ𝑒𝑓𝑓 + 𝛿0.99𝑛𝑛+2
𝑐
( 4.13 )
The drag calculated, CDMiGS, is then subtracted from the measured drag coefficient to
give the aerofoil profile drag.
4.3.9 Control volume analysis for CFFS wind tunnel model configuration
A control volume analysis is required to define the impact of the added momentum and
mass flow from the jet of the CFFS on the total drag. The method is limited by the
following assumptions:
The freestream flow enters the control volume from the inlet on the left and
leaves the control volume through the exit on the right
The freestream flow at the inlet and outlet is perpendicular to the inlet and
outlet boundaries respectively
The upper and lower boundaries are parallel to the freestream flow at the
upper and lower boundaries
The pressures at control volume boundaries are equal to the pressures in the
freestream at the boundaries
The flow is of steady state form inside the control volume
Air is injected from the CFFS slot
Following a method presented in [57], [58], Figure 4.11 depicts a control volume
surrounding the aerofoil with CFFS device shown by the dotted line from a to i. The

CHAPTER 4 – RESEARCH METHODS
C.D. HARLEY 73
resultant force acting on the control volume is equal to the momentum variation across
the control volume boundary:
𝐹 = 𝜌𝑉 ∙ 𝒅𝑺 ∙ 𝑽
𝑠
( 4.14 )
Applying this equation in the x-direction of Figure 4.11 gives:
−𝑝1𝑆1 + 𝑝2𝑆2 + (𝑝𝑗𝑆𝑗 )𝑥 + 𝑅𝑥 = − 𝜌𝑉1𝑑𝑦𝑉1
𝑎
𝑖
+ 𝜌𝑉2𝑑𝑦𝑉2
𝑏
ℎ
−𝑚 𝑗𝑉𝑥𝑗 ( 4.15 )
The total drag of the aerofoil can be defined as the x-component of the total force acting on
the aerofoil. The total force is made up of the pressure and shear stress acting on the aerofoil
surface, the thrust of the jet acting on the aerofoil, and the pressure at the slot acting on the
aerofoil. Rearranging equation ( 4.15 ) with respect to the drag give:
𝐷 = − 𝑅𝑥 +𝑚 𝑗𝑉𝑥𝑗 + (𝑝𝑗𝑆𝑗 )𝑥 = 𝜌𝑉1𝑑𝑦𝑉1
𝑎
𝑖
− 𝜌𝑉2𝑑𝑦𝑉2
𝑏
ℎ
− 𝑝1𝑆1 + 𝑝2𝑆2 ( 4.16 )
The conservation of mass gives:
𝜌𝑉1𝑑𝑦𝑎
𝑖
= 𝜌𝑉2𝑑𝑦𝑏
ℎ
−𝑚 𝑗 ( 4.17 )
Assuming 𝑝1 = 𝑝2, and using equations ( 4.16 ) and ( 4.17 ), the drag on the
aerofoil is:
𝐷 = 𝜌𝑉2 𝑉1 − 𝑉2 𝑑𝑦
𝑏
ℎ
−𝑚 𝑗𝑉1 ( 4.18 )
From the general assumptions of control volume analysis, the velocity at station 1 is equal to
the freestream velocity, giving:
𝐷 = 𝜌𝑉2 𝑉∞ − 𝑉2 𝑑𝑦
𝑏
ℎ
−𝑚 𝑗𝑉𝑗 ( 4.19 )

CHAPTER 4 – RESEARCH METHODS
C.D. HARLEY 74
Converting to coefficient form by dividing through by dynamic pressure and wing area gives:
𝐶𝐷 = 𝐶𝐷𝑊𝑎𝑘𝑒 − 𝐶𝜇
𝑉∞𝑉𝑗
( 4.20 )
Therefore the total drag is the drag from the wake survey minus a correction factor due
to conservation of mass. This means the thrust of the jet is a part of the wake survey
measurement. The same result is reached for circulation control aerofoils [57], [58] and
injection only aerofoils [59] whose jet is in the positive drag direction.
Figure 4.11: Control volume for a CFFS aerofoil
4.4 Measurement validation methods
4.4.1 CFFS end effects investigation
An investigation of the three-dimensional effects of the CFFS device was performed.
The slot length was varied from 100mm to 400mm in 100mm intervals and
measurements were taken using the force balance. The effect of slot length with change
in lift is shown in Figure 4.12. For the purposes of this work the gradients of the results
have been assumed within a usable tolerance. The plot shows that there are negligible
slot end effects. Therefore extending the result to a full span slot requires a scaling
factor based on the slot length and wing span.

CHAPTER 4 – RESEARCH METHODS
C.D. HARLEY 75
Figure 4.12: Effect of slot length on change in lift coefficient (force balance
measurement). ○ = 100mm,□ = 200mm, ∆ = 300mm, ◊ = 400mm.
4.4.2 Sampling period investigation
An investigation into the effect of the sampling period on the drag coefficient measured
from the wake survey method was performed. The time period per sample taken at each
total pressure port in the wake rake was increased from 3 seconds upwards until the
drag calculated converged to a constant result. This investigation helps to reduce the
errors in the wake survey method from potential fluctuations of the tunnel speed. The
sampling period investigation was performed with the wind tunnel model in its baseline
configuration at zero incidence.
Figure 4.13 shows the change in drag coefficient with increasing sampling period from
3 to 14 seconds. At sampling periods between 3 and 6 seconds the drag coefficient
varies by 10%. Only above 6 seconds does the variation of the drag measurement begin
to settle. Based on these results a sampling period of 10 seconds was chosen to be used
for the rest of the wind tunnel testing. The same sampling period was also used for all
measurements including the surface pressure distribution.

CHAPTER 4 – RESEARCH METHODS
C.D. HARLEY 76
Figure 4.13: The effect of sampling period on wake survey drag coefficient
measurements at a sampling rate of 1kHz.
4.4.3 Forced boundary layer transition
“Scale effects” refer to differences between the experimental and actual flight operation
flow conditions. A trip strip analysis is one method of reducing the differences between
these flow conditions, by tripping the surface flow from laminar to turbulent at 0.1c for
all angles of attack tested. The location of transition is not fixed, but moves with angle
of attack. It is assumed that a transition fixed at 0.1c is suitable for this investigation
[54]. Figure 4.14 shows the results of a transition study on the model using two-
dimensional or pinked tape as the transition mechanism. The process followed is as
presented in Pope et al [54].
At trip strip heights of less than 0.3mm the drag coefficient increases rapidly. Beyond a
height of 0.3mm any added height leads to a constant increase in drag. This indicates
that boundary layer transition has been reached with a pinked tape of thickness 0.3mm.
The trip strip drag correction is the delta between the (fully established transition or)
chosen trip strip height to that extrapolated back to zero trip strip height. This delta
corrects for the pressure drag caused by the trip strip, while the trip strip ensures

CHAPTER 4 – RESEARCH METHODS
C.D. HARLEY 77
laminar to turbulent transition occurs at the proper location. Due to the discrepancy
with the force balance data, a trip strip height of 0.5mm was used in all following tests.
Figure 4.14: Results of a transition study using a series of two-dimensional tape (or
pinked tape) of increasing thickness located at 0.1c from the leading edge on the upper
and lower surfaces of the model. The drag coefficient values shown are measured from
the force balance and momentum loss in the wake.
4.4.4 CFFS plenum validation
Based on [44], the design objectives for the CFFS plenum were:
1. To minimise the total pressure distortion at the slot exit
2. To minimise the static pressure drop from plenum entry to plenum exit
3. To minimise the installed volume
The design was tested by measuring the static pressure distribution across the span on
the internal lower surface of the plenum, shown by Figure 4.15. The four pressure
tappings are equally spaced along the span of the plenum. All pressure readings are
within 3% of the mean value, and therefore shows good uniformity.

CHAPTER 4 – RESEARCH METHODS
C.D. HARLEY 78
Figure 4.15: Spanwise variation of static pressure in the CFFS plenum
4.5 Measurement uncertainty
4.5.1 An overview of measurement uncertainty
“The purpose of uncertainty evaluation is to define the result of the measurement in
terms of three parameters: the mean value, the expanded uncertainty and the confidence
level or coverage factor.”[60]
The method of uncertainty calculation in this thesis is based on that defined by the
general metrology for measurement uncertainty provided by the British Standards
Institute [60]. The following process was used to calculate the measurement uncertainty
of the lift coefficient from the force balance in the following sections:
1. Calculate the standard uncertainty of a measurement based on the number of
samples and standard deviation of the sample set.
𝑢 𝑥 =
𝑠 𝑥
𝑛
( 4.21 )
0
5
10
15
20
25
30
35
1 2 3 4Pressure tapping location
Plenum Static Pressure, kPa

CHAPTER 4 – RESEARCH METHODS
C.D. HARLEY 79
Where, s(x), is the standard deviation of the sample and, n, is the number of
samples taken.
2. Obtain the expanded uncertainty of the measurement device (usually provided
in a calibration file for the device) used to then calculate the calibration standard
uncertainty.
𝑢𝑐𝑎𝑙 𝑥 =
𝑈 𝑥
𝑘 ( 4.22 )
Where, U(x), is the expanded uncertainty and, k, is the coverage factor (1.96 for
a confidence level of 95%).
3. The sample and calibration standard uncertainties are then combined to give the
total standard uncertainty of the measurement.
𝑢 = 𝑢 𝑥
2+ 𝑢𝑐𝑎𝑙 𝑥
2 ( 4.23 )
4. The effect of the measurement on the output quantity (e.g. lift coefficient) is
based on a sensitivity coefficient. This is defined as the partial derivative of the
functional relationship (the output quantity written in terms of the input
quantities) between the input quantities and the output quantity.
𝑐𝑖 =
𝜕𝑓
𝜕𝑥𝑖 ( 4.24 )
5. The combination of uncertainty due to each input quantity can then be
combined, if uncorrelated using:
𝑢𝑐2 𝑌 = 𝑐𝑥1
2 𝑢2 𝑥1 + 𝑐𝑥22 𝑢2 𝑥2 +⋯ ( 4.25 )

CHAPTER 4 – RESEARCH METHODS
C.D. HARLEY 80
4.5.2 Uncertainty in lift coefficient measurement
The lift coefficient from equation ( 4.4 ) can be written in terms of its input quantities
from equation ( 4.2 ) as:
𝐶𝐿 =
𝑁 cos𝛼 − 𝐴 sin𝛼
𝑞∞𝑐
( 4.26 )
The input quantities are the axial force, A, the normal force, N, and the dynamic
pressure, q∞. The following table sets out the calculation of the uncertainty associated
with the force balance lift coefficient of the baseline model configuration at an angle of
attack of 6 degrees. The nominal lift coefficient is 0.6197, and the calculated expanded
uncertainty at the 95% confidence level is 9.15%. This is an acceptable uncertainty for
the purposes of this study.

CHAPTER 4 – RESEARCH METHODS
C.D. HARLEY 81
(cu
)2
5.6
89
e-7
0.0
00
83
6
5.6
77
e-7
0.0
00
84
cu
-0.0
00
75
0.0
28
91
9
-0.0
00
75
c
-0.0
01
13
0.0
10
71
-0.0
01
71
𝒄𝒊
=𝝏𝑪𝑳
𝝏𝒙𝒊
𝜕𝐶𝐿
𝜕𝐴
=𝑁
cos𝛼
𝑞∞𝑐
𝜕𝐶𝐿
𝜕𝑁
=−𝐴
sin𝛼
𝑞∞𝑐
𝜕𝐶𝐿
𝜕𝑞∞
=−𝑁
cos𝛼
+𝐴
sin𝛼
𝑞∞
2𝑐
Sta
nd
ard
un
cert
ain
ty,
u
0.6
7
2.7
0.4
418
0.0
289
K
1.9
6
1.9
6
1.9
6
1.9
6
Exp
an
ded
un
cert
ain
ty,
U
1.3
133
5.2
921
0.8
66
0.0
567
0.6
197
9.1
5
xi
A
N
Q
Co
mb
ined
No
min
al
va
lue
%
un
cert
ain
ty
Table 4.2: Uncertainty calculation of the force balance lift coefficient. The expanded
uncertainty at the 95% confidence level for CL = 0.6197 is 9.15%.

CHAPTER 5 – COMPUTATIONAL METHODS
C.D. HARLEY 82
5 COMPUTATIONAL METHODS
This chapter presents the computational methods applied to obtain
predictions of the two-dimensional aerodynamic performance of counter-
flow fluidic spoilers. The numerical solver is described along with the
mesh, the case set-up and convergence metrics. Results from two
validation cases are then presented, one for a macro geometric spoiler [61]
and one for a normal blowing fluidic spoiler [40], where the aim is to
match the surface pressure distribution due to a control input.
5.1 Computation apparatus and case set-up
5.1.1 Numerical solver
The computational fluid dynamics (CFD) code Fluent (version 6.1) was used for the
numerical study. An Unsteady Reynolds-Averaged Navier-Stokes (URANS) approach
was employed using the fully implicit unsteady solver and a second-order-discretisation
scheme in time and space for all variables. The Semi-Implicit Method for Pressure-
Linked Equations (SIMPLE) [62] algorithm is suitable for incompressible flows [70]
and was used for the pressure and velocity coupling.
5.1.2 Convergence criteria
Unsteady solution convergence was measured by monitoring the velocity at a number
of locations in the unsteady flow field region, as well as the global aerodynamic force
coefficients. The maximum number of inner-loop iterations (per time step) was set to
20, which was sufficient to ensure inner-loop convergence (inner step convergence
criteria was set to 10-5
); the computation required approximately 6,000 to 8,000 outer-
loop iterations to reach a periodically converged solution.
CHAPTER 5 – COMPUTATIONAL METHODS
C.D. HARLEY 83
5.1.3 Solution monitoring and convergence
To ensure efficient convergence, computations were initially obtained for steady state
flow up to 1000 iterations, before then being restarted using the unsteady solver. A
constant time step size of t = 1x10⁻⁴
was used, which ensures that the Courant number
is less than 1 in the majority of the domain, and a maximum Courant number
throughout the entire domain of around 10.
5.1.4 Turbulence model
The k- Shear Stress Transport (SST) turbulence model of Menter [63] was used in all
cases presented. This selection was based on numerical studies performed by Choi et al
[64] who tested a range of turbulence models for flow past an inlay spoiler; the k-
SST provided the best agreement with experimental data.
The SST model was developed based on observations that the k-e model [65] had
difficulties at the surface of a wall due to the non-zero value of epsilon (the rate of
turbulence dissipation), whilst the standard k-omega model [66] was known to have an
unstable dependence upon freestream turbulence levels. The SST effectively employs
the k-omega model in the near-wall region, whilst switching to the k-epsilon equation
away from the wall. As such, the SST model is able to be used in the near-wall viscous
region without the need for additional modelling and without adversely influencing the
calculation performance or stability.
The numerical meshes used have a near wall resolution sufficient to ensure that the
non-dimensional wall distance, y+, attains a value of less than unity at all times.

CHAPTER 5 – COMPUTATIONAL METHODS
C.D. HARLEY 84
5.1.5 Calculation of the lift and drag coefficient
The lift and drag forces for all cases were calculated from the surface pressure and
shear-stress distribution around the aerofoil. These forces are then summed and
converted to coefficient form by dividing by the freestream dynamic pressure and the
chord length, as is shown in equation ( 4.4 ). For the CFFS case the momentum of the
jet is taken into account when calculating the lift and drag coefficients.
5.1.6 Mesh definition
An unstructured hybrid mesh (a combination of both triangular and rectangular cells)
was used in all cases in order to minimise the number of cells and therefore the
computational time per iteration. A structured mesh block of regular rectangular cells
was used in the immediate vicinity of the aerofoil, from the surface up to a distance of
0.3c away from the aerofoil surface, so as to provide an accurate resolution of the
boundary layer, and to ensure a y+ value of less than unity at the first node away from
the wall. The boundary layer refinement region was projected downstream by 1 chord
in order to provide detailed resolution of the wake profile. Beyond this region, at a
suitable distance downstream, an unstructured mesh was employed until the end of the
domain, approximately 10 chord lengths away from the aerofoil, where the mesh ended
as a circular far-field boundary split into an inlet on the upstream side and an outlet on
the downstream side. These details are shown in Figure 5.1. Mesh refinement is also
concentrated around the jet slot, to capture the interaction of the jet with the oncoming
freestream flow.

CHAPTER 5 – COMPUTATIONAL METHODS
C.D. HARLEY 85
Figure 5.1: Computational grid used for the fluidic spoiler study. Case shown is for
spoiler at 0.65x/c
5.1.7 Mesh independence study
In order to ensure mesh independence of the results, three different mesh resolutions
were examined, as summarised in Table 5.1.
The increase in mesh density at each state was split in the perpendicular and parallel
directions from the aerofoil surface in the structured mesh region. The increase in cell
numbers in the unstructured mesh was aimed to be kept constant.
Figure 5.2 displays the evolution of predicted lift coefficient with numerical time, and
highlights the impact of mesh refinement on the results. Both the coarse and medium
mesh sizes are completely unable to capture any periodic oscillation of the separation in
the wake. However, this was captured by the fine mesh, which was therefore selected to
provide a reference mesh resolution for all further cases.

CHAPTER 5 – COMPUTATIONAL METHODS
C.D. HARLEY 86
Mesh Number of Cells Max y+ Average Courant
number
1: Coarse 100,000 1.6 ~10
2: Medium 117,000 1.4 ~10
3: Fine 132,000 1 ~10
Table 5.1: Overview of the important mesh parameters used in the mesh refinement
study
Figure 5.2: Effect of grid refinement on aerofoil lift coefficient, for upper surface
CFFS at 0.65c, with max. C, and = 6o.
5.2 Computational method validation
5.2.1 Section overview
The computational procedure described above was validated against experimental data
for two cases; a geometric and fluidic spoiler case as summarised in Table 5.2. Results
are presented in the form of the surface pressure distribution comparison between
experiment and computation. The flow was deemed to have converged when both the
velocity probes downstream of the spoiler and the total lift coefficient reached periodic
solutions.
L
S

CHAPTER 5 – COMPUTATIONAL METHODS
C.D. HARLEY 87
Validation Case Reynolds
# # of Cells t Average y+
Geometric spoiler case:
RA16SC aerofoil with inlay spoiler,
deflected to 20o
1.9x10⁶ 230,000 1x10
-4 1
Fluidic spoiler case:
NACA 0018 aerofoil with normal
blowing fluidic spoiler, C = 0.48
2.0x10⁵ 130,000 1x10
-5 0.8
Table 5.2: Validation cases conducted for the CFD process
5.2.2 Geometric spoiler case
The flow around an aerofoil with an inlay spoiler was studied experimentally by
Consigny et al [61]. This was selected as a validation case since another relevant
computational study also investigated this case, and so it was possible to directly
compare the computational prediction [67]. The aerofoil is at zero incidence, the spoiler
is deflected to 20o and the Reynolds number with respect to chord length is 1.9x10
6.
A close up of the mesh used is shown in Figure 5.3. Note that the mesh refinement
increases towards the aerofoil and spoiler surfaces in order to accurately resolve the
boundary layer and flow structures in these regions. The mesh refinement downstream
of the spoiler is designed to capture the unsteady oscillation of the wake resulting from
the separation. The Courant number is less than unity for the majority of the flow field.

CHAPTER 5 – COMPUTATIONAL METHODS
C.D. HARLEY 88
Figure 5.3: Close-up of the mesh around the RA16SC aerofoil with inlay spoiler
The aerofoil profile used by Consigny et al was the experimental aerofoil RA16SC,
which is a rare geometry and was not obtainable during this work. As such the profile
was extrapolated digitally from an electronic journal paper; for this reason it was not
possible to capture the geometry of the leading edge to a satisfactorily high level of
accuracy and so minor discrepancies were expected in this region (see Figure 5.4).
However, since the primary aim of this validation case was to evaluate the ability of the
present computational method in the prediction the separated flow resulting from the
spoiler, it was deemed that this loss of accuracy in the vicinity of the leading edge was
acceptable.
As shown in Figure 5.4, the computation provides a good approximation of the surface
pressure distribution in the region of separated flow, a feature of the flow which has
substantial impact on the overall prediction accuracy. However, there is a slight
discrepancy at the spoiler hinge point (0.5x/c) on the upper surface, which was also

CHAPTER 5 – COMPUTATIONAL METHODS
C.D. HARLEY 89
observed by Filippone [67]. This is most likely due to geometrical differences between
the computational geometry and experimental geometry.
Figure 5.4: Geometric spoiler validation case for a 16% supercritical wing with
inlay spoiler, = 20o, = 0
o, and Re = 1.9x10
6 [61].
5.2.3 Normal blowing fluidic spoiler case
The flow around a normal blowing fluidic spoiler case at Re = 2x10⁵ was reported by
Leopold et al [40]. With respect to the spoiler jet, normal blowing refers to blowing
from an orifice/slot such that the jet is normal to the local aerofoil surface. The
experimental data is fairly sparse, yet it provides sufficient information to enable a
useful validation of the application of CFD to a case with a fluidic spoiler. The aerofoil
section is a NACA 0018, the jet slot width is 0.0067c and located at the mid chord with
a blowing coefficient, C = 0.48.
The mesh used in this validation case is shown in Figure 5.5. Notice the refinement
around the aerofoil surface and particularly in the region of the jet plume. The Courant
number is less than unity for the majority of the flow field except for the refinement
-1
-0.8
-0.6
-0.4
-0.2
0
0.2
0.4
0.6
0.8
1
0 0.2 0.4 0.6 0.8 1
CP
X/C
Uppersurface
Lower surface
Present Simulation
Experimental data

CHAPTER 5 – COMPUTATIONAL METHODS
C.D. HARLEY 90
region around the jet orifice, where some larger values could not be efficiently avoided,
reaching a maximum value of ~10 throughout the entire domain.
Figure 5.5: Close-up of the mesh around the NACA 0018 aerofoil with normal
blowing fluidic spoiler
Figure 5.6 shows a comparison of the predicted CP and that reported from the
experiment for the normal blowing case. Initial results indicated that when the jet
momentum coefficient was the same as that reported in the experiment, the numerical
prediction was poor in the vicinity of the spoiler. This could be due to differences in
the dimensionality between the experimental and numerical flow; the current
numerical simulation assumes a fully two-dimensional jet which might be expected to
be considerably more effective than that in experimental (three-dimensional)
conditions. Given that the aim of this validation is to evaluate the accuracy of the
current numerical approach in the application to the flow around a fluidic spoiler, it
was decided to adjust the jet momentum coefficient to a value that was more
representative of the flow reported experimentally. A factor of one half of the
simulated jet momentum coefficient was found to provide the best agreement, and was

CHAPTER 5 – COMPUTATIONAL METHODS
C.D. HARLEY 91
therefore used to obtain the predictions plotted in Figure 5.6. The figure shows good
agreement upstream of the jet location; though the agreement is not quite so good
downstream of the jet. In particular, the predicted flow on the upper surface of the
aerofoil, downstream of the jet, indicates regions of pressure which are lower than
those in the experiment. This is a fairly common occurrence in the unsteady modelling
of 2D separated turbulent flow, since the additional instabilities that would be
generated in the spanwise direction of a 3D flow are not able to be captured, and so a
region of rotating flow is erroneously allowed to persist. So as to reduce all other
possible sources of error, a large number of iterations were performed to ensure that
these results are sufficiently time-averaged, and grid resolution was improved as much
as possible. When comparing the experimental and numerical surface pressure
distributions for the CFFS cases, in the results section of this thesis, the numerical
blowing coefficient will be half of that of the experimental value (and stated in the
legends of the plots).
While it has not been possible to achieve a perfect agreement with the case of a fluidic
spoiler, a sufficiently accurate prediction is obtained, and the jet momentum coefficient
has been calibrated for this type of flow. If one were aiming to improve the accuracy of
this prediction further, one would most likely need to consider the simulation of a 3D
domain, together with a more advanced turbulence simulation technique such as Large
Eddy Simulation (LES). Both these measures increase computational cost considerably
and have therefore not been selected for this work.

CHAPTER 5 – COMPUTATIONAL METHODS
C.D. HARLEY 92
Figure 5.6: Fluidic spoiler validation case for a NACA 0018 airfoil with jet issuing
from the lower surface; = 0o, and Re = 2x10
5, experimental C = 0.48, simulated C =
0.24 [40].
-2.5
-2
-1.5
-1
-0.5
0
0.5
1
0 0.2 0.4 0.6 0.8 1
CP
X/C
Lower surface
Upper surface
Present Simulation
Experimental data

CHAPTER 6 – RESULTS & DISCUSSION
C.D. HARLEY 93
6 RESULTS & DISCUSSION
The aim of this chapter is to present and discuss the results of the Micro
Geometric spoiler and Counter-Flow Fluidic spoiler investigations,
comparing results with conventional macro geometric spoilers and trailing
edge controls where appropriate.
6.1 Comparison of baseline results
A comparison of baseline lift, drag and surface pressure between different measurement
techniques, CFD and published data for the baseline model is shown in Figure 6.1. The
experimental lift curve slope, Figure 6.1 a), is consistent between force balance data
and integrated surface pressure data, and these measurements are also consistent with
CFD data and data from the literature, providing evidence that the experimental and
computational methods are suitable for the evaluation of lift. A similar comparison for
drag is shown in Figure 6.1 b). In this case there is significant discrepancy between
drag measurement from the force balance and the other sources. It is believe that this is
due to inaccuracies in accounting for support interference and tare effects, and lack of
two-dimensionality flow towards the wing tips. As a result of this discrepancy all
experimental drag data presented in the following is based on wake survey
measurements, apart from for the control coupling tests presented at the end of the
results section where balance data had to be used for experimental expediency. The
baseline surface pressure data, Figure 6.1 c) and d), show reasonably good agreement
between experiment and computation, providing further evidence that the
computational tools used are fit for purpose at least for the benign baseline cases.

CHAPTER 6 – RESULTS & DISCUSSION
C.D. HARLEY 94
a) Lift b) Drag
c) Surface pressure at 0o angle of attack d) Surface pressure at 6
o angle of attack
Figure 6.1: Comparison of the baseline experimental and numerical lift, drag and surface
pressure distributions. Literature results from [43].
6.2 Micro geometric spoiler results
Attention will now be focussed on presentation and discussion of the experimental
force, moment and pressure results for the Micro Geometric Spoilers (MiGS). Lift,
Drag and Moment data for varying spoiler deflection and chordwise location is shown
in Figure 6.2. The broad conclusion from these data is that the MiGS is behaving in a
similar manner to that expected from a macro scale spoiler from simple base area and
camber considerations, i.e. spoiler deflection on either the upper or lower surface

CHAPTER 6 – RESULTS & DISCUSSION
C.D. HARLEY 95
increases drag, whereas upper surface spoiler deflection reduces lift and lower surface
deflection increases lift.
Focussing on the lift data, Figure 6.2 a) and b), the spoiler chordwise location makes a
relatively significant difference to the control response. For the forward location the lift
characteristic is nonlinear with respect to spoiler deflection, with evidence of control
reversal at low spoiler deflections. This is similar to the effect by small deflection of
forward located macro geometric spoilers (as seen in Figure 2.4 a). At the aft location
the response is monotonic. Considering now the effect of upper or lower surface spoiler
location, it can be seen that at = 0o (circles), the response is symmetric, as required by
the symmetric geometry. For positive angle of attack the change in lift from the upper
surface is always greater than the change in lift from the lower surface. However, for
the forward spoiler location on the upper surface there is significant change in control
response with incidence whereas for the aft position there is very little change. In
summary, for use of a MiGS for lift control, the aft position has better linearity
compared to forward, however the forward location is more efficient (larger gain).
Considering now the drag data, Figure 6.2 c) and d), it can be seen that deflection of a
spoiler at either the upper or lower, or fore or aft location generates an increase in drag,
(consistent with increasing base area and reduced downstream pressure recovery),
however the magnitude of the response is much larger for the forward location.
Furthermore, the magnitude of control response is proportional to alpha for the forward
location, whereas at the aft location the response is approximately independent of
alpha. In terms of upper/lower surface location, for the forward station the control drag
gain is significantly higher for the upper surface compared to the lower surface. On the
other hand, for the aft station the spoiler drag response is symmetric upper/lower. The

CHAPTER 6 – RESULTS & DISCUSSION
C.D. HARLEY 96
dotted lines in Figure 6.2 b) and c) show the total drag minus the calculated base drag
of the spoilers (as detailed in the method section) as a way of illustrating the relative
contribution of the aerofoil section and the spoiler itself to the production of drag. For
the forward located spoiler the majority of the drag comes from the aerofoil component
whereas for the aft location the majority of drag comes from the calculated base drag
component. As mentioned in the research method section, the base drag estimate will
be an over estimate since the reference velocity was based on the free stream rather
than the local boundary layer velocity, however even with this uncertainty it can be
seen that if drag is required then it may be advantageous to place MiGSs in a forward
location on an aerofoil, however tests of the time response due to a control input are
required to make sure the lag is below a minimum limit. In summary, for use of a
MiGS for drag control, the aft location has relatively poor efficiency with the drag
increment mainly due to the spoiler base drag increment. The forward location has
much higher efficiency, however the magnitude of control response is strongly coupled
with angle of attack (more control at higher alpha).
The MiGS generated pitching moments about the quarter chord are shown in Figure 6.2
e) and f). Of particular note is the change in sign of the pitching moment response with
spoiler deflection between the fore and aft spoiler locations, which is observed in macro
geometric spoilers in Figure 3.7. For the fore location, upper surface spoiler deflection
produces a nose down (negative) pitching moment in association with a decrease in lift
(and an increase in drag). This implies that the centre of pressure of the loading
increment is aft of the quarter chord. For the aft spoiler location at low incidence the
pitching moment trend with spoiler deflection is opposite to the fore location, even
though the drag and lift response has the same sign as for the fore location.
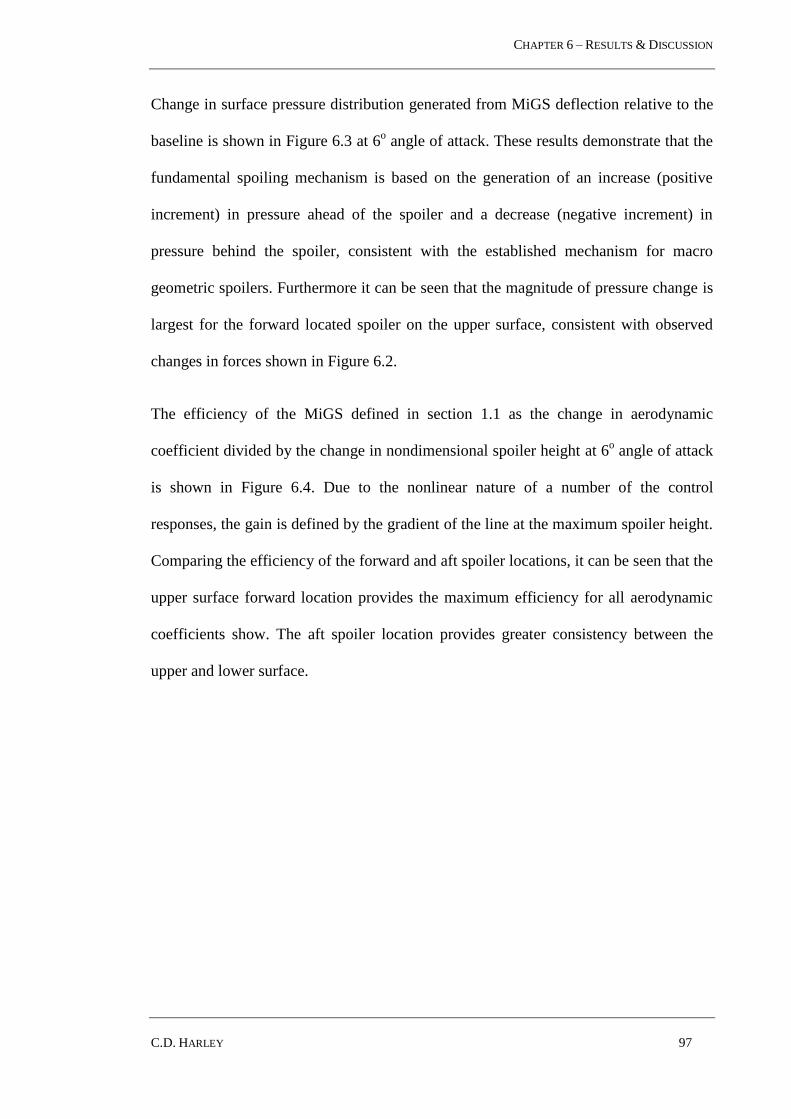
CHAPTER 6 – RESULTS & DISCUSSION
C.D. HARLEY 97
Change in surface pressure distribution generated from MiGS deflection relative to the
baseline is shown in Figure 6.3 at 6o angle of attack. These results demonstrate that the
fundamental spoiling mechanism is based on the generation of an increase (positive
increment) in pressure ahead of the spoiler and a decrease (negative increment) in
pressure behind the spoiler, consistent with the established mechanism for macro
geometric spoilers. Furthermore it can be seen that the magnitude of pressure change is
largest for the forward located spoiler on the upper surface, consistent with observed
changes in forces shown in Figure 6.2.
The efficiency of the MiGS defined in section 1.1 as the change in aerodynamic
coefficient divided by the change in nondimensional spoiler height at 6o angle of attack
is shown in Figure 6.4. Due to the nonlinear nature of a number of the control
responses, the gain is defined by the gradient of the line at the maximum spoiler height.
Comparing the efficiency of the forward and aft spoiler locations, it can be seen that the
upper surface forward location provides the maximum efficiency for all aerodynamic
coefficients show. The aft spoiler location provides greater consistency between the
upper and lower surface.

CHAPTER 6 – RESULTS & DISCUSSION
C.D. HARLEY 98
a) Lift, MiGS at 0.35x/c. Showing CL of
20% chord flap deflected to 14o.
b) Lift, MiGS at 0.65x/c. Showing CL of
20% chord flap deflected to 14o.
c) Drag, MiGS at 0.35x/c. d) Drag, MiGS at 0.65x/c.
e) Pitching moment, MiGS at 0.35x/c. d) Pitching moment, MiGS at 0.65x/c
Figure 6.2: Effect of Micro Geometric Spoiler (MiGS) location on the change in
experimental lift, drag and pitching moment with spoiler height. Angle of attach range: ○ =
0o, ∆ = 3
o, □ = 6
o. Corresponding surface pressure distribution plots (in Fig. 6.3) indicated
in vertical axis (ACP, BCP, CCP, DCP).

CHAPTER 6 – RESULTS & DISCUSSION
C.D. HARLEY 99
a) Upper surface MiGS at 0.35c.
Corresponds to BCP in Figure 6.2.
b) Upper surface MiGS at 0.65c.
Corresponds to DCP in Figure 6.2.
c) Lower surface MiGS at 0.35c.
Corresponds to ACP in Figure 6.2.
d) Lower surface MiGS at 0.65c.
Corresponds to CCP in Figure 6.2.
Figure 6.3: Effect of 0.03c MiGS location on change in surface pressure distributions at =
6o. (□) = upper surface, (∆) = lower surface, (- -) = Spoiler chordwise location.
Figure 6.4: Gain (efficiency) of MiGS for both lower and upper surfaces, and both
chordwise locations
-16
-12
-8
-4
0
4
dCL/d(hs/c) dCD/d(hs/c) dCM/d(hs/c)
lower surface spoiler at 0.35cupper surface spoiler at 0.35clower surface spoiler at 0.65cupper surface spoiler at 0.65c

CHAPTER 6 – RESULTS & DISCUSSION
C.D. HARLEY 100
6.3 Counter-flow fluidic spoiler results
Force and moment data for CFFS plotted in the same format as for the MiGS is shown
in Figure 6.5. The first observation is that the overall form of the lift and drag plots are
broadly similar for the MiGS and the CFFS, confirming that whilst the implementation
of these two types of control is very different, the fundamental control response for the
different control locations is similar. In terms of differences, the forward upper surface
CFFS has a monotonic lift control response with blowing coefficient, unlike the MiGS
in the same location. Also, for drag, the control gain for the aft CFFS is greater than for
the fore location, which is the opposite way round to the MiGS case.
In order to understand the level of „amplification‟ generated by the CFFS the overall
measured drag with the calculated jet thrust component subtracted is shown in Figure
6.5 c) and d) as dotted lines. For the aft location at higher blowing rates the fluidic gain
of the system is around 2 (one unit of momentum gives two units of drag). At the
forward location the fluidic gain is reduced, with a gain of less than two at higher
blowing rates, and a gain approaching unity at lower blowing rates.
The moment data for the CFFS is shown in Figure 6.5 e) and f). The change in moment
magnitude for a given change in lift is roughly similar between the MiGS and CFFS,
however for drag, the moment coupling is significantly reduced for the aft CFFS
position compared to the best case moment coupling for the MiGS. The effect of
amplification is carried over from the drag plots into the pitching moment plots by the
dotted line, which shows the pitching moment caused by the jet. It can be seen that the
effect of the jet on the pitching moment is almost negligible compared to the pitching
moment from the aerofoil surface pressure.

CHAPTER 6 – RESULTS & DISCUSSION
C.D. HARLEY 101
Pressure distributions for the CFFS are shown in Figure 6.6. Comparison with the
pressure distributions for the MiGS shows that the basic pressure signature of the CFFS
is similar to that of the MiGS, i.e. actuation generates an increase in pressure ahead of
the device and a decrease behind. Notice, however, that the device pressure signature is
projected further ahead of the device location for the CFFS compared to the MiGS.
This is consistent with the difference in providing actuation through tangential
momentum injection and local momentum „removal‟ by the MiGS.
The CFD data is plotted against the upper surface blowing CFFS in plots Figure 6.6 a)
and b). The simulated C value is half of the experiment as discussed in the
computational chapter. There appears to be a larger difference between the
experimental and simulated CFFS case than observed in the normal blowing case study.
The main difference is observed ahead of the spoiler, where surface flow separation
occurs. The experimental results show a further forward projected pressure signature
than the simulation. This is expected to be caused by additional instabilities generated
in the spanwise direction of a 3D flow are not able to be captured in the simulated case.
The efficiency of the CFFS is shown in Figure 6.7. As with the MiGS efficiency plot
the gain is defined by the gradient of the line at the maximum control input. Unlike for
the MiGS, the forward located CFFS provides less overall efficiency across most of the
aerodynamic coefficients than the aft location, on both the upper and lower surfaces.
This difference is expected to be caused by the lack of increase in base observed in the
MiGS case, such that the change aerodynamic coefficients are mainly caused by change
in surface pressure distribution.

CHAPTER 6 – RESULTS & DISCUSSION
C.D. HARLEY 102
a) Lift, CFFS at 0.35x/c. Showing CL of
20% chord flap deflected to 14o.
b) Lift, CFFS at 0.65x/c. Showing CL of
20% chord flap deflected to 14o.
c) Drag, CFFS at 0.35x/c. d) Drag, CFFS at 0.65x/c.
e) Pitching moment, CFFS at 0.35x/c f) Pitching moment, CFFS at 0.65x/c.
Figure 6.5: Effect of Counter-Flow Fluidic Spoiler (CFFS) location on the change in
experimental lift, drag and pitching moment with blowing coefficient. Angle of attach
range: ○ = 0o, ∆ = 3
o, □ = 6
o. Corresponding surface pressure distribution plots (in Fig.
6.6) indicated in vertical axis (ACP, BCP, CCP, DCP).(z is the moment arm for the jet)

CHAPTER 6 – RESULTS & DISCUSSION
C.D. HARLEY 103
a) Experimental and CFD upper
surface CFFS at 0.35c. Corresponds to
BCP in Figure 6.5.
b) Experimental and CFD upper
surface CFFS at 0.65c. Corresponds to
DCP in Figure 6.5.
c) Experimental lower surface
CFFS at 0.35c. Corresponds to
ACP in Figure 6.5.
d) Experimental lower surface CFFS
at 0.65c. Corresponds to CCP in
Figure 6.5.
Figure 6.6: Effect of C=0.05 blown CFFS location on change in surface pressure
distributions at = 6o. (□) = upper surface, (∆) = lower surface, (- -) = Spoiler chordwise
location.
Figure 6.7: Gain (efficiency) of CFFS for both lower and upper surfaces, and both
chordwise locations
-16
-12
-8
-4
0
4
dCL/d(hs/c) dCD/d(hs/c) dCM/d(hs/c)
lower surface spoiler at 0.35cupper surface spoiler at 0.35clower surface spoiler at 0.65cupper surface spoiler at 0.65c
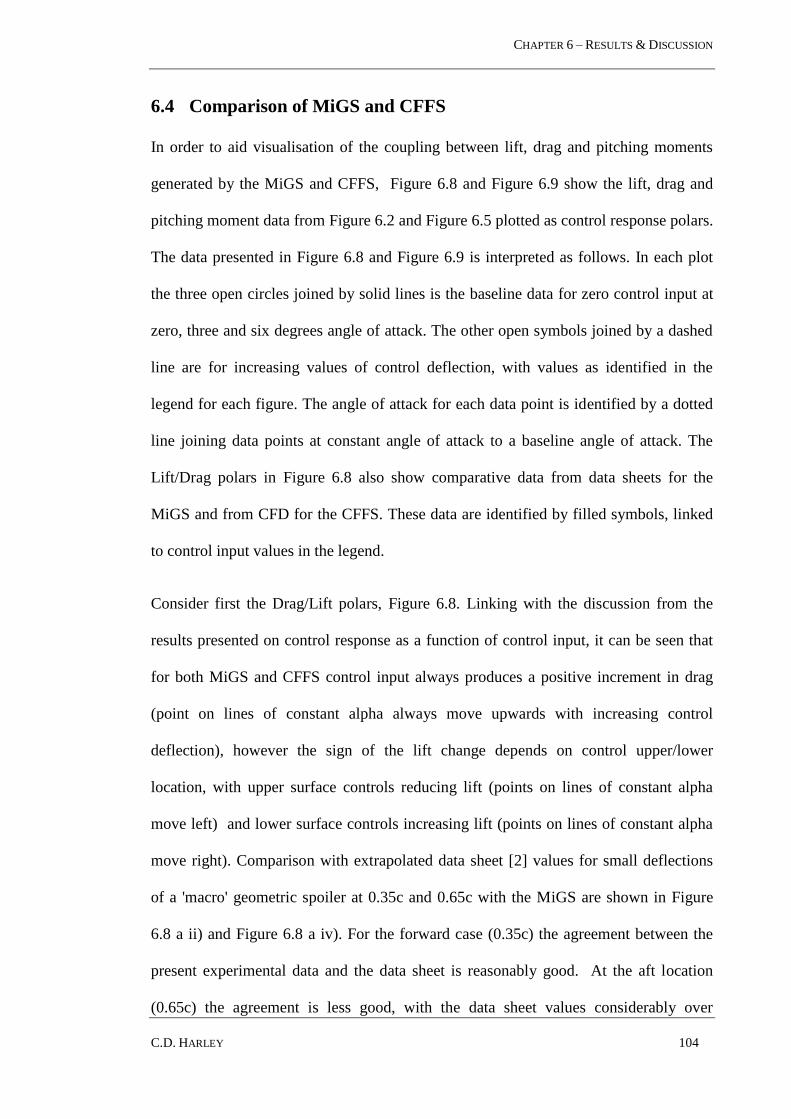
CHAPTER 6 – RESULTS & DISCUSSION
C.D. HARLEY 104
6.4 Comparison of MiGS and CFFS
In order to aid visualisation of the coupling between lift, drag and pitching moments
generated by the MiGS and CFFS, Figure 6.8 and Figure 6.9 show the lift, drag and
pitching moment data from Figure 6.2 and Figure 6.5 plotted as control response polars.
The data presented in Figure 6.8 and Figure 6.9 is interpreted as follows. In each plot
the three open circles joined by solid lines is the baseline data for zero control input at
zero, three and six degrees angle of attack. The other open symbols joined by a dashed
line are for increasing values of control deflection, with values as identified in the
legend for each figure. The angle of attack for each data point is identified by a dotted
line joining data points at constant angle of attack to a baseline angle of attack. The
Lift/Drag polars in Figure 6.8 also show comparative data from data sheets for the
MiGS and from CFD for the CFFS. These data are identified by filled symbols, linked
to control input values in the legend.
Consider first the Drag/Lift polars, Figure 6.8. Linking with the discussion from the
results presented on control response as a function of control input, it can be seen that
for both MiGS and CFFS control input always produces a positive increment in drag
(point on lines of constant alpha always move upwards with increasing control
deflection), however the sign of the lift change depends on control upper/lower
location, with upper surface controls reducing lift (points on lines of constant alpha
move left) and lower surface controls increasing lift (points on lines of constant alpha
move right). Comparison with extrapolated data sheet [2] values for small deflections
of a 'macro' geometric spoiler at 0.35c and 0.65c with the MiGS are shown in Figure
6.8 a ii) and Figure 6.8 a iv). For the forward case (0.35c) the agreement between the
present experimental data and the data sheet is reasonably good. At the aft location
(0.65c) the agreement is less good, with the data sheet values considerably over

CHAPTER 6 – RESULTS & DISCUSSION
C.D. HARLEY 105
predicting the drag. This is not unexpected since the data sheet methods do not take into
account the loss in spoiler effectiveness due to boundary layer emersion at small
deflections. Comparison of upper surface CFFS CFD results with experimental data are
given in Figure 6.8 b ii) and Figure 6.8 b iv). The CFD trends with increasing blowing
are consistent with the experimental data, i.e. blowing reduces lift and increases drag.
However, for the forward spoiler locations CFD over predicts both the reduction in lift
and the increase in drag for a given blowing coefficient, whereas for the aft spoiler the
CFD over predicts lift and under predicts drag. Comparing the gradients of the L/D
CFD and experimental data, shows very similar results for the aft location but not for
the fore location. This discrepancy in CFD and experimental data at the fore location
was investigated and initially thought due to improper resolution of the separation
location ahead of the jet. A number of increasingly dense meshes were used to capture
this, during which the monitoring of velocity at a number of points showed no period
excitation was captured. The forward mounted CFFS device causes the leading edge
stagnation and stagnation point ahead of the CFFS to be much closer than in the aft
case. This is thought to cause a higher frequency separation relative to the aft CFFS and
beyond the ability of the URANS approach.

CHAPTER 6 – RESULTS & DISCUSSION
C.D. HARLEY 106
Figure 6.8: Experimental lift-drag polar plots compared with data sheet (MiGS) and CFD
(CFFS) results
Figure 6.9: Experimental pitching moment – lift polar plots

CHAPTER 6 – RESULTS & DISCUSSION
C.D. HARLEY 107
Consider now the moment/Lift polars shown in Figure 6.9. The data presented in this
form confirms that the pitching moment response of a forward mounted MiGS and
CFFS are similar, however there are a noticeable few differences. A lower surface
mounted CFFS produces very little pitching moment for a given lift compared to the
MiGS. Also, unlike the MiGS the upper surface forward mounted CFFS of Figure 6.9 b
ii) produces a negative pitching moment of a similar order to the aft location, at all lift
coefficients tested. The pitching moment response from both lower surface locations
are equivalent, implying that the change of pitching moment due to CFFS actuation is
much less sensitive to chordwise location than the MiGS.
6.5 Upper and lower surface CFFS blowing
The final set of data explores the simultaneous use of both an upper surface and lower
surface CFFS, with the aim of understanding the potential for use of dual CFFS devices
for control of drag at constant lift and pitching moment. It was decided to use an upper
surface CFFS at the forward location and a lower surface CFFS at the aft station based
on the control authority demonstrated in these positions when used exclusively (only
one control operating at a time). Since there is a fair degree of decoupling between the
pressure distribution on the controlled side and the pressure distribution on the opposite
(uncontrolled) side, it is hypothesized that the control effect from non exclusive
actuation (both controls working at the same time) will be similar to the sum of the
exclusive effects. Measurement of drag, lift, and moment were obtained from the wind
tunnel force balance for varying blowing through both the upper and lower CFFS
devices for an angle of attack of zero and six degrees.
Figure 6.10 shows contour maps of the drag data plotted using the lower surface
blowing as the x axis and upper surface blowing as the y axis. Overlaid on top of this

CHAPTER 6 – RESULTS & DISCUSSION
C.D. HARLEY 108
are loci of upper and lower surface blowing for zero change in lift and zero change in
pitching moment, labelled CM=0 and CL=0, respectively. Thus by choosing blowing
control input pairs that correlate with either of the two loci it is possible to generate a
finite drag with either zero change in pitching moment or zero change in lift, which is
the desired result from a control independence point of view. As it happens, the pitch
and lift loci are approximately overlaid for both zero and six degrees alpha, so
following either loci means that drag can be obtained with zero change in pitching
moment and zero change in lift. Whilst this is a fortuitous result, it arises because for
the present configuration there is proportionality between control lift and control
pitching moment; hence if either is driven to zero then the other will be zero also.
Finally, in comparing the achievable drag control at zero and 6 degrees alpha, it can be
seen that the magnitude of drag obtainable is significantly greater at the higher angle of
attack; however, these high values of drag cannot be obtained along the zero change in
pitching moment and lift loci. Indeed, the maximum achievable drag with no pitch and
lift coupling is less for the six degrees angle of attack case compared to the zero angle
of attack.

CHAPTER 6 – RESULTS & DISCUSSION
C.D. HARLEY 109
a) 0 degrees alpha
b) 6 degrees alpha.
Figure 6.10: Force balance drag coefficient from dual surface blowing for yaw control.
Upper surface CFFS = 0.35x/c. Lower surface CFFS = 0.65x/c. Zero pitching moment
(CM) and lift (CL) loci indicated.

CHAPTER 7 – CONCLUSIONS & FUTURE RESEARCH OPPORTUNITIES
C.D. HARLEY 110
7 CONCLUSIONS & FUTURE RESEARCH
OPPORTUNITIES
7.1 Conclusions
Micro geometric spoilers (MiGS) and Counter-flow fluidic spoilers (CFFS) can be
placed in a similar class of spoiler, ‘low form factor spoiler’, due to their similar
installed volume and influence on the surrounding flow field.
A MiGS is defined as a device whose deployed length scale is of a similar order
to the local boundary layer thickness at the point of operation. This is contrast to
conventional 'macro geometric spoilers' where the deployed length scale is
much larger than the local boundary layer thickness. The MiGS acts as a barrier
to the smooth near wall flow effectively reducing the momentum in the co-flow
direction.
A CFFS is distinct from other fluidic control implementations that use
tangential blowing in that the blowing direction is perpendicular to the leading
edge and in opposition to the local freestream direction and that the control is
placed on the upper or lower surface away from the leading and trailing edges.
This is significant in that leading and trailing edges are typically already highly
constrained areas of real estate on a lifting surface in terms of geometry and
systems placement and hence the capability to implement new flight controls
outside these areas is advantageous. The CFFS acts as a barrier to the smooth
near wall flow by addition of momentum in the counter-flow direction.
CHAPTER 7 – CONCLUSIONS & FUTURE RESEARCH OPPORTUNITIES
C.D. HARLEY 111
A simple qualitative comparison has shown that a typical rearward mounted
spoiler can produce similar changes in the aerodynamic coefficients as camber
modifications. Geometric and fluidic spoilers have also been shown to have
broadly similar flow topology features apart from a number of detailed
differences.
An upper surface rearward mounted spoiler or negative camber modification
cause a reduction in lift, an increase in drag and an increase pitching moment. A
lower surface rearward mounted spoiler or positive camber modification cause
an increase in lift and increase in drag and a reduction pitching moment.
Both geometric and fluidic spoilers cause a large recirculating region that
reattaches to the surface or stays separated depending on the lifting surface
configuration and flow field conditions. Both geometric and fluidic spoilers
have small recirculating regions similar to those termed “hinge bubbles” just
ahead and behind the spoiler base or slot, apart from the CFFS, whose large
recirculating region is entrained by the jet such that there is no minor aft
recirculation.
Relatively small scale, low speed two dimensional wind tunnel experiment has
been shown suitable to obtain the two-dimensional qualitative aerodynamic
performance of MiGS and CFFS at low angles of attack.
Measurements were taken from an overhead mounted force balance, surface
pressure tapping‟s and wake survey. The force balance drag measurements
captured three-dimensional flow characteristics for the baseline aerofoil

CHAPTER 7 – CONCLUSIONS & FUTURE RESEARCH OPPORTUNITIES
C.D. HARLEY 112
configuration therefore the wake survey drag was used for subsequent drag data
except where stated.
A control volume analysis of the wind tunnel test section containing CFFS
model configuration has shown that a correction related to the additional mass
flow of the jet is required to obtain the actual drag coefficient, similar to that
observed in other fluid injection device experiments.
CFD can provide realistic results for aerofoils at low angles of attack with
deployed geometric spoilers. However, accurate simulation of fluidic spoiler
devices using URANS is limited.
CFD analyses of geometric surface configurations, such as baseline wind tunnel
model and macro geometric spoiler configurations from literature have shown
good agreement of both surface pressure distributions and global aerodynamic
coefficients.
Accurate correlation between CFD and experimental results for the CFFS cases
was only found when the calibration factor used in the fluidic spoiler validation
case was used. The use of a calibration factor is considered acceptable practice
on the basis that the effective discharge coefficient of the blowing slot is
unknown and hence there needs to be some correction applied to the blowing
coefficient used in the CFD and the actual blowing coefficient delivered by the
experiment when the experimental blowing coefficient is derived from
measurement of plenum pressure.
It was also found that for the forward CFFS location using the methods
described; the CFD methodology used could not qualitatively predict the global

CHAPTER 7 – CONCLUSIONS & FUTURE RESEARCH OPPORTUNITIES
C.D. HARLEY 113
aerodynamic coefficients. Comparing the CFD results to the experimental
results, it is clear that the good qualitative agreement is found for the aft CFFS
case; however there are differences in the forward location results. A mesh
refinement study failed to capture the periodic oscillation in the flow field,
therefore it is perceived this discrepancy is most likely due to a limitation of
URANS in capturing the high frequency oscillations that may dominate the
flow field.
Experimental results combined with understanding of flow field topology from
CFD shows that the fundamental fluid mechanism for both MiGS and CFFS is
similar, however there are some differences.
Both the MiGS and CFFS generate an adverse pressure gradient ahead of the
actuation mechanism which causes an upstream flow separation. The location of
this separation is approximately proportional to the control input, that is, larger
MiGS deflection or increased blowing from the CFFS shifts the separation point
forward. The static pressure downstream of the spoiler generally decreases
(becomes more negative) with increasing spoiler input, however, the magnitude
of the change is generally smaller than pressure change ahead of the device.
This overall mechanism is similar to the way in which macro spoiler devices
work at small deflection angles.
For an aerofoil at a positive lift coefficient, spoiler input on the upper surface
reduces the lift and increases the drag, whereas a spoiler on the lower surface
decreases lift and increases drag.
The fore/aft location of the spoiler devices has important effects on the device

CHAPTER 7 – CONCLUSIONS & FUTURE RESEARCH OPPORTUNITIES
C.D. HARLEY 114
control response and these effects are different for the MiGS and CFFS. For the
MiGS, the greatest lift and drag control gain (efficiency) is for a forward located
device on the upper surface, however the control response varies considerably
with angle of attack. This coupled with the potential lag in control response
observed in the early development of spoilers makes control implementation
problematic. For the CFFS, the greatest lift and drag gain is for the aft location
and the control response is reasonably independent of angle of attack. The
pitching moment generated by the MiGS is nose down for the forward location
and nose up for the aft location on both upper surfaces. For the CFFS, the
pitching moment is generally nose down for all locations.
By placement of a CFFS device on the upper and lower surfaces and use of
simultaneous blowing from both devices it is possible to generate finite changes
in drag with zero change in both lift and pitching moment. This potentially
simplifies the implementation of spoiler devices into a yaw control scheme
based on lateral differential drag control.
7.2 Future research opportunities
The work presented in this thesis combined the micro geometric spoiler and counter-
flow fluidic spoiler in to the low form factor spoiler class. The two-dimensional
aerodynamic performance of these two devices has been evaluated and shown to
provide similar effectiveness to small deflections of macro geometric spoilers and
trailing edge devices. Following on from this thesis, a number of areas may benefit
from further work.
The URANS methodology applied in this thesis has shown good agreement
with experiment for aerofoils with deflected geometric spoiler, however, the

CHAPTER 7 – CONCLUSIONS & FUTURE RESEARCH OPPORTUNITIES
C.D. HARLEY 115
fluidic spoiler has proven more difficult to simulate. In particular two areas
require further study, 1) the blowing coefficient calibration factor required to
match simulated surface pressure distribution with experimental results, and 2)
the ability to capture the period excitation within the flowfield due to the fluidic
spoiler in the fore (0.35x/c) location separating the flow near the leading edge.
3D URANS and LES simulations investigating these issues could lead to a
greater understanding of the limitations of 2D URANS simulations in predicting
these complex flow structures.
This thesis has evaluated low form factor devices in two-dimensions, however
the flow over an aircraft wing is rarely two-dimensional. Therefore an
understanding of the three-dimensional performance of low form factor devices
is necessary before application to a flight vehicle. This could be achieved by
applying the devices to a swept wing with and without end plates, to distinguish
between wing sweep effects and end effects.
Both the MiGS and CFFS are susceptible to interaction with a wide range of
radar frequencies due to the discontinuity in the aerodynamic mould line of the
wing. The MiGS discontinuity consists of a high aspect ratio physical spoiler,
whereas the CFFS discontinuity consists of a high aspect ratio slot in the wing
surface. The micro geometric spoiler requires an increase in surface area to
increase effectiveness, which in turn will increase radar signature. However, the
counter-flow fluidic spoiler has a fixed discontinuity and therefore a fixed radar
signature at all actuation conditions. Therefore the CFFS may lend itself to low
observable applications. Potential areas of further work are:
o The radar signature of the device could be reduced by using a series of
shorter slots, or holes, instead of a single high aspect ratio slot.

CHAPTER 7 – CONCLUSIONS & FUTURE RESEARCH OPPORTUNITIES
C.D. HARLEY 116
However, this may cause unwanted effects, such as a reduction of
efficiency or effectiveness.
o The radar signature of the device could be minimised, when it is
inactivate, by having a slot opening/closing mechanism. Potential
solutions are a mechanical slot lip actuator and a flexible slot lip. A
mechanical actuator could act as a valve or actuation mechanism for the
CFFS, allowing the pneumatic system to be fully pressurised and
therefore minimal lag in the device activation. A flexible slot lip could
be designed to flex under certain pressure difference conditions between
the local freestream and the plenum.
The macro geometric spoiler located towards the leading edge has been shown
to increase the lag of the aircraft response due to spoiler deployment. Moving
the spoiler further towards the trailing edge reduced the lag but also reduced the
effectiveness. A thorough understanding of the lag of the aircraft response to a
control input is beneficial before flight investigations take place. An
investigation of the lag due to a MiGS and CFFS is suggested through the use of
a dynamic load recording wind tunnel investigation.
Flapless flight refers to the ability of a aircraft to perform a full flight operation
without the use of geometric control surfaces. This can be performed by the use
of fluidic devices for aircraft control such as circulation control and fluidic
thrust vectoring. If the pneumatic system of these fluidic devices relies on
engine bleed, high control authority but low throttle phases of flight, such as the
approach and landing phase, may cause issues. A CFFS system could provide a
method which allows maximum throttle and therefore high control authority at
these flight phases.
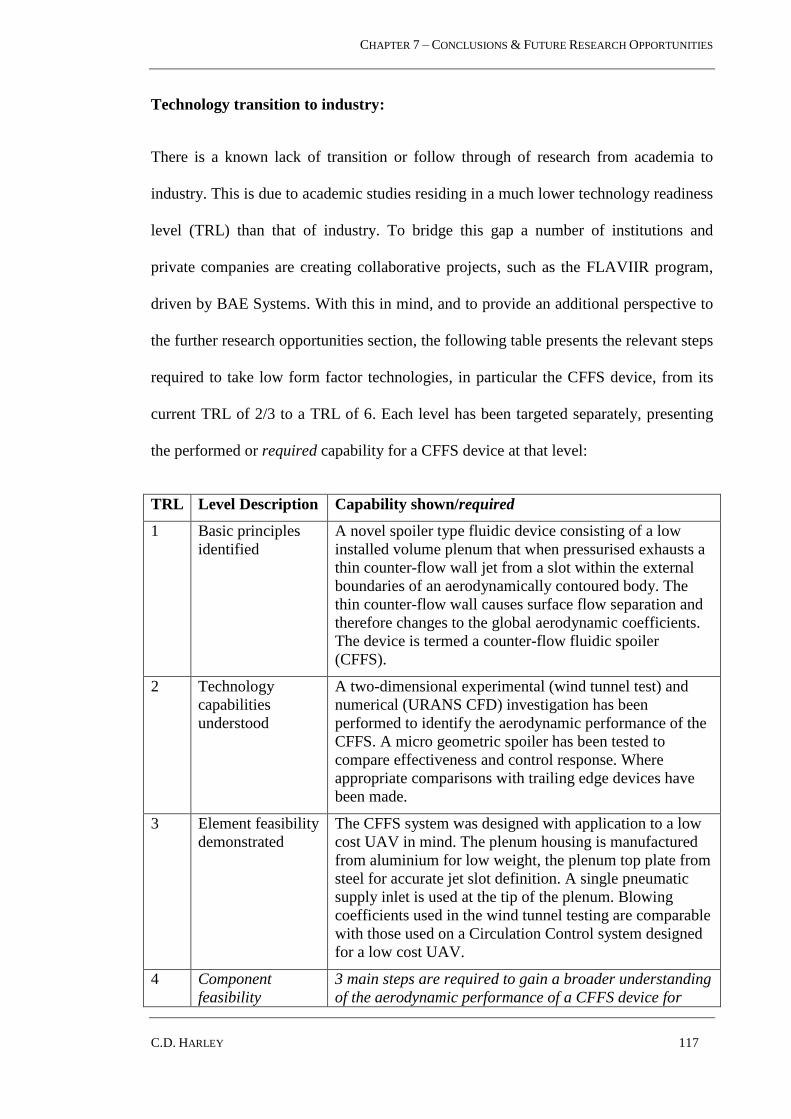
CHAPTER 7 – CONCLUSIONS & FUTURE RESEARCH OPPORTUNITIES
C.D. HARLEY 117
Technology transition to industry:
There is a known lack of transition or follow through of research from academia to
industry. This is due to academic studies residing in a much lower technology readiness
level (TRL) than that of industry. To bridge this gap a number of institutions and
private companies are creating collaborative projects, such as the FLAVIIR program,
driven by BAE Systems. With this in mind, and to provide an additional perspective to
the further research opportunities section, the following table presents the relevant steps
required to take low form factor technologies, in particular the CFFS device, from its
current TRL of 2/3 to a TRL of 6. Each level has been targeted separately, presenting
the performed or required capability for a CFFS device at that level:
TRL Level Description Capability shown/required
1 Basic principles
identified
A novel spoiler type fluidic device consisting of a low
installed volume plenum that when pressurised exhausts a
thin counter-flow wall jet from a slot within the external
boundaries of an aerodynamically contoured body. The
thin counter-flow wall causes surface flow separation and
therefore changes to the global aerodynamic coefficients.
The device is termed a counter-flow fluidic spoiler
(CFFS).
2 Technology
capabilities
understood
A two-dimensional experimental (wind tunnel test) and
numerical (URANS CFD) investigation has been
performed to identify the aerodynamic performance of the
CFFS. A micro geometric spoiler has been tested to
compare effectiveness and control response. Where
appropriate comparisons with trailing edge devices have
been made.
3 Element feasibility
demonstrated
The CFFS system was designed with application to a low
cost UAV in mind. The plenum housing is manufactured
from aluminium for low weight, the plenum top plate from
steel for accurate jet slot definition. A single pneumatic
supply inlet is used at the tip of the plenum. Blowing
coefficients used in the wind tunnel testing are comparable
with those used on a Circulation Control system designed
for a low cost UAV.
4 Component
feasibility
3 main steps are required to gain a broader understanding
of the aerodynamic performance of a CFFS device for

CHAPTER 7 – CONCLUSIONS & FUTURE RESEARCH OPPORTUNITIES
C.D. HARLEY 118
demonstrated flight control, this includes:
1. Effectiveness near stall angles
2. wing tip effects
3. effect of increasing wing sweep
4. Effect of yaw
5. Speed
6. Altitude
7. Scale effects
8. Environmental effects
9. Safety
10. Qualification
5 Major component
capability
demonstrated
This would include:
1. Application of an optimised CFFS device to a
representative flight ready pneumatic system,
either a pressurised cylinder or engine bleed.
2. Using a wind tunnel, investigate the aerodynamic
performance of a CFFS device applied to a low
cost UAV system to meet specific flight control
performance requirements.
6 Integrated
component
capability
demonstrated
Flight testing of a CFFS device integrated into a low cost
UAV system.

REFERENCES
C.D. HARLEY 119
8 REFERENCES
[1] Mack, M.D, Seetharam, H. C., Kuhn, W. G., Bright, J. T., “Aerodynamics of
spoiler control devices,” presented at the AIAA Aircraft Systems and Technology
meeting, New York, 1979.
[2] Flower, J.W., “Lift and rolling moment due to spoilers on wings with flaps
undeflected at subsonic speeds,” ESDU, 90030b, pp. 1-30, 1999.
[3] Waszak, M. R., “Robust Multivariable Flutter suppression for benchmark active
control technology wind tunnel model,” AIAA, vol. 24, no. 1, pp. 147-153, Feb.
2001.
[4] Il, D. A., Gentry, G. L. and Stickle, J. W., Wind tunnel study of slot spoilers for
direct lift control. NASA, Langley Research Centre, NASA-TN-D-6672, 1972.
[5] Croom, D. R., Dunham, R. E., Low-speed wind-tunnel investigation of span load
alteration, forward-located spoilers, and splines as trailing-vortex hazard
alleviation devices on a transport aircraft model. NASA, Langley Research
Centre, NASA-TN-D-8133, 1975.
[6] “www.airliner.net.”
[7] Standish, K. J., Baker, J.P. and van Dam, C. P., “Two-Dimensional Wind Tunnel
and Computational Investigation of a Microtab Modified Airfoil,” Journal of
Aircraft, vol. 44, no. 2, pp. 563-572, Mar. 2007.
[8] Standish, K. J., Van Dam, C. P., “Computational analysis of a microtab-based
aerodynamic load control system for rotor blades,” Journal of the American
Helicopter Society, vol. 50, no. 3, pp. 249-258, Jul. 2005.
[9] Nakafuji, D. Y., Active Load Control & Mitigation Using Microtabs: A Wind
Energy Application. U.S. Department of Energy, 2003.
[10] Englar, R. J., “Circulation control for high lift and drag generation on STOL
aircraft,” Journal of Aircraft, vol. 12, no. 5, pp. 457-463, 1975.
[11] Bradley, R. D., Wray, W. O., “A conceptual study of leading-edge-vortex
enhancement by blowing,” presented at the 6th AIAA Fluid and Plasma Dynamics
Conference, Palm Springs, California., pp. 33-48, 1973.
[12] Crowther, W. J. Wilde, P. I. A and Harley, C. D., “Application of circulation
control for three axis control of a tailless flight vehicle,” Proceedings of the
Institute of Mechancial Engineers, vol. 224, pp. 373-386, 2009.
[13] Crowther, W. J., Wilde, P. I. A and Buonanno, A., “Integrated design of fluidic
flight controls for a gas turbine powered aircraft,” presented at the 26th AIAA
Applied Aerodynamics Conference, Honolulu, Hawaii, 2008.
[14] Anderson, J. D., Fundamentals of Aerodynamics, Third. McGraw-Hill, 2001.
[15] Lee, C. S., Bodapati, S., “Experimental investigations of the flowfield of an airfoil
with spoiler,” AIAA, vol. 25, no. 11, pp. 1411-1416, Nov. 1987.
[16] McLachlan, B. G., Karamcheti, K. and Ayoub, A., Hadjidakis, G., “A study of the
unsteady flow field of an airfoil with deflected spoiler,” presented at the AIAA
Atmospheric flight mechanics conference, Gatlinburg, Tennessee, 1983.
[17] Weick, F. E., Wenzinger, C., J., Wind-tunnel research comparing lateral control
devices, particularly at high angels of attack. I - Ordinary Ailerons on rectangular
wings. NACA, Langley Memorial Aeronautical Laboratory, NACA-TR-419,
1933.
[18] Toll, T. A., Summary of lateral-control research. NACA, Langley Research
Centre, NACA-TN-1245, 1947.

REFERENCES
C.D. HARLEY 120
[19] Bear, R. M., Effect of baffle flaps on aerofoil characteristics. Construction
Department, Washington Navy Yard, Report No. 201, 1922.
[20] Batson, A. S. Irving, H. B., Some early model experiments on devices for
improving lateral control near the stall. Aeronautical Research Council, Reports
and Memoranda, Report No. 1251, 1929.
[21] Wenzinger, C. J. Weick, F. E., Preliminary investigation of rolling moments
obtained with spoilers on both slotted and plain wings. NACA, Langley Memorial
Aeronautical Laboratory, NACA-TN-415, 1932.
[22] Eighteenth annual report of the national advisory committee for aeronautics.
NACA, 18th Annual Report, Washington, U.S., 1933.
[23] Weick, F. E., Soule, H. A and Gough, M. N., A flight investigation of the lateral
control characteristics of short wide ailerons and various spoiler with different
amounts of wing dihedral. NACA, Langley Memorial Aeronautical Laboratory,
NACA-TR-494, 1935.
[24] Jones, R. T. Weick, F. E., Resume and analysis of NACA lateral control research.
NACA, Langley Memorial Aeronautical Laboratory, NACA-TR-605, 1937.
[25] Wenzinger, C. J., Rogallo, F. M., Wind-tunnel investigation of spoiler, deflector,
and slot lateral-control devices on wings with full-span split and slotted flaps.
NACA, Langley Memorial Aeronautical Laboratory, NACA-TR-706, 1941.
[26] McAvoy, W. H., Lawrence, A., Flight measurements of the lateral control
characteristics of an airplane equipped with a combination aileron-spoiler
control system. NACA, Ames Research Centre, NACA-WR_A-68, 1942.
[27] Fitzpatrick, J. E., Furlong, G. C., Effect of spoiler-type lateral-control devices on
the twisting moments of a wing of NACA 230-series airfoil sections. NACA,
Langley Memorial Aeronautical Laboratory, NACA-TN-1298, 1947.
[28] Purser, P. E., McKinney, E. G., Comparison of pitching moments produced by
plain flaps and by spoilers and some aerodynamic characteristics of an NACA
23012 airfoil with various types of aileron. NACA, Langley Memorial
Aeronautical Laboratory, NACA-ACR-L5C24a, 1945.
[29] Ernst, G., Kramer, M., Development of spoiler controls for remote control of
flying missiles. NACA, ZWB Forschungsbericht Nr, NACA-TM-1210, 1943.
[30] Goodman, A. Letko, W., Preliminary wind-tunnel investigation at low speed of
stability and control characteristics of swept-back wings. NACA, Langley
Memorial Aeronautical Laboratory, NACA-TN-1046, 1946.
[31] Weick, F. E., Wenzinger, C. J., Preliminary investigation of rolling moments
obtained with spoilers on both slotted and plain wings. NACA, Langley Research
Centre, NACA-TN-415, 1932.
[32] Shortal, J., Weick, F. E., Wind-tunnel research comparing lateral control devices,
particularly at high angles of attack. V - spoilers and ailerons on rectangular
wings. NACA, Langley Memorial Aeronautical Laboratory, NACA-TR-439,
1932, pp. 1-11.
[33] Shortal, J. A., Effect of Retractable-Spoiler Location on Rolling and Yawing
Moment Coefficients. NACA, Langley Research Centre, NACA-TN-499, 1934,
pp. 1-9.
[34] Laitone, E. V., Summers, J. L., An additional investigation of the high-speed
lateral-control characteristics of spoilers. NACA, Ames Aeronautical Laboratory,
NACA-ACR-5D28, 1945.
[35] Wood, R. M., Bauer, S. X. S., Advanced Aerodynamic Control Effectors. NASA,
Langley Research Centre, SAE-1999-01-5679: , 1999.
[36] Dorsett, K. M., Mehl, D. R., Innovative control effectors (ICE). NACA, Wright

REFERENCES
C.D. HARLEY 121
Laboratory, WL-TR-96-3043, 1996.
[37] Bauer, S. X. S., “An aerodynamic assessment of micro-drag generators (MGDs),”
presented at the 16th AIAA Applied aerodynamics conference, Albuquerque, NM,
1998.
[38] Filippone, A., “Steep-descent maneuver of transport aircraft,” Journal of Aircraft,
vol. 44, no. 5, pp. 1727-1739, Sep. 2007.
[39] Bowers, D. L., “Aerodynamic effects induced by a vectored high aspect ratio
nonaxisymmetric exhaust nozzle,” Journal of Aircraft, vol. 16, no. 10, pp. 729-
732, 1979.
[40] Krothapalli, A., Leopold, D., and Tavella, D. A.,, “Some Observations on the
Aerodynamics of an Airfoil with a Jet Exhausting from the Lower Surface,”
presented at the 21st AIAA Aerospace Sciences Meeting, 1983.
[41] Langan, K. J. Walchli, L. A., “Transonic evaluation of a pneumatic spoiler for
aircraft control,” in 17th AIAA Applied aerodynamics conference, 1999.
[42] Lee, C. S. Tavella, D. A. and Wood, N. J., Roberts, L., “Jet spoiler as a yaw
control device,” Journal of Aircraft, vol. 24, no. 9, pp. 611-615, Sep. 1987.
[43] Jacobs, E. N., Sherman, A., Airfoil section characteristics as affected by
variations of the reynolds number. NACA, Langley Research Centre, NACA-TR-
586, 1937.
[44] Wilde, P. I. A. Crowther, W. J. and Michie, S. M. Gill, F., “Towards Integrated
design of fluidic flight controls for flapless flight,” The Aeronautical Journal, vol.
133, no. 1148, Oct. 2009.
[45] Gregory-Smith, D.G., Gilchrist, A. R., “The compressible Coanda wall jet - an
experimental study of jet structure and breakaway,” International Journal of Heat
and Fluid Flow, vol. 8, no. 2, pp. 156-164, 1987.
[46] McGlaughlin, D. W., Greber, I., “Experiments on the separation of a fluid jet fron
a curved surface,” ASME - Advanaces in fluidics, 1967.
[47] Lucius, G. A. Cornelius, K. C., “Physics of Coanda jet detachment at high-
pressure ratio,” Journal of Aircraft, vol. 31, no. 3, pp. 591-596, 1994.
[48] Trobaugh, L.A. Englar, R. J. and Hemmerly, R. A, “STOL potential of the
circulation control wing for high-performance aircraft,” Journal of Aircraft, vol.
15, no. 3, pp. 175-181, 1978.
[49] Griffin, J. Wetzel, D. and Liu, F., Cattafesta, L., “An experimental study of
circulation control on an elliptic airfoil,” presented at the 39th AIAA Fluid
Dynamics Conference, San Antonio, Texas, 2009.
[50] Strykowski, P. J. Van Der Veer, M. R., Thrust vector control of rectangular jets
using counterflow. Minnesota Univ. Minneapolis Office of Research and
Technology Transfer Administration, AFOSR-TR-95-0639, 1995.
[51] Frith, S., “Flapless control for low aspect ratio wings,” PhD Thesis, The
University of Manchester, UK, 2007.
[52] Jones, B. M., Measurement of profile drag by the pitot-traverse method.
Aeronautical Research Council Reports and Memoranda, No. 1688, 1936.
[53] Krause, L.N., Effecs of pressure-rake design parameters on static-pressure
measurement for rakes used in subsonic free jets. NACA, Lewis flight propulsion
laboratory NACA-TN-2520, 1951.
[54] Barlow, J.B., Rae, W. H. and Pope, A., Low-speed wind tunnel testing, Third
edition. (JohnWiley, New York), 1999.
[55] “Fluid Forces and moments on flat plates,” ESDU, 70015, Oct. 1972.
[56] Schlichting, H., Gersten, K., Boundary Layer Theory, 8th ed. Springer.
[57] Kind, R. J., “A proposed method of circulation control,” PhD Thesis, Univ. of

REFERENCES
C.D. HARLEY 122
Cambridge, 1969.
[58] Williams, R. M., Harvey, J. H., Two dimensional subsonic wind tunnel tests on a
20 percent thick, 5 percent cambered circulation control airfoil. Naval ship
research and development centre, NACA-TN-AL-176, 1970.
[59] Gao, W. Zha, G. and Paxton, C. D, “Jet effects on coflow jet airfoil performance,”
Journal of Aircraft, vol. 45, no. 6, pp. 1222-1231, Jun. 2007.
[60] General metrology - Part 4: Practical guide to measurement uncertainty. British
Standards Institute, 2004.
[61] Consigny, H., Gravelle, A. and Molinaro, R., “Aerodynamic characteristic of a
two-dimensional moving spoiler in subsonic and transonic flow,” Journal of
Aircraft, vol. 21, no. 9, pp. 687-694, Sep. 1984.
[62] Patankar, S.V., Spalding, D. B., “A calculation procedure for heat mass and
momentum transfer in three-dimensional parabolic flows,” In. J. Heat Mass
Transfer, vol. 15, pp. 1787-1806, 1972.
[63] Menter, F. R., “Two-equation eddy-viscosity turbulence models for engineering
applications,” AIAA, vol. 32, no. 8, pp. 1598-1605, 1994.
[64] Chang, K. S., Choi, S. W., “Parametric Study of Transient Spoiler Aerodynamics
with Two-Equation Turbulence Models,” AIAA, vol. 38, no. 5, pp. 888-894, Sep.
2001.
[65] Launder, B. E., Sharma, B. I., “Applications of the energy dissipation model of
turbulence to the calculation of flow near a spinning disc,” Letters in Heat and
Mass Transfer, vol. 1, no. 2, pp. 131-138, 1974.
[66] Wilcox, D. C., “Re-assessment of the scale-determining equation for advanced
turbulence models,” AIAA, vol. 26, no. 11, pp. 1299-1310, 1988.
[67] Filippone, A., “Inverted jet spoilers for aerodynamic control,” Journal of Aircraft,
vol. 46, no. 4, pp. 1240-1252, 2009.
[68] Increments in aerofoil lift coefficient at zero angle of attack and in maximum lift
coefficient due to deployment of a plain trailing-edge flap, with or without a
leading-edge high-lift device, at low speeds. ESDU, data sheet 94028, 1994.
[69] Jenn, D, Radar and Laser Cross Section Enginering, Second Edition, AIAA, 2005
[70] FLUENT 6.3. users guide.
[71] Jones, G.S. Pneumatic Flap Performance for a 2D Circulation Control Airfoil, Steady
and Pulsed. 2004 NASA/ONR Circulation Control Workshop, NASA Langley
Research Center, Hampton, VA, United States, 2005.

APPENDIX
C.D. HARLEY 123
9 APPENDIX
9.1 Change in lift due to the deflection of a plain flap
The theoretical lift due to the deflection of a plain flap has been compared with the
change in lift caused by the micro geometric spoiler and counter-flow fluidic spoiler in
the results section. The theoretical and empirical working used to obtain the change in
lift due to a flap deflection presented here is based on that presented in ESDU [68].
Figure 9.1 shows a schematic of a two-dimensional aerofoil and plain trailing edge flap
to which the theory refers. This theory extends into three-dimensional applications,
however, only the two-dimensional case is required in this study. The increment in lift
due to a flap deflection at zero lift angle of attack is:
∆𝐶𝐿0𝑡 = 2𝐽𝑝𝜉𝑓𝑙𝑎𝑝 𝑎𝑡 ( 27 )
Where Jp is an empirical constant based on aerofoil geometry, flap is the flap deflection
and aflap is:
𝑎𝑓𝑙𝑎𝑝 = 𝜋 − cos−1 2𝑐𝑓𝑙𝑎𝑝
𝑐′ − 1 + 1−
2𝑐𝑓𝑙𝑎𝑝𝑐′ − 1
2
12
( 28 )
Where cflap is the flap chord length, and c’ is the mean aerodynamic chord length.
The limiting parameters of the theory are shown in the following table. The predicted
data is given to within ±20% of experimental data. Therefore the application as a
comparison with micro geometric and fluidic spoilers is justified for this study.

APPENDIX
C.D. HARLEY 124
Parameter Range
Thickness to chord ratio, t/c 0.06 to 0.18
Flap chord to chord ratio, cflap/c 0.2 to 0.5
Reynolds number based on chord length 2.17 to 6 (x106)
Mach number 0.09 to 0.15
Table 9.1: Parameter ranges for test data for plain trailing-edge flaps
Figure 9.1: Geometric definition of an aerofoil with a plain flap control surface
for the determination of the theoretical lift coefficient
Copyright © 2022 FDOKUMEN