Effect of the wing trailing-edge flaps and spoilers ... - eucass
10
7 TH EUROPEAN CONFERENCE FOR AERONAUTIC AND SPACE SCIENCES (EUCASS) Effect of the wing trailing-edge flaps and spoilers position on the jet-vortex wake behind an aircraft during takeoff and landing run Yu. M. Tsirkunov ∗† , M. A. Lobanova ∗ , A. I. Tsvetkov ∗∗ , B. A. Schepanyuk ∗∗ ∗ Baltic State Technical University, 1st Krasnoarmeiskaya str. 1, 190005 Saint Petersburg, Russia ∗∗ Centre of Applied Aerodynamics, Research Park, Saint Petersburg State University 190000 Saint Petersburg, Russia † Corresponding author: [email protected] Abstract The large-scale vortex structure of flow in the near wake behind an aircraft during its run on a runway is in- vestigated numerically. The geometrical aircraft configuration was taken close to a mid-range commercial aircraft like Boeing 737-300. It included all essential elements: a body (fuselage), wings with winglets, horizontal and vertical stabilizers, engine nacelles, nacelle pylons, inboard flap track fairings, leading-edge and trailing-edge flaps, and spoilers. Flaps and spoilers position corresponded to the takeoff and landing run conditions. Computational simulation was based on solving the Reynolds averaged Navier-Stokes equations closed with the Menter SST turbulence model. Patterns of streamlines, fields of the axial vor- ticity and the turbulent intensity, vertical and horizontal velocity profiles in the wake are compared and discussed for both run regimes. The flow model was preliminary tested for validity by comparison of the calculated velocity profiles behind a small-scaled aircraft model with those obtained in special wind tunnel experiments. 1. Introduction An aircraft rolling on a runway during takeoff or landing generates a strongly disturbed and long-living airflow behind it, which is known as a vortex wake. Such a wake, particularly behind a large airliner, presents a serious danger for a following aircraft, and this limits a runway capacity. For the takeoff and landing safety it is critically important to predict the wake properties, particularly its large-scale vortex structure. The jet-vortex wake flow behind aircrafts remains an important and interesting subject of investigation for several decades. It is caused by practical needs of effective air traffic control and flight safety, and by an academic interest to complicated and correlated fluid mechanics phenomena in the wake. A considerable attention was paid to a single wing-tip vortex structure [1], dynamics and stability of a vortex pair in atmosphere [2, 3], near-field and far-field flow behind an aircraft under cruise conditions [4, 5], ground effect on the vortex behaviour [6, 7], contrail formation in aircraft wakes [8], and many other aspects. The great majority of publications are devoted to the study of the wake properties for the cruising flight conditions. A variety of theoretical, computational and experimental techniques were developed and used for analysis and control of wake flows. Excellent reviews [9, 10, 11, 12, 13] give a comprehensive view on the subject and contain several hundred references. Recent activities and results obtained within the European 7th Framework Program (FP7) are presented in reports of WakeNet3 [14]. In spite of intensive investigations of commercial aircrafts wake vortex systems under the cruise conditions, much less attention has been paid to the wake flow structure when an aircraft runs on a runway during takeoff and landing. Only several papers are devoted to the wake flow during landing approach (e.g. [15]). Contrary to the cruising flight, leading-edge and trailing-edge flaps, and spoilers are deflected as prescribed by the mode requirements when an aircraft rolls on a runway. For example, all flaps and spoilers are fully extended during landing run. One might expect that flaps and spoilers create a variety of concentrated vortices which interact and merge with each other, and form together with the wing tip vortices a very complex heterogenous vortex structure in the wake. Besides, a runway, as a solid screen, can effect considerably on the development of a wake flow. Copyright © 2017 by Yu. M. Tsirkunov, M. A. Lobanova, A. I. Tsvetkov and B. A. Schepanyuk. Published by the EUCASS association with permission. DOI: 10.13009/EUCASS2017-318
-
Upload
khangminh22 -
Category
Documents
-
view
3 -
download
0
Transcript of Effect of the wing trailing-edge flaps and spoilers ... - eucass
7TH EUROPEAN CONFERENCE FOR AERONAUTIC AND SPACE SCIENCES (EUCASS)
Effect of the wing trailing-edge flaps and spoilers position onthe jet-vortex wake behind an aircraft during takeoff and
landing run
Yu. M. Tsirkunov ∗†, M. A. Lobanova ∗, A. I. Tsvetkov ∗∗, B. A. Schepanyuk ∗∗
∗Baltic State Technical University, 1st Krasnoarmeiskaya str. 1, 190005 Saint Petersburg, Russia∗∗Centre of Applied Aerodynamics, Research Park, Saint Petersburg State University
190000 Saint Petersburg, Russia†Corresponding author: [email protected]
AbstractThe large-scale vortex structure of flow in the near wake behind an aircraft during its run on a runway is in-vestigated numerically. The geometrical aircraft configuration was taken close to a mid-range commercialaircraft like Boeing 737-300. It included all essential elements: a body (fuselage), wings with winglets,horizontal and vertical stabilizers, engine nacelles, nacelle pylons, inboard flap track fairings, leading-edgeand trailing-edge flaps, and spoilers. Flaps and spoilers position corresponded to the takeoff and landingrun conditions. Computational simulation was based on solving the Reynolds averaged Navier-Stokesequations closed with the Menter SST turbulence model. Patterns of streamlines, fields of the axial vor-ticity and the turbulent intensity, vertical and horizontal velocity profiles in the wake are compared anddiscussed for both run regimes. The flow model was preliminary tested for validity by comparison of thecalculated velocity profiles behind a small-scaled aircraft model with those obtained in special wind tunnelexperiments.
1. Introduction
An aircraft rolling on a runway during takeoff or landing generates a strongly disturbed and long-living airflow behindit, which is known as a vortex wake. Such a wake, particularly behind a large airliner, presents a serious danger fora following aircraft, and this limits a runway capacity. For the takeoff and landing safety it is critically important topredict the wake properties, particularly its large-scale vortex structure.
The jet-vortex wake flow behind aircrafts remains an important and interesting subject of investigation for severaldecades. It is caused by practical needs of effective air traffic control and flight safety, and by an academic interest tocomplicated and correlated fluid mechanics phenomena in the wake. A considerable attention was paid to a singlewing-tip vortex structure [1], dynamics and stability of a vortex pair in atmosphere [2, 3], near-field and far-field flowbehind an aircraft under cruise conditions [4, 5], ground effect on the vortex behaviour [6, 7], contrail formation inaircraft wakes [8], and many other aspects. The great majority of publications are devoted to the study of the wakeproperties for the cruising flight conditions. A variety of theoretical, computational and experimental techniques weredeveloped and used for analysis and control of wake flows. Excellent reviews [9, 10, 11, 12, 13] give a comprehensiveview on the subject and contain several hundred references. Recent activities and results obtained within the European7th Framework Program (FP7) are presented in reports of WakeNet3 [14]. In spite of intensive investigations ofcommercial aircrafts wake vortex systems under the cruise conditions, much less attention has been paid to the wakeflow structure when an aircraft runs on a runway during takeoff and landing. Only several papers are devoted to thewake flow during landing approach (e.g. [15]). Contrary to the cruising flight, leading-edge and trailing-edge flaps,and spoilers are deflected as prescribed by the mode requirements when an aircraft rolls on a runway. For example,all flaps and spoilers are fully extended during landing run. One might expect that flaps and spoilers create a varietyof concentrated vortices which interact and merge with each other, and form together with the wing tip vortices a verycomplex heterogenous vortex structure in the wake. Besides, a runway, as a solid screen, can effect considerably onthe development of a wake flow.
Copyright© 2017 by Yu. M. Tsirkunov, M. A. Lobanova, A. I. Tsvetkov and B. A. Schepanyuk. Published by the EUCASSassociation with permission.
DOI: 10.13009/EUCASS2017-318

Yu. M. Tsirkunov, M. A. Lobanova, A. I. Tsvetkov, B. A. Schepanyuk
The present paper describes the results of computational simulation on developing the jet-vortex wake behinda running mid-range aircraft like Boeing 737 in the near wake flow field. Two different flap and spoiler positionscorresponding to takeoff and landing run conditions are considered. The engines were taken as running, and the gasvelocity, pressure and temperature at the exits of the exhaust nozzle and the bypass duct were obtained from preliminarythermodynamic calculations of the engine. The flow patterns, the vortex structure, the turbulence intensity, and theprofiles of vertical and horizontal velocity are presented and discussed. For validation of the computational model,special wind-tunnel test experiments and numerical simulation for the small-scaled aircraft model were carried out,and the vertical velocity profiles were compared.
2. Aircraft configuration
The configuration of an aircraft for computational investigation of the jet-vortex flow in the wake was taken close to themid-range airplane Boeing 737-300. The aircraft 3D geometrical model was designed using SolidWorks15. It includedall essential elements: a body (fuselage), wings with winglets, horizontal and vertical stabilizers, engine nacelles,nacelle pylons, inboard flap track fairings, Krueger flaps, slats, trailing-edge flaps, flight and ground spoilers. The bodylength was 32.2 m, wing span with winglets was 31.2 m, body height and width in the middle part were 4.01 m and3.76 m, respectively, wing dihedral was 6°, horizontal stabilizer span was 12.7 m, horizontal stabilizer dihedral was 7°,the angle between the root airfoil chord and the body centerline (setting angle) was +1°, the wing was geometricallytwisted, and the setting angle for wing tip was -0.8°. The horizontal stabilizer had no geometrical twisting and itssetting angle was -2°. Configuration and sizes of the engine were taken close to the turbofan engine CFM 56-3. Thelength of the engine nacelle was 4.0 m. The diameters of the annular exhaust duct and bypass duct outlets were 0.51 mand 0.76 m, and 1.04 m and 1.30 m, respectively.
Position of leading- and trailing-edge flaps and spoilers corresponded to two regimes: takeoff run and landingrun. In both cases Krueger flaps and all slats were fully extended. The trailing-edge flaps were deflected at the angleof 15 and 40 degrees for takeoff and landing run, respectively. Flight and ground spoilers were in full-up position(they were raised at the angle of 40 and 60 degrees, respectively) only for landing run mode. Coordinates of airfoils invarious wing cross-sections were taken from UIUC Airfoil Coordinates Database [16]. Aircraft sizes were taken fromavailable open information sources [17]. The aircraft configuration for landing run is shown in Fig. 1.
Figure 1: View of the aircraft model corresponding to the landing run conditions: leading- and trailing-edge flaps arefully extended, and flight and ground spoilers are fully raised.
3. Calculation domain, flow model and boundary conditions
Calculations were performed for two cases. At first, the flow over a small-scaled aircraft model was simulated numer-ically for experimental conditions in AT-11 wind tunnel, and the calculated and experimental vertical velocity profilesin the wake were compared to validate the flow model. Then a detail computational investigation of the near wakeflow structure was performed for the actual-size aircraft with flaps and spoilers position corresponding to the takeoffand landing run. Specific features of the calculation domain and boundary conditions for flow simulation in the windtunnel will be described in the next Section.
Here we describe the computational flow model used for the study of wake behind an actual-size aircraft. Thecalculation domain represented a rectangular parallelepiped (see Fig. 2) with 160.9 m length (5 body lengths), 46.7 mwidth (approx. a wing semi-span plus a body length), and 34.8 m height (approx. a body length). The forward point ofthe fuselage was located at the distance of 32.2 m (a body length) from the inflow boundary. Directions of coordinateaxes are shown in Fig. 2 (z-axis is pointed in the opposite direction to the free stream velocity vector). The flow overan aircraft was assumed to be symmetric relative to the aircraft vertical centerline plane. The origin of the coordinatesystem was located in the plane of symmetry at the distance of 28.9 m from the inlet boundary (3.3 m ahead of the
2
DOI: 10.13009/EUCASS2017-318
EFFECT OF FLAPS AND SPOILERS POSITION ON THE AIRCRAFT WAKE DURING TAKEOFF AND LANDING RUN
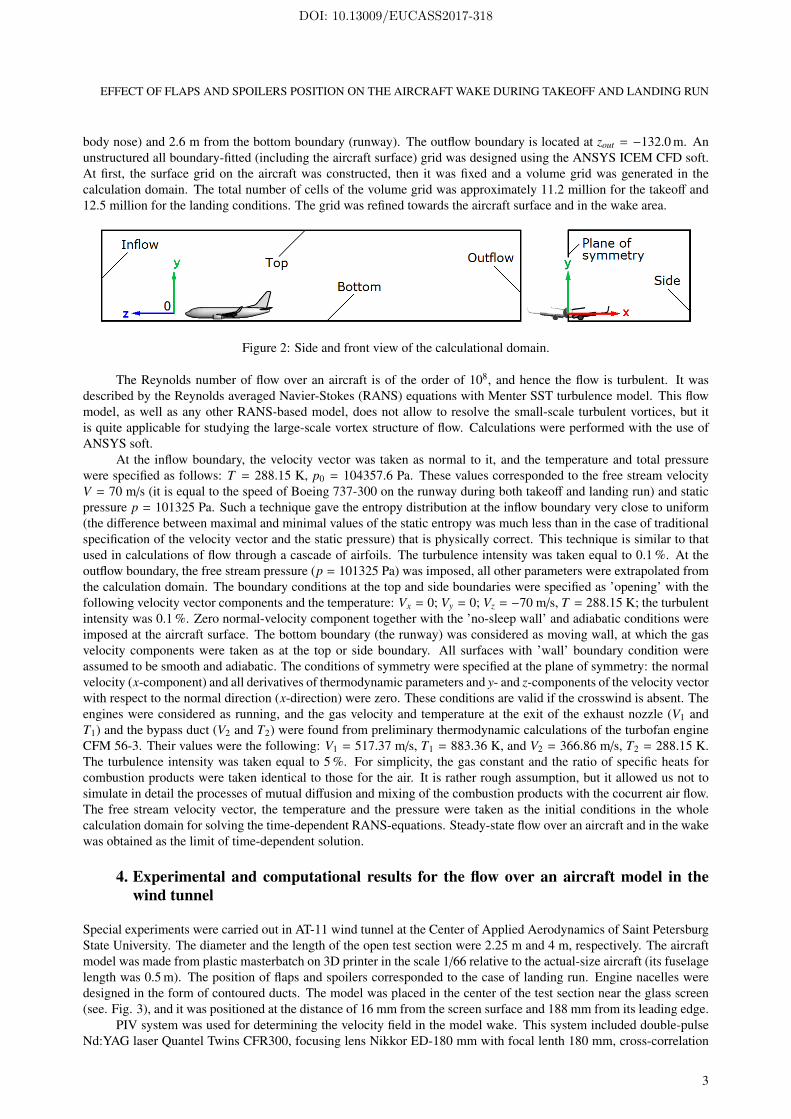
body nose) and 2.6 m from the bottom boundary (runway). The outflow boundary is located at zout = −132.0 m. Anunstructured all boundary-fitted (including the aircraft surface) grid was designed using the ANSYS ICEM CFD soft.At first, the surface grid on the aircraft was constructed, then it was fixed and a volume grid was generated in thecalculation domain. The total number of cells of the volume grid was approximately 11.2 million for the takeoff and12.5 million for the landing conditions. The grid was refined towards the aircraft surface and in the wake area.
Figure 2: Side and front view of the calculational domain.
The Reynolds number of flow over an aircraft is of the order of 108, and hence the flow is turbulent. It wasdescribed by the Reynolds averaged Navier-Stokes (RANS) equations with Menter SST turbulence model. This flowmodel, as well as any other RANS-based model, does not allow to resolve the small-scale turbulent vortices, but itis quite applicable for studying the large-scale vortex structure of flow. Calculations were performed with the use ofANSYS soft.
At the inflow boundary, the velocity vector was taken as normal to it, and the temperature and total pressurewere specified as follows: T = 288.15 K, p0 = 104357.6 Pa. These values corresponded to the free stream velocityV = 70 m/s (it is equal to the speed of Boeing 737-300 on the runway during both takeoff and landing run) and staticpressure p = 101325 Pa. Such a technique gave the entropy distribution at the inflow boundary very close to uniform(the difference between maximal and minimal values of the static entropy was much less than in the case of traditionalspecification of the velocity vector and the static pressure) that is physically correct. This technique is similar to thatused in calculations of flow through a cascade of airfoils. The turbulence intensity was taken equal to 0.1 %. At theoutflow boundary, the free stream pressure (p = 101325 Pa) was imposed, all other parameters were extrapolated fromthe calculation domain. The boundary conditions at the top and side boundaries were specified as ’opening’ with thefollowing velocity vector components and the temperature: Vx = 0; Vy = 0; Vz = −70 m/s, T = 288.15 K; the turbulentintensity was 0.1 %. Zero normal-velocity component together with the ’no-sleep wall’ and adiabatic conditions wereimposed at the aircraft surface. The bottom boundary (the runway) was considered as moving wall, at which the gasvelocity components were taken as at the top or side boundary. All surfaces with ’wall’ boundary condition wereassumed to be smooth and adiabatic. The conditions of symmetry were specified at the plane of symmetry: the normalvelocity (x-component) and all derivatives of thermodynamic parameters and y- and z-components of the velocity vectorwith respect to the normal direction (x-direction) were zero. These conditions are valid if the crosswind is absent. Theengines were considered as running, and the gas velocity and temperature at the exit of the exhaust nozzle (V1 andT1) and the bypass duct (V2 and T2) were found from preliminary thermodynamic calculations of the turbofan engineCFM 56-3. Their values were the following: V1 = 517.37 m/s, T1 = 883.36 K, and V2 = 366.86 m/s, T2 = 288.15 K.The turbulence intensity was taken equal to 5 %. For simplicity, the gas constant and the ratio of specific heats forcombustion products were taken identical to those for the air. It is rather rough assumption, but it allowed us not tosimulate in detail the processes of mutual diffusion and mixing of the combustion products with the cocurrent air flow.The free stream velocity vector, the temperature and the pressure were taken as the initial conditions in the wholecalculation domain for solving the time-dependent RANS-equations. Steady-state flow over an aircraft and in the wakewas obtained as the limit of time-dependent solution.
4. Experimental and computational results for the flow over an aircraft model in thewind tunnel
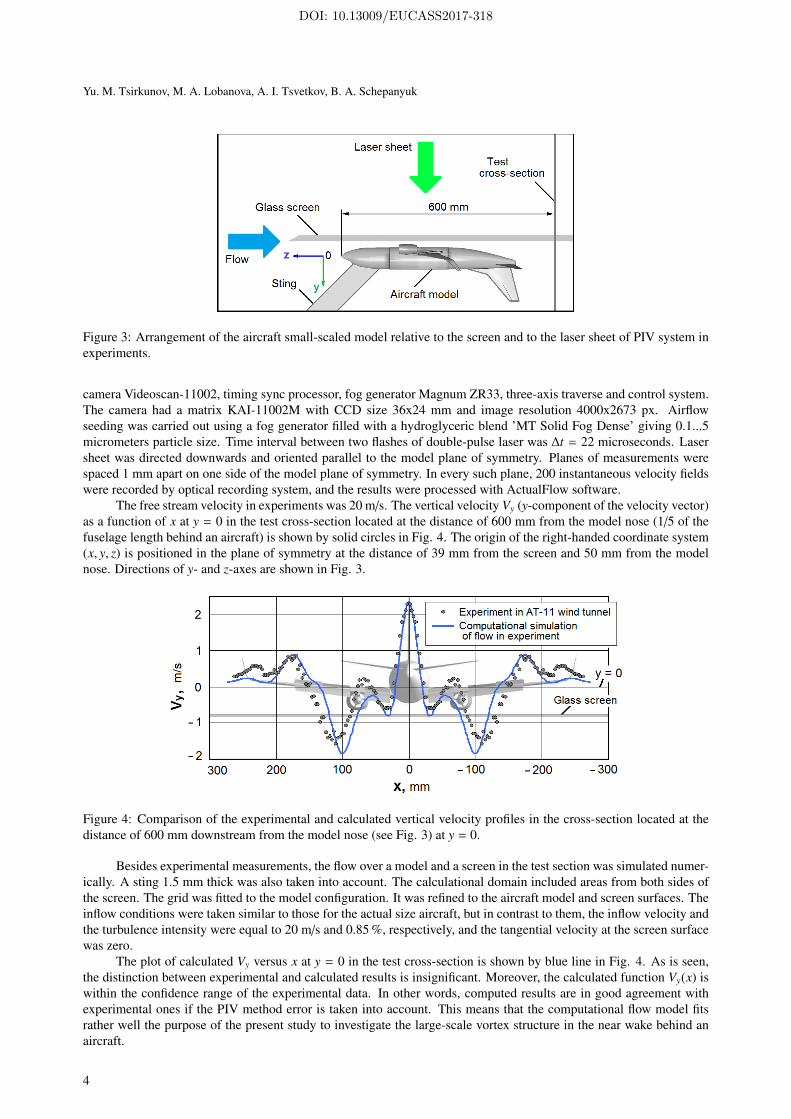
Special experiments were carried out in AT-11 wind tunnel at the Center of Applied Aerodynamics of Saint PetersburgState University. The diameter and the length of the open test section were 2.25 m and 4 m, respectively. The aircraftmodel was made from plastic masterbatch on 3D printer in the scale 1/66 relative to the actual-size aircraft (its fuselagelength was 0.5 m). The position of flaps and spoilers corresponded to the case of landing run. Engine nacelles weredesigned in the form of contoured ducts. The model was placed in the center of the test section near the glass screen(see. Fig. 3), and it was positioned at the distance of 16 mm from the screen surface and 188 mm from its leading edge.
PIV system was used for determining the velocity field in the model wake. This system included double-pulseNd:YAG laser Quantel Twins CFR300, focusing lens Nikkor ED-180 mm with focal lenth 180 mm, cross-correlation
3
DOI: 10.13009/EUCASS2017-318
Yu. M. Tsirkunov, M. A. Lobanova, A. I. Tsvetkov, B. A. Schepanyuk
Figure 3: Arrangement of the aircraft small-scaled model relative to the screen and to the laser sheet of PIV system inexperiments.
camera Videoscan-11002, timing sync processor, fog generator Magnum ZR33, three-axis traverse and control system.The camera had a matrix KAI-11002M with CCD size 36x24 mm and image resolution 4000x2673 px. Airflowseeding was carried out using a fog generator filled with a hydroglyceric blend ’MT Solid Fog Dense’ giving 0.1...5micrometers particle size. Time interval between two flashes of double-pulse laser was ∆t = 22 microseconds. Lasersheet was directed downwards and oriented parallel to the model plane of symmetry. Planes of measurements werespaced 1 mm apart on one side of the model plane of symmetry. In every such plane, 200 instantaneous velocity fieldswere recorded by optical recording system, and the results were processed with ActualFlow software.
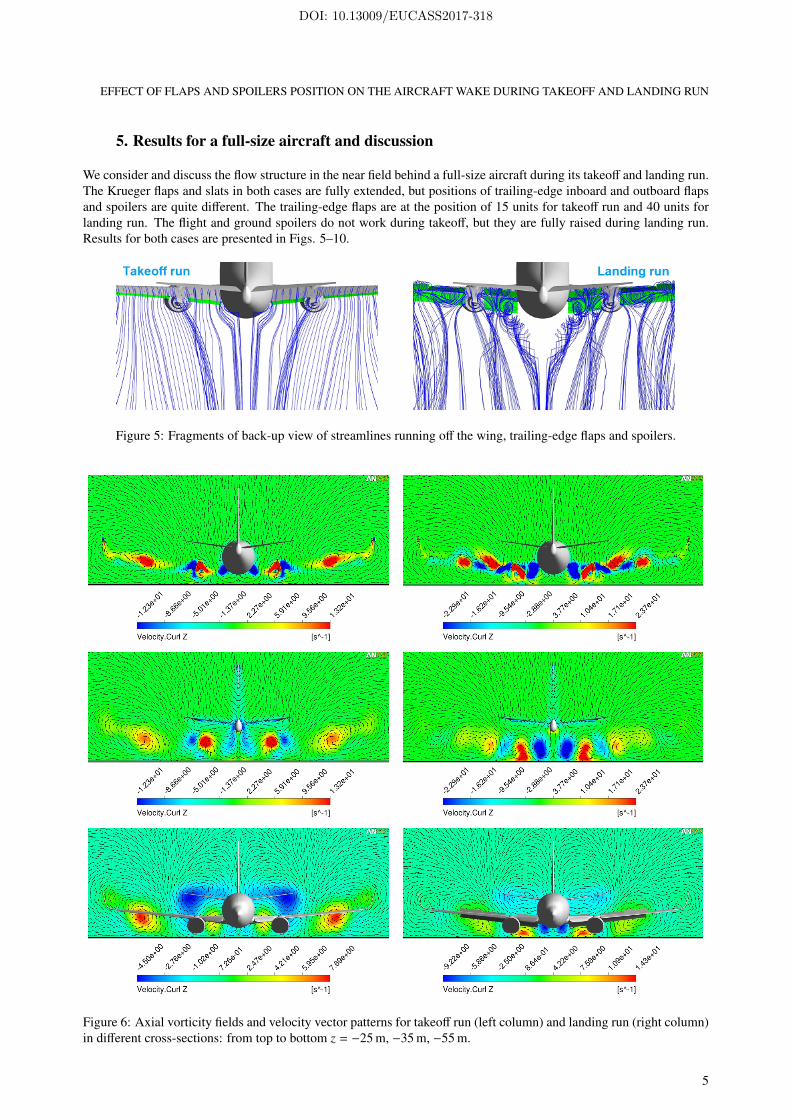
The free stream velocity in experiments was 20 m/s. The vertical velocity Vy (y-component of the velocity vector)as a function of x at y = 0 in the test cross-section located at the distance of 600 mm from the model nose (1/5 of thefuselage length behind an aircraft) is shown by solid circles in Fig. 4. The origin of the right-handed coordinate system(x, y, z) is positioned in the plane of symmetry at the distance of 39 mm from the screen and 50 mm from the modelnose. Directions of y- and z-axes are shown in Fig. 3.
Figure 4: Comparison of the experimental and calculated vertical velocity profiles in the cross-section located at thedistance of 600 mm downstream from the model nose (see Fig. 3) at y = 0.
Besides experimental measurements, the flow over a model and a screen in the test section was simulated numer-ically. A sting 1.5 mm thick was also taken into account. The calculational domain included areas from both sides ofthe screen. The grid was fitted to the model configuration. It was refined to the aircraft model and screen surfaces. Theinflow conditions were taken similar to those for the actual size aircraft, but in contrast to them, the inflow velocity andthe turbulence intensity were equal to 20 m/s and 0.85 %, respectively, and the tangential velocity at the screen surfacewas zero.
The plot of calculated Vy versus x at y = 0 in the test cross-section is shown by blue line in Fig. 4. As is seen,the distinction between experimental and calculated results is insignificant. Moreover, the calculated function Vy(x) iswithin the confidence range of the experimental data. In other words, computed results are in good agreement withexperimental ones if the PIV method error is taken into account. This means that the computational flow model fitsrather well the purpose of the present study to investigate the large-scale vortex structure in the near wake behind anaircraft.
4
DOI: 10.13009/EUCASS2017-318
EFFECT OF FLAPS AND SPOILERS POSITION ON THE AIRCRAFT WAKE DURING TAKEOFF AND LANDING RUN
5. Results for a full-size aircraft and discussion
We consider and discuss the flow structure in the near field behind a full-size aircraft during its takeoff and landing run.The Krueger flaps and slats in both cases are fully extended, but positions of trailing-edge inboard and outboard flapsand spoilers are quite different. The trailing-edge flaps are at the position of 15 units for takeoff run and 40 units forlanding run. The flight and ground spoilers do not work during takeoff, but they are fully raised during landing run.Results for both cases are presented in Figs. 5–10.
Figure 5: Fragments of back-up view of streamlines running off the wing, trailing-edge flaps and spoilers.
Figure 6: Axial vorticity fields and velocity vector patterns for takeoff run (left column) and landing run (right column)in different cross-sections: from top to bottom z = −25 m, −35 m, −55 m.
5
DOI: 10.13009/EUCASS2017-318
Yu. M. Tsirkunov, M. A. Lobanova, A. I. Tsvetkov, B. A. Schepanyuk
Patterns of streamlines (Fig. 5) demonstrate that the wake flow behind an aircraft during landing run is disturbedmuch higher than in the case of takeoff run. This is also evidenced by fields of axial vorticity (z-component of the vectorCurl V) and corresponding to them kinematic patterns (Fig. 6). Arrows show the direction of circulation flow. Scales ofthe axial vorticity under every picture applies only to its one half (containing the left part of the aircraft wing): to the lefthalf for z = −25 m and −35 m, and to the right half for z = −55 m. Another half of every picture is obtained by mirrorreflection, and it can be interpreted as the vorticity with the opposite sign. The aircraft image is given to indicate thevortices location relative to the wing. Right behind the wing (z = −25 m), the flow vorticity structure for both takeoffand landing run is rather complex: at least six axial vortices with opposite direction of rotation can be distinguishedon each side of the vertical centerline plane. These vortices interact with each other downstream that results in theirdiffusion and merging, and already at the distance of approximately 1/2 of the fuselage length (z = −55 m) from theaircraft the kinematic pattern in each case differs qualitatively from that for z = −25 m. The scales of the axial vorticityat z = −55 m are local, and, as is seen, the range of the axial vorticity for landing run is twice wider than for takeoffrun.
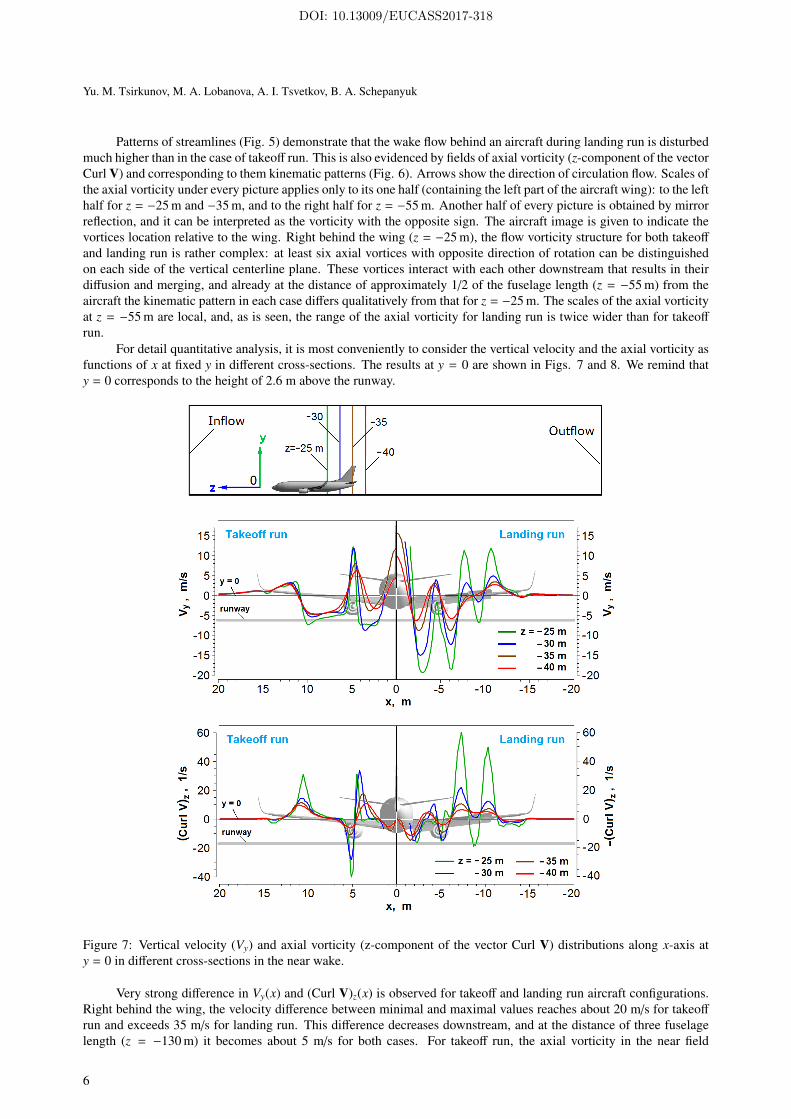
For detail quantitative analysis, it is most conveniently to consider the vertical velocity and the axial vorticity asfunctions of x at fixed y in different cross-sections. The results at y = 0 are shown in Figs. 7 and 8. We remind thaty = 0 corresponds to the height of 2.6 m above the runway.
Figure 7: Vertical velocity (Vy) and axial vorticity (z-component of the vector Curl V) distributions along x-axis aty = 0 in different cross-sections in the near wake.
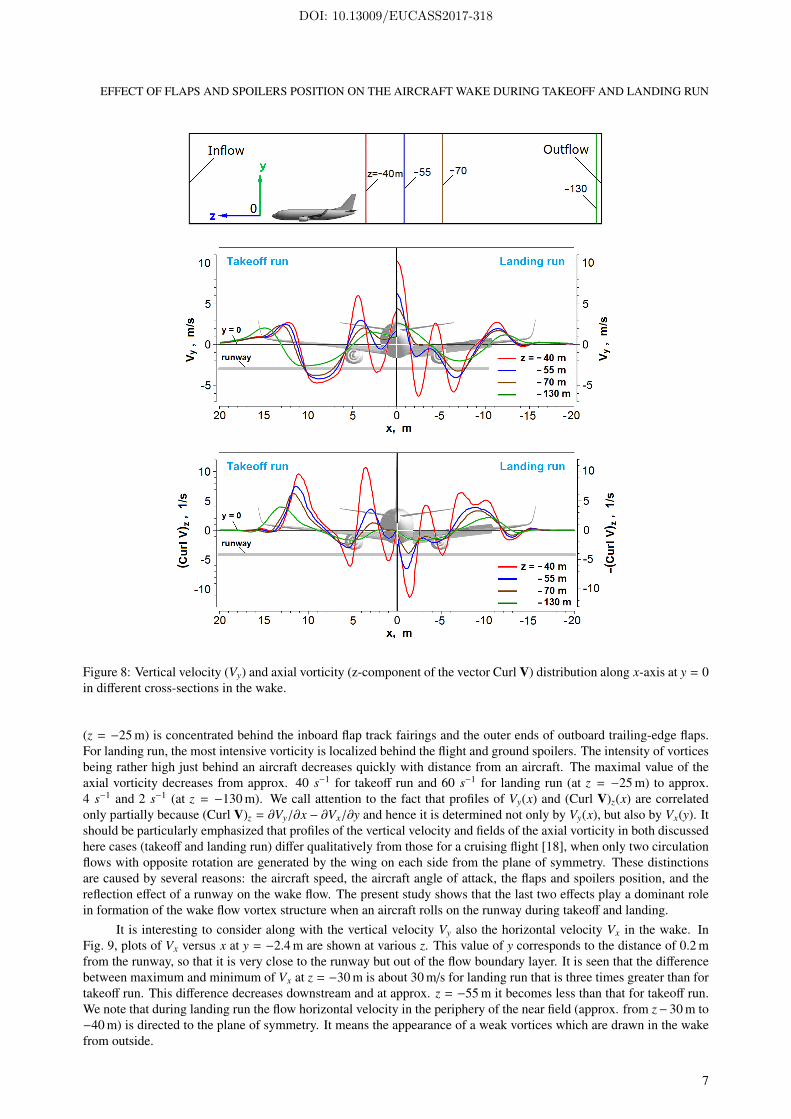
Very strong difference in Vy(x) and (Curl V)z(x) is observed for takeoff and landing run aircraft configurations.Right behind the wing, the velocity difference between minimal and maximal values reaches about 20 m/s for takeoffrun and exceeds 35 m/s for landing run. This difference decreases downstream, and at the distance of three fuselagelength (z = −130 m) it becomes about 5 m/s for both cases. For takeoff run, the axial vorticity in the near field
6
DOI: 10.13009/EUCASS2017-318
EFFECT OF FLAPS AND SPOILERS POSITION ON THE AIRCRAFT WAKE DURING TAKEOFF AND LANDING RUN
Figure 8: Vertical velocity (Vy) and axial vorticity (z-component of the vector Curl V) distribution along x-axis at y = 0in different cross-sections in the wake.
(z = −25 m) is concentrated behind the inboard flap track fairings and the outer ends of outboard trailing-edge flaps.For landing run, the most intensive vorticity is localized behind the flight and ground spoilers. The intensity of vorticesbeing rather high just behind an aircraft decreases quickly with distance from an aircraft. The maximal value of theaxial vorticity decreases from approx. 40 s−1 for takeoff run and 60 s−1 for landing run (at z = −25 m) to approx.4 s−1 and 2 s−1 (at z = −130 m). We call attention to the fact that profiles of Vy(x) and (Curl V)z(x) are correlatedonly partially because (Curl V)z = ∂Vy/∂x − ∂Vx/∂y and hence it is determined not only by Vy(x), but also by Vx(y). Itshould be particularly emphasized that profiles of the vertical velocity and fields of the axial vorticity in both discussedhere cases (takeoff and landing run) differ qualitatively from those for a cruising flight [18], when only two circulationflows with opposite rotation are generated by the wing on each side from the plane of symmetry. These distinctionsare caused by several reasons: the aircraft speed, the aircraft angle of attack, the flaps and spoilers position, and thereflection effect of a runway on the wake flow. The present study shows that the last two effects play a dominant rolein formation of the wake flow vortex structure when an aircraft rolls on the runway during takeoff and landing.
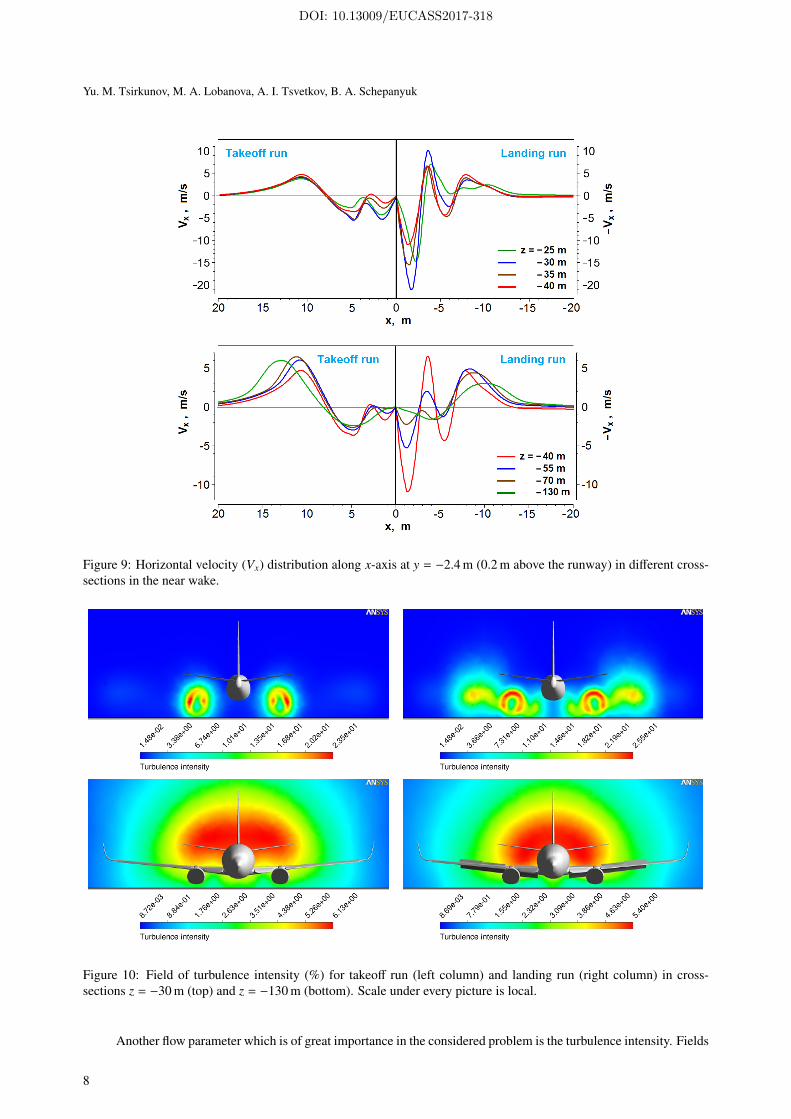
It is interesting to consider along with the vertical velocity Vy also the horizontal velocity Vx in the wake. InFig. 9, plots of Vx versus x at y = −2.4 m are shown at various z. This value of y corresponds to the distance of 0.2 mfrom the runway, so that it is very close to the runway but out of the flow boundary layer. It is seen that the differencebetween maximum and minimum of Vx at z = −30 m is about 30 m/s for landing run that is three times greater than fortakeoff run. This difference decreases downstream and at approx. z = −55 m it becomes less than that for takeoff run.We note that during landing run the flow horizontal velocity in the periphery of the near field (approx. from z− 30 m to−40 m) is directed to the plane of symmetry. It means the appearance of a weak vortices which are drawn in the wakefrom outside.
7
DOI: 10.13009/EUCASS2017-318
Yu. M. Tsirkunov, M. A. Lobanova, A. I. Tsvetkov, B. A. Schepanyuk
Figure 9: Horizontal velocity (Vx) distribution along x-axis at y = −2.4 m (0.2 m above the runway) in different cross-sections in the near wake.
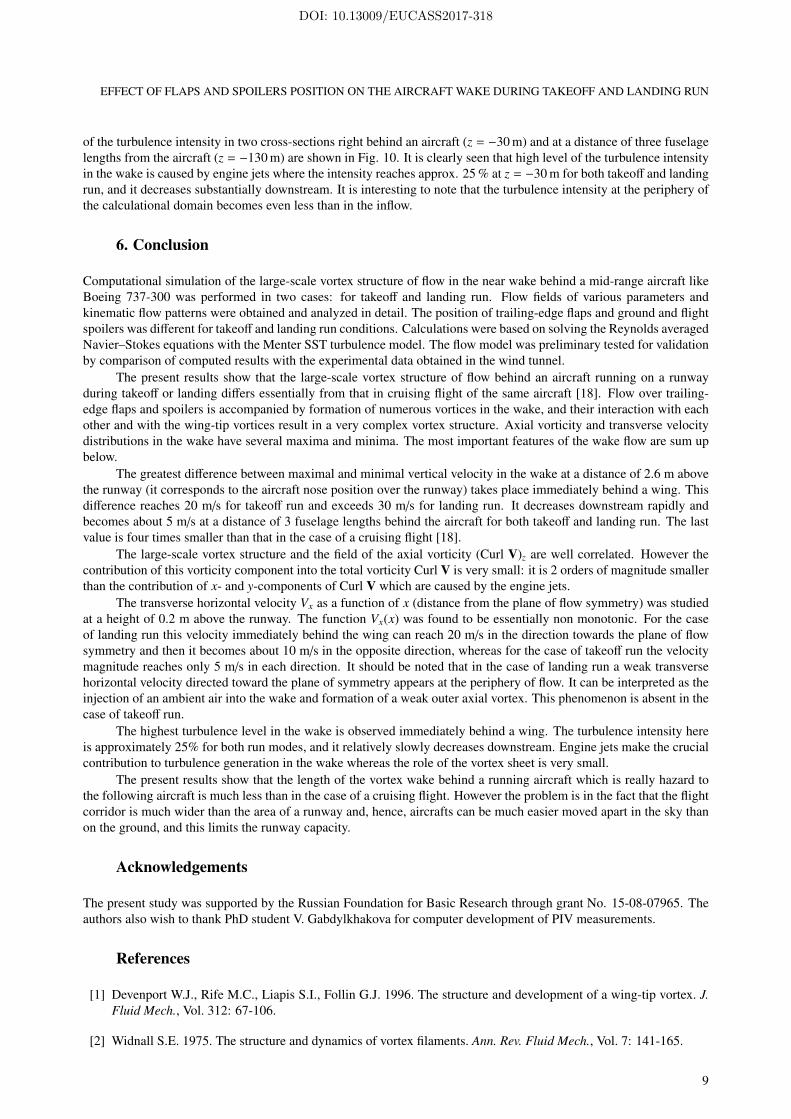
Figure 10: Field of turbulence intensity (%) for takeoff run (left column) and landing run (right column) in cross-sections z = −30 m (top) and z = −130 m (bottom). Scale under every picture is local.
Another flow parameter which is of great importance in the considered problem is the turbulence intensity. Fields
8
DOI: 10.13009/EUCASS2017-318
EFFECT OF FLAPS AND SPOILERS POSITION ON THE AIRCRAFT WAKE DURING TAKEOFF AND LANDING RUN
of the turbulence intensity in two cross-sections right behind an aircraft (z = −30 m) and at a distance of three fuselagelengths from the aircraft (z = −130 m) are shown in Fig. 10. It is clearly seen that high level of the turbulence intensityin the wake is caused by engine jets where the intensity reaches approx. 25 % at z = −30 m for both takeoff and landingrun, and it decreases substantially downstream. It is interesting to note that the turbulence intensity at the periphery ofthe calculational domain becomes even less than in the inflow.
6. Conclusion
Computational simulation of the large-scale vortex structure of flow in the near wake behind a mid-range aircraft likeBoeing 737-300 was performed in two cases: for takeoff and landing run. Flow fields of various parameters andkinematic flow patterns were obtained and analyzed in detail. The position of trailing-edge flaps and ground and flightspoilers was different for takeoff and landing run conditions. Calculations were based on solving the Reynolds averagedNavier–Stokes equations with the Menter SST turbulence model. The flow model was preliminary tested for validationby comparison of computed results with the experimental data obtained in the wind tunnel.
The present results show that the large-scale vortex structure of flow behind an aircraft running on a runwayduring takeoff or landing differs essentially from that in cruising flight of the same aircraft [18]. Flow over trailing-edge flaps and spoilers is accompanied by formation of numerous vortices in the wake, and their interaction with eachother and with the wing-tip vortices result in a very complex vortex structure. Axial vorticity and transverse velocitydistributions in the wake have several maxima and minima. The most important features of the wake flow are sum upbelow.
The greatest difference between maximal and minimal vertical velocity in the wake at a distance of 2.6 m abovethe runway (it corresponds to the aircraft nose position over the runway) takes place immediately behind a wing. Thisdifference reaches 20 m/s for takeoff run and exceeds 30 m/s for landing run. It decreases downstream rapidly andbecomes about 5 m/s at a distance of 3 fuselage lengths behind the aircraft for both takeoff and landing run. The lastvalue is four times smaller than that in the case of a cruising flight [18].
The large-scale vortex structure and the field of the axial vorticity (Curl V)z are well correlated. However thecontribution of this vorticity component into the total vorticity Curl V is very small: it is 2 orders of magnitude smallerthan the contribution of x- and y-components of Curl V which are caused by the engine jets.
The transverse horizontal velocity Vx as a function of x (distance from the plane of flow symmetry) was studiedat a height of 0.2 m above the runway. The function Vx(x) was found to be essentially non monotonic. For the caseof landing run this velocity immediately behind the wing can reach 20 m/s in the direction towards the plane of flowsymmetry and then it becomes about 10 m/s in the opposite direction, whereas for the case of takeoff run the velocitymagnitude reaches only 5 m/s in each direction. It should be noted that in the case of landing run a weak transversehorizontal velocity directed toward the plane of symmetry appears at the periphery of flow. It can be interpreted as theinjection of an ambient air into the wake and formation of a weak outer axial vortex. This phenomenon is absent in thecase of takeoff run.
The highest turbulence level in the wake is observed immediately behind a wing. The turbulence intensity hereis approximately 25% for both run modes, and it relatively slowly decreases downstream. Engine jets make the crucialcontribution to turbulence generation in the wake whereas the role of the vortex sheet is very small.
The present results show that the length of the vortex wake behind a running aircraft which is really hazard tothe following aircraft is much less than in the case of a cruising flight. However the problem is in the fact that the flightcorridor is much wider than the area of a runway and, hence, aircrafts can be much easier moved apart in the sky thanon the ground, and this limits the runway capacity.
Acknowledgements
The present study was supported by the Russian Foundation for Basic Research through grant No. 15-08-07965. Theauthors also wish to thank PhD student V. Gabdylkhakova for computer development of PIV measurements.
References
[1] Devenport W.J., Rife M.C., Liapis S.I., Follin G.J. 1996. The structure and development of a wing-tip vortex. J.Fluid Mech., Vol. 312: 67-106.
[2] Widnall S.E. 1975. The structure and dynamics of vortex filaments. Ann. Rev. Fluid Mech., Vol. 7: 141-165.
9
DOI: 10.13009/EUCASS2017-318
Yu. M. Tsirkunov, M. A. Lobanova, A. I. Tsvetkov, B. A. Schepanyuk
[3] Devenport W.J., Vogel C.M., Zsoldos J.S. 1999. Flow structure produced by the interaction and merger of a pairof co-rotating wing-tip vortices. J. Fluid Mech., Vol. 394: 357-377.
[4] Stumpf E., Rudnik R., Ronzheimer A. 2000. Euler computation of the near-field wake vortex of an aircraft intake-off configuration. Aerosp. Sci. Technol., Vol. 4: 535-543.
[5] Robins R.E., Delisif D.R. 1997. Numerical simulations of three-dimensional trailing vortex evolution. AIAA Jour-nal, Vol. 35, No. 9: 1552-1555.
[6] Zheng Z.C., Ashf R.L. 1996. Study of aircraft wake vortex behavior near the ground. AIAA Journal, Vol. 34, No.3: 580-589.
[7] Corjon A., Poinsot T. 1997. Behavior of wake vortices near ground. AIAA Journal, Vol. 35, No. 5: 849-855.
[8] Paoli R., Helie J., Poinsot T. 2004. Contrail formation in aircraft wakes. J. Fluid Mech., Vol. 503: 361-373.
[9] Spalart P.R. 1998. Airplane trailing vortices. Ann. Rev. Fluid Mech., Vol. 30: 107-138.
[10] Rossow V.J. 1999. Lift-generated vortex wakes of subsonic transport aircraft. Progress in Aerospace Sciences,Vol. 35: 507-660.
[11] Gerz T., Holzapfel F, Darracq D. 2002. Commercial aircraft wake vortices. Progress in Aerospace Sciences, Vol.38: 181-208.
[12] Breitsamter C. 2011. Wake vortex characteristics of transport aircraft. Progress in Aerospace Sciences, Vol. 47:89-134.
[13] Chernyshev S.L., Gaifullin A.M., Sviridenko Yu.N. 2014. Civil aircraft vortex wake. TsAGI’s research activities.Progress in Aerospace Sciences, Vol. 71: 150-166.
[14] < http://www.wakenet.eu >.
[15] Stephan A., Holzapfel F., Misaka T. 2014. Simulation of aircraft wake vortices during landing with decay en-hancing obstacles. Proc. of 29th Congress of the Int. Council of the Aeronautical Sciences (ICAS 2014), PaperNo. 0796.
[16] http://www.ae.illinois.edu/m-selig/ads/coord database.html
[17] http://www.b737.org.uk/
[18] Lobanova M.A., Tsirkunov Yu.M. 2012. Numerical simulation of a jet-vortex wake behind a cruise aircraft.ECCOMAS 2012 – European Congress on Computational Methods in Applied Sciences and Engineering, e-BookFull Papers: 6909-6922.
10
DOI: 10.13009/EUCASS2017-318