Eastern Tropical and Temperate Pacific Ocean - Ecologically ...

ORIGINAL PAPER
Demography of the upward-shifting temperate woody speciesof the Rhododendron pseudochrysanthum complexand ecologically relevant adaptive divergence in its trailingedge populations
Chia-Ying Chen & Bo-Kai Liang & Jeng-Der Chung & Chung-Te Chang &
Yi-Chiang Hsieh & Teng-Chiu Lin & Shih-Ying Hwang
Received: 20 August 2012 /Revised: 22 August 2013 /Accepted: 24 September 2013 /Published online: 5 October 2013# Springer-Verlag Berlin Heidelberg 2013
Abstract Trailing edge populations of upward migrating spe-cies induced by postglacial climatic warming can be evolu-tionarily significant in the face of global warming. We testedfor population size changes between lower- and higher-elevation populations located in the same mountainous re-gions of the upward-shifting temperate woody species of theRhododendron pseudochrysanthum complex in Taiwan. Wealso tested whether natural selection evoked adaptive diver-gence in trailing edge populations of this species complex.Wegenotyped 26 expressed sequence tag-simple sequence repeat(EST-SSR) loci of 185 individuals from nine populations of theR. pseudochrysanthum complex including Rhododendronrubropunctatum , Rhododendron hyperythrum , Rhododendronmorii , and R. pseudochrysanthum . R. rubropunctatum popu-lations in the R. pseudochrysanthum complex possessed thelowest estimates of genetic diversity and effective populationsize. Higher-elevation R. pseudochrysanthum populations hadlower effective population sizes than lower-elevation R. morii
populations in Hohuanshan and Tahsueshan, as revealed byestimates using both MIGRATE-N and approximate Bayesiancomputation (ABC). R. rubropunctatum populations divergedsignificantly from populations of other members of the R.pseudochrysanthum complex. An outlier potentially underpositive selection specific to R. rubropunctatum populationswas identified and strongly associated with ecologically rele-vant environmental variables. Postglacial climatic warminghas a significant influence on population isolation in the R.pseudochrysanthum complex. The results indicate adaptive evo-lution in the trailing edge populations, i.e., R. rubropunctatumpopulations of the upward shifting R. pseudochrysanthumcomplex.
Keywords Climate warming . Population isolation .
Rhododendron . Taiwan . Trailing edge population . Upwardrange shift
Introduction
Upward shifts in species distribution are common in responseto postglacial climatic warming (Lenoir et al. 2008). However,the ability to migrate upwards may be limited by increasinglyharsh environmental conditions (Köner 2007). When speciesmove upward in elevation, reductions in habitat area andeffective population size can occur, resulting in the loss ofrare, high-elevation species (Dirnböck et al. 2011). A discon-tinuous population distribution along elevation gradientscan influence the level of genetic diversity within and amongpopulations associated with climate change (Ohsawa andIde 2008). Biogeographical range shifts induced by upward
Communicated by P. Ingvarsson
Chen and Liang contributed equally to this work.
Electronic supplementary material The online version of this article(doi:10.1007/s11295-013-0669-x) contains supplementary material,which is available to authorized users.
C.<Y. Chen :B.<K. Liang :C.<T. Chang :Y.<C. Hsieh : T.<C. Lin :S.<Y. Hwang (*)Department of Life Science, National Taiwan Normal University, 88Tingchow Road, Section 4, Taipei 11677, Taiwan, Republic of Chinae-mail: [email protected]
J.<D. ChungDivision of Silviculture, Taiwan Forestry Research Institute, 53Nanhai Road, Taipei 10066, Taiwan, Republic of China
Tree Genetics & Genomes (2014) 10:111–126DOI 10.1007/s11295-013-0669-x

migration can promote evolution, particularly at the leadingand trailing edges of a species’ range (Thuiller et al. 2008).Current genetic differentiation and diversity within speciesmay have been affected by long-term habitat isolation, whichcan promote local adaptation and eventually lead to speciation(Schluter 2000; Gavrilets and Vose 2007). The level of geneticvariation plays a key role in maintaining a population that isrobust to future environmental changes, thereby reducing theprobability of extinction (Booy et al. 2000).
Based on a palynological study of a lake core at an elevationof 745.5 m in central Taiwan, cold-temperate species may havedominated lowland vegetation because temperatures were 8.0to 11.0 °C cooler than today during the last glacial maximum(LGM; Tsukada 1966). Plant species, woody plants, in partic-ular, decrease in population sizes with narrow vertical distribu-tions after the LGM due to elevated temperature and cannotcompete with rapidly growing subtropical forest species thatcan inhabit broader altitudinal and ecological ranges in thelowland forests (Jump et al. 2009). A 1,500 to 1,600 m upwardmigration of forests occurring in Taiwan after the LGM hasbeen reported (Liew and Chung 2001). Moreover, Jump et al.(2012) found a rapid upward migration of ca. 3.6 m yr-1 ofmountain plants during the last century in Taiwan. Althoughnumerous species and genera continued to grow at the samelatitude, suitable habitats would have been reduced when forestspecies distributions shifted upward to a different range ofelevations in response to postglacial climatic warming(Tsukada 1966; Liew and Chung 2001). Moreover, accordingto an altitude-for-latitude model for the range retractions ofwoody species, a temperature increase of 1 °C is equivalentto range retractions of approximately 167 m in altitude andapproximately 145 km in latitude (Jump et al. 2009). Theinfluence of postglacial climatic warming on range retractionsin Taiwan may be substantial for island-endemic temperatewoody species (Tsukada 1966; Liew and Chung 2001), be-cause Taiwan covers only a narrow latitudinal range of 385 km.
Rhododendron hyperythrum Hay., Rhododendron moriiHay., Rhododendron pseudochrysanthum Hay., andRhododendron rubropunctatum Hay. are recognized as theR. pseudochrysanthum species complex because of their sub-stantial morphological similarities (Li et al. 1998). Molecularphylogenetic analyses also revealed close genetic relationshipsamong species of the R. pseudochrysanthum complex (Chunget al. 2007; Huang et al. 2011). R. morii and R. pseu-dochrysanthum populations of the R. pseudochrysanthumcomplex are presently distributed in mountain ranges at eleva-tions of 2400 to 3950 m, with R. morii distributed lower andR. pseudochrysanthum distributed higher (Li et al. 1998).Populations of these two species in the R. pseudochrysanthumcomplex typically overlap at elevations of approximately 3,000min mountains such as at Hohuanshan and Tahsueshan. TheR. pseudochrysanthum populations of theR. pseudochrysanthumcomplex grow on exposed gravelly slopes at the periphery of
cold-temperate coniferous forests above 3,000 m. The R.morii populations of the R. pseudochrysanthum complexgrow on exposed gravelly slopes at the periphery of warm-temperate evergreen broadleaf forests at elevations of 2,400to 3,000 m. The R. hyperythrum population of the R.pseudochrysanthum complex is only found on the peak ofNanhutashan, dominating the alpine tundra at an elevation of3,500 m. Only a few remnant R. rubropunctatum populationsof the R. pseudochrysanthum complex have been found insubtropical broadleaf woody forests on the northern tip ofTaiwan at elevations of 600 to 1,200 m (Li et al. 1998).
A previous study using chloroplast DNA (cpDNA) se-quence data (Chung et al. 2007) inferred that populations ofthe R. pseudochrysanthum complex experienced north-to-south expansion at middle elevations during the LGM. Thiswas based on significantly negative values of demographicneutrality test statistics, a star-like phylogeny, and the directionof cpDNA haplotype derivations from R. rubropunctatum(northern Taiwan) to other members (central and southernTaiwan) of the R. pseudochrysanthum complex. Moreover,nested clade analysis revealed population isolation with re-stricted gene flow within this complex. Therefore, a once-widespread distribution of theR. pseudochrysanthum complexat middle elevations followed by range contractions into highelevations or reduced habitat areas was suggested (Chung et al.2007) and led to genetic isolation among populations of the R.pseudochrysanthum complex (Chung et al. 2007; Huang et al.2011). Postglacial climatic warmingmay have caused the cold-adapted Rhododendron species in the R. pseudochrysanthumcomplex to shift upwards into a greatly confined space, subse-quently reducing effective population sizes. The postglacialupward migrations of R. hyperythrum , R. morii , and R.pseudochrysanthum populations of theR. pseudochrysanthumcomplex are verified by their recolonizations on high peaksof various mountainous areas. The persistence of R. rubro-punctatum populations in low-elevation habitats can be con-sidered the trailing edge populations of the R. pseudo-chrysanthum complex shifting up in elevation after theLGM. Therefore, populations of the R. pseudochrysanthumcomplex provide an opportunity to characterize the contempo-rary population isolation and adaptive divergence of islandendemic temperate woody species in response to postglacialclimatic warming.
This study collected multilocus genotypic data of 26expressed sequence tag-simple sequence repeat (EST-SSR)markers from 185 individuals of nine populations of the R.pseudochrysanthum complex. We estimated the level of genet-ic diversity, population structure, and recent population bottle-necks in natural populations of the R. pseudochrysanthumcomplex. We tested whether postglacial climatic warmingcaused upward migration and population size change by com-paring lower- and higher-elevation populations of the R.pseudochrysanthum complex located in the same mountainous
112 Tree Genetics & Genomes (2014) 10:111–126

regions. Genome scan approaches were used to test foroutliers potentially under selection in populations of the R.pseudochrysanthum complex. We also applied a logistic re-gression method to test for associations between genetic dataand environmental variables indicative of ecologically relevantlocal adaptation.
Materials and methods
Sampling and genotyping
Genomic DNA was extracted from the leaves (Doyle andDoyle 1987) of 185 individuals from nine populations of theR. pseudochrysanthum complex including one population(n =45) of R. hyperythrum, three populations (n =43) of R.morii , three populations (n =60) of R. pseudochrysanthum ,and two populations (n =37) of R. rubropunctatum (Table 1,Fig. 1). Samples were collected at a distance of 2.5 m at leastto avoid collecting clonemates. SSRs were identified in 1,245ESTs generated from R. catawbiense in the NCBI databasecontaining di-, tri-, tetra-, and penta-nucleotide repeats usingSSRIT (http://www.gramene.org/db/markers/ssrtool), andthen SSR primers were designed using Primer 3 (http://frodo.wi.mit.edu/primer3/input.htm). All samples weregenotyped at 26 EST-SSR loci (Electronic supplementarymaterial, Table S1). Polymerase chain reaction (PCR) wasperformed in a 10-μl reaction volume containing 20 ng tem-plate DNA, 75mMTris–HCl (pH 8.8), 20 mM (NH4)2SO4, 0.01 % (v/v) Tween 20, 2.5 mMMgCl2, 0.2 mM dNTP mix, 75nM of each primer, 0.8 μg bovine serum albumin, and 0.5 UTaq DNA polymerase. We conducted the PCR with the fol-lowing process: 94 °C for 10 min, followed by 38 cycles at94 °C for 30 s, 30 s at the optimal annealing temperatures(Electronic supplementary material, Table S1), and 30 s at72 °C, with a final extension of 5 min at 72 °C. AmplifiedPCR products were run on MegaBACE 1000, and allele sizeswere scored using Genetic Profiler software.
Genetic diversity
Possible genotyping errors (i.e., stuttering, large allele drop-outs and null alleles) were evaluated using MICRO-CHECKER v2.2.1 (Van Oosterhout et al. 2004) with 1,000randomizations, and errors were corrected. Deviation from theHardy–Weinberg equilibrium (HWE) was tested using a mod-ified Fisher’s exact test for each population at every locus(Guo and Thompson 1992), based on 9×10⁵ Markov chainiterations with GENEPOP v4.0.10 (Raymond and Rouset1995). A total of 234 locus-by-population combinations ofHWE test were performed. GENEPOP was further used toestimate pairwise locus linkage disequilibrium (LD) based onthe permuted distribution of likelihood ratio statistics. The
Bonferroni correction was used for multiple comparisons.Allelic richness (AR) was estimated, accounting for differ-ences in sample-sizes, using the rarefaction procedure(Hurlbert 1971) for the smallest sample size (16 genes) asimplemented in HP-RARE v1.0 (Kalinowski 2005). Thenumber of alleles (AT), number of private alleles (AP), percentpolymorphisms (P), and observed (HO) and expected (HE)heterozygosity were analysed using MSA v4.05 (Dieringerand Schlötterer 2003). Inbreeding coefficient (F IS) was calcu-lated based on neutral loci (excluding outliers, see the“Results” section) using FSTAT v2.9.3 (Goudet 2001).
Identification of outliers based on FST-based neutrality tests
Various FST-based neutrality tests were developed to identifyloci potentially under selection using genetic data (Holdereggeret al. 2008). These methods perform coalescent simulations togenerate a null distribution of FST under neutral expectations.Loci that do not fit the neutral drift simulations because ofunusually high or low FST values are identified as outlierspotentially under positive or balancing selection, respectively.Four FST-based tests were used to identify outlier loci todetermine whether adaptive divergence had occurred in theinvestigated populations.
At first, we employed the global population comparisonmethods of FDIST2, BAYESFST, and hierarchical islandmodel test (HT) to identify outliers (Beaumont and Nichols1996; Beaumont and Balding 2004; Excoffier et al. 2009). InFDIST2, FSTwas calculated for each sampled locus based onan infinite island model. The expected neutral distribution ofFST conditioned on heterozygosity of each locus was gener-ated by 1×10⁵ iterations of coalescent simulation (Beaumontand Nichols 1996; Beaumont and Balding 2004). The P-valuefor each locus was calculated at a 95 % confidence level. Lociwith unusually high or low FST values conditioned on hetero-zygosity were recognized as outliers potentially under positiveor balancing selection, respectively. BAYESFST, which dif-fers from FDIST2 by assuming unequal FST among the studypopulations, was also employed. With this method, FST wasmodeled as log(Fij/1-Fij)=α i+β j+γ ij, where α i is a locuseffect, β j is a population effect and γ ij is a locus-by-population effect (Beaumont and Balding 2004). Locus effectwas used to examine potential outliers based on 2,000 samplesof Markov chain Monte Carlo (MCMC) simulations extractedfrom the resulting posterior probability distributions. A locuswas considered to be under positive selection if its locus effect2.5 % quantile was positive and under balancing selection ifits locus effect 97.5 % quantile was negative. Three indepen-dent runswith different parameter values were performed untilconvergence. The HT was further applied to identify outliersusing a method similar to that of FDIST2 (Beaumont andNichols 1996) implemented in ARLEQUIN v3.5 (Excoffierand Lischer 2010). However, HT considers population
Tree Genetics & Genomes (2014) 10:111–126 113
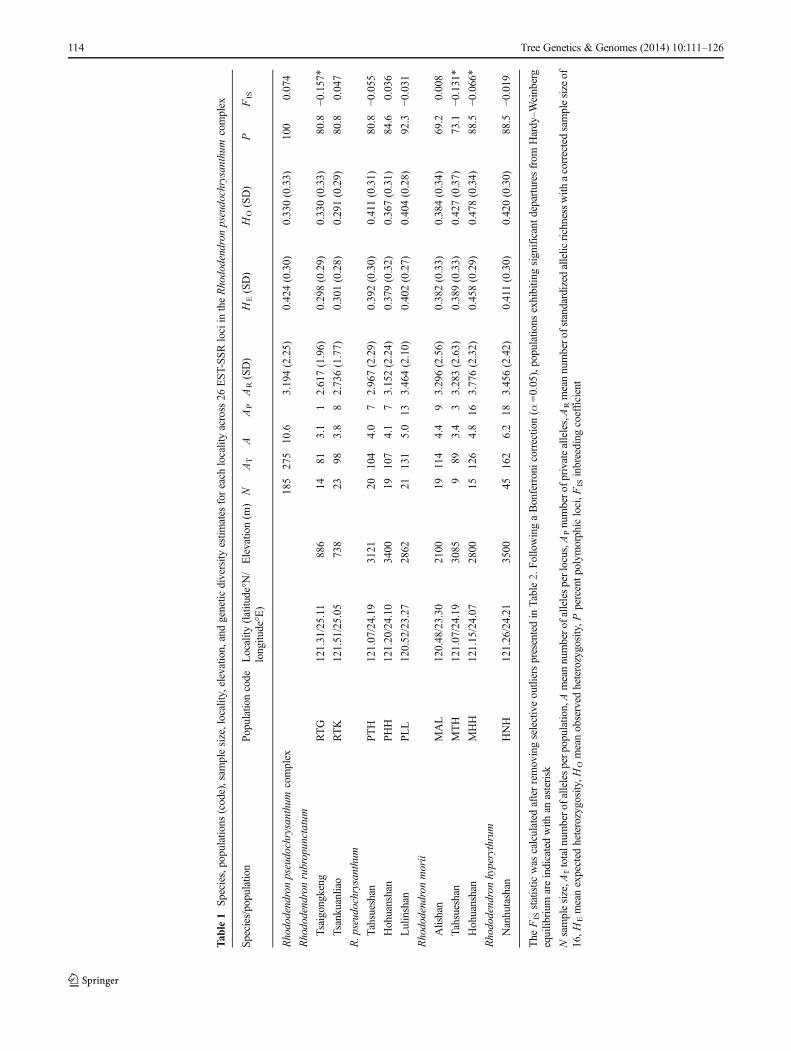
Tab
le1
Species,populatio
ns(code),sam
plesize,locality,elevatio
n,andgenetic
diversity
estim
ates
foreach
localityacross
26EST-SSRlociin
theRhododendronpseudochrysanthum
complex
Species/population
Populationcode
Locality
(latitu
de°N
/longitu
de°E)
Elevatio
n(m
)N
AT
AAP
AR(SD)
HE(SD)
HO(SD)
PFIS
Rhododendronpseudochrysanthum
complex
185
275
10.6
3.194(2.25)
0.424(0.30)
0.330(0.33)
100
0.074
Rhododendronrubropunctatum
Tsaigongkeng
RTG
121.31/25.11
886
1481
3.1
12.617(1.96)
0.298(0.29)
0.330(0.33)
80.8
−0.157*
Tsankuanliao
RTK
121.51/25.05
738
2398
3.8
82.736(1.77)
0.301(0.28)
0.291(0.29)
80.8
0.047
R.pseudochrysanthum
Tahsueshan
PTH
121.07/24.19
3121
20104
4.0
72.967(2.29)
0.392(0.30)
0.411(0.31)
80.8
−0.055
Hohuanshan
PHH
121.20/24.10
3400
19107
4.1
73.152(2.24)
0.379(0.32)
0.367(0.31)
84.6
0.036
Lulinshan
PLL
120.52/23.27
2862
21131
5.0
133.464(2.10)
0.402(0.27)
0.404(0.28)
92.3
−0.031
Rhododendronmorii
Alishan
MAL
120.48/23.30
2100
19114
4.4
93.296(2.56)
0.382(0.33)
0.384(0.34)
69.2
0.008
Tahsueshan
MTH
121.07/24.19
3085
989
3.4
33.283(2.63)
0.389(0.33)
0.427(0.37)
73.1
−0.131*
Hohuanshan
MHH
121.15/24.07
2800
15126
4.8
163.776(2.32)
0.458(0.29)
0.478(0.34)
88.5
−0.066*
Rhododendronhyperythrum
Nanhutashan
HNH
121.26/24.21
3500
45162
6.2
183.456(2.42)
0.411(0.30)
0.420(0.30)
88.5
−0.019
The
FISstatistic
was
calculated
afterremovingselectiveoutlierspresentedin
Table2.
Follo
wingaBonferronicorrectio
n(α
=0.05),populatio
nsexhibitin
gsignificantd
eparturesfrom
Hardy–W
einberg
equilib
rium
areindicatedwith
anasterisk
Nsamplesize,A
Ttotalnum
bero
fallelesperp
opulation,Ameannumbero
fallelesperlocus,A
Pnumbero
fprivatealleles,ARmeannumbero
fstandardizedallelic
richnesswith
acorrectedsamplesize
of16,H
Emeanexpected
heterozygosity,H
Omeanobserved
heterozygosity,P
percentp
olym
orphicloci,F
ISinbreeding
coefficient
114 Tree Genetics & Genomes (2014) 10:111–126

subdivisions to identify loci with unusual levels of differenti-ation (Excoffier et al. 2009). Genetic differentiation calculatedfrom the empirical data set was integrated into the hierarchicalisland model to detect outliers across all populations; 95 %confidence limits were determined from 5×10⁵ simulated loci.Bonferroni correction was applied to evaluate the significanceof selective outliers at P <0.025 for the FDIST2, BAYESFST,and HT methods.
We further employed DETSEL, a pairwise population com-parison method, to identify loci potentially under selection.DETSEL uses a model where a common ancestor populationsplit into two populations and only subsequently diverged byrandom drift after a possible bottleneck event (Vitalis et al.2001, 2003). We performed 10,000 coalescent simulations byconsidering a wide range of potential parameters. For eachpopulation pair (i , j), and for all loci, population-specific diver-gences of Fi and Fj were calculated. Expected joint distribu-tions of Fi and Fj were generated by the 10,000 coalescentsimulations. Null distributions were generated using nuisanceparameters including the locus mutation rate per generationfollowing an infinite allele model set to μ =1×10⁻⁴, 50 and500 generations before the bottleneck (T0), 50 and 500 indi-viduals during the bottleneck (N0), and ancestor populationsizes of 500 and 5,000 before the bottleneck (Ne). With variouscombinations of T0, N0, and Ne set for the coalescent simula-tions, outliers were identified as falling outside the 99.99 %confidence envelope. However, no estimates of the microsatel-lite mutation rates are available for Rhododendron species. Theaverage microsatellite mutation rate estimated for di-nucleotiderepeats in Arabidopsis thaliana was 8.87×10⁻⁴ (Marriage et al.2009). Therefore, because most markers in this study were di-nucleotide repeats, we adopted amore conservative value of 1×10⁻⁴ for the EST-SSRs. The empirical P value for each outlierof a population pair comparison was determined using 2Darrays of 50×50 square cells (Vitalis et al. 2001), and a com-bined P value for different comparisons was also calculated.
Association between environmental variables and EST-SSRalleles
We tested associations of EST-SSR alleles with 11 environ-mental variables obtained from the Central Weather Bureau ofTaiwan recorded in 1989–2009 from 390 meteorological sta-tions. The environmental variables were mean temperature(Tmean), maximum temperature (Tmax), minimum temperature(Tmin), mean wind speed (WSmean), precipitation (PRE), rela-tive humidity (RH), cloud cover (CLO), hours of sunshine(SunH), days of maximum temperature>30 °C (D30), days ofminimum temperature<10 °C (D10), and number of days with>0.1 mm rain per month (RainD). The selected environmentalvariables were primarily related to temperature, precipitation,and monsoons because of their roles in vegetation type differ-ences in Taiwan (Liew et al. 2006; Lee and Liew 2009). We
used a spherical model of the universal Kriging method inArcGIS to generate a distribution map, which was used tointerpolate values of environmental variables at an unobservedlocation from nearby meteorological observations (Carrera-Hernández and Gaskin 2007). Monthly mean values of the11 environmental variables at each sampling site wereextracted from their associated distribution maps/layers cover-ing a latitude/longitude grid within 1 km2. Since most envi-ronmental variables are likely correlated to some extent, weapplied a principal component analysis (PCA) to examinecorrelations between environmental variables.
To identify environmental variables that may have servedas selective forces, we used the spatial analysis method (SAM)of Joost et al. (2007, 2008). This method uses univariatelogistic regressions to determine the degree of associationbetween allelic frequencies at all marker loci and values ofenvironmental variables. With all possible pairwise combina-tions of allele vs. environmental variables, the significance ofan association was determined using both likelihood ratio andWald tests with Bonferroni correction at P <0.05.
Genetic structure
We used 22 loci not identified as outliers by the FST-basedneutrality tests (see the “Results” section) for genetic structureand recent bottleneck analyses. Pairwise FST values werecalculated and tested for significance with Fisher’s exact testafter 50,000 permutations using ARLEQUIN. Hierarchicalgenetic structure of the total genetic variation was partitionedinto among-group, within-group, and within-population com-ponents using analysis of molecular variance (AMOVA)implemented in ARLEQUIN with 50,000 permutations.Bayesian clustering was used for individual assignmentto different population clusters using STRUCTURE v2.3(Pritchard et al. 2000). STRUCTURE identifies distinct ge-netic populations and assigns individuals probabilistically topopulations. In practice, we applied no admixture model withallele frequencies correlated among populations assuming thatthe genotypes of individuals within a population are derivedcompletely from that population. If genetic admixtures be-tween different populations occur, they are probably causedby migration or shared ancestry. Prior population informationwas not incorporated in calculating the posterior probabilityfor individuals belonging to different clusters. For each clus-tering scenario (K =1–10), we performed 20 complete analy-ses each with a 50,000 burn-in period and a sampling periodof 5×10⁵ iterations. Different clustering scenarios were eval-uated using the mean log probability, LnP(D ) (Pritchard et al.2000) and the change in log probability, ΔL (K ) (Evanno et al.2005). The symmetric similarity coefficients (SSCs) werecomputed with CLUMPP, as a measure of the similarityamong the 10 replicate STRUCTURE runs within each valueof K (Jakobsson and Rosenberg 2007). The mean pattern
Tree Genetics & Genomes (2014) 10:111–126 115

of STRUCTURE outputs for each value of K were thendisplayed graphically using the software DISTRUCT(Rosenberg 2004).
Demographic analyses
We used MIGRATE-N v3.1.3 (http://popgen.scs.fsu.edu/Migrate-n.html) applying a simple electrophoretic laddermodel to estimate long-term migration rates and confidenceintervals (CIs) of microsatellite alleles among populations.Long-term migration rates, M , 4N e generations in the past,were estimated based on a coalescent approach using themaximum likelihood mode. All possible combinations ofmigration that were either symmetrical or had no dispersalbetween populations were evaluated with the likelihood ratiotest. Long-term effective population size (Ne) of each popu-lation was estimated based on parameter θ , i.e., 4Neμ , whereμ is the mutation rate per site. Bidirectional M among popu-lations (M=m /μ , where m is the immigration rate per gener-ation) were also estimated. In the maximum likelihood runs ofMIGRATE-N, we sampled one of every 20 reconstructedgenealogies for each locus for ten short and three long chains.In the recorded 1,000 and 104 genealogies for short and longchains, respectively, the first 200 and 2,000 genealogies werediscarded as burn-in.
To determine whether decreases in population size oc-curred recently, we used BOTTLENECK v1.2.02 (Cornuetand Luikart 1996; Piry et al. 1999). This program identifies abottleneck within 0.5 to 5 Ne generations after the initiation ofa population reduction, where Ne is the effective bottleneckedpopulation size according to a Wilcoxon signed-rank test forsignificant deviation from heterozygosity excess, and as-sumed an infinite allele model, a stepwise mutation model,or a two-phase model of microsatellite mutation (Cornuet andLuikart 1996). A bottleneck within 2 to 4 N e generationsshould be detectable using a mode-shift test, where allelefrequency distribution deviates from an L-shape (Piry et al.1999).
We further tested whether higher-elevation populations ofthe R. pseudochrysanthum complex in Hohuanshan andTahsueshan had smaller population sizes than lower-elevation populations using the approximate Bayesian com-putation (ABC) implemented in DIYABC v.0.4.39 (Cornuetet al. 2008, 2010). Two competing scenarios were tested; oneassuming constant population size and the other allowing apopulation size change (Electronic supplementary material,Fig. S1). Four population samples (PHH, MHH, PTH, andMTH) containing 63 individuals genotyped at 22 neutral loci(excluding outlier loci, see the “Results” section) were includ-ed in ABC analysis. In the constant population size scenario,population sizes of the two Hohuanshan (PHH andMHH) andthe two Tahsueshan (PTH and MTH) populations were des-ignated N t1 and N t2, respectively. In the scenario allowing
population size change, each population was given its sizeestimator (N1 for MTH,N2 for PTH, N3 for MHH, and N4 forPHH), and the higher-elevation PHH and PTH populationswere constrained to have smaller population sizes than thelower-elevation MHH and MTH populations, respectively(N1>N2; N3>N4). Hohuanshan MHH and PHH populationsdiverged td1 generations in the past from an ancestral popula-tion size of NA1, and Tahsueshan MTH and PTH populationsdiverged td2 generations in the past from an ancestral popula-tion size of NA2. Looking backward in time at td generationsago, a common ancestral population size of NAwas given forthe four populations. The divergence times (in the number ofgenerations) were constrained in that td was larger comparedto td1 and td2. Simulated genetic data were obtained using ageneralized stepwise mutation model of microsatellite muta-tion (Estoup et al. 2002). The prior distributions of mutationrate, μ , and the parameter of geometric distribution, P, wereset at default values. Uniform priors for the population sizes(10≤N ≤104) and divergence times (1≤t ≤104) were used.Summary statistics including the mean number of alleles, themean genetic diversity, the mean size variance, the mean Mratio (Garza and Williamson 2001), the mean index of classi-fication (Rannala and Moutain 1997; Pascual et al. 2007), andFST values were calculated for the observed and 2×10⁶ sim-ulated data sets. We generated posterior parameter distribu-tions from the 104 simulated data sets that had the smallestnormalized Euclidean distances using Locfit 2.0 in the Renvironment, based on the local linear regression method ofBeaumont et al. (2002). A logistic regression approach wasused to estimate the 95 % CIs for the posterior probability ofeach scenario (Fagundes et al. 2007; Cornuet et al. 2008).
Results
Genetic diversity and inbreeding coefficients
This study observed 234 alleles over 26 loci from nine popu-lations of the R. pseudochrysanthum complex (Table 1). Onaverage, R. rubropunctatum RTG and RTK populations hadthe lowest genetic diversity estimates for AT, AR,HE, andHO.In Hohuanshan and Tahsueshan, lower AR and HO valueswere found in the R. pseudochrysanthum PHH and PTHpopulations at higher elevations, respectively, compared tothe R. morii MHH and MTH populations at lower elevations.Higher HE was found for the R. morii MHH population atlower elevation compared to the R. pseudochrysanthum PHHpopulation at higher elevation in Hohuanshan, although thedifference was not significant due to overlapping standarddeviations. Moreover, a comparable level of HE was foundby comparing the R. pseudochrysanthum PTH population athigher elevation with the R. morii MTH population at lowerelevation in Tahsueshan. Population F IS values estimated
116 Tree Genetics & Genomes (2014) 10:111–126

using 22 neutral loci (excluding outliers) ranged from −0.157(RTG) to 0.047 (RTK) with significant heterozygote excessobserved in the MTH and MHH populations of R. morii andRTG population of R. rubropunctatum (Table 1).
After adjusting for multiple comparisons with Bonferronicorrection at P <0.05, significant departures from HWE werefound for loci 5557 and 6637 in the R. pseudochrysanthumPHH population. No LD was found after applying theBonferroni correction.
Ecologically associated outliers
Locus 5571 was identified as being an outlier potentiallyunder positive selection using FDIST2 and HT (Table 2).Three outliers (loci 1804, 1812, and 6637) were identifiedpotentially under balancing selection, of which loci 1812 and
6637 were detected by both FDIST2 and HT methods andlocus 1804 was identified by both BF and HT methods.DETSEL also identified locus 5571 as being an outlier poten-tially under positive selection in six of seven population paircomparisons of the RTG or RTK populations of R.rubropunctatum with populations of other members of theR. pseudochrysanthum complex under various conditions(combined empirical P <0.0001). Protein coding gene se-quences of the outlier 5571 potentially under positive selec-tion was functionally annotated to the RAB GTPaseholomlog, RABA1f, with an E -value of 2E -81 using theBlastX tool of NCBI (Electronic supplementary material,Table S1).
We further employed SAM to test the association of EST-SSR alleles at all loci with environmental variables in additionto the use of FST-based tests in identifying outliers. In the R.
Fig. 1 Map of sampling localitiesof nine populations of theRhododendronpseudochrysanthum complex
Tree Genetics & Genomes (2014) 10:111–126 117

rubropunctatum RTG and RTK populations, close associa-tions between allelic frequencies of alleles 263 and 265 of thelocus 5571 and values of a number of environmental variableswere found at a significance threshold of 2.73411E-07 corre-sponding to the 99.99 % CI (Table 2). However, no associationwas found between genetic data and environmental variables inpopulations of other members of the R. pseudochrysanthumcomplex.
The first two axes of the PCA used to investigate correla-tion between environmental variables explained 84.14 %(68.77 % and 15.37 %, respectively) of the total variation.The PC1 was derived by giving approximately equal weightto each of the 11 environmental variables except D30. Theseresults suggest that environmental variables examined arehighly correlated, and hence alleles 263 and 265 of the locus5571 potentially under positive selection had significant asso-ciations with most environmental variables as that revealed bySAM analysis (Table 2).
Genetic differentiation
Significantly higher levels of genetic differentiation for pairwisecomparisons between R. rubropunctatum populations and pop-ulations of other members of the R. pseudochrysanthum com-plex were found (average pairwise FST=0.188, combined P<0.0001, Table 3). This was based on 22 neutral loci (excludingoutliers) after applying Bonferroni correction at P <0.05. Theaverage pairwise FST was 0.109 for the R. pseudochrysanthum
complex, which declined to 0.056 when R. rubropunctatumpopulations were excluded. Significant genetic differentiationwas also found among species groups of the R. pseudo-chrysanthum complex (ΦCT=0.06431, P=0.011) based onAMOVA. The AMOVA also showed significant genetic dif-ferentiation (ΦCT=0.12492, P =0.028) between R. rubro-punctatum populations and populations of other members ofthe R. pseudochrysanthum complex (Table 4). Although theAMOVA showed no significant genetic differences amongspecies groups of R. pseudochrysanthum , R. hyperythrum ,and R. morii (ΦCT=0.01875, P=0.144), significant geneticdifferentiation among populations of these three species of theR. pseudochrysanthum complex was found (ΦST=0.06569,P <0.00001).
Population differentiation of the R. pseudochrysanthumcomplex was further analyzed by STRUCTURE (Fig. 2). TheSSCs computed with CLUMPP across ten independent runswere 0.9964, 0.9836, 0.9187, and 0.9558, respectively, for K =2, 3, 4, and 5, suggesting absence of genuine multimodalityacross runs. The largest ΔK was found at K =2 (Fig. 2a).However, STRUCTURE cannot distinguish individuals amongR. hyperythrum , R. morii , and R. pseudochrysanthum whenK =2. Although the maximum LnP(D) value was found whenK =3, LnP(D) value at K =3 was not significantly differentfrom LnP(D) values of K =4 and K =5 (Fig. 2a). Nonetheless,LnP (D) decreased significantly beyond K =5. When K =3was specified, STRUCTURE yielded the following clusters:(i) R. rubropunctatum RTG and RTK individuals; (ii) R.
Table 2 Outliers identified by paired and global comparison methods in the Rhododendron pseudochrysanthum complex
Globalcomparison
Pair comparison Environmental variables
FD BF HT DS SAM
R. pseudochrysanthum complex
Outlier potentially under positive selection
5571 (alleles 263 and 265) ** * RTG, RTK Tmean, Tmax, Tmin: all year
WSmean: January, February, April, May, June, October, November
PRE: January, February, March, September, October, November, December
CLO: January, February, April, May, June, October, November, December
SunH: January, February, March, April, May, June, October, November, December
D30: February, April, May, July, September, October
D10: all year
RainD: January, February, March, April, October, November, December
Outlier potentially under balancing selection
1804 ** *
1812 ** *
6637 ** *
The significant threshold for DETSEL was set to 99.99 %
FD FDIST2, BF BAYESFST, HT hierarchical test, DS DETSEL, SAM spatial analysis method
Significant values at *P<0.025; **P <0.001 (after applying the Bonferroni correction at α=0.05)
118 Tree Genetics & Genomes (2014) 10:111–126

pseudochrysanthum PTH individuals and R. hyperythrumHNH individuals; and (iii) R. pseudochrysanthum PHH andPLL individuals plus R. morii MAL, MTH, and MHH indi-viduals (Fig. 2b). When K =4 was specified, STRUCTUREyielded the following clusters: (i) R. rubropunctatum RTG andRTK individuals; (ii) R. pseudochrysanthum PTH individuals;(iii) R. pseudochrysanthum PHH and PLL individuals plus R.morii MAL, MTH, and MHH individuals; and (iv) R.hyperythrum HNH individuals (Fig. 2b). When K =5 wasspecified, no further increase in the number of geneticallydistinct groups was found.
Demography
No bottlenecks were detected in all examined populations up to5 Ne generations ago in the R. pseudochrysanthum complex
based on heterozygosity excess and allele frequency distributiontests (Electronic supplementary material, Table S2). Historicalmigration rates expressed as the number of migrants per gener-ation (Nm, the product of θ andM divided by 4) estimated withMIGRATE-N revealed asymmetrical migration among popula-tions (Table 5). Estimates of Nm among populations were lowand ranged from 0.072 to 0.527, with an average of 0.279.However, higher average dispersal rates (average Nm=0.323)were found among populations of R. pseudochrysanthum , R.morii , and R. hyperythrum compared to the averageNm of totalpopulations. In Hohuanshan and Tahsueshan, historical migra-tion rates were higher from higher-elevation to lower-elevationpopulations (from R. pseudochrysanthum PHH to R. moriiMHH in Hohuanshan and from R. pseudochrysanthum PTHto R. morii MTH in Tahsueshan, respectively) than the reverse.However, asymmetrical migration rates between the two
Table 3 Estimated population pairwise FST (below the diagonal) and corresponding P values (above the diagonal) in the Rhododendronpseudochrysanthum complex
Population code RTG RTK PTH PHH PLL MAL MTH MHH HNH
RTG – <0.0001 <0.0001 <0.0001 <0.0001 <0.0001 <0.0001 <0.0001 <0.0001
RTK 0.0866* – <0.0001 <0.0001 <0.0001 <0.0001 <0.0001 <0.0001 <0.0001
PTH 0.2149* 0.2229* – <0.0001 <0.0001 <0.0001 <0.0001 <0.0001 <0.0001
PHH 0.1496* 0.2039* 0.0529* – 0.0006 0.0004 0.0387 0.0056 <0.0001
PLL 0.1577* 0.2221* 0.0938* 0.0322* – <0.0001 <0.0001 <0.0001 <0.0001
MAL 0.1494* 0.2099* 0.1108* 0.0433* 0.0400* – 0.0038 <0.0001 <0.0001
MTH 0.1650* 0.2209* 0.0788* 0.0202 0.0651* 0.0395 – <0.0001 <0.0001
MHH 0.1540* 0.1905* 0.0632* 0.0251 0.0529* 0.0469* 0.0459* – <0.0001
HNH 0.1775* 0.1990* 0.0521* 0.0428* 0.0952* 0.0775* 0.0507* 0.0542* –
*Significance after Bonferroni correction at α=0.05
Table 4 Summary of AMOVA results comparing genetic variation within and among different groupings
Source of variation Df Sum of squares Variance components Percentage of variation Φ statistics P value
Four species groups in the Rhododendron pseudochrysanthum complex
Among groups 3 135.080 0.30340 6.43 ΦCT=0.06431 0.01108
Among populations within 5 65.206 0.26186 5.55 ΦSC=0.05932 <0.00001
Groups
Within populations 361 1499.105 4.15265 88.02 ΦST=0.11981 <0.00001
Total 369 1699.392 4.71791
Two groups: Rhododendron rubropunctatum vs. other species in the R. pseudochrysanthum complex
Among groups 1 91.236 0.63382 12.49 ΦCT=0.12492 0.02818
Among populations within groups 7 109.050 0.28751 5.67 ΦSC=0.06475 <0.00001
Within populations 361 1499.105 4.15265 81.84 ΦST=0.18158 <0.00001
Total 369 1699.392 5.07397
Three species groups: R. pseudochrysanthum , Rhododendron morii , and Rhododendron hyperythrum
Among groups 2 46.835 0.08801 1.88 ΦCT=0.01875 0.14471
Among populations within groups 4 51.365 0.22026 4.69 ΦSC=0.04783 <0.00001
Within populations 289 1267.118 4.38449 93.43 ΦST=0.06569 <0.00001
Total 295 1362.318 4.69275
Significance was tested against a null distribution of 50,000 random permutations
Tree Genetics & Genomes (2014) 10:111–126 119

populations in Tahsueshan were not significantly different be-cause of overlapping 95 % CIs. Moreover, estimates of Nm
indicate that the mean rate of migration into R. rubropunctatumpopulations from populations of other members of the R.pseudochrysanthum complex were lower than the mean rateof migration from populations of other members of the R.pseudochrysanthum complex to R. rubropunctatum popula-tions (average Nm=0.135 vs. 0.305). Long-term effective pop-ulation size (θ) ranged from 0.5659 to 1.6338 with the smallestat the R. rubropunctatum RTG population and the highest at theR. hyperythrum HNH population. Both R. rubropunctatumRTG and RTK populations had relatively lower θ values com-pared to those of populations of other members of the R.pseudochrysanthum complex. Moreover, in the context ofcomparing populations in the same mountainous areas ofHohuanshan and Tahsueshan, effective population size wassignificantly higher in lower-elevation than in higher-elevationpopulation, i.e., R. morii MHH (θ=1.2160, 95 % CI: 1.1136–1.3116) vs. R. pseudochrysanthum PHH (θ =0.9214, 95 % CI:
0.8543–0.9778), and R. morii MTH (θ =0.9254, 95 % CI:0.8443–1.0200) vs. R. pseudochrysanthum PTH (θ= 0.8484,95 % CI: 0.7942–0.8974), respectively, according to non-overlapping (MHH vs. PHH) or slightly overlapping (MTHvs. PTH) 95 % CIs.
Population size reductions of higher-elevation Hohuanshanand Tahsueshan populations were also revealed by ABC, basedon a higher posterior probability of 0.89 (95 % CI: 0.866–0.923) obtained in the scenario allowing population size changecompared to a posterior probability of 0.11 (95 % CI: 0.078–0.134) in the constant population size scenario (Electronicsupplementary material, Fig. S1). In Hohuanshan, the medianof recent population sizes were estimated to be 8,030 (95 % CI:3,930–9,910) and 3,070 (95%CI: 948–7,040), respectively, forthe R. morii MHH population at lower elevation and R.pseudochrysanthum PHH population at higher elevation(Table 6). Moreover, the median of ancestral population sizewas estimated to be 6,830 (95 % CI: 1,160–9,830) for the R.morii MHH and R. pseudochrysanthum PHH populations in
Fig. 2 Bar plots ofSTRUCTURE analysisrepresenting assignments ofgenotypes to nine populations ofthe Rhododendronpseudochrysanthum complex.See Table 1 for population codes.(a) Log likelihood and changes inthe log likelihood for differentscenarios of groupings based on22 microsatellite loci derivedfrom expressed sequence tags(ESTs) of R. catawbiense . (b) Barplots represent assignments ofgenotypes for nine populations ofthe R. pseudochrysanthumcomplex
120 Tree Genetics & Genomes (2014) 10:111–126

Tab
le5
Mutation-scaled
effectivepopulatio
nsizes(θ=4N
eμ)andthenumberof
immigrantspergeneratio
nacross
nine
populatio
nsin
theRhododendronpsedochrysannthum
complex
Recipient
ΘSource
RTG
RTK
PTH
PHH
PLL
MAL
MTH
MHH
HNH
RTG
0.5659
(0.5324,
0.5991)
*0.1567
(0.1265,
0.1905)
0.1478
(0.1178,
0.1804)
0.1492
(0.1211,
0.1817)
0.0846
(0.0649,
0.1115)
0.1218
(0.0955,
0.1513)
0.1564
(0.1273,
0.1901)
0.0726
(0.0552,
0.0938)
0.1110
(0.0869,
0.1386)
RTK
0.6962
(0.6414,
0.7389)
0.2649
(0.2150,
0.3179)
*0.1824
(0.1462,
0.2232)
0.1077
(0.0806,
0.1378)
0.1187
(0.0913,
0.1545)
0.1414
(0.1107,
0.1788)
0.1887
(0.1471,
0.2308)
0.1276
(0.0968,
0.1624)
0.1794
(0.1395,
0.2258)
PTH
0.8484
(0.7942,
0.8974)
0.1768
(0.1418,
0.2188)
0.1122
(0.0861,
0.1453)
*0.3058
(0.2554,
0.3647)
0.2372
(0.1931,
0.2872)
0.2226
(0.1790,
0.2706)
0.1941
(0.1557,
0.2398)
0.1381
(0.1083,
0.1743)
0.2869
(0.2386,
0.3461)
PHH
0.9214
(0.8543,
0.9778)
0.3154
(0.2583,
0.3838)
0.3039
(0.2491,
0.3670)
0.3109
(0.2553,
0.3747)
*0.2434
(0.1943,
0.3027)
0.1621
(0.1262,
0.2049)
0.2948
(0.2399,
0.3578)
0.2359
(0.1889,
0.2903)
0.4349
(0.3579,
0.5156)
PLL
1.1123
(1.0350,
1.1894)
0.3468
(0.2805,
0.4404)
0.2735
(0.2175,
0.3428)
0.3717
(0.3015,
0.4664)
0.2698
(0.2141,
0.3387)
*0.5273
(0.4396,
0.6339)
0.3074
(0.2449,
0.3821)
0.3504
(0.2845,
0.4313)
0.3149
(0.2525,
0.4059)
MAL
1.4244
(1.3156,
1.5132)
0.3307
(0.2671,
0.4035)
0.3085
(0.2421,
0.3793)
0.2483
(0.1960,
0.3095)
0.3507
(0.2845,
0.4263)
0.3052
(0.2455,
0.3741)
*0.5062
(0.4191,
0.6016)
0.3665
(0.2844,
0.4462)
0.3865
(0.3151,
0.4756)
MTH
0.9254
(0.8443,
1.0200)
0.2091
(0.1644,
0.2692)
0.1882
(0.1464,
0.2442)
0.2182
(0.1720,
0.2802)
0.3531
(0.2884,
0.4408)
0.0905
(0.0644,
0.1315)
0.4063
(0.3349,
0.5006)
*0.2338
(0.1835,
0.2985)
0.2026
(0.1589,
0.2612)
MHH
1.2160
(1.1136,
1.3116)
0.4144
(0.3276,
0.5121)
0.3131
(0.2471,
0.3942)
0.3503
(0.2778,
0.4375)
0.5138
(0.4182,
0.6264)
0.3342
(0.2614,
0.4272)
0.3779
(0.1629,
0.2768)
0.2135
(0.1629,
0.2768)
*0.4391
(0.3555,
0.5407)
HNH
1.6338
(1.5516,
1.7016)
0.4633
(0.3920,
0.5433)
0.5122
(0.4320,
0.6000)
0.4362
(0.3674,
0.5140)
0.4667
(0.3942,
0.5478)
0.3824
(0.3184,
0.4583)
0.4451
(0.3404,
0.4874)
0.4122
(0.3404,
0.4874)
0.3321
(0.2744,
0.3983)
*
The
mutationrateisgivenas
aconstant
value(μ
=0.0001)in
each
populatio
n.Migratio
ndirectionfrom
thepopulatio
n;recipient:migratio
ndirectionto
thepopulatio
n.The
numberof
immigrantsper
generatio
niscalculated
byNe×m
ij=θj×M
ij/4.T
he95
%highestp
osterior
credibility
(HPC)values
oftheparameter
arein
parentheses
Tree Genetics & Genomes (2014) 10:111–126 121

Hohuanshan and the median of their divergence time wasestimated to be 256 (95 % CI: 35–1,060) generations ago,which is equivalent to 3,072 years ago based on the minimumgeneration time of 12 years in Rhododendron plants (Cross1975). In Tahsueshan, the median of recent population sizeswere estimated to be 5,330 (95 % CI: 1,540–9,680) and 2,930(95 % CI: 855–6,730), respectively, for the lower-elevation R.morii MTH population and higher-elevation R. pseudo-chrysanthum PTH population. The median of ancestral popu-lation size was estimated to be 5,780 (95 % CI: 751–9,760) forthe R. morii MTH and R. pseudochrysanthum PTH popula-tions in Tahsueshan, and the median of their divergence timewas estimated to be 305 (95 % CI: 35–1,280) generations ago(3,660 years ago). In addition, the median of divergence timefrom a common ancestor of all member populations of the R.pseudochrysanthum complex located in Hohuanshan andTahsueshan was estimated to be 400 (95 % CI: 89–3,050)generations ago (4,800 years ago), and the median of commonancestral population size was estimated to be 531 (95%CI: 29–3,140).
Discussion
Genetic diversity, population isolation, and inbreeding
A lower level of genetic variability is frequently found innarrowly distributed species, which face a greater threat ofextinction from stochastic ecological events. The level ofEST-SSR variation in the R. pseudochrysanthum complex(average HE=0.424) was comparable to those of endemicplant species on average (HE=0.420), based on genomic-derived SSRs (Nybom 2004). However, the average HE valuebased on EST-SSRs of the R. pseudochrysanthum complexwas significantly smaller than averageHE values of R. ripense(averageHE=0.800; Kondo et al. 2009) and R. brachycarpum(average HE=0.815; Hirao 2010), based on genomic-derived
SSRs. Although genomic-derived SSRs varymore, whichmaybe due simply to highmicrosatellitemutation rate, the variationobserved in EST-SSRs may represent functional significancein response to selection more effectively (Ellis and Burke2007; Kane and Rieseberg 2007).
The effects of postglacial climatic warming may havediffered among populations of the R. pseudochrysanthumcomplex with similar life histories. Although genetic diversitydecreases with increased elevation because of range contrac-tion associated with upward migration (e.g., Quiroga andPremoli 2007), no conclusive evidence was found in thisstudy that higher-elevation populations had lower levels ofgenetic diversity than lower-elevation populations of the R.pseudochrysanthum complex. Nevertheless, postglacial cli-matic warming may have had greater effects on low elevation(trailing edge) R. rubropunctatum populations because oftheir lower levels of genetic variation compared to populationsof other members of the R. pseudochrysanthum complex.This agrees with the central-marginal hypothesis (e.g.,Eckert et al. 2008; Herrera and Bazaga 2008).
The shallow genetic structuring estimated by the pairwiseFST and AMOVA analyses indicated high dispersal ratesamong species groups of R. hyperythrum , R. morii , and R.pseudochrysanthum probably because of historical geneticconnectivity. However, significant levels of genetic differen-tiation among populations of the R. pseudochrysanthum com-plex, especially among populations ofR. pseudochrysanthum ,R. morii , and R. hyperythrum , indicated genetic isolation inaccordance with the results of previous studies (Chung et al.2007; Huang et al. 2011). Genetic isolation wasmore apparentbetween trailing edge populations (R. rubropunctatum popu-lations) and populations of other members of the R. pseudo-chrysanthum complex, based on the deeper genetic structuringrevealed by pairwise FST, AMOVA, and STRUCTURE analyses.Moreover, genetic structuring revealed by STRUCTURE suggeststhat evolutionary histories of R. rubropunctatum RTG and RTK,R. hyperythrum HNH, and R. pseudochrysanthum PTH
Table 6 Mean, median, modeand quantile calculated from sim-ulation of population size changemodel of lower-elevation andhigher-elevation population sam-ples of Rhododendronpseudochrysanthum and Rhodo-dendron morii in Tahsueshan andHohuanshan using approximateBayesian computation
Scenario/parameter Mean Median Mode Quantile 2.5 % Quantile 97.5 %
Scenario 2 (posterior probability: 0.89; 95 % confidence interval: 0.866–0.923)
NA 789 531 43 29 3140
NA1 (MHH-PHH) 6440 6830 9110 1160 9830
NA2 (MTH-PTH) 5630 5780 6610 751 9760
N1 (MTH) 5500 5330 4830 1540 9680
N2 (PTH) 3140 2930 2840 855 6730
N3 (MHH) 7740 8030 8520 3930 9910
N4 (PHH) 3280 3070 2910 948 7040
Td 639 400 272 89 3050
td1 (MHH-PHH) 330 256 174 35 1060
td2 (MTH-PTH) 394 305 152 35 1280
122 Tree Genetics & Genomes (2014) 10:111–126

populations differed from those of other populations of the R.pseudochrysanthum complex.
Population genetics theory predicts that reduced local ge-netic variation in small populations may trigger negativeinbreeding effects (Frankham 1995). However, genetic signa-tures of inbreeding may not be apparent if a population re-mains small for an extended period. No significant positivevalues of population F IS were found in this study. Thus,substantial evidence of inbreeding or significant geneticsubstructuring within the study populations was not obtained.Significant negative values of population F IS can be found ifrates of gene flow among populations are high and can also beattributed to the predominantly insect-pollinated outcrossingin Rhododendron species (Ono et al. 2008; Hirao 2010).However, the F IS of most of the populations examined in thisstudy showed no significant negative values departing fromHWE toward an excess of heterozygotes, which may haveresulted from restricted gene flow among populations as re-vealed by MIGRATE-N analyses.
Reduced population sizes in the trailing-edgeR. rubropunctatum and high elevation R. pseudochrysanthumpopulations
It is proposed that postglacial climatic changes caused woodyspecies to shift to much-narrower vertical habitats due toecological niche conservation (Wiens and Graham 2005;Hardy et al. 2009). Climate changes are known to causespecies to shift their ranges upward and can lead to reducedpopulation sizes (Jump et al. 2009). No evidence of bottle-necks up to 5 N e generations ago was found based on analysiswith the BOTTLENECK program, suggesting that populationsize declines may have occurred for a prolonged period oftime as a result of long-term postglacial climatic warming.The statistical power of the bottleneck tests may be low fordetecting recent population declines given the limited samplesizes of individuals, and estimations are sensitive to violationsin the assumptions of the microsatellite mutation model(Girod et al. 2011; Peery et al. 2012). However, populationisolation caused by postglacial climatic warming is inevitableand may be severe for island endemic temperate woodyspecies in Taiwan (Liew and Chung 2001; Jump et al.2012). The post-glacial climate in Taiwan has been primarilyhumid and warm, which can facilitate the rapid growth ofsubtropical plant species that were limited by the cooler, drierclimate of the LGM (Tsukada 1966; Liew et al. 1998, 2006).The characteristics of a slow growth rate and long generationtime of temperate Rhododendron species may limit theirability to become established in this habitat. In addition,because of minimal latitudinal coverage and the numerousplant species accommodated within the limited areas of steepmountains, competition to survive may be intense (Jump et al.2012).
No conclusive evidence of upward migration was found inthis study using MIGRATE-N on populations of the R.pseudochrysanthum complex. A simulation study by Abdoet al. (2004) found that MIGRATE-N often yielded inaccurateestimates of migration using DNA sequence data, although itis not known whether this conclusion can be applied to mi-crosatellite data. Nevertheless, migration rates among popula-tions of the R. pseudochrysanthum complex were found to below, consistent with findings for other Rhododendron species(Escaravage et al. 1997; Kameyama et al. 2001), and can beattributed to the ineffective pollen flow and short seed dis-persal distance in Rhododendron (Kameyama et al. 2000;Marshall et al. 2010). Moreover, it is probable that the paceof climate change may have exceeded their ability to migrate,resulting in population losses. Abdo et al. (2004) also pointedout that MIGRATE-N performs well in estimating the θ value,and in this study, θ values were higher in lower-elevation thanin higher-elevation populations in Hohuansan andTahsueshan. This was further supported by ABC results,although the median value of recent population size for theR. morii MTH population slightly overlapped the 97.5 %quantile value of recent population size estimated for the R.pseudochrysanthum PTH population. This suggests there ishigher overall demographic stability in lower-elevation popu-lations than in those at higher-elevation in both Hohuanshanand Tahsueshan.
The effects of postglacial climate warming would be mostprofound in R. rubropunctaum because there are no suitablehabitats in higher elevations along its current distributionalranges for populations to grow and persist. This would alsoresult in much smaller populations compared to those of othermembers of the R. pseudochrysanthum complex, as revealedby MIGRATE-N analyses. MIGRATE-N results indicate thatsmall effective population sizes may be a result of low immi-gration rates into R. rubropunctatum populations from popu-lations of other members of the R. pseudochrysanthum com-plex. It is also likely that more severe declines in effectivepopulation sizes of R. rubropunctatum are a result of increas-ingly lower limits and restraints on upward migration and/or amore stringent confinement to suitable habitats.
Ecologically relevant adaptive divergence in the trailing edgeR. rubropunctatum populations of the R. pseudochrysanthumcomplex
Dispersal is restricted among small populations, facilitatinggenetic drift and/or genetic divergence because of spatiallyheterogeneous selection pressures (Mäkinen et al. 2008).Evolutionary adaptations can occur in natural populationsshifting their geographical distributions because of climatechange, especially in populations that persist at the trailingedges (Ackerly 2003; Hampe and Petit 2005; Thuiller et al.2008). For trailing edge R. rubropunctatum populations
Tree Genetics & Genomes (2014) 10:111–126 123

persisting in low-elevation environments despite climatechange, adaptive evolution is vital because no suitable habitatsexist at higher elevations. SAM and FST-based neutrality testresults suggest a correlation between probable selective forcesand outlier or nearby linked gene in the R. rubropunctatumpopulations. In trailing edge populations, the scarcity of suit-able habitat may be reflected in small population sizes anddecreased genetic diversity (Hampe and Petit 2005; Thuilleret al. 2008; Levin 2012) and may have resulted in the loss ofadaptive potential (Pearson et al. 2009). However, variationspecific to trailing edge populations may have evoked localadaptations in response to changing local environments(Parisod and Joost 2010; Savolainen et al. 2011; Hollidayet al. 2012). The trailing edge R. rubropunctatum populationswith relatively small population sizes and low immigrationrates are strongly isolated genetically from populations ofother members of the R. pseudochrysanthum complex, assuggested by pairwise FST, AMOVA, and STRUCTUREresults. Genetic isolation of trailing edge populations fromcore populations may have evoked selection against immi-grants (Nosil et al. 2008; Levin 2012) and also downplayedthe effects of maladapted gene flow from core populations(Garcia-Ramos and Kirkpatrick 1997; Kirkpatrick and Barton1997; Holliday et al. 2012). Moreover, long-term persistenceof R. rubropunctatum at low elevations may have promotedadaptive divergence in response to environmental changesdespite small population sizes (Hampe and Petit 2005;Thuiller et al. 2008; Levin 2012). Therefore, local adaptivedivergence of the trailing edge R. rubropunctatum popula-tions may have been invoked by ecologically relevant localselective forces. Moreover, natural selection produces similareffects on local adaptations in both R. rubropunctatum popu-lations, indicating the potential for allopatric speciation com-pared to the geographically distant populations of other mem-bers of the R. pseudochrysanthum complex.
Determining the function of the outlier identified potentiallyunder positive selection in this study would be challenging. Inthis study, protein gene coding sequences of the outlier poten-tially under positive selection had functional annotation corre-sponding to RAB GTPase homolog RABA1f. RAB GTPasesare small GTP-binding proteins and are central regulators ofprotein trafficking of cellular components like proteins be-tween cellular compartments (Vernoud et al. 2003; Woollardand Moore 2008). A plant-specific RAB GTPase, ARA5, wasshown to be involved in plant salt stress tolerance (Bolte et al.2000; Zhang et al. 2009). Recently, an ARA6 gene paralogousto ARA5 was also shown to be salt-responsive (Ebine et al.2011), which was thought to emerge in the common ancestorof land plants (Ebine et al. 2012). It is possible that plant-specific RAB GTPase protein genes play general roles inabiotic stress tolerance (Ebine et al. 2012). Our result suggeststhe putative role of RAB GTPase protein genes in local adap-tations of the trailing edge R. rubropunctatum populations of
the R. pseudochrysanthum complex. Future study on whetherspecific ecological factors drive adaptive genetic variation ofthe RAB GTPase protein genes may help in understandinghow populations of R. rubropunctatum respond to climaticwarming.
Conclusions
This study employed a combination of methods to explore theeffects of biogeographical range shifts prompted by postglacialclimatic warming on populations of closely related species inthe R. pseudochrysanthum complex. No evidence of geneticerosion was found for most populations. Historical populationconnectivity may have caused low genetic differentiationamong species groups of R. hyperythrum , R. morii , and R.pseudochrysanthum . However, population isolation was re-vealed by significant genetic differentiation among all hierar-chical population groups. R. rubropunctatum populations per-sist at the trailing edge under divergent or extreme environ-mental conditions; adaptive divergence can result from histor-ical and contemporary ecological and evolutionary forces.Trailing edge populations tended to diverge from core popula-tions of a species complex and displayed lower genetic diver-sity but greater local adaptation. These trailing edge popula-tions are significant as sources of evolutionary novelty becauseof the association between outlier and environmental variables.Thus, trailing edge populations should not be considered anevolutionary dead-end destined for extinction and should per-haps be the focus of conservation efforts.
Acknowledgments This work was supported by the National ScienceCouncil, Executive Yuan, Taiwan (grant number NSC97-2313-B-003-002-MY3) to SYH. The authors are grateful to Yushan National Park forallowing them to collect plant materials. Funding for a graduate student-ship to BKL and YCH and a postdoctoral associateship to CYC and CTCby the National Science Council is also acknowledged.
Data Archiving Statement EST-SSR genotyping data of this studywere deposited at Dryad: http://doi.org/10.5061/dryad.m33cb.
References
Abdo Z, Crandall KA, Joyce P (2004) Evaluating the performance oflikelihood methods for detecting population structure and migration.Mol Ecol 13:837–851
Ackerly DD (2003) Community assembly, niche conservatism, and adap-tive evolution in changing environments. Int J Plant Sci 164:S165–S184
Beaumont MA, Balding DJ (2004) Identifying adaptive genetic diver-gence among populations from genome scans. Mol Ecol 13:969–980
Beaumont MA, Nichols RA (1996) Evaluating loci for use in the geneticanalysis of population structure. Proc R Soc Lon Ser B Biol Sci 263:1619–1626
124 Tree Genetics & Genomes (2014) 10:111–126

Beaumont MA, Zhang W, Balding DJ (2002) Approximate Bayesiancomputation in population genetics. Genetics 162:2025–2035
Bolte S, Schiene K, Dietz KJ (2000) Characterization of a smallGTP-binding protein of the rab 5 family in Mesembryanthemumcrystallinum with increased level of expression during early saltstress. Plant Mol Biol 42:923–36
Booy G, Hendriks RJJ, Smulders MJM, Van Groenendael M, Vosman B(2000) Genetic diversity and the survival of populations. Plant Biol2:379–395
Carrera-Hernández JJ, Gaskin SJ (2007) Spatio temporal analysis of dailyprecipitation and temperature in the basin of Mexico. J Hydrol 336:231–249
Chung J-D, Lin T-P, Chen Y-L, Cheng Y-B, Hwang S-Y (2007) Phylo-geographic study reveals the origin and evolutionary history of aRhododendron species complex in Taiwan. Mol Phylogent Evol 42:14–24
Cornuet JM, Luikart G (1996) Description and power analysis of twotests for detecting recent population bottlenecks from allele frequen-cy data. Genetics 144:2001–2014
Cornuet J-M, Santos F, Beaumont MA, Robert CP, Marin J-M, BaldingDJ, Guillemaud T, Estoup A (2008) Inferring population historywith DIYABC: a user-friendly approach to approximate Bayesiancomputations. Bioinformatics 24:2713–2719
Cornuet J-M, Ravigné V, Estoup A (2010) Inference on populationhistory and model checking using DNA sequence and microsatellitedata with the software DIYABC (v1.0). BMC Bioinforma 11:401
Cross JR (1975) Biological flora of the British Isles: Rhododendronponticum L. J Ecol 63:345–364
Dieringer D, Schlötterer C (2003) Microsatellite Analyser: a platformindependent analysis tool for large microsatellite data sets. Mol EcolNotes 3:167–169
Dirnböck T, Essl F, Rabitsch W (2011) Disproportional risk for habitatloss of high-altitude endemic species under climate change. GlobalChange Biol 17:990–996
Doyle JJ, Doyle JL (1987) A rapid DNA isolation procedure for smallquantities of fresh leaf material. Phytochem Bull 19:11–15
Ebine K, Fujimoto M, Okatani Y, Nishiyama T, Goh T, Ito E, Dainobu T,Nishitani A, Uemura T, Sato MH, Thordal-Christensen H, TsutsumiN, Nakano A, Ueda T (2011) A membrane trafficking pathwayregulated by the plant-specific RAB GTPase ARA6. Nat Cell Biol13:853–859
Ebine K, Miyakawa N, Fujimoto M, Uemura Y, Nakano A, Ueda T(2012) Endosomal trafficking pathway regulated by ARA6, aRAB5 GTPase unique to plants. Small GTPases 3:23–27
Eckert CG, Samis KE, Lougheed SC (2008) Genetic variation acrossspecies’ geographical ranges: the central-marginal hypothesis andbeyond. Mol Ecol 17:1170–1188
Ellis JR, Burke JM (2007) EST-SSRs as a resource for population geneticanalyses. Heredity 99:125–132
Escaravage N, Pornon A, Doche B, Till-Bottaraud I (1997) Breedingsystem in an alpine species Rhododendron ferrugineum L.(Ericaceae) in the French northern Alps. Can J Bot 75:736–743
EstoupA, Jarne P, Cornuet J-M (2002) Homoplasy andmutationmodel atmicrosatellite loci and their consequences for population geneticsanalysis. Mol Ecol 11:1591–1604
Evanno G, Regnaut S, Goudet J (2005) Detecting the number of clustersof individuals using the software STRUCTURE: a simulation study.Mol Ecol 14:2611–2620
Excoffier L, Lischer HEL (2010) Arlequin suite ver 3.5: A new series ofprograms to perform population genetics analyses under Linux andWindows. Mol Ecol Res 10:564–567
Excoffier L, Hofer T, Foll M (2009) Detecting loci under selection in ahierarchically structured population. Heredity 103:285–298
Fagundes NJR, Ray N, Beaumont MA (2007) Statistical evaluation ofalternative models of human evolution. Proc Natl Acad Sci U S A104:17614–17619
Frankham R (1995) Inbreeding and extinction - a threshold effect. ConserBiol 9:792–799
Garcia-RamosG,KirkpatrickM (1997) Geneticmodels of adaptation andgene flow in peripheral populations. Evolution 51:21–28
Garza JC, Williamson EG (2001) Detection of reduction in populationsize using data from microsatellite loci. Mol Ecol 10:305–318
Gavrilets S, Vose A (2007) Case studies and mathematical models ofecological speciation. 2. Palms on an oceanic island. Mol Ecol 16:2910–2921
Girod C, Vitalis R, Leblois R, Fréville H (2011) Inferring populationdecline and expansion from microsatellite data: a simulation-basedevaluation of the Msvar method. Genetics 188:165–179
Goudet J (2001) FSTAT, a program to estimate and test gene diversitiesand fixation indices. Version 2.9.3. http://www2.unil.ch/popgen/softwares/fstat.htm. Accessed 11 March 2013
Guo SW, Thompson EA (1992) Performing the exact test of Hardy–Weinberg proportion for multiple alleles. Biometrics 48:361–372
Hampe A, Petit RJ (2005) Conserving biodiversity under climate change:the rear edge matters. Ecol Lett 8:461–467
Hardy EA, Spaeth PA, Li C (2009) Niche conservatism above the specieslevel. Proc Natl Acad Sci U S A 106:19707–19714
Herrera C, Bazaga P (2008) Adding a third dimension to the edge of aspecies’ range: altitude and genetic structuring in mountainouslandscapes. Heredity 100:275–285
Hirao AS (2010) Kinship between parents reduces offspring fitness in anatural population of Rhododendron brachycarpum . Ann Bot 105:637–646
Holderegger R, Herrmann D, Poncet B, Gugerli F, Thuiller W, Taberlet P,Gielly L, Rioux D, Brodbeck S, Aubert S, Manel S (2008) Landahead: using genome scans to identify molecular markers of adap-tive divergence. Plant Ecol Divers 1:273–283
Holliday JA, Suren H, Aitken SN (2012) Divergent selection and hetero-geneous migration rates across the range of Sitka spruce (Piceasitchensis). Proc R Soc B 279:1675–1683
Huang C-C, Hung K-H, Hwang C-C, Huang J-C, Lin H-D, Wang W-K,Wu P-Y, Hsu T-W, Chiang T-Y (2011) Genetic population structureof the alpine species Rhododendron pseudochrysanthum sensu lato(Ericaceae) inferred from chloroplast and nuclear DNA. BMC EvolBiol 11:108
Hurlbert SH (1971) The nonconcept of species diversity: a critique andalternative parameters. Ecology 52:577–586
Jakobsson M, Rosenberg NA (2007) CLUMPP: a cluster matching andpermutation program for dealing with label switching andmultimodality in analysis of population structure. Bioinformatics23:1801–1806
Joost S, Bonin A, BrufordMW,Després L, Conord C, Erhardt G, TaberletP (2007) A spatial analysis method (SAM) to detect candidate locifor selection: towards a landscape genomics approach to adaptation.Mol Ecol 16:3955–3969
Joost S, KalbermattenM, Bonin A (2008) Spatial analysis method (SAM):a software tool combining molecular and environmental data toidentify candidate loci for selection. Mol Ecol Res 8:957–960
Jump AS, Mátyás C, Peñuelas J (2009) The altitude-for-latitude disparityin range retractions of woody species. Trends Ecol Evol 24:694–701
Jump AS, Huang T-J, Chou C-H (2012) Rapid altitudinal migration ofmountain plants in Taiwan and its implications for high altitudebiodiversity. Ecography 35:204–210
Kalinowski ST (2005) HP-Rare: a computer program for performingrarefaction on measures of allelic diversity. Mol Ecol Notes 5:187–189
Kameyama Y, Isagi Y, Nakagoshi N (2000) Microsatellite analysis ofpollen flow inRhododendronmetternichii var. hondoense . Ecol Res15:263–269
Kameyama Y, Isagi Y, Nakagoshi N (2001) Patterns and levels of geneflow in Rhododendron metternichii var. hondoense revealed bymicrosatellite analysis. Mol Ecol 10:205–216
Tree Genetics & Genomes (2014) 10:111–126 125
Kane NC, Rieseberg LH (2007) Selective sweeps reveal candidate genesfor adaptation to drought and salt tolerance in common sunflower,Helianthus annuus. Genetics 175:1823–1824
Kirkpatrick M, Barton NH (1997) Evolution of a species’ range. Am Nat150:1–23
Kondo T, Nakagishi N, Isagi Y (2009) Shaping of genetic structure alongPleistocene and modern river systems in the hydrochorous riparianazalea, Rhododendron ripense (Ericaceae). Am JBot 96:1532–1543
Körner C (2007) The use of ‘altitude’ in ecological research. Trends EcolEvol 22:569–574
Lee C-Y, Liew P-M (2009) Late Quaternary vegetation and climatechanges inferred from a pollen record of Dongyuan lake in southernTaiwan. Palaeogeo Palaeoclim Palaeoecol 287:58–66
Lenoir J, Gégout JC, Marquet PA, de Ruffray P, Brisse H (2008) Asignificant upward shift in plant species optimum elevation duringthe 20th century. Science 320:1768–1771
Levin DA (2012)Mating system shifts on the trailing edge. Ann Bot 109:613–620
Li H-L, Lu S-Y, Yang Y-P, Tseng Y-H (1998) Ericaceae. In: EditorialCommittee of the Flora of Taiwan (ed) Flora of Taiwan, vol 4, 2ndedn. Taipei, Taiwan, pp 17–39
Liew P-M, Chung N-J (2001) Vertical migration of forests during the lastglacial period in subtropical Taiwan. West Pac Earth Sci 1:405–414
Liew P-M, Kuo C-M, Huang S-Y (1998) Vegetation change and terres-trial carbon storage of eastern Asia during the last glacial maximumas indicated by new pollen records of northern Taiwan. Global PlantChange 16:85–94
Liew P-M, Huang S-Y, Kuo C-M (2006) Pollen stratigraphy, vegetationand environment of the last glacial and Holocene-A record fromToushe Basin, central Taiwan. Quat Internl 147:16–33
Mäkinen HS, Shikano T, Cano JM, Merilä J (2008) Hitchhiking mappingreveals a candidate genomic region for natural selection in three-spined Stickleback chromosome VIII. Genetics 178:453–465
Marriage TN, Hudman S, Mort ME, Orive ME, Shaw RG, Kelly JK(2009) Direct estimation of the mutation rate at dinucleotide micro-satellite loci in Arabidopsis thaliana (Brassicaceae). Heredity 103:310–317
Marshall DL, Avritt JJ, Maliakal-Witt S, Medeiros JS, Shaner MGM(2010) The impact of plant and flower age on mating patterns.Ann Bot 105:7–22
Nosil P, Egan SP, Funk DJ (2008) Heterogeneous genomic differentiationbetween walking-stick ecotypes: ‘isolation by adaptation’ and mul-tiple roles for divergent selection. Evolution 62:316–336
Nybom H (2004) Comparison of different nuclear DNA markers forestimating intraspecific genetic diversity in plants. Mol Ecol 13:1143–1155
Ohsawa T, Ide Y (2008) Global patterns of genetic variation in plantspecies along vertical and horizontal gradients onmountains. GlobalEcol Biogeogr 17:152–163
Ono A, Dohzono I, Sugawara T (2008) Bumblebee pollination andreproductive biology of Rhododendron semibarbatum (Ericaceae).J Plant Res 121:319–327
Parisod C, Joost S (2010) Divergent selection in trailing- versus leading-edge populations of Biscutella laevigata. Ann Bot 105:655–660
Pascual M, Chapuis MP, Mestres F, Balanyá J, Huey RB, Gilchrist GW,Serra L, Estoup A (2007) Introduction history of Drosophila
subobscura in the New World: a microsatellite based survey usingABC methods. Mol Ecol 16:3069–3083
Pearson G, Lago-Leston A, Mota C (2009) Frayed at the edges: selectivepressure and adaptive response to abiotic stressors are mismatchedin low diversity edge populations. J Ecol 97:450–462
Peery MZ, Kirby R, Reid BN, Stoelting R, Doucet-Bëer E, Robinson S,Vásquez-Carrillo C, Pauli JN, Palsbøll PJ (2012) Reliability ofgenetic bottleneck tests for detecting recent population declines.Mol Ecol 21:3403–3418
Piry S, Luikart G, Cornuet JM (1999) BOTTLENECK: A computerprogram for detecting recent reductions in the effective populationsize using allele frequency data. J Hered 90:502–503
Pritchard JK, Stephens M, Donnelly P (2000) Inference of populationstructure using multilocus genotype data. Genetics 155:945–959
Quiroga MP, Premoli AC (2007) Genetic patterns in Podocarpusparlatorei reveal the long-term persistence of cold-tolerant elementsin the southern Yungas. J Biogeogr 34:447–455
Rannala B, Mountain JL (1997) Detecting immigration by usingmultilocus genotypes. Proc Natl Acad Sci U S A 94:9197–9201
Raymond M, Rousset F (1995) Genepop (version 1.2): Population ge-netics software for exact tests and ecumenicism. J Hered 86:248–249
Rosenberg NA (2004) DISTRUCT: a program for the graphical displayof population structure. Mol Ecol Notes 4:137–138
Savolainen O, Kujala ST, Sokol C, Pyhäjärvi T, Avia K, Knürr T,Kärkkäinen K, Hicks S (2011) Adaptive potential of northernmosttree populations to climate change, with emphasis on Scots pine(Pinus sylvestris L.). J Hered 102:526–536
Schluter D (2000) The ecology of adaptive radiation. Oxford UniversityPress, Oxford
Thuiller E, Albert C, Araujo M, Berry P, Cabeza M, Guisan A, Hickler T,Midgley G, Paterson J, Schurr F (2008) Predicting global changeimpacts on plant species’ distributions: Future challenges. Pers PlantEcol Evol System 9:137–152
Tsukada M (1966) Late Pleistocene vegetation and climate in Taiwan(Formosa). Proc Natl Acad Sci U S A 55:543–548
Van Oosterhout C, HutchinsonWF, Wills DPM, Peter S (2004) MICRO-CHECKER: software for identifying and correcting genotypingerrors in microsatellite data. Mol Ecol Notes 4:535–538
Vernoud V, Horton AC, Yang ZB, Nielsen E (2003) Analysis of the smallGTPase gene superfamily of Arabidopsis. Plant Physiol 131:1191–1208
Vitalis R, Dawson K, Boursot P (2001) Interpretation of variation acrossmarker loci as evidence of selection. Genetics 158:1811–1823
Vitalis R, Dawson K, Boursot P, Belkhir K (2003) DetSel 1.0: A com-puter program to detect markers responding to selection. J Hered 94:429–431
Wiens J, Graham C (2005) Niche conservatism: Integrating evolution,ecology, and conservation biology. Annu Rev Ecol Evol Syst 36:519–539
Woollard AD, Moore I (2008) The functions of Rab GTPases in plantmembrane traffic. Curr Opin Plant Biol 11:1–10
Zhang L, Tian LH, Zhao JF, Song Y, Zhang CJ, Guo Y (2009) Identifi-cation of an apoplastic protein involved in the initial phase of saltstress response in rice root by two-dimensional electrophoresis.Plant Physiol 149:916–928
126 Tree Genetics & Genomes (2014) 10:111–126
Copyright © 2022 FDOKUMEN


![The Rhododendron [serial] - Internet Archive](https://static.fdokumen.com/doc/165x107/63237b81117b4414ec0c57ee/the-rhododendron-serial-internet-archive.jpg)