selected physical and aerodynamic properties of nerica
14
Journal of Agricultural Engineering and Technology (JAET), Volume 22 (No.3) September, 2014 Nigerian Institution of Agricultural Engineers © www.niae.net 47 SELECTED PHYSICAL AND AERODYNAMIC PROPERTIES OF NERICA P. C. Eze and S. I. Oluka Department of Agricultural and Bioresource Engineering Enugu State University of Science and Technology, Enugu, Nigeria. [email protected], [email protected] ABSTRACT Some physical and aerodynamic properties of NERICA (New Rice for Africa) were studied at varying moisture contents of 13%, 17%, and 20% (w.b). Four varieties of NERICA namely; FARO 44, FARO 51, FARO 52 and FARO 57 were selected to represent the different size ranges common to NERICA. The physical properties of NERICA such as shape, size, volume, moisture contents, bulk density, weights, surface area, aspect ratio and sphericity were obtained through physical measurement of the grains samples of each of the four varieties using vernier caliper, electronic weighing balance and electric oven. A locally constructed air velocity measuring rig was used to determine the terminal velocities of the NERICA seeds and husks. The other aerodynamic properties such as drag force, drag coefficient and Reynolds number were calculated from terminal velocity relationship. Results indicate that FARO 57 recorded highest value of size range of 3.924mm to 4.019mm, while FARO 44 recorded the lowest size characteristic range of 3.653mm to 3.858mm all at 13%, 17% and 20% moisture contents. These indicate that NERICA grains have wide size ranges and no single sample of the grains can effectively represent the other. The average terminal velocity was found to range from 0.4943m/s to 0.8886m/s, 0.5325m/s to 0.9655m/s and 0.6315m/s to 1.0355m/s at 13%, 17% and 20% moisture contents respectively for the seeds and the terminal velocities of the husks ranges from 0.0975m/s to 0.2588m/s, 0.1143m/s to 0.2969m/s and 0.1254m/s to 0.2991m/s at 13%, 17% and 20% moisture contents respectively . The terminal velocity increases with increase in size. Therefore the optimum air velocity necessary for effective separation of the husks from its mixture with the seeds after threshing was found to fall within the range of 0.2888m/s < Vt < 0.0975m/s at 13% (w.b), 0.2969m/s < Vt < 0.1143m/s at 17% (w.b) and 0.2991m/s < Vt < 0.1284m/s at 20% (w.b). This indicates that optimum separation can be achieved effectively without any loss of the seeds if the results obtained are properly applied. KEYWORDS: NERICA, aerodynamic, drag force, reynolds number, physical properties. 1. INTRODUCTION The term NER the successful crossing of the two species of cultivated rice, the African rice (O.glaberrima steud) and the Asian rice (O. Sativa L.), to produce progeny that combine the best traits of both parents, (WARDA, 2008). The increasing economic importance of food materials, together with the complexity of modern technology for their production, handling, storage, processing preservation, quality evaluation, distribution, marketing and utilization, demands comprehensive information on physical properties of these materials. Information on physical and aerodynamic properties of agricultural products is needed in the design and adjustments of machines used during harvesting, separating, cleaning, and handling and storing of agricultural materials and converting them into food, feed and fodder. The properties which are useful during machine designs need to be known and these properties must be determined at laboratory conditions (Gursoy and Guzel, 2010). Therefore for the purpose of machine designs, properties such as size, shape, volume, surface area, weights, density, porosity, angle of repose, coefficient of friction are of prime importance. These properties influence the design and evaluation of rice processing including drying, husking, whitening and polishing as well as grading machines, storage and grain moving equipment (Mehdi et al, 2007). For example, the knowledge of the coefficient of friction of paddy or cowpea on the equipment wall and on the silo wall surface are necessaries and fundamentals for a rational and safe design of grain handling equipment, processing and storage (Mohsenin, 1986; Milani;1993).
-
Upload
khangminh22 -
Category
Documents
-
view
0 -
download
0
Transcript of selected physical and aerodynamic properties of nerica
Journal of Agricultural Engineering and Technology (JAET), Volume 22 (No.3) September, 2014
Nigerian Institution of Agricultural Engineers © www.niae.net 47
SELECTED PHYSICAL AND AERODYNAMIC PROPERTIES OF NERICA P. C. Eze and S. I. Oluka
Department of Agricultural and Bioresource Engineering Enugu State University of Science and Technology, Enugu, Nigeria.
[email protected], [email protected] ABSTRACT Some physical and aerodynamic properties of NERICA (New Rice for Africa) were studied at varying moisture contents of 13%, 17%, and 20% (w.b). Four varieties of NERICA namely; FARO 44, FARO 51, FARO 52 and FARO 57 were selected to represent the different size ranges common to NERICA. The physical properties of NERICA such as shape, size, volume, moisture contents, bulk density, weights, surface area, aspect ratio and sphericity were obtained through physical measurement of the grains samples of each of the four varieties using vernier caliper, electronic weighing balance and electric oven. A locally constructed air velocity measuring rig was used to determine the terminal velocities of the NERICA seeds and husks. The other aerodynamic properties such as drag force, drag coefficient and Reynolds number were calculated from terminal velocity relationship. Results indicate that FARO 57 recorded highest value of size range of 3.924mm to 4.019mm, while FARO 44 recorded the lowest size characteristic range of 3.653mm to 3.858mm all at 13%, 17% and 20% moisture contents. These indicate that NERICA grains have wide size ranges and no single sample of the grains can effectively represent the other. The average terminal velocity was found to range from 0.4943m/s to 0.8886m/s, 0.5325m/s to 0.9655m/s and 0.6315m/s to 1.0355m/s at 13%, 17% and 20% moisture contents respectively for the seeds and the terminal velocities of the husks ranges from 0.0975m/s to 0.2588m/s, 0.1143m/s to 0.2969m/s and 0.1254m/s to 0.2991m/s at 13%, 17% and 20% moisture contents respectively . The terminal velocity increases with increase in size. Therefore the optimum air velocity necessary for effective separation of the husks from its mixture with the seeds after threshing was found to fall within the range of 0.2888m/s < Vt < 0.0975m/s at 13% (w.b), 0.2969m/s < Vt < 0.1143m/s at 17% (w.b) and 0.2991m/s < Vt < 0.1284m/s at 20% (w.b). This indicates that optimum separation can be achieved effectively without any loss of the seeds if the results obtained are properly applied. KEYWORDS: NERICA, aerodynamic, drag force, reynolds number, physical properties. 1. INTRODUCTION The term NERthe successful crossing of the two species of cultivated rice, the African rice (O.glaberrima steud) and the Asian rice (O. Sativa L.), to produce progeny that combine the best traits of both parents, (WARDA, 2008). The increasing economic importance of food materials, together with the complexity of modern technology for their production, handling, storage, processing preservation, quality evaluation, distribution, marketing and utilization, demands comprehensive information on physical properties of these materials. Information on physical and aerodynamic properties of agricultural products is needed in the design and adjustments of machines used during harvesting, separating, cleaning, and handling and storing of agricultural materials and converting them into food, feed and fodder. The properties which are useful during machine designs need to be known and these properties must be determined at laboratory conditions (Gursoy and Guzel, 2010). Therefore for the purpose of machine designs, properties such as size, shape, volume, surface area, weights, density, porosity, angle of repose, coefficient of friction are of prime importance. These properties influence the design and evaluation of rice processing including drying, husking, whitening and polishing as well as grading machines, storage and grain moving equipment (Mehdi et al, 2007). For example, the knowledge of the coefficient of friction of paddy or cowpea on the equipment wall and on the silo wall surface are necessaries and fundamentals for a rational and safe design of grain handling equipment, processing and storage (Mohsenin, 1986; Milani;1993).
Journal of Agricultural Engineering and Technology (JAET), Volume 22 (No.3) September, 2014
Nigerian Institution of Agricultural Engineers © www.niae.net 48
The terminal velocity and drag coefficient are the most important aerodynamic properties, which should be known for pneumatic conveying, separation, cleaning, harvesting and drying of agricultural products. The terminal velocity at which the particles are suspended stationary in vertical air stream can be determined by using different methods. These methods are free-fall, vertical air tunnel and elutriator method (Mohsenin, 1980; Grift et al; 1997, Gursoy and Guzel, 2010). The terminal velocity of grains can be calculated by using the equations developed theoretically as well as laboratory studies. A few methods Song and Litchfield, 1991). The value of aerodynamic drag coefficient, which is used for determining the aerodynamic drag force (Fd), acting upon a particle moving through air depends upon particle characteristics (mass, projected area, shape and terminal velocity) as well as the conditions of airflow (Gursoy and Guzel, 2010). The projected areas and drag coefficient of agricultural grains changed because of irregular shape and contains the variation of positions. In studies carried out, the projected area and drag coefficient of grains were usually determined Hawk et al, 1966). The objective of this study is to determine some useful data on the physical and aerodynamic properties of NERICA grains that will influence the design of a cost effective machine or equipment that can contribute to improving the efficiency or performance of existing equipment for processing and general handling of grains. The main objectives are to determine some physical properties of NERICA grains to develop appropriate technologies in design and adjustment of machines used during harvesting, separating, cleaning, handling and storage and convert them into food, feed and fodder and to determine the aerodynamic properties such as, terminal velocity and drag coefficient which is important in pneumatic conveying, separating and cleaning machines for the vital processing of rice grains for effective results. 2. MATERIALS AND METHOD The research materials include four varieties of NERICA grains, namely; FARO 44, FARO 51, FARO 52 and FARO 57. These varieties were obtained from the Ebonyi State Agricultural Development Program (EBADEP) at average moisture of 13% (dry base). The grains were hydrated to obtain three more different moisture content levels at which the tests were conducted. A total of 1000 grains were used for the experiments. These samples were taken to the Enugu State University of Science and Technology for the physical and aerodynamic tests in the Agricultural and
2.1 Test Apparatus The test apparatus used to carry out this research work include a vernier caliper of 0.01mm sensitivity used to measure the major diameter, minor diameter and the thickness of the grains; a metler Toledo electronic weighing balance of model XP 204 and 0.0001g sensitivity, used for weight measurement; an electric oven of model OP 100 by the LTE Scientific Ltd, used to determine the moisture content of the grains and a well constructed Air velocity measuring rig was used for the aerodynamic test. 2.2 Description of the Air Velocity Measuring Rig An air velocity measuring rig was locally constructed for the determination of terminal velocity of the NERICA varieties at different moisture contents. The air velocity measuring rig was constructed with sheets of metal, plexiglass and has a total size of 90 x 120cm (Fig. 1). It operates with a geared electric motor of 3 horse power of triple phase with average maximum speed of 1400/2 rpm. The seed sample used to be placed on the mesh screen in the vertical tube made of plexiglass where observation is usually carried out.

Journal of Agricultural Engineering and Technology (JAET), Volume 22 (No.3) September, 2014
Nigerian Institution of Agricultural Engineers © www.niae.net 49
The fan blades are six in number to allow maximum flow of air to the vertical tunnel. These blades were made of metal sheets and the sizes are 12 x 20cm each. The belt connection system between the shaft connecting the blower and motor is called secondary belting system. Comprises of two belts; one for the connection of blower shaft and the connecting shaft at the center between the blower shaft and the electric motor, while the second belt connects the electric motor and the center shaft. This system is to allow adequate speed of the blower for a determined air velocity. The machine worked appropriately in the determination of terminal velocity of NERICA with a reasonable experimental data determined.
Fig. 1. Air Velocity Rig 2.3 Experimental Procedure for Physical Properties of NERICA Grains i) Determination of Size and Shape The vernier caliper was used to measure the three dimensions (major diameter, minor diameter and thickness) of the grains selected randomly from each variety of three different moisture content levels. The results of the measurements (the reading obtained) were used to evaluate the size of the grains using the following equation. Size = - - - - - - - - (3.1) a is the major diameter, b is the minor diameter and c is the thickness. The shapes of the grains were assumed to approximate to a sphere. The sphericity was therefore used to determine the shape (Mohsenin, 1986). The sphericity, which is a measure of how close a material is to being spherical, was calculated using the following equation. - - - - - - - - - - - (3.2) Where; S is the sphericity, a, is the major diameter, b is the minor diameter and c is the thickness. Measurements were replicated twenty times.
Journal of Agricultural Engineering and Technology (JAET), Volume 22 (No.3) September, 2014
Nigerian Institution of Agricultural Engineers © www.niae.net 50
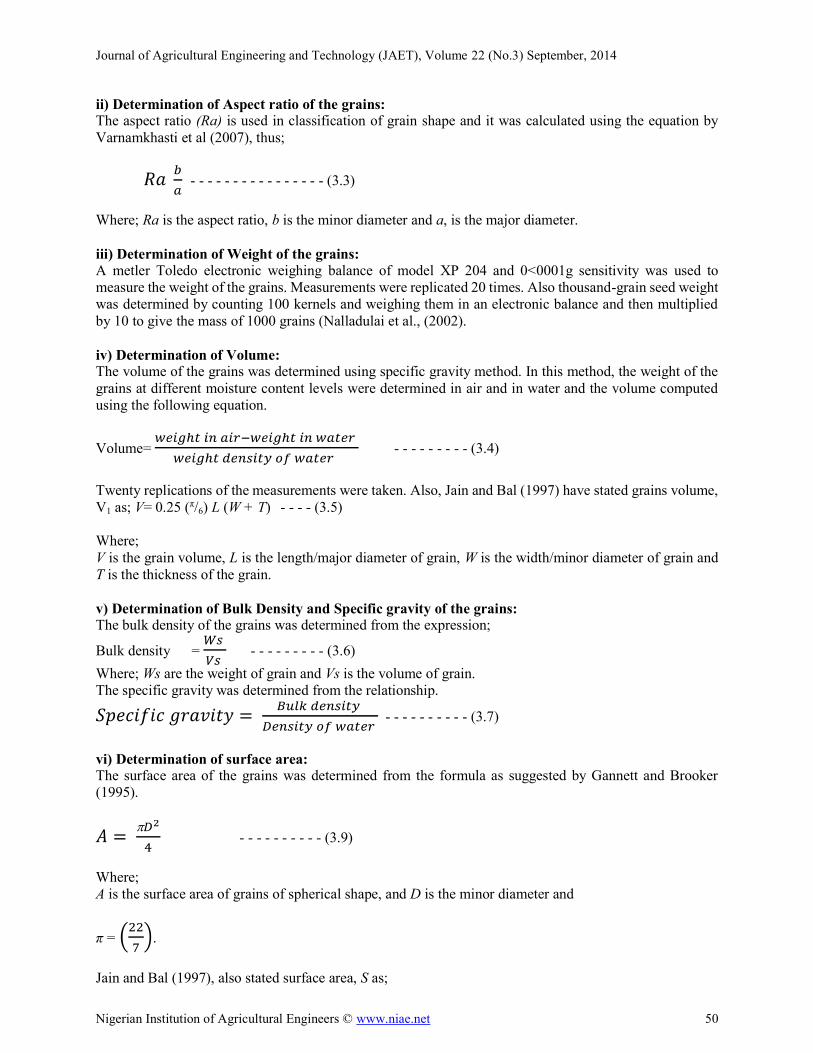
ii) Determination of Aspect ratio of the grains: The aspect ratio (Ra) is used in classification of grain shape and it was calculated using the equation by Varnamkhasti et al (2007), thus; - - - - - - - - - - - - - - - - (3.3) Where; Ra is the aspect ratio, b is the minor diameter and a, is the major diameter. iii) Determination of Weight of the grains: A metler Toledo electronic weighing balance of model XP 204 and 0<0001g sensitivity was used to measure the weight of the grains. Measurements were replicated 20 times. Also thousand-grain seed weight was determined by counting 100 kernels and weighing them in an electronic balance and then multiplied by 10 to give the mass of 1000 grains (Nalladulai et al., (2002). iv) Determination of Volume: The volume of the grains was determined using specific gravity method. In this method, the weight of the grains at different moisture content levels were determined in air and in water and the volume computed using the following equation. Volume= - - - - - - - - - (3.4) Twenty replications of the measurements were taken. Also, Jain and Bal (1997) have stated grains volume, V1 as; V= 0.25 ( /6) L (W + T) - - - - (3.5) Where; V is the grain volume, L is the length/major diameter of grain, W is the width/minor diameter of grain and T is the thickness of the grain. v) Determination of Bulk Density and Specific gravity of the grains: The bulk density of the grains was determined from the expression; Bulk density = - - - - - - - - - (3.6) Where; Ws are the weight of grain and Vs is the volume of grain. The specific gravity was determined from the relationship.
- - - - - - - - - - (3.7) vi) Determination of surface area: The surface area of the grains was determined from the formula as suggested by Gannett and Brooker (1995).
- - - - - - - - - - (3.9) Where; A is the surface area of grains of spherical shape, and D is the minor diameter and
= . Jain and Bal (1997), also stated surface area, S as;
Journal of Agricultural Engineering and Technology (JAET), Volume 22 (No.3) September, 2014
Nigerian Institution of Agricultural Engineers © www.niae.net 51
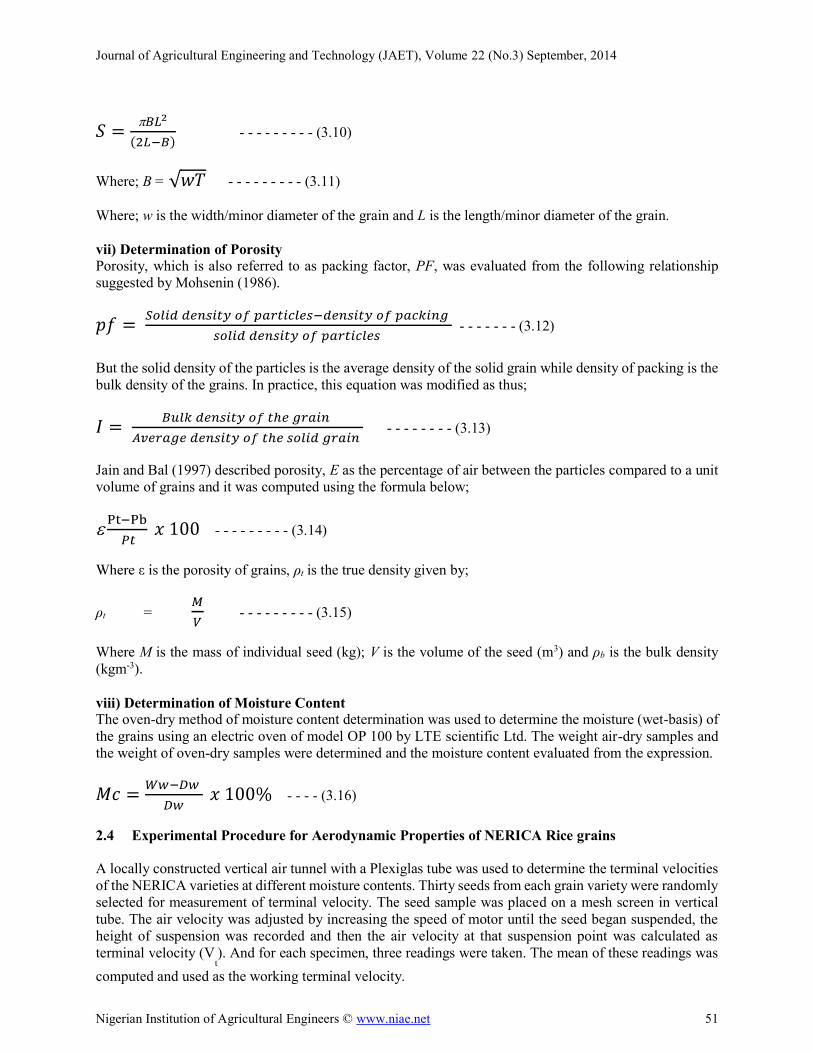
- - - - - - - - - (3.10) Where; B = - - - - - - - - - (3.11) Where; w is the width/minor diameter of the grain and L is the length/minor diameter of the grain. vii) Determination of Porosity Porosity, which is also referred to as packing factor, PF, was evaluated from the following relationship suggested by Mohsenin (1986).
- - - - - - - (3.12) But the solid density of the particles is the average density of the solid grain while density of packing is the bulk density of the grains. In practice, this equation was modified as thus;
- - - - - - - - (3.13) Jain and Bal (1997) described porosity, E as the percentage of air between the particles compared to a unit volume of grains and it was computed using the formula below;
- - - - - - - - - (3.14)
t is the true density given by;
t = - - - - - - - - - (3.15) Where M is the mass of individual seed (kg); V is the volume of the seed (m3) and b is the bulk density (kgm-3). viii) Determination of Moisture Content The oven-dry method of moisture content determination was used to determine the moisture (wet-basis) of the grains using an electric oven of model OP 100 by LTE scientific Ltd. The weight air-dry samples and the weight of oven-dry samples were determined and the moisture content evaluated from the expression.
- - - - (3.16) 2.4 Experimental Procedure for Aerodynamic Properties of NERICA Rice grains A locally constructed vertical air tunnel with a Plexiglas tube was used to determine the terminal velocities of the NERICA varieties at different moisture contents. Thirty seeds from each grain variety were randomly selected for measurement of terminal velocity. The seed sample was placed on a mesh screen in vertical tube. The air velocity was adjusted by increasing the speed of motor until the seed began suspended, the height of suspension was recorded and then the air velocity at that suspension point was calculated as terminal velocity (Vt). And for each specimen, three readings were taken. The mean of these readings was computed and used as the working terminal velocity.
Journal of Agricultural Engineering and Technology (JAET), Volume 22 (No.3) September, 2014
Nigerian Institution of Agricultural Engineers © www.niae.net 52
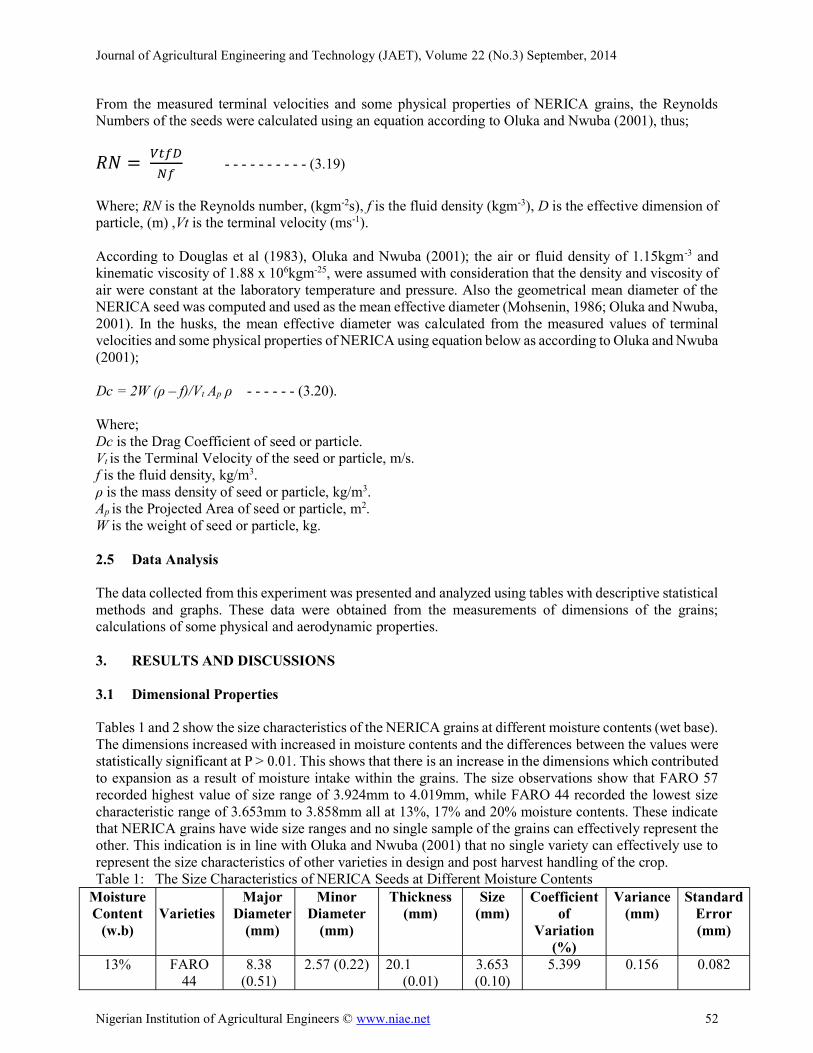
From the measured terminal velocities and some physical properties of NERICA grains, the Reynolds Numbers of the seeds were calculated using an equation according to Oluka and Nwuba (2001), thus;
- - - - - - - - - - (3.19) Where; RN is the Reynolds number, (kgm-2s), f is the fluid density (kgm-3), D is the effective dimension of particle, (m) ,Vt is the terminal velocity (ms-1). According to Douglas et al (1983), Oluka and Nwuba (2001); the air or fluid density of 1.15kgm-3 and kinematic viscosity of 1.88 x 10⁶kgm-25, were assumed with consideration that the density and viscosity of air were constant at the laboratory temperature and pressure. Also the geometrical mean diameter of the NERICA seed was computed and used as the mean effective diameter (Mohsenin, 1986; Oluka and Nwuba, 2001). In the husks, the mean effective diameter was calculated from the measured values of terminal velocities and some physical properties of NERICA using equation below as according to Oluka and Nwuba (2001);
f)/Vt Ap - - - - - - (3.20). Where; Dc is the Drag Coefficient of seed or particle. Vt is the Terminal Velocity of the seed or particle, m/s. f is the fluid density, kg/m3. is the mass density of seed or particle, kg/m3.
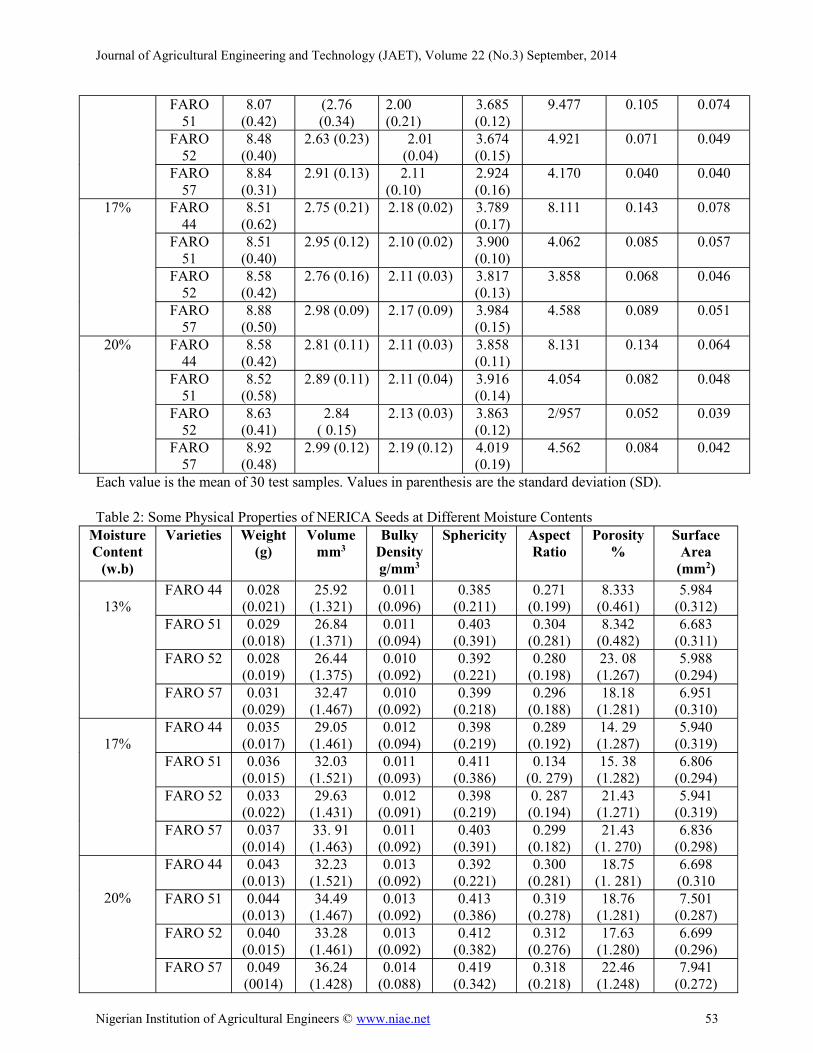
Ap is the Projected Area of seed or particle, m2. W is the weight of seed or particle, kg. 2.5 Data Analysis The data collected from this experiment was presented and analyzed using tables with descriptive statistical methods and graphs. These data were obtained from the measurements of dimensions of the grains; calculations of some physical and aerodynamic properties. 3. RESULTS AND DISCUSSIONS 3.1 Dimensional Properties Tables 1 and 2 show the size characteristics of the NERICA grains at different moisture contents (wet base). The dimensions increased with increased in moisture contents and the differences between the values were
buted to expansion as a result of moisture intake within the grains. The size observations show that FARO 57 recorded highest value of size range of 3.924mm to 4.019mm, while FARO 44 recorded the lowest size characteristic range of 3.653mm to 3.858mm all at 13%, 17% and 20% moisture contents. These indicate that NERICA grains have wide size ranges and no single sample of the grains can effectively represent the other. This indication is in line with Oluka and Nwuba (2001) that no single variety can effectively use to represent the size characteristics of other varieties in design and post harvest handling of the crop. Table 1: The Size Characteristics of NERICA Seeds at Different Moisture Contents
Moisture Content
(w.b)
Varieties Major
Diameter (mm)
Minor Diameter
(mm) Thickness
(mm) Size
(mm) Coefficient
of Variation
(%)
Variance (mm)
Standard Error (mm)
13% FARO 44
8.38 (0.51)
2.57 (0.22) 20.1 (0.01)
3.653 (0.10)
5.399 0.156 0.082
Journal of Agricultural Engineering and Technology (JAET), Volume 22 (No.3) September, 2014
Nigerian Institution of Agricultural Engineers © www.niae.net 53
FARO 51
8.07 (0.42)
(2.76 (0.34)
2.00 (0.21)
3.685 (0.12)
9.477 0.105 0.074FARO
52 8.48
(0.40) 2.63 (0.23) 2.01
(0.04) 3.674 (0.15)
4.921 0.071 0.049 FARO
57 8.84
(0.31) 2.91 (0.13) 2.11
(0.10) 2.924 (0.16)
4.170 0.040 0.040 17% FARO
44 8.51
(0.62) 2.75 (0.21) 2.18 (0.02) 3.789
(0.17) 8.111 0.143 0.078
FARO 51
8.51 (0.40)
2.95 (0.12) 2.10 (0.02) 3.900 (0.10)
4.062 0.085 0.057 FARO
52 8.58
(0.42) 2.76 (0.16) 2.11 (0.03) 3.817
(0.13) 3.858 0.068 0.046
FARO 57
8.88 (0.50)
2.98 (0.09) 2.17 (0.09) 3.984 (0.15)
4.588 0.089 0.051 20% FARO
44 8.58
(0.42) 2.81 (0.11) 2.11 (0.03) 3.858
(0.11) 8.131 0.134 0.064
FARO 51
8.52 (0.58)
2.89 (0.11) 2.11 (0.04) 3.916 (0.14)
4.054 0.082 0.048 FARO
52 8.63
(0.41) 2.84
( 0.15) 2.13 (0.03) 3.863
(0.12) 2/957 0.052 0.039
FARO 57
8.92 (0.48)
2.99 (0.12) 2.19 (0.12) 4.019 (0.19)
4.562 0.084 0.042 Each value is the mean of 30 test samples. Values in parenthesis are the standard deviation (SD). Table 2: Some Physical Properties of NERICA Seeds at Different Moisture Contents
Moisture Content
(w.b) Varieties Weight
(g) Volume
mm3 Bulky
Density g/mm3
Sphericity Aspect Ratio
Porosity %
Surface Area
(mm2)
13% FARO 44 0.028
(0.021) 25.92
(1.321) 0.011
(0.096) 0.385
(0.211) 0.271
(0.199) 8.333
(0.461) 5.984
(0.312) FARO 51 0.029
(0.018) 26.84
(1.371) 0.011
(0.094) 0.403
(0.391) 0.304
(0.281) 8.342
(0.482) 6.683
(0.311) FARO 52 0.028
(0.019) 26.44
(1.375) 0.010
(0.092) 0.392
(0.221) 0.280
(0.198) 23. 08 (1.267)
5.988 (0.294)
FARO 57 0.031 (0.029)
32.47 (1.467)
0.010 (0.092)
0.399 (0.218)
0.296 (0.188)
18.18 (1.281)
6.951 (0.310)
17%
FARO 44 0.035 (0.017)
29.05 (1.461)
0.012 (0.094)
0.398 (0.219)
0.289 (0.192)
14. 29 (1.287)
5.940 (0.319)
FARO 51 0.036 (0.015)
32.03 (1.521)
0.011 (0.093)
0.411 (0.386)
0.134 (0. 279)
15. 38 (1.282)
6.806 (0.294)
FARO 52 0.033 (0.022)
29.63 (1.431)
0.012 (0.091)
0.398 (0.219)
0. 287 (0.194)
21.43 (1.271)
5.941 (0.319)
FARO 57 0.037 (0.014)
33. 91 (1.463)
0.011 (0.092)
0.403 (0.391)
0.299 (0.182)
21.43 (1. 270)
6.836 (0.298)
20% FARO 44 0.043
(0.013) 32.23
(1.521) 0.013
(0.092) 0.392
(0.221) 0.300
(0.281) 18.75
(1. 281) 6.698 (0.310
FARO 51 0.044 (0.013)
34.49 (1.467)
0.013 (0.092)
0.413 (0.386)
0.319 (0.278)
18.76 (1.281)
7.501 (0.287)
FARO 52 0.040 (0.015)
33.28 (1.461)
0.013 (0.092)
0.412 (0.382)
0.312 (0.276)
17.63 (1.280)
6.699 (0.296)
FARO 57 0.049 (0014)
36.24 (1.428)
0.014 (0.088)
0.419 (0.342)
0.318 (0.218)
22.46 (1.248)
7.941 (0.272)
Journal of Agricultural Engineering and Technology (JAET), Volume 22 (No.3) September, 2014
Nigerian Institution of Agricultural Engineers © www.niae.net 54
Each value is the mean of 30 test samples. Values in parenthesis are the standard deviation (SD) Table 3: Terminal Velocity of Four Varieties of NERICA Seeds and Husks at Different Moisture Contents
Variety Moisture Content
FARO 44
FARO 51
FARO 52
FARO 57
At 13 % (w.b) Seeds ---------- Husks ---------
0.4943 (0.124) 0.0975 (0.024)
0.6235 (0.136) 0.1975 (0.029)
0.5325 (0.126) 0.1643 (0.025)
0.8886 (0.139) 0.2888 (0.072)
At 17 % (w.b) Seeds ---------- Husks ----------
0.5325 (0.126) 0.1143 (0.021)
0.7055 (0.137) 0.1992 (0.029)
0.6714 (0.137) 0.1788 (0.026)
0.9655 (0.201) 0.2969 (0.073)
At 20 % (w.b) Seeds ---------- Husks ----------
0.6315 (0.136) 0.1284 (0.023)
0.8356 (0.138) 0.1999 (0.029)
0.7311 (0.142) 0.1881 (0.028)
1.0355 (0.221) 0.2991 (0.026)
Each value is the mean of 20 test samples. Values in parenthesis are the standard deviation (SD) Table 4: Reynolds Numbers of Four Varieties of NERICA Seeds and Husks at Different Moisture Contents
Variety Moisture Content
FARO 44
FARO 51
FARO 52
FARO 57
At 13 % (w.b) Seeds ------------ Husks -----------
671.11 (169.03) 255.20 (63.80)
664.68 (221.56) 217.69 (72.56)
684.89 (136.98) 256.60 (51.32)
737.64 (184.41) 212.98 (53.29)
At 17 % (w.b) Seeds ------------ Husks------------
436.31 (109.08) 191.03 (63.68)
450.86 (112.72) 193.71 (64.57)
439.02 (146.34) 207.50 (41.50)
471.01 (109.08) 184.78 (61.59)
At 20 % (w.b) Seeds ------------ Husks------------
440.78 (110.20) 171.68 (42.92)
438.58 (87.716) 167.13 (41.78)
436.02 (109.08) 179.21 (59.74)
455.57 (113.74) 165.74 (55.25)
Each value is the mean of 30 test samples. Values in parenthesis are the standard deviation (SD). Table 5: Drag Coefficients of Four Varieties of NERICA Seeds and Husks at Different Moisture Contents
Variety Moisture Content
FARO 44
FARO 51
FARO 52
FARO 57
At 13 % (w.b) Seeds ----------------- Husks ----------------
6.2689 (1.567) 1.3379 (0.334)
7.7368 (1.934) 2.2468 (0.562)
5.9861 (1.497) 1.2671 (0.422)
8.9712 (2.243) 3.1421 (0.786)
At 17 % (w.b) Seeds ---------------- Husks ----------------
13.1693 (2.634) 4.3012 (0.860)
11.8705 (2.374) 3.1342 (0.784)
10.6914 (2.138) 3.1221 (0.781)
14.2577 (3.564) 4.4681 (1.117)
At 20 % (w.b) Seeds ---------------- Husks ---------------
18.4327 (4.608) 5.8161 (1.454)
18.3257 (4.581) 5.8671 (1.467)
18.6772 (4.669) 4.9231 (0.985)
21.7278 (5.432) 5.2349 (1.309)
Each value is the mean of 20 test samples. Values in parenthesis are the standard deviation (SD)
Journal of Agricultural Engineering and Technology (JAET), Volume 22 (No.3) September, 2014
Nigerian Institution of Agricultural Engineers © www.niae.net 55
Journal of Agricultural Engineering and Technology (JAET), Volume 22 (No.3) September, 2014
Nigerian Institution of Agricultural Engineers © www.niae.net 56
3.2 Sphericity The sphericity of NERICA grains in Table 2 increased with increased in moisture content, indicating that
reased. FARO 57 recorded highest value of sphericity of range from 0.399 to 0.419, while FARO 44 recorded lowest sphericity value of range from 0.385 to 0.392 all at 13%, 17% and 20% moisture contents. This indicates that relative proportional changes occurred in the dimensions of the NERICA grain samples. 3.3 Volume The NERICA grain volume increased with the increased of moisture content in Table 2. The volume increased from 25.92 mm3 to 32.47 mm3, 29.05mm3 to 33.91 mm3 and 32.23 mm3 to 36.24 mm3 all at 13%, 17% and 20% moisture contents respectively. This increase in volume may be attributed to expansion in size dimensions which was as a result of weight increase of the grains that resulted to the displacement of more liquid (Mohsenin, 1986). 3.4 Bulk Density In Table 2, the bulk density of NERICA paddy varies slightly from 0.010 g/mm3 at 13% moisture content to 0.013 g/mm3 at 20% moisture content. This result indicates a slight change in the bulk density with an
3.5 Surface Area
Journal of Agricultural Engineering and Technology (JAET), Volume 22 (No.3) September, 2014
Nigerian Institution of Agricultural Engineers © www.niae.net 57
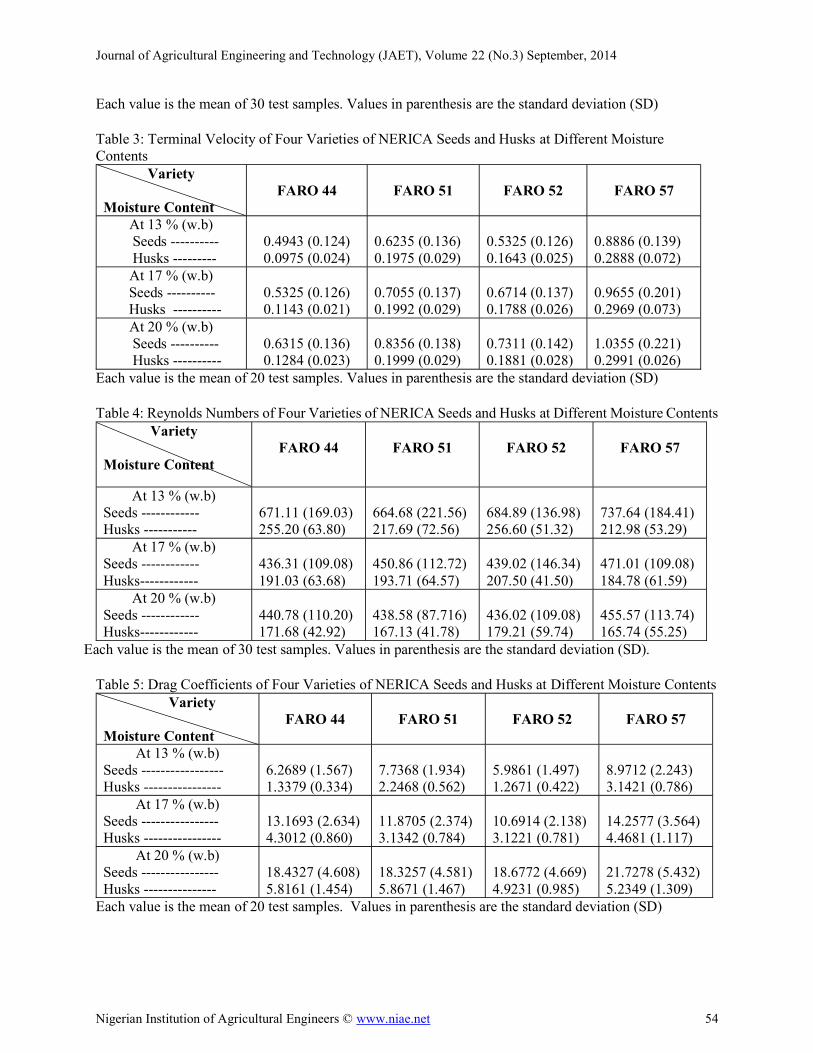
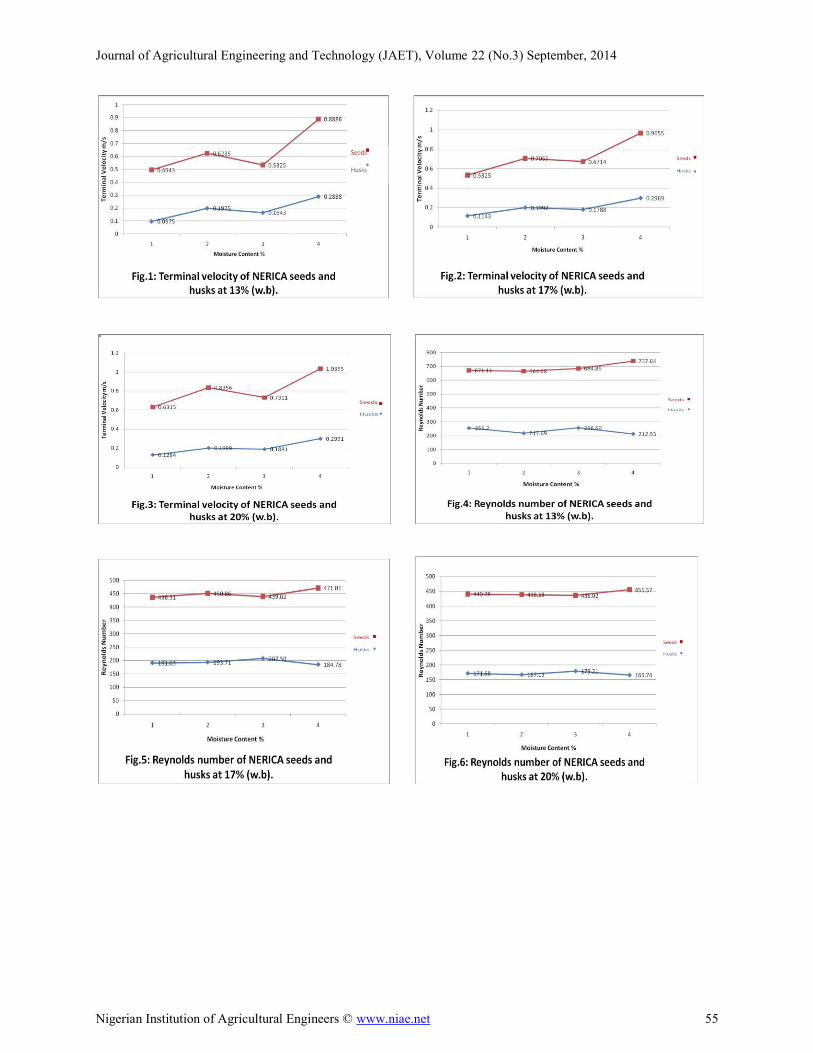
In Table 2, the surface area of the NERICA paddy increased from 5.984 mm2 to 7.941 mm2 when the increase in the values may be attributed to their dependence on the size dimensions of the NERICA paddy which can be linked to Oluka and Nwuba (2001) report for Cowpeas. 3.6 Aerodynamic Properties Tables 3 to 5 and Figures 1 to 9 represent the aerodynamic properties of NERICA seeds and husks at three (13%, 17% and 20%) moisture contents and showed a significant effect on aerodynamic properties. In Table 3 which contains the terminal velocities, FARO 57 variety recorded the highest terminal velocities of 0.8886m/s, 0.9655m/s and 1.0355m/s at 13%, 17% and 20% moisture contents respectively, while FARO 44 variety recorded the lowest terminal velocities of 0.4943m/s, 0.5325m/s and 0.6315m/s at 13%, 17% and 20% moisture contents respectively for NERICA seeds. In the case of the NERICA husks, FARO 57 also recorded the highest terminal velocities of 0.2888m/s, 0.2969m/s and 0.2991m/s at 13%, 17% and 20% moisture contents respectively, while FARO 44 also maintains the lowest value of 0.0975m/s, 0.1143m/s and 0.1284m/s at 13%, 17% and 20% moisture contents respectively. These results reveal that the sizes of the NERICA seeds and husks influence their terminal velocities, noting that the terminal velocities of the NERICA seeds and husks increase with increase in the sizes of the seeds and husks and moisture contents. Also it is observable from the results in Table 3 that the terminal velocities of the NERICA seeds and husks differ reasonably, showing that a thorough pneumatic separation of seeds from the mixture of seeds and husks is possible. It could be concluded from the results that with the terminal velocity ranges of 0.4943m/s to 0.8886m/s at 13% (w.b) 0.5325m/s to 0.9655m/s at 17% (w.b) and 0.6315m/s to 1.0355m/s at 20% (w.b) for the seeds, and 0.0975m/s to 0.2888m/s at 13% (w.b), 0.1143m/s to 0.2969m/s at 17% (w.b) and 0.1284m/s to 0.2991m/s at 20% (w.b) for the husks, that good separation of the husks from the seeds could be achieved at the air velocities of 0.2888m/s < Vt < 0.0975m/s at 13% (w.b), 0.2969m/s < Vt < 0.1143m/s at 17% (w.b) and 0.2991m/s < Vt < 0.1284m/s at 20% (w.b) without any loss of the seeds. The result was in accordance
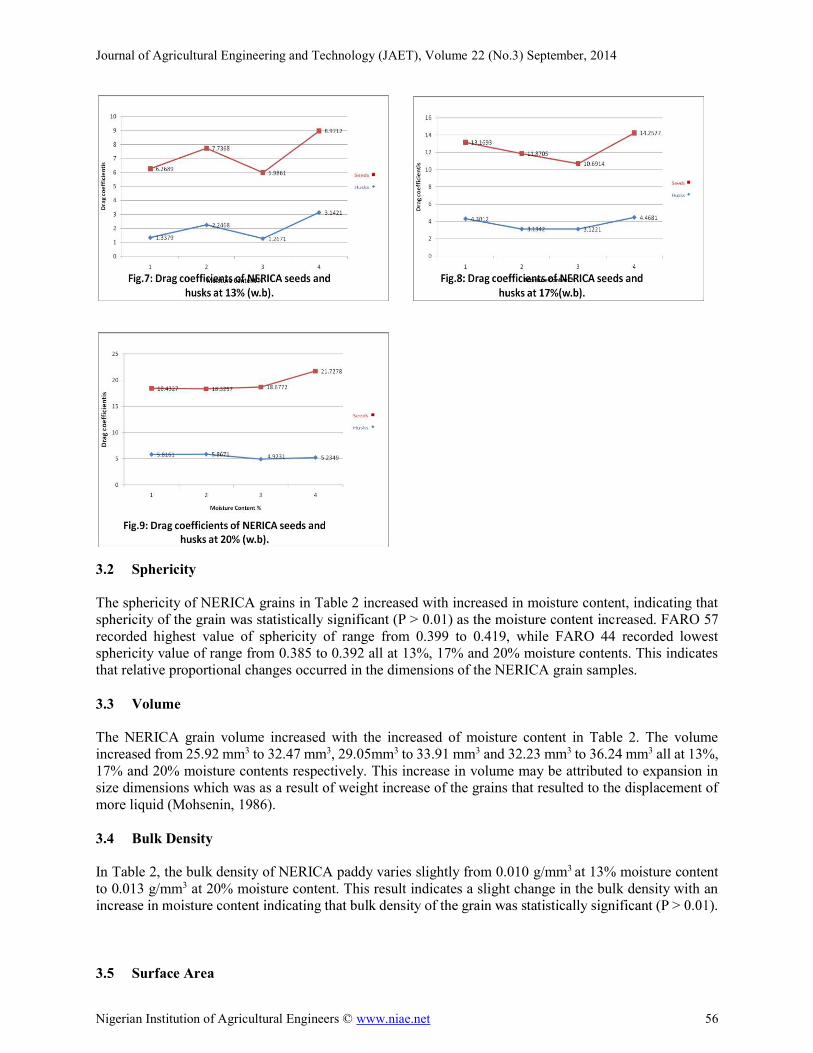
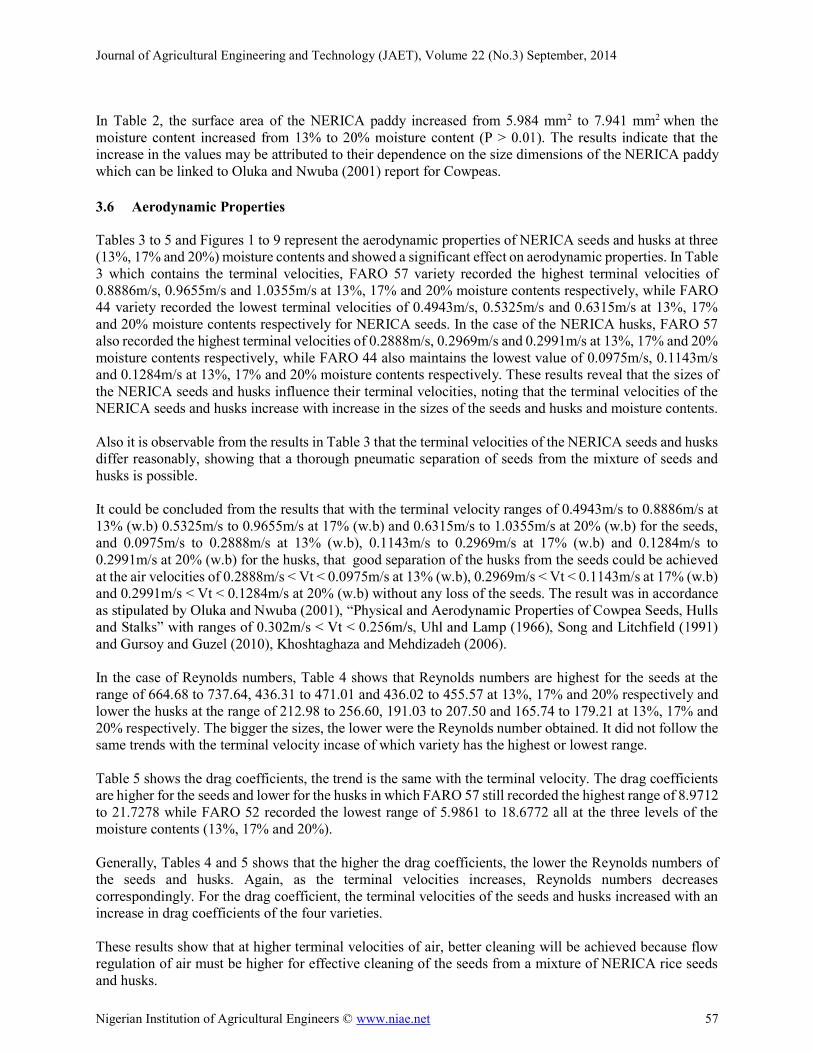
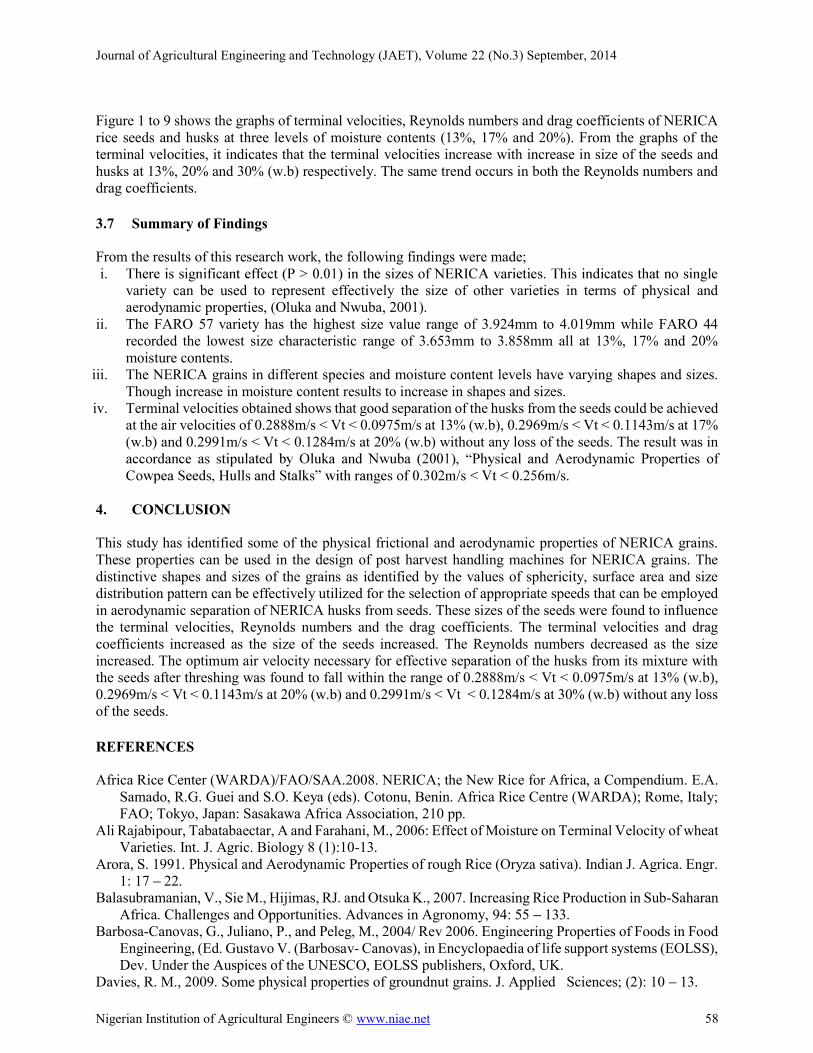
and Gursoy and Guzel (2010), Khoshtaghaza and Mehdizadeh (2006). In the case of Reynolds numbers, Table 4 shows that Reynolds numbers are highest for the seeds at the range of 664.68 to 737.64, 436.31 to 471.01 and 436.02 to 455.57 at 13%, 17% and 20% respectively and lower the husks at the range of 212.98 to 256.60, 191.03 to 207.50 and 165.74 to 179.21 at 13%, 17% and 20% respectively. The bigger the sizes, the lower were the Reynolds number obtained. It did not follow the same trends with the terminal velocity incase of which variety has the highest or lowest range. Table 5 shows the drag coefficients, the trend is the same with the terminal velocity. The drag coefficients are higher for the seeds and lower for the husks in which FARO 57 still recorded the highest range of 8.9712 to 21.7278 while FARO 52 recorded the lowest range of 5.9861 to 18.6772 all at the three levels of the moisture contents (13%, 17% and 20%). Generally, Tables 4 and 5 shows that the higher the drag coefficients, the lower the Reynolds numbers of the seeds and husks. Again, as the terminal velocities increases, Reynolds numbers decreases correspondingly. For the drag coefficient, the terminal velocities of the seeds and husks increased with an increase in drag coefficients of the four varieties. These results show that at higher terminal velocities of air, better cleaning will be achieved because flow regulation of air must be higher for effective cleaning of the seeds from a mixture of NERICA rice seeds and husks.
Journal of Agricultural Engineering and Technology (JAET), Volume 22 (No.3) September, 2014
Nigerian Institution of Agricultural Engineers © www.niae.net 58
Figure 1 to 9 shows the graphs of terminal velocities, Reynolds numbers and drag coefficients of NERICA rice seeds and husks at three levels of moisture contents (13%, 17% and 20%). From the graphs of the terminal velocities, it indicates that the terminal velocities increase with increase in size of the seeds and husks at 13%, 20% and 30% (w.b) respectively. The same trend occurs in both the Reynolds numbers and drag coefficients. 3.7 Summary of Findings From the results of this research work, the following findings were made; i.
variety can be used to represent effectively the size of other varieties in terms of physical and aerodynamic properties, (Oluka and Nwuba, 2001).
ii. The FARO 57 variety has the highest size value range of 3.924mm to 4.019mm while FARO 44 recorded the lowest size characteristic range of 3.653mm to 3.858mm all at 13%, 17% and 20% moisture contents.
iii. The NERICA grains in different species and moisture content levels have varying shapes and sizes. Though increase in moisture content results to increase in shapes and sizes.
iv. Terminal velocities obtained shows that good separation of the husks from the seeds could be achieved at the air velocities of 0.2888m/s < Vt < 0.0975m/s at 13% (w.b), 0.2969m/s < Vt < 0.1143m/s at 17% (w.b) and 0.2991m/s < Vt < 0.1284m/s at 20% (w.b) without any loss of the seeds. The result was in
erodynamic Properties of
4. CONCLUSION This study has identified some of the physical frictional and aerodynamic properties of NERICA grains. These properties can be used in the design of post harvest handling machines for NERICA grains. The distinctive shapes and sizes of the grains as identified by the values of sphericity, surface area and size distribution pattern can be effectively utilized for the selection of appropriate speeds that can be employed in aerodynamic separation of NERICA husks from seeds. These sizes of the seeds were found to influence the terminal velocities, Reynolds numbers and the drag coefficients. The terminal velocities and drag coefficients increased as the size of the seeds increased. The Reynolds numbers decreased as the size increased. The optimum air velocity necessary for effective separation of the husks from its mixture with the seeds after threshing was found to fall within the range of 0.2888m/s < Vt < 0.0975m/s at 13% (w.b), 0.2969m/s < Vt < 0.1143m/s at 20% (w.b) and 0.2991m/s < Vt < 0.1284m/s at 30% (w.b) without any loss of the seeds. REFERENCES Africa Rice Center (WARDA)/FAO/SAA.2008. NERICA; the New Rice for Africa, a Compendium. E.A.
Samado, R.G. Guei and S.O. Keya (eds). Cotonu, Benin. Africa Rice Centre (WARDA); Rome, Italy; FAO; Tokyo, Japan: Sasakawa Africa Association, 210 pp.
Ali Rajabipour, Tabatabaectar, A and Farahani, M., 2006: Effect of Moisture on Terminal Velocity of wheat Varieties. Int. J. Agric. Biology 8 (1):10-13.
Arora, S. 1991. Physical and Aerodynamic Properties of rough Rice (Oryza sativa). Indian J. Agrica. Engr. 1: 17 22.
Balasubramanian, V., Sie M., Hijimas, RJ. and Otsuka K., 2007. Increasing Rice Production in Sub-Saharan Africa. Challenges and Opportunities. Advances in Agronomy, 94: 55 133.
Barbosa-Canovas, G., Juliano, P., and Peleg, M., 2004/ Rev 2006. Engineering Properties of Foods in Food Engineering, (Ed. Gustavo V. (Barbosav- Canovas), in Encyclopaedia of life support systems (EOLSS), Dev. Under the Auspices of the UNESCO, EOLSS publishers, Oxford, UK.
Davies, R. M., 2009. Some physical properties of groundnut grains. J. Applied Sciences; (2): 10 13.
Journal of Agricultural Engineering and Technology (JAET), Volume 22 (No.3) September, 2014
Nigerian Institution of Agricultural Engineers © www.niae.net 59
Dingkuhn, M., Jones, M., Johnson, D., and Sow, A., 1998. Growth and Yield Potential of Oryza sativa and O. glaberrima upland rice cultivars and their Interspecific Progenies. Field Crops Research, 57: 57 69.
Enwerem, N.J. 1998. Food of Plant Origin, Processing and Utilization with recipes and Technology Profile. Afro-Orbia Publication Ltd., pp: 107 114.
Fagade, S.O., 2000. Yield gaps and Production decline in Rice Production in Nigeria. Paper Presented at the Expert Consultation on Yield gap and Production decline in Rice, 5 7, Sept.2000. FAO, Rome, Italy, pp: 15.
Ganett, R.E. and Brooker, D.B., 1995. Aerodynamic Drag of Farm Grains. Trans of the ASAE, 8 (1): 49 52.
traw Materials. J. Agric. Engr. Res., 46: 275 290.
Grift, T.E. Walker, J.T. and Hotstee, J.W. 1997. Aerodynamic Properties of Individual Fertilizer particles. Trans ASAE, 40 (1): 13 20.
Gursoy, S. and Guzel, E., 2010. Determination of Physical Properties of some agricultural grains. J. Applied Sciences, 2 (5): 492 498.
Hawk, A. L., Broker, D.B. and Cassidy, J.J, 1966. Aerodynamic Characteristics of Selected Farm Grains. Trans ASAE, 9 (1): 48 51.
Jain, R.K. and Bal, S., 1997. Properties of Pearl Millet. J. Agric Engr. Research, 60; 85 91. Jones, M.P., 1998(b). Food Security and major Technological Challenges: the case of rice in sub-Saharan
Africa. Japanese J. Crop Sciences, 67, extra issue 2. Jones, M.P., Dingkuhn, M., Aluko, G.K. and Semon, M., (1997(a). Diversity and Potential of Oryza
glabberima Steud, in upland rice breeding. Breeding Sciences, 47: 395 398, Karababa, E., 2006. Physical Properties of Popcorn Kernel. J. Food Engr., 72: 100 107. Kheiralipour, K., Karimi, M., Tabataectar, A., Naderi M., Khoubakht, G. and Heidarbeigi, K., 2008.
Moisture Depend Physical Properties of Wheat (Triticum Aestirum L.) J. Agric. Tech., 4(1): 53 64. Mehdi, G.V. Hossein, M., Ali, J., Shahin, R., Mohsen, H., and Kamran, K., 2007. Some Engineering
Properties of paddy (var. Sazandegi). Intl. J. Agric & Biology, 9 (5): 763 766. Milani, A.P., 1993. Determination of the Stored Products Properties for Silo Pressures and Design.
Doctorate in Structure Engineering, Engr. Sch. Of Soa Carlos. Univ. of Sao Paulo, Sao Carlos, Brazil. Mohapatra, D. Bal S., 2004. Wear of Rice in an abrasive Milling Operation, Part 2: Prediction of bulk
Temperature rice. Bio-systems Engr., 89: 101 108. Mohapatra, D., and Bal, S., 2007. Effect of degree of milling on specific energy consumption, optical
measurements and cooking quality of rice. J. Food Engr., 80 119 125. Mohsenin, N.N., 1986. Physical Properties of Plant and Animal Materials, 2nd edition. Gordo and Breach
Science Publishers, New York. Nalladullai, K., Alagusundaram, K., and Gayathri, P., 2002. Airflow resistance of Paddy and its by
products. Bio-systems Engr., 83: 67 75. Oduma, I., 2008. Physical and Mechanical Properties of Sorghum Grains, (sorghum vulgar). M. Eng.
Thesis, Agricultural and Bioresource Engineering, ESUT. Oluka, S.I. and Nwuba E.I.U., 2001. Physical and Aerodynamic Properties of Cowpea Seeds, Hulls and
Stalks. JEAS, 1: 35 43. Omobuwajo, T.O., Akanda, E.A., and Sanni, L.A., 1999. Selected Physical, Mechnical and Aerodynamic
Properties of African Breadfruit (Trecullia Africana) Seeds. J. Food Engr., 40: 241 244. Shitanda, D., Nishiyama, Y. and Koide, S., 2001. Performance Analysis of an Impeller Husker considering
the Physical and Mechanical Properties of Paddy Rice. J. Agric. Engr., 79: 195 203. Somado, E.A., and Berhe, T., 2008. Harvest and Post-Harvest Operations of NERICA Rice. Contribution
to NERICA Rice Compendium, WARDA, 2008. Song, H., and Litchfield, J.B., 1991. Predicting Method of Terminal Velocity for Grains. Trans. ASAE, 34
(1). Stroshine, R., 1998. Physical Properties of Agricultural materials and Food Products, Purdue University
Publishers, Indiana, USA. WARDA,2008

Journal of Agricultural Engineering and Technology (JAET), Volume 22 (No.3) September, 2014
Nigerian Institution of Agricultural Engineers © www.niae.net 60