ARROW-WING SUPERSONICCRUISEAIRCRAFT ...
488
NASA CR-i32575-4 • z m E I-- = _ _=L_ ___ I- i ! L !- SUBSTANTIATING DATA FOR ARROW-WING SUPERSONIC CRUISE AIRCRAFT STRUCTURALDESIGN CONCEPTSEVALUATION Volume 4, Sections 15 through 21 (N ASA-CR- 13257 5-_) aRROW-WING SUPERSONIC CRUISE AIRCRAFT STRUCTURAL DESIGN CONCEPTS EVA_UATION. VOLUME 4: SECTIONS 15 THROUGH 21 (Lockheed-California Co.) 430 p HC _11.75 CSCL 0 1C G3/05 by I. F. Sakata and G. W. Davis N76-28222 Unclas 46765 ! ! I L Prepared under Contract No, NAS1-12288 Lockheed-California Company Burbank, California for Langley Research Center NATIONAL AERONAUTICSAND SPACE ADMINISTRATION k ,' . "J/; ,,4 R.ECE/VEI) E.t • _-_ST' p,_,,_ _ '.v:U_ #,,s:,.__"T_ _lr F
-
Upload
khangminh22 -
Category
Documents
-
view
0 -
download
0
Transcript of ARROW-WING SUPERSONICCRUISEAIRCRAFT ...

NASA CR-i32575-4
• z
m
E
I--
= _
_=L_ ___
I-i!
L!-
SUBSTANTIATING DATA FOR
ARROW-WING SUPERSONICCRUISE AIRCRAFT
STRUCTURALDESIGN CONCEPTSEVALUATION
Volume 4, Sections 15 through 21
(NASA-CR- 13257 5-_) aRROW-WING SUPERSONIC
CRUISE AIRCRAFT STRUCTURAL DESIGN CONCEPTS
EVA_UATION. VOLUME 4: SECTIONS 15 THROUGH
21 (Lockheed-California Co.) 430 p HC_11.75 CSCL 0 1C G3/05
by
I. F. Sakata and G. W. Davis
N76-28222
Unclas
46765
!!
I
L
Prepared under Contract No, NAS1-12288
Lockheed-California Company
Burbank, California
for Langley Research Center
NATIONAL AERONAUTICSAND SPACE ADMINISTRATION
k ,'
. "J/;
,,4R.ECE/VEI) E.t• _-_ST' p,_,,_ _'.v:U_ #,,s:,.__"T_ _lr
F


Seczion
i
2
3
4
5
6
TABLE OF CONTENTS
Volume i
Summary
Introduction
Acknowledgement
Structural Design Concepts
Baseline Configuration
Aerodynamics
Structural Design Criteria
Structural Design Loads
Structural Temperatures
iii
V
xi
i-i
2-1
3-1
_-!
5-1
6-1
7
8
9
lO
ll
Volume 2
Materials and Producibility
Basic Design Parameters
Structural Analysis Models
Vibration and Flutter
Point Design Environment
7-1
8-1
9-1
I0-i
ii-i
12
13
14
Volume 3
Structural Concept Analysis
Fatigue and Fail-Safe Analysis
Acoustics
12-1
13-I
14-1
15
16
17
18
19
20
21
Volume h
Mass Analysis
Production Costs
Concept Evaluation and Selection
Design
Propulsion-Airframe Integration
Advanced Technology Assessment
Design Methodology
15-I
16-1
17-1
18-1
19-1
20-i
21-1
i
m3 lxi£1 .=


Em
E
SUMMARY
An analytical study was performed to determine the structural approach best
suited for the design of a Mach 2.7 arrow-wing supersonic cruise aircraft.
Results, procedures, and principal justification of results are presented
in Reference 1. Detailed substantiation data are given herein. In general,
each major analysis is presented sequentially in separate sections to pro-
vide continuity in the flow of the design concepts analysis effort. In
addition to the design concepts evaluation and the detailed engineering
design analyses, supporting tasks encompassing: (1) the controls system
development (2) the propulsion-airframe integration study, and (3) the
advanced technology assessment are presented.
Reference 1Sakata, I. F. and Davis, G. W. : Evaluation of Structural Design
Conce_ts for an Arrow-Wing Supersonic Cruise Aircraft NASACR- 1976
iii


mmm_F
L
E
E
INTRODUCTION
The design of an economically viable supersonic cruise aircraft requires
reduced sfructural mass fractions attainable through application of new
materials, advanced concepts and design tools. Configurations, such as
the arrow-wlng, show promise from the aerodynamic standpoint; however,
detailed structural design studies are needed to determine the feasibility
of constructing this type of aircraft with sufficiently low structural mass
fraction.
For the past several years, the NASA Langley Research Center has been
pursuing a supersonic cruise aircraft research program (i) to provide
an expanded technology base for future supersonic aircraft, (2) to pro-
vide the data needed to assess the environmental and economic impacts on
the United States of present and especially future foreign supersonic
cruise aircraft, and (3) to provide a sound technical basis for any future
consideration that may be given by the United States to the development of
an environmentally acceptable and economically viable commercial supersonic
cruise aircraft.
The analytical study, reported herein, was performed to provide data to
support the selection of the best structural concept for the design of a
supersonic cruise aircraft wing and fuselage primary structure considering
near-term start-of-design technology. A spectrum of structural approaches
for primary structure design that has found application or had been proposed
for supersonic aircraft design; such as the Anglo-French Concorde supersonic
transport, the Mach 3.0-plus Locaheed F-12 and the proposed Lockheed L-2000
and Boeing B-2707 supersonic transports were systematically evaluated for
the given configuration and environmental criteria.
The study objectives were achieved through a systematic program involving
th_ interactions between the various disciplines as shown in Figures A through
C. These figures present an overview of the study effort and provides a
summary statement of work, as follows:
(i) Task I - Analytical Design Studies (Figure A).- This initial
task involved a study wherein a large number of candidate structure
v
PRECEDING PAGE BLUE NOT
concepts were investigated and subjected to a systematic evaluation
process to determine the most promising concepts. An airplane
configuration refinement investigation, including propulsion-airframe
integration study were concurrently performed.
(2) Task II - Engineering Design/Analyses (Figure B).- The most
promising concepts were analyzed assuming near-term start-of-design
technology, critical design conditions and requirements identified,
and construction details and mass estimates determined for the
Final Design airplane. Concurrently, the impact of advanced tech-
nology on supersonic cruise aircraft design was explored.
(3) Task III- Mass Sensitivity Studies (Figure C).- Starting with
the Final Design airplane numerous sensitivity studies were performed.
The results of these investigations and the design studies (Task I
and Task II) identified opportunities for structural mass reduction
and needed research and technology to achieve the objectives of
reduced structural mass.
Displayed on the figures are the time-sequence and flow of data between dis-
ciplines and the reason for the make-up of the series of sections presented
in this report. The various sections are independent of each other, except as
specifically noted. Results of this structural evaluation are reported in
Reference 1. This reference also includes the procedures and principal Justi-
fication of results, whereas this report gives detailed substantiation of the
results in Reference 1. This report is bound as four separate volumes.
vi

vO
I--I
a_
l
,.--4
+__>_
vii

<--Z(z)
u.C:] :D_ "'z_r_
_O_T
z
C_
A O 0
o0o
u.i ,.,I_JOu. rr
o
_ -
IlL
Z
et-_
_8
w Z
0
8
_s
8
2 ,.,-c0o ,.,.._,,___ .... J _8
,_u.i,-rzZU.OmOn,..
0
_Zlu, J
,<>.0O_.1OZ"r
1-!O
u.I
Z<(>
,<
,.,,]
@
,<
b0
[,t
@
b_
.,4
b0
_4
_0
viii

Q.t
,el
4_U_
.el
_5
Z_.1
n
Z _
ix


=_
E
ACKNOWLEDGEMENT
This investigation was conducted under NASA Contract No. NAS!-12288, Study
of Structural Design Concepts for an Arrow-Wing Supersonic Transport Con-
figuration. The study was performed within the Science andEngineering
Branch of the Lockheed-California Company, Burbank, California, with the
participation of the Lockheed-Georgia Company in a composite design subcon-
tract effort. I. F. Sakata was the Project Engineer, and G.W. Davis was
_he Lead Engineer. The other contributors to the program are acknowledged
at each section.
Mr. J. C. Robinson of the Design Concepts Section, Thermal Structures Branch,
and Dr. E. C. Yates, Jr., Computer Aided Methods Branch, Structures and
Dynamics Division, NASA Langley Research Center, Hampton, Virginia, were the
Technical Representative of the Contracting Officer (TRCO), and Alternate
TRCO, respectively for the project.
PRECEDING PAG_ BLANK NOT
xi


SECTION 15
MASS ANALYSIS
by
R.N. Jensen and R.D. Mijares


CONTENTS
Section
INTRODUCTION
Page
15-1
BASELINE CONFIGURATION MASS DATA 15-1
Airplane Mass Properties - Task I 15-1
Airplane Mass Properties - Task II 15-10
Weight Comparison Data 15-14
Detail Wing and Body Weights 15-14
STRUCTURAL MODEL MASS DATA 15-17
Grid Point Distribution - Task I 15-17
Grid Point Distribution - Task IIA 15-17
Grid Point Distribution - Task liB (Strength/Stiffness) 15-27
STRUCTURAL CONCEPT MASS ANALYSIS 15-39
Met hod 15- 39
WING STRUCTURE MASS - INITIAL SCREENING 15-39
Chordwise Stiffened Design Concepts 15-44
Spanwise Stiffened Design Concepts 15-_8
Monocoque Design Concepts 15-50
WING STRUCTURE MASS - DETAILED CONCEPT ANALYSIS 15-50
Chordwise Stiffened Wing Design 15-52
Spanwise Stiffened Wing Design 15-58
Monocoque Wing Design 15-62
Composite Reinforced - Chordwise Stiffened Wing Design 15-75
Wing Tip Mass for Structural Arrangements 15-57
Wing Tip Mass Distribution Comparison 15-85
15-i

CONTENTS(Continued)
Section
FUSELAGE STRUCTURE MASS - INITIAL SCREENING
FUSELAGE STRUCTURE DETAILED ANALYSIS
ASSET PROGRAM RESULTS _ - TASK I
FINAL DESIGN AIRPLANE MASS ESTIMATES
WING STRUCTURE MASS
Fuselage Structure Mass Estimates
REFERENCES
Page
15-85
15-91
15-96
15-96
15-100
15-101
15-111
15-ii

LIST OF FIGURES
L_
Figure
15-i
J_'_ 15-2
15-3
15-_
15-5
15-6
i5-7
15-8
i5-9
15-10
15-11
15-12
i5-13
15-!_
15-15
15-i6
15-17
15-18
15-19
15-20
Interior Arrangement - Task I
Interior Arrangement - Task II
Center of Gravity Diagram - Task I
Aircraft Moment of Inertia - Task II
Center of Gravity Diagram - Task II
Configuration Comparison - Task I and Task II
Surface Panel Thickness - Strength Design
Surface Panel Thickness - Final Design
Wing Mass Estimation Methodology
Fuselage Mass Estimation Methodology
Wing Box Areas - Task I
Optimum Panel Weights - Chordwise Stiffened Design
Component Weight Penalties for a Damaged Spar Cap
Chordwise Arrangement
Flutter Weight Increment Required Over StrengthDesign
Wing Structure Mass Estimate for Chordwise Stiff-
ened Design
Optimum Panel Weights - Spanwise Stiffened Design
Wing Structure Mass Estimate for Spanwise StiffenedDesign
Concept Weight Comparison - Monocoque Arrangement
Optimum Panel Weights - Monocoque Design (WeldedClosures)
Fail-Safe Critical Areas of Wing Structure
_g_____e
15-3
i5-5
15-9
15-12
15-13
i5-25
15-25
15-37
15-40
15-41
15-43
15-54
i5-56
15-57
15-59
i5-61
15-63
15-64
15-67
15-72
15-iii

LIST OF FIGURES Cont. )
Figure
15-21
15-22
15-23
15-24
15-25
15-26
15-27
15-28
15-29
15-30
15-31
15-32
15-35
Comparison of Optimum Panel Unit Weights - Composite
Reinforced Versus All-Metallic Chordwise Stiffened
Designs
Shear Thickness of Wing Tip Structure - Chordwise
Stiffened
Shear Thickness of Wing Tip Structure - Spanwise
Stiffened
Shear Thickness of Wing Tip Structure - Monocoque
Wing Tip Structure Planform Geometry - Task I
Comparison of SIC Mass Distribution - Task i and
Task II
Wing Tip Mass Distributions - Task I and Task II
Wing Tip Box Geometry - Task I and Task II
Body Geometry - Task I
Skin and Stiffener Unit Weights - Initial
Screening
Unit Weight for Closed Hat Stringer Design -
Detailed Concept Analysis
Final Design Airplane - Wing Structure Mass at
SIC Grid Point
Comparison of Inboard Wing Mass - Task !I
Final Design Airplane - Fuselage Shell Structure
Mass
Impact of Composite Reinforcements on Fuselage
Shell Structure Mass
15-79
15-82
15-83
15-84
15-86
15-87
15-88
15-89
15-90
15-93
15-9%
15-io3
15-Io5
15-106
15-109
15-iv

Table
15-1
15-2
15-3
15-4
15-5
15-6
15-7
15-8
15-9
15-10
15-11
15-12
15-13
15-14
15-15
15-16
15-17
15-18
15-19
15-20
LIST OF TABLES
Pag____e
Estimated Group Weight and Balance Statement - Task I 15-7
Airplane Mass Moment of Inertia - Task I 15-8
Estimated Group Weight and Balance Statement - Task II 15-11
Preliminary Group Weight Comparison 15-15
Estimated Weights for Wing and Body - Task I 15-16
Operating Weight Empty Distribution - Task I 15-18
Payload Distribution - Task 7 15-20
Fuel Distribution - Task I 15-21
Individual Component Weight Distribution - Task I 15-23
Moment of Inertia of Engine, Nacelle, and Propulsion
System - Task I 15o24
Moment of Inertia of Wing structure and Fuel - Task I 15-24
Airplane Geometric Parameters - Task I and Task II 15-26
Operating Weight Empty Distribution - Task IIB
Strength/Stiffness Design 15-28
Payload and Fuel Distribution - Task II
Strength/Stiffness Design (Lb/Side) 15-32
Individual Component Weight Distribution - Task IIB
Strength/Stiffness Design 15-34
Mass Data for Flutter Analysis - Task IIB 15-35
Final Mass Distribution - Strength vs
Strength/Stiffness Design 15-36
Fuel Distribution for Tank No. 16 - Strength vs
Strength/Stiffness Design 15-38
Moment of Inertia - Wing, Payload and Fuel - Task II 15-38
Moment of Inertia - Aileron and Outboard Flaperon 15-38
15-v

LIST OFTABLES-(Cont.)
Table
15-21
15-22
15-23
15-26
15-27
15-28
15-29
15-30
15-31
15-32
15-33
15-34
15-35
i5-36
15-37
15-38
15-39
Su_ary of Wing Mass - Initial Screening
Estimated Wing Mass - Chordwise Stiffened Concept -
Initial Screening 15-46
Estimated Wing Mass - Spanwise Stiffened Concept -
Initial Screening 15-49
Summary of Wing Mass - Detailed Concept Analysis 15-51
Panel Load and Unit Weight - Chordwise Stiffened
Design 15-53
Component Weight Derivation - Chordwise Stiffened
Design - Detailed Concept Analysis 15-55
Panel Load and Unit Weight - Spanwise Stiffened Design 15-60
Estimated Wing Mass - Monocoque Design Concept 15-65
Panel Load and Unit Weight - Monocoque Welded Design 15-66
Component Unit Weight Derivation - Monocoque Welded
Design 15-69
Estimated Wing Structure Mass - Monocoque (Welded)
Concept 15-70
Basic Unit Weight Data for Monocoque Concepts 15-71
Fail-Safe Weight Increment - Aft Box 15-73
Fail-Safe Weight Increment - Tip Box 15-74
Comparison of Composite Reinforced Designs 15-76
Detailed Weights for Composite Reinforced Designs -
Surface and Spar Caps 15-77
Detailed Weights for Composite Reinforced Designs -
Spar Caps Only 15-78
Component Weight Derivation - Composite Reinforced
Spar Caps Only 15-80
Component Weight Derivation - Composite Reinforced
Spar Caps and Surface 15-81
15-vi
L__
Table
15-22
15-_3
15-44
15-45
]5-L6
LIST OF TABLES (Cont.)
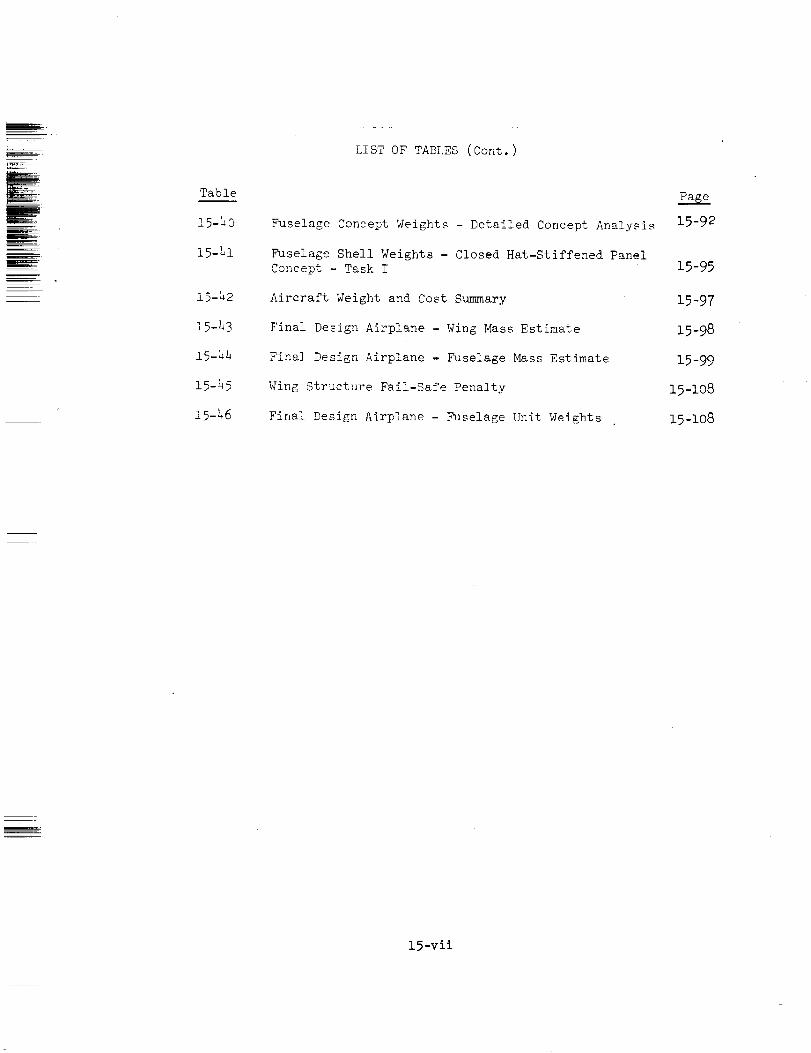
Fuselage Concept Weights - Detailed Concept Analysis
Fuselage Shell Weights - Closed Hat-Stiffened Panel
Concept - Task I 15-95
Aircraft Weight and Cost Summary 15-97
Final Design Airplane - Wing Mass Estimate 15-98
Final Design Airplane - Fuselage Mass Estimate 15-99
Wing Structure Fail-Safe Pena]ty 15-108
Final Design Airplane - Fuselage Unit Weights 15-108
15-vii


_z
SECTION 15
k
MASS ANALYSIS
INTRODUCTION
The analyses performed to provide structural mass estimates for the arrow-wing
supersonic cruise aircraft described in Section 2, are _resented in this
section.
To realize the full potential for structural mass reduction, a spectrum of approaches
for wing and fuselage primary structure design were investigated through analyses,
design studies, and detailed design:(1) to assess the relative merits of various
structural arrangements, concepts and materials (2) to select the structural
approach best suited for the Math 2.7 environment and (3) to provide construction
details and structural mass estimates based on in-depth structural design studies.
BASELINE CONFIGURATION MASS DATA
The interior arrangement of the baseline configuration concepts adopted for the
Task I and Task II studies are presented in Figures 15-1 and 15-2, respectively.
The dimensional and mass characteristics for the configurations are fully described
in Section 2. For completeness, however, the airplane mass property data are pre-
sented in the following sections along with a group weight comparison with the study
of Reference I.
Airplane Mass Properties - Task I
Estimated Group Weight and Balance Statement. - An Estimated Group Weight and Bal-
ance Statement is presented on Table 15-1 for the Baseline Configuration - Task I.
The airplane has a taxi mass of 340,000 kilograms (750,000 pounds), and a range of
7800 kilometers (4200 n. miles) with a payload of 22,000 kilograms (49,000 pounds).
This primarily titanium wing has a total planform area of 1,005 sq. meters and an
aspect ratio of 1.62. Its mass includes the center section carry-through structure
15-1

under the floor, aerodynamiccontrol surfaces and secondarystructure. Thehori-zontal stabilizer, and body mountedfin are all-movable. There are also fixed finsoutboard on the wing. Thebody is 90.5 meters long, andwill accommodate234pas-sengers in five (5) abreast seating. Theunder floor baggagecompartmentis locatedbetweenthe nose landi,ng gear and the wing carry-through structure.
The wing mounted main landing gear retracts into a well Just outboard of the body.
The axisymmetric inlets and duct-burning turbofan engines are under the wing with
the thrust reversers just aft of the wing trailing edge. The engines are sized to
provide a takeoff thrust to weight ratio of .36.
The mass estimates for the system and equipment reflect composite material applica-
tion. Standard and operating equipment includes the crew, unusable fuel, and pas-
senger service items.
Mass Moment of Inertia. - Airplane mass moments of inertia were dete_mined for the
aeroelastic studies. The data for takeoff gross weight, operational weight empty
and two intermediate flight conditions are summarized in Table 15-2.
Center of Gravity Travel. - The center of gravity travel is tailored to permit the
airplane to cruise with a minimum trim drag penalty. This is accomplished by
sequencing the fuel tanks. The forward body and forward wing tanks are used for
climbing and accelerating to cruise Mach number. The remaining wing tanks and mid-
body tanks are used during cruise. The last two body tanks contain the landing and
reserve fuel.
The interior is configured for 234 passengers in five (5) abreast seating with a
seat pitch of ,86 meters. The baggage is loaded aft of the nose landing gear.
Loadability studies indicate unrestricted passenger seating and small curve devia-
tion from the straight payload line. This is primarily due to the low passenger
mass to taxi mass fraction.
The fuel tank center of gravities are based on a fuel density of .803 kilogram/
liter. The usable fuel volumes are calculated on the basis of 90-percent of the
gross contour cross sectional area to allow for structure, systems and usable fuel.
The center of gravity travel shown in Figure 15-3 is used for the Task I Analytical
Design Studies. The results of the design, utability and control, and weight and
balance studies during Task I are reflected in a new travel diagram for the Engi-
neering Design Study of Task II.
15-2

m
m-
i;4
/ V"'-,........-Z :il
i'_ ." I__ i;,iI
i
_-\ /
i_./ l.... -7/?I
i ;+t?¢'
t_.j i i _r_""+'I+- . !
+ _r i 'lJ' =
I ti "_._k -iI- I,_s! -'r I
+h- t_+,v, +_,_
1 _t ,!
<% _ + L ;__7,i _++
r ,I_ i
,l
y _._,
+ }!'<,
'-- 7+_1 "°i
/
"h__ k i-
++


"_ o_
v
\\
_D
w__
o
_ Bk
_J
a_
H
r_


I
£
li ,il !-_


_o_ E_
I
o_
r_


! •
H
!
.<
F_
o
H
[0
I
rr
X
..J<F.-zoN
<
' I
,,n n- rr
g,2CI-
14J
Z
<
r_bJ
g_ N_
, , • . ,
0w
_ru_
o <o
d >I- <
ul _ iI.• o N
I
If
X<I-
.E
6"9
v
II
x
<
_u
.5
ip.
w
If N
ill
I °<[
PRECEDING PAGE BLANK NOT FILMEI_
ORIGINAL PAGE IS
OF POOR QU_
I_-7

TABLE 15-2. AIRPLANE _._SS MOMENT OF INERTIA - TASK i
WEIGHT WEIGHT X
CONDITION (LB) (iN)
TAKE OFF GROSS 750,000 2151
OPE R. EMPTY WT. 321,000 2301
INTERMEDIATE I 699,300 2177• ZERO FUEL" 370,000 2216
• FUEL (A) 329,300 2133
INTERMEDIATE 2 455,950 2212
• ZERO FUEL 370,000 2216
• FUEL (B) 85,950 2196
Z
(IN)
-141
-128
-155
-133
-128
-157
PITCH [ ROLL10 6 SLUGFT2
40.8 6.51 47.3
27.7 4.68 32.2
39.9 6.36 46.2
4.75 39.935.2
YAW
NOTES: (A) TANKS NOS. 2-5, 8-11 PLUS: 50 PERCENT OF NOS. 1, 6 & 7.
(B) TANKSNOS. 2&4 PLUS 50 PERCENT OFNOS. 3&5.
l 5-8

I ,
@// /J1 _11
®
VZ
o
v
o
° @u_r_
uJ0
0_
®
®vZ
I-
® ®
® ®Z
C_l (N ,-
8_ - SSVW
I I i I
ql -- SSVIN
co14'1
f,DI.n
_E
..JuJ>
n-l,->-I-
>
r,pLL0n"t,LII--Z
@,,,¢J
t,D'd"
@
E_
E_
I
4_.el>
%
o
%i1)
I
ll)
.,.-_
15-9

Airplane Mass Properties - Task II
Estimated Group Weight and Balance Statement. - The airplane weight and balance data
of Table 15-3 represent the various configurations evaluated during the Task II
effort. The data reflect the configuration refinements adopted to the NASA 15F con-
cept. All data are for a fixed sized aircraft with a takeoff gross mass of
3h0,000 kilograms (750,000 pounds) and payload of 22,000 kilograms (hg,000 pounds).
• Task IIA Configuration Data - The Task I weight data (Table 15-1) were
adjusted aft to reflect the effect of the configuration changes. The mass
of each item was assumed invariant. The taxi mass is at the 52-percent _C
and the zero fuel weight (ZFW) is at the 53.9-percent MAC.
• Task iIB Baseline Data - The data is representative of the configuration
changes adopted and the minimum mass wing and fuselage structural approach
selected for the Task II effort. The engines have been resized to reflect
an uninstalled sea level static thrust of 89,466 pounds per engine and
appropriate mass changes for the larger air induction system and nacelles
are indicated. The initial mass data does not include allowance for flutter
suppression. The taxi mass is 3h0,000 kilograms (750,000 pounds) with the
center of gravity located at the 52.5-percent MAC.
• Task IIB Final Data - The primary mass change is r_flected by the increase
in wing mass to include the requirements to suppress flutter. A trade off
with fuel (Tank No. 16) is made to achieve the ss/ne center of gravity loca-
tion as for the baseline data.
Mass Moment of Inertia. - Airplane mass moment of inertia were computed and plotted
in Figure 15-h. The data is similar to that shown in Table 15-2 for the Task I
airplane. The pitch moment of inertia is slightly less due to the shortened fuse-
lage while the roll moment of inertia is greater due to the heavier propulsion
packages. These data are used for the aeroelastic studies reported in Section 5
and I0.
Center of Gravity Travel. - The fuel management scheduling for airplane center of
gravity control is shown in Figure 15-5. The sequencing of fuel is planned
(I) to permit the airplane to cruise with a minimum of trim drag penalty and (2) to
maximize the heat sink capability of the fuel by emptying the outboard wing tanks as
early as possible in the mission.
15-i0

-- 7
HH
<E_
I
L_H
QE-_
H
Er_
!
Q
LU
z
I
iI
j
z_oO_N
_o
III
-_
-0
_O00o
i
!
/)
-r,.
I-Z
I_ (/)
id
n,-
o
_3I-
uJ0
-Iw
_L
N
!
:E
LU
II _"
U-u_
mZ_._-_•- _._ _"
o
u_

B"IO00L - J.HOFIM .L-iV_131:ll'9'
15-12

L
FUELTANK ARRANGEMENT
-J
50
PERCENT MAC
TANKS 1, 2, 3 & 4(ENGINE' FEED TANKS)
6O
56
57
58
61
PAYLOAD ,000 LB.)
OEW
-300 -200 -100 0 100 200 300 400
INDEX UNITS = W(ARM - 2223.7)1105
500
Figure 15-5. Center of Gravity Diagram - Task II
15 =13
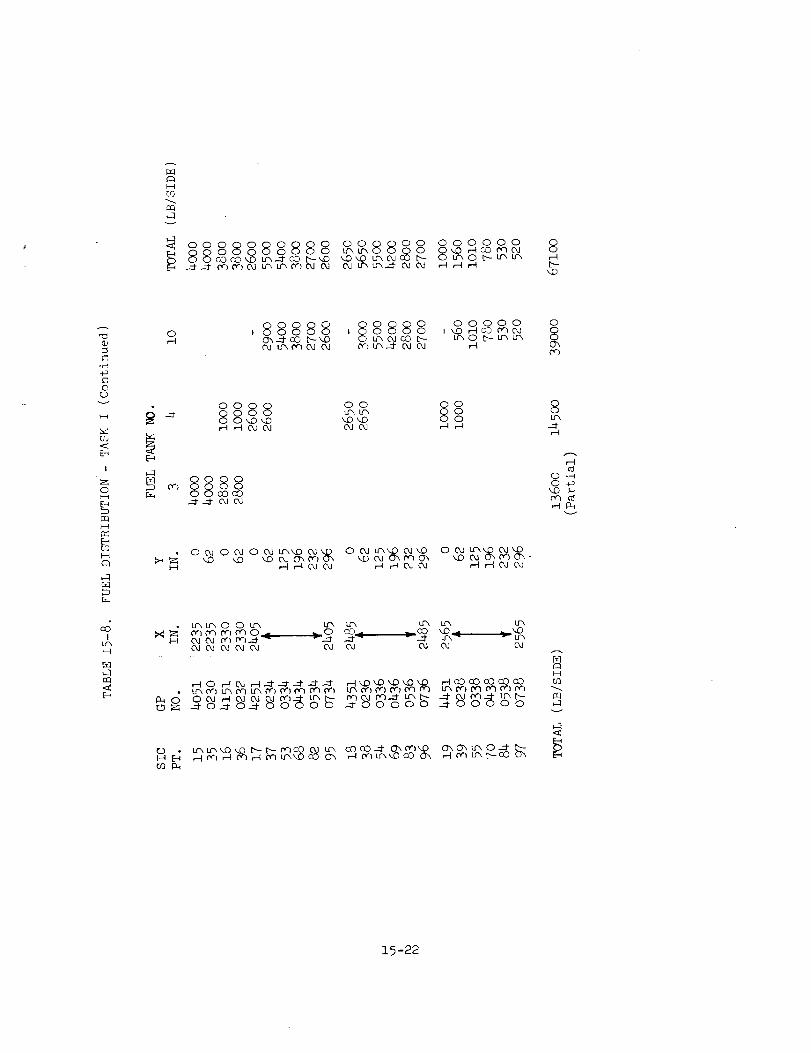
Tanks i through 4 are engine feed tanks and are kept full until all other tanks are
empty. The usable fuel mass is based on a fuel density of 0.803 kilogram/liter
(6.7 pound/gallon) and 90 percent of the gross volume to allow for structure, sys-
tems and unusable fuel. The forward limit for flight (51-percent MAC) and the aft
limit for takeoff and landing are indicated at 53.5-percent MAC and 55-percent _._C,
respectively.
Weight Comparison Data
To compare with previously established weight trends for supersonic cruise aircraft,
a group weight comparison was made. The data, presented in Table 15-4, compares
a preliminary weight estimate for the arrow-wing supersonic cruise aircraft
derived from parametric relationship of the various items (i.e. wing, body) and
data of Reference i. The referenced data is for the Boeing 969-336C production
configuration which was obtained by scaling-up-the group weights of the prototype
aircraft. As noted on the table_ the heavier wing weight used for the starting
point of this study is offset by the lighter body structure weight which considers
composite application in the cooled interior (i.e. floor beams, post, trim). The
larger diameter turbofan engines result in an increase in inlet weights. The
equipment and system weight reductions over the referenced'data are achieved by
utilizing composite materials.
Detail Wing and Body Weights
The scope of the study is to determine the structural approaches best suited for
the wing and fuselage design of a Mach 2.7 supersonic cruise aircraft. To identify
the relative weights of those components which make up the wing and body structure,
these groups were further broken-down into more detailed components as presented in
Table 15-5. This procedure isolates different types of structural elements and
their relative weights. As the analyses of different elements are completed, the
results are compared to the initial estimated values. The relative proportion
between the primary structural elements is determined by typical percentages from
previous studies and analyses. Other items, such as control surfaces, utilize
representative unit weights and their respective areas. Door and windows are based
on the size, type, and quantity.
15-14

TABLE 15-_. PRELIMINARY GROUP WEIGHT COMPARISON
REFERENCE
ITEM
WING
TAIL - HORIZONTAL
- VERTICAL
- CANARD
BODY
LAND. GEAR - NOSE
MAINAIR INDUCTION
NACELLE
TOTAL STRUCTURE
PROPULSION - ENGINES
- SYSTEMS
SUR FACE CONTROLS
INSTRUMENTS
HYDRAULICS
ELECTRICALAVIONICS
FURN. AND EQUIPMENT
ECS
OPTIONS AND TOLERANCES
MANUF. EMPTY WT. (MEW)STD AND OPER EQ.
OPER. EMPTY WT. (OEW)PAYLOAD
ZERO FUEL WEIGHT (ZFW)FUEL
TAXI WEIGHT
LOCKHEED
AR ROW-WING
INITIAL DATA
PARAMETRIC
DATA
WEIGHT
(lbs)
109,600
4,40O
3,800
41,000
3,000
27,400
17,2006.800
(213,200)
46,000
7,000
8,500
1,230
5,700
4,550
1,900
11,5008,300
2,420
BOEING
969-336C
PRODUCTION
REFERENCE1
WEIGHT
(Ibs)
92,700
2,370
3,270
2,950
51,570
3,030
27,910
15,650
(199,450)
45,020
6,310
12,4503,400
5,6O05,050
2,690
21,290
8,100
5,480
310,300 314,840
10,700 11,810
321,000 326,650
49,000 48,906
370,000 375,550
380,000 374,444
750,000 750,000
15-i5

TABLE 15-5. ESTIMATED WEIGHTS FOR WING _D BODY - TASK I
ITEM
WING GROUP:
CENTER SECTION
SURFACE MATERIAL
SHEAR MATERIAL
RIBSOUTER PANEL
SURFACE MATERIALSHEAR MATERIALRIBS
LEADING EDGE
TRAILING EDGE
MLG DOORS
BODY FAIRING
AILERONS
T.E, FLAPS
L.E. FLAPS
SPOILERS
12,750 lb.3.400
85O
49,960
7,330
9,330
BODY G RQUP:BULKHEADS AND FRAMES
SKINS
LONGE RONS AND STIFFENERS
NOSE AND FLIGHT STATION
NLG WELL
WINDSHIELD AND WINDOWS
FLOOR ING AND SUPPORTS
DOORS AND MECHANISMUNDERWlNG FAIRING
CARGO COMPARTMENT PROVISIONS
WING-BODY FITTINGS
TAIL-BODY FITTINGS
PROVISIONS FOR SYSTEMS
FINISH AND SEALING
WEIGHT (Ibs)
COMPONENT
17,000
66,620
5,470
5,520
3,600
1,600
1,440
6,8801,220
250
4,94010,510
6,010
2,5009OO
1,680
3,820
4,170
1,870
1,060
1,5006O0
740
7OO
GROUP
109,600
41,000
15-16

E
STRUCTURAL MODEL MASS DATA
Grid Point Distribution - Task I
_e data from the Estimated Group Weight and Balance Statement of Table 15-1 are
distributed to the structural model grid points (SIC) for use in the static loads
and flutter analysis programs. For the initial effort, a single mass distribution
which is representative of the three structural arrangements is used.
Table 15-6 presents the Operating Weight Empty (O_E), Table 15-7 the payload, and
Table 15-8 the fuel distribution by tank. Several individual components lumped in
the SIC distribution are listed separately in Table 15-9.
The negative sense of weight values at some points are the result of applying a couple
to obtain the correct center of gravity for the overhanging vertical fins. The mass
moment of inertia for the propulsion system, wing, and fuel are presented in Tables
15-10 and 15-11. These data are based on the weight distribution at the SIC grid
points. The grid point locations are defined _n Section 9, Structural Analysis Models.
Grid Point Distribution - Task IIA
For the Task IIA investigation, the Task I weight data (Table 15-1) were adjusted aft
to reflect the configuration changes adopted. The configuration refinements are
shown in Figure 15-6. The major configuration differences are delineated below:
(I) Added wing area (50 sq. ft./side) outboard of BL 470 by reducing angle of
the leading edge from 64.6h-degrees to 60-degrees.
(2) Increased number of fuel tanks and changed the tank arrangement to
achieve an aft shift in center-of-gravity.
(3) Reduced length Of fuselage forebody by ii:9 inches, payload moved aft.
(h) Increased fuselage-mounted vertical tail area from 290 sq. feet to
325 sq. feet.
The geometric parameters for these changes are defined in Table 15-12.
The appropriate changes to reflect the aforementioned refinements were made
(data not included) including changes to the wing tip surface panel distribution to
reflect strength-designed thicknesses (Figure 15-7). These data were then input to
th_ static loads and flutter analysis programs.
15-17

oR
rj .
CO
I
0
E_
PqHJ_dE_
b_E_
H
_6
HE_•_ r.j •
0
I
('d _ " 000d Lrx_D Or}'D'-.D''DO'x 0XD (N 0_ b-
r--1 r-I ('W O_ Cr')--._, -_
0 0 u_ _ 0 U'XO L_ u'x, _ R _ L_("'} _ (Y'} _ .-i".-J- LC',LF", _ _(.,-}'11OJ OJ O.I Od OJ OJ O.I 0,,.I C'.I OJ OJ OJ C'J C'J
,--IOJ OJ _}OJ}Ckl Ckl C'J OJLf'.,_'I or] ,'Y'}C,_} 0r) C,"}
_" O ,--I,-4
,--I--1---1-.-I"-.I"-=I" ,--I..D ',£}",.O'.D ",.O ",.C)'_C)',.C) ,--IeD o3 oD cO ODLF_ or) O r} Or) Dr} (',-} ("'I(Y'} } LF_ or) Cr} Or} (Y')(',"} (Y-)0r) (-,rI _ Or} Or} C,t'}CY'}C_}
o_o_}_ oo_ o,4,_ _ooooo_ooo_ _o_ 5.,_,_ 0, o0_ _,,',_-
Ox Ox LFX 0 .-_ b-r-,l(Y')Lm b--O,D
,--Ir"l (-2 _ ('r} _ ,.--ICkJ C',J(',r} ,--'_I 0,] {XI D'I._- H _ C'.JC',J(Y).-d"
L._ Lt"x L._ Lrx Lf"x _ _ LF',
,--I ,--I OJ C'J C'.I O.I OJ OJ
_,_ooo_
i-I 00 00 O00D OC) O0 co
I..m 0,,.I Od 0,,,I _u_ C_I O.,i 0,,I_8 ''_ooo _S 'o
_00000000
oo_ m°_0_
g 000000 _ _ _ 0 0 0 0 _ _ _0000
__ 0 _ _ _ _ __ _ 00000 _ _ _ _ _ _
_,o _, o oo _,o o _, oo_ _,ooo8_
'-d.,-i
-d
0
i5-i8

_2
c_
40
OC)
v
O5
E_
I
O
BH
_3
C_H
P_O
dI
Lf_
OJ OJ Od._
r-4 OJ O rq
Od _D D-- b-
OJ _'1P_ C_ xl:)x,O_.O_O
r._) CO f_')-_ Lrx
_ Lf_ _}
oooo4o_
_ O_
OJ -.-_ O,J _._- o"}.._f ,--IOJ
_ _0_ L_ ° Lr_OJ_ 1._ I/'N Lfx 12N t._ LF',
(_ _ U", U", 0 CO
.._" .._" U", U", _.D ',D ',D0.1 0,10d Od (%1 _ OJ
8_ o oo o oJ_._l-
_ _') ¢¢'} 0"} 0,") C¢'} C¢'} 0-I
¢,,.-} _,.-} (Y'}H,-4 ,--I ,.-.I ,"-I ,-_ ,.--I ,-.-I
C'd U_ L_--..-t" r-_ ,_ r--I0", C_CO O0
M _,_'o_
o_o_ 0,I u'x
OJ BJ OJ Od
C_
C} •
O.l 0 ,-.-I f_'} Lr_...d'_-I- _--oO [_.
_-b-..:f Oo000 GI 0J u__1 ,--toj O_ O.1 _-.I r¢>_-Ii i
O ['-_.._ O--1- _lc0 LCx O,] b-_JP Lm u'x u'x_.D',.O Lr_ LrX Lr'_O
r-I ._" _ E"-- O"}",.O--1"b-b.- b-- 00{:OO0Ctl Od Od ('d Od Od _,1 0,10d Ctl
'.DoO O GI,.D00 O O.1.._, OJOd OJ f_} f_}.-._ .-.-1- Lr_ I_ I_ Ojre'} {'F} D"} {Y'} Or} f_} _") {_'} {Y} L_
r--I _-q _-I r-'l _--I r'-! _-I _'-I _-I _-I
OO0 ",.O O00 0",'-.0.-.1"
,.o_ _ o_o _,o0_}cO O Lm_t" cO O
Od Ctl C_/ _ Od
_o_o0o,_ooo_9oo$,o_ ,,-, $"-8
O0 _-u'x 0 0_0 ,-I Lr_O00 _-I0_ OJ.__" _00 C_,-I,-I,-4
.,'4
"d
O
_) 0,.I 0 Lr'_ U", ',.D
r-I ,--I _'-I ,--I
0..-_ 0,.I ',.0 .._" ©
'..0 b- b'-
_o ,.o00_CO 0
__O_
O_ _O_
@_ooooo
_o888oo
OOOO
].5-z9

TABLE 15-7. PAYLOAD DISTRIBUTION - TASK I
SIC GP X W
PT. NO. (y=O) Lbs/Side
4 Ol08 8oo 124o
5 0110 i000 2847
6 3151 1210 3680
7 3251 1382 2440
8 3351 1580 2440
9 3451 1680 1440
i0 3551 1772 1240
ii 3651 1865 1240
12 3751 1955 620
13 3851 2o45 62o14 3951 2145 1240
15 4o51 2235 124o
16 4151 2330 1240
17 4251 2405 lOO0
18 4351 2485 i000
19 4451 2565 973
15-20

C_3
_q
O
_'Y'}
0000 8L_ Lr", O OO00 I.._ L_ O4
o8o8888_oO4 O0 ',D 04
..4" b-- ,.O t-', {kl ,-1
ooo88oLp, Lr', 0 0O4 0 _ 0",{"'}04
.._CO b--..d" _}0,1
°°°888_,,,-,o.._. r-.-i Oh U', 0,,i ,-'_
888888°°8Ro o°OhOD t_'} t"} O4 O0 ,._ ,_._, Oh0.1 .-_" t'_"} 0d 0.1 .,_ ,_1 _d" ---_ 0,1
O4
,..4
888"",.-I
Lr_L_ O 80O30d O LF",
...:t Oh
F--!
_d_ 8E-_
O
Y _
03
A
Ik/%
E-
CO
,8888c0 _'_ U'x O4
_H
o 8,888._.8Cc}_0 _0d ,d
,o80_D
,888888OhOhu'.,o4,-[O',.
_-{ C_'} C,,] O4 .--_ ,-I.-.-I"
O0 O0 _ 0
_8 OOOO8_ °°
oo 88 88OO O4O4 _
_O4O4
0 0,1Lr",_O O4 ',D',.D O4 Oh _",.D
,--I ,--I Od 0,1
0 O4 _-x,,.D 0.1 _.O LP'.
_--.I r..-I 0,.I O4 _}_>4 _ O O4 LP_',.D O4
,--I,--40,1
O O4 Lr',,,dp O,I_,D u-xO O4_:) O.I Oh _} Oh'..C) _D
_-.I _--I O4 Od {'c}
O
8
8t'--If',
OOO
_OOOOO
_}OOO OO _,ooo_8
_1 ,-I OJ
r-q
4 HO4 O4 O4 "-_
r'l -:.-.-_--_ ..-_" -._ ---_ -._ _--t M3 ',D ',D ',D M;3 '-D ,"t CD
_10 OOO _}OOO
_ Oh C_ u-x CD .--]-ct]
O O_O _1 L_OOr-I _'}-_" ,,0 [---03 ,--I {_'}_4- _.D b-cO r__ O4 cO {-,-} _ _. _-I {_'} _'} (}_ .el- oD r-t Od -_-I- --.d{_.-1- _D O r-I _}.._" KD _'- Oh O H {'q
,-4 rq
_5-2_
_DHCO
v
OOO
88o8888888cO oO _O _--d'cO b--kO
..._- _d- or) _,") O,i IP, Lr', D"} OJ C_I
o088oo O0_O_O um OJ oO b-OJ lt_um_._ Od Oj
OOOOOO 8r---tb-
',D
"t:J
-r-_
Or..)
v
I'--t
vbO<E_
!
ZOi.-i
C2t
I
o ,888880",-"i" cO b-_.O
u'xO'lOJ OJ
OOOOOO_OO_
_:_ _O '..O 04 C_} C_,--t,--I 0J O_
_OO_
oR
L)
§888 °oLP, OJOD b--
_"} U-,..-_'- 0.,I Od
OOOOO_ ,.D ,--IO0 c_'_Od
LrxO b-Lr_Lr_
O
8D"}
oo o 8umum 8 °
',DM3 OO u'-,O,Iod r--I r--I _
O Od Lr'x'.D O_D_D O_ O', r,'_ O',
,-I ,-.q C_ O_
LP_ _ If", Lrx
OJ OJ O_ Od
_O
,-dO rqOd ,--I._1- --d- -_r ..:l- .-_Lr_ D'} _ f_') LI_ _} {_'1 Or} {'r} {_'}
O.I
OOOO
,--1o0o0o0{20{::0
88'g 8
cO cO ._:r {_ _)_.D O', O_ t_, O ---I"Lr_ Lrx x.D _) b-- b-- re) CO L_
0 ._10_.D
v
8
]-5-22

TABLE 15-9. INDIVIDUAL CO_PONENT WEIGHT DISTRIBUTYON - TASK I
SIC
POINT
24
25
24
25
33
3664
GRID XPOINT
NO. (in.)
0147 3360
0148 3470
0147 3360
0148 3470
0226 2045
0232 2330
0426 2045
Y
(in.)
0
0
6262
19667
141
142
148
183
184
185
186
0432
0106
0108
1348
1350
1528
0660
06621160
1162
2330
6O0
8OO
2790
2812
2904
2660
2800
2720
2855
196
616588
6O3
264
264
438
438
WE IG HT
Ib/SIDE
567
2553
-469
+469 /+860J
1923
4928
1922
4927
525
975
-510
-510
+1020 l+14ooI
37959795
3684
9382
ITEM
HORIZONTAL TAIL
HORIZONTAL TAIL
VERTICAL TAIL (MOVABLE)
VERTICAL TAIL (MOVABLE)
MLG (UP)
MLG (UP)
MLG (UP)
MLG (UP)
NLG (UP)
NLG (UP)
VERTICAL TAI L - WING
VERTICAL TA1L - WING
VERTICAL TAIL - WING
ENGINES, NAC. AND PROP. SYS.ENGINES, NAC. AND PROP. SYS.
ENGINES, NAC. AND PROP. SYS.
ENINGES, NAC. AND PROP. SYS.
15-23

TABLE 15-10. MOMENT OF INERTIA OF ENGINE, NACELLE, AND PROPULSION SYSTEM- TASK I
SIC
POINT
183
184
185
186
GRID
PT. NO.
0660
0662
1160
1162
WEIGHT X Y
(Ibs/SIDE) (in.) (in.)
13,590 2761 264
13,066 2817 438
m
Z
(in.)
-215
-207
1000
Io X
3.39
3.23
SLUG - ft 2
Ioy = loz
21.70
20.83
TABLE 15-1!. MOMENT OF INERTIA OF WING STRUCTURE AND FUEL - TASK I
WEIGHT
(Ibs/SIDE)
X
(in.)
Y
(in.)
106 SLUG -ft 2
ITEM IOz
WING STRUCTURE 75,737 2322 252 2.69
FUEL 154,500 2082 145 2.71
TOTAL 230,237 2161 181 6.15
15-24

AREA
Figure 15-6. Configuration Comparison - Task I and Task II
.i 1!
I _ _.073_
• - ' , (.o8o) .
014 053 (_.0731_.053_/
.014 _='_ 5_.014'-_
NOTE:
XXX = UPPER SURFACE EFFECTIVE THICKNESS (IN)
(XXX) = LOWER SURFACE EFFECTIVE THICKNESS (IN)
- BEAM WEB THICKNESS (IN)
Figure 15-7. Surface Panel Thickness - Strength Design
15-25
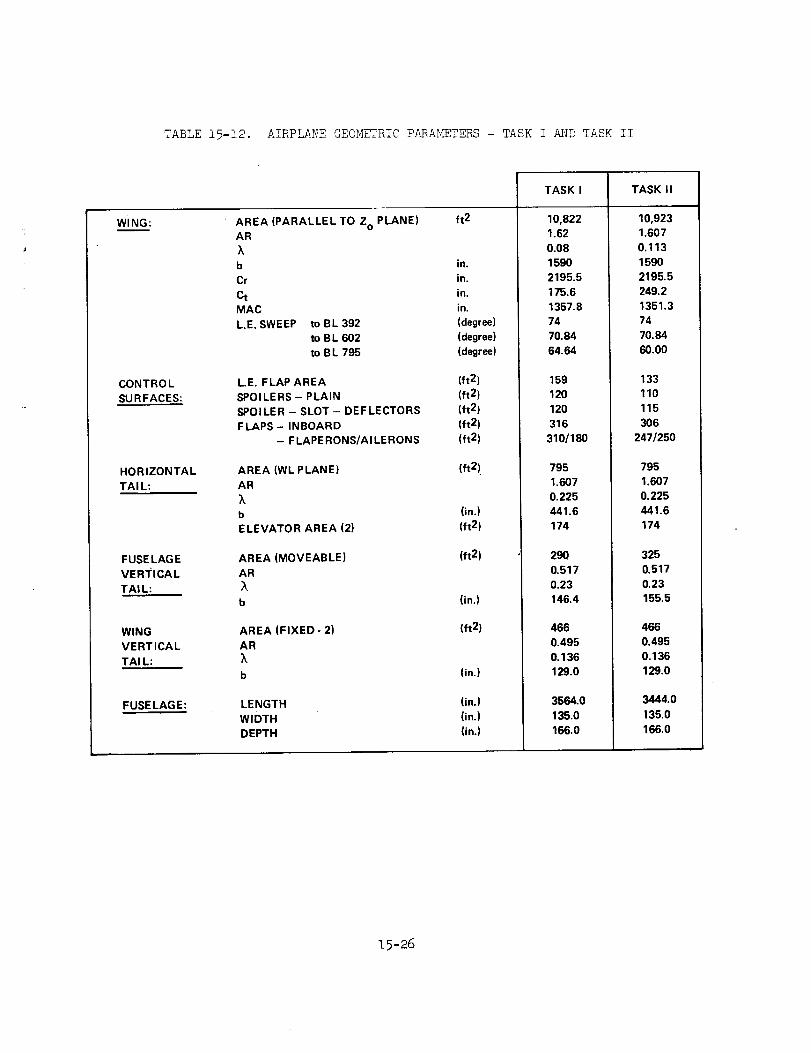
TABLE 15-12. AIRPLANE GEOMETRIC P.&EAMETERS - TASK I _D TASK II
WING:
CONTROL
SU R FACES_
HORIZONTAL
TAIL:
FUSELAGEVER'rlCAL
TAI L:
WING
VERTICAL
TAI L:
FUSELAGE:
TASKI
AREA (PARALLEL TO Zo PLANE) ft 2AR
k
b in.
Cr in.
Ct in.MAC in.
L.E. SWEEP to BL 392 (degree)
to BL 602 (degree)
to BL 795 (degree)
L.E. FLAP AREA
SPOI LERS - PLAINSPOILER - SLOT - DEFLECTORS
FLAPS- INBOARD
- FLAPERONS/AILERONS
(ft 2)(ft2)
(ft 2)
(ft 2)
(ft 2)
10,8221.62
0.08
1590
2195.5
175.6
1357.8
74
70.84
64.64
159
120
120
316
310/180
AREA (WL PLANE)
AR
kb
ELEVATOR AREA (2)
AREA (MOVEABLE)
AR
b
AREA (FIXED- 2)
ARkb
LENGTH
WIDTH
DEPTH
(_2!
(in.)
(ft2)
(ft2)
(in.)
(ft2)
(in.)
(in.)
(in.)
(in.)
795
1.607
0.225
441.6
174
29O
0.517
0.23
146.4
466
0.495
0.136
129.0
3564.0
135.0
166.0
TASK II
10,9231.607
0.113
1590
2195.5
249.2
1351.3
74
70.64
60.00
133
110
115
306
247/250
795
1.607
0.225
441.6
174
325
0.517
0.23
155.5
466
0.495
0.136
129.0
3444.0
135.0
166.0
15-26

Grid Point Distribution - Task liB (Strength/Stiffness)
The configuration refinements ident_in Section 2 and summarized in the Grid
Point Distrubition discussions wer@-adopted for the Task IIB strength and strength/
stiffness design effort. The structural approach _ _ -selected for these analyses is a
Hybrid structural arrangement consisting of the chordwise stiffened design for the
wing structure inboard of BL 406 and the monocoque design for the wing tip structure.
As shown in Table 15-3 the Task IIA weight distribution was updated to include the
engine size and weight increases to properly reflect the uninstalled sea level static
thrust level of 89,466 pounds per engine instead of the 77,957 pounds per engine.
Appropriate nacelle and air induction system weights were also included.
Table 15-13 presents the Operating Empty Weight (0EW) distribution for the strength/
stiffness design; the payload and fuel (tanks I through 16) distributions are
detailed in Table 15-14. The concentrated weight items which are included in the
OEW distribution of Table 15-13 are identified separately in Table 15-15. The
weight, center of gravity and moment of inertia data for tail surfaces and engines
are contained in Table 15-16. These data were applied to the flutter analysis
effort reported in Section i0.
The final strength/stiffness distribution resulting from the flutter optimization
analysis is shown in Table 15-17 and pictorially displayed on Figure 15-8. To pro-
vide adequate torsional stiffness, a total weight increment of 1462 pounds per side
is added to the wing tip box structure. To maintain constant aircraft gross weight,
an equal weight is removed from Tank 16 fuel, as shown in Table 15-18.
The mass moment of inertia for the wing and contents is presented in Table 15-19.
The data includes the wing fuel (BL 62 - BL 406) and payload distribution to
BL 62.0. These data are based on the weight distribution at the SIC grid points.
The moment of inertia data for the aileron and outboard flaperon are shown in
Table 15-20. These data are based on an expression for calculation of the mass
moment of inertia derived from the L-1011 wide body transport.
15-27

TABLE 15-13.
MODEL
GRIDID
3150
3250
3350
345O
3550 °
0112
0114
WEIGHT
(Ib/SIDE)
765
2,235
2,967
2,893
1.282
1,040
1,395
OPERATING WEIGHT EMPTY DISTRIBUTION - TASK liB
STRENGTH/STIFFNESS DESIGN
400.00
600.00
800.00
1,000.00
1,100.00
1,210.00
1,382.00
0116
0118
0120
0122
0124
0126
0128
0130
0132
0134
0136
733 1,580.00
509 1,680.00
506 1,772.00
517 1,865.00
432 1,955-00
453 2,045.00
462 2,145-00
450 2,235-0O
454 2,330.00
411 2,405.00
427 2,485-00
0138
0140
5150
5250
5350
545O
5550
SUBTOTAL
0314
0316
0318
032O
0322
0324
0326
0328
033O
1,092
1,143
2,512
2,702
952
1,027
5,902
(33,283)
710
345
225
265
336
331
442
1,114
¢068
COORDINATES
X Y(in.) (in.)
00.00
00.00
00.00
00.00
00.00
00.00
00.00
00.00
00.00
0.000
00.00
00.00
00.00
00.00
00.00
00.00
! 00.ooi 00.00i
2,565-00 00.00
2,640 00 00.00
2,800.00 00.00
3,000.00 00.00
3,200.00 00.00
3,360.00 00.00
3,470.00 00.00
(2,109.40)
1,382.00 125.00
1,580.00 125.00
1,680.00 125.00
1,772.00 125.00
1,865.00 125.00
1,955.00 125o00
2,045.OO 125.00
2,145.00 125.00I
2,235.00 I 125.00
WEIGHT COORDINATESMODEL
GRID ID
0212
0214
0216
0216
0220
0222
0224
0226
0226
O23O
0232
0234
0238
0238
0240
0242
0246
SUBTOTAL
0416
0418
0420
0422
0424
0426
0428
0430
0432
0434
0436
0438
044O
0442
0446
(Ib/SIDE)
2,923
3,036
1,654
1,154
1,330
1,309
1,138
1,186
1,815
1,765
1,686
1,164
1,163
2,586
2,637
288
100
(26,952)
480
175
220
287
282
392
310
1,614
1,126
370
335
430
6OO
768
155
X(in.)
1,210.00
1,382.00
1,580.00
1,680.00
1,772.00
1,865.00
1,955.00
2,045.00
2,145.00
2,235.00
2,330.00'1
2,405.00
2,485.0O
2,565.00
2,640.00
2,710.00
2,855.00
{1,999.50)
1,580.00
1,680.00
1,772.00
1,865.00
1,955.00
2,045.00
2,145.00
2,235-00
2,330.00
2,405.00
2,485.00
2,565.00
2,640.0O
2,710.00
2,855.00
SUBTOTAL (7,544) (2,274.60)
Y(in.)
62.00
62.00
62.00
62.00
62.00
62.00
62.00
62.00
62.00
6Z00
62.00
62.00
62.00
62.00
62.00
62.00
62.00
156.00
196.00
196.00
196.00
196.00
196.00
196.00
156.00
196.0_
196.0(]
196.(X
196.0C
196.0(
196,0¢
196.0(
REFER TO SECTION 9 STRUCTURAL ANALYSIS MODELS FOR GRID POINT LOCATIONS
ON AIRCRAFT PLANFORM
15-28

E
m:
m
TABLE 15-13.
MODEL
GRIDID
0332
0334
0336
0338
0340
0342
0346
WEIGHT
(Ib/SIDE)
OPERATING _TIGHT EMPTY DISTRIBUTION
STRENGTH/STIFFNESS DESIGN (Continued)
ii WEIGHT:t
it MODEL
I GRID tD {Ib/SIDE)
COORDINATES
= ,
(in.) (in.)
2,330.00 125.00
2,405.00 125.00
2,485.00 125.00
2,565.00 125.00
2,640.00 125.00
_710,00 125.00
_855.00 125.00
6,180
420
4OO
510
700
9O0
2O0
SUBTOTAL (21,146) (2,248,30)
0518
0520
0522
0524
0526
0528
0530
0532
0534
0536
0538
0540
0542
0546
1,680.00 232.00
1,772,00 232.00
1,865.00 232.00
1,955.00 232.00
2,045.00 232.00
2,145.00 232.00
2,235.00 232.00
2,330.00 232.00
2,405.00 232,00
2,485.00 232.00
2,565.00 23?_00
2,640.00 232.00
2,710.00 232.00
2,855.00 232.00
255
115
176
170
232
282
276
28O
355
325
1,655
1,610
1,035
140
SUBTOTAL (6,906) (2,462.00)
242
198
187
192
39O
365
33O
56O
756
145
2,045.00 365,00
2,145.00 365.00
2,235.00 365.00
2,330.00 365.00
2,410.00 365.00
2,500.00 365.00
2,590.00 365.00
2,678.00 365.00
2,743.00 365.0O
2,868.OO 365.OO
0926
0928
0930
0932
0934
0936
0938
0940
0942
0946
SUBTOTAL (3,365) (2,520.40}
0620
0722
0724
0726
0728
0730
0732
0734
0736
0738
0740
0742
0746
0824
SUBTOTAL
1120
1232
1234
1236
1238
1240
1242
1246
- TASK lib
COORDINATES
X Y(in.) (in.)
215 1,772.00 266.00
275 1,86&00 299.50
182 1,955.00 296.00
242 2,045.00 296.00
342 2,145.00 296.00
336 2,235.00 296.00
340 2,330.00 296.00
400 2,405.00 296.00
400 2,485.00 296.00
1,745 2,565.00 296.00
1,695 2,640.00 296.00
1,100 2,713.00 296.00
200 2,855.00 296,00
187 1,955.00 332.50
(7,659) (2,461.00)"
149 2,235.00 435.00
192 2,330.00 470.00
230 2,420.00 470.00
405 2,520.00 470.00
2,355 2,625.00 470.00
1,060 2,730.00 470.00
1,010 2,798.00 470.00
140 2"900.00 470.00
SUBTOTAL (5,541) (2,946.70)
1522
1524
1526
1528
1530
1534
230 2"818.00 676.00
154 2,831.50 660.0O
202 2,854.00 633,0O
2,569 2,882.00 600.00
450 2,905.56 573.00
125 2,949.00 521.50
REFER TO SECTION 9 STRUCTURAL ANALYSIS MODELS FOR GRID POINT LOCATIONS
ON AIRCRAFT PLANFORM] £-2q
]-5-29

TABLE 15-13. OPERATING WEIGHT
STRENGTH/STIFFNESS
MODEL
GRIDID
1028
1030
1032
1034
1036
1038
1040
1042
1,046
SUBTOTAL
1300
1304
1310
1312
1320
1322
1324
1326
1328
1330
1332
1346
1348
1350
1352
1354
SUBTOTAL
1622
1624
1626
1628
WEIGHT
(Ib/SIDE)
160
121
186
245
28O
1,585
1,605
1,020
130
(5,332)
132
181
168
275
131
180
263
-488
173
238
477
254
197
318
426
536
(3,461)
192
106
129
214
COORDINATES
X Y(in.) (in.)
402.00
406.00
406.0O
406.00
406.00
406.00
406.60
406.00
406.00
2,145.00
2,235.00
2,330.00
2,415.00
2,508.00
2,603.00
2,700.00
2,763,00
2,880.00
(2,624.30)
2,399.00
2,475.50
2,555.50
2,589.50
2,636.50
2,659.20
2,691.00
2,686.80
2,703.00
2,732.80
2,769.00
2,755.70
2,770.00
2,796.00
2,828.50
2,854.00
(2,726.00)
2,961.00
2,971.60
2,987.00
3,005.50
495.00
523.00
552.00
511.70
581.30
554.30
516.80
600.00
581.00
54E50
50_30
639.50
622.00
592.00
554.00
524.00
758.00
745.20
727.20
705.50
E_@TY DISTRIBUTION - TASK lib
DESIGN (Continued)
MODEL
GRID ID
1540
1562
1564
1566
1568
1570
1610
1614
WEIGHT
(Ib/SIDE)
180
245
165
222
304
340
250
75
SUBTOTAL (5,511)
1724
1746
1768
1790
1794
1798
SUBTOTAL
13
20
26
104
95
25
(283)
COORDINATES
X Y(in.} (in.)
573.002,998.00
2,882.60
2,894.00
2,914.00
2,937.70
2,958. 50
3,607.00
3,046.00
(2,901.50)
3,054.10
3,082.90
3,111.30
3,141.30
3,174.50
3,211.00
(3,147.30)
712.00
698.00
675.30
547.00
623.00
668.00
623.00
795.00
795.00
795.00
795.00
756.00
795.00
REFER TO SECTION 9 STRUCTURAL ANALYSIS
MODELS FOR GRID POINT LOCATIONS ON
AIRCRAFT PLANFORM
15-30

TABLE15-13. OPERATINGWEIGHTEMPTYDISTRIBUTION- TASKIIBSTRENGTH/STIFFNESSDESIGN(Continued)
WEIGHTMODEL
GRID ID fib/SIDE)
1630 122
1634 45
1662 69
1664 53
1666 78
1668 92
1670 140
1674 55
1702 26
1704 39
1706 65
1708 104
1710 190
1714 90
SUBTOTAL (1,809}
COORDINATES
X Y
(in.) ..... (in.))
3,023.80 684.00
3,062.00 639.00
2,993.00 777.00
3,003`00 ' 764.20
3,017.00 748.30
3,033, 50 729.00
3,050.30 709.00
3,087.50 665.50
3,025.10 795.00
3,035.00 783.00
3,046.50 769.00
3,061.00 752.00
3,077.00 734.00
3,113,00 691.50
(3,025.80)
MO DE L
GRID ID
ENGINE &
NACELLE:
0660
0662
SUBTOTAL
ENGINE &
NACELLE:
1160
1162
SUBTOTAL
WING FIN:
1326
1528
SUBTOTAL
TOTAL
O.E.W.
WEIGHT
(Ib/SIDE)
1,306
12.759
(14,065)
2,500
11,565
(14,065)
(REFERENCE}
-781
2,181
(1,400)
156,922
COORDINATES
X I Y
(in.] J (in.)
2,660.00 264.00
2,800,00 264.00
(2,787.00)
2,720.00 438.00
2,855.00 438.00
(2,831.00)
(2,990.90)
i
2,374.40 - ii
I
REFER TO SECTION 9 STRUCTURAL ANALYSIS.MODELS FOR GRID POINT LOCATIONSON AIRCRAFT PLANFORM
15-31

H
H
E_
HH
I
O_I._ 1.-I
O'3I,--I
r_
I
_q
N
_ w
la II
iii
Z _
z _
_. u,.1/
,-'_4
e4 ,.-"
I,-
IN
,.-'1,4
v
X c
i°
ZZ
-L
_Ju.
15-32

E
=:
L
zoH
H
E_
E-_L_Z
E_CQ
H
H
U3 _C_
I "_+_
0 0H L_
U3 C'3
AZ
O
I
=
ul
Du
ul
z
z
_j-,e
x _ _ _
IN ,_-
$
,, ,, oo_o_ _ ', _o _->" >" >" >- >- I-
15-33
)
0
z
o.-
0

TABLE 15-15. INDIVIDUAL COb_ONENT WEIGHT DISTRIBUTION - TASK liB STRENGTH/STIFFNESS DESIGN
ITEM
NOSE LANDING GEAR (UP)
MAIN LANDING GEAR (UP)
VERTICAL TAIL - FUS. (MOVABLE)
HORIZONTAL TAI L - FUS. (MOVABLE)
AIR INDUCTION - INBOARD
AIR INDUCTION - OUTBOARD
ENGINES AND NACELLES- INBOARD
ENGINES AND NACELLES - OUTBOARD
WING FIN
GRID
I.D.
3350
3450
0330
0430
0332
0432
545O
555O
54505550
0538
0738
0540
0740
1033
1238
1040
1240
0660
0662
1160
1162
13261528
WEIGHT
(Ib/SIDE)
1,500
64O
86O
13,700
6,810
1,4104,540
940
1,300-615
+1,915
3,975760
3,215
4,940
1,235
1,235
1,2351,235
4,940
1,235
1,930
1,23554O
14,065
1,306
1_759
14,065
2,500
11,565
1,400-781
+2,181
D
X
(in.)
914.7
800.0
1000.0
2273.0
2235.0
2235.0
2330.0
2330.0
3522.0
3360.0
3470.0
3449.0
3360.0
3470.0
2602.5
2565.02565.0
2640.0
2640.0
2649.7
2503.02625.0
2700.0
2730.0
2787.0
2650.0
2800.0
2831.0
2720.0
2855.0
2990.9
2686.3
2882.0
i
Y
(in.)
137.2
125.0
196.0
125.0
196.0
0
0
0
264.0
232.0
296.0
232.0
296.0
488.0
406.0
470.0
406.0
470.0
264.0
264.0
264.0
438.0
438.0
438.0
600.0
500.0
600.0
Z
(in.)
269.10
262.64
273.97
297.80
296.00
304.00
297.00
306.00
377.30
358.30
371.20
368.70
358.30
371.20
316.20
313.00
319.00
313.00320.00
322.10
321.00
319.50
326.00
325.20
305.00
305.00
305.00
311.00
311.00
311.00
338.20
307.80
327.30
_EFER TO SECTION 9 STRUCTURAL ANALYSIS MODELS FOR GRID POINT LOCATIONS
ON AIRCRAFT PLANFORM
15 -34

E_--=
ITEM
TABLE 15-16. MASS DATA FOB FLUTTER ANALYSIS - TASK IIB
VERTICAL TAIL - FUS.
HORIZONTAL TAI L- FUS.
ENGINES AND NACELLES:
INBOARD:
OUTBOARD:
WEIGHT
fib/SIDE)
1,300 3522.0
3449.0
2787.0
2831.0
FIN -WING
3,975
2990.9
14,065
14,065
240
374
332
229
125
63
37
1,400
CENTER OF GRAVITY
inch
m
X Y
0
75.3
264.0
438.0
600.0
482.0
375.0
258.0
272.5
383. 0
2920 600 330
2952 600 354
2993 600 384
3034 600 414
3067 600 441
3096 6O0 464
3122 600 484
SEC_.__T. W.L.
1 312-340
2 340-370
3 370-400
4 400-430
5 430-455
6 455-475
7 475.TIP
MOM, OF INERTIA -
- Slug.ft 2
NOTES:
REFER TO SECTION 9 STRUCTURAL ANALYSIS MODELSOF AIRCRAFT PLAN FORM.
Ix o IY o
455 3,158
2,091 6,159
3,795 17,709
3,795 17,709
542 3,134
1.7 293.5
6.1 611.5
5.4 507.6
7 203.1
1.4 59.0
0.5 14.2
0.2 3.9
FOR GRID POINT LOCATIONS
CENTER OF GRAVITY DIFFERENCES BETWEEN TABLE 15.16 AND TABLE 15.15ARE DUE TO 2-D GRID POINT LOCATIONS IN TABLE 15-15 NOT COINCIDENT WITHACTUAL CENTER OF GRAVITY.
IZ o
2,703
8,250
17,709
17,709
2,592
291.8
605.4
502.2
199.4
57.6
13.7
3.7
15-35

TABLE 15-17. FINAL MASS DISTRIBUTION - STRENGTH VS STRENGTH/STIFFNESS DESIGN
MODEL
GRID ID
1300
1304
1310
1312
1320
1322
1324
1326
1328
1330
1332
1346
1348
1350
1352
1354
1522
1524
1526
1528
1530
1534
1540
1562
1564
1566
1568
1570
WEIGHT (Ib$)
STRENGTHONLY
132
168
• 156
270
150
180
24O
-504
144
190
410
234
138
257
364
536
210
103
131
2493
450
125
180
208
84
106
190
34O
STRENGTH/STIFFNESS
132
181
168
275
131
180
263
-488
173
238
477
254
197
318
426
536
MODELGRID ID
23O
154
2O2
2569
460
125
180
245
165
222
304
34O
WEIGHT (Ibs)
1610
1614
1622
1624
1626
1628
1630
1634
1662
1664
1666
1668
1670
STRENGTH
ONLY
1674
1702
1704
1706
1708
1710
25O
75
164
50
60
146
122
45
54
22
33
46
140
55
1714
1724
1746
1768
1790
16
19
25
44
190
1794
1798
TOTALS
9O
8
15
22
104
95
25
9.602
STRENGTH/
STIFFNESS
250
76
192
106
129
214
122
45
69
53
78
92
140
55
26
39
65
104
190
90
13
20
26
104
95
25
11,064
REFER TO SECTION 9 STRUCTURAL ANALYSIS MODELS (FIGURE 9-5)
15-36

B.
WEB THK o12_
NOTE: ..........
XXX ,, UPPER SURFACE EFFECTIVE THICKNESS (in) _(XXX) " LOWER SURFACE EFFECTIVE THICKNESS (in) "_
Figure 15-8. Surface Panel Thickness - Final Design
15-37

TABLE 15-18. FUEL DISTRIBUTION FOR TANK NO. 16 - STRENGTH VS STRENGTH/STIFFNESS DESIGN
MODEL
GRID ID
0140
5150
525O
0240
STRENGTH
ON LY
1,326
_013
4,775
1,325
TANK 16 FUEL (Ib/side)
STRENGTH/
STIFFNESS
1,182
5,359
4,255
1,182
TOTALS 13,440 11,978
REF. TANK 16 FUEL CAPACITY = 15,200 Ib/SIDE
TABLE 15-19. MOMENT 0F INERTIA - WING, PAYLOAD AND FUEL - TASK ii
ITEM
WING AND CONTENTS @ OEW (A)
(BL 62 TO TIP)
PAYLOAD (BL.62)
FUEL (BL 62 to BL 406)
WING AND CONTENTS @TOW
WEIGHT
(Ib/SIDE)
92,647
9,158
148,303
E-(F.S.)
232O. 1
1820.4
2191.0
V(B.L.)
223.1
62.0
160.8
(W.L.)
275
310
270
250,108 2225.3 180.3 273.3
IZZc.g"
106 Slug - ft 2
4.32
0.34
2.18
7.46
(A) DOES NOT INCLUDE WING FIN AND ENGINES
TABLE 15-20. MOMENT OF INERTIA - AILERON AND OUTBOARD FLAPERON
CONTROL
SURFACE
AILERON
OUTBOARD
FLAPERON
AVERAGE(A)
CHORD, C(in.)
65
76
WEIGHT, W
(Ib)
625
504
IHL (B)
(ll>in.2)
0.602 x 10⁶
0.662 x 10⁶
(Ib.in..sec 2)
1560
1720
(A)
(B)
MEASURED NORMAL TO HINGE LINE
,]IHL = [\12 / + (Wd2
IHL = 0.228Wc2 (Ib-in.2) WITH d=0.38c
IHL = .00069 Wc2 (llPin.-sec 2)
15-38
HL d. CONTROL SURFACE
ROSS SECTION

STRUCTURAL CONCEPT MASS ANALYSIS
E-I
Method
The Structural Conggpt Analysis section presents sized elements for selected wing
and fuselage locations for each structural arrangement. The data reflects variable
spar or rib spacing for each panel concept at the point design region specified.
To determine the unit weights between analysis areas_ the load/temperature map is
utilized. This permits unit weights to be increased or decreased with correspond-
ing changes in the load and temperature environment. Consideration is also given to
the lightly loaded minimum gage regions.
In the locations where wing spars mate to the body frames, the spacing is selected
by the minimum weight combination of the wing and body segments.
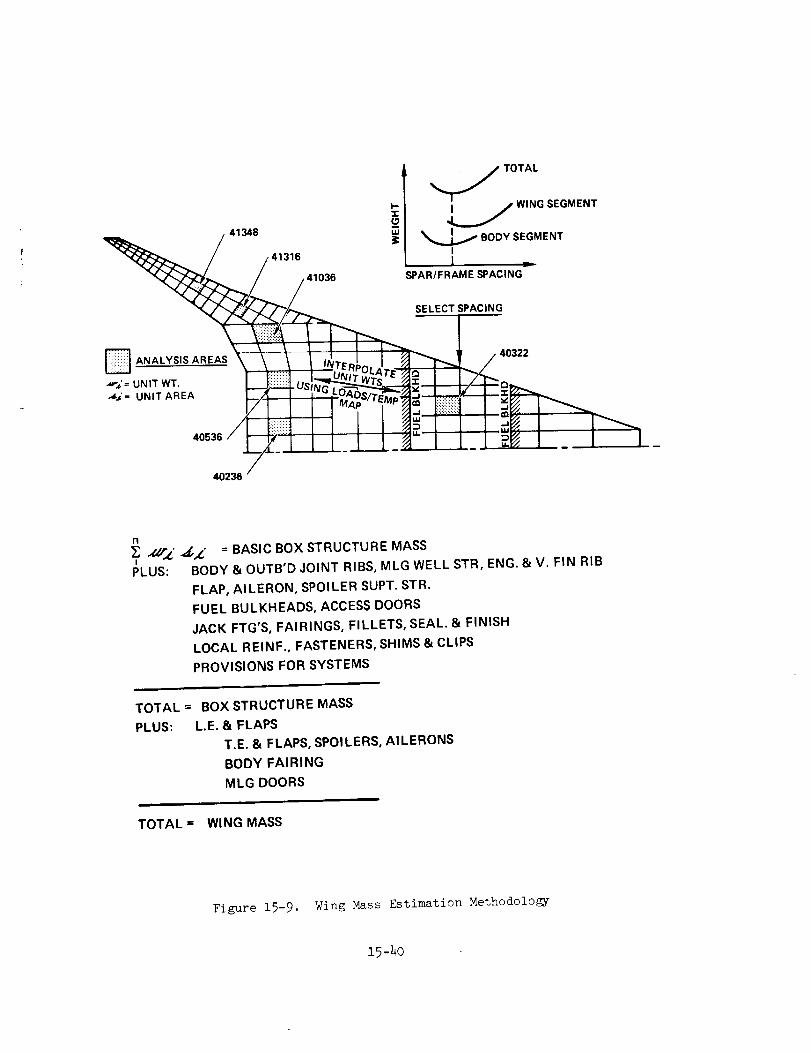
Wing. - To obtain the basic wing box structure weight, the unit weights are inte-
grated over the entire wing box areas as pictorially displayed in Figure 15-9.
Assessment is also made of special structural items, access doors, systems provi-
sions and other non-optimum items. The summation of the basic box structure, con-
trol surfaces, leading and trailing edges, result in the total wing group weight.
Fuselage. - In a similar manner to that described for the wing, four body analysis
areas were selected to inyestigate the three Candidate structuralconcepts of Task I.
Interpolation between these areas provide sufficient information to derive a total
basic shell structural weight. Special structural features are added to the basic
shell structure to derive the total body weight. The procedure employed is out-
lined in Figure 15-10.
WING STRUCTUREMASS-INITIAL SCREENING
Analysis regions for the initial screening of the candidate structural concepts are
indicated in Figure 15-9. They are described as follows:
15-39
| _ TOTAL
_-. I / WING SEGMENT
__ _,,:,,8 _ ,.¢.--J_../ ,: __.OO','._,:_,,,,,:N',"
.,._, ,.<__,.. j .,03° s,..,,.,,:R_,,,,,:_,Ac,,,,°___ s_,-,:CTS,'AC,NO
•_J= UNIT AREA I , _C_
/40236 "
n
!PLUS:
X,/J'_" -,_X." = BASIC BOX STRUCTURE MASS
BODY & OUTB'D JOINT RIBS, MLG WELL STR, ENG. & V. FIN RIB
FLAP, AILERON, SPOILER SUPT. STR.
FUEL BULKHEADS, ACCESS DOORS
JACK FTG'S, FAIRINGS, FILLETS, SEAL. & FINISH
LOCAL REINF., FASTENERS, SHIMS & CLIPS
PROVISIONS FOR SYSTEMS
!,
TOTAL = BOX STRUCTURE MASS
PLUS: L.E. & FLAPS
T.E. & FLAPS, SPOILERS, AILERONS
BODY FAIRING
MLG DOORS
1 n
TOTAL = WING MASS
Figure 15-9. Wing Mass Estimation Methodology
15-40

P
il _ SELECT SPACING
I
FRAME SPACING
FS FS4.064 19.05(160) (750)
i
B ANALYSIS AREAS
Wi = UNIT MASS
I I-. FS FS
50.80 63.50"-..._(2000) (2500)
Si = UNIT AREA
n
[_ W i Si =I
PLUS:
BASIC SHELL STRUCTURE MASS
NOSE AND FLIGHT STATION
NOSE LANDING GEAR WELL
WINDSHIELD AND WINDOWS
FLOORING AND SUPPORTS
DOORS AND MECHAN ISM
UNDER WING FAIRING
CARGO PROVISIONS
WING/BODY FRAMES AND FITTINGS
TAIL/BODY FRAMES AND FITTINGS
PROV. FOR SYSTEMS
FINISH AND SEALANT
TOTAL = FUSELAGE MASS
Figure 15-10. Fuselage Mass Estimation Methodology
15-41

Point Design Area
Region Location (Sq. Ft.)
40322 Forward Box 44.4
40536 Aft Box 35.6
41348 Tip Box 10.3
By interpolation from the analysis point design regions, unit weights for each con-
cept are applied to the panel areas shown in Figure 15-11 to derive the total box
structural weight.
The initial screening data includes a non-optimum allowance for surface-to-cap
joints of approximately 4-percent. Additional non-optlmum allowances are applied
to the box weight to arrive at a typical estimate of the "as-constructed" weight.
These non-optimum allowances are itemized as:
Non optimum
Factor (NOF)
Joints and splices to surface panels 7-percent
Margins of safety (average) 3-percent
Sheet tolerances 2-percent
System provisions (Electrical, Fuel Controls) 5-percent
Access provisions (one surface only) 6-percent
Finish, sealant, misc. 3-percent
Total NOF 26-percent
Use of these allowances, for example, means that a stress analysis which indicates
a five pound-per-square-foot panel yields an estimated fabricated weight of
(1.26 x 5.0) = 6.3 pounds per square foot.
For comparison purposes, the wing weight was divided into two major categories:
• Variable weight
• Fixed weight
The variable weight consists of that portion of the box structure which is influ-
enced by the structural concept being considered, such as the upper and lower sur-
faces and intermediate ribs and spars.
The fixed weight consists of those items which are unaffected by box structural
concept, such as main landing gear provisions, surface controls, engine support
structure, leading and trailing edge structure.
15-42

E
g_L Z Sd
gH)z Sd
_6L Sd
_L S:I
[ULSd
O_L S:l
OigL Sd
mLSd
OL ¢L Sd
Z
t.
u_
_-_
I
0
IL_
°_-I
_5-43

The least weight concept for each stiffening arrangement is listed in Table 15-21.
From this table, it appears that the convex beaded, chordwise stiffened arrangement
with composite reinforced spar cap is preferred throughout the wing box. Subse-
quent flutter optimization resulted in the monocoque arrangement to be preferred for
the tip structure from the least weight v_evpoint.
Chordwise Stiffened Design Concepts
The chordwise stiffened designs employ surface panel concepts that have stiffening
elements oriented in the chordwise direction. The substructure arrangement is
essentially a multispar structure with widely spaced ribs. Submerged caps are pro-
vided except at panel closeouts and at fuel tank bulkheads. Four surface panel con-
cepts were considered (see Section i Structural Design Concepts):
• Circular-arc concave beaded skin
• Circular-arc convex beaded skin
• Trapezoidal corrugation-concave beaded skin
• Beaded corrugation - concave beaded skin
The resulting wing weights are summarized in Table 15-22. The convex beaded con-
cept was found to be significantly l_ghter than the others evaluated. In all
cases, the spar weights are relatively heavy since the surface panels are ineffec-
tive in transmitting the wing span bending loads.
A general expression for deriving box panel unit weights, using the three analysis
point design regions as a starting point, is based on the following parameters:
• Inplane loads: Nx, Ny, Nxy
• Pressure loads: _p
The e_ression for the convex beaded optimum panel weight is:
Where,
N = axial chordwise load (ib/in)X
N = axial spanwise load (Ib/in)Y
N = panel shear flow (ib/in)xy
15-44

TABLE15-21. SU_.{_iARYOFWINGMASS- INITIAL SCREENING
PLANAREA
(ft2)
1231
5038
896
1047
1955
484
800
133
553
25O
225
ITEM
VARIABLE WEIGHT (A)
CENTER SECTION (BL 0--62)
UPPER SURFACE
LOWER SURFACE
SPARS
RIBS
INTERM. PANEL (BL 62--470)
UPPER
LOWE R
SPARS
RIBS
OUTER PANEL (BL 470-...TIP)
UPPER
LOWE R
SPARS
RIBS
FIXED WEIGHT
LEADING EDGE
TRAILING EDGE
BL 62 RIBS
BL 470 RIBS
FIN ATTACH R IBS
REAR SPAR
ENG. SUP'T STRUCTURE
MLG DOORS
- WHEEL WELL AND ATTACH.
WING/BODY FAIRING
LE FLAPS
TE FLAPS
AILERONS
SPOILERS
FUEL BULKHEADS
TOTAL (STRENGTH DESIGN
ON LY)
CHO RDWISE_CONVEX
BEADED
56,655
(8,722)
1,570
1,5_
4,884
693
(39,_6)
7,073
7,073
22,006
3,144
(8,637)
1,555
1,555
_837
690
(41,352)
5,235
_8881,4_
700
435
3,_0
3,590
_904
_750
1o800
1,1_
_890
1,280
1,360
_90o
98,007
(A) BASED ON 20-INCH SPAR OR RIB SPACING
SPANWISE
HATSTIFFENED
62,176
(9,380)
3,377
3,518
1,041
1,444
(43,478)
15,652
16,304
4,826
6,696
(9,318)
3,355
3,494
1,034
1,435
MONOCOQUE
H/C SAND.
WELDED
50,796
(8,274)
2,482
2,532
2,325
935
(35,514)
10,654
10,867
9,980
4,013
(7,008)
2,102
2,145
1,969
792
103,528 92,148
CHORDWISE
COMPOSITE
REINFORCED
43,624
(6,716)
1,570
1,570
2,878
698
(30,258)
7,073
7,073
12,963
3,144
(6,650)
1,555
1,555
2,850
690
= (41,352)
5,235
4,888
1,430
700
435
3,400
3,680
2,904
3,750
1,600
1,130
5,890
1,250
1,360
3,800
84,976
15-$5

TABLE15-22. ESTIMATEDWINGMASS- CHORDWISESTIFFENEDCONCEPT- INITIAL SCREENING
ITEM
VARIABLE WEIGHT:
CENTER SECTION
UPPER SURFACE
LOWER SUR FACE
SPAR CAPS AND WEBS
RIBS
INTERM. PANEL (BL. 62--. 470)
UPPER SUR FACE
LOWER SURFACE
SPARS
RIBS
OUTER PANEL (BL. 470 --_TIP)
UPPER SURFACE
LOWER SURFACE
SPARS
RIBS
FIXED WEIGHT:
LEADING EDGE
TRAILING EDGE
B.L. 62 RIBS
B.L. 470 RIBS
FIN ATTACH RIBS
REAR SPAR
ENG. SUP'T. STRUCTURE
MLG DOORS
WHEEL WELL AND ATTACH.
WING/BODY FAIRING
LE FLAPS
TE FLAPS
AILERONS
SPOILERS
FUEL BULKHEADS
TOTAL (STRENGTH DESIGN
ONLY)
CONCAVE
BEADED
(58,660)
(9,030)
1,716
1,716
4,876
722
(40,687)
7,730
7,730
21,970
3,257
(8,943)
1,699
1,699
4,829
716
(41,352)
5,235
4,888
1,430
7O0
435
3,400
3,580
2,904
3,750
1,600
1,130
5,890
1,250
1,360
3,800
100,012
15-46
CONVEX
BEADED
(56,655)
(8,722)
1,570
1,570
4,884
698
(39,296)
7,073
7,073
22,006
3,144
(8,637)
1,555
1,555
4.837
690
98,007
TRAPEZOID
NO BEAD
(60,236)
(9.273)
1,762
1,762
5,007
742
(41,780)
7,938
7,938
22,561
3,343
(9,183)
1,745
1,745
4,959
734
101,588
TRAPEZOID
BEADED
(61,743)
(9,505)
1,901
1,901
5,038
665
(42,825)
8,565
8,565
22,697
2,998
(9,413)
1,883
1,883
4,989
658
103.095
-----(41,352)
5,235
4,888
1,430
700
435
3,400
3,580
2.904
3.750
1,600
1,130
5,890
1,250
1,360
3.800

The total variable weight, then, after interpolating to deter_r_ine each box panel
unit weight is:
-!
n
Wv = ( _ wl s)(z.26)i
For the convex beaded concept:
(Reference Figure 15-9)
Wv 56,655 (lb)W = 56,655 pounds; w - - = 7.91 psf
v ave Sbo x 7,165 (ft 2)
This result is based on the unit weights for the three analysis regions as tabulated
below:
PANEL CONCEPT
Concave-Beaded
Convex-Beaded
Trapezoidal Corrugation
Beaded Corrugation
Point Design Regions (A) wav e
(incl. 1.26
40322 40536 41348 NOF)
Unit Weights- Pound per square foot
11.45
11.30
11.55
11.60
9.85
9.75
9.90
i0.00
4.10
3.80
4.35
4.6o
8.19
7.91
8.41
8.62
(A) Unit Weights do not include non optimum factor (NoF
The total variable weight for the other concepts was facilitated by deriving a gen-
eral expression, where:
Wv =\5.17/ . , 13 lJ
Temperature variation between panels is small and has negligible effect on the
process of weight interpolation, since the structural concept for each point design
already accounts for the effects of thermal stresses. For this reason, weight
interpolation has been performed as a function of inplane loads and normal pressure
loads.
15-47

SpanwiseStiffened DesignConcepts
The spanwisestiffened wing concept is a multirib designwith closely spacedribsandwidely spacedspars. Thesurface panel configurations have effective load car-rying capability in their stiffened (span) direction. Smoothskins are requiredfor aerodynamicperformance. The four spanwise stiffened designs investigated are
as follows:
• Zee stiffened
• Integral zee stiffened
• Hat stiffened
• Integral stiffened
Their comparative weights are summarized in Table 15-23. As indicated on the
table, the hat stiffener concept is the least weight. In all cases, the spar
weights are relatively light, compared to the chordwise stiffened designs due to
the ability of the surfaces to carry spanwise inplane loads.
A general expression for deriving box panel unit weight is:
where:
N = axial chordwise loadX
N = axial spanwlse loadY
N = panel shear flowxy
_p = pressure load
(Ib/in)
(ib/in )
(ib/in)
(ib/in2)
Unit weights for each analysis panel of the four structural concepts are from
Section 12 and are summarized below:
Panel Concept
Zee stiffened
Integral zee
Hat stiffened
Integral stiffened
Point Design Region (A)
40322 40536 h1348
Wave
(incl. 1.26
_OF)
Unit Weight- Pound Per Square Foot (psi)
4.95
_. 70
h .70
5._0
13.3O
13.8o
13.75
14.25
8.55
8.50
8.50
9.65
8.77
8.69
8.68
9.58
(A) Unit weights do not include non optimum factor (NOF)
15-48

TABLE 15-23. ESTIMATED WING MASS - SPANWITE ST_FENED CONCEPT - INITIAL SCREENING
ZEE INTEGRAL HAT INTEGRAL
ITEM STI FFEN ED ZEE STI FFENED STI FFENED
__ =-
E
m
t
Z'Z
VARIABLE WEIGHT
CENTER SECTION
UPPER SUR FACE
LOWER SURFACE
SPAR CAPS AND WEBS
RIBS
INTERM. PANEL (BL 62--470)
UPPER SUR FACE
LOWER SURFACE
SPARS
RIBS
OUTER PANEL (BL 470 ---TIP)
UPPER SURFACE
LOWER SURFACE
SPARS
RIBS
FIXED WEIGHT
LEADING EDGE
TRAILING EDGE
B.L. 62 RIBS
B.L. 470 RIBS
FIN ATTACH RIBS
REAR SPAR
ENG. SUP'T. STRUCTURE
MLG DOORS
MLG WHEEL WELL AND ATTACH.
WING/BODY FAIRING
LE FLAPS
TE FLAPS
AILERONS
SPOILERS
FUEL BULKHEADS
TOTAL (STRENGTH DESIGN
ONLY)
(62,827)
(9,479)
3,659
3,327
1,043
1,450
(43,931 )
16,957
15,420
4,832
6,722
(9,417)
3,635
3,305
1,036
1,441
(41,352)
(62,248)
(9,393)
3,428
3,475
1,043
1,447
(43,528)
15,888
16,105
4,832
6,703
(9,327)
3,404
3,451
1,036
1,436
(62,176)
(9,380)
3,377
3,518
1,041
1,444
(43,478)
15,552
16,304
4,826
6,696
(9,318)
3,355
3,494
1,o34
1,435
(68,601)
(10,353)
4,286
3,572
1,046
1,449
(47,962)
19,856
16,547
4,844
6,715
(10,286)
4,258
3,549
1,039
1,440
•_ (41,352)
5,235
4,883
1,430
700
435
3,400
3,580
2,904
3,750
1,600
1,130
6,890
1,250
1,360
3,800
104,179
5,235
4,883
1,430
700
435
3,400
3,580
2,904
3,750
1,600
1,130
5,890
1,250
1.360
3,800
103,600 103.528 109,953
15-49

Total variable weight after interpolating to determine each box panel weight is:
W =
v wisi)(1.26)1
For the hat stiffener concept, total variable weight is 62,176 pounds.
results in an average box unit weight of 8.68 pounds per square foot:
This
Wave(Ib/ft2) -- [(62,176)+ (7165)] = 8.68
Total variable weight for the other structural concepts was facilitated by deriving
a general expression where:
Wv = \5.275! 3 w40322 + w_0536 + wh1348 1.26
The weight distribution between center, intermediate and tip box structure was
taken to be proportional to that found in the hat stiffened concept. Weight dis-
tribution between surfaces, ribs and spar is based on the structural analysis data
of Section 12.
Monocoque Design Concepts
The monocoque construction consists of biaxially stiffened panels which support the
principal load in both the span and chord direction. For the substructure arrange-
ment, both multirib and multispar designs were evaluated. The initial screening
and detailed analysis mass estimation of these concepts were performed concurrently
and are reported in Monoeoque Wing Design section.
WING STRUCTURE MASS-DETAILED CONCEPT ANALYSIS
As a result of the initial screening process, each of the most promising concepts
were investigated further through the analysis of three additional point design
regions. The results of this anal_'sis effort is snmmarized in Table 15-2h.
15-5o
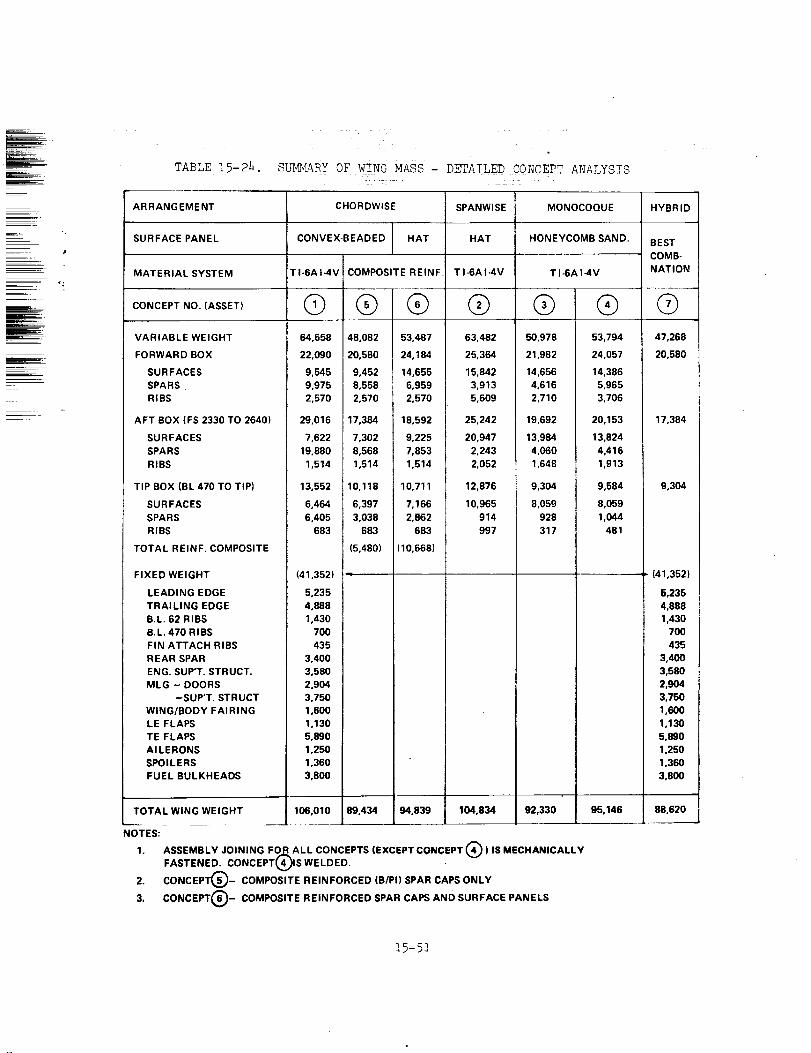
f_,,
TABLE 15-24. SU_4ARY OF WING MASS - DETAILED CONCEPT ANALYSIS
:_ uu:
ARRANGEMENT
SURFACE PANEL
MATERIAL SYSTEM
CONCEPT NO. (ASSET)
CHORDWISE
CONVEX-BEADED ] HAT
TI-6AI-4V COMPOSITE REINF.
Q ® ®VARIABLE WEIGHT 64,658 48,082
FORWARD BOX 22,090 20,580
SURFACES 9,545 9,452
SPARS 9,975 8,558
RIBS 2,570 2,570
AFT BOX (F6 2330 TO 2640) 29,016 17,384
SURFACES 7,622 7,302
SPARS 19,880 8,568
RIBS 1,514 1,514
TIP BOX (BL 470 TO TIP) 13,552 10,118
SURFACES 6,464 6,397
SPARS 6,405 3,038
RIBS 683 683
TOTAL REINF. COMPOSITE (5,480)
FIXED WEIGHT (41,352) --
LEADING EDGE 5,235
TRAILING EDGE 4,888
B.L. 62 RIBS 1,430
B.L. 470 RIBS 700
FIN ATTACH RIBS 435
REAR SPAR 3,400
ENG. SUP'T. STRUCT. 3,580
MLG - DOORS 2,904
-SUP'T. STRUCT 3,750
WING/BODY FAIRING 1,600
LE FLAPS 1,130
TE FLAPS 5,890
AILERONS 1,250
SPOILERS 1,360
FUEL BULKHEADS 3,800
SPANWISE
=
HAT
T1-6AIJ, V
MONOCOQUE
HONEYCOMBSAND.
TI_AIJ, V
0 (D53,487 63,482
24,184 25,364
14,655 15,842
6,959 3,913
2,570 5,609
18,592 25,242
9,225 20,947
7,853 2,243
1,514 2,052
10,711 12,876
7,166 10,965
2,862 914
683 997
(10,668)
TOTAL WING WEIGHT 106,010 89,434 94,839 104,834
NOTES:
1.
2.
3,
@ @50.978 53,794
21,982 24,057
14,656 14,386
4,616 5,965
2,710 3,706
19,692 20,153
13,984 13,824
4,060 4,416
1,648 1,913
9,304 9,584
8,059 8,059
928 1,044
317 481
92,330 95,146
HYBRID
BEST
COMB-
NATION
47,268
20,580
17,384
9,304
(41,352)
5,235
4,888
1,430
7OO
435
3,400
3,580
2,904
3,750
1,600
1,130
5,890
1.250
1,360
3,8OO
88,620
ASSEMBLY JOINING FO_ALL CONCEPTS (EXCEPT CONCEPT @ ) 18 MECHANICALLY
FASTENED. CONCEPT 4(_1S WELDED.
CONCEPT(_- COMPOSITE REINFORCED (B/PI) SPAR CAPS ONLY
CONCEPT@- COMPOSITE REINFORCED SPAR CAPS AND SURFACE PANELS
15-51
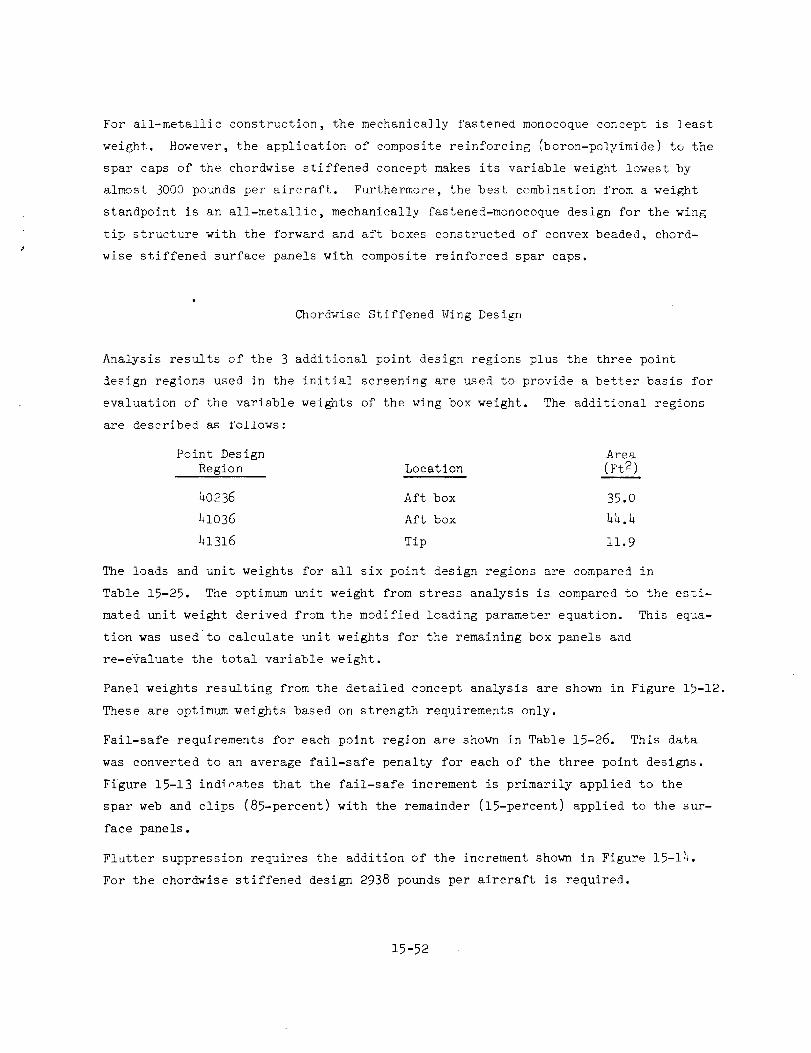
For all-metallic construction, the mechanically fastened monocoque concept is least
weight. However, the application of composite reinforcing (boron-polyimide) to the
spar caps of the chordwise stiffened concept makes its variable weight lowest by
almost 3000 pounds per aircraft. Furthermore, the best combination from a weight
standpoint is an all-metallic, mechanically fastened-monocoque design for the wing
tip structure with the forward and aft boxes constructed of convex beaded, chord-
wise stiffened surface panels with composite reinforced spar caps.
Chordwise Stiffened Wing Design
Analysis results of the 3 additional point design regions plus the three point
design regions used in the initial screening are used to provide a better basis for
evaluation of the variable weights of the wing box weight. The additional regions
are described as follows:
Point Design Area
Region Location (Ft 2)
40236 Aft box 35.0
41036 Aft box 4L.4
41316 Tip 11.9
The loads and unit weights for all six point design regions are compared in
Table 15-25. The optimum unit weight from stress analysis is compared to the esti-
mated unit weight derived from the modified loading parameter equation. This equa-
tion was used to calculate unit weights for the remaining box panels and
re-evaluate the total variable weight.
Panel weights resulting from the detailed concept analysis are shown in Figure 15-12.
These are optimum weights based on strength requirements only.
Fail-safe requirements for each point region are shown in Table 15-26. This data
was converted to an average fail-safe penalty for each of the three point designs.
Figure 15-13 indicates that the fail-safe increment is primarily applied to the
spar web and clips (85-percent) with the remainder (15-percent) applied to the sur-
face panels.
Flutter suppression requires the addition of the increment shown in Figure 15-14.
For the chordwise stiffened design 2938 pounds per aircraft is required.
15-52

TABLE 15-25. PANEL LOAD AND UNIT WEIGHT - CHORDWISE STIFFENEI_ DESIGN
PANEL UNIT WEIGHTS
POINT
DESIGN
REGION
40322
40236
40536
41036
41316
41348
INPLANE LOADS
N x
Ny , (Ib/in.)
NXy
488
-1,063
-120
658
-16,387
-1,316
-1,305
-14,379
-2,354
-1,442-9,156
-2,237
571
-16,982
+4,807
-1,433-10.800
2,483
PRESSURE LOADS
UPR.
LWR. (Ib/in 2)
-8.33
-9.47
17.80
-8.96-10.14
19.10
-7.47
-8.29
15.76
-1.27
0.11
1.38
4.98
-0.26
5.24
-5.07
1.0
6.07
TOTAL
UPR
LWR _,SPARS
RIBS
(A)
(B)
WpANEL = [INxJ + INyI * J2NxyI + 3501Apl ] +2100
INCLUDES STRESS NON OPTIMUM FACTOR
3.800.83
0.94
1.53 (B)
0.50
12.08
1.03
1.25
9.15 (B)
0.65
11.301.61
1.34
7.75 (B)
0.60
8.25
1.35
1.45
4.95
0.50 (B)
15.38
2.60
2.05
10.13
0.60 (B)
9.75
1.63
1.326.20
0.60 (B)
(Ib/ft 2)
PANEL ESTIMATED
WEIGHTS
WpANEL (A)
(Ib/ft 21
3.82
12.55
12.33
7.40
13.81
9.20
i5-53
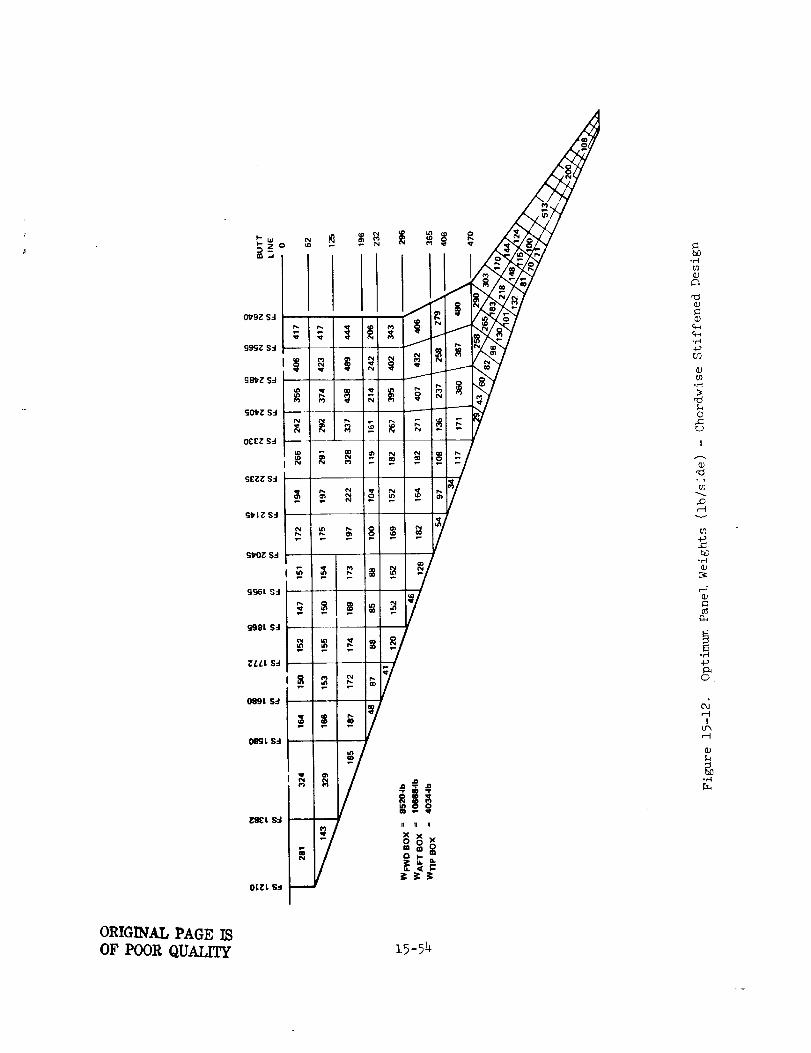
O[ZL S:t
t/lID
n:J
.r..t
U?
0
I
,.o
0_
f:
I1)
a_
(2)
_d!
Itl
t_
ORIGINAL PAGE ISOF POOR QUALITY 15 -54

TABLE 15-26. COMPONENT WEIGHT DERIVATION - CHORDWISE
DETAILED CONCEPT ANALYSIS
STIFFEI$ED DESIC
3.0
U.
_a
2.0
.J
<zUJ
p-1.0
I.,t.I
,CLIPS PANELS
I ICHORDWISE ARRANGEMENT
CONVEX- BEADED PANEL
POINT DESIGN REGION 40536
L,,__,_.. SPAR WEB
0 20 30 40
SPAR SPACING, IN.
Figure 15-13. Component Weight Penalties for a D_maged Spar Cap Chordwise Arrangement
15-56

D+
izc_wNO OZ
0'"
O
XX OQ I,- -
O_ W
_- -SaqO,ZL _ ,,z, _ z
uJ:E ¢n <:
SV3H 991;' = QAZ'I,
SV3_I g_t_ = IA
SV=I)I 6L£ = "A
X(N¢3
.-,e-- -- Sg'I 01._Z-
$8"1 0'I_Z
"1 _ Sg"l ,"'3"v_N
_- $8"1 0LS_
$8"1 _S/.Z '
,_ eq
+ L" _ __
] ix',,_1 _1 J(N
! iiO
(SB'I) .LH_)I3M SS3N::I-II/S "IVNOISEIO/dlJ. _)NIM
i.n
c3ko,1¢
==03
OO3
ACO<_LLIVv
ILlILl
(,0
n,"UJk-l--
--IU.
t_3-.--i
0J
_C
o3
;>O
q_
°r-t
H
q)
ILr_
O_
°_
z5-57

A build-up to total box weight, including the above increments is tabulated in
Figure 15-15. Cumulative plots of the "strength" weight versus span are agso shown.
From the total box weight of Figure 15-15, equations were developed to express the
average box unit weight in terms of the detailed stress analysis point design region
unit weight:
Wfwd box (ib/ft 2) = 0.1220 (9w40322 + w41036)
Waft box (!b/ft2) = 0.3162 (w40236 + w40536 + 2w41036)
Wtip box (Ib/ft2) = 0.3465 (w41316 + w41348 + 2w40322)
These equations are used in Table 15-26 to derive the component weight breakdown
shown in Table 15-24.
Spanwise Stiffened Wing Design
The detailed concept analysis weights for the hat stiffene_ concept are obtained by
incorporating into the estimation procedure, the results of the 3 additiona] point
design regions (40236, 41036 and 41316).
The loads and unit weights for all 6 point design .'egions are compared in Table 15-27.
The optimum unit weight from stress analysis are compared to the estimated unit
weight derived from the modified loading parameter equation. This equation
(Table 15-27) was used to calculate the unit weights for the remaining box panels
and to reevaluate the total variable weight.
Panel weights resulting from this analysis are shown in Figure 15-16. These are
optimum weights based on strength requirements only. No fail-safe increments are
required for the spanwise stiffened design.
Flutter suppression requires the addition of the increment shown in Figure 15-14 to
the wing tip structure. For the spanwise stiffened design 2928 pounds per aircraft
is required to achieve the required flutter margin.
15-58

12
CHORDWlSE STIFFENED _ CONVEX BEADED
WEIGHT/SIDE (LB.
FWD. BOX AFT BOX
STRENGTH ONLY
NON-OPTIMUM
FAIL-SAFE
FLUTTER
TOTAL
8,520 10,668
+2,215 +2,774
+310 +1,066
11,045 14,508
TIP BOX
4,034
+1,049
+224
+1,469
6,776
10668
(10.01
P=f) _._10
ql-
I.-..I-Eg,J
j=I,M
>
--I
:E
¢J
z
8520
(4.12
psf)
AFTBOX6
0
I '111
0 200 400 o 600 800 1000I¢
B'L" _" IN" I DIST. ALONG REAR BEAM _-- IN.
Figure i5-15. Wing Structure Mass Estimate for Chordwise Stiffened Design
15-59
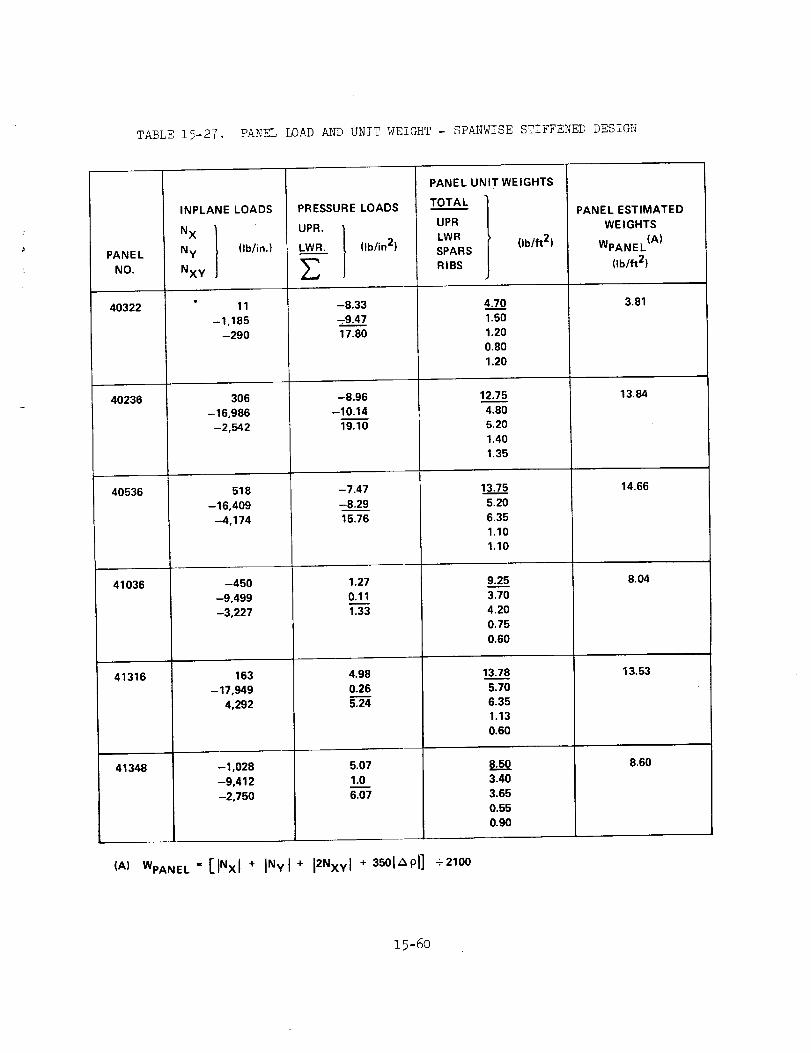
TABLE 15-27. PANEL LOAD AND UNIT WEIGHT - SPANWISE STIFFENED DESIGN
PANEL
NO.
40322
40236
40536
41036
41316
41348
INPLANE LOADS
NX 1_ (Ib/in.)Ny
NXy ]
11
-1,185
-290
306
-16,986
-2,542
518
-16,409
--.4,174
-450
-9,499
-3,227
163
-17,949
4,292
-1,028
-9,412
-2,750
PRESSURE LOADS
UPR. ]LWR. lib/in 2)
-8.33
_9-4..__..Z717.80
-8.96
-10.14
19.10
-7.47
-6.2915.76
1.27
0.111.33
4.98
0.265.24
5.07
1.0
6.07
PANEL UNIT WEIGHTS
TOTAl..
UPR
LWR , (ibiS2)SPARS
4.7__01.50
1.20
0.80
1.20
12.754.80
5.20
1.40
1.35
13.7.._.._55.20
6.35
1.10
1.10
9.25
3.70
4.20
0.75
0.60
13.785.70
6.35
1.13
0.60
3.40
3.65
0.55
0.90
RIBS
PANEL ESTIMATED
WE I GHTS
WpANEL (A)
(Ib/ft 2)
3.81
13.84
14.66
8.04
13.53
8.60
(AI WpANEL= [INxl + INyI * 12NxYI + 3solidi] -:21oo
15-6o
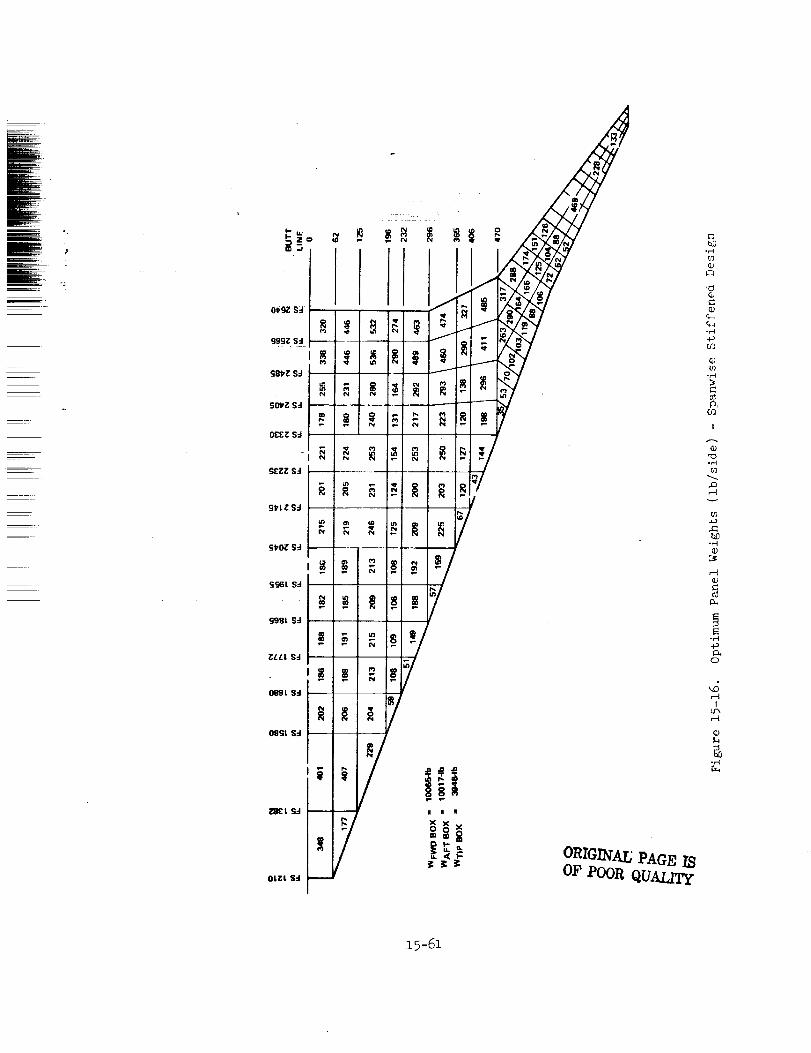
m
ggGL S:I
cj99L S:I
_LLL S::J _ mO_9t S-,J
OtZZ Sd
g i_ II
ORIGINAI_ PAGE IS
OF POOR QUALF/y
b_
*rd
O3-r-I
t_
O3
!
_g,eqm
m
(1)
r'-'t
I1)
,el
4-_
0
,S1
I1)
.el
_5-6_

A _uild-up of the total weight for each box o-_._m_no is tabulated on Figure 15-17.
Cumulative plots of the strength-design weights versus span are also shown.
Aonocoque Wing Design
_o section presents the initial screenin_ and detailed concept analysis mass esti-
mation results for the monocoque designs. The three surface panel concepts _nvesti-
gated are as follows:
• Honeycomb sandwich - aluminmm brazed - welded closures
• Honeycomb sandwich - aluminun_ brazed - mechanical fasteners
• Truss-core sandwich - mechanical fasZeners
The relative weigi_ts for these 3 concepts are shown in Figure 15-I_. These initial
weights are for a 20-inch spar spacing and do not include allowance for weight incre-
ments for fail-safe design or flutter suppression. The data shown on Table 15-28
_ncludes allowance for fail-safe and flutter suppression requirements. Appropriate
spar spacing, as shown on the structural arrangement drawings of Section 18, are also
considered in determining the detailed weights _resented.
The basic unit weight data resulting from the detailed concbpt analysis are presented
in Section 12 for the monocoque designs. These data identify unit weight of the
surface manels, substructure, and combined surface panels and substructure at each
point design region for strength requirements.
The scaling equation used for weight interpolation between the design analysis panels
is shown in Table 15-29 for the welded closure concept:
w (lb/ft_) = [(l_xl+I Nyl +I 2_xyl+ 3501A_)+(3000)]
with the notation as described earlier for the Chordwise Stiffened Design Concepts.
Panel weights resulting from this interpolation process are shown,in Figure 15-19 for
the welded closure design.
Weight equations were developed for the wing forward, aft and tip box areas which
depend upon the detail stress analysis at each point design region:
15-62

_: 4
SPANWISE STIFFENED - HAT sEcTION
STRENGTH ONLY
NON-OPTIMUM
FAI_L-_SA_FE_
(9.395 PSF)
(A) 10,017
(F) 10,06510
(4.866 P_F)
8
TOTAL
FWD. BOX
8t,-
I---i-_3M,I
4
(.9Z
WEIGHT/SIDE (LB.
10,065
2,617
12,682
AFT BOX
10,017
2,604w
12,621
TIP BOX
3,948
1,026
1,464
6,438
(8.812 PSF)
wo. ox o
0 200 400 _ 600 800 1000
I DIST. ALONG REAR BEAM _,-IN.B.L. -'-, IN.
Figure 15-17. Wing Structure Mass Estimate for Spanwise Stiffened Design
15-63

WIllo
w
8
0
w
o
o
>-w
Zow-
Ix_
a-J
I I, I
! I
I
_z_
+_
E
oej
0
o
I
o
.e-{
or_.)
-o
°_
e.)
orj
_dI
©
15-64

TABLE 15-28. ESTIMATED WING MASS - MONOCOQUE DESIGN CONCEPT
HONEYCOMB HONEYCOMB
#
ITEM
VARIABLE WEIGHT (Ib)
FORWARD BOX (Ib)
MECH. FAST.
50,978
(21,982)
WELDED
53,794
(24,057)
TRUSSCORE
59,066
(28,667)
SURFACES
SPA RS
RIBS
AFT BOX
SURFACES
SPARS
RIBS
TIP BOX
SURFACES
SPARS
RIBS
(Ib)
(Ib)
FIXED WEIGHT (Ib}
TOTAL WING WEIGHT (Ib)
14,656
4,616
2,710
(19,692)
13,984
4,060
1,648
(9,304)
8,059
928
317
41,352
92,330(A)( TM
14,386
5,965
3,706
(20,153)
13o717
4,523
1,913
(9,584)
8,059
1,044
481
41,352
95,146 (B)(D)
20,104
5,502
3,061
(2O,748)
14,948
3,945
1,855
(9,651)
8,424
806
421
41,352
100,418 (c)(D)
(A) INCLUDES A FAIL-SAFE WEIGHT INCREMENT OF 762 LBS.
(B) INCLUDES A FAIL-SAFE WEIGHT INCREMENT OF 567 LBS.
(C) INCLUDES A FAIL-SAFE WEIGHT INCREMENT OF 454 LBS.
(D) INCLUDES A FLUTTER WEIGHT INCREMENT OF 2,340 LBS.
15-65

TABLE 15-29. PANEL LOAD AND UNIT WEIGHT - MONOCOQUE WELDED DESIGN
PANEL
NO.
40322
40236
40536
41036
41316
41348
INPLANE LOADS
NX l
Ny (Ib/in.)
NXy j
51
-529
-191
-1,193
-11,63 8
-2,099
-3,272
-11,787
1-4,795
-2,219
-6,423
-3,209
-1,587
-12,183
+3,310
-1,190
-7,263
+3,285
PRESSURE LOADS
UPR.
LWR. _ (Ib/in 2)
-8.33
-9.47
17.80
-8.96
-10.14
19.10
-7.47
-8.29
15.76
1.27
0.11
1.33
4.9 8
0.26
5.24
5.07
1.0
6.07
PANEL UNIT WEIGHTS
TOTAL
UPR
LWR
SPARS ] (IbiS2)
RIBS !J
4.4_._Z_1.14
0.98
1.65
0.70
8.60
2.51
2.91
2.22
0.96
8.64
2.92
3.30
1.72
0.70
5-3.__.Z71.87
1.94
1.09
0.47
7.25
2.71
3.14
1.01
0.39
5.7___902.022.24
1.12
0.33r r
PANEL ESTIMATED
WEIGHT
WpANEL (A)
(Ib/ft 2)
2.40
7.91
10.05
5.18
7.40
5.72
(A) WpANE L '= ['INxl + INyI + 12NxYI + 35o1 1] +3000
15-66

/_ _
_9<1)
,---tr_
I1)
r-t
v
©
0
0
I
m
-g
,--I(1)
.r-I4._
&
alI
OLEL IL
ORIGI_A_ P_GE ISOF PO0/_ QUA//Ty
15-67

Wfb kfb(6w40322+w4103 )
Wab -- kab lwL023_ + _053_ + _103_j)
Wtb = ktb (w41316 + 2w41348)
Using the welde_ closure configuration as an example, Table 15-30 presents the method
used to derive component weights shown in Table 15-31 and summarized in Table 15-28.
The basic data used for the analyses are presented in Table 15-32.
The d_mage tolerance and flutter suppression weight increments are superimposed on
the above results. A flutter penalty of 2340 pounds is identified in Figul-e 15-14
for the monocoque design. This value is an estimated amount over the strength-
design requirements to be applied to the stiffness critical wing ti_ structure.
Fail-safe critical areas are identified for both the wing tip (inboard) and the aft
box in Figure 15-20. The weight increment is based on fail-safe analysis of the
2 point design regions indicated. The results of these analyses, as shown in
Section 13, indicates that sizable penalties are required to meet the fail-safe
requirements. However, the use of the fail-safe reinforcement provides additional
cross sectional area which reduces the spanwise (Ny + 1.5 _) limit stress level
from 52 ksi to 35 ksi or approximately 33 percent. This permits further reduction
of the surface panel thickness and fail-safe reinforcement. This load redistribu-
tion process results in a surface panel thickness and fail-safe reinforcement com-
bination shown on Table 15-33 and 15-34 for point design regions 40536 and h1348,
respectively. As indicated on the tables, these results are applied to establish
the mass increment to satisfy the fail-safe requirements for the wing aft box and
tip box structure. The applicable areas (Figure 15-20) were obtained by reviewing
the critical inplane loads and surface panel thicknesses and comparing the resulting
limit stresses to the stress levels at the respective point design regions. The
tables further define the weight increment for the various insert/closures used
with the honeycomb panel design. It is noted that the welded closure method requires
a smaller fail-safe increment than the mechanically fastened approach. Also, the
welded method results in 540 _ound reduction in fuel tank sealant in the forward
and aft boxes. Unfortunately, the panel edges required for sufficient weld thick-
ness and module-approach of assembly results in the welded design to be three-
percent heavier than the mechanically fastened design.
15-68

TABLE 15-30. COMPONENT UNIT WEIGHT DERVYATION - MONOCOQUE WELDED DESIGN
i:
E
=
OPTIMUM BOX
WEIGHT (Ib/side)
FWD
AFT
TIP
95O8
7871
2781
PLANFORM
AREA (ft2/side)
2_8.3
1_6.2
448.0
OPTIMUM
UNIT WT.
(psf)
4.597
7.382
6.207
UNIT WT.
X NON OPT (INCL N,O.F.)FACTOR (pd)
1.26
1.26
1.26
L.....
5.792
9.302
7.821
UNIT WEIGHT EQUATION (20-inch SPAR SPACING):
Wfb = 0.180 (6 X 4.47 + 5.37) = 5.792 psf
Wab = 0.4114 (8.6 + 8.64 + 5.37) = 9.302
Wob = 0.4194 (7.25 + 2 X 5.70) = 7.821
15-69

TABLE15-31. ESTIMATEDWINGSTRUCTUREMASS- MONOCOQUE(WELDED)CONCEPT
ITEM
FWD. BOX (AREA = 4136.6 ft2/AIRCRAFT) TOTAL =
w = 0.180 (6 X 2.63 + 3.9) =SURFACES _ REDUCED TANK SEALANT REQUIREMENT =
UNIT
WEIGHT
(psf)
5.816
3.543
-0.065
SPARS w = 0.180 (6 X 1.16 + 1.05) =
RIBS w = 0.180 (6 X 0.75 + 0.48) =
SURFACES
AFT BOX (AREA = 2132.4 ft2/AIRCRAFT) TOTAL =
REDUCED TANK SEALANT REQUIREMENT =w = 0.4114 (5.54 + 6.5 + 3.9) =
1.442
0.896
9.45____Z
-0.125
6.558
SPARS
RIBS
l w = 0.4114 (2.08 + 1.54 + 1.05)FAI L-SAFE PROVISIONS
w = 0.4114 (1,00 + 0,70 + 0.48)
OUTER BOX (AREA = 896 ft2/AIRCRAFT)
l w = 0.4194 (6.22 + 2 X 4.50)SURFACES FLUTTER PREVENTION
,_ w = 0.4194 (0.72 + 2 X 0.85)SPARS J FAIL-SAFE PROVISIONS
RIBS w = 0.4194 (0.48 + 2 X 0.40)
TOTAL =
1.921 }0.20
0,897
10,697
" 6.383
2.612
1.015 )_f
0.150 I
0.537
BOX
WEIGHT
(Ib)
24,057
14,656-270
5,965
3,706
-267
13,984
4,523
1,913
9,584
5,719
+2,340
1,044
481
15-70

TABLE15-32. BASICUNITWEIGHTDATAFORMONOCOQUECONCEPTS
DESIGN
CONCEPT
HONEYCOMB
SANDWICHBRAZED-
WELDED
HONEYCOMB
SANDWICH
BRAZED-
MECH.
FASTENERS
TRUSSCORE
SANDWICH
MECH.FASTENERS
POINT
DESIGN
40322
40236
40536
41036
41316
41348
40322
40236
40536
41036
41316
41348
40322
40236
40536
41036
41316
41348
SPAR
SPAC. (in.)
34.0
23.4
23.4
23.4
35.0
30.0
34.0
23.4
23.4
23.4
35.0
30.0
SURFACES
2.63
5.54
6.50
3.90
6.22
4.50
2.63
5.54
6.50
3.90
6.22
4.50
UNIT WEIGHTS (psf)
SPARS RIBS
1.16
2.08
1.54
1.05
0.72
0.85
0.75
1.00
0.70
0.48
0.48
0.40
0.54
0.88
0.60
0.40
0.34
0.26
0.60
0.90
0.70
0.50
0.50
0.30
34.0
23.4
23.4
23.4
35.0
30.0
3.75
5.85
6.70
4.50
6.50
4.85
0.86
1.85
1.35
0.82
0,56
0.74
1.10
1.90
1.35
0.80
0.50
0.60
TOTAL
4.54
8.62
8.74
5.43
7.42
5,75
4.03
8.27
8.45
5.12
7.12
5.50
5.45
8.65
8.75
5.80
7.50
5.75
REFER TO SECTION 12 STRUCTURAL CONCEPT ANALYSIS
15 -71

41348
CLAIRPLANE
BL470
I
40536
FS 2640
FS 2330
;,:,:,:
!i!i!iii!i!!!_
FAIL-SAFE
CRITICAL
AREA
ASFs = 1013.2 FT 2PER
AIRCRAFT
"AI L-SAF E
CRITICAL
AREA
Z_SFS = 448 FT 2PER
AIRCRAFT
Figure 15-20. Fail-Safe Critical Areas of Wing Structure
15-7a

xo
E_
I
E-t
r_b-.t
U)
IU'N
O'l I'_..,i ¢,+j
°!°, .+.:._
I I I
I I I
,_oci
.,t+.m_c/6_
t_ t_ t_
g,
++
+,_+,.z_._.
°ii1
I
e_ 6
I I 1
g
_ _mr.
+ __.+r-. +m_
+++0 w
++<<
m 0_+C0'u"
15-73

X
I
H
H,<
r-_
,<
WUJ
Z
a.
U.UJ
I-).-'I"
<_
a..<
Ore c !ZI.-
cn
Q.
.I- a
__.8 ",.
Z
Q
] I-
_r3 u_
Ow QUQ I->'._ ZWGUzz 2O<
• ,- o
t _ ,r-
I_ Ill i_
o_ oo oo
. _ . . 0 , ° . .ooo ooo ooo
¢0,- ! Io
w III
_ M
,,°7,-w I i I
LU
0
0 o o
O_ I I i
_-<<z u) u. u.uJQ
15 -%

Composite Reh, forced-Chordwise Stiffened Wing Design
The chordwise stiffened arrangemen{ _$scr_bed earlier.-p£6v]des the basic apprsach- n ....... _L-- -
offering the maximum mass savings potential for application of composites to the
design. The two composite reinforced designs investigated are as follows:
• Composite reinforced spar caps with metallic beaded surface panels
• Composite reinforced spar caps and surface panels
A comparison of these two reinforcing methods are presented in Table 15-35 with their
all-metallic counterpart. The results.show an ll-percent to 13-percent reduction in
total wing weight,. Initial screening data used to derive this comparison is reported
in Section 12.
Since the aforementioned results indicated that both concept weights were very close
to each other, further detailed analyses were conducted. The resul%s of the latter
is presented in Tables 15-36 and 15-37. An interesting conclusion, when comparing
the reinforced spar caps only with the all metallic design, is a one pound
reduction in structure weight for each O.hO-pound of B/PI composite rein-
forcing material used.
Using the same equations as described earlier in the Chordwise Stiffened Design
section, the box component weights are derived in Tables 15-38 and 15-39. Fig-
ure 15-21 shows the relationship between the all-metallic and composite reinforced
spar cap optim'_ panel unit weights. For a minimum-gage all-metallic design (3.8 psf)
there is no weight reduction possible by reinforcing the spar caps, since no further
reduction in gages is possible. However, for a highly loaded all-metall.ic panel
weighing 15 pounds per square foot, the addition of 2.4 pounds per square foot of
composite reinforcement to the spar caps will reduce the overall panel weight to
9 pounds per square foot.
Wing Tip Mass for Structural Arrangements
Surface panel shear thickness is a critical parameter for evaluation of outer wing
torsional stiffness and flutter speed. Therefore, the estimated thicknesses used in
the NASTRAN 2-D model were compared with thSse derived from the detailed stress
analysis (strength design only) as shown in Figures 15-22 through 15-24. This data
15-75
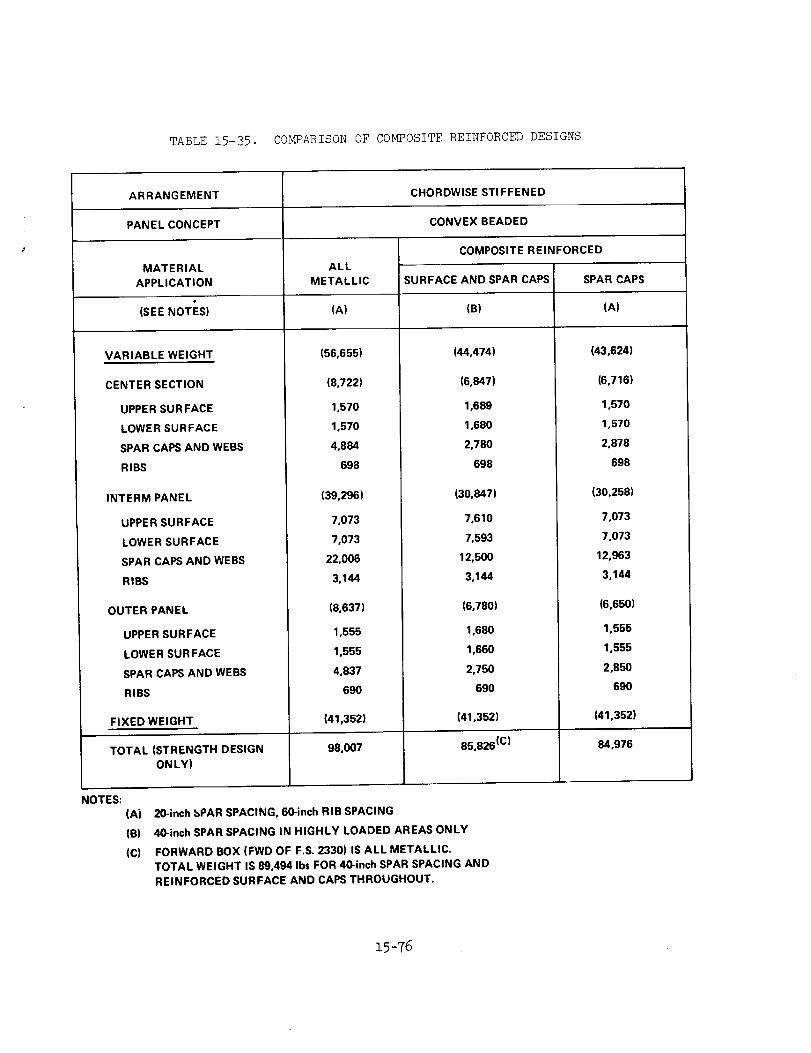
TABLE 15-35. COMPARISON OF COMPOSITE REINFORCED DESIGNS
ARRANGEMENT CHORDWISE STIFFENED
PANEL CONCEPT CONVEX BEADED
COMPOSITE REINFORCED
MATERIAL
APPLICATION
ALL
METALLIC SURFACE AND SPAR CAPS SPAR CAPS
(SEE NOTES) (A) (B) (A)
VARIABLE WEIGHT
CENTER SECTION
UPPER SUR FACE
LOWER SURFACE
SPAR CAPS AND WEBS
RIBS
INTERM PANEL
UPPER SURFACE
LOWER SURFACE
SPAR CAPS AND WEBS
RIBS
OUTER PANEL
UPPER SURFACE
LOWER SURFACE
SPAR CAPS AND WEBS
RIBS
FIXED WEIGHT
TOTAL (STRENGTH DESIGNONLY)
(56,655)
(8,722)
1,570
1,570
4,884
698
(39,296)
7,073
7,073
22,006
3,144
(8,637)
1,555
1,555
4.837
690
(41,352}
98,007
(44,474)
(6,847)
1,689
1,680
2,780
698
(30,847)
7,610
7,593
12,500
3,144
(6,780)
1,680
1,660
2,750
69O
(41,352)
85,826 (c)
(43,624)
(6,716)
1,570
1,570
2,878
698
(30,258)
7.073
7,073
12,963
3,144
(6,650)
1,555
1,555
2,850
690
(41,352)
84,976
NOTES:
(A) 21_inch bPAR SPACING, 60-inch RIB SPACING
(B) 4_inch SPAR SPACING IN HIGHLY LOADED AREAS ONLY
(C) FORWARD BOX (FWD OF F.S. 2330) IS ALL METALLIC.TOTAL WEIGHT IS 89,494 Ibs FOR 40-inch SPAR SPACING AND
REINFORCED SURFACE AND CAPS THROUGHOUT.
15-76

<
<_
E.)
I
z
rj_
r_o
o
H
U3
orj
RU3
OI--4
,gf¢'3
IL_,-'4
• , W
o _ _:
<:ww ,- ,-Q.GO .J
oc << 1-
IlgOQ_
Z-W
IEu,l
O
o
O')
A
O
5 i
_, I
l"O I_IXI !,.l'l
i#pz0I--
..,J
-I'-
A A ii,,I
v v
Z
ILl
<->"Zm
I--"1-
I.iJ
I.LI
or,. oo, i I--
_1_1 ('_ ,-. 0
0¢J
II
II
II
_zzz_9

Z
O
C_
0_o3
I
ZOH
H
g_
H
O
E_
F_
H
I
•. w
_2m
_Z
g
o0_
o_u
_ _°
2 o
o 0
I I
I I
_3v v
v_
O
_J
0-I
11
15-T8

0
tsd _' NglS3G O]_)HO-INI3kl 3.1.1SOdlAIO0 HO:l J.Hgl3M J.INN N91S3O J.NlOd
(i)c.)
0c_
--I_J
cO
0C_
0 C
4_ °r-I
_ r.Q
(I),-'-t _
_'__2
0
•_ u_ ,,.-I
0,.-t
°_
%
!
rio°r.-t
15-79

TABLE15-38. COI_0_;ENTWEIGHTDERIVATION- COMPOSITEREINFORCEDSPARCAPSONLY
A. COMPOSITE REINFORCED SPARS ONLY
(20-inch SPAR SPACING)
FORWARD BOX: (AREA = 4136.6 ft2/AIRPLANE)
SURFAC, ES _ SAME AS ALL-METALLIC (LESS FAIL-SAFE)• RIBS
• SPARS = 0.122 (1.53 X 9 + 2.375) +
(COMPOSITES: 522 Ib)
AFT BOX: (AREA =2132.4 ft2/AIRPLANE)
SURFACESSAME AS ALL-METALLIC LESS FAIL-SAFE)
• RIBS
• SPARS = 0.3162 (4.21 + 3.72 + 2 X 2.375) + 0.009
(COMPOSITES: 3,762 Ib)
TIP BOX:
• SURFACES
• RIBS
• SPARS =
(AREA = 896.0 ft2/AIRPLANE)
SAME AS ALL-METALLIC LESS FAIL-SAFE)
0.3465 (3.97 + 2.74 + 2 X 1.53) + 0.005
(COMPOSITES: 1,196 Ib)
FLUTTER INCREMENT
FAIL-SAFE
0.090
UNIT
WEIGHT
(Ib/ft 2)
4.975
2.069
8.152
4.018
11.292
3.390
3.279
BOX
WEIGHT
(Ib)
20,580
(9,452)
(2,570)
(8,558)
17,384
(7,302)
(1,514)
(8,568)
10,118
(3,459)
(683)
(3,038)
(2,938)
TOTAL COMPOSITE MATERIAL WEIGHT: 5,480 Ib
]-5-8o

TABLE 15-39. COMPONENT WEIGHT DERIVATION - COMPOSITE
REINFORCED SPAR CAPS AND SURFACES
_J
±
B. COMPOSITE REINFORCED SPARS AND
SURFACES (40-INCH SPAR SPACING)
FORWARD BOX: (AREA = 4136.6ft2/AIRPLANE)
• SURFACES = 0.122 (9 X 2.838 + 3.449) + (0.006)
(COMPOSITES: 1,635 Ib)
• RIBS (SAME AS METALLIC)
• SPARS = 0.122 (9 X 1.31 + 2.175) - (0.022)
(COMPOSITES: 919 Ib)
AFT BOX: (AREA = 2132.4 ft2/AIRPLANE)
• SURFACES = 0.3162 (3.293 + 3.49 + 2 X 3.449) =
(COMPOSITES: 1,414 Ib)
• RIBS (SAME AS METALLIC)
• SPARS = 0.3162 (3.996 + 3.51 + 2 X 2.175) - (0.066)
(COMPOSITES: 4,578 Ib)
TIP BOX: (AREA = 896.0 ft2/AIRPLANE)
• SURFACES = 0.3465 (4,425 + 3.517 + 2 X 2.838) =
(COMPOSITES: 536 Ib)
• RIBS (SAME AS METALLIC)
• SPARS = 0.3465 (4.062 + 2.643 + 2 X 1.31) - (0.037)
(COMPOSITES: 1,586 Ib)
• FLUTTER INCREMENT
UNIT
WEIGHT
(Ib/ft2)
5.846
(3.543)
(0.621)
(1.682)
8.719
(4.326)
(0.710)
(3.683)
11.954
BOXWEIGHT
(Ib)
24,184
(14,655)
(2,570)
(6,959)
18,592
(9,225)
(1,514)
(7,853)
10,711
TOTAL COMPOSITE MATERIAL WEIGHT: 10,668 lb.
(4.719)
(0.762)
(3.194)
(3.279)
(4,228)
(683}
(2,862)
(2.938)
15-81

NOTE: SHEAR THICKNESS, (t s) = 0.78T
WHERET = EQUIVALENT WEIGHT THICKNESS
IJJ
£3BOX
WEIGHT ='
(LB.) _ I
MODEL -----_ ¢_ _ _ '- " I _
DESIGN-----_ _ _ *_ _ _ I _ --
-----
4-i_ -- -- - STRUCTURAL MODEL
._¢c _ I STRENGTH DESIGN
200 -- BOX PERIMETER / _/
_ _ --L ......
100 --
0 _ I .... I I ....... I I| 500 600 700 800 900
-io• f_
m _ DISTANCE ALONG REAR BEAM _ INCH
.10
.08
.06
d
.04 _
.02 _
111
0
ui
0 <
Figure 15-22. Shear Thickness of Wing Tip Structure - Chordwlse Stiffened
15-82

BOX
WEIGHT
(LB.)
MODEL _ eo
NOTE:
04 ¢0 ¢b P,,t'-
DESIGN _ _ _L'= I'=
SHEAR THICKNESS (t s) = 0.40¼
WHERE _t= EQUIVALENT WEIGHT THICKNESS
r_ y-r.-
I.LI
.J
O_00r,-
N
30O
dm
,,=, 200I-UJ:SuerUJa.
xO
100
41316
"7I
1t__
STRENGTH-DESIGN
.J
I.-0I.-
I1
41348
STRUCTURAL
MODELBOX PERIMETER
II-- 7
- I, MIN. GAGE f
I I ......... I I I II
.j o 500 000 700 800 900• p_
m ,¢ DISTANCE ALONG REAR BEAM,--4NCH.
,10
- ,08
Am
4..,v
=-I.gz
- .06 v
3:k-
rr<UJ
u)
rc- .04 ua
>O
<
- .02
i
01000
Figure 15-23. Shear Thickness of Wing Tip Structure - Spanwise Stiffened
15-83
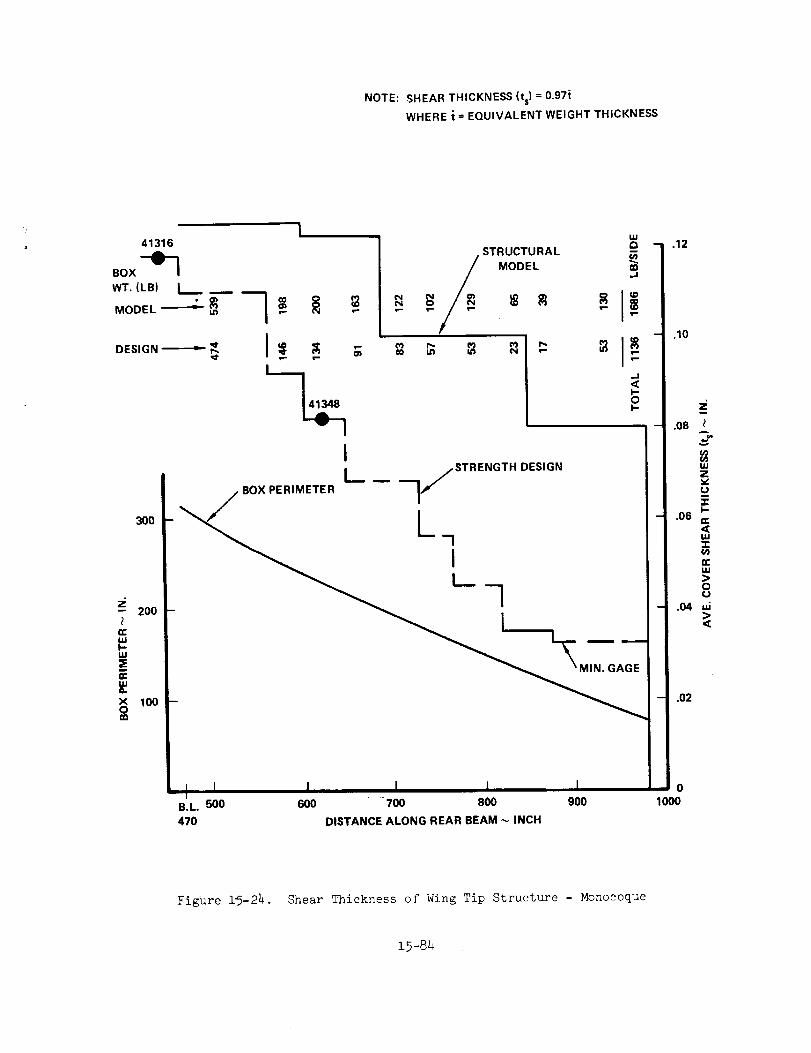
NOTE: SHEAR THICKNESS (t s) = 0.97¼
WHERE t = EQUIVALENT WEIGHT THICKNESS
41316
WT. (LB) [
MODEL"----;"_= 1 _ _ _"
L_--
I
w
STRUCTURAL
MODEL I _
.J
_ Mv-. i,_
.J
30O
- 200
erillI--I,M=EEUg
x 100O
I /STRENGTH DESIGN
/ BOX PERIMETER i/
L7
- i
,I I ....... I I IB.L. 500 600 700 800 900
470 DISTANCE ALONG REAR BEAM _ INCH
•_ ,12
.10
=;w
.08
r_
UJz
I..-.og a:
ul-r
lgul
o
.04 ui>
.O2
01111111
Fighre l_-2h. Shear Thickness of Wing Tip Structure - Monocoque
15-84

wasused as the basis for evaluation of the flutter incrementrequired for each
structural concept (ReferenceFigure 15-14).
Thesemassdata comparisonsincluded only that portion of the outer box which liesperpendicular to the rear beamand outboard of butt line 470 as pictorially dis-played on Figure 15-25.
Froma weight efficiency standpoint, the monocoquearrangementis preferred, since97-percent of the surface panel weight is effective in providing torsional stiffness.By comparison,the effective shear thicknesses for the chordwise and spanwisestiffened arrangementsare only 78-percent and 40-percent, respectively.
WingTip MassDistribution Comparison
Theaeroelastic analysis of Task Y used a single massdistribution for the 3 wingstructural arrangements. Since wing tip massdistribution has a significant effect
on flutter speed, several comparisonswere madeYetweenthe Task I and Task II dis-tributions. Figure 15-26 comparesthe deadweight shear measuredspanwisealongthe rear beam. Thewing tip structure center of gravity at a percent of chord and_ng weight distribution (poundsper inch) in the spanwisedirection is comparedin Figure 15-27. Thewing tip box geometryis displayed in Figure 15-28 and showsthat the Task II planform andwetted areas are slightly larger than Task l, whilethe effective span is decreasedabout i0 percent.
FUSELAGESTRUCTUREMASS-INITIALSCREENING
Thebasic structural arrangementfor the fuselage design is a uniaxial stiffenedstructure of skin and stringers with supporting frames. Thepanel structural con-cepts investigated are as follows:
• Zee stiffened
• Closed-hat stiffened
• Open-hatstiffened
Figure 15-29 presents the body perimeter, width, height and cross sectional areasof the fuselage. Theperimeter wasusedto calculate the wetted areas for 200 inch
OI IGINM pAG poor QUg/T
15-85

H_)NI _ 3NI'I I I n8
H
b3
E_
I
E0
_._
E
0
_J
Co
r_
u'_oJI
Lr*_
15-86

Em
/I,B
j jJr
v
<I--
I
Z_3
IJJ
UJ
ZU.U,.
I-
2:I-
ZUJ
rr
I--U_
// ,,/
/
/
/
=
<I--
IZ
Iu
° /,,rI-
z
\
• 0
N
g
I-
b-t
,r-t
Z
-J
W rjU H
Z _<
0ffl
e3
_ °0,.1
I
0
X0
81 _ (J.H_)I3M OV3O) UV3HS
¢"4 O
2-5-87
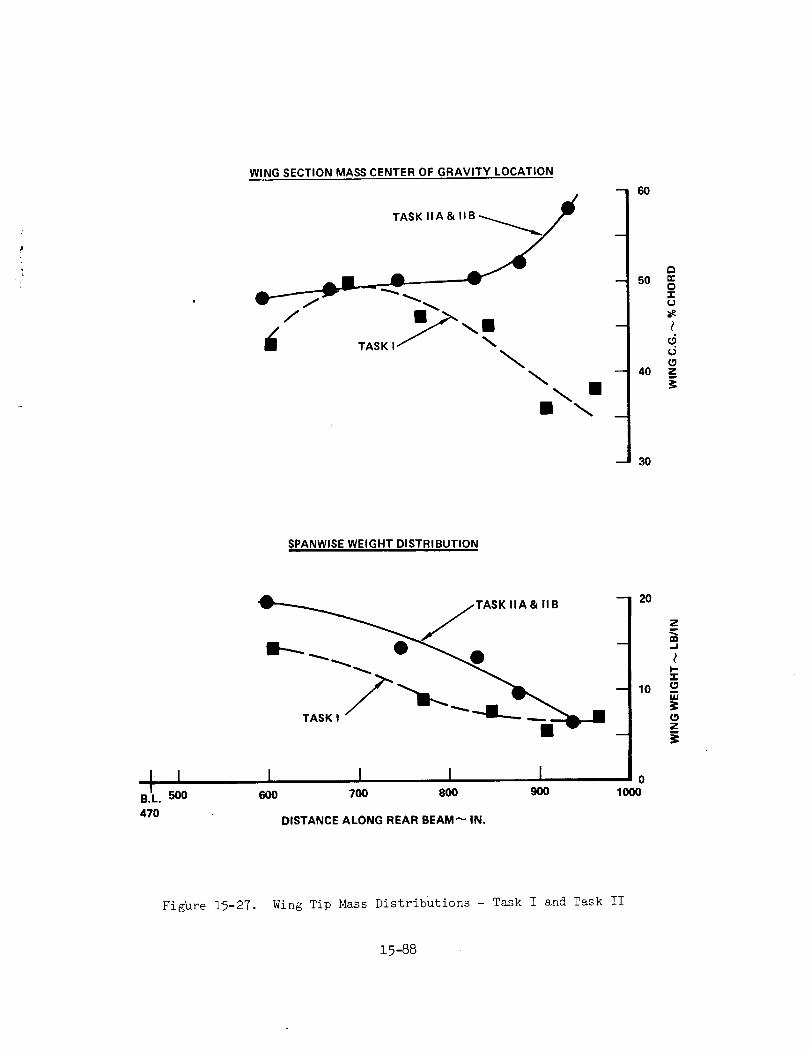
r
t
WING SECTION MASS CENTER OF GRAVITY LOCATION
T,SK,,,_,,B_/
/ •T,sK,
\ ••
-- 6O
-- 50
-- 40
3O
nr"0"ru
0
Z
SPANWlSE WEIGHT DISTRIBUTION
! IB.L. 500
470
jTASK IIA & lIB 20 Z
TASk, ---U _r=
I I I I o6OO 700 8OO 9OO IOO0
DISTANCE ALONG REAR BEAM"_ IN.
Figure i_-27. Wing Tip Mass Distributions - Task I and Task II
15-88
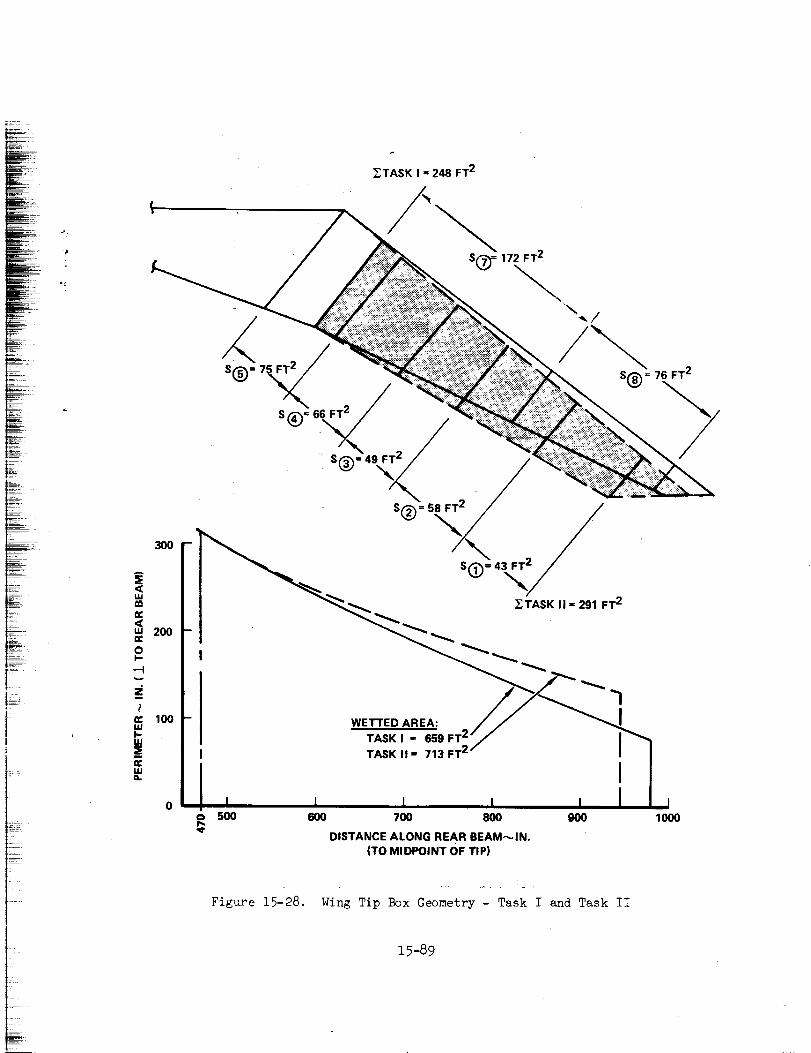
_TASK I = 248 FT 2
S(_ 172 FT 2
\-\
_,/
S@ = 76 FT 2
T.TASK II = 291 FT 2
100 WETTED AREA:
I "_ ;-:'-_9 _T2"7 I_',
o I i I .... I Io 500 600 700 800 900 1000f._
DISTANCE ALONG REAR BEAM_,IN.
(TO MIDPOINT OF TIP}
Figure 15-28. Wing Tip Box Geometry - Task I and Task II
15-89
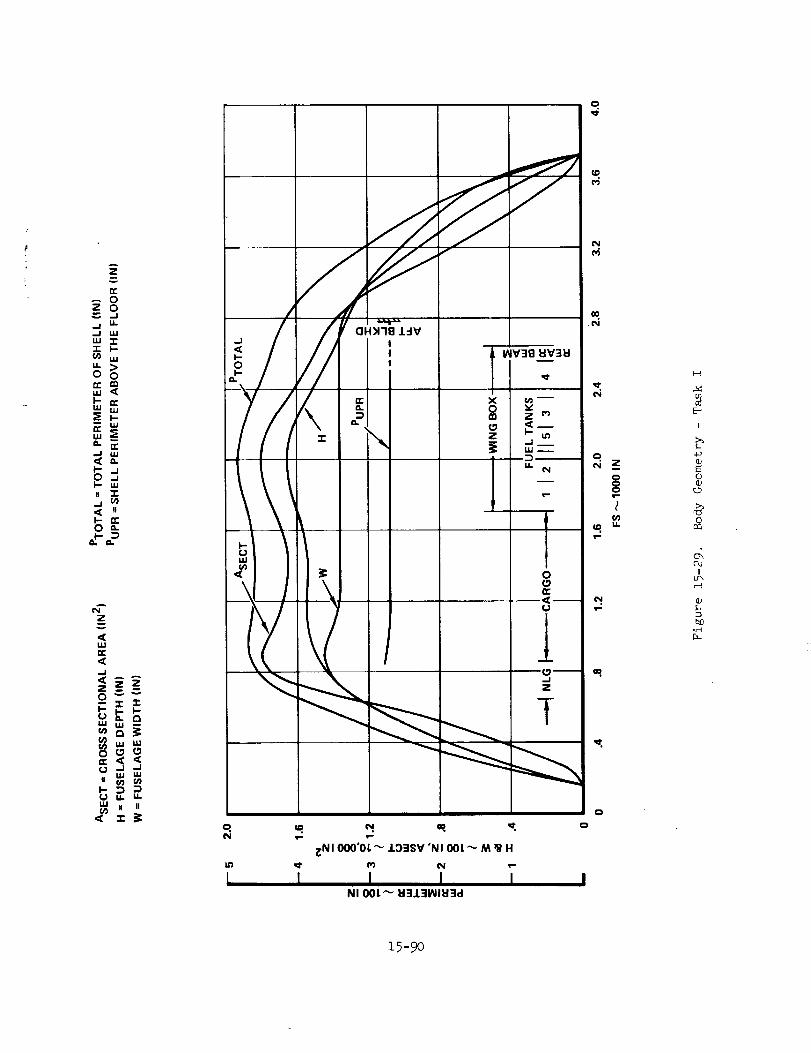
AZ
n-O
Z 0..J
_j I_.
.J ILl
,,' "t""r I--
UJ
- >0 0
., <I-- 0:I.U I._
_ W
O ..JI-- wII "3"
.j _
I'- I_
0 a.
AN
z
< <,.I -1
II U|
o
In
[
/
0
o
_D
c_
c_
.N
ENI O00"OL _/_)3SV 'NI OOL _ NI i_ H
I I I /NI OOL _ 1:13/31NIl:13d
_-- rd
0 ,-:
0
0
cgE-_
I
4J
0
00
[3
0ca
ol
I
r-I
0
N?,r-t
15-90

t_
L
segments. In the region of the wing box carry-through structure the body area is
the circular arc segment above the uoper wing surface. The segment areas and skin
and stiffener unit weights are illustrated in Figure 15-30. The zee, open-hat and
closed-hat stiffened concepts were analyzed at Fuselage Stations 2000, 2500 and
3000. As indicated on the figure, the closed-hat is 5- to 10-percent lighter and is
selected for the weight calculation. The forward cabin utilizes zee stiffening
and the transition assumes straight line extrapolation between the analysis points.
FUSELAGE STRUCTURE DETAILED ANALYSIS
For the detailed concept analysis, complete frame data and revised data for the
closed-hat panel design were determined. The results of the analysis are identified
on Table 15-40 in the shaded-collmmm. The total fuselage weight for the zee- and
open-hat stiffened shell are also shown. These data reflect the initial screening
panel weights combined with the newly determined frame data for the closed-hat design.
The weight trends, as indicated for the initial screening data for the panel concepts
in Figure 15-30, are 5- to 6-percent lighter for the selected design concept. A
minimum skin gage of .050-inch was used for the aft fuselage to meet the preliminary
sonic fatigue requirements. Figure 15-31 and Table 15-41 illustrate the method used
to derive the detailed fuselage shell weight for the closed'hat design. The mass
data includes a non-optimum factor (NOF) applied to the shell structure unit Weight
to arrive at a typical estimate of the "as-constructed" weight. These non-optimtur_
allowances are itemized as:
Joints and splices
Margins of safety (average)
Sheet tolerances
Access provisions
Finish, sealant, misc.
Total NOF
Non-Optimum
Factor (NOF)
h-percent
3-percent
2-percent
2-percent
3-percent
14-percent
ORIGINAL PAGE IBOF POOR QUALI_
,15-91
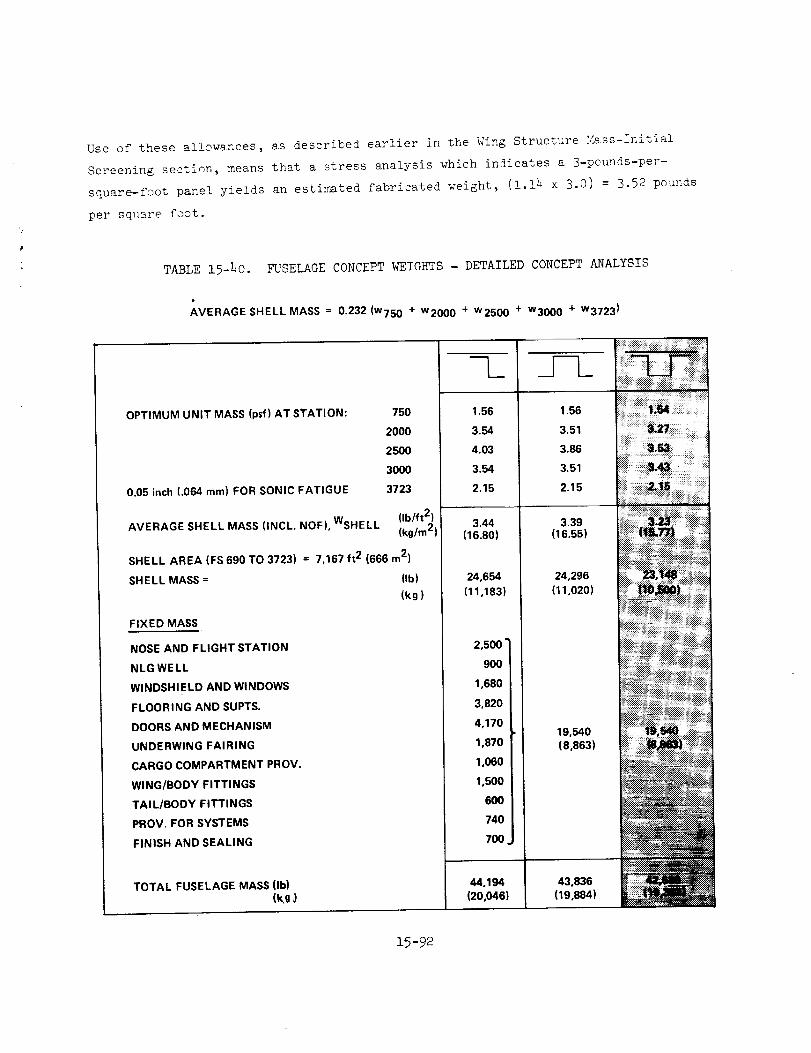
Useof these allowances, as described earlier in the WingStructure Mass-InitialScreening section, meansthat a stress analysis which indicates a 3-pounds-per-square-foot panel yields an estimated fabricated weight, (1.14 x 3.0) = 3.52 poundsper square foot.
TABLE15-hO. FUSELAGECONCEPTWEIGHTS- DETAILEDCONCEPT ANALYSIS
AVERAGE SHELL MASS = 0.232(w750 + w2000 + w2500 + w3000 + w3723 )
OPTIMUM UNIT MASS (psf) AT STATION: 750
2000
2500
3000
0.05 inch (.064 mm) FOR SONIC FATIGUE 3723
AVERAGE SHELL MASS (INCL. NOF), WSHELL (Ib/ft2)(kg/m 2)
SHELL AREA (FS 690 TO 3723) = 7,167 ft 2 (666 m2)
SHELL MASS =
FIXED MASS
NOSE AND FLIGHT STATION
NLG WELL
WINDSHIELD AND WINDOWS
FLOORING AND SUPTS.
DOORS AND MECHANISM
UNDERWlNG FAIRING
CARGO COMPARTMENT PROV.
WING/BODY FITTINGS
TAI L/BODY FITTINGS
PROV. FOR SYSTEMS
FINISH AND SEALING
(Ib)
(kg)
TOTAL FUSELAGE MASS lib)(kg J
1.56
3.54
4.03
3.54
2.15
3.44(16.80)
24,654
(11,183)
2,500"
900
1,680
3,820
4,170
1,870
1,060
1,500
6OO
740
7OO
44,194(20,046)
1.56
3.51
3.86
3.51
2.15
3.39(16.55)
24,296
(11,020)
19,540(8,863)
43,836(19,884)
15-92

7XOgo
(DZ
IO(D
..jZ
7-
UJ
U_
I
.<
_rJz_
/
J //
!i sI /
,/
I
i
flaUJ
<
0
XW
m
//
!
t
I
N
c_
°_
H
m
or-I
°_
0
I
('1:1 "O$ OOL) V31:IV 1N31Ng::I$ QNV (:lSd) 1Hg13M IlNFI
15-93

• J
/
_.I xo
\ °Zr:
---'x-_ __Z
iI
ef ,_
F-W
w
/I
• i
_-gl \_t!
!
/I
I,- 0
{S3WVH:I ig "SHN:::IJ.S'NI)IS)"dSd_ J.HDI3M J.INfl I"13HS INrIINIJ.clO
NI 001. "_ I:I3J.31NIH3d A(]O8
(D
o
o0
_DIN
V)
(D
t,,,-
O
00
(D
_JCJ
O
@
@
I
,rl
"C
O
0_-_
,._b_
.,-4
r'4(wl
I
,,,-_
_5-94

TABLE 15-41. FUSELAGE SHELL WEIGHTS - CLOSED HAT-STIFFENED PANEL CONCEPT - TASK I
PERIMETER (A)
E
s_=====
_=_
z
SECT.
F.S.
690- 800
800 - 1000
- 1200
-1400
-1600
-1705
1705-2640
2640-2800
- 3000
- 3200
-3400
-3600
- 3723
(in.)
445
457
457
460
462
467
270
425
397
347
272
173
70
AS(ft 2)
340
635
635
639
642
340
1753
472
551
482
378
240
SHELL
UNIT
WT. (psf)
1.55
1.80
2.12
2.42
2.70
2.90
3.35
3.50
3.45
3.35
3.13
2.75
A Wop T(Ib)
527
1143
1346
1546
1733
986
5873
1652
1901
1615
1183
660
C.G.
(in.)
745
900
1100
1300
1500
1653
2175
2720
2900
3100
3300
35O0
366060 2,33 140
TOTALS 7167 (B) 20,305 (C) 2150
(A)
(B)
(C)
AVERAGE DATA FOR SHELL
CUTOUT FOR WING EXCLUDED
OPTIMUM WEIGHT; "AS-FABRICATED" WEIGHT = 1.14 X 20,305 - 23,148 Ib
(SKINS = 11,423 Ib; STIFFENERS = 8,120 ro; FRAMES = 3,6051b)
,15-95

ASSET _ ..... "_ _;_" - TASK I
The ASSET ......:_ _, am s','nt'.,tesizes, t_=.e vehicle so t!:mt _-;tv mav be scaled uo and ,flown in
. ' . - " . _ _:f .... e.._s the win_size The selected w_r,_ concerts are refiectea by input _-_ e'-_ _-* to
group equation. The coefficients also consider those !iGh¢!y leaded areas which are
minimum gage, in additior, to the primary load carrying stru:zure.
Wing and fuselage weights resulting from the detailed conceot analysis effort of
Task I are reflected in the ASSET Pro{ram r_rintouts. Data are _oresented for: (i) the
aircraft scaled up to meet the range objective of 4200 nautical miles (777_ kilo-
meters) and (2) the aircraft which has a takeoff weight of 750,000 rounds (3h0,000
kilograms) with variable range as dictated by the avai __,a_e'_fuel.
Table 15-42 summarizes the results of the ASSET runs for ecs,- reference.
The wing concepts are described below:
i. Chordzise stiffened, Ti-6AI-hV Convex-beaded - mechanical fasteners
2. Spanwise stiffened, Ti-6AI-hV Hat - mechanical fasteners
3. Monoco]ue, Aluminum brazed honeycomb sandwich - mechanical fasteners
h. Monocoque, Aluminum brazed honeycomb sandwich - welded
5. Chordwise Stiffened, Convex-beaded, B/PI, composite reinforced soars
6. Best Combination:
• Concept 5 for forward and aft box structure
• Concept 3 for outer box structure
In all cases, the wing loading at takeoff (WTo/S) is 69.3 pounds per square foot and
the thrust loading (T/WTo) is 0.h77 pounds of thrust per pound of takeoff weight.
This is an uninstalled S.L.S. thrust of 89,h66 pounds per engine, increasing engine,
nacelle and air induction weights over those carried for Task I.
FINAL DESIGN AIRPLANE MASS ESTIMATES
Detailed weight descriptions of the wing and fuselage for the Final Design airplane
are given in Tables 15-43 and 15-44, respectively.
" _'_ QU_
15-96

G
Z<
<
cd
I
<
o
_:_ ®_
mN
p,.
N
r_
r_
N
ORIGINAL PAGE I_
OF POOR QUALIT_
15-97
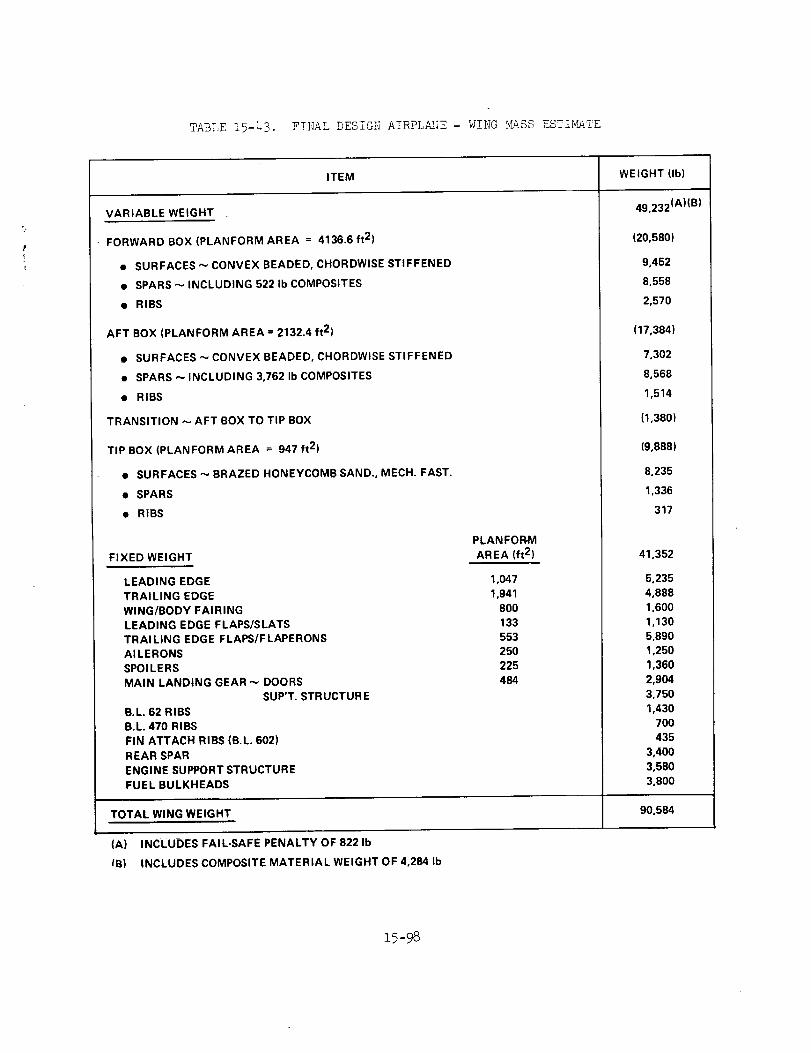
TABLE 15-L3. FINAL DESIGN AIRPLA]_[E - WING _[&SS ESTIMATE
ITEM WEIGHT (Ib)
VARIABLE WEIGHT
• FORWARD BOX (PLANFORM AREA = 4136.6 ft 2)
• SURFACES "" CONVEX BEADED, CHORDWlSE STIFFENED
• SPARS _ INCLUDING 522 Ib COMPOSITES
• RIBS
AFT BOX (PLANFORM AREA = 2132.4 ft 2)
• SURFACES -,- CONVEX BEADED, CHORDWISE STIFFENED
• SPARS _ INCLUDING 3,762 Ib COMPOSITES
• RIBS
TRANSITION _ AFT BOX TO TIP BOX
TIP BOX (PLANFORM AREA -- 947 ft 2)
• SURFACES _, BRAZED HONEYCOMB SAND., MECH. FAST.
• SPARS
• RIBS
FIXED WEIGHT
LEADING EDGE
TRAILING EDGE
WING/BODY FAIRING
LEADING EDGE FLAPS/SLATS
TRAI LING EDGE FLAPS/F LAPERONSAILERONS
SPOILERS
MAIN LANDING GEAR _ DOORS
SUP'T. STRUCTURE
B.L. 62 RIBSB.L. 470 RIBS
FIN ATTACH RIBS (B.L. 602)REAR SPAR
ENGINE SUPPORT STRUCTURE
FUEL BULKHEADS
PLANFOR4VI
AREA (ft 2)
1,047
1,941800
133
553250
225
484
TOTAL WING WEIGHT
49,232 (A)(B)
(20,580)
9,452
8,558
2,570
(17,384)
7,302
8,568
1,514
(1,380)
(9,888)
8,235
1,336
317
41,352
5,235
4,888
1,600
1,130
5,890
1,250
1,360
2,9043,750
1,4307OO
435
3,400
3,580
3,800
90,584
(A) INCLUDES FAIL-SAFE PENALTY OF 822 Ib
/B) INCLUDES COMPOSITE MATERIAL WEIGHT OF 4,284 Ib
15-98

TABLE !5-hh. FILIAL DESIGN AIRPLANE - FUSELAGE MASS ESTImaTE
ITEM WEIGHT (Ib}
SHELL STRUCTURE
SKIN
STIFFENERS
FRAMES
FIXED WEIGHT
NOSE AND FLIGHT STATION
NOSE LANDING GEAR WELL
WINDSHIELD AND WINDOWS
FLOORING AND SUPPORTS
DOORS AND MECHANISM
UNDERWlNG FAIRING
CARGO COMPARTMENT PROV.
WING TO BODY FRAMES AND FITTINGS
TAIL TO BODY FRAMES AND FITTINGS
PROV. FOR SYSTEMS
FINISH AND SEALANT
22,582 (A)
11,144
7,921
3,517
19,540
2,500
900
1,680
3,820
4,170
1,870
1,060
1,500
60O
740
7O0
re_
TOTAL FUSELAGE WEIGHT 42,122
(A) INCLUDES FAIL-SAFE PENALTY OF 1,432 Ib
15-99

Thewing t:ox (variable • -"_' __e_.:_) represents the test combination of structural
concepts, ,_.,_v is:
• Forward and aft fox: convex %e_-ded, _nordwise stiffened surfaces with
comrosite reinforced star cars.
• Outer box: braze_ honeycomt sandwich surfaces, mechanically _a ..... ed
closures.
The ",_: _*_gn_ description includes fail-safe provisions, allowances for flutter _,re-
vention, and ranel th_c:,ne_ changes for manu_a_ur=ng/_es__n constraints. The
fixed weight consists of those items which are unaffected by box structural concer, t,
such as surface controls, engine rails, leading and trailin{ edge structure. Items
in this category are weighed by comparison with previous supersonic cruise aircraft
and contemporary aircraft.
i_e fuselage_ weight is also divided into two major categories, shell "_'e_gh_:"_ and
jfixed weight. Here again the shell weight is derendeno u_on structural conceot,
while the fixed weight such as doors, windows, flight station and fairin4 are
unaffected. Fixed weight items are evaluated by eomr,arison with L-2000 and con-
temporary aircraft.
WING STRUCTURE :_tASS
The wing structure mass for the Final Design Airplane is based on the NASTRAN
strength-stiffness bulk data (Reference Section 9, Structural Analysis Hodels).
Appropriate non-optimum factors are applied to the integrated mass data to obtain
the "as-constructed" wing weights.
The effect of the various design parameters on the sizing of the structural elements
are included in the determination of the bulk data flexibilities.
include:
• Strength
• Fatigue Life
• Temperature
• Thermal Stress
• Flutter
The parameters
• Aeroelastic Loads
• Jig-shape Effects on Loads
• Design & Hanufacturing
• Material Selection (Including Composites)
• Ninimum Gage
iS-ioo

F ¸Im
L|
|
!
p.=
i:: tl--
|
E_ZZ
"!
The integrated mass for the wing surface panel, substructure and non-optimum factor
are shown at each grid point of the wing p!anform of Figure 15-32. _,[ass su_c.ations
for the forward, aft, and tip boxes and transition are shown. Appropriate allow-
ance for fail-safe requirements at the transition of the monocoque tip design to
the chordwise stiffened aft box are included.
Figure 15-33 presents acomparison of the forward and aft box weights for the
strength and strength-stiffness design. The cumulative weights for the wing inboard
of BL470 are presented. The data generated indicated that except fer small devia-
tion in the aft box region, the strength-design and the strength/stiffness design are
essentially unchanged. The change in aft box weight is _artial]y attributed to load
_ncreases from jig shape effects on ae_oela ....c loads. These aft box mass increases
as well as the wing fixed weight items are refiehted in the SIC distribution.
Table 15-45 fresents the mass increments required to meet the specified fail-safe
criteria. The unit weight data are as calculated in Section 13 and distributed to
the aft box and wing tip structure according to the associated stress levels. The
data indicates the aft box oenalties appear to be localized in the region of %he
propulsion system installations. The wing tip penalties are associated with span-
wise fail-safe straps required to stop propagation of a chordwise crack in both
skins Of the honeycomb sandwich panels. It appears that this penalty can be further
minimized if the tip structure were specifically designed to meet the stiffness
requirement to suppress flutter in light of the fail-safe design requirements.
Application of boron-a!umin_n surface panels in lieu of titanium honeycomb sandwich
and considering a multispar design to minimize chordwise crack growth offer signi-
ficant potential mass reduction for the wing tip structure design.
Fuselage Structure Mass Estimates
The fuselage mass estimates for the Final Design airplane are based on the verifi-
cation of the results of the Detailed Concept Analysis of Task I (refer to
Figure 15-31). The "as-constructed" fuselage weights were established by applica-
tion of a non-optimum factor to the shell (i.e., skin-stringer and frame) unit
weight determined for the five selected fuselage stations. This data is again
presented on Figure 15-34, as corrected for the shortened nose and slightly altered
wing carry through structure. Superimposed on the figure are (i) the verified unit
OEIGINAL PAGE
OF POOR QUALIT 15-101


_LLL
og9L
og_I
_gCL
OL_L
O00L
_C
_c
_c
_J
\\
/
!/
/
!
x
.-I
uJ
w a
II II o
X _ II
m_ x0
J


l
_L
O00C
olTg_T.
g8_
-ru gt,&_.z_I
:P
2,<
tll
< 000Z-I
u. gg6 L
ggSL
C') _ 0
I


i
W
Z
U.U.
F-
Zw
E
I--
I I I I
_m v-
"X
.... i
GO
UJ
X _
0 D
I-- D
"8"1000L _ J.HDI3M "M/N3
GO(%1
_D
ed
8
O
I--
D
U.
009-
_Df,..
w,-
e,,Ie-
H
_J
£-I
I
%
_5
0
C
E0r..)
f',"3
I
r-M
?2
PRECEDING PAGE BL.A_NK NOT FIL]_
15-Io5
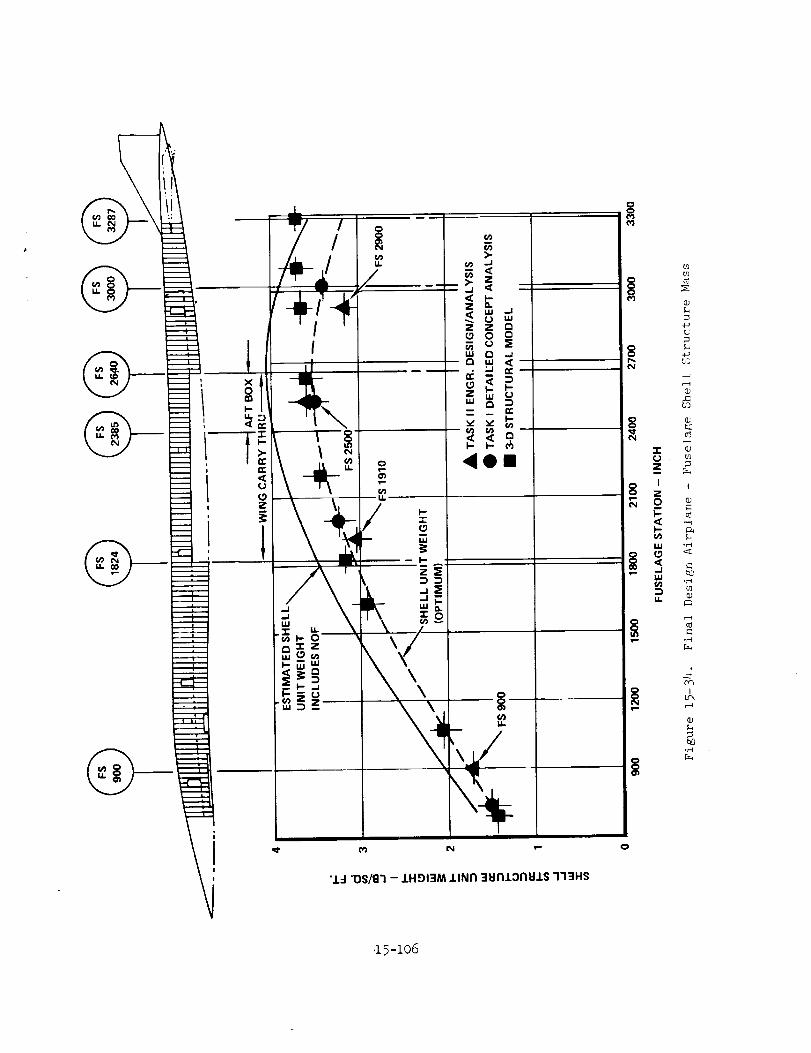
I
\
u_
_ N w,-
".L-I "OS/8"i - .LH£)I3M J.lNfl 3UI'LL31"IEI.LS "I'I3HS
O
03
4J
L
,-C_3
%
!
e-ft
%
_7
b_
03
;2
I
_-4
N?
,15-io6

weights from the 3-D finite element structural model and (2) the unit weight
calculations from detailed analysis of Task il which includes the strength and fail-
safe requirements. The results of the detailed analysis (including strength and
fail-safe des_gm) are presented in Table 15-46 for F.S. 900, F.S. 1910, F.S. 2500
and F.S. 2900. The mass trends are very near the optimum shell weights calculated
for Task I. In the af%body, the results indicate values less than previously used.
Rather than reduce the mass trends in the aftbody, the _ originally determined trends
were maintained to provide adequate structural integrity for asymmetric conditions
which were not fully investigated for the fuselage design.
Figure 15-35 presents the impact of composite reinforcement of the titanium hat
section stringers with boron-alum_nm_l and boron-polyimJde. The results were con-
strained by frame an9 stringer spacing. Although approximately 5-percent reduction
in shell structure unit weight is indicated on Figure 15-35, the effect on the total
body weight is only slightly greater than k-percent. The application of boron-
polyimide shows slightly increased benefits over boron-aluminmm. The Final Design
airplane retains the basic skin-stringer-frame construction using titanium alloy
6AI-LV (annealed), although in the interior region (i.e., floors, floor beams, trim)
epoxy resin composites are employed in selected areas.
ORIGINAL PAGE IS
OF POOR QUALITY
15-107
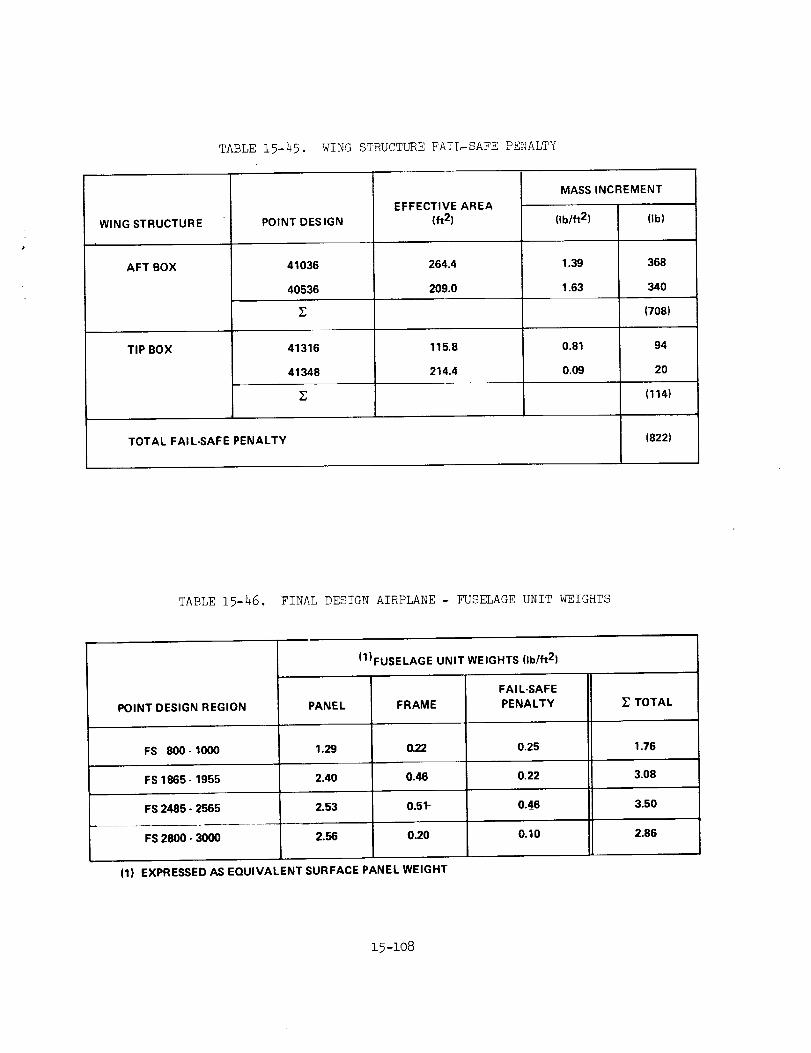
TABLE15-25. WINGSTRUCTUREFAIL-SAFEPENALTY
WING STRUCTURE
AFT BOX
TIP BOX
POINT DES IGN
41036
40536
41316
41348
TOTAL FAIL-SAFE PENALTY
EFFECTIVE AREA
(ft 2)
264.4
209.0
115.8
214.4
2;
MASS INCREMENT
(Ib/ft 2) (Ib)
1.39 368
1.63 340
(708)
0.81 94
0,09 20
(114)
(822)
TABLE 15-46, FINAL DESIGN AIRPLANE - FUSELAGE UNTT WEIGHTS
POINT DESIGN REGION
FS 800- 1000
FS 1865-1955
FS 2485 - 2565
FS 2800- 3000
PANEL
1.29
2.40
2.53
2.56
(1)FUSELAGE UNIT WEIGHTS (Ib/ft 2}
FRAME
0.22
0.46
0.51-
0.20
FAI L-SAFE
PENALTY
0.25
0.22
0.4_6
0.10
TOTAL
1.76
3.08
3.50
2.86
(1) EXPRESSED AS EQUIVALENT SURFACE PANEL WEIGHT
15-108
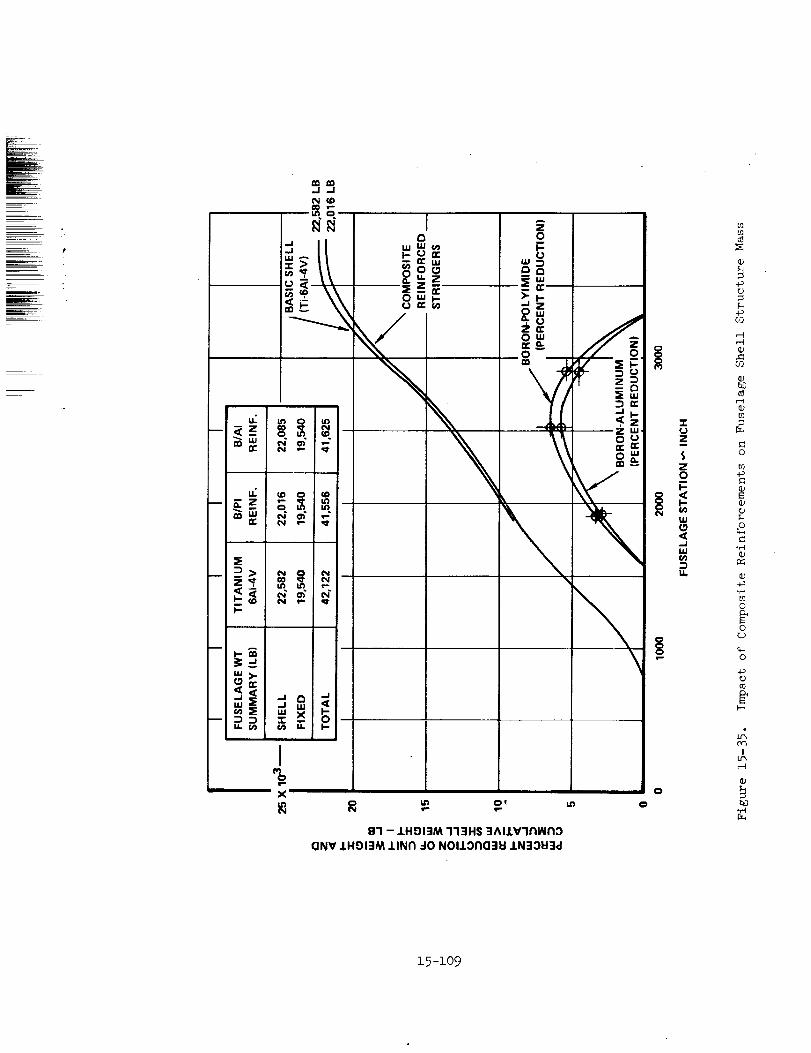
<[
UJu_
I%X
81 - J.HOI3M "I'I3HS 3AIJ.V1NINNO
ONV J.HOI3M .LINN ::10 NOIJ.Ono3kl .LN3Ol:13d
I.I1 (:_
O
t_
cJ
_)
0)b_
q)
0
¢.)
,e-tI1)
I1)
._
0
0
0
!
.r..t
_5-_o9


7-
i,
REFERENCES
Mach 2.7 Fixed Wing SST Model 969-336C (SCAT-25F) D6AII666-1 and D6A!_666-2,
_me Boeing Company, July 1969
15 -iii


SECTION 16
PRODUCTION COSTS
BY
W. NEWCO_B


TABLE OF CONTENTS
m
Section
INTRODUCTION
COST _THODOLOGY
DETAIL COSTING
COST RESULTS
16-i
16-1
16-2
16-7
16-i


LIST OF FIGURES.
E_
Figures
16-1
16-2
16-3
16-4
16-5
16-6
16-7
Cost Analysis Methodology
Wing Point Design Regions
Wing Forward Area - Cost Analysis Region
Structural Details - Chord_ise Stiffened Wing Design
Structural Details - Span_ise Stiffened Wing Design
Structural Details - Monocoque Wing Design
Structural Details - Monocoque (Welded) Wing Design
Structural Details - Composite Reinforced Wing Design
Page
16-3
16-3
16-_
16-4
16-5
16-5
16-6
16-6
PRECEDING PAGE BLANK NOT FILMED
16-1ii


Table16-1
16-2
16-3
16-4
16-5
16-6
16-7
LIST OF TABLES
,Total Manhour, _terial & Tooling Costs
Production Costs - Chordwise Stiffened Wing Design
Production Costs - Spanwise Stiffened Wing Design
Production Costs - Monocoque Stiffened Wing Design
Production Costs - Monocoque (Welded) Wing Design
Production Costs - Composite Reinforced Wing Design
Summary of Production Costs
16-8
16-9
16-10
16-11
16-12
16-13
16-14
PRECEDING PACE BLANK NOT F_ED
16-v


SECTION 16
PRODUCTION COSTS
INTRODUCTION
The results of the analyses performed to develop production costs of the five wing
structural arrangements are presented in this section.
The design concepts are identified as follows:
(i) Chordwise stiffened wing design (Mechanically fastened)
(2) Spanwise stiffened wing design (Mechanically fastened)
(3) Monocoque wing design (Mechanically fastened)
(h) Monocoque wing design (Jointed by welding)
(5) Composite reinforced wing design (Mechanically fastened)
Each of the wing designs were analyzed in sufficient depth to establish credible
production costs estimates to be used for conducting simplified cost benefit trade
studies for the evaluation and selection of the best structural approach for a
March 2.7 arrow-wing supersonic cruise aircraft. These estimates included production
manhours, material costs, and fabrication and assembly tool-make time. The production
costs for each wing design were translated into "value per pound" inputs to the ASSET
(Advanced Synthesis and Evaluation Technique) computer program to determine fly-away
and total system costs. The ASSET computer program and its usage is described in
Section 17, Concept Evaluation and Selection.
COST METHODOLOGY
To achieve useable cost inputs for each of the wing designs, it proved necessary
to evaluate the fabrication and assembly operation for each of the details in the
surface panels and substructure of various areas of the airframe as generalized in
Figure 16-1. This type of analysis was essential since each wing design, having
the same planform and basically the same material usage, differed in many ways.

Thesedifferences included part count, methodsused to produce the surface panelsand internal structure, plus design difference resulting from constraints imposed
by the location on the wing planform.
Analysesto the required detail were achieved by conducting the costing effortfrom the componentlevel to the major assemblylevel. Areas of the wing, coincidentwith the point design regions used for the structural analysis, were adoptedasshownin Figure 16-2. Three regions were selected for cost analysis: 40322,40536,and 413h8. ThEsizing data (i.e. skin thickness, cap size, etc.) in these regionswere considered as representative for the wing forward area, wing aft box area andthe wing tip, respectively. Themajor assemblycosts for the three areas of thewing were then used to estimate averagecosts for the total wing structure.
Production wing panel sizes were determined for each of the five wing designs and
the panels surrounding the "point design regions" were selected for analyses. Fig-
ure 16-3 shows details associated with forward wing area of wing design (2). Note
that the panel structure is divided into six elements: upper and lower skin assem-
blies and two different spar and rib designs. This structural breakdown is typical
in each panel, with each wing area, (forward, aft, outer), for each wing design.
DETAIL COSTING
Cost analyses were performed for the variety of structural details shown on Fig-
ures 16-h through 16-8. Production costs were estimated for (i) the weld bonded
beaded panel design, (2) the weld bonded hat stiffened panel design and (3) the
aluminum brazed honeycomb core sandwich design, using appropriate advanced produci-
bility techniques (see Section 7, Materials and Producibility). The variety of spar
and rib configuration costs were determined for each wing design considering such
factors as metal removal and welding requirements. Production manhours were devel-
oped using the joint designs shown in the figures, consistent with each design.
Fabrication data for the upper and lower skin assemblies were estimated by the man-
hours and material weight per square foot of each panel. The fabrication data for
the linear structure, such as caps, webs, etc., were determined by the lineal foot.
All assembly data were based on type of joint design, such as number of fasteners,
inches of weld, etc., and were also estimated by the lineal foot.
16-2

F
E
. FORWARD
Figure 16-1. Cost Analysis Methodology
FS19_
FS FS13_ 1_5
FS2565
FS FS2485 2640
I, . . ,.
Figure 16-_.
,40236
40536
i _. _,41o38
FS 2660
2580
Wing Point Design Regions
BLO
BL 62
BL 125
BL 232
BL 296
BL 406
BL 470BL 522
BL 594
16- 3

FS 1705
_ POINT DESIGN
FS 2045
I-- BL6:
JPPEF
;KIN •
1
- IL 191
REGION 40322SEE FIGURE 16-2
ELEMENT DIMENSIONAL DATA
UPPER SKIN 317 SQ. FT.
LOWER SKIN 317 SQ. FT.
CIRCULAR ARC SPARS 34 LIN. FT.TRU.SS SPARS L 45 LIN. FT.
_'_ CIRCULAR ARC RIBS 57 LIN. FT.
_> TRUSS RIBS 170 I_IN. FT.
LOWER
SKIN
_WRP
Figure 16-3. Wing Forward Area - Cost Analysis Region
TYPICAL PANEL JOINT
FS
64.897 /TIG WELD
(2555"00) _=====;a_
_.,___!_.L_---..._ _..___.._.L_\
___ WE LD BOND ""_
FILLET SEALANT 2 I i I _\FAYING SURFACE
WET BA'_ I [ L SEALANT(FUEL) I_'_ "_ UPPER PANEL AT FUEL RII_
[ /-- "SPAR
SHALLOW HEAD HI-LOK
HI-TIGUE FASTENER ONr_A
UPPER & LOWER PANELSB_,..._.,
_ WELD BOND -'-_= w=, n_ -_/':_- DOUBLER E S WELD----7" _ J \'_
/ '/SPECIAL FITTING __._O_01,010MtN _ / //_ \_
_"_ I DETAIL B / / \ '\ \
[_"_"0| AGONAL -NO SCALE- _ /_:_ A
UPPER SURFACE AND SPAR CAP v __-/TUBULARSECTION A-ATRUSS
TUBULAR TRUSS SPAR
__ CHORDWISE STIFFENEDBL _ SKIN PANEL
FASTENERS \ _ =_o /.Z-u'°_. } .;-'WELD BOND
I I t _" FAYING SURFACE SEALANT
WE'rBAY____f L_DRY BAY(FUEL) _ _,..._% R I B
SPAR
Figure 16-4. Structural Details - Chordwise Stiffened Wing Design
16-

TYPICAL PANEL JOINTS'_ WELD BOND
- ['_ i 11 I'II_=3 U _
_---T_-"_'_ • ,, -,.,,-,, ,,- WELD BOND
(FOEL, i L! WELD_-- _, --_'_'-_ WET BAY _._-._-"_ nRY =AY
• (FUEL) L__: _, CIRCULAR ARC WEB RIB'_CIRCULAR ARC WEB SPAR
.:_E_ ___W HITIGUE
ELD BOND
!
SECTION A-A
HAT-STI FFENED PANELS ',, A
" /,.:_._//"J__TIG WELD
Figure 16-5.
SPLICE PLATE
FILLET OR --
FAYING SURFACE
SEALANT
Structural Details - Spanwise Stiffened Wing Design
TYP!C. A.L PANEL JOINTS
F_.=F.ASTE NE R
_. TI CRACK STOPPER (TYPICAL)
_'_-_:i_/_I il _ ALUMINUM BRAZED TO PANEL=_J _rJ-l_'__--.3/ .2540 (10.0) TO ,3048 (12.0) CHORDWISE SPACING
,_ ALUMINUM BRAZED TO PANEL
FUEL SPAR
ERS
DENSIFIEDCORE / ]_,_, _TI DOUBLERS
EClAL FITTING_IAGONAL
SECTION A--A
Figure 16-6.
r--A
• ATIC; WELD
TUBULAR TRUSS SPAR
Structural Details - Monocoque Wing Design
16-5

PANEL SPLICEE B WELD (MODULE INTERFACE} __;*
/ALUMINUMBRAZEDT,./C
,_1i_ 'L HI _ ,. i__,_i ___llt'.',;ll : !i_'/ WE i __i DRYB ---.-' 1t 1,;/_--_,'_ ..,,,,,_ TBAY i, '_ AY
(FUEL}
• -- _;FUEL SPAR DRY BAY'-_"
I
SECTION A-A
Figure 3.6-7. Structural Details
LD
TUBULAR TRUSS SPAR
- Monocoque (Welded) Wing Design
FS BL64.897 FASTENERS .--_. 7.518 /T- WELD BOND
(2555,00) _ (296,00) Jl
-,------- 1 : k _----TIG WELD =T'_| _ DRY BAY,=c'_ eAy I '_I _ WET BAY I L.J..... _ _ ,--0.010 MIN (FUEL) _P"_---_,_"_..=
(FUEL) i f _SPAR _ _ _-_' _RIB
TYPICAL PANEL JOINT "_-P_
DETAIL B
SHALLOW HEAD HI.TIGUE FASTENER NO SCALE
ON UPPER & LOWER PANELS_ t__=. Atr 7, ._____L./-_ "-
/'?_ TIG WELD '----,_'" ...J-\ _'-'"-'-_TUBULAR
/,' I\ _ ; _cJ TRUSS SPAR
t_s=:_
UPPER PANEL AT FUEL RIB
BORON POLYIMIDE (0O) ON ALL SPAR CAPSEXCEPT FUEL TANK BOUNDARY SPARS.REINFORCEMENT STRIPS ARE CONTINUOUSFROM LE, TO LE.
SECTION A-A
Figure 16-8. Structural Details - Composite Reinforced Wing Design
16-6

r_
COST RESULTS
Table 16-1 summarizes the total manhours, material costs and tool-make manhours for
the forward, aft and outer wing areas to manufacture the first PrOduction aircraft.
The cost for th_ honeycomb core surface panels are included as Material Dollars
since they are considered as a purchased item.
Tables 16-2 through 16-6 presents the production costs for each wing design. The
details of the forward wing area are provided for each design. The methodology used
to adapt the total production manhours, tool-make manhours and material costs to
"value per pound" increments for input into the ASSET computer program is also presented
The summary of production costs in terms of "value per pound" are tabulated in
Table 16-7.
16-7

in('M
£-4
0L_
8E-_
.<
p_
E-_
0E_
!
(nI--DmILl0Z
8Z
r,ni11
U_
z
tll
X X X X.- _. % %
_ I- X
o o o . oZ Z Z Z< <{ < <
16-8

I-I
J--I
E-I
r._
I
o
oI--I
0
!
i n ....
mflm
mllr
]-6-9

c_
H
cQ
D'J
I
O'J
D'20C3
I--4
I
,=.,
1")
C
<
,d
C
I-.,,=
(.
<(.
Z
>..Jco
uJ
t
16-io

_- g _,
¢q
CO
0I---4
0 I-u'_ ,-
0
0
I
U_
o
o
I
_ ° __ _ _. _ _ .
_Xm
u_,,4D_
_6-z_

I m
Or- __
H
_ _u_
A
,.IF-
O
8 -'®
!
u_
o
I--4E-t _.1- _,,
I
e_
C_
_ ,r-
- _ I ". ,
t
: ,- _ _ ,_ _ ,-" •r- ,-
_ .,-_-
16-:L2

I--4CO
¢3
¢.J
O
H
E-IH
C)
I
Ca']
E-4O3
O
_J
o
_d!
_q
r¢
z
_o
m|l . J
ORIGINAL PAGE IS
OF_POOR QUALITY ]_6-]_3

D_5_59O<.)
HEl
O
I
a.ILlozO0
Z
I.Ll
UJ
..J({>
• °tn
• o(_ r.-i.- r.D
co 0• o
o• ,
00 ('M
m..I
9 .J(J --
r,.o_
cov.-o
_D
v-
01
r_
0
v-
(nrr
0
=.
UJv
..I00i-
16-14
SECTION 17
CONCEPT EVALUATION AND SELECTION
BY
I. F. SAKATA


CONTEi_TS
Section
INTRODUCTION
EVA_UATIONCRITERIA
EVALUATIONPROCEDURE
TheASSETVehicle Synthesis Model
Cost ModelDescription
EVALUATIONRESULTS
ConstantWeightAircraft
Constant Payload-RangeAircraft
CONCEPTSELECTION
REFERENCES
APPENDIXA. COMPUTERPRIh_rOUTASSETPARAMETRICANALYSISCOMPOSITEREINFORCEDWINGDESIGN(WC5)
Page
17-1
17-i
17-2
17-3
17 -9
17-27
17-27
17-29
17-36
17o45
17-47
17-i


Figure
!7-I
17-2
17-3
17-4
17-5
17-6
17-7
17-8
17-9
17-10
17-11
LIST OF FIGURES
Concept Evaluation
The ASSET Synthesis Cycle
ASSET Program Schematic
Aircraft Flyaway Cost Model
Aircraft Sizing Results
Structural Mass Versus Cost
Technology Improvement Versus Cost
Technical Risk Versus Cost
Investment Versus Cost
Composite Reinforced Wing Design - Fasteners
Stuctural Approach for Task II
Page
17-4
17-5
17-5
17-15
17-30
17-31
17-33
17-34
17-35
17-39
17-43
Pasc_mu _AGE _ Nor Fa_D
17-iii

I-
EE
Table
17-1
17-2
17-3
17-4
17-5
17-6
LIST OF TABLES
ASSET Cost Input
Evaluation Data for Structural Arrangements
Concept Evaluation Summary - Constant Weight Aircraft
Concept Evaluation Summary - Constant Payload-Range Aircraft
Wing Weights for Structural Arrangements
Evaluation Data for Hybrid Structural Arrangement
17-13
17-28
17-37
17-37
17-42
17-44
PeEc_e PAGE BZ,4,N_ No_ F_
17-V


SECTION 17
CONCEPTS EVALUATION AND SELECTION
INTRODUCTION
Analytical Design Studies (Task I) were perfon_ed to assess the relative merits of
the various structural arrangements, concepts and materials applicable to the
arrow-wing supersonic transport configuration defined in Section 2, Baseline
Configuration Concept.
A spectrum of structural approaches for wing and fuselage applications that fui]y
exploit the practically attainable advantages of near-term structures and materials
technology were evaluated. Both smooth-skin and beaded-skim designs were explored
considering advanced producibility techniques available for design of a near-term
supersonic cruise aircraft.
The results of the detailed structural analysis were used to develop preliminary
design drawings for mass and cost estimation. These data were then used for sim-
plified cost benefit studies to evaluate the relativ_ merits of each structural
approach and identify those concepts which would merit further detailed engineering
design and analysis (Task II).
EVALUATION CRITERIA
The criteria for evaluation of the structural design concepts include measures of:
structural mass; mission capability; airplane size; development, production
(material and fabrication), operational costs; and technology risk.
17-i

EVALUATIONPROCEDURE
Theevaluation process is performed in two steps:
!. _ne structural massof the aircraft is estimated for each of the candidate
structural approachesbasedon the premiseof a fixed vehicle size andtaxi mass(340,000kilograms). This permits the determination of theallowable fuel for the aircraft andhenceits range capability. RDT&E,production and maintenancecosts, for eachof the candidate structuralapproachesare then determined. A direct comparisonof the structuralmassj range and cost is madeon the basis of constant airplane configura-tion and gross mass. Themain shortcomingof this approachis that, sinceall three factors of strmctural mass, range performanceand cost arevariables, one cannot establish a single criterion for the selection ofthe optimumconcept. Thus,the purposeof this step is to establish theoasis for the evaluation methodologythat follows.
2. The airplane configuration and gross massare resized to meet the payload(22,000 kg) and range (7,o00 km) requirements. Thepurposeof the resiz-ing is not to suggest that the airplane configuration (size) oe changed,but rather to provide a tool for assessing the impact of the candidatestructural concepts andmaterials evaluated on a commonbasis, i.e.,constant payload/rangeperformance. Oncethis is done, the conceptevaluation ar_ selection may be performed on the basis of minimum-total-
system-cost (as tempered by technology availability and risk considerations).
In this context_ total-system-cost includes the effects of:
• Structural efficiency/material properties
• Design considerations such as fuel tank sealing and ease of fabrication
and assembly
• Varying thrust_ engine size_ and engine mass requirements as airplane
size changes
• Impact of the structural/material concept_ airplane size_ and mass on
fuel consumption; development, manufacturing and operating (maintenance)
costs.
17-2

DOC(Direct Operating Cost) is a measureof total-system-cost that includes all theparametersnoted and is chosenas the evaluation criterion in this study.
In oraer to assess the relative importanc9 of the characteristics of each struc-tural approachon the major componentof DOCand provide a comparisonbetweenthecost and risk factors_ the results of the aforementionedevaluation procedurearepresented in the form of cost-benefit tradeoffs. Typical tradeoffs shownon Fig-ure 17-1 are:
• Structural mass versus cost
• Technology improvement versus cost
• Technical risk versus cost
• Investment versus cost
As noted above_ the selection of the best concept is performed on the basis of
minimum-total-system-cost to satisfy the given payload/range requirement at
acceptable program technology risk levels.
The ASSET Vehicle Synthesis Model
The parametric sizing, and performance evaluation of the structural design concepts
are performed through the use of the Lockheed developed ASSET (Advanced System
Synthesis and Evaluation Technique) vehicle synthesis model. A schematic presenta-
tion of the primary input and output data involved in the ASSET Synthesis Cycle, is
shown on Figure 17-2. The ASSET Program integrates input data describing vehicle
geometry, aerodynamics, propulsion, structures/materials, weights, and subsystems,
and determines candidate vehicles which satisfy given mission and payload
requirements. It provides the means to assess the effects of design options
(thrust/weight, wing loading, engine cycle, advanced materials usage, etc.) on the
vehicle weight, size, and performance. The key elements and the flow of information
through ASSET are depicted in Figure 17-3.
17-3
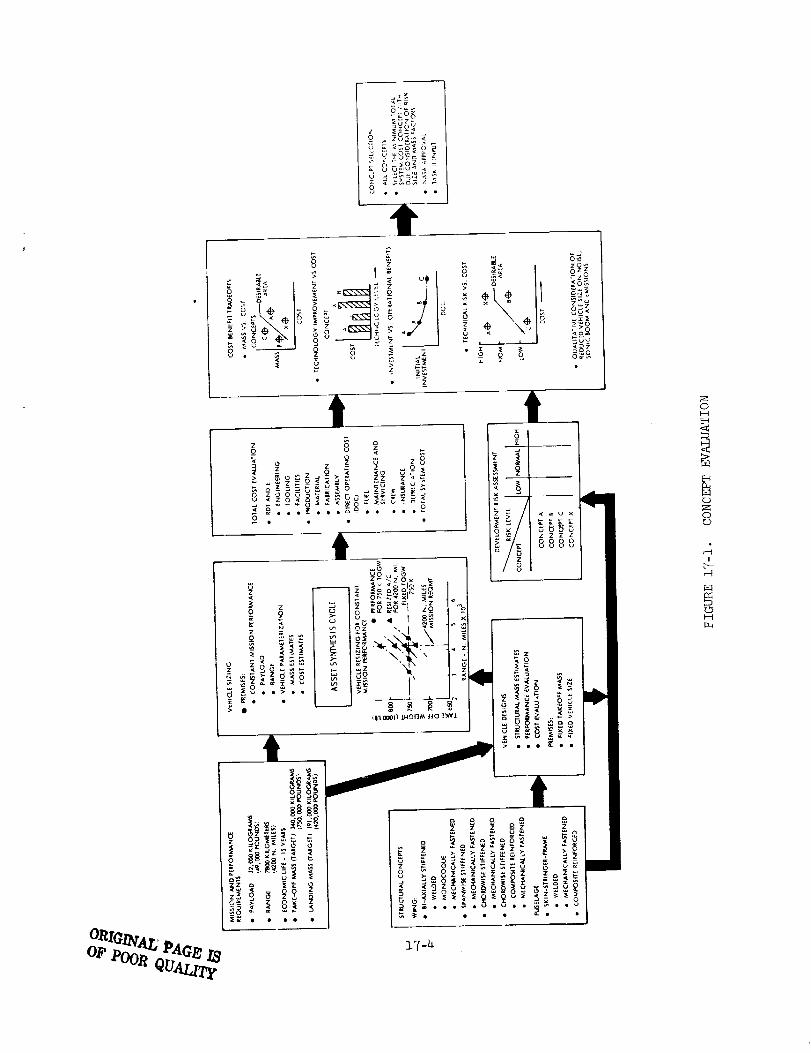
_ o_z b
i i I 8 i_ .'-" I -" = "=i"• , =-i
j _J_
Z
8d-
17-4
OH
iD_
_D
O
H

I CANDIDATE CONCEPTS I
+i PREL'",NARYDES'ON[
" I
AERODYNAMICS PROPULSION AND AND SIZINGMATERIALS
I i l I+
I I
+l size I
• BODY
• WING
• TAIL
• ENGINES
• GEOMETRY
• FUEL CAPACITY
I wE_T I
• GROSS
• EMPTY
• STRUCTURAL
• MATERIALS
DISTRIBUTION
• PROPULSION
• SUBSYSTEMS
I_'_i THE ASSET PROGRAM
I
i PROGRAMOUTPOT]- |,
[ PERFORMANCE]I
• FLIGHT HISTORY
• BLOCK FUEL
• •LOCK TIME
• RESERVES
• CLIMB & TRASONIC
PERFORMANCE
• FAA BAL. TAKEOFF
AND LANDING
• OFF _ESIGN MISSION
PL/RANGE CAPABILITY
• SONIC BOOM
• NOISE
.,SSIONPROF,LEl'l-I L___] PERFORMANCEj
REQUIREMENTS [
PAYLOAD REQUIREMENTS J
+I COST I
I• RDT&E
• INVESTMENT
PRODUCTION
TOOLING
SPARES & SSE
DATA. ETC.
• OPERATIONAL
DOC
IOC
ROt
• TOTAL SYSTEM COST
FIGURE 17-2. THE ASSET SYNTHESIS CYCLE
iDRAG IN_l DATA
CONFIgURaTION _ I" • WEIGHT BUILO U_ • DRAG BUILDUP
• size & GEOMETRY • FUEL WEIGHT • INDUCED DRAG
• FUEL _LUME AVAIL • FUEt,. VOLUME REQ'D • ETORE ORAG
,4
SIZING LOOP
SEQUENCER
SPECIFY S_TE OF VALUESFOR
• T/W, WiE. AR, T/C
• _ADtU_. eAYLOAO
• OTHERS
i ooNEIG....TOATA) 1 EIG...........)
(INPUT DATA BANK1
• ENGINE TYPE s NUMBER
• INSTALLI_D PERFORMANCET & rE - tiM. hI
• _EB SETTINGSMAX A/B INTER NORM
• REVERSE THRL_'/ TABLES
• _ALING FACTORS
l
MISSION PROFILE
INPUT DATA
r
NO t_AI JkSE _)N YES PRINT OUIl, eUT PLOT OUTPUT
FIGURE 17-3. ASSET PROGRAM SCHEMATIC
_7-5

The three major sffoprograms of ASSET are sizing, performance, and costing. The
sizing subprogram sizes each parametric aircraft to a design mission. The design
characteristics and compone..t weights of the sized aircraft are then transferred
to (i) the costing subprogram, which computes aircraft cost on the basis of compo-
ne_.t weights and materials, engine cycle and size, avionics packages, payload,
production and operational schedules, and input cost factors, and (2) the perfor-
mance subprogram which computes maximum speed, ceiling, landing and take-off
distances and other performance parameters.
ASSET program output consists of a group weight statement, vehicle geometry
description, mission profile summary, a summary of the vehicle's performance
evaluatlon, and RDT&E, production and operational cost breakdowns (reference
Appendix A).
Vehicle Sizing. The sizing subprogram is composed of five routines: sequence,
• configuration, weight, drag, and mission. In addition, the sizing suoprogra_n uses
propulsion data input in the form of thrust and fuel flow tables and an independent
atmosphere subroutine.
The sequence routine groups the sets of independent variaoles (design options and
mission requirements) that are to be varled parametrically. Examples of these
variables include (but are not limited to) thrust/weignt, wing loading, aspect
ratio, wing thickness ratio, wing sweep angle, design load factor, payload, equip-
ment, avionics weights and volumes, materlals usage factors, and design mission
requirements (range, radius, endurance, speed, etc.).
The configuration routine computes the geometric data for the vehicle components
(planform areas, wetted areas, frontal areas, lengths, diameters, chords, refer-
ence lengths, volumes, shapes, etc.) required by the weight and drag routines. The
weight routine determines the component weight build-up, materials usage for the
major airframe elements based on an input percentage distribution matrix and the
fuel available. These data are utilized in the configuration routine. The config-
uration and weight routines, operating together, determine the geometric and weight
characteristics for an airplane having an assumed trial takeoff gross weight. The
17-6

trial vehicle is geometrically sized to contain the crew, equipment,payload,propulsion systemand fuel. The tails are sized to provide specified (input) tailvolumecoefficients.
IT_edrag routine constructs a drag build-up composedof friction drag, zero-liftpressure drag, and induceddrag. Friction drag is determined for eachvehiclecomponentover a range of Machnumbersand altitudes using the componentwettedareas, reference lengths, a_udroughnessand from drag factors. The zero-liftpressure drag for the wing is computedover the Machnumberrangeby the drag sub-routine using the wing geometrycharacteristics (sweep,thickness, aspect ratio,leading edgeradius). The zero-lift pressure drags for other vehicle componentsare basedon the componentareas, determinedby the configuration routine, and theinput values of the componentzero-lift pressure drag coefficients. Induceddrag(including the effects of compressibility) of the trial aircraft, basedon the winggeometry, is determinedas a function of Machnumberand lift coefficient by thedrag routine. The computeddrag build-up for the aircraft and propulsion data forthe engine under study are input to the program. Applicable powersetting (take-off, maximum,intermediate, maximumcontinuous, etc.) thrust and fuel flow data areprovided as functions of Machnumberand altitude. Partial powertables are usedto simulate operation at thrust levels required during cruise or loiter.
Ynemission subroutine determines the fuel required to perform the design missionprofile. Themission profile is assembledfrom specified flight segments,suchastakeoff, climb, acceleration, cruise, loiter, etc. Simplified two dimensionalpoint massflight equations are used in determining the time history of the mis-sion. Climbs follow predeterminedspeed-altitude schedules. Cruise and loitersegmentsmaybe performedat specified altitude and speedflight conditions, or thespeedand/or the altitude canbe optimized for maximumcruise rangeof maximumloiter endurance. Allowancesare madefor taxi, warmupand takeoff, landing, andfuel reserves.
An iterative convergencetechnique completesthe sizing subprograms. The fuelavailable from the weight routine and the fuel required determinedby the missionroutine are compared. The iteration computesand passesnewtrial aircraft
through the sizing cycle until acceptable agreementis reachedbetweenthe
ORIGINAL PAGE
OF POOR QUALrrY
17-7

available and required fuel. At this point the vehicle is properly sized to
perform the specified design mission.
Performance Evaluation. - Any or all of the following vehicle performance capa-
bilities can be evaluated: Climb, maximum speed, maneuverability, airport perfor-
mance, and alternate mission capability. The climb characteristics are assessed at
specified vehicle weights for given thrust settings. The maximum rate of climb at
sea level is. determined at the takeoff weight for a zero-acceleration climb sched-
ule. Ceiling altitudes are determined for specified rate of climb requirements for
a series of aircraft weights ranging from the takeoff weight to the zero fuel
weight. Service and cruise ceilings may be determined by specification of the
appropriate thrust settings, and rate of climb requirements.
Speed characteristics are assessed for specified aircraft weights and thrust set-
tings. The maxim'am speed at sea level_ the maximum speed at the optimum altitude,
and the corresponding optimum altitude are determined.
Airport performance is evaluated for standard or non-standard days. Aerodynamic
data representing the maximum lift coefficient and drag polars for the aircraft in
the takeoff and landing configurations are provided by input. The distance
required to take off over a 50 foot obstacle is determined for defined thrust set-
tings. Takeoff and transition speeds are specified as percentages of the stall
speed. Landing distances over a 50-foot obstacle may be determined for both flared
and unflared approaches. Approach and touchdown speed are specified as percentages
of the stall speed. Sinking speeds at the 50-foot height and at touchdown are
constrained below defined limits. Thrust reversal may be employed during the brak-
ing phase. Go-around rate of climb during the landing approach is computed for
specified thrust settings. Any number of engines may be inoperative.
Alternate mission off-design performance for the synthesized aircraft is deter-
mined by the mission routine. The basic difference between the mission routine of
sizing subprograms and the alternate mission performance evaluation is that the
former determines the fuel required to perform the design mission, whereas the lat-
ter determines the mission capabilities (range, radius, endurance, etc.) with the
17 -8

E
fuel availatle in the sized aircraft. The alternate mission profiles are
assembled from specified flight segments (takeoff, climb, acceleration, cruise,
loiter, etc.) in the same manner that the design (sizing) mission is constructed.
However, one of the mission segments of the profile is a variable segment.
Through an iteraZive convergence technique, the duration of the variable segment
(distance, time, etc.) is adjusted so that the fuel required to perform the mission
is equal to the onboard fuel. Payload and equipment weights, and fuel loads for
the alternate missions are specified and may be different from those corresponding
to the design mission.
Costing. - The costing program computes RDT&E, investment, and operational costs.
Both the RDT&E and production (flyaway) aircraft costs are broken down by airframe,
engines, avionics, and armament. Airframe costs are further broken down into
engineering, tooling, manufacturing, qua]ity control, and material costs. The
various cos% elements are computed on the basis of cost estimating relationships
(CER) which are established by analysis of historical data of applicaole aircraft
programs, Lockheed's R&D and production experience, and subcontractor'supplier
quotations. Cost input consists of dollars-per-hour (labor cost) and dollars-per-
pound (material cost) factors by aircraft structural element and material, labor
rates, production rates and schedule, learning curves, subsystem, engine and
avionics cost factors, and operational (fuel, attrition, etc.) considerations. The
model permits parametric costing as function of thrust, inert weight element and
advanced material usage.
Cost Model Description
The cost models used in the evaluation of the arrow-wing configaration supersonic
transport consists of subroutines to the ASSET program.
Development Cost Model. - The cost estimates for the primary elements of develop-
ment cost are determined by cost estimating relationships (CER's) which are deter-
mined by statistical analysis of historical data from military programs. The basic
equations used to estimate the development cost for the airframe and engine are
modified versions of the CER's developed by the RAND Corporation (references i
oRIGINAL PAGZ L_
OF _00_ QUALIT_17-9

and 2). TheRANDequations are modified to reflect airframe and engine manufac-turer's experience. The airframe engineering hour estimates by the RANDCER'saremodified to reflect a Lockheedin-house estimate. The Lockheedestimate is pro-vided by a methodelogythat hasbeen developedthrough a detailed analysis ofLockheedprograms. Themodifications to the RANDequations are provided by theapplication of K factors to the basic equations.
The developmentcost model includes the following elements:
Prototype Aircraft
DesignEngineering
DevelopmentTest Articles
Flight Test
EngineDevelopment
DevelopmentTooling
Special Support Equipment
DevelopmentSpares
Technical Data
Avionics Development
The equations for determining the cost for each of the aboveelementsare showninthe DevelopmentCost Model that follows.
The cost for the prototype aircraft is determ.inedfrom the flyaway cost modelandinput to the developmentmodel. Theprototype aircraft are costed on the basis ofthe first few vehicles produced.
Development Cost Model
Prototype Aircraft
TPROT = TFLCO * _0
Design Engineering
RFDE = 0.0396 * WAMPR ** 0.791 * SS ** 1.526 * CXNYO ** 0.183
DIH = RFDE * XKE - SELH0 = (Design Engineering hours less sustaining)
DIEC = DIH (DER + OER) * (i + APRFF) = (design engineering cost)
' 17-i0

To_lin_
DTHB = L.0127 * WAMPR ** 0.764 * SS ** 0._99 * CXNY0 ** 0.176 * DRT * 0.066
YHT = DTHB * XKT - PTLHO = (Design tooling hours less sustaining)
DTC = DrH (DTR + OTR) * (i + APRFF) = (Design tooling cost)
Development Test Articles
DSTA = (_AFCO/CXITYO) * XNSTA = (Cost for static test article)
DFTA = (TAFCO/CXNY0) * Xf_TA = (Cost for fatigue test article
DMTS = (TAFCO/CX}_O) * XMTSF = (Cost for systems test articles)
D_T : (DSTA+ DFTA + D_S) * (i + APRFr)
Flig)_t Test
RFFT = O.001244 * WAf_PR ** 1.16 * SS ** 1.371 * CXfYf0 ** 1.281
DFT = RFFT (i + APRFF) * XKFT = (Flight test cost including profit)
Engine Development
CEDCM : XMlv_&x ** 0.62 [(CXNYIO + CXNYO) * XNENGC] ** 0.i0
DC_G : CEDCF * [(TCE/IOOO)/XICENGC] ** CEDCE * CEDCM
Avionics
DAV = DPAVD * WAV_ + FAVDC
Spares
DSPAR = ADSF * TAFCO + EDSF * TENCO + AVDSF * TAVC0
Special Support Equipment
DSSE = DSSEF * TFLCO
17-11

Technical Data
DDATA = DTDF (TFLC0 + DIEC + DTC + DART + DFT + DCENG + DLENG + DAV + DSPAR
+ DSSE + DOT + DMT)
The description of the inputs and the factors for the development model are included
along with the description of the inputs for the production model that follows.
Investment Cost Model. - The Investment Cost Models includes subroutines to provide
the cost for the aircraft, the aircraft spares, and the special support equipmei_.
The primary element of investment is the aircraft and it is given the most attention
in te_s of detail and consideration of the labor and material cost factors. The
spares and special support equipment cost are treated as percentages of the fly-
away cost of the aircraft. The production cost estimate is made to the same gen-
eral level of detail as the airplane group weight statement. The production cost
input form,at includes the following elements:
Material Cost Factors
Labor Cost Factors
Labor Rates
Sizing and Learning Curve Factors
Sustaining Engineering
Sustaining Tooling
Engineering Change Orders
Quality Assurance_
Miscellaneous Costs
Warranty
Insurance and Taxes
Profit
An illustrative example of the elements of the airframe and their representative
cost factors is shown in Table 17-1. How these factors are applied is illustrated
in the schematic of the flyaway cost model shown in Figure 17-4.
Airframe Materia_ Cost - As shown by Table 17-1, the material cost factors
include representative cost factors for various types of material for the
structural elements of the airframe. The airframe production cost model has
space for material cost factor inputs for aluminum, titanium, steel, compos-
ites, and other. The various types of materials are listed across the top of
the input sheet (Table 17-1). A material cost factor is assigned to each type
ORIGINAL PAGE IS
OF POOR QUALITY 17 -12
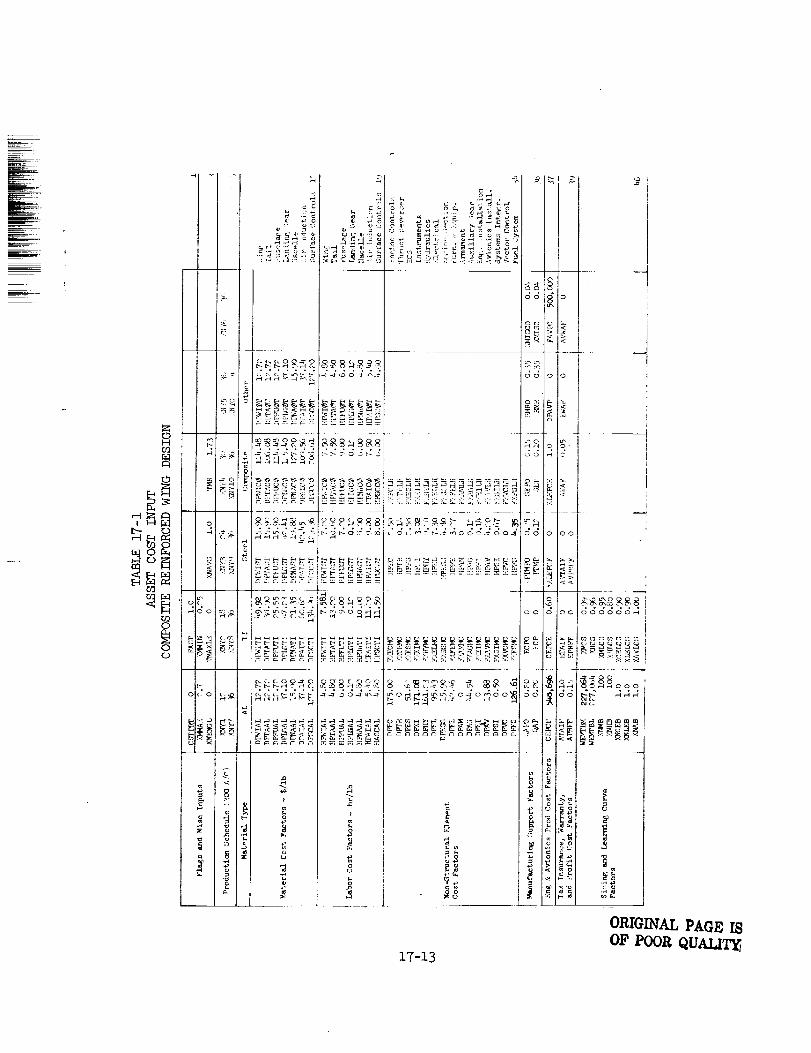
i HD--
cr_
HCQ
t.b
C_
r.D
_o
coo
r.)
oo
r_
0 o
17-13
_ §oo
oo
O0 0
o_
_0
-d G
;,4:7
t: N
i
P%?d<_io
0
oo1_
ss _
{o__1
<
0
<
O0
,-q:2
g_ gggoc dSdddd_
>< _: >.
I
a_i_NNNooo
= o
:¢
ORIGINAL PAGE ISOF POOR QUALIT_

I o['- r._,.-I
NB
orj
ii
!
i
i
" I
I
::_d d d g,-4
I
_0_ o
o_:i _o
+, o
_5 _o0._
m a i_
g_
iT-l_

_o_ •
D_
ow
'i t I
b_0
<
!
b--
I--I
17-15

type of material as determined from the sizing program. The ASSET program
determines the total weight of each element from the performance and configu-
ration input data. After the total weight of the component is determined_ the
amount of each type of material is obtained by applying percentage factors to
the total. The percentage factors for each type of material are established
through previous analysis and input to the program.
p
Airframe Labor Cost - The same procedure as used in the materials is used in
the labor subroutine_ except that the labor is in hours. After the total
number of hours are determined the labor rate is applied to arrive at the
total labor cost.
The labor rates shown in Table 17-1 include the rates for design engineering,
tooling, manufacturing, quality assurance, and miscellaneous. 0nly the labor
rates for manufacturing and quality assurance are used for development engi-
neering and tooling.
Non-Structural Elements Cost Factors - The cost factors for these elements
includes both labor and material. This category includes the installation
cost for the systems and equipment noted as well as their manufacturing cost
with the exception of the engine and avionics. The installation costs for the
engine and avionics are included here but the purchase costs for these items
are shown separately.
After the labor hours, labor rates and material cost factors are applied to
each material type, the elements are summed to arrive at a total airframe
labor and material cost. These sums are then adjusted for quantity and size.
Sizing and Learnln$ Curve Factors. - The sizing factors are included to account
for scaling of the labor and material cost due to aircraft size. The learning
curve factor accounts for cost change due to quantity produced. The labor and
material cost factors shown in Table 17-1 are normalized to a particular
vehicle weight and production quantity. The scaling factors modify the labor
and material cost according to the size of the vehicle being analyzed and the
number of aircraft in the production program. The sizing and learning curve
factors include:
17-16
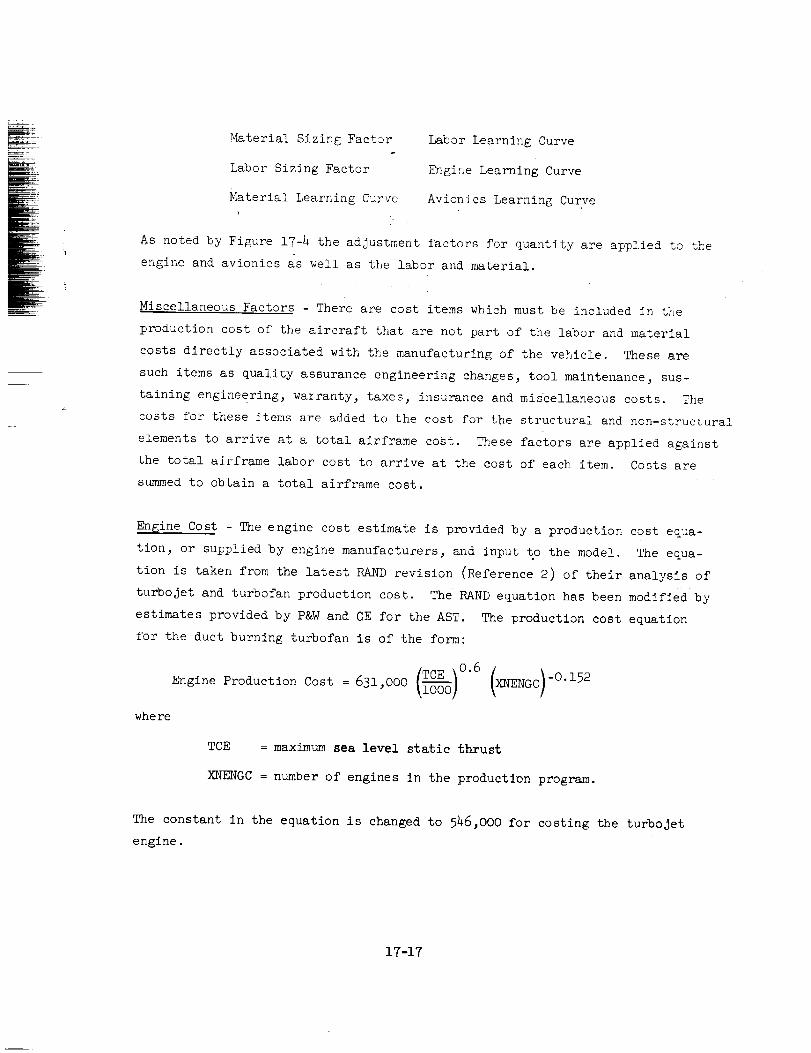
Y_terial Sizing Factor
Labor Sizing Factor
Material Learning Curve
Labor Learning Curve
EngineLearning Curve
Avionics Learning Curve
As noted by Fi_are 17-2 the adjustment factors for quantity are applied to theengine and avionics as well as the labor andmaterial.
Miscellaneous Factors - There are cost items which must be included in the
production cost of the aircraft that are not part of the labor and material
costs directly associated with the manufacturing of the vehicle. These are
such items as quality assurance engineering changes, tool maintenance, sus-
taining engineering, wazranty_ taxes, insurance and miscellaneous costs. The
costs for these items are added to the cost for the structural and non-structural
elements to arrive at a total airframe cost. These factors are applied against
the total airframe labor cost to arrive at the cost of each item. Costs are
summed to obtain a total airframe cost.
En6ine Cost - The engine cost estimate is provided by a production cost equa-
tion_ or supplied by engine manufacturers, and input to the model. The equa-
tion is taken from the latest RAND revision (Reference 2) of their analysis of
turbojet and turbofan production cost. The RAND equation has been modified by
estimates provided by P&W and GE for the AST. The production cost equation
for the duct burning turbofan is of the form:
tTCE _0"6 (XNEN)-0.152Engine Production Cost = 631,000 \lOOOJ GC
where
TCE = maximum sea level static thrust
XNENGC = number of engines in the production program.
The constant in the equation is changed to 546,000 for costing the turbojet
engine.
17-17
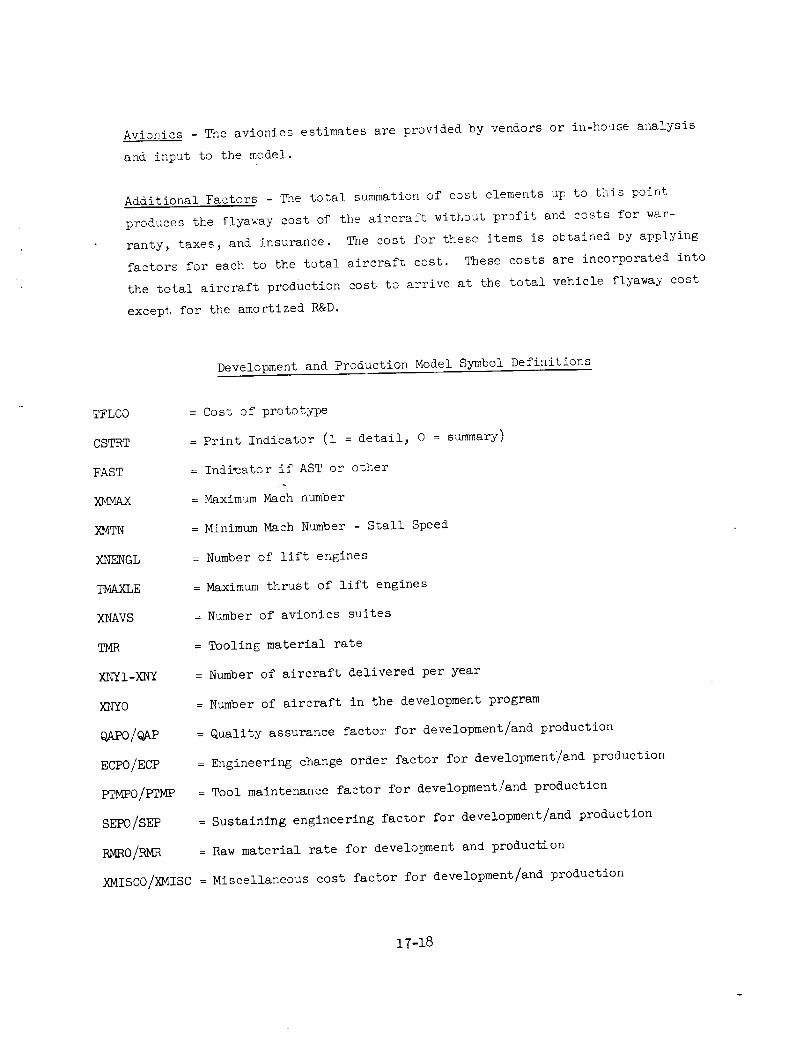
Avionics - The avionics estimates are provided by vendors or in-house al_alysis
and input to the model.
Additional Factors - The total summation of cost elements up to this point
produces the flyaway cost of the aircraft without profit and costs for war-
ranty, taxes, and insurance. The cost for these items is obtained by applying
factors for each to the total aircrafz cost. These costs are incorporated into
the total aircraft production cost to arrive at the total vehicle flyaway cost
except for the amortized R&D.
Development and Production Model Symbol Definitions
TFLCO
CSTRT
FAST
XMMAX
XMTN
XNENGL
TMAXLE
XNAVS
TMR
XNYI-XNY
XNYO
_/_P
ECPO/ECP
PTMPO/PTMP
St_DO/SgP
= Cost of prototype
= Print Indicator (I = detail, 0 = summary)
= Indimator if AST or other
= Maximum Mach number
= Minimum Mach Number - Stall Speed
= Number of lift engines
= Maximum thrust of lift engines
= Number of avionics suites
= Tooling material rate
= Number of aircraft delivered per year
= Number of aircraft in the development program
= Quality assurance factor for development/and production
= Engineering change order factor for development_and production
= Tool maintenance factor for development/and production
= Sustaining engineering factor for development/and production
= Raw material rate for development and production
XMISCO/XMISC = Miscellaneous cost factor for development/and production
17-18

CEPCF
CEPCE
XLEPCF
XLEPCE
DPAVP
FAVPC
ATAIF
ESTAIF
AVTAiF
AWAF
EWAF
AVWAF
APRFF
EPRFF
AVPRFF
WEMTBM
WEMTBL
XNMB
XNH]B
XNCEB
XNLEB
XNAB
XMCS
XHCS
= Constant value for engine production cost formula _Cruise engine
= Value of coefficient in engine production cost formula cruiseengine
= Co_stant value for engine production cost formula - lift engines
= Value of coefficient in engine production cost formula - lift engine
= Avionics production cost factor
= Production cost for avionics
= Airframe insurance factor
= Engine insurance factor
= Avionics insurance factor
= Airframe warranty factor
= Enginewarranty factor
= Avionics warranty factor
= Airframe profit factor
= Engineprofit factor
= Avionics profit factor
= Weight emptyof aircraft being evaluated
= Weight emptyof base line vehicle from which the cost factors weredeveloped
= Quantity at which the material factors were developed
= Quantity at which the labor factors were developed
= Basequantity for cruise engines
= Basequantity for lift engines
= Basequantity for avionics
=Material cost sizing coefficient
= Labor cost sizing coefficient.
iT-19

XMLCS
XHLCS
XCELCS
XLELCS
DER
OER
DEGR
OEGR
XMGR
DTR
OTR
DTGR
OTGR
XAGR
DMR
OMR
DMG R
OMGR
XEGR
DQAR
OqAR
DQAGR
OQAGR
DMISC
OMISC
XKE
= MaZerial learning curve slope
= Labor learning curve slope
= Cruise engine learning curve slope
= Lift engine learning curve slope
= Engineering labor rate (direct)
= Engineering overhead rate (indirect)
=IGrowth rates - not used
!
= Tooling labor rate (direct)
= Tooling overhead (indirect)
=IGrowth rates - notused
!
= Manufacturing labor rate (direct)
= Manufacturing overhead rate (indirect)
= Quality assurance labor rate (direct)
= Quality assurance overhead rate (indirect)
= I Growth rates - not used
= Labor rate for miscellaneous items
= Overhead rate for miscellaneous items
= Complexity factor for engineering
17-20

XXT
XK_
XNSTA
X_[FTA
XMTSF
ETSMR
EFTMR
CEDCF
CEDCE
XLEDCF
XLEDCE
DPAVD
FAVDC
DRT
ADSF
EDSF
AVDSF
DSSEF
DTDF
DOT
DMT
PRT
PECF
PECE
APSF
= Complexity factor for tooling
= Complexity factor for flight test
= Number of test articles for structural tests
= Number of test articles for fatigue tests
= Number of test articles for systems test
= Engineering test material rate
= Flight material rate
= Constant value for cruise engine development cost equation
= Value of coefficient for development cost formula for cruise
engines
= Constant value for lift engine development equation
= Value of coefficient for development cost formula for lift engines
= Development cost factor for avionics
v Development cost for avionics
= Production rate for development
= Airframe spares factor for development
= Engine spares factor for development
= Avionics spares factor development
= Special suppport cost factor for development
= Technical data cost factor for development
= Operator trainer cost factor for development
= Maintenance trainer cost factor for development
= Maximum monthly production rate
= Constant term for production engineering cost formula
= Value of coefficient for production engineering cost formula
= Spares factor for production airframes
17-21
PAG OF Pooa QUALny

EPSF
AVPSF
PSSEF
PTDF
POT
PMT
SCFM
SCFL
= Spares factor for production engines
= Spares factor for production avionics
= Special support equipment cost factor for production
= Technical data cost factor for production
= Cost for operator trainers
= Cost for maintenance trainers
= Material cost factor for maintenance
= Labor cost factor for maintenance
Operating Cost Models. The operating cost includes the standard elements normally
found in the direct and indirect operating cost (DOC/IOC) as reported by the air-
lines. The DOC model is a modified version of the 1967 ATA method (Reference 3).
The modifications to the D0C equations in the ATA method consists of: i) combining
the crew cost equations into a general expression for any number of crew members
and 2) expanding the maintenance equations into greater detail. The more detailed
maintenance equations are obtained from (Reference 4). The IOC model consists of
set of expression derived through the combined efforts of Lockheed and Boeing
(Reference 5). The indirect expense factors are those experienced by the inter-
national carriers (Reference 6).
Fli_t Crew
Fuel and Oil
Insurance
Depreciation
Maintenance
D0C Model
[3.0 * (45 + SSFB) + 35 (XNCREW - 3) + IFB] * (i,0 + FCSIR) XNYR * U
1.02 * U * (FB/TB * CFT + XNENGC * COT * 0.135)
IRA * TUACC
(TUACC + SPARES)/PERIOD
Equipment and Furnishings
Labor : [O. STF + 1.0 + (4.5TF + 18) * WAF/IO 6] * U/TB * MNTLR
Material = [0.4TF + 1.20 + (14TF + 42) * WAF/IO 6] * U/TB
17-22
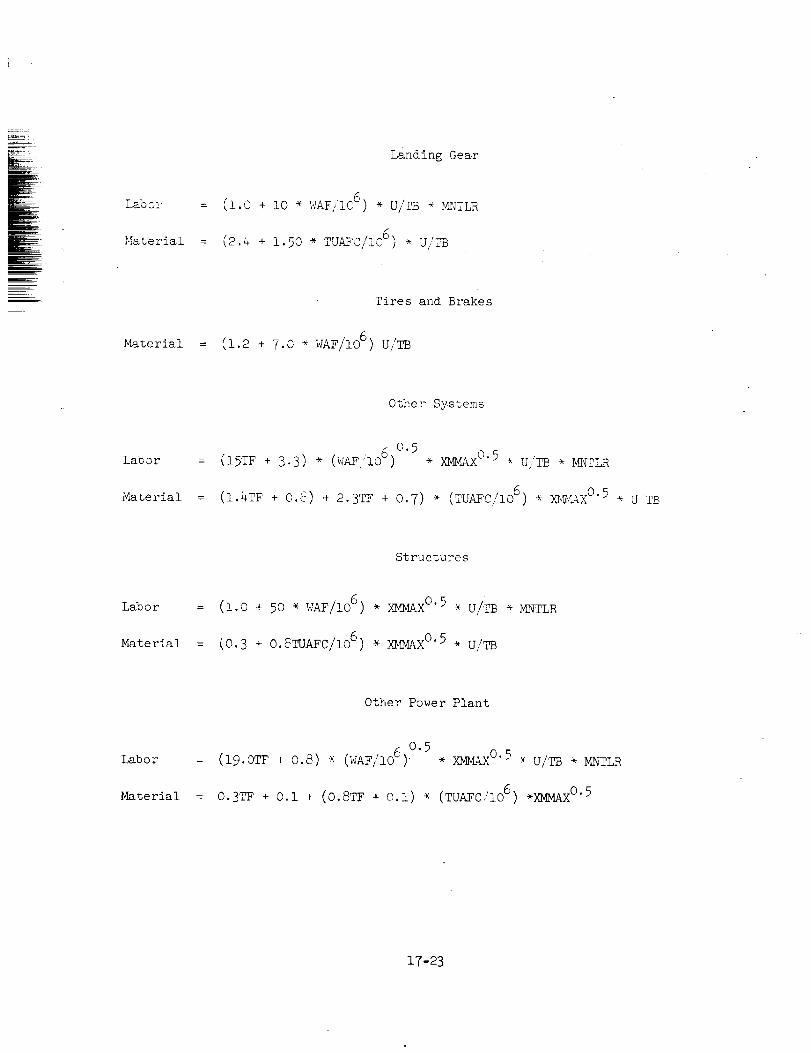
m'-!
Lab o r
Material
Landing Gear
= (i.0 + i0 * WAF/106) * U/TB * !{[?LR
: (2.4 + 1.50 * TUAFC/IO 6) * U,,i9
Tires and Brakes
Ma%erial = (1.2 + 7.0 * WAF/IO 6) U/TB
Other Systems
Lgooro.5
= (15TF + 3.3) * (WAF/IO 6) * XMMAX 0"5 * U/TB _ ZINTLR
Material = (I.4T? + 0._) + 2.3TF + 0.7) _ (TUAFC/IO 6) * X_]%&X 0"5 * U rB
Structures
Lab o r
Material
= (!.o+ 5o * WAF/IO_) _ x_x °'5 * u/_ _ _rLR
= (0.3 + O.@TUAFC/IO 6) * XMMAX 0"5 . U/TB
Other Power Plant
Labor
Material
(WAF/I06 O. 5: (19.0TF + 0.8) * ) * XMM-AX 0"5 * U/TB * MNTLR
: 0.3TF + 0.i + (0.STF + 0.i) * (TUAFCIIO 6) *XMMAX 0"5
17-23

Engine
Labor
Material
: [O.hTF + 0.2 + (O.OlSTF + 0.012) * TCE/XI,_NGC/IO 3] U/I_B -_ ]_£;I'LR
• XNENGC
: (3.STF + 2.l_0) (ENGC/10 5) U/IZ * XNENGC
The aoove formulas calculate the DOC in terms of dollars per aircraft year. This
is converted to cents per seat mile by converting the dollars to cents and dividing
each element by the seat miles flown per year.
Item I
Item II
Item III
Item IV
ITS4 V
Item Vl
Item Vll
IOC Model
System Expense
System Expense = XKSE x direct maintenance labor dollar
Local Expense
Local Expense = XKLOE x
Aircraft Control
maximum takeoff weighti000 x departures
Aircraft Control Expense = XKCO x departures
Cabin Attendant Expense
Cabin Attendant Expense = XKAT x Cabin attendant block hours
Food and Beverage Expense
Food and Beverage Expense = X](FB
x weighted revenue passenger block hours
Passenger Handling Expense
Passenger Handling Expense = XKPH x Passengers enplaned
Cargo Handling Expense
Cargo Handling Expense = XKCH x Total tons carried
17-21_
Item VIII
Item IX
Item X
Other PassengerExpense-
Other PassengerExpense= XKOPx RevenuePassengermiles
OtLer CargoExpense
Other CargoExpense= XKOCx RevenueFreigY_tton miles
Generaland Administrative Expense
GS_Expense= XKGAx Direct plus indirect Operating expenseless depreciation and insurance
DOCand IOCModelSymbolDefinitions
XI_ITE = SymbolTor selecting the range
YEAR
XNCRE_I
X}_ASS
XNATT
XLF
SSFB
IFB
FCSIR
= Year input for calculating costs in the proper year's dollars
= Numberof personnel in the flight crew
= Passengercapacity of the aircraft
= Numberof cabin crew
= Loadfactor
= Flight crew supersonic flight bonus
= Fli_,t crew international flight bonus
= Flight crew salary inflation rate
ENGC = Enginecost per engine
MNTLIR= Maintenancelabor inflation rate
TG = Groundtime in minutes
U = Utilization
IRA = Insurance rate
PERIOD= Depreciation period
CFT = Cost of fuel ($/LB)
COT = Cost of oil ($/LB)
17-25

MBF = Maintenanceburden factor
RE_PAS: Numberof revenuepassengersper year
AVCARG
XKSE
XKLOE
XKCO
XKAT
X](FB
XKPH
XKCH
XKOP
XKOC
XKGA
CFARE
XKFARE
XFACC
TA_
CARGF
FB
TB
WAF
TUAFC
TF
TUACC
= Average pounds of cargo per flight
= System expense 10C factor
= Local 10C factor
= Aircraft control 10C factor
= Cabin attendant IOC factor
= Food and beverage IOC factor
: Passenger handling 10C factor
= Cargo handlinglOC factor
= Other passenger expense 10C factor
= Other cargo expense IOC factor
= G&A expense 10C factor
= Fare cost factor - (function of distance)
= Constant portion of the fare - (function of number of revenue passengers)
= Facilities cost (dollar input)
= Income tax rate (decima.])
= Revenue per cargo ton mile
= Block fuel
= Block time
= Weight of airfrar_e (weight empty - engines)
= Total airframe cost
= Flight time
= Total aircraft flyaway cost including R&D
17-26

Return on Investment (ROI) Model
The returr, on investment (ROi) for the ASTis calculated by a simplified methodinthe ASSETprogramfor comparativeanalysis.
EVALUATIONRESULTS
Five structural approacheswere evaluated and comparedusing the resulCs of theASSETcomputerprogram. The wing design approaches included:
(I) Chordwise stiffened wing arrangement, beaded skin panels, mechanical
fasteners (WCI)
(2) Spanwise stiffened wing arrangement, hat stiffened skin panels,
mechanical fasteners (WC2)
(3) Monocoque wing arrangement, aluminum brazed honeycomb sandwich skin
panels, mechanical fasteners (WC3)
(4) Monocoque wing arrangement, aluminum brazed honeycomb sandwich skin
panels, welded (WC4)
(5) ComposiCe reinforced-chordwise stiffened wing arrangement, beaded skin
panels, mechanical fasteners (WCS)
In evaluating each of the above wing designs, a skin stringer and frame construction
was assumed for the fuselage.
A summary of the ASSET program results are presented in Ta0ie 17-2. The results
include weight, geometry and cost data for both the constant-size and constant
payload-range aircraft.
CONSTANT WEIGHT AIRCRAF2
A comparison of the various parameter (i.e., structural mass, range, cost) for the
constant size/weight aircraft indicates a variation in these parameters and the
minimum does not necessarily identify the best concepts. The least weight wing
ORIGINAL PAGE IS.
OF POOR QUALrI_
17-27

LUlLu_Z
_ _ o=_,_,:o, _OIE E ,-
g8
(_3
(.3
C_0
0H
!
,-4
I,U
83_ __a _ "_oQ_
N_ _00_0
_N_N_
A
0 Z , 0_-_ _ _-_
_o_===_ o_ a-
17-28

concept is the composite reinforced_design (WC5); the spanwise design (WC2) is,
however, the least initial cost concepts as typified by the flyaway cost. It can
be seen from the tabulated data that the weight savings realized by the application
of composites to the spar caps permits approximately i6,60Opounds of additional
fuel to be carried. Hence, the range capability of the structurally efficient
composite reinforced design (WC5) is approximately 340 nautical miles greater than
the chordwise wing design (WCI). All concepts, however, do not meet the range
criteria of 4200 nautical miles. A reduction in structural mass of 1700 pounds is
required to the composite reinforced design to satisfy the payload-range
requirement.
CONSTANT PAYLOAD-RANGE AIRCRA/T
The constant payload-range data of Table 17-2 indicates that the takeoff gross
weight of the resized aircraft varies from a maximum of 885,000 pounds to a minimum
of 760,000 pounds. The data presents the minimum structural Weight, size and cost
to be the composite reinforced design (WC5).
Growth Factor. - Figure 17-5 visually displays the takeoff, gross weight variation
with the. range capability of the constant-weight and constant payload-range air-
craft. The trends presented indicates that the growth factor of this class of
aircraft, which is represented by approximately 50-percent fuel, is 6 (i.e., a
1-pound increase in structural weight results in a 6-pound increase in the aircraft
takeoff gross weight). Thus, the importance of minimizing structural mass is
emphasized by these trends.
Structural Mass Versus Cost. The wing mass variation with relative cost is pre-
sented in Figure 17-6. The data relates the structural efficiency of the design
concepts with the direct operating cost, normalized to the least cost approach.
DOC is a measure of total-system-cost that includes such parameters as: structural
efficiency; engine requirement variation as the airplane size changes; the impact
of airplane size, concept selection, and mass on fuel consumption; and development,
manufacturing and operating (maintenance) costs. The desirable area, as visually
displayed by the arrow, is the least weight and least cost region. The composite
reinforced design (WC5) is the least weight and cost concept evaluated.
17-29

Z
w w °
0 0
o o _t0 '0Z z O}0 o _0
.-__
_g___
a zw<
-NZ_wo
0I-(.90wX
u-
o o o o
X
"q] _.. IHDI3M SSOBD 4:10 3);VJ.
I I I I
X
B)t --. SSVIAISS01::IOd.-IO 3)IVl
Io¢N¢0
oo
o
8=o
U')
8
17-3o

/LU
e,e0-r
/ILl
w
z
o.o')
I,iL
dL
,\
ILla.Ju.J
ILl
00U0z0_E
\ILl
00
0Z0
\
oZm _,,
r_ o(_a,.O_"1"0uu
\
_-J.::1-8"1 J.Hgl3M J.INrl ONIM
o
00O
r_v
I-b0O(.3
Lu>!-
_1
_;,,,rr
(NO
8
o
I I I
Z-- uJ"§_1 SSVIN .LIN_'I 9NIM
o
co
_.o
>
,.dI
t_
a_
oH
17-31.

Technology Improvement Versus Cost. Figure 17-7 presents a bar chart relating the
technology level of each design concept with the initial cost. The metallic stif-
fened skin approaches are displayed on the left hand side with the more advanced
technology concepts on the right hand side. The initial cost is measured by the
flyaway cost of the vehicles, normalized to the least cost system. The composite
reinforced design (WC5) is the least cost with the monocoque approaches being
approximately 15-percent greater.
Technology Risk Versus Cost. - Technology risk, as presented herein, is a quantita-
tive factor related to the damage tolerance characteristics of the design concepts,
tempered with an assessment of development risk. As shown in Figure 17-8 the span-
wise and chordwise designs are considered as the least risk concepts; with the
welded monocoque design representing the highest risk. Since the composite rein-
forced design is essentially a chordwise stiffened design with only the spar caps
reinforced with Boron Polyimide (B/PI) composites, it is displayed above the chord-
wise design. The monocoque design is represented as nominal. The cost parameters
are normalized (to the least cost concept) direct operating costs. The composite
reinforced design is the most desirable of the five design concepts evaluated.
Investment Versus Cost. Figure 17-9 presents the investment cost variation for
each design concept with direct operating costs. Both cost values are normalized
to the least cost approach.
Investment cost includes the cost for the aircraft, the aircraft spares and the
special support equipment. The cost of the production aircraft is the primary
element of investment. The spares and support equipment are treated as percentages
of the flyaway cost of the aircraft.
As shown by the normalized values, the composite reinforced design is the least
cost approach.
17-32

L
qN
8
Ow
w
o_oSo_
w
DOOt)O
I
r.Q0r_)
r._
>
0
oo
u
I
L"--
b-t
17-33

&L
•
awa.Jw
Iw
OOU
OzO
-r
dh
W
8OzO
a
O14-
.I0:
Ou
Oz
lJl
O
IF
uJ
Z
O.J
o
o.
o
oO
A
O
v
O
ILl>
<.JHI
oED
r.o
I>
H
H
r..)
:d!
[.._
H
'17-34
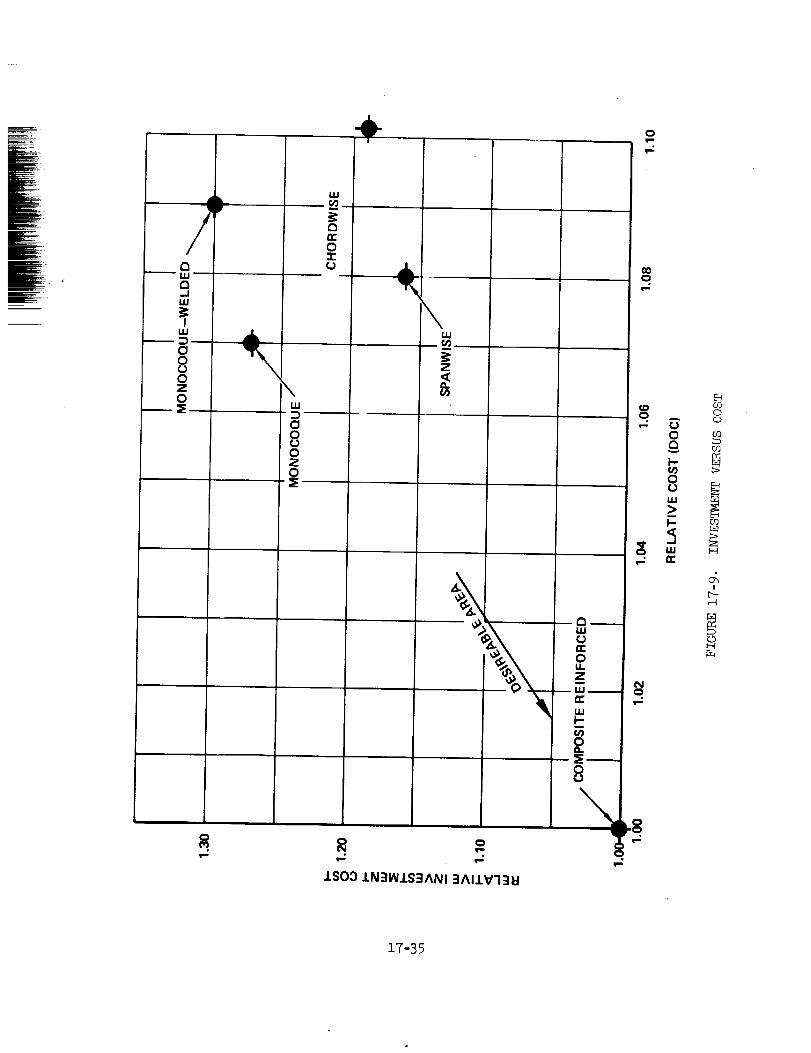
JL
/,r_
C3..JuJ
IIJJ
OOU0z0
0
\LU
00
0z0
w
n-O"1-u
\LU
/SO3 J.N=IIN.LS3ANI 3AI.LV"I3i:I
\
r_u.,i
rrOLLz
_lJJ
IJJI-
Ou
\
o
00o
(JDO
O(3
v
1-,-
OuuJ>
¢NO
r.oo
co
o3
H
o_!
,-q
0
17-35

CONCEPT SELECTION
The various wing design concepts, each with a skin-stringer fuselage design, were
evaluated with respect to structural mass, performance and cost. These factors
were interrelated to yield a relative comparison, based on minimum-total-system-
cost for a constant payload-range aircraft.
Based on a constant-weight airplane the ranking of the design concepts shown in
Table 17-3 was obtained. When these design concepts were applied to a minimum
total-system-cost airplane the ranking of the concepts was unchanged (Table 17-h).
A comparison of the relative costs of the various wing design concepts is also pre-
sented in Table 17-4, and shows that the composite reinforced design is 7 to ii per-
cent less costly than the other design concepts.
The best homogeneous (single concept applied to total wing) structural approach for
design of Mach 2.7 supersonic cruise aircraft is the least cost and weight chord-
wise stiffened design with metallic surface panels and composite reinforced spars.
The structural arrangement for this design concept is presented in Figure 17-10.
Approximately 6000 pounds of composite material is used and result_ in a 16,600 pound
weight saving of wing structural mass. Structurally efficient circular arc-convex
beaded surface panels of titanium alloy (Ti-6AI-4V annealed) are used. The surface
panel design is directed towards alleviating thermal stresses while utilizing both
skins in resisting shear. With the beaded inner and outer skins, the surfaces do
not participate in resisting wing bending and all the bending material is concen-
trated in the spar caps. The titanium spar caps are reinforced with boron/
polyimide as shown in the figure. The reinforcement strips are continuous from
BL 470L to BL 470R.
The importance of minimum mass structural concepts was emphasized by the increasing
cost trends with an increase in wing structural mass as shown in Table 17-4.
Weight inefficiencies evaluated under the payload-range constraints can and do
raise costs appreciably. Furthermore, with the apparent high growth factor (GF _ 6)
of this class of aircraft, it appears that considerable effort is warranted to
remove unnecessary wei _o minimize the effect aircraft size and_ cascading on
takeoff gross weigh__
17-36

TABLE 17-3. CONCEPT EVALUATION SU_%__RY - CONSTANT WEIGHT AIRCRAFT
w
CONCEPT
(1) CHORDWISE STIFFENED-CONVEX-BEADED PANE LS
(2) SPANWlSE STIFFENED-HAT-STIFFENED PANELS
(3) MONOCOQUE- ALUMINUMBRAZED HONEYCOMB
CORE PANELS
(4) MONOCOQUE - ALUMINUMBRAZED HONEYCOMB
CORE PANELS (WELDED)
(5) CHORDWlSE STIFFENED-
CONVEX-BEADED PANE LS;B/PI REINFORCED SPARS
WING WEIGHT
LBS/FT2
9.80
9.68
8.54
8.85
8.25
RELATIVE
WEIGHT
1.19
1.17
1.03
1.07
1.00
TABLE 17-4. CONCEPT EVALUATION SUMMARY - CONSTANT PAYLOAD-RANGE AIRCRAFT
STRUCTURAL ARRANGEMENTAND CONCEPT
(1) CHORDWISE STIFFENED-CONVEX-BEADED PANELS
(2) SPANWISE STIFFENED-HAT-STIFFENED PANELS
(3) MONOCOQUE -ALUMINUMBRAZED HONEYCOMBCORE PANELS
(4) MONOCOQUE - ALUMINUMBRAZED HONEYCOMBCORE PANELS (WELDED)
(5) CHORDWISE STIFFENED -CONVEX-BEADED PANELS;B/PI REINFORCED SPARS
WING MASS COST
kg • m-2 LB • FT -2 RELATIVE" DOC RELATIVEMASS (C/SM) COST
49.80
48.82
41.89
43.40
40.43
10.20
10.00
8.58
8.89
B.28
1.23
1.21
1.04
1.07
1.00
2.14
2.09
2.06
2.11
1.93
1.11
1.08
1.07
1.09
1.00
17-37


°IIII
I
c_


• ¥
oE
d!
R
8

__1
The structural weight for the various regions of the wing structure are shown in
Table 17-5 for the five structural approaches. It appears that incorporating the
minimum weight regions into the wing design would result in the best approach for a
Mach 2.7 design.
Thus, the recommended structural approach for the Task lI Detaiied Engineering
Design and Analysis is a hybrid structural approach consisting of the monocoque and
chordwise stiffened structural arrangement as shown in Figure 17-11. A minimum
structural mass airplane (near-term) is obtained by combining the minimum mass
components (i.e., wing forward box, aft box and tip) as determined by the detailed
structural analysis. Table 17-6 shows the airplane weight and cost parameters
for this hybrid design, for both constant-weight and constant payload-range
criteria. The hybrid design very nearly satislies the payload-range require-
ment, specified for the 750,000 pound baseline configuration concept,
,& C DTSGpAG NOT FKM
17-41

H
!
ZW
W
Z
r,r"
o oo ._
A A
ml "
_: _ _ _ X>i • • • _-.
0
qr,,,,
_7-4_

z
C_IL
oI.-
,¢I-
O0
,r"
n'-ILl1-
,¢iii
z
\
\
i=\
\
n_
0
>-ILl2_O.-J
iit"1" zc_c¢I11 0,.
N "1-
8g#
z_0_o
HH
I
H
17 -43

TABLE17-6. EVALUATIOr_DATAFORHYBRIDSTRUCTURALARRANGEMENT
STRUCTURAL
ARRANGEMENT
CONSTANT GTOW:
TOGW
OWE
WING WEIGHT
WING AREA
WING UNIT WT
RANGE
F LYAWAY COST
DOC
IOC
ROI A.T.
HYBRID
(MECHANICAL)
WC7
(LB)
(LB)
(LB)
(FT2)
(LB.FT'2)
(N.Mi)(MIL DOL)
(C/SM)
(C/SM)(%)
CONSTANT PAY LOAD-RANG E:
Ti3GW
750000
312322
88620
10822
8.19
4183
93.57
1.91
0.90
1.82
OWE
WING WEIGHT
WING AREA
WING UNIT WT
RANGE
FLYAWAY COST
DOC
IOC
ROI A.T.
(LB)
(LB)
(LB)(FT2)
(LB.FT-2)
(N.Mi)
(MIL DOL)
(C/SM)
(C/SM)
(%)
754665
313963
89216
10889
8.20
4200
94.02
1.92
0.90
1,73
17-44

E REFERENCES
Levenson, G.S.; Boren, H.E.; Tihansky, D.P.; Timson, F.S., "Cost-Estimating
Relationships for Aircraft Airframes" R-761-PR (abridged), Rand, Santa Monica,
February 1972.
T!Large, J.P., Estimating Aircraft Turbine Engine Costs" RI_-6384/I-PR, Rand,
Santa Monica, September 1970.
3 Standard Method of Estimating Comparative Direct Operating Costs of Turbine
Powered Transport Airplanes, Air Transport Association, December 1967.
"More Realism in a Standard Method for Estimating Airline Operating Expense,"
Lockheed California Company, Report 0EA/SST/179, March 1966.
"Revisions to 1964 Lockheed/Boeing Indirect Operating Expense Method,"
Lockheed California Company, Report COA2061, December 1969.
Indirect Operating Expense Coefficients years 1963 through 1972, Lockheed
California Company, COA/1277, June 1973.
17-45


Lp
J_
APPENDIX A
COMPUTER PRINTOUT
ASSET PARAMETRIC ANALYSIS
17-47
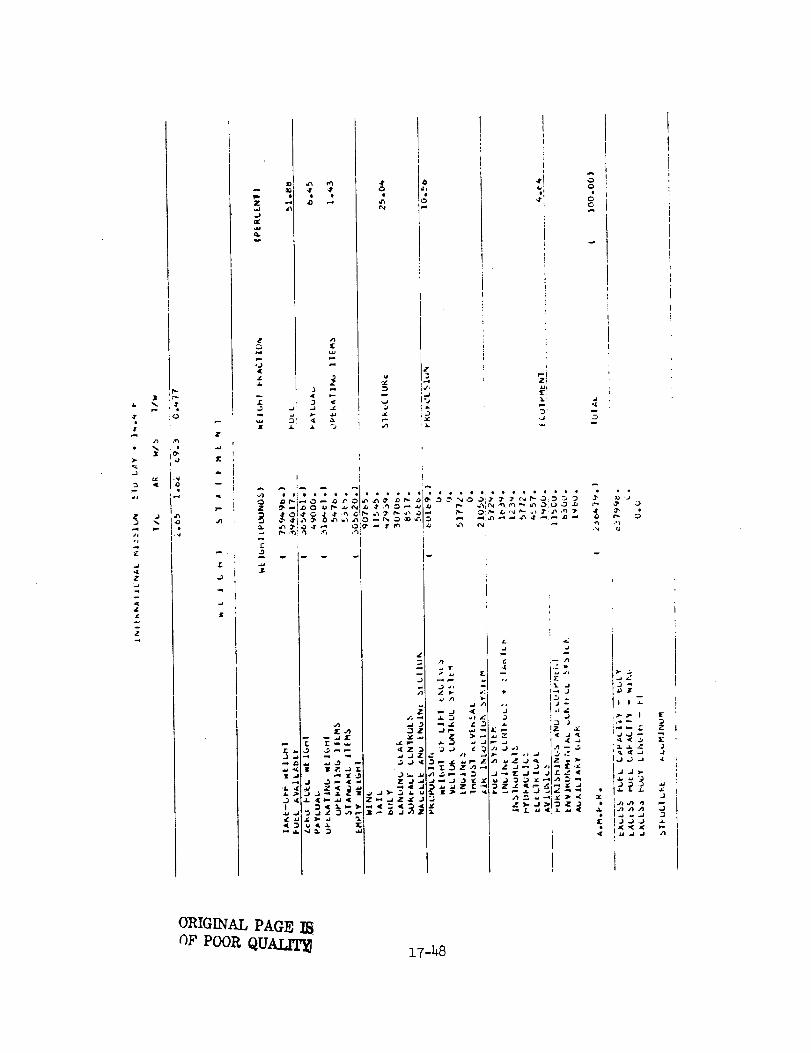
3
.T 0
4J.a
Z
Z
Z
lr
r
_ i
i
£
.J
u
s
_ " .J .L
'.J
1I
_r
7
_P .. _ "3
_ i _4. 1_,w j_
i
l -
'___ ,_
ORIGINALPAGE m,O_ POOR Q_A_r_
17-4-8

3:
=...
:L
V'_
p.,
1"
_J
l
.t
,5 41"r...O ,",
,-e
• e
.,,,j,,0..Fi
O 4'
ON
J-i
,...* _ 0' 0_ I,..4
r_- .u I'4
_._ r_ 4" ,._
P.. M _ i.,
•.-q _(m
Z
m
I,-
D
t
Z
.J
_d _._4[
_neq
Q,
t%J '% •
N%,.n
_:_ o
• " L,
2 _
" i :-
t ,z J !
p- • ,_
Z
_a't
,./1
:!_ A
_ Z
I_ Z
.3
"I I
ORYG_NAL PA_ I_
OF POOR QUALITY

.,r
i
o
3_., '
i
I,-.
I
II
I
l_"z
I -
,..J ,..J _,i[ .i _
_ g_g
_ e
m Z _'1_
i
"1
e • •
I
_7-_0

17-51

.J
_-7-5_

4"
wd •
._-o -°
I
..1[
,J
z ;J _1"
,m
_T, ,"
FJ._
zr'- ;,
J_.
1;I0
|
1;
,_,,0
,xl
2t _
g', 0
¢'4
0
_L
,Jo'l
I[
e
'4'
J
-- Z
_ 2J
0 •
oO"
17-53
00
p.0
o
q
4" • _',J N
° _1o
_ m
4
,t 0e •
_r
e
!"
I
40,1
;g2
0:
I
11<
o'1 ,j w
i_.0 _
0_ o* | 0
0
Z<
(_rlb_INAI;PAGE ISOF POOR QUALITY

0 *0000
0
0000000• ¢_
oo. oooo0 0 0
_ ° •0 00
• 0 •
d
0
• e
0000, 0
J 0 iO
IT-5_

J.. _ !rw •
JJ
Z
,,z
. !
£
J
IC
i •
:) •
_. ..J
• 1 J"
J
m
u,
Fe,.
4 _
& ..,
-_-T.g -
I
0
•
I
i J:,
3_
I I _-
.J.J _
• J
•.) Jd i_
17-55

..q
t
p..
I-
:C
0
i •
_o_
_q I,%
,,%
• i
4"
m-
e
o" D
M
d_
0
a. e
o
a5
Z
_.oo
aL
...;0
mO
Z
mad_
o
m
I
,¢3
17-56

E
z
"m
Q
.L
_JJ_
Zd_
4[[Z
"d2._
d.
4" _
9
j --
._ i_ "_-
Z
Zm;
o o
o. - ,_
0
o, oo0 0 0
•0 *A¢F N
• ,i _,q
iO Q <r ,_
s
. ." C, C, _
&.i
0 0 0 0 0
; ; g g d d
, _ _ _ ,,, _
e" * •
•"1 -'1 _, ,n
17-57
0 0 0 0 0 0
oooti
e • e
ddg_
ggd;dg
!
2_2";;
-2 35
;giggg_)
_ g
o o
0 0 0
p- p-
! !
:_ _ •
e *
; 2
@
0
.0
?
y
Iii ° °•1' .'_
1
,0e
e,
,.,a
4,,
OR_GINAE PAGE IS
OF POOR QUAIATE

0O"
' iO" t-O0
_d
•Q4)
L I.O ._ e • •
z !_ • Io
L:J •
. I
r%; • •
,-4 ,rl Jo ,7, _
,% .
r..
E: _"
< II
r_ _DN_
4_ _._ e_ r,!
Np_
,,el_
J
,G
.J
' Ii •
o i
¢L..J_Z 4'
m,v_!
_,: _,
17-58

E
L
m
:C
o i"iz
,Jv_
.,q
3JC #
J • •
p.4
.1[• p ,
z
_ zw
I
Z _
..q
e-
!z
_ 3
J 3 2
,__ _ .'i _
1
J.
k-
• ,1 _1_
g g g _ -_ Z
. _
Z 2_ ...1
X 5 -
• .-q
¢ : -
z - 2 ,
.I J
17-59
o. o. _.0 _ 0 0 _ 0
_ g
o S o g
ii
w
4" 4"4" '_
o8
Z )"
1_ _ -..._
= if_S ,-"$"_ = "_
-.
w
_ JL
_) ._
J ,(
,ll
N
I-
I I I
qt I _
)._J
.a• , ).
,(
!

17-60
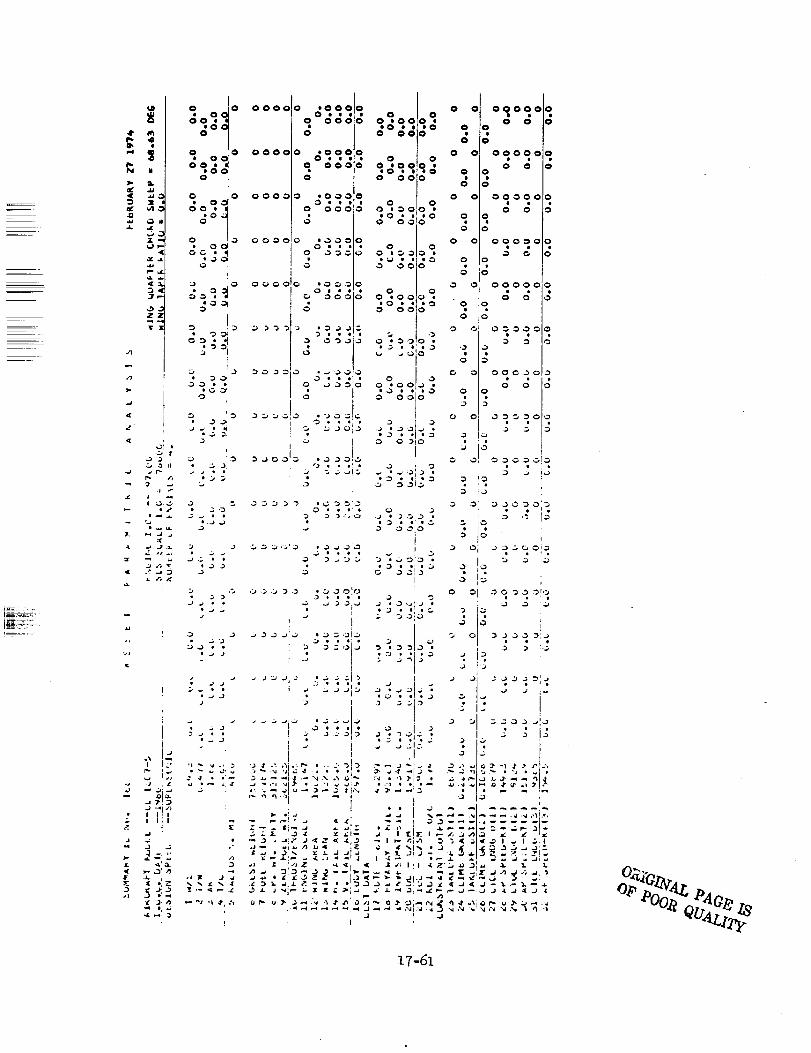
4" Iq
libN #
_ L40
3p
T
).
0 0 0000
0
_ O00 0000
0
0 0 0000
0
0 0 00_,0* O0
°_,.i g
000
0
0 0
o
0 O0
_ ° o
!
goo._0 _000 0 *00
go;;
e . _ • i
o ° °o.:0
0 (:0
0
0 0
0
g•D 0
o; o0 *
0
0
• _ • o._oo .:._0 o 0 00o
• J "_ I
°!' I I-
-;,_ , • _, J "> • .: . .J , o
,!
o.0
o o.o o.o0 0
200000
• e0 0
0
000000
0
0 0
o o I o_o_o,o.
° 1
_ LJ
3 iO I
J 0 i J ,.._,& _J 0_3
-,'_!D
" If
J ..;
_':'
_1 * ,,4
0
0
0
• • . J 0 '
.! • :. 9 i_
-J 3 _ , i.j
] -J !';_
;-, . . _ -:'_ " i"i " J • , :; _,_:'.j I.
t
,-oo
i t
IT-61


_i_!
---y _-_
lu
!:
Ji
!N
lk-!_
i
SECTION 18
DESIGN
C.Wo
BY
LINDBLOM


E_
El,
TABLE OF CONTENTS
Section
INTRODUCTION
DESIGN APPROACH
Joining Methods
Design Ground Rules and Constraints
STRUCTURAL DESIGN -- TASK i
Chordwise Stiffened Wing Design -- Fasteners
Spanwise Stiffened Wing Design -- Fasten6rs
Monocoque Wing Design -- Fasteners
Monocoque Wing Design -- Welded
Composite Reinforced Wing Design -- Fasteners
Skin-Stringer and Frame Fuselage Design -- Fasteners
Sandwich Shell Design -- Welded
Design Problem Areas
DETAILED DESIGN -- TASK II
Design Objectives
Scope of Design Studies
Wing Structure Design
Fuselage Structure Design
Potential Problems Not Resolved During Study --
Design and Manufacture
Components for Further Evaluation and Test
REFERENCES
Page
18-i
18-3
18-3
18-6
18-9
i8-9
i8-i7
18-_2
18-3o
18-35
18-35
18-40
18-43
!8-45
i$-45
18-45
i8-46
18-59
18-60
18-61
18-67
18-i


=-
Figure
18-1
LIST OF FIGURES
Chordwise Stiffened Wing Design -- Fasteners
Page
18-ii
r
|v-|!
!I!
I
!|
L
_i _i:i_
i ¸.
|
I
!
| -
18-2
18-3
i8-4
18-5
18-6
18-7
i8-8
18-9
18-10
18-11
i8-12
18-13
Installation Space Requirements for Various Fasteners
Spanwise Stiffened Wing Design -- Fasteners
Monocoque Wing Design -- Fasteners
Monoeoque Wing Design -- Welded
Typical Module for Welded Sanuwich Wing Structure
Composite Reinforced Wing Design -- Fasteners
Sandwich Shell Design -- Welded
Structural Design Concept -- M2.7 Arrow-Wing Supersonic
Transport Configuration (Near-Term)
Structural Design Concepts -- Surface Panels and Substructure
Attachment of Truss Spar to Low Pressure Diffusion BondedSurface
Structural Design Concepts -- Truss Spar and SurfacePanel at Transition Structure
Structural Design Concepts -- Tank Sealing Concept andRib Details
18-15
i8-i9
i8-23
18-3i
i8-33
18-37
i8-4i
18-47
18-49
i8-52
18-53
i8-57
=
|::i ::!.| ::
{
E
=
_L-2 :
_-:
18-111
PAc mot


LIST OF TABLES
Table
18-1
18-2
18-3
18-5
18-6
18-7
i8-8
18-9
!8-i0
Vendor Contacts Made for Arrow-Wing Structures Study
Evaluation of Structural Approaches -- Task I
Potential Problem Not Resolved -- Wing Surface Panel Concept --
Convex Beaded
Potential Problems N_t Resolved --Wing Span Concept --
Composite Reinforced Titanium Alloy Caps
Potential Problems Not Resolved --Wing Surface Panel Concept --
Honeycomb Sandwich
Potential Problem Not Resolved -- Fuselage Shell Concept --
Skin and Stringer
Potential Problems Not Resolved -- Tank Sealing Concept
Test Objectives
Fabrication Process Tests
,Structural Element and Component Tests
Page
18-2
18-4
18- 61
_8- 62
18-62
18-63
18-63
18-65
18-65
18-66
_'RP--'_I)I_3PAGE BLAArlT NOT FILMED'
18-v

SECTION 18
DESIGN
INTRODUCTION
An important facet of the structural design concepts study is the establishment of
a firm design technology base that will permit the best possible judgement to be
exercised in the selection of structural concepts and materials for the next genera-
tion supersonic transport. This design technology base was determined with the
full consideration of:
• the practically obtainable benefits of applicable advanced technology
• the internal structural response to the complex interactions among inertial,
aerodynamics and thermal loadings
• the effects of various structural arrangements, concepts and materials on
these interactions
An underlying objective _as the achievement of the minimum possible structural mass
fraction since the economic effectiveness of the supersonic cruise aircraft is
critically sensitive to inert mass as well as aerodynamic and propulsive efficieneies.
In approaching this task the following were identified as encompassing the potential
for structural mass reduction:
• Improved titanium alloys (beta alloys)
• Improved fatigue quality through minimizing fasteners by the use of welding,
bonding, brazing, weld bonding, weld brazing and rivet bonding
• Large scale fabrication to minimize the number of Joints
• Minimizing or eliminating tank sealing by the use of large scale application
of welding, bonding and brazing
• Selective reinforcing of metal structure with organic and metal matrix
composites
18-i

• Determining the structural arrangementsmost efficient in coping with theinteractive ioading of a large, flexible arrcw-wing
• Determining the most efficient structural conceptswithin these structuralarrangements
The initial design effort wasdevoted to the establishment of the baseline config-uration concepts and the subsequentdevelopmentof internal details to provide inputsto massdistribution and other studies included in the structural study effort. Thevarious drawings developedare presented in Section 2, Baseline ConfigurationConcept. The developmentof these drawings madefull use of the information ofReferencei.
In developing the structural arrangementdrawings for the various wing and fuselagedesign approaches, an extensive backgroundof design data wasavailable from thedesign and manufacturing studies of advancedstructural designs having potentialapplication in a Mach2.7 arrow-wing configuration transport. Thesestudiesincluded numerousconsultations with vendors (Table 18-1) and other contrac-
tors, extensive literature surveys and close collaboration with producibilitypersonnel. This backgrounddata was fully utilized in the structural arrangementdrawings discussed in the subsequentsections as well as in the determination of thedesign parameters (Section 8).
TABLE18-1. VENDORCONTACTSMADEFORARROWWINGSTRUCTURESSTUDY
Vendor
AeroncaMfg.Rohr Aircraft
Northrop Aircraft
TRWSystemsAdvancedStructures and TechnologyCo.Sciaky Brothers, Inc.AvcoHolosonics
Subject Discussed
Aluminum Brazed Honeycomb Sandwich
Liquid Interface Diffusion (LID)
Diffusion Braze Process
Nor-Ti-Bond Diffusion Braze Process
Weld Bond
STRESSKIN
Welding
Metal Matrix Composites
NDT Inspection Methods
18-2

DESIGNAPPROACH
Thevarious approachesin the arrangementof surface panel concepts and structurefor primary structure design are presented in Section i, Structural DesignConcepts.The evaluation rationale of the structural approacheswasalso presented (Table 18-2).
Eachstep of the procedure wasoutlined from:
(i) Establishing the material system
(2) Defining the fabrication and/or assemblymethodfor the candidate concepts
(3) Conductingthe design analysis according to the guidelines defined
(4) Establishing massand cost data, and
(5) Evaluating the results and selecting the most promising arrangementforfurther detailed study.
Joining Methods
A vital part of the study matrix (Table 18-2) is the evaluation of the joiningmethods. Theseare important parametersbecauseof their influence on suchfactors as:
• Fatigue quality and damage tolerance
• Manufacturing cost, facilities and techniques
• Serviceability and maintainability
• Fuel tank sealing
• Thermal stresses, residual stresses, and mass
Based on the comprehensive investigation into the various Joining methods and their
applicability to the candidate structural design concepts, two methods were selected
as identified in the Fabrication and/or Assembly column of Table 18-2.
18-3

Z
:3 -J
wO• Z
°!H
z
o b- _
<g =w =I
* i!
° _ _iz _
< •
cd
r_
Et
-- _wZ
A
0
Z _
_ Z
_o_., . _8_ -_
F^ .
wO__Z
o__
II 1
.J
I--
0
L_J
I-
E
_4
L
I--
0
E=
00"00
li_ I,Ll Iu
,z., z
II
*!!!ii!5 E=
.. 0.i1li@ • • II
U
'_-'--_,_-GD_ALPAGE IS,
01_ POOR QUALIT_
18-_

• The "fastener" Joining method is taken as a baseline ease and is
investigated for all wing and fuselage structural arrangements.
• The two joining methods (welding and fasteners) are considered for the
monocoque wing arrangements.
The logic behind this reduced matrix is that the study of the two methods noted
above will yield sufficient data concerning the merits of each fabrication and/or
assembly method to permit valid projections to be made concerning the effects of
Joining methods on the spanwise and chordwise stiffened wing arrangements without
the need for a design development effort for each individual joining method.
Titanium alloy Ti 6AI-hV is taken as the baseline metal for the design study even
though Beta C and other titanium alloys were investigated.
As a matter of clarification, the joining methods described herein are concerned
with methods used to assemble major components (wing surface assemblies, spar
assemblies, etc.) to their next assembly. It does not imply that all attachments
within these major components use the same joining method. For example:
• A wing structure design using honeycomb sandwich surface panels attached
to substructure by fasteners is included in the "fastener" assembly
concept even though the surface panels themselves might be fabricated as
aluminum brazed, bonded or welded honeyeomb sandwiches.
• A fuselage structure design with skin panel assemblies joined together
by fasteners also is classified under the "fastener I' concept even though
stringers, frame segments and other detail parts of skin panel assemblies
are attached by weld bonding, brazing or other means.
18-5

ManufacZuring/Subcontracting/Facilities Guidelines
The focus on the methodof joining major componentsreflects the complexity requiredin manufacturing equipment, facilities and techniques. For example, the "fastener"concept permits conventional manufacturing approachesto be utilized. In contrast,the "welding" designation indicates that complexand expensive facilities and equip-mentmaybe required for manufacturing and maintenance. Thesefactors relate to anumberof items, including the feasibility of a particular "design go-ahead"date.
The interpretations abovepermit subassembliesto utilize advancedassemblyprocesses,such as weld bonding, weld brazing and others, consistent with the assumed"designgo-ahead"and the fabrication and transportation size limits established.
Guidelines in reference to manufacturing, subcontracting and facilities were estab-lished considering the aboveto aid in the design process. Theguidelines, dis-
cussed in Section 7, _terials and Producibility and Section 8, Basic DesignParameters,are smmmarizedbelow:
• The entire fuselage, except for the flight station, is designed for
subcontracting (and transportation limitations).
• All wing segments, and the complete wing, to be assembled in a new facility
assumed to be constructed in Palmdale. Wing components, such as spars and
ribs, to be suitable for subcontracting.
• The new Palmdale facility is postulated to have autoclave and fusion and
spot welding equipment suitable for fabricating large components.
• Fuselage segment joints need not coincide with wing segment Joints.
Design Ground Rules and Constraints
The ground rules enumerated below were established at the beginning of the study
and are presented to define the basis for the design effort. Some of these rules
might be modified by new developments or as a result of further study. Specific
guidelines for manufacturing are presented in Section 7, Materials and Producibility.
18-6
• Minimum mass is the primary design objective]
• Design work is initially based on all-metal structure reflecting the
technology level for a design go-ahead at the end of 1975. This technology
level is expanded to include selective reinforcing of the metal structure
with composites considering a design go-ahead in 1981.
• Bonding, weld bonding, rivet bonding, weld brazing and the aluminum braze
(Aeronca) processes are postulated to be developed adequately and available
for use.
• TIG, plasma arc and EB welding acceptable but laser welding not yet
qualified.
• Component size limits, as dictated by fabricating processes, to be:
o Hot vacuum forming - 15 feet wide by 35 feet long
o Aluminum brazed sandwich - 68 inch wide by 40 feet long
o Weld bonded and rivet bonded panels - 15 feet wide by 50 feet long
• Component size limits, as dictated by transportation method, defined in
Section 7, Materials and Producibility.
• Structure to have an economic service life of 15 years, a service life of
50,000 flight hours, a design fatigue life of twice the service life and
damage-tolerant structural concepts where possible.
• Structure design to be based on Mach 2.7 cruise speed.
• Fuel tank access to be provided by a minimum of 2 doors for each fuel tank
or isolated portion thereof. Access opening size to be approximately
13 x 18 inches for vertical entry and 20 x 31 inches for horizontal entry.
• Minimum skin gauges (inch) to be:
o 0.020 for exterior skins on the wing lower surface
o 0.015 for exterior skin on the wing upper surface
o 0.010 for the interior face of a sandwich
18-7

• All fasteners in exterior surface to be flush.
• External splice strap acceptable at all longitudinal panel splices in thefuselage and at BL L70 Joint in the wing.
• At countersunk fasteners, the face sheet thickness shall be at least0.010 inches greater than the countersink depth to avoid "feather edges"
and degradedquality. This rule might be waived in joints where thereduced allowables and degradedquality resulting from feather edgesareacceptable.
• Framelocations different from spar locations are considered acceptable butwill be used only where an overall advantageis indicated after evaluationof any extra material required to redistribute and/or account for loadings
encountered at BL 62.hi rib.
• For welded/corrugated web spars and ribs, it is assumed that the cap strips
should be normal to the plane of the web. (Note: subsequent meetings with
Sciaky welding specialists indicate the feasibility of welding caps to webs
at angles varying as much as 15-degrees from normal to the web).
• Manually upset Ti rivets (B-120 and Beta C) limited to 0.156 inch diameter
maximum,
• All Ti Hi-Tigue fasteners to have studs of Ti-6AI-4V in the STA condition.
• Shear (shallow) head flush fasteners acceptable in the outer skin.
• Single row of fasteners unacceptable at skin panel joint if the joint must
be fuel tight.
• For welded joints:
o Manual welding limited to an absolute minimum
o Skin splice welds planished
o All welds to be the butt type
o All welds shaved on all surfaces unless impossible
o Welds are designed for stress relieving where feasible. However, welded
spars and ribs will not be stress relieved. Note that welded joints in
members which are later hot formed are stress-relieved automatically.
18-8

E--=
m
• In the primary structure, acces# doors are to be the "clamped" type where
feasible to avoid fastener holes in primary structure.
• From the manufacturing standpoint, blind fasteners are preferred ever access
doors.
Further study and development may indicate the need for amplification and/or modi-
fication of the above rules.
STRUCTURAL DESIGN -- TASK I
Chordwise Stiffened Wing Design -- Fasteners
The structural arrangement drawing in the chordwise stiffened wing design is pre-
sented in Figure 18-1. The arrangement of the substructure, fuel tanks and surface
panel Joints for the representative panels are indicated on the airplane planform.
The highly efficient convex beaded surface panel design is shown with discrete sub-
merged spar caps used to transmit the wing spanwise bending loads. Representative
spar cap and truss-web geometry are indicated for selected point design regions
identified on the wing planform. General features for this design are enumerated
below:
• Double-skin wing surfaces in which both the inner and outer skins contain
a series of chordwise-oriented stiffening beads.
• Numerous spanwise spars which are of truss design except where a spar
serves as a fuel tank wall or a fuel surge pressure spar. Where spar depth
or loading so dictates, the truss spar design may be replaced by a stiffened
web or other arrangement.
• At fuel tank wall and fuel baffle locations, the spars have welded corrugated
websand I-section caps.
• Relatively few chordwise ribs are used. These also are of the truss type
design except where the rib serves as a tank wall or baffle. In such appli-
cations, welded corrugated webs and I-section caps are used.
• Spars are spaced relatively close in the main wing box behind the maln
landing gear (_G) well.
18-9


'I
/-" W
/
!
/


i
/
\
@
o_,
i


• Large surface panel assemblies are used.
• The "fastener" Joining method is used throughout the entire wing in
accordance with the_mat_riX of:Table_:_$-2. As d_scussed in the Design Approach=
section, this indicates that major components are Joined together With fasten-
ers in order to permit conventional assembly of major components to obtain
the aircraft structure. Welding, weld bonding and other Joining methods are
used, where advantageous, in fabricating individual components such as spars,
surfaces and other subassemblies.
The arrangement of the structure is based on the results of the analytical studies
(Section 12, Structural Concepts Analysis) and is used to establish the mass esti-
mates reported in Section 15, Mass.
The chordwise-beaded surfaces used in the structure of Figure 18-1 are similar in
some respects to those used in the L-2000-7A and the YF-12/SR-71. However, the
latter two aircraft used the bead design noted as "corrugation" rather than the cir-
cular arc-convex configuration shown in Figure 18-1. The latter bead design has
been used because of its structural efficiency and the reduced eccentricity en-
countered at the terminations of the beads. It is recognized that the circular
arc-convex beaded design may result in an increased drag penalty as well as increased
danger of damage during aircraft maintenance, hail storms and from foreign object
damage (FOD). However, the analytical results of the chordwise stiffened panel
designs reported in Section 12, Structural Concepts Analysis, indicated the minimum
mass potential for the design shown. The design is directed towards alleviating
thermal stresses while still utilizing both skins in resisting shear. Also, heat
transfer to the fuel heat sink is reduced, relative to a single skin design, because
the fuel does not contact the outer skin in the areas covered by the beads in the
inner skin. The cavities enclosed by the beads are vented to ambient atmosphere by
means of a hole in the outer skin at each end of a cavity. With the beaded inner
and outer skins the surfaces do not participate in resisting wing bending and all
bending material is concentrated in the spar caps. This uncoupling of bending and
torsional material permits either the bending or torsional stiffness to be varied
independently of the other.
PRECEDING PAGE BLANK NOT F_
18-13

A major manufacturing joint, and a changein direction of the sparsj occur at BL 470._nis is the location of the outer rib for the outboard engine as well as the jointbetweenthe inner wing and the highly sweptouter wing and tip.
The "fastener" concept used for assemblymajor components_n the chordwisestiffenedwing structure meansthat fasteners are used for the surface/substructure attach-ments. Problemsarising in this area are muchmoresevere if flush surface/substructure attachr_ents are required.
Sourcesof attachmentproblems include those listed below:
• The thin outer skin thickness anticipated over much of the wing makes it
difficult to avoid the "feather edges" encountered if a countersink extends
through a sheet. Yt was strongly desired to avoid this condition even
though feather edges were accepted on the L-2000-7A and the YF-12/SR-71
aircraft.
• Ti, CRES and similar rivets are difficult to drive and require relatively
massive bucking bars and sizable access space. The submerged spar caps
shown in Section B-B and the "I" cap spar shown in Section C-C of Figure 18-1
illustrates the restricted access for installing surface attachments.
• Since individual spars are not of fail-safe design, the failure of a spar
results in sizable loads transmitted from the surface to adjacent spars and
require numerous attachments for load redistribution.
• Upset type fasteners, particularly with thin skin, can result in deformation
of the skin and damage or destruction of the bond between the inner and outer
skins.
For preliminary design, minimum exterior skin gauges were assumed to be 0.020 inch
for the lower surface and 0.015 inch for the upper surface. The minimum gauge of
the inner skin was 0.010. Shear type (shallow head) flush head fasteners were con-
sidered acceptable in the outer Skin.
Studies of access requirements for fastener installation yielded the results shown
in Figure 18-2. As shown, blind fasteners require the minimum space. The space
requirement for Hi-Tigue fasteners is based on the use of the special tool described
_8-14

1.3 MIN.- FOR RIVETS
1.0 MIN. - FOR HI-TIGUE
0,5 MIN. - BLIND FASTENERS
Figure 18-2. Installation Space Requirements for Various Fasteners
in Reference (3). Fastener studies also revealed an interesting new fastener, the
"Cherrybuck." This is a one-piece bimetal fastener which has a Commercially
Pure (CP) or ductile Ti tail on the end of a Ti-6AI-4V shank. This fastener, used
on the B-I and the F-5E, offers a high strength (95 ksi shear), lower weight than
2 or 3 piece fasteners, and a ductile Ti tail which upsets to 1.5 D without special
tools. Investigation also was made of the LS 9714 rivet, a 100-degree miniature
head solid rivet designed during the L-2000-7A program. The LS 9714 rivet was devel-
oped in two materials: A-286 CRES (95,000 psi min shear) and C.P. titanium
(65,000 psi min shear). Comparison shows that the Cherrybuck rivet (all Ti) provides
the same shear strength as the LS 9714 A-286 CRES rivet at a lower weight. These
limited investigations indicate that:
• Cherrybuck rivets appear useful where an upset flush rivet is acceptable and
where the 95 ksi shear strength is advantageous
• LS 9714 CP Ti rivets appear usable when an upset type of flush rivet is satis-
factory and the higher shear strength (and probable higher cost) of a Cherry-
buck rivet are not required.
As stated previously, concern is felt that upset type fasteners can result in defor-
mation of thin skin and damage or destruction of the bond between the inner and outer
skin. Suitable tests are recommended for resolving this question. Where this is
.-_ found to be a problem, Hi-lnk or Hi-Tigue fasteners are applicable. Hi-Tigue fas-
'" _eners are indicated where fatlgue consideratlons are signlfzcant
18-15

To avoid the feather edge problem in thin skin areas, several approaches have been
considered. The two most interesting possibilities are discussed below:
• In one approach, thickened strips would be incorporated _n the outer skin
sheet in the areas directly above spar (and rib) caps. These strips would
be welded in place as part of the process of welding sheets together to
obtain the large outer skin weldment required for the large surface panel
assemblies used. The thickness of these strips would be at least 0.O10 ins.
more than the depth of countersinks for flush fasteners. These strips would
be machined so that the increased thickness area at fasteners would fair back
into the basic skin thickness at a slope of 15/1 or more. This design would
result in more welding in the outer skin than would otherwise be required
and the thickened areas also would lead to a higher skin weight. Also, sur-
face smoothness may be degraded somewhat.
• In another approach, the outer skins would be chemically milled from sheets
whose initial thickness would be at least 0.010 ins. more than the depth of
countersinks for flush fasteners. The chem milling would reduce the skin
thickness as required in the non-fastened areas while maintaining the
thickened areas around fasteners. Machining would be required to smoothly
blend out the sharp edges obtained at the edges of chem milled areas. This
approach has some merit, but available data indicates that chem milling
etches welded areas about lO-percent faster than basic sheet. This is of
some concern since the outer skin is a large weldment. However, this prob-
lem might be overcome in various ways, one of which is to chem mill individual
skin segments before these segments are welded together to obtain the large
final external skin required.
In approaching the thin skin/feather edge problem, it appears desirable to consider
the steps outlined belong.
• Identify those areas where the degraded structural quality associated with
feather edges is permissible and accept the feather edge condition in those
areas.
• Where possible, investigate smaller and more numerous fasteners as a potential
method for avoiding the feather edge problem.
18-16
• Where warranted, the "chem milled skin" design outlined above appears
feasible and the most practical choice at the present.
Spanwise Stiffened Wing Design -- Fasteners
The structural arrangement drawing for the spanwise stiffened wing design is pre-
sented in Figure 18-3. The planform view of the airplane shows the arrangement of
substructure, fuel tanks and surface panel Joints.
General features of the spanwise stiffened structures in Figure 18-3 include those
listed below:
• Relatively widely spaced spars with closely spaced ribs.
• Spars and ribs are of truss design except where they serve as fuel tank
walls or fuel tank baffles.
• At fuel tank wall and fuel baffle locations, spars and ribs have welded
corrugated webs topped by 1-section caps mechanically attached to the
welded corrugated webs.
• Large surface panel assemblies are used.
• The "fastener" Joining method is used throughout the entire wing in accor-
dance with the matrix of Table 18-1. As discussed earlier, this means that
major components are Joined together with fasteners in order to permit con-
ventional assembly of major components of the aircraft structure. As with
all "fastener" designs, welding, weld bonding and other Joining methods are
used where advantageous in fabricating individual components such as spars
and other subassemblies.
The spanwise stiffened wing structures of Figure 18-3 are configured on the basis of
the factors noted below:
• Ribs are spaced relatively closely. As shown in the planview of Figure 18-3,
the spacing is approximately 20 inches. Major ribs include two per engine,
two per MLG strut and a rib at each side of the fuselage. As shown on the
figure, major ribs are extended fore and aft, in some cases, to facilitate
load distributions, assist in damage tolerance or serve as fuel baffles.
18-17


\
t \
i
\


R
w x
_ zeg _'
m.. i _z
O_ ',-4
,-t


B
EE
• A dry bay completely surrounds the MLG well so that no NLG support structure
attaches directly to structure serving as a fuel tank wall. This reduces
the possibility of damage to the fuel tanks in the event of a hard landing
or similar occurrence.
• Forward of FS 1705, the forward end of center section fuel, spars do not
extend through the fuselage and the wing is supported from the side of the
fuselage.
• The wing is built in segments which, except for the aft main box segment,
include all wing structure from one leading edge to the opposite leading
edge. The aft main wing box extends from the MIX; cutout to the rear beam
and from one fixed fin to the opposite fixed fin (a span of i00 ft.). This
manufacturing breakdown is developed from the structural arrangement and is
based on minimizing the number of segments while avoiding excessive size and
difficult assembly and handling of the various segments.
The sheet metal hat stiffened surface panel design resulting from the analytical
design study is shown. The surface assembly, which consists of the outer skin and
hat stiffeners, is attached to the rib assembly comprised of the rib chords and
diagonals fabricated as one wledment. See Section B-B of Figure 18-3.
With the hat-stiffened surface (closed section stiffeners), it is noted that heat
transfer from the slipstream to the fuel heat sink is reduced in value when compared
to the single skin-open section concepts, since more of the outside skin is in con-
tact with the fuel.
Weld bonding has been selected for the stringer/skin attachment after consideration
of several alternate methods. Surface panel sizes are shown on the planform view
of Figure 18-3. For forming and fabricating individual panels, a size limit of
15 by 35 feet has been used. This limit is discussed in Reference (3). Where a
Joining operation involves bonding only, the panel length limit has been extended
to 50 feet. This special length limit has been exploited wherever possible.
In the aft main wing box area the surface length extends from BL 62.41L to BL 470L
and from BL 62._IR to BL 470R. A splice of the hat stiffeners, is integrated into the
design (Section A-A of Figure 18-3) to accommodate a fuel rib at BL 296L and R.
_F_D_I_G PAGE BI_A_ NOT F _I_18-21
This surface configuration eliminates a chordwise Joint at BL 296L and R, however,
results in a "fastened" (rather than "fastened/bonded") surface splice at BL 62.41L
and R.
In fuel stowage areas, access is required to the interior of the tanks. For this
purpose, two access doors in the surface are provided for each individual tank or
isolated portion thereof. The design intent is to minimize the access doors in the
outer surface by exploiting the openings between diagonals in truss type ribs and
spars was emphasized. Access door cutouts in the surface result in more weight
penalty in the spanwise than chord_ise stiffened design since the surfaces contain
bending as well as shear material.
Additional provisions for fail-safe and damage tolerance were not required for the
spanwlse stiffened design as indicated in Section 13, Fatigue and Fail-Safe.
The "Fastener" concept used for assembling major components in the spanwise stiffened
wing structures of Figure 18-3 means that fasteners are used for the surface/sub-
structure attachments.
A major manufacturing Joint and change in direction of the spars and surface panels
occur at BL 470. This is the location of the outer rib for the outboard engine as
well as the Joint between the inner and outer wing.
Monocoque Wing Design - Fastener
The structural arrangement drawing of the monocoque wing design is presented in
Figure 18-4. The surface panels consist of aluminum brazed honeycomb core sandwich
panels with densified core for the "fastener" approach. The arrangement of the sub-
structure, fuel tanks and surface panel Joints is indicated on the wing planform.
18-22

z
E;


n
E
E
\
®
°°_O,P


The panel concept selection was based on the results of the analytical design of
both the honeycomb and truss core sandwich designs discussed in Section i, Structural
Design Concepts. These panel concept designs were selected after a comprehensive
review of numerous candidates and their applicability to a near-term arrow-wing con-
figuration supersonic transport. The types of surface panel studied include:
• Aluminum brazed honeycomb sandwich surfaces made by the "Aeronca" process.
• Adhesive bonded honeycomb sandwich surfaces.
• Welded honeycomb sandwich (STRESSKIN) surfaces.
• Trusscore sandwich surfaces, a design using a unidirectionally corrugated
core sheet between the sandwich face skins.
In addition to the above, both the Rohr Liquid Interface Diffusion (LID) and
Northrop Nor-Ti-Bond processes were considered and evaluated for the fabrication of
brazed sandwich surface panels. In the Nor-Ti-Bond process, copper is electroplated
on the edges of the honeycomb cell walls before the core is brazed to the face sheets.
The brazing step results in a diffusion brazed joint between the core and face sheets.
The Rohr LID process is similar except that several elements, rather than copper
alone, are electroplated on the edges of the honeycomb core cells. Both processes
provide good mechanical properties as well as operating temperature capabilities.
However, both have demanding tolerance requirements. For example, the core/face
sheet gap must not exceed 0.005 ins. In contrast, the "Aeronca" process aluminum
braze process can tolerate a core/face sheet gap up to 0.002 ins. Because of the
manufacturing difficulties foreseen in applying the LID and Nor-Ti-Bond processes
to the large wing surfaces for the near-term airplane, detail drawings were not made.
The waffle type of monocoque surface was not included for application to the large
wing surface panels under consideration because of the difficulties and costs fore-
seen in fabricating and forming such panels.
The surface panels selected for design application use the "Aeronca" aluminum
brazing process originally developed by Aeronca for the Boeing SST. In this process,
a thin aluminum foil sheet (3003 alloy) is placed between the core and face sheet, or
PRECEDING PAGE BLANK NOT F_U_
18-25

other surfaces to be Joined, and the brazing step conductedat a temperatureof12_0F. A detailed discussion of the Aeroncadevelopmentwork of this fabrica-
tion method is described in Reference 2.
The Aeronca process results im a thin coating of aluminum over the entire interior
surface of the sandwich. This includes the inner surfaces of the face sheets as
well as the walls of the honeycomb cells. As can be seen, this indicates that a
significant amount of parasitic weight of unnecessary aluminum braze alloy is incor-
porated in the final brazed sandwich. This aluminum costing also results in a
relatively high heat transfer to the fuel and substructure. When non-perforated
core is used, each cell is hermetically sealed after brazing. This feature prevents
fuel or other material from entering adjacent cells if the fuel or other liquid
should somehow enter the cell(s) in a particular area.
The Aeronca aluminum braze process, which is fully discussed in Reference (4), has
a number of advantageous features relative to design. These features include:
• The core depth can be varied, or tapered, within a given brazed panel.
• Separate doublers (or fail safe straps) can be incorporated within a brazed
panel.
• An appreciable gap can be tolerated between the core and face sheets. Suc-
cessful brazing has been accomplished with localized gaps up to 0.020 inches,
which indicates a realistic process for application to large panels (such as
wing surfaces).
• The core density and cell size can be varied within a brazed panel if
required.
• Hermetic sealing of each cell, obtained with non-perforated core, means
that fuel (or other liquid) which penetrates one cell is not automatically
free to enter all other cells in the sandwich.
• No confining restraints apply relative to the thicknesses of the face sheets,
the core and inserts. The thickness variation among these elements can be
very large and is not restricted as is the case when, for example, the core
is spotwelded to the face sheet.
18-26

• Considerable development effort has been expended on this type of structure
and an appreciable amount of data is available. Boeing has received con-
siderable DOT funding for development and tests of this structural concept.
The Aeronca process does, however, have a few disadvantages. Some examples include:
• A fairly significant weight penalty is incurred by the fact that 3003 alumi-
num braze alloy coats the entire interior of the sandwich. "Stop-off" and
other techniques to alleviate this situation are discussed in Reference (4).
• The aluminum coating on the interior surfaces of the sandwich results in
relatively high heat transfer *o the fuel and substructure.
• The fact that the braze alloy melts and flows causes difficulties in brazing
Joints which have a significant slope (Zabout 20-degrees) relative to the
basic plane of the panel. Aeronca has claimed development of proprietary
techniques for alleviating this condition.
• Repair techniques need further development. Some work has been done using
bonding techniques which appear promising. Welded repairs are not feasible
in close proximity to aluminum brazed Joints.
• Fabrication of large panels, postulated as feasible for this study, will
require careful control of brazing temperature, dimensional changes and
other factors.
For this study, a maximum brazed panel size of 68 inches by 40 feet has been postu-
lated. This size limit, based on discussions with Aeronca personnel, contrasts
with a size of approximately 3 feet x 25 feet for the largest panel brazed to date.
At the beginning of this study, no data was available to confirm the fabrieabi!ity
of thick panels with heavy skins. However, data from Reference 2 indicates the
feasibility of sandwich thicknesses to 1.60 inches and face sheets to 0.156 inches.
The general features of the monoc0que design are enumerated below:
• Numerous spanwise spars which are of truss design except where a spar
serves as a fuel tank wall or fuel surge pressure spar.
18-27

l
• At fuel tank wall locations, spars have welded circular arc webs.
• Relatively few chordwise ribs are used. These also are of the truss type
except where the rib serves as a tank wall. In such applications, welded
corrugated web ribs are used.
• The "fastener" Joining method is used throughout the wing in accordance with
the matrix of Table 18-2. As discussed in the Design Approach section, this
indicates that major components are Joined together with fasteners in order
to permit conventional assembly of major components. Welding and other
Joining methods are used, where advantageous, in fabricating individual com-
ponents such as spars and other subassemblies.
• Surface panels are long and narrow_ consistent with the postulated size limit
of 68 inches by 40 feet. With the spar spacing used, surface splices are located
per Figure 18-4.
Two types of wing surface joints are utilized in the inner wing. A "balanced"
(double shear) joint is proposed for heavily loaded areas (Section C-C of Fig-
ure 18-4) and where advantageous in structural mass. Section C-C illustrates such
a joint at a flush surface splice. In general, all flush fasteners are envisioned
as having shallow ("shear") heads to permit minimum countersink depths. The splice
plate thickness is then made at least 0.010 inches greater than the fastener head
height to avoid "feather edges" and the resulting degradation in structural quality.
Note that Section C-C specifies densified (1/8 inch cell) core at the fasteners. In
tests conducted by Aeronca, the 1/8 inch cell proved adequate in strength to permit
full torquing of a 1/4 inch diameter fastener (to 175 in.-ib, torque) as well as
the elimination of separate panel closure. A locally thickened pad machined
integral with the skin is shown for load transfer from the face sheet to the splice
plate. This approach requires the use of a suitably thick sheet or plate. An
alternate approach is welding thicker strips into the face sheet at panel edges
and other locations requireing additional thickness.
18-28
In the wing apex and other lightly-loaded areas, the "single-edge" panel splice is
used with a zee-closure at the edge of the panel.
As previously noted, core cell size can be varied within a brazed panel. However,
to date this has been done by poke welding (resistance welding) individual cell
walls together at the interface joint between the different cell sizes. This poke
welding, done with vary small electrodes, is laborious and expensive. Development
is needed for a procedure involving a brazed Joint at the interface joint between
the two different core cell size areas, Another potential solution is the use of
alternate core cell shapes. This is an attempt to reduce the core cell joint areas
and weights and to lower the heat transfer rate through a brazed panel.
The aluminum brazed panel design is adaptable to the incorporation of fail-safe
straps. As shown a certain proportion of the face sheet material is shown
segregated and incorporated in failsafe straps brazed to the face sheet during panel
fabrication. It is assumed that these brazed straps will be effective as crack-
stoppers. However, tests are required to verify that these integrally brazed
straps will be effective crack stoppers.
The substructure in the inboard wing is similar to that used in the chordwise and
spanwise stiffened W_ng designs discussed previously. This indicates that:
i Spars and ribs are of welded truss design except where used as tank walls
or fuel baffles. This approach is used to provide good internal access for
manufacturing and structural inspection purposes.
• At tank walls, spars and ribs have welded circular arc webs. The web cap
directly contacts the surface sandwich as shown in Section A-A of Ffg-
ure 18-h. At rib/spar Joints, a splice plate is used between the web cap
and the surface for load transfer. As previously noted, Sciaky has verified
the practicality of welding the caps to the circular arc webs at angles as
much as 15-degrees from normal to the web.
Hi-Lok or Hi-Tigue fasteners are envisioned for surface/substructure attachments
in tank areas.
18-29

Feather edgesat countersinks, and the associated degradedstructural quality_are avoided whereverundesirable by local thickening of the outer skin. Thicknessvariation in the outer skins is envisioned as obtained by chemical milling/machining.
The upper and lower surfaces of the outer wing and wing tip are composed of separate
brazed panels which are fastened to substructure. All or some panels of the upper
surface are attached with screws and are removable for inspection and maintenance
purposes.
The above approach is based on the desire to avoid numerous access door cutouts in
the surfaces and the need for blind fasteners.
Monocoque Wing Design - Welded
The structural arrangement drawing of the monocoque wing design - "welded" approach
is shown on Figure 18-5. The surface panels consist of aluminum brazed honeycomb
cone sandwich panels with tubular inserts to facilitate welding. The fuel and sub-
structrue arrangements are presented on the wing p!anform along with the surface
panel joints of the representative panels.
The welded structure concept described in this section has many similarities to the
fastened structure covered previously. This discussion is primarily intended to
define differences in the structural design arising from the use of the welding
concept.
18-3o


B_
\
- _:_
i ....... _,_'_ __
1 __ o _
o
I
,,-4
t


The design objective in this investigation was development of a completely, or
nearly completely, welded structure in an attempt to obtain such anticipated
advantages as:
• The elimination of numerous fasteners and the minimization of the number
of Joints.
• A much simpler problem in sealing fuel tanks. In addition to easier tank
sealing, the welding concept permits the avoidance of a significant weight
increment associated with tank sealing compounds.
Figure 18-5 depicts the welded structure design developed for the area inboard of
BL 470. It employs a unique "module" concept which is illustrated in the sketch
of Figure 18-6. As shown therein, a module consists of two adjacent spars, rib
segments and an upper and lower surface. The surface panels, twice as wide as
the spar spacing, are Joined to the adjacent module by spanwise EB _elds assembling
modules into wing segments. The location of segment Joints is shown in Figure
18-5.
Figure 18-6. Typical Module for Welded Sandwich Wing Structure
18-33

Designguidelines used in developing the welded structure conceptinclude:
• All welding f,s designed for automation wherever possible.
• EB welding is used wherever feasible, and not for surface Joints alone,
because of good mechanical properties, a minimum heat-affected zone andI
a high welding speed.
• All welds are dressed on all surfaces unless impossible.
• Wherever possible, welds are inspectable visually.
• The maximum possible joining of parts is accomplished during the pane1
brazing process. This is an attempt to minimize assembly labor.
In line with the latter point, spar caps, rib caps, panel closures and other elements
are incorporated within the panel brazement. This is illustrated in the sectional
views shown in Figure 18-5. This approach provides increased structural depth for
spars and ribs. Some panel inserts are extended to the external surface so to
provide the capability of extended visual inspection.
In fabrication, the spar and rib caps and panel edge members in a given pahel are
first EB welded together in a grid. The honeycomb core is poke welded to the inserts
and the sandwich skins are then brazed to the insert grid and core to obtain a com-
pleted panel brazement. The inserts are shaped to facilitate poke welding to the
core. Note that the brazing, performed at approximately 1240 F, stress relieves the
we3ded grid assembly. Since very close tolerances are required for the EB welded
Joints between modules, the inserts at the module interfaces are made heavier to
allow machining on assembly. This is shown in Section C-C of Figure 18-5.
Spars and ribs are of truss design, as with other structural designs in this report,
except where they serve as tank walls or fuel baffles. A tank wall spar is shown
in Section A-A on Figure 18-5.
Surface panel Joints are the balanced, or double edge, type for good structural
efficiency and are located midway between spars to allow access for welding equip-
ment and to permit dressing of welds after the Joining of modules. Surface panel
size is assumed limited to 68 inches in width and 40 feet in length.
18-34

m
Welded joints must be configured and located carefully to ensure that the welding
does not damage the brazed Joints. The weld/braze clearances shown are preliminary
estimates and would require verification tests before finalization.
In the cabin floor area, seat tracks are incorporated in the brazed panels to pro-
vide increased structural depth and to facilitate a longer span between supports.
The planview of Figure 18-5 shows that both the upper and lower surfaces of the
outer wing and wing tip are composed of separate brazed panels. All or some panels
of the upper surface are attached with screws and are removable for inspection
and maintenance purposes. The major difference from the "Fastened" approach of
Figure 18-4 is that the fasteners attaching the lower spar caps to the lower
surface have been eliminated in the welded structures of Figure 18-5. This large
reduction in the number of fasteners through the lower surface in the welded
structure design has been accomplished by incorporating the lower spar caps in the
lower surface.
Composite Reinforced Wing Design -- Fasteners
The structural arrangement of the composite reinforced wing design is presented in
Figure 18-7. The basic arrangement of the structure and design features are identical
to the chordwise stiffened wing design of Figure 18-1 and discussed in detail in the
chordwise stiffened wing design section.
The structurally efficient circular arc-convex beaded surface panels of titanium
alloy (Ti-6AI-hV annealed) are used. The titanium alloy spar caps are reinforced
with boron/poyimime (B/PI) as shown in Section E-E of Figure 18-7. The reinforce-
ment strips are continuous from leading edge to leading edge forward of F.S 2368.
Aft of F.S. 2368 the reinforcing is continuous from BL 470L to BL 470R.
Skin-Stringer and Frame Fuselage Design -- Fasteners
The fuselage structural arrangement shown with the various wing concept designs in
Figures 18-1, 18-3, 18-4, 18-5 and 18-7 is a skin-stringer and frame construction.
The closed hat stiffener configuration is used in the major portion of the fuselage
with the zee stiffener used in the more lightly loaded but pressure critical fore-
body. The frames are zee-sections with continuous shear clips as indicated on the
18-35

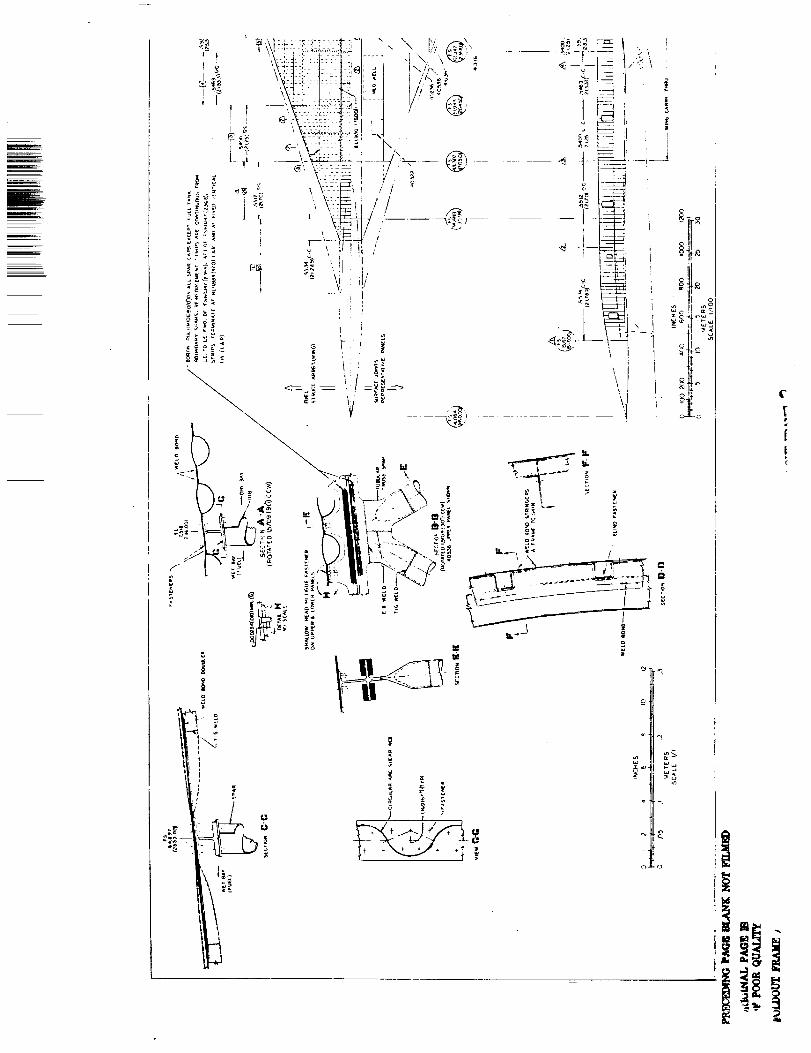
!i
G _-"
-_ 1 _'_q
2.
) 7 '" / '
-'i
E
[ii


r- --!J
i
J
m
o i
t--
"I
¢
¢
I


figures. The analytical studies reported in Section 12, Structural Concepis Analysis,
resulted in a frmv,e spacing of apprcximately 20 inches to yield minimum mass. Thus,
for th_ chordwise stiffened wing design (including the composite reinforced spar caps
design), the frames are located coincident with the spars. For the spanwise stiffened
and m_nccoque wing designs, frames are located at various multiples of the spar spacing
and are attached thereto; intermediate frames do not attach _irectly to the spars.
Weld bonding has been selected for the stringer/skin and frame/skin attachments. In
this process, the basic spotweld attachment is made first and is followed by the
infiltration of adhesive around the spotwelds. This enhances the fatigue properties
of the Joint in relation to a spotwelded Joint and requires that individual fuselage
panels be processed in curing ovens after being spotwelded together. Weld brazing is
a backup for weld bonding if the weld bonding should prove unacceptable or impractical.
Since weld bonding is basically a spotwelding process, the panel size limits were
established as a maximum of 15 feet in width. This width has been exploited in
achieving a major advantage in that only one longitudinal skin panel splice, at the
top centerline, is used in the cabin in the wing area. In the L-2000-TA design,
spotwelding alone was used for skin/stringer and frame/stringer attachments in con-
Junction with skin panel splices at the 3 o'clock and 9 o'clock positions. At the
top centerline and other panel splices, an external splice strip is used to provide
a double shear Joint with enhanced characteristics in fatigue. The top centerline
splice in the cabin area is located at a plane of symmetry and minimizes the changes
in skin thickness taking place at the splice since it means that thickness changes
occur in the fore and aft direction only.
The fuselage segments are very close to 50 feet in length. This value is based on
transportation considerations as well as the assumption of 50 feet long ovens for
curing the adhesive used in the weld bonding and rivet bonding utilized extensively
in fuselage fabrications. Furthermore, the fuselage is not broken at each wing seg-
ment. Instead, the fuselage is broken into approximately 50 foot long segments as
discussed above. An important factor in the fuselage design is the fact that most,
or all, of the fuselage is designed to permit subcontracting.
PRECEDING PAGE BU NK NOT
18-39
Sandwich Shell Design --Welded
Various approaches for minimum mass fuselage designs were investigated. These studies
were exploratory in nature but did identify the applicability of the concepts to a
near-term start-of-design supersonic cruise aircraft.
Figure 18-8 prasents one of the exploratory design studies made of sandwich fuse-
lage structure. This particular study was based on the use of an aluminum brazed
honeycomb sandwich shell ("Aeronca process") in conjunction with the welding Joining
method. It was recognized that the brazed sandwich results in a significant amount
of parlsitic weight of aluminum braze alloy, and thus increasing the difficulty
of achieving a weight saving. However, the brazing process was assumed in this par-
tlcular study because it offered the potential for structural integrity and
reasonable adaptability to the welding Joining method.
Two approaches are shown in Figure 18-8. The right side of the figure shows a
design using circumferential panels which are continuous between floor/shell inter-
sections. The design attempts to incorporate as many elements as possible within
panel brazements to reduce assembly labor and Joints. Panel brazements are EB welded
together between frames and contain crack stoppers brazed to both skins. As shown,
various frame designs and frame/shell Joint designs were considered.
The left side of Figure 18-8 illustrates an approach using longitudinal panel braze-
ments welded together with fore and aft EB welds. A panel width of 20 inches was
assumed to minimize the contour deviation from a flat plane within each panel to
reduce the problem with the braze alloy's tendency to run to the low point of the
panel. Two variations of this design are shown. In one, circumferential panel
Joints are in a common fuselage station plane. In the other, circumferential panel
Joints are offset and not in a common fuselage station plane. This complicates the
welding procedure but avoids a continuous welded Joint in a single plane.
Although the studies showed the need for further development in several areas, the
longitudinal panel design appears to be feasible and have some attractive features.
Welded Joints must be located carefully to avoid heat damage to the panels. The
latter problem would be even more critical with an adhesive bonded/welded construc-
tion. An adhesive bonded circumferential panel design could, however, use
18-_o

/
.,/, _d_:! _- _
i - , _il
_1 _ , .
:___.i__
!7"t[
E
|
ii
!
II_ I!1,
I [_
i 1_ I,
- i 1
_ i! _J i
t_ _i [ _7[
rr'q K..... ---:-_ _ ' i: i
, ilII .;,$ ,_ ,
": !Pi ....... _'_
i _,._
,4
¢


m
ii
i!
w
! \ _i <:
. i%
i
! "\i,_
' ._i
!
'i
it _!'
i
i !- !
|
ti
I
ii -
_<! - !
:e
15
r
r-
.... "1! !! _i:0- ._---.%1I I it _
" "_F_ I ,'
• i---I
\ i____] __._____,
i',-t_J
li.!-o ll.co
i:!i __i_
ft
,,4
_ ?

k_
i
considerably larger panels than those shown in Figure 18-8 for the trazed design.
The preliminary studies of sandwich fuselage structure indicated considerable risk
in conjunction with a limited weight saving potential relative to semi-monocoque
design.
Design Problem Areas
A wide variety of structural designs were developed for evaluation and potential
application in the wing and fuselage of the arrow-wing configuration supersonic cru_e
aircraft. Further design studies were conducted to evaluate the three wing structural
arrangement and variations thereof. Candidate fuselage arrangements were also evalu-
ated. These studies together with related design and manufacturing data, the manu-
facturing plan and the numerous drawings were developed to represent the major output
of the design task.
One of the goals of this study is the identification cf problem areas. Problem
areas associated with design are briefly noted below for the various types of
structure:
• Chordwise Stiffened
a. With beaded outer skin, especially convex beads, thermal gradients and
thermal cycling may cause disbonding at outer/inner skin weld bonded
attachments. Loss of the bond would degrade fatigue and sealing
properties. Therefore, verification tests are recommended.
b. Convex beads in the outer skin, with thin gauges, cause concern relative
to damage from hail, maintenance operations, FOD and other causes.
c. Venting of inner/outer skin cavities at beads may present problems, par-
ticularly on the upper surface. One plan is to drill a 0.125 inch
diameter hole in the outer skin at each end of a bead cavity. This
might permit entry and accumulation of dirt and liquids over a long
period and may require periodic cleaning of these cavities.
__R_ PAGE BLANK NOT
18-43

d. Some concern is felt that the installation of fasteners-especially upset
types-may cause disbonding even though a preliminary test indicates this
may not be a problem.
e. Fretting of fastened Joints is a concern.
f. The drag/fuel penalty associated with external beads in the outer skin
has not been fully assessed.
g. When local thickening of the outer skin is used to avoid feather edges
at countersinks in the outer skin, penalties in flushness/smoothness
may result along with a significant cost increase.
h. Blind fasteners may be indicated in some areas as a result of a desire to
minimize access doors.
i. The shape and size of submerged spar caps make it difficult to install
surface/spar fasteners and constrain the type of fasteners.
J. Not all surfaces of all welds can be dressed and visually inspected.
Ah example is a truss diagonal-to-end-fitting weld.
k. It is not feasible to stress relieve all weldments.
1. Fail-safe design of spar caps is difficult with this concept because
of the monolithic nature and the large loads concentrated in spar caps.
However, preliminary analyses indicate that the problem is soluble
(without excessive mass penalty or complex measures) by exploiting load
redistribution principles. Also_ there mmy be a potential application for
laminated structure for fail-safe metallic design.
• Spanwise Stiffened -- See items d, e, g, h, J, k under the "Chordwise
Stiffened" heading:
a. As noted in (a) of the Chordwise Stiffened discussion above, thermal
gradients and thermal cycling may cause disbonding at the outer/inner
skin weld bonded attachments. If suitable tests show weld bonding is
not acceptable, weld brazing is a possible backup approach.
18-44

Aluminum. Brazed Honeycomb Sandwich (Monocoque)
a. This type of surface includes a significant parasitic weight of
aluminum braze alloy. This also increases heat conduction through the
sandwich. Develcpment of ,stop-off" or other fabrication techniques
to minimize these problems is desirable.
b. Achievement of reliable faying surface brazed Joints may present
problems, particularly if the width of the brazed Joint is significant.
c. Data are needed relative to the effectiveness of welded Joints in crack-
arresting applications.
d. The prevention of excessive creep at brazed Joints under long-term/high
temperature conditions results in allowables much lower than the static
strength.
DETAILED DESIGN -- TASK II
Design Objectives
The detailed design studies were directed towards the final definition of the
structural design for the wing and fuselage of the Mach 2.7 arrow-wing supersonic
cruise aircraft. Other goals of this effort are the identification of:
• Problems not resolved during the study
• Components warranting further evaluation by fabrication and test.
Scope of Design Studies
The Task I results reported in Section 17, Concept Evaluation and Selection identified
the least mass and cost wing structure design to be the composite reinforced
approach. The evaluation data also indicated the importance of minimum mass
designs. Thus, a hybrid wing design was adopted for the detailed design studies
effort. The hybrid design was developed by making full use Of the minimum mass
arrangement defined for the forward wing box, the aft wing box and the wing tip
structure. The resulting minimum mass structural arrangement uses sandwich
18-_5

surfaces in the wing tip box and chordwise-stiffened surfaces with composite re-
inforced spar caps in the remainder of the wing box. The preliminary design
drawings presented herein define the salient features listed below as applicable
to both types of wing surface construction and the Joint area between them:
• The overall structural arrangement for both the wing box and fuselage
• Surface and spar construction, as well as damage tolerance features, in
the chordwise and monocoque and transition areas
• Fuselage structure design details for the skin/stringer/frame structural
arrangement
• Composite reinforcement applications in the wing box and fuselage
• Manufacturing breakdown for the wing box and fuselage
• Fuel sealing provisions at tank wall spars and ribs and at intersections
of composite reinforced spar caps with tank wall ribs
Wing Structure Design
The structural arrangement, manufacturing breakdown and the locations of represen-
tative panels and surface panel Joints are presented in Figure 18-9 for the final
design airplane. A hybrid structure consisting of the least mass chordwise
stiffened - composite reinforced wing design and the monocoque wing design adopted
for the final design are defined below:
Wing Structure -- Inboard of BL 470L/R -- The design details for a specific chordwise-
stiffened surface panel and substructure are shown at the right of Figure 18-10.
With this beaded skin design, wing bending material is concentrated in the spar caps
and the surfaces primarily transmit the chordwise and shear inplane loads. The
uncoupling of bending and torsional material permits either the bending or torsional
stiffness to be varied independently of the other. Also, this surface design alle-
viates thermal stresses and reduces heat transfer to the fuel, relative to a flat
skin, since only a portion of the fuel is in direct contact with the wing external
skin.
18-46

I
z
o _
o _
d
¢
'°ai


/m
er
i


Weld bcnding is the basic choice for Joining the inner and outer skins of the
surface assembly. Surface panel size has been held to 15 feet by 35 feet. The
length limi_ _s based on tooling considerations for hot vacuum forming of the skins
while the width limit is based on the postulated Size of spotwelding equipment.
Concern over potentiai damage from hail, FOD and maintenance operations has resulted
in establishment of the following minimum gages:
• 0.020 in. for exterior skins on the wing lower surface
• 0.015 ins. for exterior skins on the wing upper surface
• 0.010 in. for inner skins of chordwise or biaxially stiffened surfaces
In locating wing spars in the chordwise-stiffened wing area, a minimum spacing
of 2] inches has been maintained between constraints such as fuel tank boundaries.
This spacing, at or slightly above the optimum determined in Task I, is based on
providing a minimum of 19 inches clear passage between spars. This passage width,
with sufficient depth, allows internal movement of personnel for installing surface
attachment fasteners and performing inspection and maintenance operations. This
spacing approach has been taken to avoid blind fasteners and minimize access doors.
The relatively thin external skin in the weld bonded surfaces, in conjunction with
flush fasteners, result in feather edges at countersinks in some areas. Where
this is unacceptable, thickened pads are incorporated in the skin. Section I-I of
Figure 18-10 depicts an example of such a spar/surface attachment. As shown, dif-
fusion bonding is specified as an alternate method for Joining the inner and outer
skins. Low pressure diffusion bonding Is a very attractive process which, when
adequately developed, would avoid or minimize the need for thickened pads in the
outer skin and would thereby permit reductions In mass and surface roughness. If
attachment clips are included in such a diffusion bonded surface assembly, the
assembly could be fastened to a welded truss spar as sketched in Figure 18-11. By
reducing fasteners through the surface, this approach would facilitate fuel sealing
also.
18-51

CLIP
DIFFUSION BOND
FASTENERS
SPAR CAP (COMPOSITE REINFORCED)
Figure 18-11. Attachment of Truss Spar to Low PressureDiffusion Bonded Surface
Wing rib spacing is a nominal 60 inches but is modified as required to suit design
constraints. In the chordwise-stiffened and transition areas, welded truss spars
are used except where a spar serves as a fuel tank wall. At such locations, spars
have welded circular arc webs _Ith stiffened "I" caps. To facilitate fuel sealing,
no surface beads extend across tank boundaries. Inner wing spars in the aft wing
box are fabricated initially as continuous subassemblies between BL 470L and R. At
the latter locations, as shown in Figure 18-12 spars are subsequently welded together
to form continuous spars from one vertical fin to the opposite. An 85-foot long
vacuum chamber has been postulated for electron beam welding of spar subassemblies.
Whenever possible, all welds are designed for automation as well as stress relieving,
dressing on all surfaces and visual inspection after welding.
Effective use is made of composite reinforcement with the major application involving
unidirectional reinforcement of spar caps. At all welded truss spars, the composite
reinforcement is continuous between BL 470L and R. Figure 18-12 details the outboard
termination of the spar cap reinforcements. The continuity of these reinforcements
is very desirable even though they penetrate fuel tank wall ribs. The design devel-
oped for fuel sealing at intersections of composite reinforced welded truss spars with
18-52

_,___ i_, !,_ :.-:,.]
J
/I
_v
i
>.
t
o
t


IT
II-
I


t
I


/
I
I
_L
-i
__ -I-
o
@
t"
I


tank wall ribs is shown at the left of Figure 18-13. Machined aluminum fittings,
which are not attached through the composite, fit tightly around the reinforced
spar _aps to provide both fuel sealing and spar cap support. The right side of
Figure 18-13 shows the intersection of a composite reinforced truss spar with BL h06
tank wall rib aft of the area where fuel sealing is required. At tank wall spars,
as shown in Figure 18-10, the composite reinforcement consists of separate reinforce-
ment strips between adjacent tank wall ribs. This interruption is used so that a
special metal fitting, made an integral part of the spar cap, can be designed to
provide an efficient structural joint between tank wall ribs and tank wall spars
while also permitting a clean tank corner amenable to fuel sealing.
Boron/polyimide (B/PI) is specified as the basic composite material for spar cap
reinforcement because of its lower cost and structural efficiency. The multiple
element form of the B/PI spar cap reinforcement results in damage tolerance
capability. Boron/aluminum (B/A1) diffusion bonded to spar caps is an alternate
approach and one which has been used by Ameron, An additional alternate is the use
of Borsic/aluminum reinforcements'j which are aluminum brazed to _he caps. In another
extensive application, composite reinforcement is bonded to both sides of the welded
diagonal-to-cap Joints in all welded truss spars to serve as a crack stopper. This
is depicted in View G-G of Figure 18-10 and Figure 18-12.
tentative plan for venting the closed cavities at inner/outer skin beads is the
use of a small diameter hole in the outer skin at each end of a bead cavity. For
the upper surface in particular, this requires further review since this might per-
mit entry and accumulation of dirt and liquids over a period of time.
Problem areas identified for the wing structural design are discussed in a later
section.
Wing Structure -- Outboard of BL 470L/R -- Design details for the monocoque surfaces
and the substructure in the wing tip box are defined at the left of Figure 18-9.
The sandwich surfaces are brazed together using 3003 aluminum alloy as the brazing
material (the "Aeronca" process). Outboard of BL 470, welded circular-arc spars
and ribs are used since the minimum or zero need for web penetrations allows the
realization of their inherent light weight and simplicity. Composite reinforcement
is not used in the brazed surfaces or the welded circular arc spars and ribs.
_CEDn_G PAG_18-55 BLANK NOT FIL_D


l i
ii -


I
I
!
o
_r


A size limit of 68 inches by I_0 feet f_r brazed surfaces was postulated as a guide- r
after consultation with Aeronca. The actual panel configurations defined in Fig-
ure 18-9 approximate this size and are based on the design philosophy that all or
some panels of the upper surface are attached with screws and are removable for
inspection and maintenance purposes.
The flexibility of the aluminum braze process is exploited by incorporating crack
stoppers and panel edge doublers in the surface panel brazements. Also, the
capability of tapering the panel thickness is utilized in the joint between the
chordwise and monocoque surface areas. In the joint area, as shown in Figure 18-12,
the outboard sandwich surfaces are extended inboard across BL 470 so that spanwise
components of the outboard surface loads due to wing bending loads are transferred
directly to the chordwise stiffened structure at the BL 406 rib.
Spanwise hat section stiffeners are alllminum brazed to the tapered wing surface
panels in the joint area to provide the needed surface stiffening. Surface panel
splice plates are sufficiently thick to avoid feather edges at countersunk fasteners.
Fuselage Structure Design
The fuselage structural arrangement and design details of a specific fuselage area
for both all titanium and composite reinforced metal structure are shown in
Figure 18-9. As shown, both designs include machined extrusion stringers, crack
stoppers between frames and floating zee frames with shear clips. Closed hat
section extruded stringers which provide structural efficiency, are machined
to provide for crack stoppers and to vary stringer thickness. Extruded stringers
also are well suited to effective installation of composite reinforcement. The
floating zee frames with shear clips are considered preferable, from a fatigue
standpoint, to full depth frames having notches for stringers. Also, zee frames
avoid the offset shear center associated with channel section frames.
Weld bonding is used for attaching frames, stringers and crack stoppers to the skin
because of economy, minimum mass, good fatigue characteristics and the avoidance
of sealing problems. Staisfactory weld bonding of three thicknesses, as encountered
at some locations, may require development. Weld brazing is a possible backup
to weld bonding. Where fasteners are used at shear clips and frame/stringer
_RECEDING PAGE BLANK NOT F_ 18-59

attachments, fastener bonding is utilized in lieu of fasteners alone to obtain
enhanced fatigue properties. The size of fuselage skin panel assemblies has been
limited to 15 ft by 50 ft; the former is based on the postulated size of spot-
welding equipment, the latter on the postulated length of the adhesive curing ovens.
Longitudinal skin panel splices are located only at the top and bottom centerlines
of the fuselage and at the floor/shell intersections fore and aft of the wing carry-
through area. These longitudinal splices utilize external and internal splice
plates in conjunction with fastener bonding to achieve a double shear splice having
damage tolerance capabilities and good fatigue properties. Suitable combinations
of fastener size and external splice plate thickness are utilized to avoid feather
edges at countersinks for flush fasteners. At circumferential panel splices, and
other locations as required, feather edges are avoided by incorporating thickened
pads in the external skin in a manner similar to that for wing skins. Chemical
milling is used to vary fuselage skin thickness in accordance with load requirements.
Potential Problems Not Resolved During Study
Design and Manufacture
Preliminary design studies of a wide variety of structural design concepts were
made to assess the relative merits of various concepts and materials suitable for
an advanced supersonic cruise aircraft (Mach 2.7). Construction details were pro-
vided for wing and fuselage primary structure to enable mass and cost estimates to
be made. In the process of preparation of the preliminary engineering drawings
potential problems were uncovered and resolved (on the drawing) by applying good
engineering Judgement, related subscale experimental work and decisions made in
consultation with Structures, Advanced Design, Materials and Producibility
specialists.
The critical problems in the fabrication technology were Joining, forming, sealing
and related equipment requirements. These disciplines were further affected by the
materials constraints. Some industry research and development programs have been
initiated in these technologies, however, specific application to a supersonic cruise
aircraft (Mach 2.7) with an arrow-wlng design configuration presents many new prob-
¢
18-60

m
lems to be resolved. The size effect of hardware components, for example, presents
some of the critical fabrication problems.
A sum_<ary of the potential problem areas for design and manufacture of wing and
fuselage primary structure are identified in Tables 18-3 through 18-7. These
problem areas require further detailed study to develop the fabrication processes,
tooling methods, and definition of the facilities to verify the manufacturing capa-
bility to produce hardware components that meet the engineering requirements.
TABLE 18-3. POTENTIAL PROBLEMS NOT RESOLVED - WING
SURFACE PANEL CONCEPT - CONVEX BEADED
Wing Surface Panel Concept - Convex Beaded
• Welding of thin gage sheet to fabricate large panels (15 ft. x 35 ft.)
• Vacuum forming skin panels to final compound contour
• Continuous progressive rolling of inner skins
e Assembly of skin panels
o Weld bonding
o Weld brazing
o Isothermal brazing
o Diffusion bonding (low pressure)
• Fastening minimum gage skin panels to substructure
o Disbonding at fasteners through weld bonded surfaces
o Rivet types and installation clearance requirements
• Disbonding resulting from thermal gradients and cycling
• Venting of beaded skins
• Fail-safe characteristics and fatigue quality
18-61

TABLE 18-4. POTENTIAL PROBLEMS NOT RESOLVED DURING STUDY - WING
SPAR CONCEPT - COMPOSITE REINFORCED TITANIUM ALLOY CAPS
Wing Spar Concept - Composite Reinforced Titanium Alloy Caps
• Boron/polyimide reinforcement
o Autoclave and heat expanding rubber oven curing methods
o Tooling methods
o Process procedures
o NDT methods
• Borsic/aluminum reinforcement
o Aluminum brazing methods
• Boron/aluminum reinforcement
o Diffusion bonding methods
• Boron/aluminum truss tubes
o Diffusion bonding methods
o Brazing methods
• Fail-safe characteristics
TABLE 18-5. POTENTIAL PROBLEMS NOT RESOLVED DURING STUDY - WING
SURFACE PANEL CONCEPT - HONEYCOMB SANDWICH
Wing Surface Panel Concept - Honeycomb Sandwich
• Aluminum brazing large panels to compound contour
• Brazing doublers and fail-safe straps
• Core stop-off material and processes to prevent vertical
cell wall braze flow during brazing cycle
• Braze panel structural repair methods
o Potting compounds (organic plus ceramic materials) '
o Mechanical fastened patch plates
o Tooling/equipment requirements
o NDT techniques
• Fail-safe characteristics
J
18-62
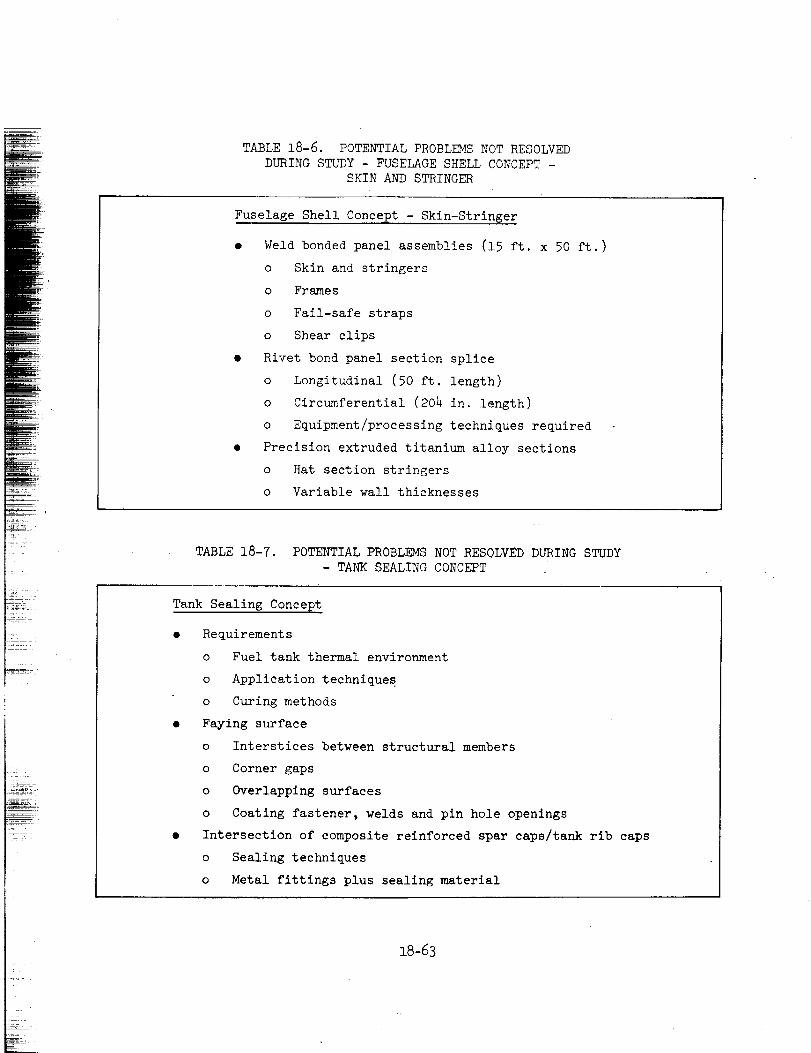
TABLE18-6. POTENTIALPROBLEMSNOTRESOLVEDDURINGSTUDY- FUSELAGESHELLCONCEPT -
SKIN AND STRINGER
Fuselage Shell Concept - Skin-Stringer
• Weld bonded panel assemblies (15 ft. x 50 ft.)
o Skin and stringers
o Frames
o Fail-safe straps
o Shear clips
Rivet bond panel section splice
o Longitudinal (50 ft. length)
o Circumferential (204 in. length)
o Equipment/processing techniques required
Precision extruded titanium alloy sections
o Hat section stringers
o Variable wall thicknesses
TABLE 18-7. POTENTIAL PROBLEMS NOT RESOLVED DURING STUDY
- TANK SEALING CONCEPT
Tank Sealing Concept
• Requirements
o Fuel tank thermal environment
o Application techniques
o Curing methods
• Faying surface
o Interstices between structural members
o Corner gaps
o Overlapping surfaces
o Coating fastener, welds and pin hole openings
• Intersection of composite reinforced spar caps/tank rib caps
o Sealing techniques
o Metal fittings plus sealing material
L.
18-63

Componentsfor Further Evaluation and Test
The developmentof structural concepts for supersonic cruise aircraft has beenthesubject of this reported analytical investigation.
This investigation has produceda numberof promising concepts having goodpotentialapplication for design of a supersonic airplane structure. However,experimentalresearch is necessaryto assess the validity of the structural conceptsand todetermine the combination of conceptsbest suited for design and fabrication of
flight hardwarefor Mach2.7 arrow-wing configuration transport.
The economicviability of a supersonic cruise aircraft is dependent upon achievement
of a low structural mass fraction through lightweight and reliable structural design
concepts. State-of-the-art structures and materials are inadequate to provide a
viable commercial supersonic transport with a service life of 50,000 hours.
The principal objective of this planned research and development program was to
assess the relative merits of various structural concepts and materials for a
prescribed arrow-_ing aerodynamic configuration; to determine the structural weight
estimates based on in-depth structural design studies. The concepts were evaluated
through design studies making use of the best available materials technology, design
tools, design criteria and simplified cost benefit studies. The best concepts
which merit experimental evaluation are identified.
As an integral part of the research and development program it is essential that an
experimental program be initiated to verify the manufacturing capability to produce
hardware components that meet the engineering requirements as shown in Table 18-8.
Moreover, experimental data verifying fabrication processes (Table 18-9) from the
element and component tests (Table 18-10) must be compared with predicted values of
strength, deflections, temperature distributions, fatigue quality, fail-safe charac-
teristics, and life to determine the degree to which concept perforT_ance can be
predicted in a realistic structural application. The results of these tests should
then be used to refine the methods of analyses and concept designs.
It is recommended that future studies be directed towards the design, fabrication,
and testing (with appropriate attachment and restraint conditions) under simulated
flight environment of larger structural assembly incorporating the refined concept
designs. The outer wing and nacells of the NASA YF-12 aircarft could be effectively
used as the baseline structural envelope for design and fabrication of such an
assembly. After sufficient ground testing, actual flight experience at the hi_
l_ch ranges can be obtained.
18-64

TABLE 18-8. TEST OBJECTIVES
Conduct Sufficient Tests to Experimentally Validate the Structural
Design Concepts:
• Manufacturing processes
• Strength and damage tolerance capability of the components
for the load/temperature environment
• Correlate test results with the theoretical analysis
• Assess the impact upon the results of this design concept
study
m
E
TABLE 18-9. FABRiCAT!O_ PROCESS TESTS
EE
; _m_
Types of Test Recommended
Fabrication processes
o Tooling approach
o Fabrication and assembly schedule
o Joining methods
o Chemical milling/shot peening
o Metallurgical examination
o Inspection/quality assurance methods
i :
=1
-:V
_-.
8-65
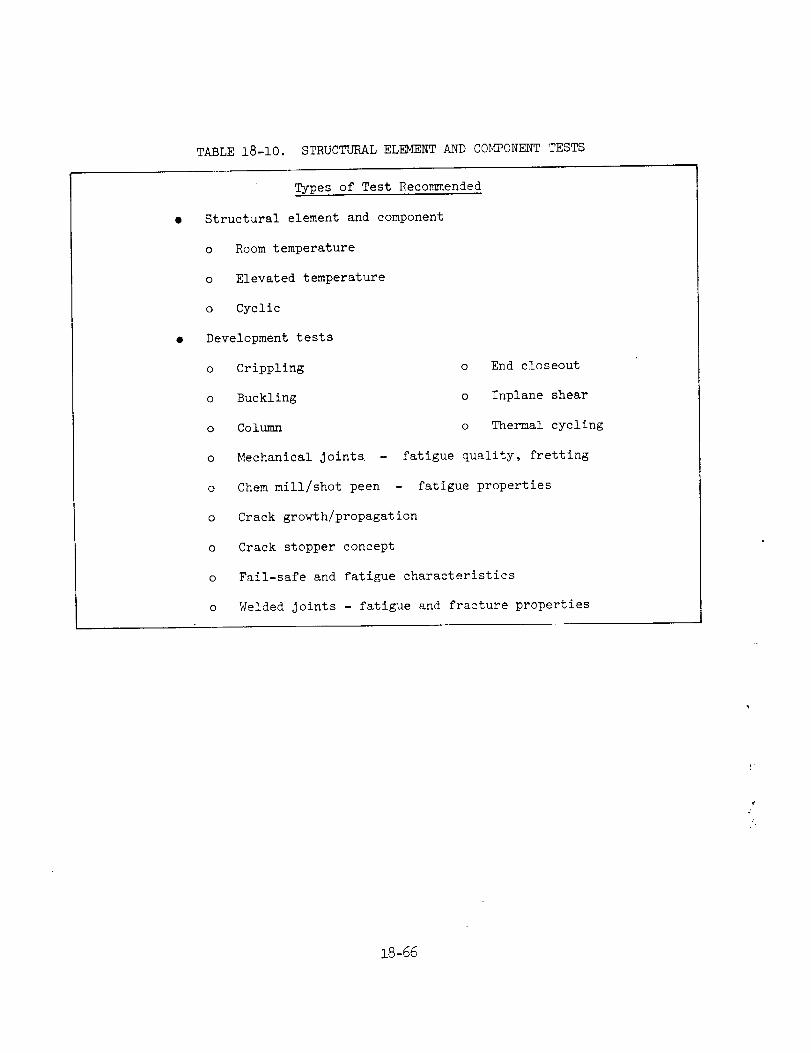
TABLE 18-i0. STRUCTURAL EL_4ENT AND COMPONENT TESTS
Types of Test Recommended
Structural element and component
o Room temperature
o Elevated temperature
o Cyclic
Development tests
o Crippling
o Buckling
o Column
o Mechanical Joints -
o Chem mill/shot peen -
o Crack growth/propagation
o Crack stopper concept
o Fail-safe and fatigue characteristics
o Welded joints - fatigue and fracture properties
o End closeout
o Znplane shear
o Thermal cycling
fatigue quality, fretting
fatigue properties
¢
18-66

REFERENCES
i
i. Foss, R.L.: Studies of the Impact of Advanced Technologies Applied to
Supersonic Transport Aircraft, LR 25827-3, Lockheed-California Company,
January 197_
2. Elrod, S.D. and Lovel, D.T: Development of Aluminum Brazed Titanium
Honeycomb Sandwich Structure, Boeing Aircraft Report D6-60203, July 1972
(Report No. FAA-SS-72-03).
18-67

-#
i i¸Lit
!J!!
!i
II
SECTION 19
PROPULSION-A!RFRA$_ INTEGRATION
BY
S.J.SMYTH, D.M.URIE, T.A.SEDGWICK, I. F. SAKATA
|
!L- :_7
|!L{-i: =
F


Em
CONTENTS
Section
INTRODUCTION 19-i
DESIGN INTEGRATION
Engine Forward Movement
Engine Spanwise Movement
Engine Size
Constraint Envelope
PROPULSION SYSTEM INTEGRATION
Boundary Layer Diverter
Inlet Mutual Interaction
19-1
19-7
19-11
19-11
19-12
19-12
19-12
19-12
AERODYNAMICS CHARACTERISTICS
Control Surface
Performance
STRUCTURAL CHARACTERISTICS
Flutter Characteristics
Sonic Fatigue
RESULTS
REFERENCES
19-17
19-17
19-20
19-2o
1%2o
19-22
19-22
.19-i


Figure
19-!
19-2
19-3
19-L
19-5
19-6
19-7
19-8
i9-9
19-10
19-i1
19-12
19-13
!9-1_
19-15
19-16
LIST OF FIGURES
Baseline Powerplant Configuration 19-3
Duct Burning Turbofan Engine - Mach 2.7 19-5
Preliminary Nacelle 19-6
Flutter Speed Variation with Engine Placement 19-8
Overall Sound Pressure Level - Aft Mounted Engines 19-9
Overall Sound Pressure Level - Engine Forward 19-10
Constraint Envelope 19-13
Diverter Height Variation with Nacelle Longitudinal Position 19-14
3table Operating Location of Aft Inlet 19-16
Incremental Lift Due to Inboard and Outboard Engine
Spanwise Shift - Flaps at 20 Degrees 19-18
Incremental Lift Due to Outboard Engine Spanwise Shift -
Flaps at 20 Degrees 19-18
Trimmed Lift as a Function of Outboard Engine Spanwise
Location - Flaps at 20 Degrees 19-19
Effect of Outboard Engine Spanwise Location on Rolling
Moment Due to Flaperons 19-19
Vertical Tail Required Due to Spanwise Shift of Outboard
Engine 19-21
Effect of Mission Lift/Drag Ratio on Nacelle Forward Shift 19-21
Candidate Engine Location 19-23
?_D_NG ?AGE BLANKNOT
19-ill

¢

Table
!9-1
19-2
LIST OF TABLES
Propulsion System Parameters
Propulsion-Airframe Integration Results
Pagem
19-5
19-23
u_£1u
!
____
PRECEDING PAGE BLANK NOT FZ_
19-v

¢

SECTION 19
PROPULSIOH - AIRFRA3_ INTEGRATION
INTRODUCTION
E_
BE
= ....
The study conducted to provide the proper integration of the engine and the air-
frame for meaningful completion of the detailed engineering design and analysis
of Task II is reported in this section.
The orientation of the nace!]es of the baseline configuration concept (Section 2)
were derived from unpublished data of wind tunnel tests at the NASA Langley
Research Center with their spanwise location determined from the NASA configura-
tion data deck (identified as 733-336C Follow-on, April 1973). The engine
characteristics for the selected duct-burning turbofan engine, designated
BSTF 2.7-2, were obtained from Reference i.
The aforementioned data were integrated into the baseline configuration concept
to define the propulsion installation shown on Figure 19-1. Small longitudinal
and spanwise movements from the baseline position were explored and sensitivities
determined to aid in establishing the best aft mounted-underling installation
for the propulsion packages.
DESIGN IHTEGRATI 0][
The effect of engine location and size on the overall airplane structural,
aerodynamic and performance characteristics were explored to establish a
nacelle constraint envelope for the placement of four underwing nacelles on
the arrow-wing configuration transport.
The duct-burning turbofan engine shown in Figure 19-2 was selected for the
study. The engine, designated the BSTF 2.7-2, has a bypass ratio of 3.26
and a fan pressure ratio of 3.0. The scale-one engine has an uninstalled
sea level static thrust of 78,000 pounds, a maximum diameter of 90 inches and
an overall length of 255 inches. Other pertinent data are found in Engine
Recommendations of Section 2_ Table 19-1 gives the propulsion system param-
eters for the BSTF 2.7-2 engine.
19- i

¢

i
EE
ji /
•
!i,ii__-_i!y.'_;-",.-/ _
/
iI
i
t
I

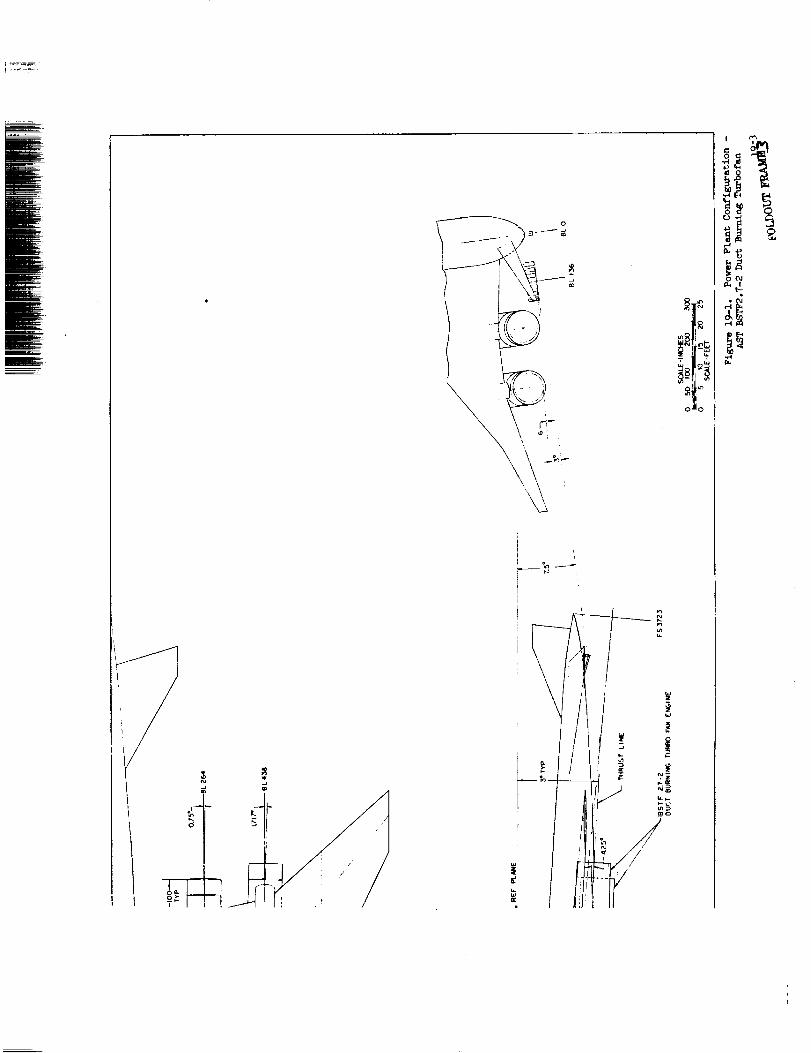
i
!I
i
o
,-I
_o


CONCEPTUAL GAS PATH SCHEMATICFAN PRESSURE RATIO = 3.0
FRONT [--- REAR
MOUNT /Pro j Mou
_z
Figure 19-2. Duct Burning Turbofan Engine -Mach 2.7
TABLE 2-2. PROPULSION SYSTEM PARAmeTERS
Engine:
Number of engines:
Noise suppression:Inlet/nozzle:
Thrust/weight -- (lift off):
Lift of Speed:
BSTF 2.7-2 duct burning turbofan
FAR 36-5
Axisymmetric/variable convergent-divergent
0.36
Math 0.30
Scale Factor: 1.0 (Ref.) 1.147
78,000
11,14333.1
Net thrust, lb. (A)
Engine w_ight, lb. (B)ACAP, ft_
89,466
12,78138.0
D_X, in.
DCO_, in.
DNOZ, in.
LENG, in.
LINLET, in.
Study Application
9O
79.4
9O
255189.3
96.4
85.0
96.4
267.5
203.9
Task I Task II
(A) SLS, Max. IPower, uninstalled
_B) Includes reverser and suppressor
PRECEDING PAGE BLANK NOT FILME_
19-5

The layout of the preliminary nacelle with an axisynnnetric mixed compression
inlet and the BSTF 2.7-2 duct burning turbofan engine is shown in Figure 19-3.
The inlet is as described in Boeing Report FA-SS-72-50, dated April 1972,
scared to account for the differences in engine face diameter and airflow.
Supersonic diffuser lines are maintained as a function of _ch number and
subsonic diffuse divergence is kept unchanged. The nozzle is rotated down
h-degrees 15-minutes relative to the engine center line to permit proper
orientation of nacelles relative to the wing.
The propulsion installation of Figure 19-1 are toed in 0.75-degree and
1.717-degree for the inboard (BL 26h) and outboard (BL _38) engines, respec-
tively. The inlet is aligned with the underwing flow field and the nozzle
tilted 3-degrees down relative to the Z o reference line. The tilt prevents a
loss in airplane lift/drag ratio as was determined in previous supersonic
transport studies. The engine dimensional data used corresponds to the
BSTF 2.7-2/(scale 1.147) duct-burning turbofan which has a maximum diameter of
96.h inches. As shown in the figure, the rotation of the nozzle to prevent an
L/D loss, the increased engine diameter, the nozzle clearance for a 3-degree
roll at touch down requires an increase of 19 inches in the landing gear length
from that shown for the Task I-Baseline Configuration concept. The engine
mounts are located aft of the wink rear beam, and are supported from beams
which extend aft (cantilevered) of the structural box. Engine accessories are
arranged around the forward portion of the engine. The hydraulic pumps, con-
stant speed driven generator, and engine power takeoff are located aft of the
MACH 2.7 DUCT BURNING TURBOFAN_
mild Jl_ _ J_W j
--.-4| --i
i'.
AXISYMMETRIC MIXED COMPRESSION INLET
Figure 19-3. Preliminary Nacelle
19-6

wing box, as indicated on the figure. Further study indicates that these units
should be moved for_{ard of the rear beam, with an access panel located in the
upper surface of the wing box. The area aft of the rear beam is congested with
controls for the flaperons, flaps and spoilers. The . engine driven compressor
for the airplane environmental control system is located on the engine lower
cerJterline and requires a faired bump in the lower nacelle (not shown on draw-
wing). Inlet boundary layer diverter heights are 15 inches on the inboard
nacelle and 8 inches on the outboard nacelle. The outboard inlet is aft of
the inboard inlet and approximately one diameter away. Mutual interference will
cause an unstart on the inboard inlet to unstart the outboard inlet. To prevent
this an inlet fence is required between nacelles as shown.
:: Z
Engine Forward Movement
Factors influencing longitudinal limits on nacelle placement include wing lead-
ing edge shock wave, flutter, sonic fatigue, thermal stresses, _ave drag, air-
plane balance, airplane tail-down and roll angle, landing gear length, and inlet
mutual interference.
The arrow-wing configuration in this study has a subsonic wing leading edge.
This permits the underwing nacelles to be moved forward until the inlet lip is
ahead of the wing leading edge and still remain in a favorable interference
field. Practical limitations at the wing trailing edge reduced the potential •
for the forward movement of the nacelles to approximately i00 inches.
Engine longitudinal placement effect on flutter speed as presented in the Sen-
sitivity Studies section (Vibration and Flutter, Section 9) indicated an increase
in the bending and torsion mode flutter speed with a forward engine movement
(Figure 19-_). This allows for a reduction in the mass to be added to the wing
tip structure, and also a mass reduction resulting from shortening of the deflec-
tion critical engine rails.
As the engine is moved forward, the effect of nozzle exhaust increases sonic
fatigue and thermal stresses on the trailing edge flaps, flaperons, and wing
vertical fin. The increased sonic environment is visually displayed on Fig-
ures 19-5 and 19-6. The primary mass penalty, as indicated, is on the trailing
edge structure,
19-7

5O0
400FLUTTER
SPEED
(KEAS)
3OO
4
SYMMETRIC BENDING AND TORSION MODECHORDWISE STIFFENED ARRANGEMENT
WEIGHT "750,000 LOS. MACH 0.90
1.2 V D - 468 KEAS
® ® © ® ®
Figure 19-h. Flutter Speed Variation With Engine Placement
The forward movement of the nacelles however, permits a shorter landing gear
for a given tail-down angle and roll-angle on landing. Fore and aft placement
of the nacelles is further influenced by center of gravity restrictions in the
balance of the airplane. Preliminary balance studies with the engine exhaust
at the wing trailing edge indicates that the required balance can be achieved
by shifting the fuselage _ relative to the wing and nacelles. The influence of
an inboard inlet unstart disturbing or unstarting the outboard inlet is a func-
tion of longitudinal separation as well as spanwise and is discussed in the
Propulsion System Integration section.
¥
19-8

Z
/
r/3
q_
.._
o
c_
I
©
>
oO
O_
orjo
,-{,-I
.h_J
0
o_
b_
19-9

o
°r_bO
M
I
_._©
c)
u]
oj
R_
oo_
_-_
(I)
o
Ic_
b_
¢
19-10

Spanwise Engine Movement
The limits for spanwise location of the nacelles were influenced by wing trailing
edge control surfaces, inlet mutual interference, flutter, and main landing
gear location. Of these factors, the trailing edge control surfaces were the
single most critical factor in spanwise location of nacelles. With the engine
size shown on Figure 19-1, lift and roll control are adequate, but there is no
margin for moving the inboard-nacelle inboard. Spanwise movement would require
a larger wing area or change in aspect ratio and span. In addition, moving
the engines inboard and forward must consider clearance with landing gear doors
and the main landin_ gear strut. Moving the outboard engine outboard increases
roll control and incremental lift from the flap, but increases the flutter prob-
lem and requires a larger all moving vertical tail. Since movement of the two
nacelles away from each other was restricted by the above factors, it was not pos-
sible to separate the inlets by one and a half diameters and line them up fore
and aft. Therefore, the inlet fence must be retained to prevent an inboard inlet
unstart from upsetting the outboard inlet.
Engine Size
The effects of engine size on the overall airplane performance were evaluated by
arbitrarily increasing the size and weight of the BSTF 2.7-2/1.147 duct-burning
turbofan engine. This increase was based on the assumption that the engine
design was over-optimistic. The engine maximum diameter was increased from
96.h inches to 107 inches, while the length remained unchanged. The engine
T/W ratio was arbitrarily reduced from 7.0 to 6.0 for an increase in engine
weight of 2,130 pounds per engine. The increased engine and structure weight
resulted in a loss of over 200 nautical miles. The most difficult problem
faced by this increased engine diameter on the arrow-wing configuration was in
the wing trailing edge control surfaces. As discussed earlier, they are Just
adequate for the 96.4 inch diamter engine, but would be reduced to the point of
insufficient lift and roll control for takeoff and landing with the larger
engines. The only solution to this problem is a larger wing or increased span
with resultant increased gross weight. The importance of controlling engine
size, especially diameter and weight, was made very apparent in the develop-
ment of the smallest, most efficient supersonic aircraft.
19-11

Constraint Envelope
The placement of four underwing engines on the arrow-wing configuration was
extremely limited. As noted earlier, there was no improvement from moving the
nacelles spanwise, and therefore the constraint envelope, shown in Figure 19-7,
maintains the same spanwise location as the NASA card deck. Longitudinal limits
were not so restrictive, and as the constraint envelope indicates, the nacelles
may move from the exhaust i00 inches aft of the wing trailing edge to the exhaust
at the trailing edge. Movement farther forward was possible, but increases the
sonic fatigue problem. Because of the lack of benefits identified in moving the
engines spanwise, the primary effort was in the determination of the best longi-
tudinal position for the nacelles.
PROPULSION SYSTEM INTEGRATION
Boundary Layer Diverter
Boundary layer diverter height variation with nacelle longitudinal position
(relative tot he wing leading edge) was determined to aid in the design layout.
The results shown in Figure 19-8 are independent of spanwise position and were
derived from unpublished data of wind tunnel tests conducted at the NASA
Langley Research Center. The diverter heights for the baseline configuration
of the arrow-wing supersonic cruise aircraft are indicated on the figure.
Inlet Mutual Interaction
An important aspect of airframe/propulsion system integration is the minimiza-
tion of inlet-to-inlet interaction effects. These mutual interiction effects
can be particularly severe for underwing engine installations. Sp4cifically,
the disturbance associated with an inlet unstart may propagate through shock-
boundary layer interaction effects to an adjacent inlet. If the disturbance
is sufficiently strong the adjacent inlet will unstart. In order to prevent
excessive aircraft pitch, yaw, and rolling moments, an adjacent inlet unstart
should be prevented.
An analysis of experimental data (Reference 2) for inlet mutual interaction
effects at an inlet Maeh number of 2.6 indicates that a boundary layer fence
¢
19-12

E
I_L_
iII
:_Ju't LJLJL_
.JLJLJ LJLJI. 1
IIII
Z
it)
o
-o
o
I
,,.-I
19-13
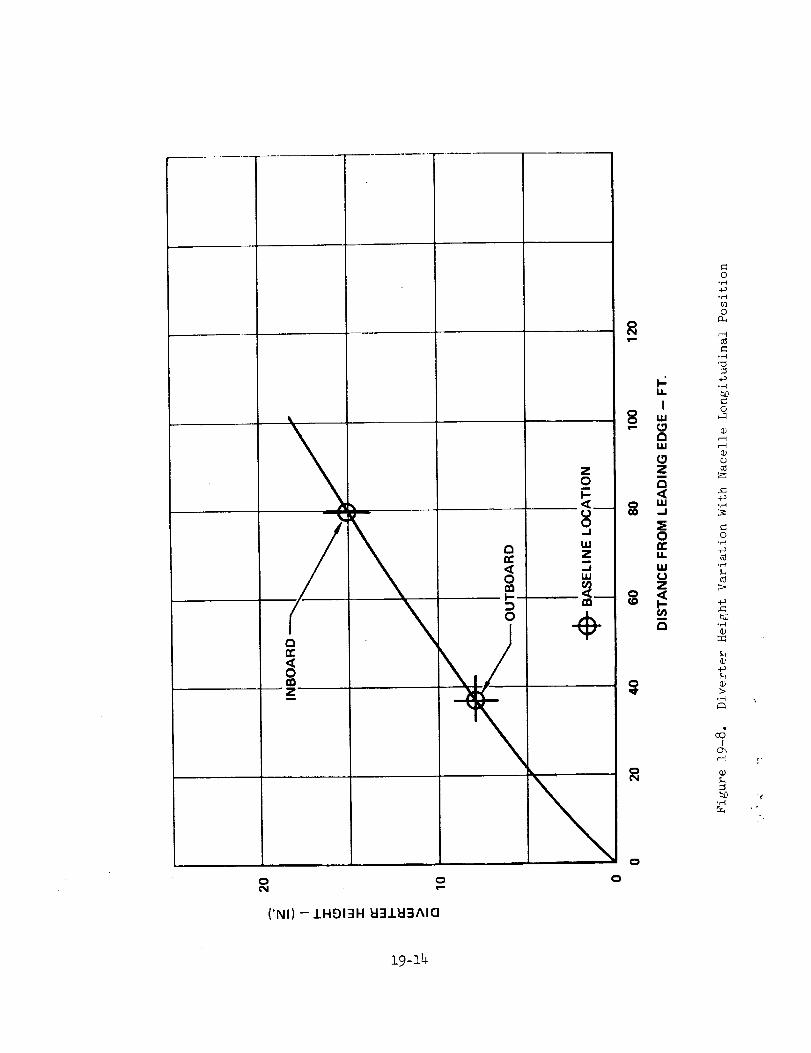
Qn,-<0
I-,-:)0
Z0I-<,U0,--I
I,I,I
zm--II,U
0¢51
0 0
('NI) - AHOI3H 1::i311::13A10
1.6
I
I,U
ZmQ<
--I
O
IJL
IJJcaz
mQ
O
O.r-t+a-r.l
O
,--I
G
¢)c..)
,_
O,rml
4_
°_©
%
%
_dI
Ch
¢
19-14

E
_ill be required to prevent an unstart of the downstream outboard inlet due to
an unstart of the inboard inlet of the baseline study vehicle. Figure 19-9
shows the stable and unstable regions for operazion of the outboard inlet during
_instart of the inboard inlet, based on experimental data for two inlets _ith no
wing. The results, which show the present location to be only marginally satis-
factory, do not reflect the effect of the interaction between the expelled inlet
shock wave and the wing boundary layer. Since the expelled inlet shock wave
will propagate further forward due to separation of the wing boundary layer,
the outboard inlet will most likely unstart. A boundary layer fence, similar
to the one employed on the Boeing SST, was incorporated on the baseline vehicle
to prevent this unstart.
An outboard inlet unstart can also be prevented by relocation of the inlet.
Based on the )_ach 2.6 data of Reference 3, the inlets _ould have to be later-
ally aligned and separated approximately three and one-half inlet di_eters
(cowl lip to cowl lip) to completely eliminate mutual interaction effects.
Depending on the sensitivity, of the inlet and engine to the _jaceno_ _ inlet
unstart disturbance, the inlets could possibly be placed closer together, flow-
ever, because of the complex interactions involved, the minim_mmoinlet separa-
tion distance would have to be determined experimentally.
As discussed in Reference 4, a lateral separation distance of one and one-half
equivalent inlet diameters was found to be acceptable for the Lockheed L-2000 SST.
The equivalent inlet diameter is defined as the diameter of an axisymmetrie inlet
which has the same capture area as the L-2000 SST two-dimensional inlet. This
result was determined b_r tests of a scale model inlet in the presence of a sim-
ulated wing boundary layer and a si[_ulated adjacent inlet unstart disturbance.
The unstart disturbance was simulated by air injection through slots into the
wing boundary layer, controlled to yield the same vin_ pressure distribution
as previously determined from small scale aircraft/inlet model tests. Since
two-dimensional inlets were employed in the above tests, the inlet stability
results may not be completely applicable to axisymmetric inlet installations
since the shock wave boundary layer interactions differ from one to the other.
19-15

3
72
I-,-
w 1¢/)Ez
a,.
0
/
Y
m
_f
LOCKHEED L-2000
STABLE
UNSTABLEI
/ BASELINE
10 20 30 40 50
8 , AFT INLET ANGULAR POSITION _ DEGREE
LOCAT!ON
f
60
-¢
Figure 19-9. Stable Operating Location Of Aft Inlet
19-16
m
AERODYUN,[I C CHARACTERISTICS
The analyses to determine the aerodynamic effects of moving the engine nacelles
from their baseline location (Figure 19-1) were performed. The range of poten-
tial locations was limited to spanwise positions along the lower surface of the
wing trailing edge inboard of the wing vertical fin. Spanwise shifts of either
nacelle cause changes in the size and location of the wing trailing edge flap
panels. Also, the yawing moment due to the thrust of the outboard engine is
changed.
Control Surface
The panels affected by the spanwise shifts studied are F!, F2, and F 3 whose rela-
tive positions are shown in the sketch. Flap panel F 1 is used onl Z as a lift
flap while F2 and F 3 are flaperons providing both incremental lift and roll con-
tro]. Figure 19-10 shows the incremental lift coefficient due to all three flap
panels deflected 20-degrees. Both nacelles are shifted inboard and outboard
from their baseline positions keeping the separation between them constant at
the baseline value. This provides a trade off between panel F I and panel F 3.
Because the effectiveness of a flap is dependent in part on the area of wing in
front of it, the addition of span to the inboard panel F 1 at the expense of
outboard F_,increases the lift added by about ten percent. Similarly_ a
decrease of F 1 and increase of F 3 causes a net loss in flap lift effectiveness.
Figure 19-11 shows the effect of a trade between F 2 and F 3 while F1 was held
constant. The airplane trimmed lift coefficient for conditions approximating
second segment climb is shown as a function of outboard nacelle location in
Figure 19-12.
Variation in the incremental lift potential of flaperon panels F 2 and F 3 coupled
with the shift in panel center of pressure effects the roll contro] power avail-
able at Mach numbers up to 0.8. Rolling moment coefficient from F 2 and F 3 at
full asymmetric deflection is shown in Figlme 19-13. The individual contribu-
tions and their sum. are shown as a function of outboard nacelle spanwise
location.
A shift of the outboard engine inboard or outboard from the baseline position
will change the yawing moment due to an inoperative engine. The all moving
19-17

16
Figure 19-10.
NACELLE
(HOLD)II
F2(HELDCONSTANT
INE LOCATIONOUTBOARD NACELLE
m
FLAP = 0.35 RAD (20 DEG)
C.G. AT 0.51c
20 40 60 80 100
PERCENT SEMISPAN ~ b/2
Incremental Lift Due To Inbcard And Outboard Engine Spanwise
Shift - Flaps at 20 Degrees
16
.12z<04
.os<JM.
tJ
<3 .04
BODY
+-I
IJ
F.
(HELD
___4 CONSTANT)
!!....... OUTBOARD
INUUAHU = --........ NAueLLE
NA_;iLLk (BASELIN_._..
L
2 F3
8 FLAP = 0.35 RAD (20 DEG)
C.G. AT 0.51
I!
I40 60
PERCENT SEMISPAN ~ b/2
00 20 80 100
Figure 19-]1. Incremental Lift Due To Outboard Engine Spanwise Shift -
Flaps at 20 Degrees
¢
19-18

:Em
cck-
.8
.J(J
.4
00
I
I
!
INBOARDNACELLE
(HOLD)I
I
!
-OUTBOARD--NACELLE
(BASELINE)
I
<x= 0.14 RAD (8 DES)
--_'FLAP = 0.35 RAD (20 DEG) --
C.G. AT 0.51 _.
Figure 19-12.
20 40 60 80 100
PERCENT SEMISPAN ~ b/2
Trimmed Lift As A Function Of Outboard Engine Spanwise
Location - Flaps At 20 Degrees
.016
.012
C_ .008
• RIGHT ROLL
• _a TOTAL = 0.7 RAD (40 DEG)
BODY
1
INBOARDNACELLE
(HELDCONSTANT)
II
]II
il
F2 + F3
fBASELINE LOCATION-OUTBOARD NACELLE
00 20 40 60 80 100
PERCENT SEMISPAN ~ b/2
Figure 19-13. Effect Of Outboard Engine Spanwise Location on Rolling
Moment Due to Flaperons
19-19

centerline vertical tail is sized to control this thrust asymmetry at low speed
as required for acceptable performance. The dependence of this tail area on
outboard engine position is shown for constant minimum control speed in
Figure 19-14.
Performance
Fore and aft position of the engine nacelles does not modify relative flap size
or vertical tail area and hence does not effect low speed aerodynamics. It does,
however, effect wave drag at supersonic speeds. If both inboard and outboard
nacelles are shifted i00 inches forward the wave drag is increased by approxi-
mately one count (0.0001) at cruise. One count of drag has the same effect on
performance as adding 2500 pounds of empty weight or reducing range 31 nautical
miles. The mission maximum lift to drag ratios for the baseline airplane and
for the airplane with nacelles forward are shown in Figure 19-15.
STRUCTURAL CI_RACTERISTICS
The structural effects of longitudinal and spanwise movements from the baseline
position were identified with the change in flutter characteristics, sonic fatigue
requirements, and mass and balance as discussed in the Design Integration section.
Flutter Characteristics
The flutter optimization results and engine placement investigation reported in
Section I0, Vibration and Flutter, provided an insight into the structural mass
trends with engine longitudinal position. The results of the study (Figure 19-4)
indicates an increase in the flutter speed for the bending and torsion mode from
379 KEAS to h01 K_AS or an increase of 22 KEAS. This increase in flutter speed
allows for a reduction of approximately 500 pounds of structure from the wing
tip region. In addition, shortening of the engine support beams by i00 inches
each permits a mass savings of approximately 450 pounds. Thus, the net poten-
tial savings is 950 pounds per aircraft.
¢
19-20

E
m_RE
NE
30,.I
u 20
10
50-
5OO
40
¢,_ 400g.
300,,.,,I
'_ 200
==.
_ 100
0- 0
Figure 19-1h.
BODY
V
20
INBOARDNACELLE(HELD
CONSTANT)
40 60
PRECENTSEMISPAN _ b/2
BASELINE LOCATIONOUTBOARD NACELLE
80 100
Vertical Tail Required Due To Spanwise Shift Of Outboard Engine
12
X<
A
.Jv
10\
4
08
2.54 METERS (100-INCHES)
1.2 1.6 2.0 2.4 2.8
MACH NUMBER
Figure 19-15. Effect Of Mission Lift/Drag Ratio On Nacelle Forward Shift
19-21
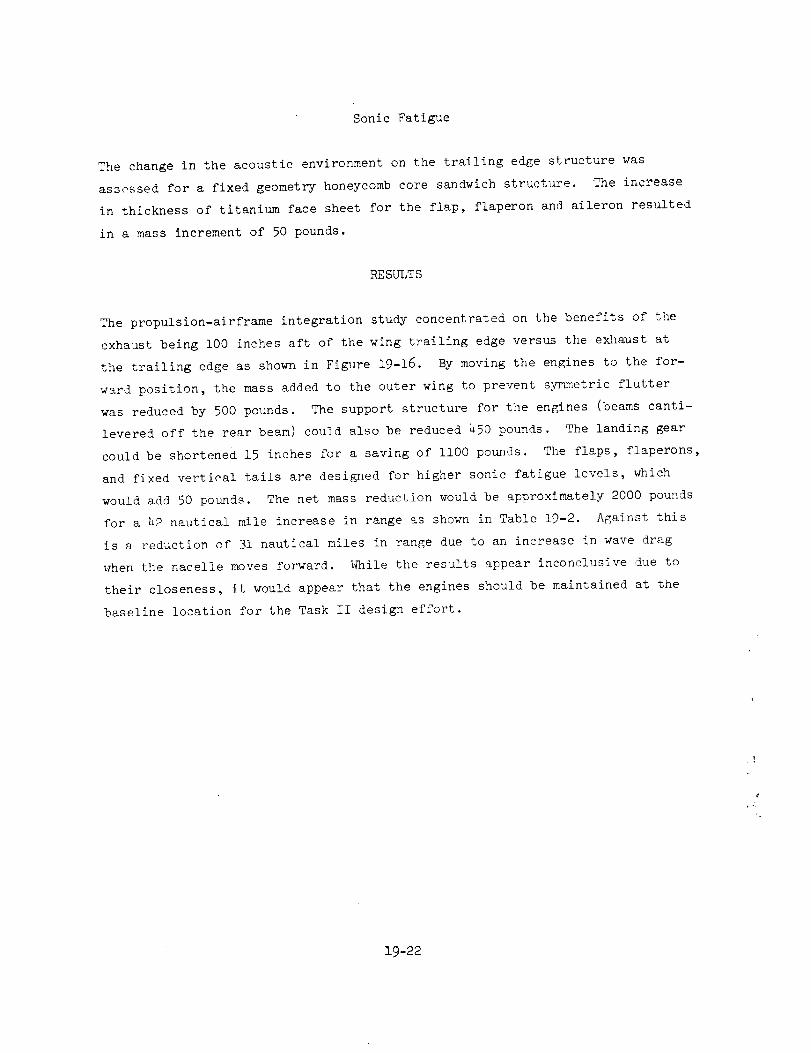
Sonic Fatigue
The change in the acoustic environment on the trailing edge structure was
assessed for a fixed geometry honeycomb core sandwich structure. The increase
in thickness of titanium face sheet for the flap, flaperon and aileron resulted
in a mass increment of 50 pounds.
RESULTS
The propulsion-airframe integration study concentrated on the benefits of the
exhaust being i00 inches aft of the wing trailing edge versus the exhaust at
the trailing edge as showl% in Figure 19-16. By moving the engines to the for-
ward position, the mass added to the outer wing to prevent symmetric flutter
was reduced by 500 pounds. The support structure for the engines (beams canti-
levered off the rear beam) could also be reduced 450 pounds. The landing gear
could be shortened 15 inches for a saving of ii00 pounds. The flaps, flaperons,
and fixed vertical tails are designed for higher sonic fatigue levels, which
would add 50 pounds. The net mass reduction would be approximately 2000 pounds
for a 42 nautical mile increase in range as shown in Table 19-2. Against this
is a reduction of 31 nautical miles in range due to an increase in wave drag
when the nacelle moves forward. While the results appear inconclusive due to
their closeness, it would appear that the engines should be maintained at the
baseline location for the Task II design effort.
, .\¢
19-22

BASELINE
(A"FT M(_UNTED)
EXHAUST AT TRAILING EDGE
(FORWARD MOUNTED)
Figure 19-16. Candidate Engine Location
Table 19-2. Propulsion - Airframe Integration Results
WE IGHT CHANGE -
e FLUTTER -500 LB
e ENGINE SUPPORT BEAMS -450 LB
e LANDING GEAR LENGTH -1,100 LB
e INCREASED SONIC FATIGUE_ +50 LB
-2, 000 LB
RESULTS -
e WEIGHT SAVING +42 N.MI.
e WAVE DRAG PENALTY -31 N. M I.
e NET +11 N.MI,
_:ONCLUS ION -
MAINTAIN BASELINE ENGINE LOCATION
19-23

¢

REFEREI[CES
] •
2.
,
4,
R.!. Foss, "S-_vLmary Report - Task Iii Concept Refinement and Engine
Coordination," hockheed-Caiifor_ia Company, LR 25827-3, _ _nuar,'T_- 7o7k
Motycka, D.L., and Murr,hy,=_ J.B., "Inlet to Inlet Shock Interference Uests,"
I'_ASA CR-26}_, September ±90>_"_
Mitchell, G.A., and Johnson, D.F., "Investigaticn of a i[scelie ][ounted
_T{_- Boundary Layer," NASA ..... _ ' T_ - " ;o7Surersonic Inlet With a _;.... _J-_'.-=lS_, ._azcn
Anon.: "Supersonic Transport Develonment Program - Phase II! Pro_osai,"
Lockheea-_al1_ornla Company, FAA-SSL66-7_ Vol. II-E Airframe Design,
September 1966
PRECEDING PACE _' _'_-'_a NOT FILME_
_9-25

#

_w
E
E
SECTION 20
ADVANCED TECHNOLOGY ASSESSMENT
by
Y. F. Sakata, R. N. Jensen and A. R. Holland

#

CONTENTS
m_
Sect iJn
INTRODUCTIO]_
ADV.<'[CED TECHZ]OLOGY SELECTION
DESIGL _ APPROACH
Materials
Design Concepts
Point Design Regions
Wing Design Loads
Fuselage Design Loads
Results - Wing
Results - Fuselage
_&I_FACTUR ING PLAN
MASS ESTIMATES
Wing Mass
Fuselage Mass
Secondary Structure Mass
FINAL DESIGN - ADVANCED TECHNOLOGY AIRCRAFT
REFERENCES
Page
20-1
20-1
20-3
20-4
20-12
20-12
2o-z6
20-17
20-17
20-31
20-46
20-49
20-5].
20-54
2_O-54
20-57
20-61
20-i

¢
i i"

LIST OF FIGURES
Figure
20-1
20-2
20-3
20-6
20-7
_0-9
20-!0
20-11
20-12
25-13
20-14
20-15
20-16
20-17
20-15
20-19
20-20
S_ructure, _ateria!$ and Control Impact on SST
Performance
Extensiona! and Shear Modulus for _r_n/Ep_uxy and Boron/
Polyimide
Extensional and Shear Modulus for Graphite/Epo×y and
Craphite/Polyimide
Ccmparative Thermal Stress - Titani_mv_ vs Composite _.!ateriais
Comparative Buckling Efficiency and Specific Stiffness for
_ron/Polyimide and GraDhite/Polyimide
Surface Protection System for Composite Laminates
Composite Wing and Fuselage Design Concepts
Ch_rdwise Stiffened Wing Design - All Composite Concepts
Definition of Wing Point Design Regions
Definition of Fuselage Point Design Regions
Fuselage Shear Diagram- Task I
Fuselage Bending Moment Diagram - Task I
Chordwise Stiffened All-Composite Design Concept
Monocoque All-Composite Design Concept
Composite Fuselage Laminate Directions
Idealized Cross-Sect_on of Fuselage
Typical Frame-Stringer Intersection Schemes
Chordwise Stiffene_ Wing Panel Fabrication
Specific Stiffness Properties of Titanium and Composites
Advanced Hybrid Structural Approach - 1990 Start-of-Design
(Far-Term)
Pag___Se
20-3
20-6
20.y
20-9
20-10
20-11
20-ii
20-14
20-15
20-I5
20-20
20-20
2O -23
2o-27
20-37
20 -37
20-43
20-48
20-53
20-58
PR C D a PAG
20-iii


LIST OF TABLES
Table
20-1
20-2
20-3
20-b
20-5
20-6
20-7
20-8
20-9
20-i0
20-11
20-12
20-13
20-14
20-15
20-16
20-17
20-18
20-_9
20-20
20-21
20-22
20-23
20-24
20-25
20-26
Composite Design Properties for the 1960-1990 Time Feriod
Merits of Potential All'Composite Chordwise Stiffened Design
Concepts
Critical Wing Loading Conditions
Design Loads for Chordwise Stiffened Arrangement - Ultimate
Design Loads for Monocoque Arrangement - Ultimate
Summary of Composite Chordwise Stiffened Wine Surface Fanels
Graphi_e-Polyimide Substructure - Point Design L0322
Suz_ary of Composite Monocoque Wing Surface Panels
Composite Truss Spar and Rib - Monocoque Design
Circular-Arc Corrugated Spar/Rib Webs - Reference Titani±m
Alloy
Composite Circular-Arc Corrugated Spar Web - Point Design_0322
Composite Circular-Arc Corrugated Web 1{eights
Wing Weight Comparison For Point Design Regions
Composite Tee-Stiffened Panel - FS 750
Composite Tee-Stiffened Panel - FS 2000 and FS 3000
Composite Hat Stiffened Panel - FS 2000 and FS 3000
Composite Tee-Stiffened Panel - FS 2500
Composite Hat-Stiffened Panel - FS 2500
Composite Fuselage Frar_es - FS 2000 and FS 3000
Composite Frame Weights
Composite Fuselage Weight Sur_ary
Advanced Technology Aircraft Mass Comparison
All-Composite Wing Box Structure Mass Comparison
All-Composite Shell Structure Mass Comparison
Weight Reduction Factors for Advanced Technology Aircraft
Secondary Components
Airplane Mass and Performance Comparison - Advanced
Technology Aircraft
[_-_ING PAGE BLANK NOT FIL_
Pa_e
_-5
20-13
20-17
20-IS
2o-19
20-25
2o-26
20 -20
20-30
20-32
20-33
20-34
20-35
20-38
20-39
2O-4o
20-41
2o -42
2o-4L
20-45
20-47
20-50
20-52
2o-55
20-56
20-59
20-v

't
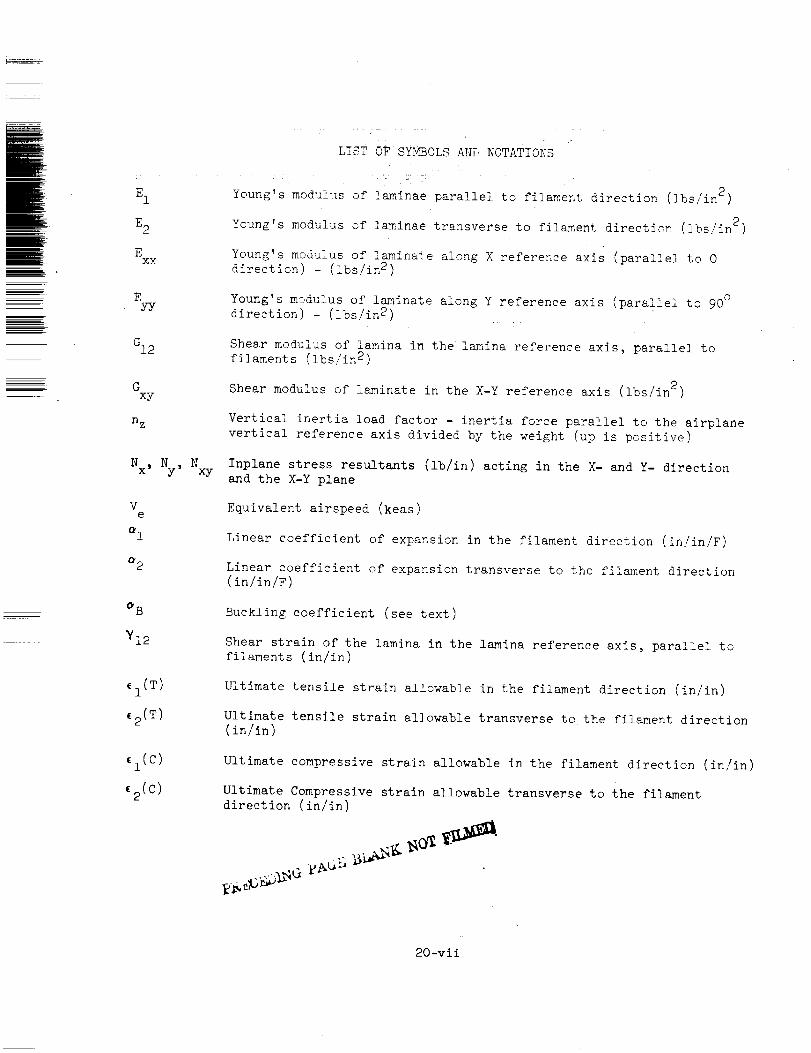
E 1
E 2
EXX
E
GI2
Gxy
n Z
Nx, Ny, N
Ve
a I
a 2
_I(T)
c2(T)
,l(C)
e2(c)
xy
LIST OF SYMBOLS AN[ NOTATIONS
Young's modulus of laminae parallel to filament direction (Ibs/in 2)
Young's modulus of laminae transverse to filament direction (ibs/in 2)
Young's msdu!us of laminate along X reference axis (parallel to 0
direction) - (Ibs/in 2)
Young's modulus of laminate along Y reference axis (parallel to 90 °
direction) - (!bs/in 2)
Shear modulus of lamina in the lamina reference axis, parallel to
filaments (Ibs/in 2)
Shear modulus of laminate in the X-Y reference axis (ibs/in 2)
Vertical inertia load factor - inertia force parallel to the airplane
vertical reference axis divided by the weight (up is positive)
Inplane stress resultants (ib/in) acting in the X- and Y- direction
and the X-Y plane
Equivalent airspeed (keas)
Linear coefficient of expansion in the filament direction (in/in/F)
Linear coefficient of expansion transverse to the filament direction
(in/in/F)
Buckling coefficient (see text)
Shear strain of the lamina in the lamina reference axis, parallel to
filaments (in/in)
Ultimate tensile strain allowable in the filament direction (in/in)
Ultimate tensile strain allowable transverse to the filament direction
(in/in)
Ultimate compressive strain allowable in the filament direction (in/in)
Ultimate Compressive strain allowable transverse to the filament
direction (in/in)
20-vii

v12
w21
Major Poisson's ratio of laminae relating contraction in the transverse
direction due to extension in the filament direction.
Minor Poisson's ratio of laminate relating contraction in the filament
direction due to extension in the transverse direction
density (ibs/in 3)
20-viii

SECTION20
ADVANCED TECHNOLOGY ASSESSMENT
INTRODUCTION
The results of the Advanced Technology Assessment, which explored an aggressive
application of composite materials and fabrication technolo_v for wing and fuselage
structure of a Mach 2.7 arrow-wing supersonic cruise aircraft, are _resented in
this section.
The analysis of selected wing and fuselage point design regions, considering the
various structural arrangements, design concepts, and corresponding internal loads
and flexibilities, were made by the Lockheed-Georgia Company. Weight reduction
factors for secondary and other structural components were obtained from the
results of the Advanced Technology Transport (ATT) studies of _eference i and were
applied as appropriate to determine weights for an aircraft with a fixed takeoff
weight of 750,000 pounds and an aircraft resized to provide a constant payload-
range performance.
ADVANCED TECHNOLOGY SELECTION
Studies of advanced technology application to future transport performance and
economics identified major technological advances that could reasonably be avail-
able during the 1980-1990 time period. The resulting trends indicated conclusively
that the highest structural mass payoff was in the area of materials technology or
more specifically, composite material system application. Furthermore, the most
significant structural mass reduction resulted from resizing the airplane to
reflect the lower structural weight achieved through advanced materials application.
Reference I presents the results of a study of the application of advanced tech-
nologies to long-range transport aircraft conducted by the Lockheed-Georgia
Company. Trade studies were conducted to determine the effects of variation in
technology advancements in the areas of (i) aerodynamics, (2) structures and
materials, and (3) active controls systems. The most significant benefit was
20-1

obtained by the application of advanced materials as shown by marked improvements
on airplane performance and economics. For example, for a 50-percent utilization
of advanced materials, the takeoff gross weight was reduced by about 30-percent
and the R0I is increased by about 35-percent. Above 50-percent utilization of
advanced materials, however, the DOC increased and R0I decreased, because of the
relatively inefficient application of advanced materials in this region.
Reference 2 presents the impact of advanced technologies on supersonic transport
aircraft. Weight savings predictions based on the use of composites, new struc-
tural concepts and active controls were developed. The benefit of weight reduc-
tion was amplified by the growth factor for this class of aircraft (Reference
Section 17); consequently, a pound saved in structure results in gross weight
being approximately 6-pounds less for a supersonic transport maintaining the
same payload-range capability. This reduction results from the smaller fuel
requirement and the lighter structure associated with the reduced gross weight
as follows:
Basic weight saving
Fuel reduction
Structural weight reduction
Total gross weight reduction
1.0 lb.
2.8
2.2
"6.o lb.
Although no attempt was made in the study of Reference 2 to single out indivi-
dual structural improvements (i.e. materials, design concepts, active controls),
a forecast was made of a 10-percent weight savings taking the improvements col-
lectively. The impact of these technology improvements is illustrated in
Figure 20-1.
Also shown on the figure are weight and performance trends resulting from the
advanced technology assessment of this study (designated far-term) and the
Task I results (designated near-term). The shaded band represents the potential
improvements by application of advanced materials and concepts. The takeoff
weight is approximately 100,000 pounds less, and the range increases 500 nautical
miles.
¢
20-2

TAKEOFF
WEIGHT
1000 LBS
1000
900
TODAYS
TECHNOLOGY
700
ADVANCED
STRUCTURES,
MATERIALS,
& CONTROL
SYSTEMS
600
50O
25 30 35 40 45 50
RANGE _ 100 N.MI,
Figure 20-1. Structures, Materials, and Controls Impact
DESIGN APPROACH
Projected composite development trends predict the availability of improved
stable high temperature resin systems such as thermoplastic polyimides or high
temperature polyaromatics, large numerically controlled tape laying equipment,
filament winding and pultrusion equipment, and larger autoclaves.
To arrive at projections for airframe structural mass for the advanced technology
supersonic cruise aircraft, the results of the Task I Analytical Design Studies
were used to size specific point design regions. The sizing data included the
internal loads and stiffness requirements of the various airframe arrangements
(i.e. chordwise stiffened, spanwise stiffened and monocoque designs). A com-
parison was then made with the minimum weight all-metal design to similar designs
in graphite or boron composites.
2o-3

Basic section weights were taken as the basis of comparison since nonoptimum
factors resulting from advanced manufacturing techniques used for the near-term
aircraft (e.g. welded design) assembly are offset by a bonded composite structure
havir_g approximately equal utilization of mechanical fasteners. Further, histor-
ical data for composite assemblies of the size and type considered are not
available.
The use of composite materials to the extent considered in this study is dependent
upon two restrictions related to the materials themselves. First, it was assumed
that high service temperature capability polyimides would be available and that
the material system could be processed with far less difficulty than 1974 polyimide
resin systems. Processing of currently available high temperature systems w$uld
increase the complexity of assembly fabrication greatly. Second, it was premised
that for the sake of economy, assembly sections were large and automatically pro-
duced. However, the time required for lamination, handling of such a large
vol_me of material (by machine or otherwise), and the molding of part or assem-
blies of the sizes required offer problems which have never before been faced.
Materials
Design Properties - Considering the 1980-1990 time period, adjustments were made
in the material properties to reflect improvements anticipated for these materials.
In making the adjustments, no great revelations have been forecasted. Rather,
it has been assumSd that as a minimum, current inconsistencies in the material
properties would diminish through refined processing. As a general guide, the
1980-1990 design values where obtained by assuming these values equal to the
1972-1973 mean property values. The resulting values for boron/polyimide and
graphite/polyimide are compared to current values in Table 20-1. The data reported
in Reference 3 provided the basis for the design values of both time periods.
No distinction has been made for room temperature and elevated temperature prop-
erties since, for the elevated temperatures of interest to this study, any var-
iation in significant properties is within the accuracy of forecasted values.
Figures 20-2 and 20-3 presents comparative extensional modulus (E ) and shearxx
modulus (G ) data for boron-epoxy, boron-polyimide, graphite-epoxy andxy
graphite-polyimide. The data are room temperature properties for various percentage
• /
20-4

TABLE20-I. CO_,_OSITE DESIGN PROPERTIES FOR THE 1980-1990 TI_E PERIOD
MATERIAL
SYSTEM
TIME PERIOD
PROPERTY
E 1 106psi
E2 106 psi
G12 106 psi
w12
v21
_'1 10 .6 in./in./F
_'2 10-6 in./in./F
ULTIMATE STRAINS
el(T) 10 .6 in./in.
C2(T) 10 .6 in./in.
1 (C) 10 .6 in./in.
(2(C) 10 .6 in./in.
Y12 10 .6 in./in.
P Ib/cu in.
PLY THICKNESS (in.)
BORON/PI GRAPHITE/PI
1975 1985 1975 1985
32.2
2.0
0.80
0.31
0.019
2.8
15.0
6,340
2,560
7,100
4,700
15,000
32.2
2,0
0.8
0.31
0.019
2.8
15.0
7,500
3,000
9,750
9,750
15,000
22.8
1.98
0.71
0.33
0.029
-0.17
9.45
7,100
4,400
6,700
8,250
15,000
r,,,
0.072 0.056
0.0055 0.007
22.8
1.98
0.71
0.33
0.029
-0.17
9.45
8,250
4,950
8,250
8,250
15,000
9-5

lO
8
4
BORON/POLYIMIDE J
o 1o 2o 30 40 50 60 70 80 90 100
% +45 ° PLIES
Y
"X_ + 1.5° uo°
//_X_ 45°
0 10 20 30
R()OM 'TEMPERATURE=
] , , .
I INOTE: Gxy IS INDEPENDENT OF % AT0 °
i i40 50 60 70
% +---45° PLIES
AND % AT 90 °
80 90 100
Figure 20-2. Extensional and Shear Modulus for Boron/Epoxy and Borcn/
Polyim±de
2o-6

I .- _i _z_
XX
UJ
24
0
Exx
0 10 20 30 40 50 60 70 80 90
% +-45 ° PLIES
100
4
,B
3
r_
J
J
R()OM TEMPERATURE
HIGH STRENGTH GRAPHITE/EPOXY _
*1
00 10
Figure 20-3.
20 30 40 50 60 70 80 90 100
% +-45°PLIES
Extensional and Shear Hodulus for Graphite/Epoxy and
Graphite/Polyimide
2o-7

of ±_5-degree !ayup or combination of ±45-degree and O-degree plies. Improvement
in the polyimide material system properties are sho_rn by the trends presented.
The thermal stress potential as measured by the product of the modulus of elas-
ticity and coefficient of expansion is presented in Figure 20-4 versus percent of
±45-degree plies for the boron-polyimide and graphite-poiyimide material systems.
The potential for very small thermal stresses are noted by the near-zero E_ forx
the graphite-polyimide system. For comparison purposes, the Ee for titanium alloy
6AI-hV is also indicated. This figure does not reflect the thermal stresses that
exist in an unrestrained cross-plied composite material due to change in temperature
and due to different coefficient of ex[?ansion, which does not occur in titanium.
Figure 20-5 presents specific stiffness data for both the B/PI and Gr/PI as com-
pared to the reference titanium system. Four-fold improvement in properties are
indicated for both composite material system with the most significant improvement
offered by the boron-polyimide material system. For buckling critical design,
similar trends are indicated because of the improved modulus to density ratio.
P_'otective System - It is recognized that composite materials require provisions
for protection beyond that of all-metal counterparts. In particular it is
desirable to protect against degradation by aggressive environments such as
electrical hazards, erosion, impact, and weathering. The basic external pro-
tective system arrangement ass'_ed for this study is illustrated in Figure 20-6.
For lightning and static electricity problems the optimum_ protection, weight, and
producibility is offered by the aluminum wire mesh. Two wire-mesh configurations
have been provided. All exterior surfaces are to be covered with 200 x 200 mesh
except the edge sections where 120 x 120 mesh is to be applied. The 120 x 120
mesh was selected for the leading edge to improve heat dissipation for this area.
Additional composite protection is provided by an electrical insulating barrier
consisting of one ply of 120 glass laminated between the laminate and the aluminum
wire mesh. The 120 glass barrier ply and the aluminum wire mesh are cocured with
the resin from the 120 glass, bonding the mesh to the composite. The wire mesh is
connected to metallic substructure to provide a path for electrical discharge.
4
, J
20-8

| - .
E
E
m_m_
t
w
7O
6O
5O
40
3O
10
Ea x
MULTIPLE
LAMINA
(0/+- 45)1
Ea
Eay ........... -.-
Ea Y
Gr/PI
,_J
B/PI
B/PI
Gr/PI
_l Em
6AI-4V TITANIUM ALLOY:
E a x = E ay = 92.5psi/F
--lq .........
0 10 2O 30 40 50 60
PERCENT + 45 PLIES {01+45 LAMINATES }
Figure 20-h. Comparative Thermal Stress - Titanium vs Composite Materials
2o-9

w
_D0
g
Z_JC_
0
zm.J
cDLm00w
c_
90O
800
B/PI
450
400
70OGr/PI
600
5OO
400
300
200 E/p TITANIUM 100
IO0_B, BUCKLING COEFFICIENT = OcrX (b)2
5O
00
Figure 20-5.
020 40 60 80 100
PERCENT +45 ° PLIES (0°/45 ° LAMINATES)
Comparative Bu@kling Efficiency and Specific Stiffness
for Borom/Polyimide and Graphite/Polyimide
20-i0

m
i
f 15.,LSPAINTI [ ,S.,_SPA,NT
f _X_AL.ES.l [ ,20XI_AL.ES.
f ,20GLASSI I ,_GLA_
I LA"'NATEI I _A"'NATE
GENERAL PROTRUDINGTIPSSURFACES AND EDGES(0.045 LRIFT2) (0.081 LB/FT2)
I
]
J
Figure 20-6. Surface Protection System for Composite L_inates
STRUCTURAL
ARRANGEMENTS
WING
CHORDWISE
STIFFENED
WING
_N_O_
FUSELAGE
SKIN_TRINGER
ANDFRAME
SURFACE
PANEL
I
IIlllllllllllfl
BASIC CONCEPTS
SUBSTRUCTURE
SPAR RIB WEB
TR U $ S WE B
m
FRAME
Figure 20-7. Composite Wing and Fuselage Design Concepts
20-11
F

Other protective measures include coating all surfaces with a polyurethane system
(more desirable, higher service temperature systems are anticipated by 1985) seal-
ing all cut edges, and wet installation of fasteners. The amount of protection
required varies with the component location, with the greatest care required for
leading-edge structure. Maximum protection, therefore, is assumed for these areas.
Design Concepts
The primary load carrying composite concepts for the far-term supersonic cruise
aircraft design explored both biaxially and uniaxially stiffened surface panels.
The concepts examined were variations of those evaluated in Task I, thus, the
internal loads calculated for the Analytical Design Studies were directly applicabke
to this technology assessment study.
Figure 20-7 presents the basic design concepts evaluated for both wing and fuselage
designs. All wing surface panel concepts are smooth skin designs and exploit the
low coefficient of expansion characteristics, especially inherent in the graphite-
polyimide system. For the fuselage, the more conventional skin-stringer and frame
designs are evaluated. Further amplification of design variations are discussed in
Table 20-2 and pictorially displayed in Figure 20-8.
Point Design Regions
Representative structure was specified at selective wing and fuselage regions.
Analysis of the selected regions are performed to establish unit weights which are
employed to establish total airplane weights.
Wing Point Design Regions - The location of wing point design regions are shown in
Figure 20-9 and include the 3 regions which are displayed on the wing #lanform of
the structural model. Point design regions are identified by the corresponding
NASTRAN panel element nllmbers. Representative structure is specified at each of
these locations and include a definition of the upper and lower surface panels,
typical rib and spar structure, and the associated non-optim'_m factors. These
regions were selected as representative of wing critical design regions. A
description of these regions is as follows:
20-12

TABLE20-2. MERITS OF POTENTIAL ALL-cO}.'_OSITE CHORDWI:SE STIFFENED
DESIGN-CONCEPTS
CONCEPT A - CORRUGATED HAT STIFFENER
PROVIDES GOOD COMPRESSION EFFICIENCY, ESPECIALLY WITH EXTRA UNIDIRECTIONAL MATERIAL
APPLIED IN HAT CROWN ELEMENT. CLOSED STIFFENER PROVIDES EXCELLENT TORSIONALRIGIDITY AND LATERAL STABILITY PROPERTIES.
CONCEPT B - POINTED HAT STIFFENER
ALLOWS EFFICIENT PLACEMENT OF COMPRESSIVE MATERIAL, BUT REPRESENTS A REDUCTION IN
LATERAL STABI LITY FOR A CLOSED SECTION STI FFENER. SPAR CAP INTERFACE REPRESENTSWEIGHT PENALTY.
CONCEPT C - ROUND HAT STIFFENER
ALTHOUGH A ROUNDED SECTION REPRESENTS ADDED BUCKLING STRENGTH, THE INCREASE IS
THOUGHT TO BE LESS FOR A LAMINATED COMPOSITE ELEMENT RELATIVE TO A CIRCULAR METAL
STIFFENER. MANUFACTURING DIFFICULTIES AND SPAR CAP INTERFACE REPRESENTS ADDITIONALPROBLEM AREAS.
CONCEPT D - HONEYCOMB STABILIZED HAT STIFFENER
THE RIGIDITY OF THE HONEYCOMB PRESENTS TOLERANCE PROBLEMS IN BOND AND CURE OF THE
PANEL. THE CORE/SKIN INTERFACE UNDER THE HAT REPRESENTS A "HARD SPOT" RESTRAINING
SMOOTH EXPANSION AND CONTRACTION, ESPECIALLY FOR BORON-POLYIMIDE MATERIAL.
CONCEPT E - TEE STI FFENER
FOR LIGHT WEIGHT COMPOSITE PAN ELS, TEE STI FFENERS OF MULTIDIRECTIONAL LAYERS REPRE-
SENT A VERY WEAK TORSIONAL STABILITY CAPABILITY. TOTAL SKIN THICKNESS INCREASEDRELATIVE TO A CLOSED STIFFENER LAYOUT.
CONCEPT F - BULB STIFFENER
ALTHOUGH COMPRESSION EFFICIENCY IS ENHANCED BY THE JUDICIOUS PLACEMENT OF A BUNDLE
OF UNIDIRECTIONAL FIBERS, HERE AGAIN TORSIONAL RIDIGITY AND LATERAL STABILITY SUFFERS.
ALSO, SPAR CAP INTERFACE WEIGHT PENALTIES WILL RESULT.
20-13

w/ u.
/ I °*
0
J
f_ Ix
Zu.iu.
I-
u "r
n,0(3
w
8 _,
ar
wI- w
8 _I-
r_
u.
N
0
0
20 -3.4
L
r_0
!i,8
4-_
#4(D
0
.._-_1
r_
,--t
I
°_
u_
rd0.)
°r-t
4-_
eA
.r4
%o
r...)
!
0oJ
0
bO

FS2640
FS FS Ils_ z_51
Fs ,s I ,s I1382 1865 I 2485 I I
I I1/= I11- ,_ - ---t-'r-r-r- r_ - ._o
/l I 1 / I I
:- II I I 1,12.;?:_ BL._ __'Fl.i - i i i i ...i i i BL125
40536
_ INky _/_!_.._ eL232
BL 406
BL 470
fR'_ INITIAL SCREENINGBL 522
k_2 / BL 594
D DETAIL CONCEPT ANALYSIS
F_ _o2560
Figure 20-9. Definition of Wing Point Design Regions
i I IFS FS FS
4.064 19.05 _ 5080
11601 (750) "- ,., . I2000)
Figure 20-i0. Definition of Fuselage Point Design Regions
20-15
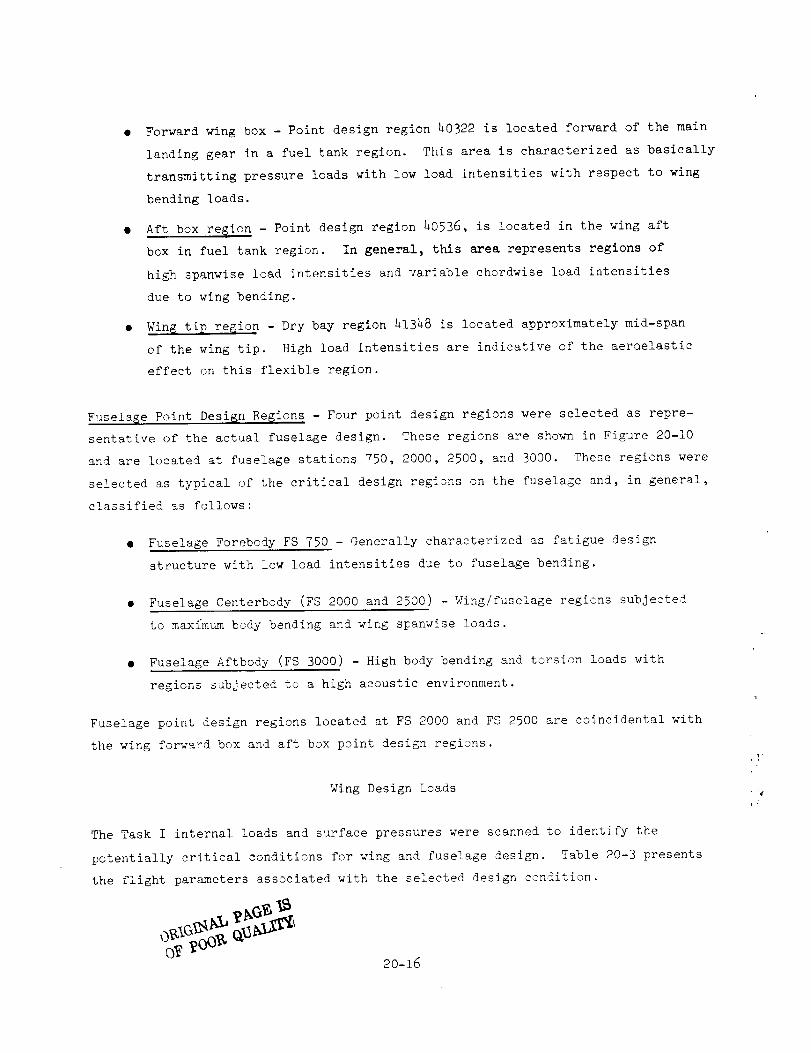
• Forward wing box - Point design region h0322 is located forward of the main
landing gear in a fuel tank region. This area is characterized as basically
transmitting pressure loads with low load intensities with respect to wing
bending loads.
• Aft box region - Point design region 40536, is located in the wing aft
box in fuel tank region. In general, this area represents regions of
high spanwise load intensities and variable chordwise load intensities
due to wing bending.
• Wing tip region - Dry bay region 41348 is located approximately mid-span
of the wing tip. High load intensities are indicative of the aeraelastic
effect on this flexible region.
Fuselage Point Design Re_ions - Four point design regions were selected as repre-
sentative of the actual fuselage design. These regions are shown in Figure 20-10
and are located at fuselage stations 750, 2000, 2500, and 3000. These regions were
selected as typical of the critical design regions on the fuselage and, in general,
classified as follows:
• Fuselage Forebody FS 750 - Generally characterized as fatigue design
structure with low load intensities due to fuselage bending.
• Fuselage Centerbody (FS 2000 and 2500) - Wing/fuselage regions subjected
to maximum body bending and wing spanwise loads.
• Fuselage Aftbody (FS 3000) - High body bending and torsion loads with
regions subjected to a high acoustic environment.
Fuselage point design regions located at FS 2000 and FS 2500 are coincidental with
the wing forward box and aft box point design regions.
Wing Design Loads
The Task I internal loads and surface pressures were scanned to identify the
potentially critical conditions for wing and fuselage design. Table 20-3 presents
the flight parameters associated with the selected design condition.
20-16
• "4
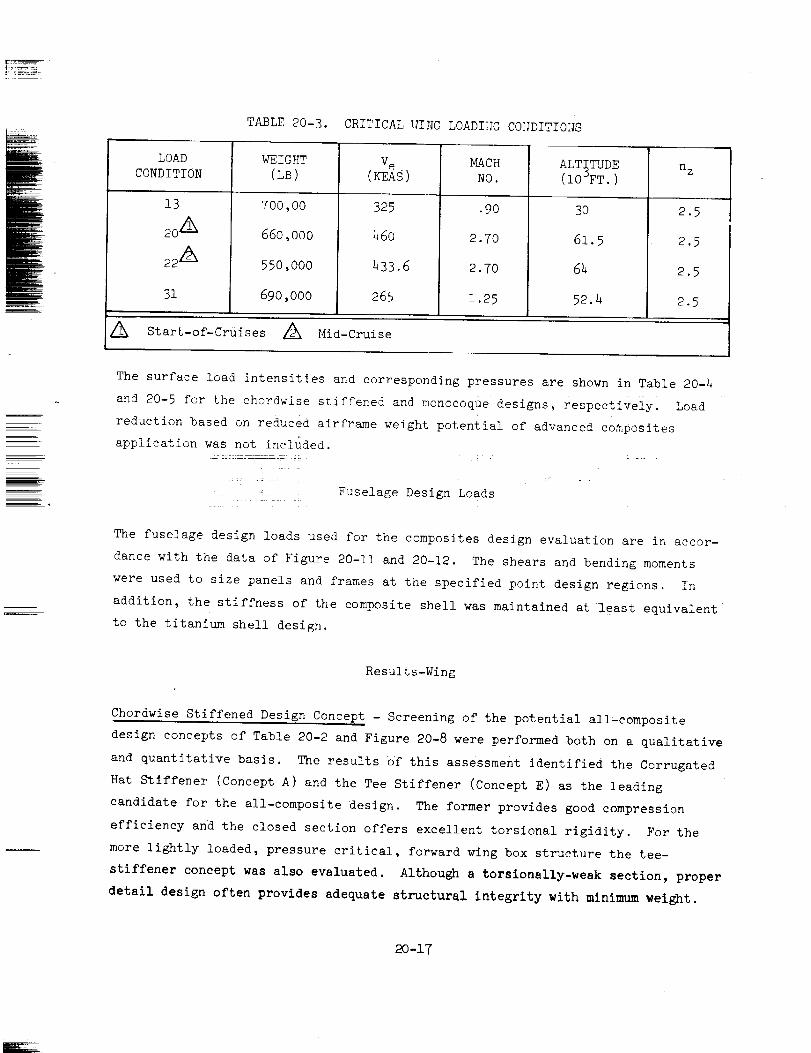
TABLE 20-3. CRITICAL _gING LOADIHG C0:;DITIONS
LOAD
CONDITION
13
2oZ_
22 A
31
WEIGHT
(LB)
700,00
660,000
550,000
690,000
325
46O
433.6
265
MACH
NO.
.9O
2.70
2.70
1.25
ALTITUDE
(IO-'FT.)
3O
61.5
64
52.4m,,
/_ Start-of-Cruises A Mid-Cruise
n Z
2.5
2.5
2.5
2.5
The surface load intensities and corresponding pressures are shown in Table 20-4
and 20-5 for the chordwise stiffened and monocoq_e designs, respectively. Load
reduction based on reduced airframe weight potential of advanced composites
application was not included.
Fuselage Design Loads
The fuselage design loads used for the composites design evaluation are in accor-
dance with the data of Figure 20-11 and 20-12. The shears and bending moments
were used to size panels and frames at the specified point design regions. In
addition, the stiffness of the composite shell was maintained at least equivalent
to the titanium shell design.
Results-Wing
Chordwise Stiffened Design Concept - Screening of the potential all-composite
design concepts of Table 20-2 and Figure 20-8 were performed both on a qualitative
and quantitative basis. The results of this assessment identified the Corrugated
Hat Stiffener (Concept A) and the Tee Stiffener (Concept E) as the leading
candidate for the all-composite •design. The former provides good compression
efficiency and the closed section offers excellent torsional rigidity. For the
more lightly loaded, pressure critical, forward wing box structure the tee-
stiffener concept was also evaluated. Although a torslonally-weak section, proper
detail design often provides adequate structural integrity with minimum weight.
20-17

E-4
!
E_
Z
A
z_2
E-_
O
C.)
0
O
cD
03
IOOd
i-3
ZO
ILl
Z
I--Z
OQ,,
1.1,1 '_"
O O ,---I
O
0-I
-I
, ,
_d
It') i.o,- m _
O
ZO
I--
00
<0-.I
• , . e_ • °
>.x _. X
Z Z Z =.
>.x >. x
_' _ Z '*'
0@,I
(.D
(.D
i!ii}iiiii} iiiiiii}i}i!iii ili}i!iiii!iii i!! i i ! i
¥ _,
=
=
Z Z Z _.
x >. _"Z Z Z _.
illI--0Z
(,_<
l-,=luJ0Xl.,iJ
LU0
IIl*r
(4
.I
l.i.
0Z
LU
ill
>uJrr
¢
ORIGINAL PAGE ISOF POOR QUALY/_
2o-_8

I
E_z
r_
o"o
ozo
o
c0
o
cor_
io
z0
2:
D.
ec"W
0..I
iiiii_!:!!,ii_iiiii;!'!i!ii:i'i_i_i:i!iiiiiii_iii!iiiii_ii!_i_ii:!!_ii!i
,..I
o
INS
P,, (D
..I
• 0 . • . •
I.i.II.-0Z
,<
l-.-
ILl
X
,<
#.n
oZ
>
20-Z9
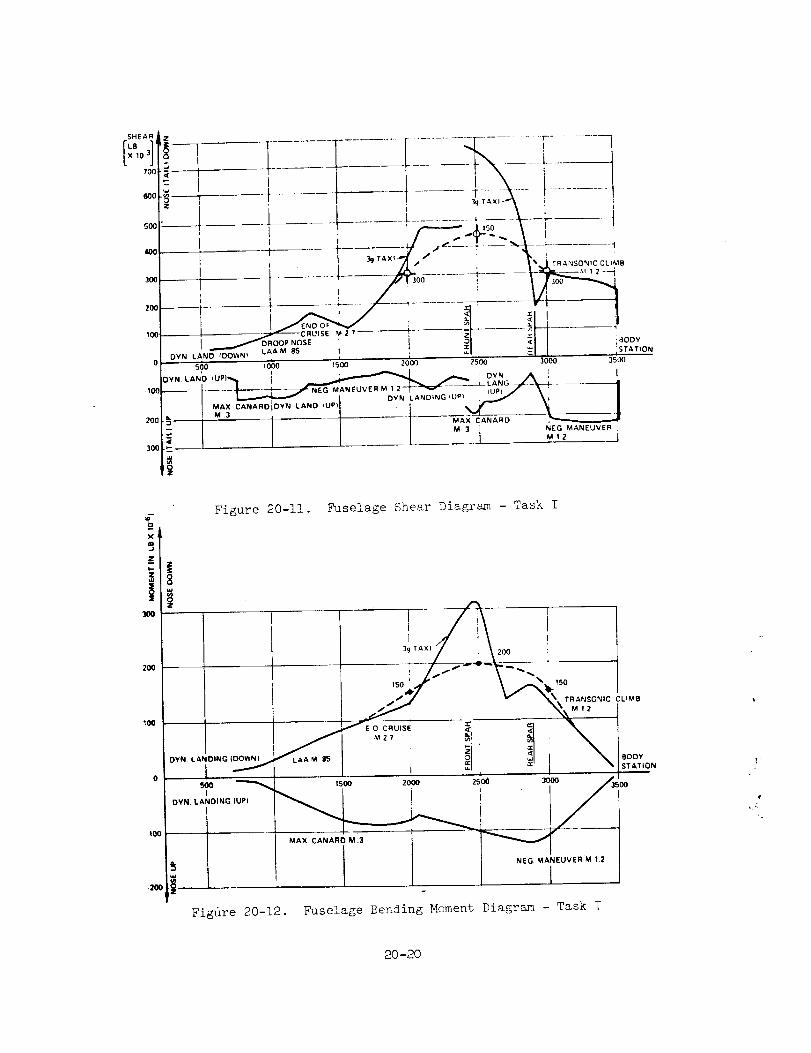
SHEAR
X 10
7OO
_0
5_
2_
0
200
300
Z
-- _--_ 300-.... --_ _c
I o.ooPNOSE ! I ol 'OVNLAND'DOWNL_A _ I _ --1; _.
....... i
I
L T_ _SONIC CLIMB
) t}ODY
iSTATION
500 1000 15OO 200_} 2900 000 35OO
_VN LANb {U_l_, i _ _ " DYN " , I
-'Tv-__Tnlr._ _Ar_cuvt:_a _.: ] v iUPl / I J.... _ [ DVN LANDING IMP1 • _ _, I
L I _IA_MAXCANARD [DVN LAND IUP) " l _" _1__ , /
:_ I | M-AX CANARD
-" I I I / M] i NEG_ANEUVER.
!l,z
|
2OO
tOO
I OYN LANDING (_o t,
I
Figdre 20-12.
Fi6ure 20-11. Fuselage Shear Diagram - Task I
]! I"A 200
_..j'_"_E 0 CRUISE ,_] El "_ 1
/""3 -_,--- _!, _I_ \ I
_; = i "I -A''°NMAX CANARD M 3 __ 35_00
I NEG. MANEUVER M 121
Fuselage Bending Moment Diagram - Task I
¢
20-20

Figure 20-13 presents a layout of a typical section of the wing for the chordwisestiffened design. Representative truss and bulkhead spars are indicated. Botha honeycomband corrugated bulkhead-type spar/rib webare conceptually sho_m. Asummaryof the compositewing surface panel designs are show_in Table 20-6. Thegeometryand layup for the hat-stiffener for point design region 20322and 20536
are presented. For both the boron-polyimide and the graphite-polyimide materialsystem, the samegeometryis used for a given region. The ply thickness anddensity of the graphite and boron material varies thus resulting in slightvariations in equivalent panel thickness and panel unit weight. The detail
o
geometry for the tee-stiffener design indicates the reduced efficiency and
thus higher unit weight by approximately 40-percent.
The substructure sizing results are displayed in Table 20-7 for the graphite-
polyimide material system at point design region 40322. The details of repre-
sentative substructure components (i.e. spar caps, rib caps, spar and rib webs)
are tabulated. The geometry and layup orientation employed in the design are also
shown. Proportionate unit weights were developed for the boron-polyimide sub-
structure at the various point design regions.
Monocoque Design Conce_t - For the monocoque design only the honeycomb sandwich
was evaluated. The design of the sandwich panel was based on laminated face skins
of boron-polyimide and graphite-polyimide composites with a titanium alloy core.
Condition 13 was critical for point design 40322 and condition 31 critical for
both the aft box and tip box structure regions.
Figure 20-1h presents a layout of a typical wing section employing the honeycomb
surface panel design. Although a total honeycomb system is pictorially displayed,
the substructure weights are for representative truss spar/rib and corrugated
spar/web designs. The details for the wing surface panels are shown in Table 20-8
for the B/PI and Gr/PI designs. The resulting panel unit weights include a
protective system weight of .O45-1b per square foot.
For the truss spar and rib design, a cruciform configuration was adopted in lieu
of the tubular section used for the metallic design. The composite cruciform
member was sized to yield a greater cross-section "El" at the same column length
as its titanium counterpart. Comparative data is shown in Table 20-9 for the
titanium truss tubes and the composite section. A weight saving of approximately
ORIGINAL PAGE ISOF POOR QUALITY

- ¢
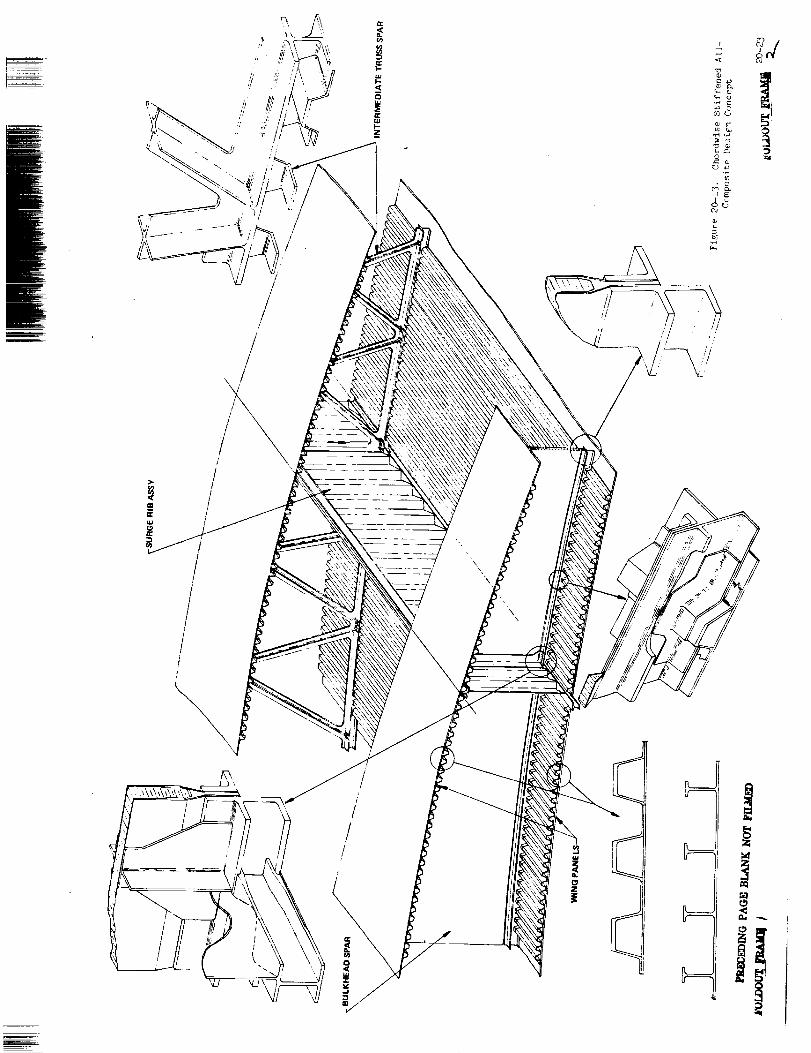
_7
7_'_ _ .. ,, II \_-7 z_
_._7\!.iY_,,z/\'_ ,i I •
t
/t
/
_m
i/!
i!
iit#
ii
/!
!
i1/
ii i
t0
I0
\,\
"\
\,,
g
i !I
_
E
/
iZ
i
°i


N
J
LM
O
ZtM
w..JIM
+I
N4_C'_ mO1:t
O -- Z
°
" t
o 0
÷I
c_ I '-!
c_ I "
o
o e-
÷I
oo
0
O ,-
+I
O O
W
PRECEDING PAQ_ BI_K NOT
uJ
mI-_JUJ
0
_a
r_
.J_JZ
v
H
H
H
o
or_
o
Io
20-25

C'_
0
H
H0
I
r_3
tm
u3
i--..i
o
I
60,t
E-_
<
<
_ _ d o d e_ d
• , , . o ,
A = _ 0o
• ° ,
0 0
, , 00 0 0
U)
o o . . . •
OI
Z0
<
Z_ul
0
O,
Z
_u
_ N,1
a. 0
0 0
<U
nr
<
6" o
<U
0 0
<,,,
<r,-,
,T,
n-
O
>.
>...4Q.
I-...J
Z
<
n-
O
_QiJ.l
0-ri-
0u.
r_ILlI--<
ZLLI
Oz
-,r
,.n,
m
<
¢

m
/!
//
//
///
/
\
el"
I--
8IE
I..-
_z
\\
\\
\
ZC_
l-
I-
_z
-I
i-i
Z
.J
m
LLI
0
,,oi


m_
m_3,-3
Z<
L)<
r_
_Q
0Z
CF0L;0
0
E_
0
0
0
U_
I0C_
20-29 PRECEDING PAGE BLA_E NOT FIeldED
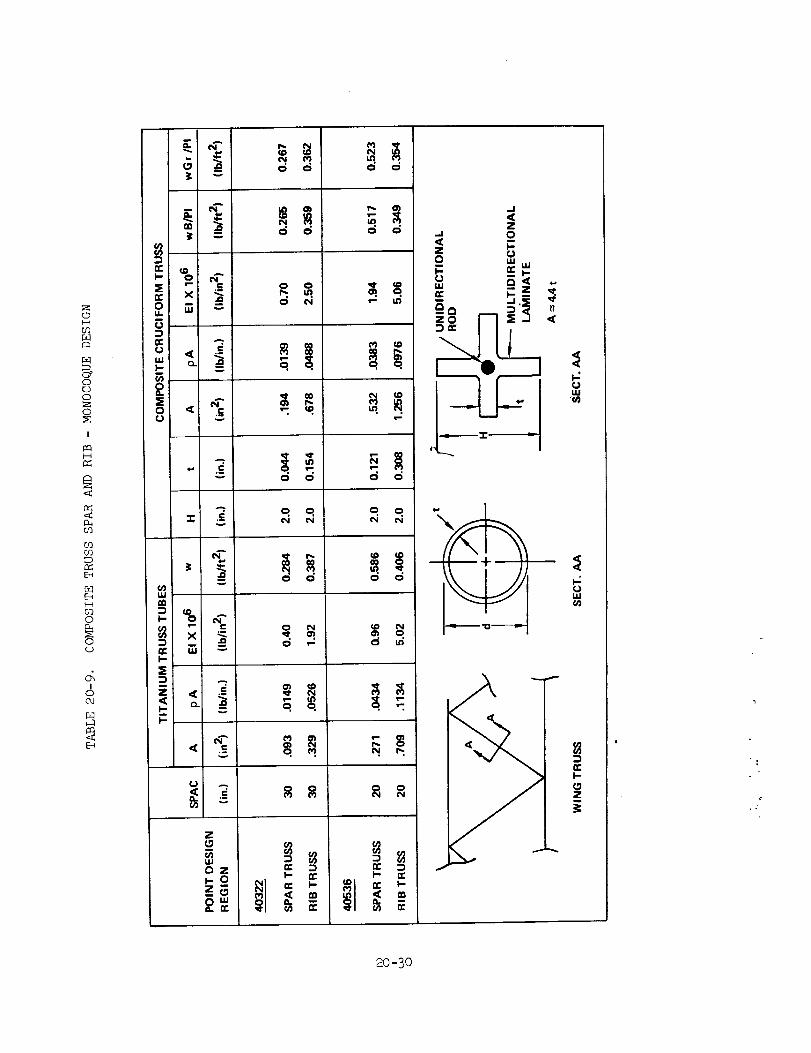
c_b
Q
0
Q
I
H
o
I
i,. q- (_
x _ d
_i _ i _o., .7_ _
a. .a o
az _
_°_l _
e_ e_
oe_
'i
I
0 w
_, _r ii
_ "
i
, •
¢
_o-3o

m
m
6-percent is realized over the titanium alloy design. Note the unidirectional
rod used in the center of the crucifor_ for achieving a high _EA product.
The corrugated composite spar and rib webs were sized to provide a greater E_or
G_ than the tita_Tu_ a !They design. =_This approach offered reasonable pressure
(bending) and shear capabii_ty, respectively. _The overall corrugation dimensions
were retained for the composite webs. Table 20'10 presents the geometry data
developed for the circular-arc corrugated spar/rib webs for the reference titaniu_
alloy. The appropriate geometry for the 3 point design regions are sho_m. The
results of the composite spar web design at point design region 40322 is sho_T_
in Table 20-i_. The results indicate a weight saving of approximately 25-percent
when composite designs are employed. Since the cross section properties for the
spar and rib webs in regions 40322, L0536 and 41348 are off the same magnitude, the
regicn 40322 spar web weight saving factor was used to calculate the composite web
weights _n all three point design regions as shown in Table 20-12.
Table 20-13 presents a comparison of unit wing weights for the 3 point design
regions for the chordwise stiffened hat section _esign a_t_e monoc0que honeycomb
sandwich design. The unit weights for the surface panels and individual sub-
structure components are shown. The minimum weight design for each point design
region is identified by the cross-hatching. Trends simila_ to the metallic design
are noted, with the chordwise stiffened being least weight for the lightly loaded
forward box region (40322) and the honeycomb design being least weight for the
highly loaded aft box and stiffness critical tip box structure. These unit
weights are applied to establish the total wing weights for the advanced technology
aircraft.
Results - Fuselage
The assessment of the potential payoff for composite technology application
to the primary shell structure was made observing practical constraints for
passenger accomodation. The two major factors included: (1) the need for
passenger windows and (2) the requirement for ingress and emergency egress.
It is foreseeable to arrive at a "windowless" aircraft with an aesthetic mural for
the interior design for an advanced technology supersonic transport. This would
provide further opportunities to exploit fully the san_wlch shell design or shell
20-31
E

0
H
rJ
!
C_
5O3
(Dr._
r_3
I
r..)
!0OJ
>-
W
oW
c0_
0
v
I=
I,D0
v
v
A
"0
v
z
_zo
,%
/// \
z
,.,I ILl
U
_!" ¢D
0 0
0
0 0
(D _'N
0
0 0
N,-. N,0 0
_8
0 0
UJ
U)
0
0 0
0
0 0
, o
o o
_8 • -¢
20-32

m
m_
mm
C
H0
I
<
<
0
I
r..3
r_
rj3o
or...)
r--II
OOJ
£_
x_I'- W v
m
v
m A
_ X'_v
o
A _
z x_
i.U.
Z
_zwo
I-
p,.
f_O
ID
r_
o
o
o
o
N
O
O
m
°
_0-33
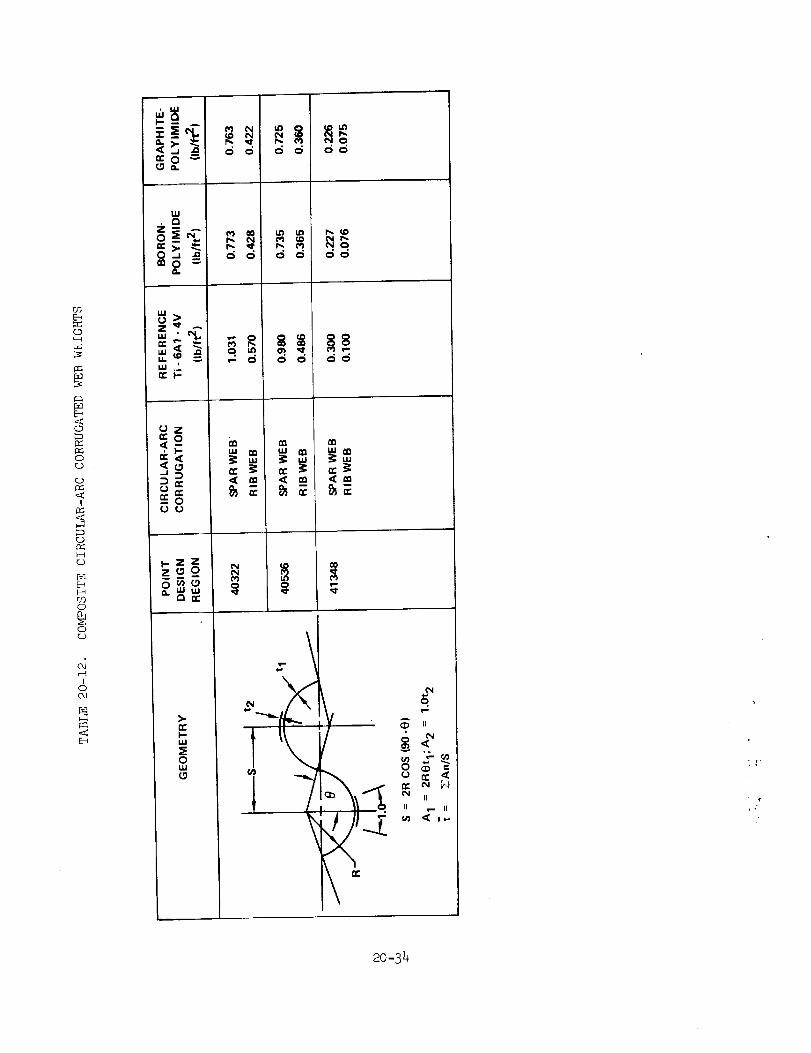
0
I
5r..)
MBF_U?0
0r..)
c_I
0OJ
E-t
_2
uJ
_0 " o c5 o _ oc5
-,-, m m
--0U U
_ZZ co_o _ _
n,-I--Ud
oU.I
L _ , ] ":
!r II II
20-34

mE
Z0
r...O
0
0
009
0r_)
rDH
I0OJ
20-35

structure optimization without a frame spacing constraint. However, to obtain
the design trends for this study, constraints for frame spacing of 20-inches
and frame height of 3.0-inches were observed. Furthermore, the aforementioned
constraints are consistent with the titanium skin-stringer and frame design
evaluated in Task I and a direct comparison can be made to relate more directly
the impact of composite utilization on the primary shell structure design.
The fuselage of the supersonic cruise aircraft is bending critical over most of
its length as depicted in Figure 20-12, with internal pressure dictating require-
ments for the shell structure design forward of FS i000. The basic concepts
employed to satisfy the design requirements are shown in Figure 20-7. The tee-
stringer design was adopted for the lightly loaded pressure critical forebody
structure. For the bending critical regions both the tee-stringer and hat-
stringer designs were evaluated.
For analysis, the fuselage shell was idealized as a circular shell as sho1_-n in
Figure 20-15. The figure further reveals the skin-strlnger and frame lamina
directions identified in the subsequent tables. The analysis results of the
fuselage cross section are identified by the notation of Figure 20-16; location
7 being representative of the lower centerline of the fuselage.
Tables 20-14 through 20-18 presents the sizing results of the design concepts
employing boron-polyimide and graphite-polyimide composites. For comparison,
the reference titanium shell properties are also indicated. In all cases the Et
is greater for the composite material systems.
For fuselage frame design both the I-section and channel section frames were in-
vestigated. Typical frame-stringer intersections are shown in Figure 20-17. The
figures indicate full depth frames with skin-flange continuity provided by integral
clips. Table 20-19 indicates the proposed channel frames and the idealized frame
employed for analysis. For composite application, a I0- to 20-percent increase in
stiffness is indicated at FS 2000 and FS 3000 with a corresponding reduction in
frame unit weights of approximately 20-percent, as shown in Table 20-20. To
determine the frame weights at FS 2500 the above weight trend was applied and
results tabulated.
J
20-36
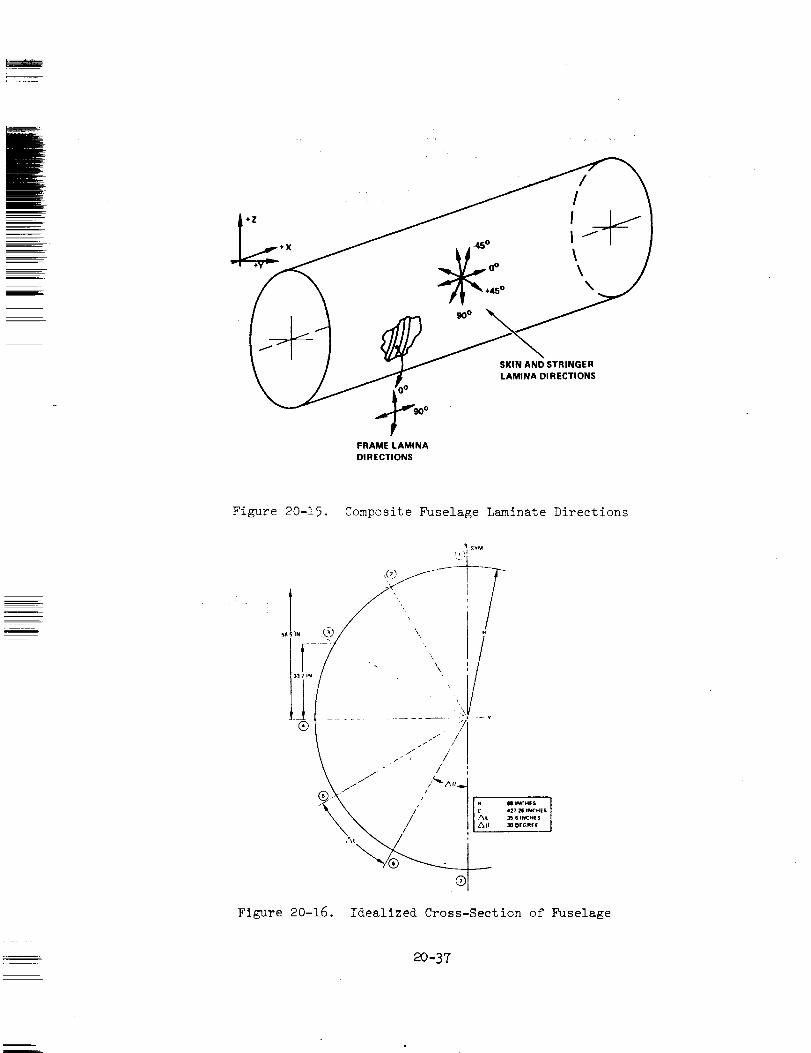
FRAME LAMINA
DI RECTIONS
Figure 20-15. Composite Fuselage Laminate Directions
_v_
®
, ...'" /7..! j1 /
I
0
Figure 20-16. Idealized Cross-Section of Fuselage
20-37

TABLE 20-1h. C0_4POSITE TEE-STIFFENED PANEL - FS 750
|
Il
4.0_I
I]
NO.
BORON-POLYIMIDE
ORIENTATION
08/_+454/904
3
Etx 106 ',lb/in)
pt (Ib/in 2)
+454
012/+454
b(in)
0.90
0.25
t(in)
0.088
0.022
0.088
2.10
NO.
GRAPHITE-POLYIMIDE
ORIENTATION b(in) t(in)
08/+454/904
+454
012/-+-454
1.92
.00756 .00745
- 0.112
0.90 0.028
0.25 0.112
REFERENCE TITANIUM: E_ = 0.92 x 10⁶ Ib/in; pT" = .009 Ib/in 2
¢
-38
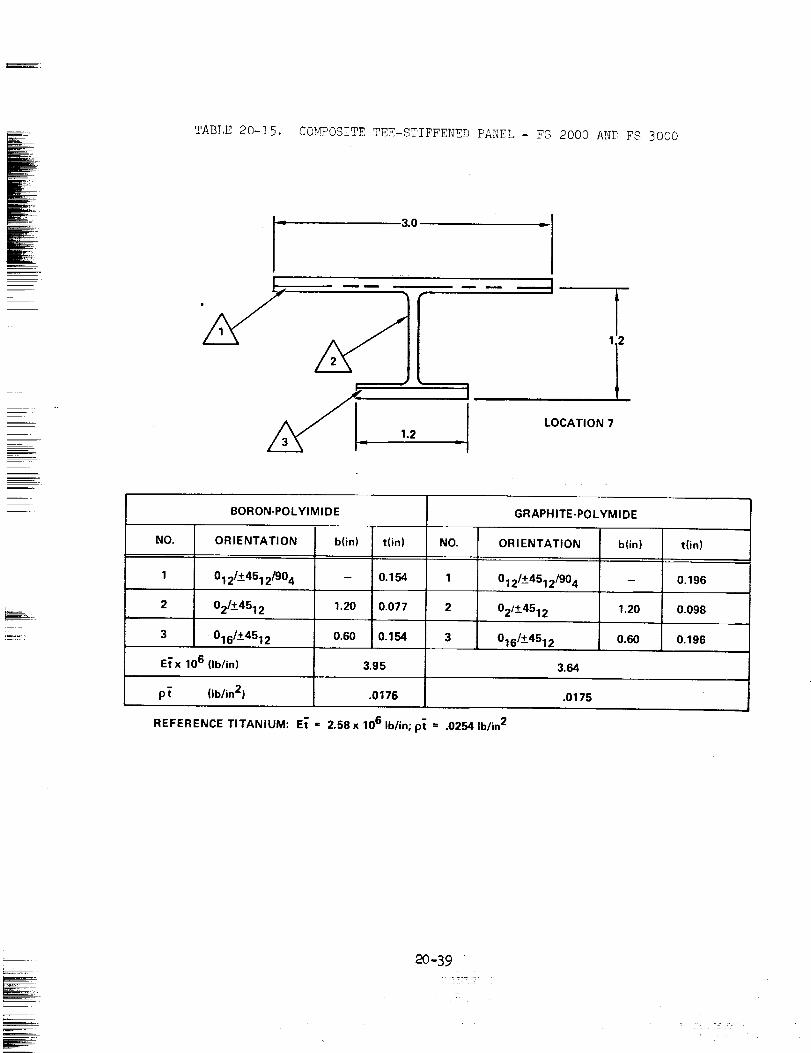
[TABLE 20-15. _cu_<°OSITE TEE-STIFFENED "D^'_:r"_T_i .... - FS 2000 AND FS 3000
]
LOCATION 7
BORON-POLYIMIDE
NO. ORIENTATION b(in)
1 012/+4512/904 -
2 02/+-4512 1.20
3 016/+4512 0.60
t(in)
0.154
0.077
0.154
3.95
NO.
1
2
3
GRAPHITE-POLYMIDE
ORI ENTATION
012/+4512/904==
02/+4512
016/±4512
b(in)
1.20
0.60
t(in)
0.196
0.098
0.196
E_x 106 (Ib/in) 3.64
Pt (Ib/in 2) .0176 .0175
REFERENCE TITANIUM: E_ = 2.58x 10⁶ Ib/in; pt = .0254 Ib/in 2
20 -39

TABLE 20-16. COMPOSITE HAT STIFFENED PANEL - FS 2000 AND FS 3000
1_ 5.0 "J1 I'- ,o .po -I
NO.
BORON-POLYIMIDE
ORIENTATION
012/+-4512/904
+-4512
-+4512
012/+4512
b(in)
1.15
1.15
1,00
t(in) N0.
0.154 1
0.066 2
0.066 3
0.132 4
3.14E_x 106 (Ib/in)
p t (Ib/in 2) .0161
REFERENCE TITANIUM: E_ = 2,58 x 10⁶ Ib/in; pt" = .0254 Ib/in 2
GRAPHITE-POLYMIDE
ORIENTATION
012/+-4512/904
+-4512
b(in)
1.15
t(in)
0.196
0.084
-+4512 1.15 0.084
012/+4512 1.00 0.168
2.91
.0160
• ¢
20 -40

J
TABLE 20-17. CO,'.'IPOSITE TEE-STiFFE._ED PA]'{EL - FS 2500
[_ 3.0
I=I
i]
LOCATION 7
T1.2
I
BORON-POLYMIDE
NO. ORIENTATION b(in)
1 016/+4512/904 -
2 02/+-4512 1.20
3 020/+-4512 0.60
t(in)
0.176
0.077
0.176
4.94
GRAPHITE-POLYMIDE
ORI ENTATION b(in) t(in)
016/-+-4512/904 - 0.224
02/+-4512 1.20 0.098
020/+4512 0.60 0.224
NO.
1
2
3
E_ x 106 (Ib/in) 4.53
p_ (Ib/in 2) .0200 .0202
REFERENCE TITANIUM: E_ = 3.06 x 10⁶ Ib/in; pt = .0302 Ib/in 2
====_
20-41
] - -- :

TABLE 20-18. COMPOSITE HAT-STIFFENED PANEL - FS 2500
BORON-POLYIMIDE GRAPHITE-POLYIMIDEr w
NO. ORIENTATION b(in.) t(in.) NO. ORIENTATION t(in.),r
1 016/+4512/904 - 0.176 1 016/+__4512/904 0. 224
2 +__4516 1.15 0.088 2 +_4516 0.112
3 1.15 0.088 0.112+4516
016/+4516 1.00 0.176
+_4516
016/+_4516
b(in.)
1.15
1.15
1.00
E{X 106 (Ib/in.) 4.04 3.73
p_ (Ib/in. 2) 0.0194 0.0192
REFERENCE TITANIUM: Et = 3.06 X 10⁶ Ib/in.; pt" = 0.0302 Ib/in. 2
0.224
20 -42
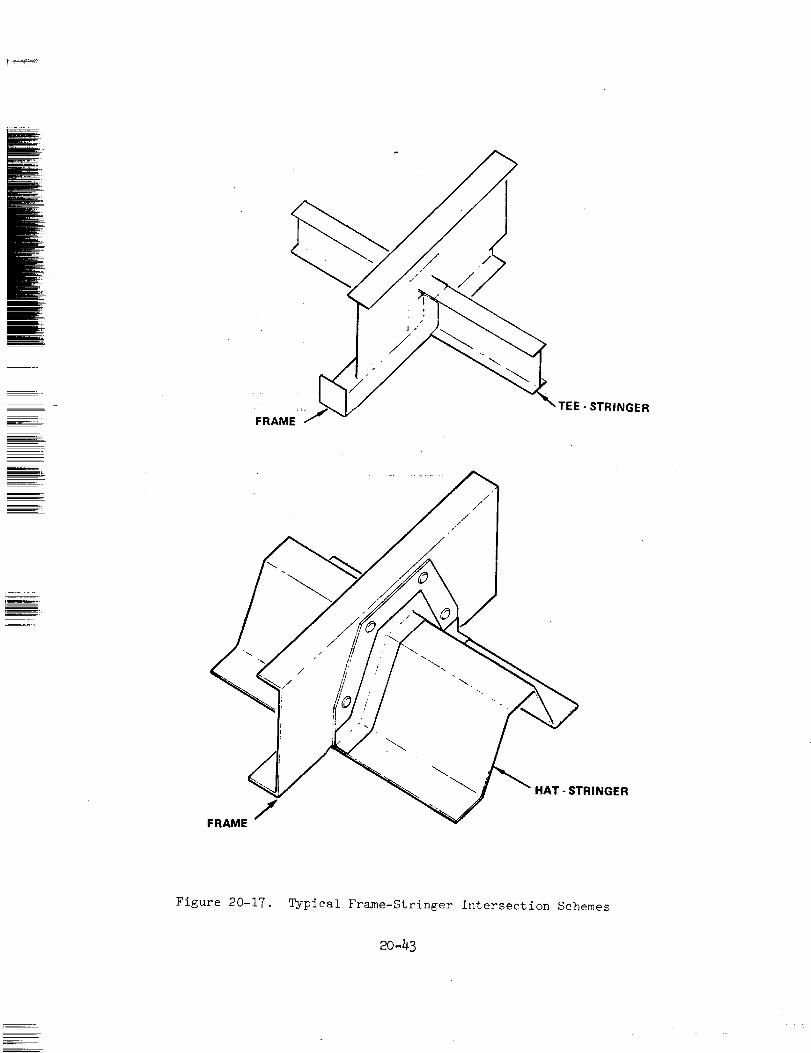
F AME TEE- STRINGER
FRAME / HAT - STRINGER
Figure 20-17.
Typical Frame-Stringer Intersection Schemes
2O-43

TABLE 20-19. COMPOSITE FUSELAGE FRAMES - FS 2000 AND FS 3000
[EIxx] REF-Ti "
_Ti "
8.75 X 10⁶ Ib-in 2
0.46 Ib/ft 2 X
I _ WEB- 20 PLIES
X
IDEALIZED
FRAME
CAP - 34 PLIES
BORON-POLYIMI DE.
1
2
3
:D
Elxx =
ELEMENT
1.0 X 34 X 0.0055
3.0 X 20 X 0.0055
1.0 X 34 X 0.0055
AREA
0.187
0.330
0.187
0.704
ORIENTATION
018/±4516
04/,+4516
018/'+4516
E X 106
10.88
6.36
10.88
[(10.88 X 10⁶)(2)(0.187)(1,5) 2 + (6.36 X 10⁶)(0.110)(3)3/12] = 10.73 X 10⁶ Ib-in. 2
EA X 106
2.034
2.099
2,034
6,167
pt" = (0.072)(0.704/20) = 0.00253 Ib/in. 2
GRAPH ITE-POLYIMIDE.
ELEMENT AREA ORIENTATION E X 106 EA X 106
1 1.0 X 34 X 0.0070 0.238 018/_+4516 7.60 1.809
2 3.0 X 20 X 0,0070 0.420 04/,+4516 4.74 1.991
3 1.0 X 34 X 0.0070 0.238 018/_+4516 7.60 1.809
T. 0.896 5.609
Elxx = [(7.60 X 10⁶)(2)(0.238)(1.5) 2 + (4.74 X 10⁶)(0.140)(3)3/12 ] = 9.63 X 10⁶ Ib-in. 2
p_" = (0.056)(0.896/20) = 0.00251 Ib/in.
¢
20 -44

TABLE 20-20. C@_IPOSiTE FR_E _'_TIGHTS
F.S. 2000 AND F.S. 3000
E Ixx WE IGHT
FRAME . Elxx INCREASE pt" w SAVINGSMATERIAL (106 Ib-in. 2) (PERCENT) (103 Ib/in. 2) (Ib/ft 2) (PERCENT)
TITANIUM 8.75 - 3.20 0.46 -
BORON-10.73 22.6 2.53 0.365 20.6
POLYIMIDE
GRAPHITE-9.63 10.1 2.51 0.362 21.3
POLYIMIDE
m_
F.S. 2500
Elxx ASSUMED
FRAME E Ixx INCREASE WT SAVINGS wMATERIAL (10 6 Ib-in. 2) (PERCENT) (PERCENT) (Ib/ft 2)
TITANIUM 10.94 - - 0.576
BORON-13.40 22.5 20.6 0.457
POLYIMIDE
GRAPHITE-12.05 10.1 21.3 0.452
POLYIMIDE
20 -45

The results of the fuselage skin panel and frame analysis are summarized on
Table 20-21. The resulting weight trends for both boren-polyimide and graphite-
polyimide composites are displayed for the panel concepts analyzed. Similar trends
as observed for the metallic design are indicated with the tee-stiffener being
least weight in the forebody and the hat stiffener design being least weight in
the centerbody and aftbody structure. The data includes an estimate for the
protection system weight of 0.045 Ibs. per square foot. Also shown on the table
is a sulm_ary of frame weight for the point design regions. The frame weights at
FS 750 were conservatively taken as being equal to the requirements at FS 2000.
MA_TFACTUR ING PLAN
The principal ass_mmption for producing the 1980-1990 advanced technology aircraft
is that polyimide resin systems will have developed to a point such that processing
can be accomplished with ease. Thus, the low cost manufacturing method now being
developed for epoxy processing were taken as feasible for polyimides. Restrictions
on such factors as laminated thickness, bond pressure, etc. were neglected for
this study.
Fabrication of ribs and spar caps as well as truss webs is accomplished by closed
mold processing with elastomeric tooling as a pressure generator (Reference 5).
Single stage molding and attachment of caps to truss or corrugated webs would be
performed by similar techniques.
Wing skin panels, honeycomb or hat stiffened, would be produced with large sheets
of material laminated by automated machines. Unit panels having dimension
i0 ft. x 20 ft. were asslnned. Since, for the most part, the wing skin gages are
small, it assumed that the hat stiffener would first be produced as trapezoidal
corrugation molded from a flat sheet. The hats would then be cocured to the skins
using removable expansion mandrels. Because of contour complexity, flexible
elastomeric tooling would be used extensively. The manufacturing sequence is
pictorially displayed _n Figure 20-18.
• .#
ORIGINAL PAGE IS
)F POOR QUAL_20-46

TABLE 20-21. C_POSITE FUSELAGE _JEIGHT SU!,_dARY
i
_J ±
l
m
_/-x_ TFUSELAGE SKIN PANELS |
REFERENCE BORON- GRAPHITE- BORON- GRAPHITE-
MATERIAL SYSTEM TITANIUM POLYIMIDE POLYIMIDE POLYIMIDE POLYIMIDE
w, UN IT WE IGHT Ib/ft 2 ib/ft 2 Ib/ft 2 Ib/ft 2 Ib/ft 2
F.S. 750
F.S. 2000
F.S. 2500
F.S. 3000
1.29
2.74
3.02
2.90
2.363
2.839
2.363
u
2.349
2.810
2.349
1.134
2.579
2,925
2,579
1.118
2.565
2.954
2.565
w n = [(pt'x 144)+ (0.045)]
FRAMES ] ]MATERIAL SYSTEM REFERENCE TITANIUM BORON-POLYIMIDE
w, UN IT WT. Ib/ft 2 Ib/ft 2
0.25
0.53
0.576
0.53
F.So 750
F.S. 2000
F.S. 2500
F.S. 3000"
0,365
0.365
0.457
0.365
]G RAPH ITE-PO LY IMI DE
Ib/ft 2
0.362
0.362
0.452
0.362
20-47

_LJJ
I--<
f_
U.0
<:CO-J u.I
0-r--i+_
©
°_-_
RD
0_:_ED
IC_c_
bD.,-j
• ¢
-48

. _m
E
iE
MASS ESTIMATES
The advanced technology assessment exploited an aggressive application of composite
mater] '- '_s t,_ the airframe of a far-term supersonic transport. The weight advant-
ages gained through the use of boron-poly]m_de (B/PI) and graphite-polyimide
(Gr/PI) composites in the wing box and fuselage primary shell were determined
through analysis of selected point design regions. The results of the advanced
technology transpc, rt (ATT) studies (Reference I) were used to establish weight
trends for the ether items. The comparison of weight trends for the far-term
advanced technology supersonic transport and the near-term aircraft defined through
indepth studies are s_m_marized in Table 20-22.
im
A significant improvement in the fuel fraction for the fixed-size and weight air-
plane is shown for an all-composite and a hybrid far-term design. The range is
increased from i_183 nautical miles to an excess of h600 nautical miles, holding
the payload constant at 49,000 pounds. ]_en this aircraft carries a space-limit
payload of 61,800 pounds (234 passengers x 200 + 1500 x i0) the range is approxi-
mately 4400 nautical miles. It is noted, however, that the fuel quantity in-
dicated on the table exceeds the design capacity of 399,000 pounds. Thus,
modification to the tank arrangement and capacity are required before a viable
aircraft with the aforementioned performance potential can be achieved.
Another approach to e_$it the weight advantages of composite application to the ;
far-term design is resizing as shown in Table 20-22. _ie all-composite and hybrid
design airplanes are resized to maintain a range_of h200 nautical miles with a
payload of 49,000 pounds. The wing loading, takeoff thrust-to-weight ratio and
fuel fraction are essentially held constant. For these cases, the taxi mass is
6h5,000 pounds and 641,500 pounds, for the all-composite and hybrid designs,
respectively. The wing area has been reduced to approximately 9300 square feet.
As indicated on the table, the Manufacturer's Empty Weight (MEW) has been reduced
from 301,513 pounds to 246,762 pounds for the resized aircraft. This reduction
of approximately 18-percent would result in a commensurate reduction in flyaway
cost.
It is interesting to note that the reduction in.structural mass between the near-
term all-metal design and the far-term hybrid design is 21-percent. This result
is consistent with the data of Reference i for the factors derived for the
i -
-49

TABLE 20-22. ADVANCED TECHNOLOGY AIRCRAFT _ASS COMPARISON (LB)
NEAR-TERM
ITEM
WING
STRUCTURAL BOX
"FIXED" WT. (L.E., T.E. ETC.)
TAIL
FUSELAGE
SHELL
"FIXED" WT. (FLT. STA., FAIRING, ETC.]
TASK I
INITIAL
109,600
11,340
41.000
TASK I
HYBRID
88,620
4,2.]41,352j
11,34o
42,688
[23.1.]19,540 J
ALL-COMPOSITE
FIXED
SIZE
LANDING GEAR
AIR INDUCTION
NACELLES
ENGINES
PROPULSION SYSTEMS
SURFACE CONTROLS
INSTRUMENTS
HYDRAULICS
ELECTRICAL
AVIONICS
FURNISHINGS AND EQUIPMENT
ECS
TOLERANCE AND OPTIONS
MEW
STD. AND OPER. EQ.
DEW
PAYLOAD
ZFW
FUEL
TAXI MASS
RANGE, n. mi.
WING AREA, ft 2
BODY LENGTH, ft
W/S, Ib/ft 2
WF U EL/WTo
30,400
17,800
4,900
44,600
7,000
8,500
1,230
5,700
4,550
1,900
11,500
8,300
1,980
310,300
10,700
321,000
49,000
370,000
380,000
750,000
4,025
10,822
297
69.3
0.507
30,400
20,755
5,616
51,124
7,310
8,500
1,230
5,700
4,550
1,900
11,500
8,300
1,980
301,513
10,809
312.322
49,000
361,322
388,678
750,000
4,183
10,882
297
69.3
0.518
78,320
45.278133,o41j
8,845
36,721
[19..1]16,74oJ
27,360
18,o36
4,880
51,124
7,31o
6,800
1,23o
5,7oo
4,550
1,900
11,5oo
8,300
1,9S0
274,556
11,054
285,610
49,000
334,610
415,390
750,000
FAR-TERM
4,630
10,882
297
69.3
0.554
RESIZED
68,740
40,320128,42oJ
8,170
36,721
24.250
15.220
4.200
43,950
7.022
5,982
1,230
4.900"
4,485
1,900
11.500
8,300
1,980
248,550
10,300
253,850
49,000
307,850
337,150
645,000
4,200
9,307
297
69.3
0.523
HYBRID
FIXED
SIZE RESIZED
77,455 67,577
33,o41j L28,261J8,845 8,127
36,721 36,721
27,360 24,118
18,036 15,137
4,880 4,174
51,124 43,728
7,310 6,984
6,800 5,950
1,230 1,230
5,700 4,875
4,550 4,461
1,900 1,900
11,500 11,500
8,300 8,300
1,980 1,980
273,691 246,762
11,062 10,284
284,753 257,046
49,000 49,000
333,753 306,046
416,247 335,454
750,00O 641,500
4,644 4,200
10,822 9,257
297 297
69.3 69.3
0,555 0.523
¢
20-50

B
i__!_
E
40-percent advanced materials and applying the factors to the Task I weights
shown. When comparing similar data to the hybrid design (i.e. composite re-
inforced) the reduction is 14-percent.
Wing Mass
The general expression used to evaluate the relative weights of the wing box
structure is based on the three wing point design regicns discussed earlier. The
equation, which includes appropriate factors that produce consistent results with
the Detailed Concept Analysis of Task I, is as follows:
SBo x
UB°x - %ox (4.5308 wh0322 + 2.0000 w40536 + 1.0540 w41348)(NOF)
where, SBox, box planform area = 7165 ft 2
KBo x = 7.5532
w , point design region unit weight (ib/ft 2)n
NOF, non-optimum factor = 1.26
The total box weight (variable) is presented in Table 20-23 for the individual
boxes (i.e. forward aft, tip). For comparative purpose the results of the hybrid
design, Section 17, Concept Evaluation and Selection, is also shown.
Evaluation of the wing box weights for the near-term and far-term designs indicate
the weight advantage of the minimum gage titanium alloy beaded panels of the for-
ward box as compared to an equivalent stiffness composite design of either boron-
polyimide or graphite-polyimide. For the stiffness critical tip structure, however,
the application of composites afford a significant weight saving. The flutter
penalty for the composite design is determined by providing equivalent added
torsional stiffness based on the specific stiffness (G/P) parameter for the
respective material systems as shown in Figure 20-19.
20-51

TABLE 20-23. ALL-COMPOSITE WING BOX STRUCTURE MASS CO},_ARISON
TASK IIHYBRID (A)
ADVANCED TECHNOLOGY
ITEM B/PI Gr/PI
START-OF-DESIGN NEAR-TERM FAR-TERM
POINT DESIGN REGION
40322 (Ib/ft 2)
40536 (Ib/ft 2)41348 (Ib/ft 2)
WING BOX
3.80 (6)
7.275.50
20,580 (B)
17,384
6,9642,340 (c)
47,268
FORWARD (Ib)AFT (Ib)
TIP (Ib)
FLUTTER INCR (Ib)
Z; TOTAL (Ib)
3.99
7.23
4.73
21,607
17,283
6,016809(C)
45,715
3.96
7.15
4.71
21,445
17,092
5,962780(C)
45,279
NOTES: (A) COMPOSITE REINFORCED SPAR CAPS; BEADED PANELS EXCEPT H/C SANDWICH TIP BOX.
(B) SIGNIFICANT ADVANTAGE OF METAL SURFACE PANELS AND COMPOSITE REINFORCED
SPAR CAPS,
(C) SIGNIFICANT ADVANTAGE OF COMPOSITE SANDWICH APPLICATION TO THE TIPSTRUCTURE; FLUTTER INCREMENT BASED ON G/p RE LATIONSHIP ASSUMING +45 °
LAYUP.
• ¢
2<3-52
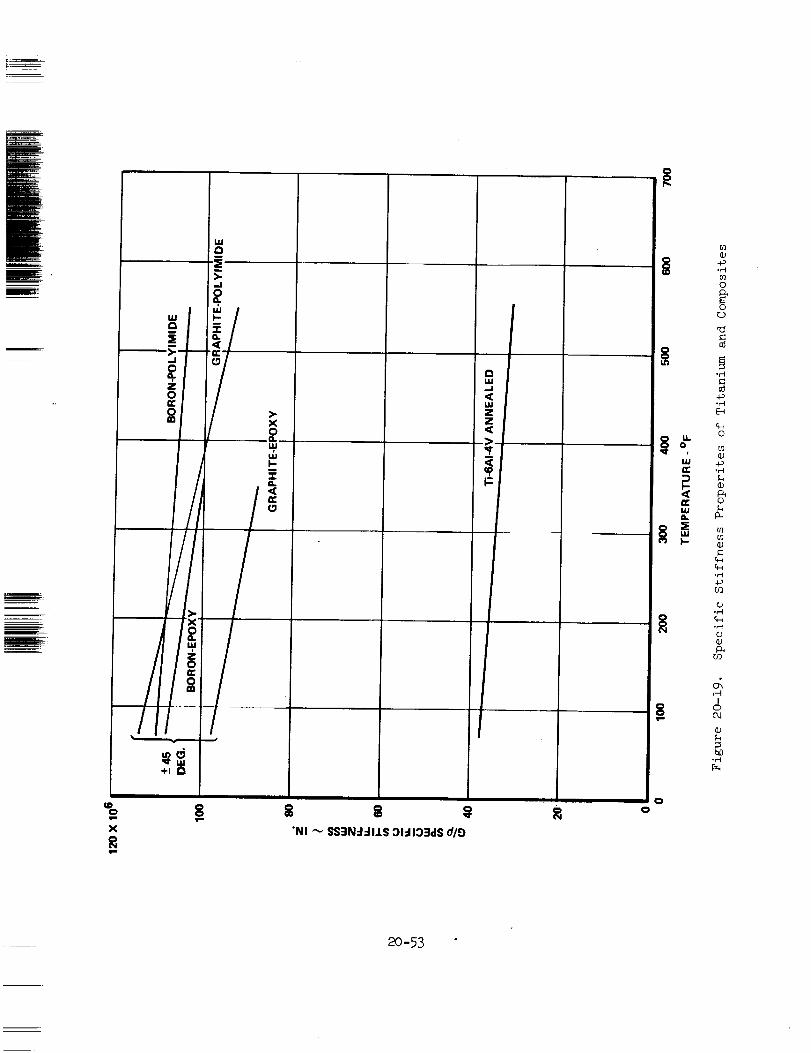
1.14
2
ov-
X
v-
/!/ij/
g
X
_2W,I
ilu1-
12
, I
"NI "_ SS3N:I:IIJ.S :)l:ll:)3dS d/E)
ouJ..J<uJZZ<
>
P_
uJ
a.
p.
8
c:)
o
._1
O
.r-_
O
113
i1)
.r-,I
or.t
I1)
O3
Ioc_
b0
_-53

Fuselage Mass
The general expression used to evaluate relative weights of the shell structure is
based on the four point design region defined at F.S. 750, F.S. 2000, F.S. 2500 and
The equation, which contains parameters defined in Section 15, is asF.S. 30O0.
follows :
Wshel I -
where, Sshell, shell wetted area
Sshell
Kshel I (w750 + w2000 + w2500 + w3000)(NOF)
= 7167 ft 2
Kshel I = 4.1544
Wn, shell unit weight at each point design region (ib/ft 2)
NOF, non-optimum factor = 1.14
Table 20-2_ presents the shell unit weights for each point design region and re-
sulting total shell weight. Both boron/polyimide and graphite-polyimide material
system data are shown along with corresponding weights for the all-titanium shell.
A decrease in shell unit weight is reflected at all point design regions; the mag-
nitude varies from a 4-percent to a 21-percent weight saving potential. A weight
savings for the total shell when employing advanced composites is 14-percent.
Secondary Component Mass
The weight reduction factors for the secondary components were obtained from the
results of the Advanced Technology Transport (ATT) studies conducted by the
Lockheed-Georgia Company are reported in Reference I. The appropriate _eduction
factors were applied to each component of the near-term design to arrive at the
values _ used for the far-term aircraft as shown in Table 20-25. For the fixed
weight items for the wing and fuselage, the overall reduction factor is 0.799 and
0.857, respectively.
The secondary components for the wing and fuselage total in excess of 60,000 pounds.
The application of the respective reduction factors to the design results in a
20-54

_L_ LT T -_¸
E
MATERIAL SYSTEM:
POINT DESIGN
REGION
F.S. 750
F.S. 2OO0
F.S. 2500
F.S. 3000
UNITS
Ib.ft "2
Ib,ft 2
Ib.ft "2
Ib,ft 2
NEAR-TERM
TITANIUM
6A1-4V
1.54
3.27
3.53
3.43
FAR-TERM
BORON
POLYIMIDE
1.50
2.73
3.30
2.73
GRAPHITE
POLYIMIDE
1.48
2.71
3.26
2.71
PERCENT
CHANGE
OVER
NEAR-TERM
-3.9
-17.1
-7.6
-21.0
WSHEL L Ib 23,148 20,178 19,981 -13,7
TABLE 20-24. ALL-COMPOSITE SHELL STRUCTURE MASS C0MPARTSON
_-55
"_::L

TABLE 20-25. WEIGHT REDUCTION FACTORS FOR ADVANCED TECHNOLOGY AIRCRAFT
SECONDARY COMPONENTS
ITEM REDUCTION FACTOR (A)
WING-FIXED WEIGHT
LEADING EDGE
TRAILING EDGE
WING/BODY FAIRING
LEADING EDGE FLAPS
T.E. FLAPS
AILERONS
SPOILERS
MLG DOORS
SUPPO RT STR UCTU RE
BoL. 62 RIBS
FIN ATTACHMENT PROVISIONS
B.L. 470
REAR SPAR
ENGINE SUPPORT STRUCTURE
FUEL BULKHEADS
(SU BTOTA L)
0.70
0.70
0.70
0.75
0.70
0.75
0.75
0.75
1.00
0.86
0.86
0.86
0.86
1.00
0.86
0.799
NEAR-TERM FAR-TERM
5,235
4,888
1,600
1,130
5,890
1,250
1,360
2,904
3,750
1,430
435
700
3,400
3,580
3,800
41,352 Ib
3,664
3.422
1,120848
4,123
938
1,020
2,178
3,750
1,230374
6O2
2,924
3,580
3,268
33,041 Ib
FUSELAGE-FIXED WEIGHT
NOSE AND FLIGHT STATION
NLG WELLWINDSHIELD AND WINDOWS
FLOORING AND SUPPORTS
DOORS AND MECHANISM
UNDERWlNG FAIRING
CARGO COMP'T. PROV.
WING-TC_BODY FRAMES/FTG_
TAI L-TO-BODY FRAMES/FTG_
PROV. FOR SYSTEMS
FINISH AND SEALANT
(SUBTOTAL)
0.93
0.93
1.00
0.75
0.80
0.70
0.80
1.00
1.00
1.00
1.00
2,500900
1,680
3,820
4,170
1,870
1,060
1,500
600
740
700
(A) REFERENCE 1
2,325
837
1,680
2,865
3,336
1,309848
1,500500
740
700
0.857 19,540 Ib 16,740 Ib
-56

i
potential structural mass savings of approximately i0,000 pounds. These items
alone offer significant weight payoff and improve aircraft performance for the
supersonic cruise aircraft design.
FINAL DESIGN-ADVANCED TECHNOLOGY AIRCRAFT
The final design resulting from this advanced technology assessment is a hybrid
structural approach as shown in Figure 20-20. The design makes extensive use of
graphite/polyimide material system with a protective system of aluminum wire fabric
and 120 glass. The chordwise stiffened structural arrangement-convex beaded sur-
face panel concept of titanium alloy 6AI-hV resulted in minimum weight for the
lightly loaded forward wing box structure. For the strength-stiffness critical
wing aft box and tip structure, the honeycomb core sandwich using graphite/polyimide
faces was found to be least weight. The fuselage structural arrangement is a
skin-stringer-frame approach employing closed-trapezoidal hat stiffeners in the
center body and aftbody with tee-section stiffeners used in the pressure critical
forebody design.
The manufacturing plan postulated the applicability of low cost methods now being
developed for epoxy processing. Fabrication of ribs and spar caps as well as
truss webs would be accomplished by closed-mold processing with elastomeric tool-
ing as the pressure generator. Single stage molding and attachment of caps to
truss or corrugated webs would be performed by similar techniques. Wing skin
panels would be produced with large sheets of material laminated by automated
machines. Unit panels having dimensions of 10-feet x 20 feet are assumed.
Because of contour complexity, flexible elastomeric tooling is extensively used.
The technology evaluation data presented in Table 20-26 compares the advanced
technology aircraft with the near-term technology all-titanium and composite re-
inforced designs. The cascading effect of resizing of the advanced technology
aircraft for a constant payload-range (49000-Ib x h200 n.mi) is shown. An 8.2-
percent reduction in zero fuel weight considering a fixed airplane taxi weight is
realized by the use of composites. This weight reduction is equated to a
performance (range) increase of 500 nautical miles. Considering the growth factor
20-57

>-0
<
>-
0m
I.ul.-Zu4U
>-
uJn-Ou.
_JE-_
I
-rtm
@
I
o!
%
r--t
I
e.)
o%
%
c)
%
u_
or"l
%
i1)f..)
i>
<
C'dI
0
@¢
20-58

!
Fj_:
ERR
H<
o0
o
r_)r_
A
r..)
I
ou)H
r..)
rJ
o
O3U3
<
,.sCkl
IO0J
z_ _
N O,!!_:!i|i
• .v ......
_, -Z-Z'/'Z'7,
o _ _- iiiii!iiii!ii!iii
< _- iiiiiii!!!:ii:iiii:i..... ...:_
<I.,.<(2
_ 7
,,J ul
>" i,-
i-
g
i E_
',v.'.'.',v:.. ".v,'.','.v.".v,v.v.v.'. ,.v.v.v.v,.":_':'Z'X'Z':'Z-Z'Z'Z':
.i _ Z : iiiiiii!_ii!i!!!!!!iiiiii!iii!i!!ii! _ _"
= _ iiii_iii!:i!iiiii!iliiiiiiiiiiii;:v.v,v,vz: :z:.v;.v.,.v..z,v.v.v v,v,vz.v.
:::::::::::::::::::::::::::_::
:iiiiiiiiiiiiiiiiiii"i!ili!ii_}!_ _ _ _" _ "
!!!}:_..}} i}}if::i:}}i}iii-:!!_:}:i:i:E:_:i.!:!:}:i.:: }i:_}}i"!i!!iiiT"}ii:i:i:i:i_:i:!:!:!:i:!:i:!!iii:i:i:!:i:i:_:i_!!!ii'iiiii :! iiiili iii!!_!! iii_!i
!iiiiiiWilii_i_i!!!iiiii!iii_ii;i!i!i_i_!ii_iiii_ | iii_i !
.. !:i:i:i:i_ii: _ _ _ ::::::::_:::_ :::_: _ 0, !i!i!i!!!i!i!!iiii_ .
i:i:i:i;_i:i 0 0 :i:i:i:i:i:i:E:
:::::::_::::' _ ® _.!iiiiiiii!i!!!!!!i
-- . :i:i:i:_i:i; = _ :::::::::::::::::::::- ::.:.:-:+:.:.:.:- _ !!iiiii!ii!iiiii!!!!!!
::.:+:.::::.::m = iiiiiiiii!i!ii!i!ii!ii*_ i!!iiiii_i:iiiiiiii:
< _ _
< z
20-59
for this class of aircraft which consists of approximately 50-percent fuel,
resizlng of the airplane was accomplished. The airplane taxi weight _as reduced
by approximately 100,000 pounds.
The results of this assessment has identified the potential benefits of the
composite materials and fabrication technology for application to a 1990-plus
start-of-deslgn Mach 2.T supersonic cruise transport. The impact on the airplane
size and _eight are significant but require further in-depth analytical and experi-
mental studies for validation. This includes, not only, the primary structural
components, but also, secondary components including the leading edge, trailing
edge, flight station, fairlngs, etc. _hich contribute significantly to the
potential savings.
¢
20-60

la
2e
,
to
5,
REFERENCES
R.H. Lange, et. al "Study of the Application of Advanced Technologies to
Wing-Range Transport Aircraft," NASA CR 112088, Lockheed-Georgia Company,
dated April 1971.
R.L. Foss, "Studies of the Impact of Advanced Technologies Applied to
Supersonic Transport Aircraft," LR 26089, Lockheed-California Company, dated
January 1974.
E.B. Birchfield, F. Kollsmanberger, "Develop Fabrication/Processing
Techniques for High Temperature Advanced Composites For Use in Aircraft
Structures," AFMC-TR-72-91, McDonnell Aircraft Company, July 1972.
T.M. Hsu, "Attainable Stress of Composite Panels Reinforced by Hat-
Section Stiffeners," S_N 313, Lockheed-Georgia Company, January 1972.
W. Cremens, "_4anufacturing Methods for Thermal Expansion Molding of
Advanced Composite Aircraft Structures," First Quarterly Report, Contract
F-33615-74-C-5150, Lockheed-Georgia Company, July 1974.
20-61

' ¢

I
m
SECTION 21
DESIGN METHODOLOGY
By
D. A. Brogan, G. W. Davis, G. A. Galins, E. A. Goforth, B. C. Wollner

"I"
¢

|_
Section
INT RODUCT I0N
STRUCTURAL TEMPERATURE ANALYSIS
Math Models
Airframe Structural Temperatures
FINITE-ELEMENT STRUCTURAL ANALYSIS
Structural Models
Structural Influence Coefficients
Internal Loads Runs
AEROELASTIC LOADS ANALYSIS
Critical Flight Conditions
Theoretical Aerodynamics
Grid Trans fo_m
Mass Distribution
Jig-Shape Definition
Net Aeroelastic Loads
VIBRATION AND FLUTTER ANALYSIS
Structural Model
Vibration Analysis
Aerodynamic Formulation
Flutter Analysis
Flutter Optimization
REFERENCES
CONTENTS
21-1
21-i
21-3
21-4
21-7
21-7
21-12
21-12
21-14
21-16
21-16
21-19
21-21
21-22
21-23
21-23
21-24
21-24
21-26
21-28
21-31
21-37
21-i

Ir ,
¢
_I Fr
LIST OF FIGURES
2l-Z
21-2
21-3
21-4
21-5
21-6
2l-7
21-8
2l-9
21-i0
21-11
21-12
21-13
21-14
21-15
21-16
21-17
21-18
2z-19
21-20
2_%-21
21-22
21-23
pRDcEDING ?AG_ BLANK NOT FILMI_D
Analytical Design Cycle
Lockheed' s Integrated Structural DesignAnalysis System
Evaluation Procedure for Structural Temperatures
Wing Box Thermal Analyzer Network
Network Node Definition, Type-2 Wing Panels
Network Node Definition, Fuselage Panel and Frame
Airframe Structural Temperatures
Finite Element Structural Analysis Procedure
Structural Model Usage
Comparison of Wing Rear Beam Structural Influence Lines
Comparison of Fuselage Structural Influence Lines
Aeroelastic Loads Evaluation Procedure
Subsonic Aerodynamic Grid
Supersonic Aerodynamic Grid
Design Load Conditions - Strength/Stiffness
Net Integrated Wing Shears - Theoretical vs Measured
Span Loading Distribution -Mach 2.7
Wing Lift Coefficients - _ch 2.7
Load Panel Grid
Vibration and Flutter Analysis
Symmetric Degrees of Freedom for Vibration Analysis
Theoretical Aerodynamic Distribution
Normalized CL Versus Reduced Frequency
21-iii
21-2
21-2
21-3
21-5
21-5
2Z-6
2Z-6
21-9
21-9
21-11
21-11
21-15
21-17
2]--17
21-]8
21-20
21-20
21-20
21-22
21-24
21-25
21-27
21-27

2z-24
21-25
21-26
21-27
21-28
2z-29
2]--3o
21-31
LIST OF FIGURES (Cont)
The Effects of Ntunber of Modes on the Flutter Solution
Flutter Speed Variation With Number of Modes
Flutter Analysis Results
Participation Coefficients - Mach 0.9 -FFFP-Mode 8
Sy_netric Flutter Analysis - Mach 0.9 - FFFP
Design Regions for Flutter Optimization - Task I
Design Regions for Flutter Optimization - Task II
Nonlinearities in the Incremented Stiffness Matrix
Elements, Arrow Wing
2z-29
2z-29
21-30
21-30
21-32
2Z-34
21-3_
21-36
i ,¢
21-iv

m
21-2
21-5
21-6
LIST OF TABLES
Comparison of Wing Surface Load Intensities -
All Models, Mach 0.90 Load Condition
Effect of Jig-Shape on Wing Upper Surface Load Intensities,Task IIB Hybrid Model
Critical Loading Conditions
Stummsry of Adjusted Aerodynamic Coefficient Matrices -
Task I (k=O)
Analytical Methods for Vibration Analysis
Lower Frequency Symuetric Vibration Modes -Chordwise Stiffened
P84_e
21-13
21-13
21-15
21-32
m
21-V
b

• ¢
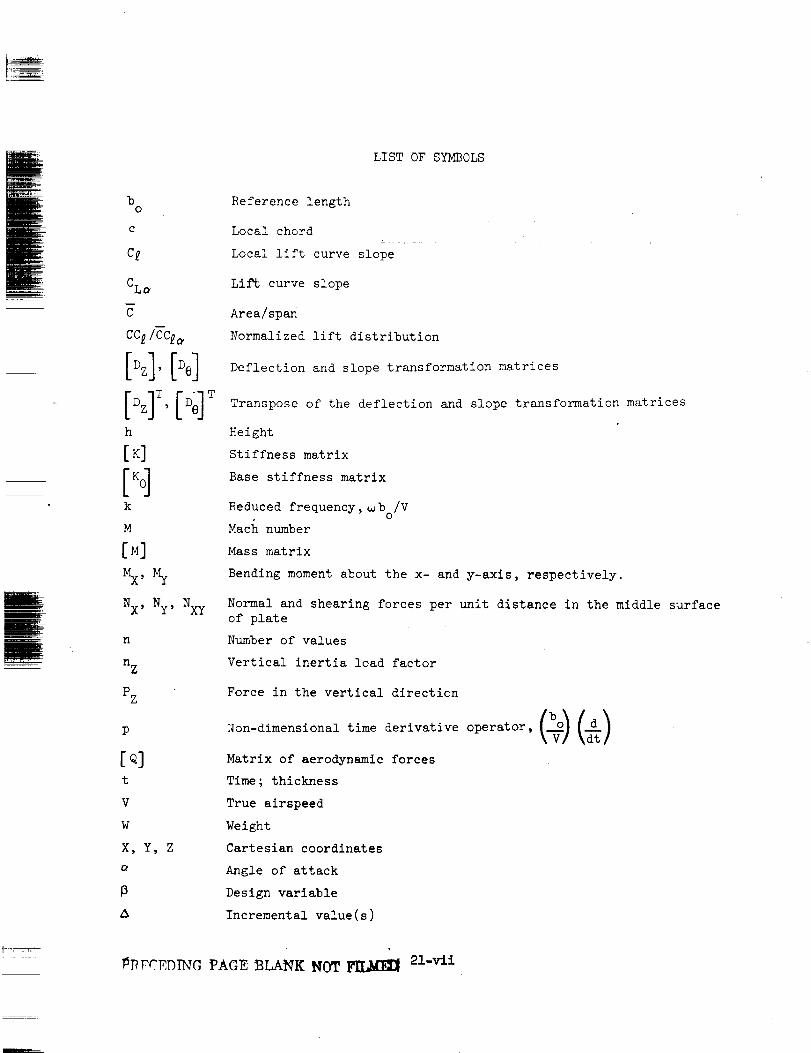
LIST OF SYMBOLS
m
m
bO
C
c_
CL_
cc_/cc_
•h
k
M
[M]
N x , Ny, NXy
n
n Z
PZ
P
[Q]t
V
W
X, Y, Z
A
Reference length
Local chord
Local lift curve slope
Lift curve slope
Area/span
Normalized lift distribution
Deflection and slope transformation matrices
Transpose of the deflection and slope transformation matrices
Height
Stiffness matrix
Base stiffness matrix
Reduced frequency, _b /VO
Mach number
Mass matrix
Bending moment about the x- and y-axis, respectively.
Normal and shearing forces per unit distance in the middle surface
of plate
Number of values
Vertical inertia load factor
Force in the vertical direction
Non-dimensional time derivative operator, (_) (d)
Matrix of aerodynamic forces
Time; thickness
True airspeed
Weight
Cartesian coordinates
Angle of attack
Design variable
Incremental value(s)
P_VCP,DING PACE BLANK NOT _ 21-vll

LIST OF SYMBOLS (Cont'd)
tO
Pitching acceleration
Rolling acceleration
Angular frequency in radians/second
¢
21-viii
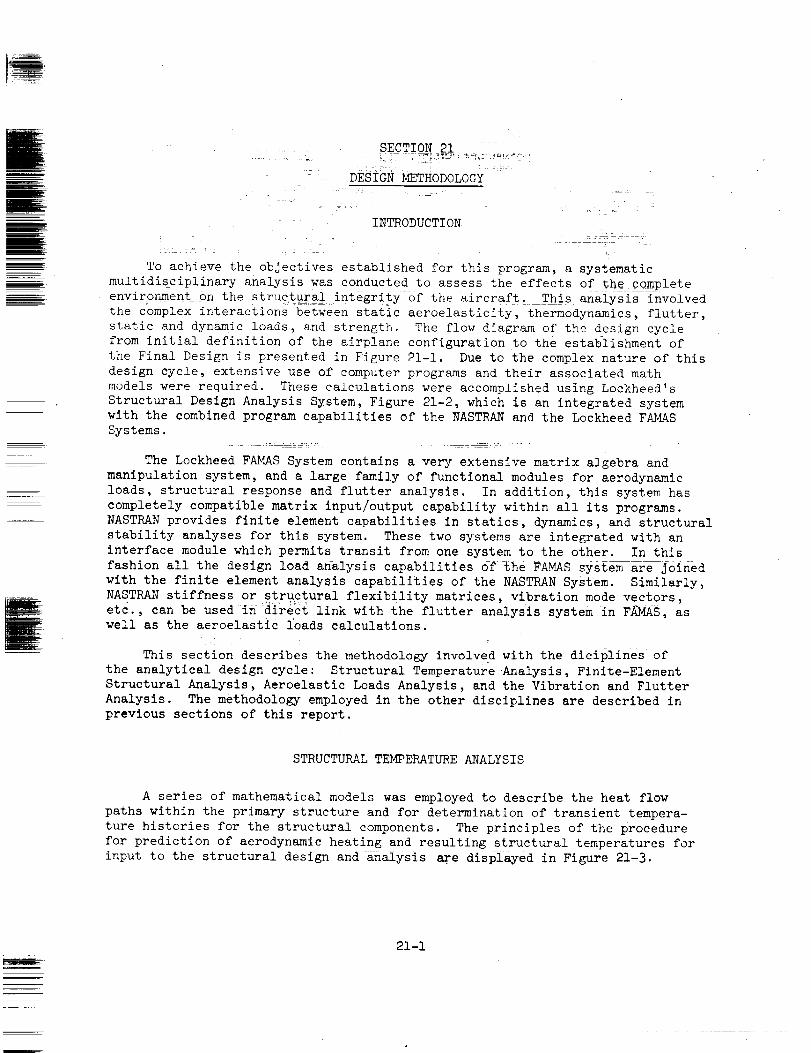
E
B
m
. - SECTION 21
T_ODOLOGY- DESIGN ME
- INTRODUCTION
To achieve the objectives established for this program, a systematic
multidisciplinary analysis was conducted to assess the effects of the complete
environment on the structural integrity of the aircraft. This analysis involved
the complex interactions between static aeroelasticity, thermodynamics, flutter,
static and dynamic loads, and strength. The flow diagram of the design cycle
from initial definition of the airplane configuration to the establishment of
the Final Design is presented in Figure 21-1. Due to the complex nature of this
design cycle, extensive use of computer programs and their associated math
models were required. These calculations were accomplished using Lockheed's
Structural Design Analysis System, Figure 21-2, which is an integrated system
with the combined program capabilities of the NASTRAN and the Lockheed FAMAS
Systems.
The Lockheed FAMAS System contains a very extensive matrix algebra and
manipulation system, and a large family of functional modules for aerodynamic
loads, structural response and flutter analysis. In addition, this system has
completely compatible matrix input/output capability within all its programs.
NASTRAN provides finite element capabilities in statics, dynamics, and structural
stability analyses for this system. These two systems are integrated with an
interface module which permits transit from one system to the other. In this
fashion all the design load analysis capabilities of the FAMAS system are Joined
with the finite element analysis capabilities of the NASTRAN System. Similarly,
NASTRAN stiffness or structural flexibility matrices, vibration mode vectors,
etc., can be used in dir@ct link with the flutter analysis system in F_MAS, as
well as the aeroelastic loads calculations.
This section describes the methodology involved with the dieiplines of
the analytical design cycle: Structural Temperature Analysis, Finite-Element
Structural Analysis, Aeroelastic Loads Analysis, and the Vibration and Flutter
Analysis. The methodology employed in the other disciplines are described in
previous sections of this report.
STRUCTURAL TEMPERATURE ANALYSIS
A series of mathematical models was employed to describe the heat flow
paths within the primary structure and for determination of transient tempera-
ture histories for the structural components. The principles of the procedure
for prediction of aerodynamic heating and resulting structural temperatures for
input to the structural design and analysis are displayed in Figure 21-3.
21-i

FINAL
BASE I_INE I DESIGN
_1 IANDSIZ'NGI'--------
/ MATE / I (OEFLECT,ON)I IFLUTTE" I
! _ \ ' IOPTIMIZATIONI____,¢:t_A'I"U _E I AEROELASTIC' I _
STRUCTURALMODEL t" _ASS L(_ADLSoNTROLNESS _I r --/IE,F.C.V.IiSTAT,C SOLUTION _ _I _S_"_#" /
_?/,ii;i!:i!;i;[ii_//_N_:_i_i;_j;;;i_i;:;i;i!iiii!ii.:i;i;¢_i;iJii.:i_i_
Figure 21-1. Analytical Design Cycle
FAMAS SYSTEMFULLY COMPATIBLE
• AEROELASTIC LOADS
• BASIC AERO PROGRAMS
• FLUTTER ANALYSIS
• FLUTTER OPTIMIZATION
• MATRIX ALGEBRA
• AUXILIARY SYSTEM
NASTRAN SYSTEMFULLY COMPATIBLE
• STRUCTURAL ANALYSIS(STATIC)
• MODAL ANALYSIS(GIVENS)
• MATRIX ALGEBRA
SPECIAL MODULES
MATRIX COMPATIBILITY lDATA TRANSLATION _
!-
¢
Figure 21-2. Lockheed s Integrated Structural Design Analysis System
21-2

STRUCTURAL
ARRANGEMENT
THERMOPHYSICAL
PROPERTIES
FLIGHTPROFILE
THERMAL ANALYZER
THERMAL MODEL RESULTS
• STRUCTURAL
NETWORK
• HEAT FLOW
PATHS
• TIME-TEMPHISTORIES
• AIRPLANESTRUCTURAL
TEMPERATUR ES
REDUNDANTSTRUCTURALANALYSIS
STRUCTURALANALYSIS
DESIGN
Figure 21-3. Evaluation Procedure for Structural Temperatures
Math Models
The mathematical models consist of networks of structural nodes inter-
connected by heat flow paths and set up for solution using Lockheed's Thermal
Analyzer computer program (Reference I). The solution method is analogous to
the solution of voltage distribution in an electrical resistor-capacitor net-
work: current (heat) flows through electrical (thermal) resistors as a function
of the voltage (temperature) potential between connected points, and is stored
as electrical (thermal) energy in components called capacitors (structural mass)
at a rate that is a function of the electrical (heat) capacity of that component.
Lockheed's Thermal Analyzer is a completely general and versatile computer pro-
gram, permitting specification of any type of temperature- or time-dependent
heat flow including conduction, convection, radiation, and variable heat storage.
An additional capability allows reconnection of network elements during run time,
permitting solution of complex problems such as exposure of fuel tank structureto interior radiation as fuel was drained from the tank.
The thermal networks were generalized to accept arbitrary dimensional data
for applicability to similarly shaped structures. Detail dimensions were sup-
plied as standard input data and the actual resistor and capacitor values
calculated automatically for each case. This technique eliminated the need
for minor network revisions each time a dimension was changed, and saved sig-
nificant programming time.
All Thermal Analyzer networks were set up to compute in a transient mode.
The flight profile for a "hot day" (standard plus 8K) international mission was
used to determine aerodynamic heating and altitude effects. Cases were run
from takeoff roll, to climb, through cruise, and descent to loiter before
landing.
ORIGINAL PAGE 18oF P0o2 QUAUTZ 21-B

Heat transfer in the interior of the wing was determined by setting up a
wing box network. The network (Figure 21-4) includes sets of nodes for the
upper and lower panels, plus one node each for the four vertical webs (to
form a rectangular box). The shape of the box was determined by panel size
(spanwise by chordwise dimensions) and by wing depth obtained from wing con-
tour drawings. All node areas were normalized with reference to one square
foot of panel surface area to facilitate resistor and capacitor calculations.
Heat transfer within the wing box includes radiation exchange, convection to
boundary layer air when leakage was a factor, and for fuel tank areas, con-
vection to fuel and fuel vapor.
Two sets of nodal representations for the surface panels were derived for
inclusion in the wing box network. The first set was for the corrugation or hat-
section stiffened panel concepts, and the second set was for the honeycomb panels.
An example of the node definitions for the honeycomb panels are shown in
Figure 21-5. Nodes 2 and 3 are defined as the outer and inner halves of the
core, respectively. Nodes 1 and 4 include thermal capacity of the braze
material. Heat transfer within the panel includes conduction (nodes 1-2, 2-3,
and 3-4) and radiation (nodes 1-2, 1-3, I-4, 2-3, 2-4, and 3-_). To reduce
network complexity and computer running time, all braze material was assumed
to remain in contact with the face sheets.
Node definitions for the fuselage frame network are shown in Figure 21-6.
This network was set up to determine the variation in average skin panel and
frame temperatures around the circumference of the fuselage. The hat-sectionstiffened skin concept is shown, and skin-panel heat transfer is identical to
that for type-i wing panels. Heat transfer to the frame was hy zonduction and
radiation from the skin panels, and by conduction from the surrounding insula-
tion. Conduction through the insulation to the inner skin was also included.
Boundary conditions on the inner surface of the fuselage ;u_! included a lowconvection rate to cabin air and radiation to cabin inter1_r. The network at
the fuselage forebody station was adjusted to simulate zee-section stiffeners
with the hat-section model.
Heat flow paths were defined by thermal resistors connected between nodes
representing structure or between nodes and given boundary condition tempera-
tures. Heat flows directly into a node were also defined explicitly. The
Thermal Analyzer network included the following types of heat flow paths:
external and internal convection, conduction, external and internal radiation,
and thermal capacity.
Airframe Structural Temperatures
Structural temperatures were calculated to define the thermal environment at
selected wing and fuselage locations for the detail stress analysis and on the
overall configuration for input into the structural models, Figure 21-7. These
temperatures were developed by using the thermal analysis networks and structural
data of the arrow-wing configuration and performing the airplane over a nominal
Mach 2.7 cruise flight profile.
Time-temperature histories were developed using the Thermal Analyzer com-
puter program at 14 wing and i0 fuselage locations. These locations were
selected to include those point design regions used for the detail stress
21-h
¢
.-i

OUTED __D
WEB, NODE25
Figure 21-h.
l . FWD WEB NODE 15
\ AIFT WEB NODE 36
SECTION B B
U/S PANE L NODES 14
_,NSO •EB_,lSf_ODE WING DEPTHAT PANEL CORNERS.
ht , h2 , h3. h4
,(_ ___ tL/$ PANEL NODES7 10
SECTION A A
Wing Box Thermal Analyzer Network
NODE
EXTERIOR NUMBERING: T1
e ;L J __-
...... HCt .
!
,N,ER,OR ® tT2
CORE CROSS SECTION:
DIME NSIONAL DATA :
HC PANEL THICKNESS
T1 EXTERIOR FACE SHEET THICKNESS
T2 INTERIOR FACE SHE ET THICKNESS
S CORE CELL SIDE
TC CORE FOIL THICKNESS
ADDITIONAL DATA:
WB BRAZE WEIGHT/AREA
Figure 21-5. Network Node Definition, Type-2 Wing Panels
B
ORIGINAL PAGE IS
OF POOR QUALn_21-5
L

FUSELAGE
INTERIOR SKIN
INSULATION
HAT-STIFFENED
EXTERIOR PANEL
DIMENSIONS IN CM {IN.)
VARIABLE DIMENSIONS:
[2_ 1.91 10.75)
l-'- T I Tf FRAME THICKNESST S SKIN THICKNESS
T h STIFFENER THICKNESS
, Xf FLANGE WIDTHI - - "-'_-- I .. NOOE_U.ERo117) 261_ | o17 /
.... } _[ .... s.s, ,_5o,
e(lm _[_ el6 T
"111*°'_T 1'_1,,, ,,+,+,,_,L,::1.91 10.751_,,.-J P's"_'t }'gl (0.75) ._ _..o_.3.81 (1.50) .
1S.2 (6.0)_-_,.
NOT TO SCALE
CURVATURE NOT SHOWN FOR
SKIN PANEL CROSS SECTION
Figure 21-6. Network Node Definition, Fuselage Panel and Frame
® '_ -- -[ r [ [ " W-; [---r
_4, F,\i i '_-+so ,J_ L ; " I_ANGIUlIITS
I -I--++--,+--, +- +-- +---_---t-- 1--_.+. i +
_L,G,_ mOF_LEr,_ UI++UTIS
Figure 21-7. Airframe Structural
WING NETWORK "-,-14 LOCATIONS
FUSELAGE NETWORK --., 10 LOCATIONS
Temperatures
¢
21-6

I
I
analysis and provided the-necessary temperature data to define the point designenvironment for these regions.
Temperatures were developed for the entire wing and fuselage based on the
extrapolation of the time-temperature histories calculated at the selected wing
and fuselage locations. In addition, grid point and element temperatures were
developed from these overall wing and fuselage temperatures for inclusion in
the finite-element structural model.
FINITE-ELEMENT STRUCTURAL ANALYSIS
A series of finite element (F.E.) structural analysis models were used for
the evaluation of structural design concepts. These models were coded for
NASTRAN, and Lockheed's Structural Design Analysis System was used to provide
internal loads and displacements for stress analyses, to calculate structural
deflection influence coefficients for aeroelastic load analyses, and to deter-
mine reduced stiffness and mass matrices and compute vibration modes for flutter
analyses. The principles of this analytical procedure are shown in Figure 21-8,
and generally consisted of the following steps:
(i) F.E. structural models were established using the basic airplane
configuration and the flexibilities commensurate with the structural-
material concept being studied. Plot routines and internal check runs
were conducted to validate each model.
(2) NASTRA_ redundant-structure analysis solutions were obtained using the
F.E. models formulated in step (i). Plot routines were used to verify
the continuity of the resulting displacement structural influence
coefficients (SIC). Upon verification of the SIC, both SIC and stiff-
ness matrices were released for the aeroelastic loads and vibration
analyses, respectively. The vibration analysis initiated the vibra-
tion and flutter evaluation with no further interaction with the F.E.
structural analysis until the next design iteration was attempted.
The SIC matrix, in association with the basic aerodynamics, mass
matrices, and the flight parameters was used to calculate the static
aeroelastic loads.
(3) A NASTRAN internal loads run was conducted using the aeroelastic loads
matrix derived in Step (2), with the resulting displacements and
internal loads (stresses) subsequently used for the point design
stress analysis.
Stl-uctural Models
r
The F.E. structural models used for the structural investigation are sum-
marized on the flow schematic in Figure 21-9. These models are characterized by
their basic modeling technique and their wing primary load-carrying structural
arrangement. The three general types of structure and combination thereof
evaluated were: chordwise-stiffened, spanwise-stiffened, biaxially-stiffened
(monocoque), and the hybrid-stiffened arrangements. The two different modeling
21-7
OaIG AL PAGE mo2 20o2 QUAZa

techniques employed in the formulation of these structural models were: the
pseudo 2-Dimensional (2-D) method and the conventional 3-Dimensional (3-D) method.
A statistical comparison of the two modeling techniques is as follows:
MODEL GRID
POINTS
53o
715
ELEMENTS
13oo
2450
DEGREES
OF
FREEDOM
1050
2200
CPU TIME*
(HR)
0.37
0.72
* COMPUTER TIME TO GENERATE SYM. AND A/S SIC'S
In addition, the computer time required to formulate the symmetric and anti-
symmetric structural influence coefficients (SIC) are included and indicate the
cost effectiveness of the pseudo 2-D model, i.e., the 2-D model is half as costly
(computer run time) as the more detailed 3-D model.
The simplified pseudo 2-D model technique was formulated for the initial
studies as a rapid, cost effective method for evaluating the effects of the pri-
mary wing loads (P , M. and _r). A representative description of the modelingZ _ "j
technique used on the 2-D models is included in Figure 21-9. This model repre-
sents the actual wing upper surface planform with a simplified wing cross-
section and the fuselage was idealized as a simple beam. For t_e wing, a
horizontal midplane (X-Y plane) of structural symmetry was assumed, which
permits the size of the model to be substantially smaller since only the upper
half of the wing needs to be specified in the model. Th -_ _¢_ng cross-section of
the model was symmetrical about the X-Y plane. The Z coor%in%tes (measured
from the'X-Y plane) defined the upper wing surface and were equal to one-half
of the total wing depth of the model. Section properties were equal to the
average stiffness of the wing upper and lower surfaces.
For the wing vertical fin model, a two-dimensional (X-Z plane) grid sys-
tem with NASTRAN bar and shear panel elements was used to represent the
equivalent bending and torsion stiffness of the fin. Fin loads are introduced
into the wing by means of NASTRAN multipoint constraint (_._C) equations which
were applied at the interface of the fin with the wing box.
Engine support beams were represented in the model by NASTRAN bar elements
with the capability to transmit axial, torsional, and vertical and lateral bend-
ing loads from the engines into the wing box. The beams were located at the
constrained wing midplane and were connected by MPC equations to the X-Y rigid
body motions of the wing for the vibration analyses.
The 2-D models represent the fuselage as a simple beam and used NASTRAN bar
elements with torsional, and vertical and lateral bending stiffness. The fuse-
lage beam was connected to the wing model by _C equations and scalar springs
(NASTRAN CELAS elements) representing an approximation of the fuselage frame
flexibility.
¢
J
21-8

CONFIGURATION
STRUCTURAL
ARRANGEMENT
STRUCTURAL
MATERIAL
CONCEPT
ii
FINITE ELEMENT STRUCTURAL ANALYSIS
STRUCTURAL
MODEL
• GRID
• COORDINATES
• BULK DATA
TEMPERATURES
Figure 21-8.
STATIC
SOLUTION
• STIFFENESSES
INTERNAL LOADS
• DISPLACEMENTS
• INTERNAL LOADSAND STRESSES
• LOAD INTENSITIES
MODAL AEROELASTIC
ANALYSIS LOADS
Finite Element Structural AnalysisProcedure
i STRENGTHANALYSIS
DESIGN
CHORDWlSESTIFFENED
20MODEL
TASK I "i = TASK IIA "--"="l _TASK lib
CHORDW|SE CHORDWISE
STIFFENED I STIFFENED
2D I 2.D
MODEL MODEL
SPANWISE i I f f
STIFFENED | HYBRID HYBRIDi, 3.0 3.o
MODEL i MODEL MODELSTRENGTH FINAL
SIZING DESIGN
MONOCOQUE
(BIAXlALLYSTIFFENED)
2.DMOO_L
_ __ CE 3-D MOD_
2.D MODEL
. T " " ENGINE RAtLG c ._.._'_'"_"
Figure 21-9, Structural Model Usage
21-9

For the Task II analyses, a more detailed, 3-D model was used to describe
the airframe. An isometric view of this model is also included in Figure 21-9.
The wing planform grid for the 3-D model was approximately equal to the 2-D
model grid. However, for the 3-D model both upper and lower wing surfaces were
represented, including camber and twist of the actual airfoil. Flexible control
surface actuators were represented using NASTRAN CELAS elements and MPC equa-
tions. The elimination of the X-Y wing midplane of structural symmetry (and
load antisymmetry) used on the 2-D models required a redefinition of the loca-
tion for the wing interfaces with the vertical fin, main landing gear and
engines.
The 3-D model fuselage was idealized using 25 frame stations with approxi-
mately i0 nodes describing the fuselage half-circumference. NASTRAN bar
elements are used to represent fuselage frames with rod elements and quadri-
lateral shear panels used to represent the fuselage shell.
For both modeling techniques, a network of unit loads, were used on the
models to calculate SiC's and to introduce design loads into the model struc-
ture. Effective unit load locations are, in general, identical for both models
with the exception of the unit loads applied to the 3-D model fuselage which
differ from those used on the 2-D models in their application as distributed
loads at each frame station. The corresponding structural influence coefficients
on the 3-D fuselage model represent an average deflection of the frame node
points to which the unit load was distributed.
To assess the results of the structural model techniques and provide insight
for future research studies, an investigation was conducted to compare the
accuracy (2-D versus 3-D) of the two modeling techniques. This investigation
was conducted by up-dating the Task II-A chordwise structural model (2-D),
completing a NASTRAN static solution, and comparing these results with those of
the Final Design airplane which employed a 3-D structural model. Commensurate
with model technique, the input data for the 2-D model reflected the identical
coordinate and flexibility data used in the 3-D structural model.
Examples of the results of the 2-D NASTRAN static solution are presented in
Figures 21-10 and 21-11 with the corresponding data from the 3-D model included
for comparison purposes. These figures show the normalized structural influence
coefficients for the wing rear beam and fuselage.
With reference to Figure 21-10, both 2-D and 3-D structural influence coef-
ficients were normalized to the maximum wing tip displacement of the 2-D struc-
tural model. This data indicates approximately equal stiffnesses for both models
in the basic wing region, inboard of BL 470, with the 2-D model having a more
flexible wing tip, e.g., for equal loads applied at the wing tips, the wing tip
displacement for the 2-D model would be approximately 10-percent greater than
the corresponding displacement of the 3-D model.
ORIGINAL PAGE IS
OF POOR QUALm'
21-10

1.0
I- 0.8 --I_ZuJZ
O
Nr,i.w
...I<
OZ
SYMMETRIC SICNORMALIZED TO 2-D MODEL
i MAXIMUM VALUE (5.82 X 10 .3 IN/LB)
0.6
0,4
0.2
0
I
3-D MODEL_ / l
,y
0 100 200 300 400 500 600 700 800
Figure 21-10.
WING BUTT LINE
Comparison of Wing Rear Beam Structural Influence Lines
1.0 I
0.8
i o.6_i
tjN
0.4N
_ 0.2
3-D MODEL
00 500 1000 1500 2000 2500 3000 3500
FUSELAGE STATION
Figure 21-Ii. Comparison of Fuselage Structural Influence Lines
21-11

Similar to the wing results, Figure 21-11 indicates the 2-D model contains
a more flexible fuselage forebody region than the 3-D model with a maximum
difference in influence coefficients of approximately 50-percent occurring at
the nose. Relatively good agreement between the influence lines are noted for
the remaining centerbody and aftbody regions.
These results indicate only the relative trends in stiffness associated
with each modeling technique; for a complete assessment of the a2curacy, addi-
tional analyses are required including the overall effects of static aeroelas-
ticity, vibration and flutter, and strength.
Structural Influence Coefficients
A total of 274 generalized coordinates were defined on the structural model
for calculating the structural influence coefficients (SIC) matrix and the stiff-
ness matrix. The SIC matrix was used to calculate the aeroelastic loads;
whereas, the stiffness matrix after a reduction to approximately 180 degrees-of-
freedom was used for the vibration and flutter analyses.
For both the symmetric and antisymmetric boundary conditions, the 274
generalized coordinates were primarily associated with the Z-displacement
(vertical) degrees-of-freedom. The exception being the antisymmetric coordi-
nates at the fuselage centerline which were related to the y-displacement
(lateral) degrees-of-freedom. In addition, for both boundary conditions,
rotational and y-displacement degrees-of-freedom were defined for the wing
leading edge and wing vertical, respectively.
Because of the importance of the structural influence coefficients (SIC),
an auxiliary plot routine was used to assist in the revLew of the NASTR_N gen-
erated.SIC's. In general, this computer program (FAMAS plot routine) extracts
the d_agonal elements from the NASTRAN SIC matrix for selected sets of wing and
fuselage points, normalizes these values to the largest absolute value of each
set, and plots these as a function of location (fuselage station, butt line,
or water line). These plots display the continuity or discontinuity of the
influence lines and were an aid in assessing the validity of the flexibility
data input to the structural model.
Internal Loads Runs
NASTRAN internal load runs were conducted on each Task I and Task II model
using the aeroelastic loads commensurate with the model stiffness. In addition,
the aeroelastic loads for the final design included Jig-shape effects which are
described in more detail in the following Aeroelastic Loads Analysis section.
The results of the NASTRAN solutions identified the displacements and
internal forces (stresses) associated with the elements of each structural
model. For the point design stress analysis, the internal loads and stresses
from the NASTRAN solution were converted into running loads by an auxiliary
FAMES program.
A comparison of the wing upper surface load intensities (ib/in.) are shown
in Table 21-1 for all structural models. These loads were based on the results
21-12
ORIGINAL PAGE
OF POOR QUALITY

i
TABLE 21-1. COMPARISON OF WING SURFACE LOAD
INTENSITIES - ALL MODELS, MACH 0.90 LOAD CONDITION
*LOAD INTENSITY (ULTIMATE). LBS/IN.
PANEL IDENTIFICATION
REGION NUMBER
WING 40322FORWARD
40236
WING 40536AFT BOX
41036
WING 41316TIP
41348
•LOAD CONDITIONS;
DIRECTION CHORDWISE
Nx - 10Ny 1145Nxy 201
Nx 188Ny 10646Nxy 416
Nx 65Ny 10680Nxy 1118
Nx 274Ny 6670Nxy 1369
Nx 701Ny -11655Nxy 3492
Nx 719Ny 6293Nxy 1535
TASKI
SPANWISE
1481155
275
122-12181
1181
- 13212318
2288
- 3668762027
29812546
3240
57458861797
IIA
MONOCOOUE=i
- 199- 595
211
- 9258102
858
CHORDWISE
8191120
143
• 37711474
436
1483 4718763 112072521 1409
-1094 567-4544 70401949 1581
-932 5928268 121452528 3773
60547312132
106864021990
TASK liB
HYBRID 'HYBRID'STRENGTH) ,FINAL!
- 122 219110(3 1049
112 75
179 15•12779 14311
271 272
458 - 31512680 14410
1068 1159
1052 15623522 47251583 1773
1226 14789504 101063686 373O
877 8565148 65982290 2608
TASK I CONDITION 12: MACH 0.90 nz = 2.5. W = 700.000 LB. Ve _ 325 KEASTASK IIA CON_I_O_,I 9: MACH 090, nz = 25, : 700,000 LB, Ve 325 KEAS
TASK 118 CONDITION 8; MACH 090 nz : 25. W : 700,000 LB. Ve : 325 KEAS _
TABLE 21-2' EFFECT OF JIG-SHAPE ON WING UPPER SURFACE
LOAD INTENSITIES, TASK IIB HYBRID MODEL
PANEL IDENTIFICATION
REGION NUMBER
WING - 40322
FORWARD
40236
WING 40536AFT BOX
41036
41316
W,NG 'TIP
8
• LOAD CONDITIONS:
' LOAD INTENSITY (ULTIMATE), LBS/IN.
DIRECTION
NX
NY
NXY
NX
NYNXY
NX
NY
NXY
NX
NY
NXY
NX
NY
NXY
NX
NY
NXY
ASSUMED JIG SHAPE
MID-CRUISE
151
1106
130
67
14650453
1073
14303
1485
1812
4220
2106
1638
12407
4009
1207
6897
2284
ZERO LOAD
166
1083124
13315596
499
1182
15315
1750
2096
46122471
1700
142804262
1187
8192
2560
TASK II B CONDITION 12: MACH 1.25, n z = 25, W = 690,000 LB. Ve = 294 KEAS
PERCENTAGEDIFFERENCE
t%)
+10
2
5
+98
+7
+10
+10
7+17
+16
+9+17
.4+14
+5
9
+19+12
ORIG_A_ PAGE ]B
nP POOR QUALrI_ 21-13

of the NASTRANstatic solution as defined at the six point-deslgn regions usedfor the structural analysis. Thedirection of the inplane loads correspondstothe basic airplane axes with the exception of the wing tip regions (panels41316and 41318). For these panels the y-direction (spanwise) wasparallel tothe rear beamof the wingtip structure and the x-direction (chordwise) perpen-dicular to the rear beam. Conventional sign notation wasused; positive signsdenote tensile forces and conversely, negative signs denote compression.
A study of the effect of jig-shape on internal loads wasconductedusingthe Task liB strength-sized model. The structural deflections were determinedfor one-g flight condition during mid-cruise flight, these deflections wereapplied negatively to numerically define the jig-shape (i.e., local slope anddeformation of the wing grid points). Having established these values theaeroelastic loads were calculated for the 2.5-g symmetricmaneuvercondition atMach1.25. A summaryof these results, variation of the point design loadintensities with andwithout the jig-shape effect, is shownin Table 21-2 withthe percentage differences indicated.
All load intensities increased whenthe Jig-shape effect was included inthe aeroelastic loads calculations; the exception being the spanwise(Ny) andshear (Nxy) loads at point design region 40322which were reducedby 2-percentand 5-percent respectively. As expected, the largest load intensity variationsoccurred on the more flexible regions of the wing (e.g., a 19-percent increasein spanwiseload intensity for region h1348)which is approximately centerspan of the wing tip.
Beca_]seof the large variation in load intensity attributed to the jig-shapeeffect, the results of this study were incorporated into the elementproperties for the Final Design F.E. model. In addition, the final aeroelasticloads included the jig-shape effect.
AEROELASTICLOADSANALYSIS
Net aeroelastic loads were determined for the aerodynamicshapedefined forthe baseline configuration at selected conditions on the design flight profile.Theseloads were calculated using Lockheed's static aeroelastic loads programfor inclusion in the NASTRANinternal loads solution, and reflected the specificairframe flexibility of each of the general-types of structural arrangements.
The general logic flow diagramof the aeroelastic loads analysis is pre-sented in Figure 21-12. A moredetailed description of the principal tasksinvolved are as follows:
(I) Determination of the critical flight conditions and their relatedflight parameters (speed, altitude, acceleration, and gross weight).
(2) Establishment of the basic aerodynamicgrid systema_d local airfoilgeometryfor calculating the theoretical airloads distributions.
(3) Calculation of the theoretical airloads distribution basedon theapplicable aerodynamictheory for the flight conditions under investi-gation. Condenseand transfer these theoretical panel point loads
21-14

D_EE
CONFIGURATION
FLIGHT PARAMETERS
AERODYNAMIC
LOADS
• STEADY AIC'S
• UNSTEADY AIC'S
FLUTTER
UNSTEADYAIC'S
MASS
--IP"STIFFNESS
I AEROELASTtC
LOADS
SATI_D • MID-CRUISE LOADS
• MID-CRUISE JIG SHAPE
y • INCORPORATE JIG-SHAPE
' • NET FLIGHT LOADS
FINITE ELEMENT
STRUCTURAL ANALYSIS
Figure 21-12. Aeroelastic Loads Evaluation Procedure
TABLE 21-3.
Flight
Ground
CONDITION
CRITICAL LOADING CONDITIONS
MACH
NO. nz SCAT-15F
Sy_net ric O.30 2. O
0.60 2.5
0.90 2.5
1.25 2.5
2.00 2.5
2.70 2.5
2.90 2.5
Asymmetric 0.30O&
O,90 1.67
1.25
TaxiRotation
Landin6
2.0
J
J
L-2000-7
J
J
969-336C
J
J
ARROWWING
J
,/
J
,/
,/
7
J
J
21-15
=

to the structural influence coefficient grid system of the finite-
element model and adjust values to reflect any measured steady state
lift coefficients and aerodynamic center data when required.
(4) Determination of the net aeroelastic flight loads using the theoretical
air load calculated in step (3), the mass matrices, and the airframe
stiffness (SIC'S) as defined by the NASTRAN static solution. These
data were combined with the aid of matrix algebra to formulate dis-
tributed grid point loads on the airplane consistent with the solution
of the equations of motions for the prescribed maneuvers.
Critical Flight Conditions
Previous supersonic transport design studies were reviewed to identify
potentially critical conditions for the baseline configuration concept. Design
conditions for the SCAT-15F, Boeing 969-336C, and Lockheed L-2000-7 supersonic
transport are summarized on Table 21-3. Loading conditions evaluated for this
study are also included on the table to indicate the scope of potentially crit-
ical loading conditions investigated. For the baseline configuration, load con-
ditions were evaluated at both maximum positive and maximum negative load factor
and include all conditions where peak values or rapid change in aerodynamic coef-
ficients exist. During the course of this study, all conditions identified on
Table 21-3 were investigated sufficiently to assure that critical design loads
are included for structural analysis. Supplemental conditions were developed to
ascertain the design loads for specific regions of the wing and fuselage.
The loading conditions for the final design cycle included 8 subsonic spee_
symmetric maneuvers (steady and transient); 7 low supersonic cases, including
negative normal acceleration conditions, steady and tra_slent maneuvers at heav_-
and light gross weights; 4 Mach 2.7 conditions, including mid-cruise level flig_.t
and maneuver, and steady and transient maneuvers at start-of-cruise; 2 dynamic
gust (pseudo) conditions at Mach 0.90 (positive and negative); and h dynamic
landing conditions. These load cases are further identified on the design air-
speed envelope of Figure 21-15. The gust and landing cases were supplemental
conditions developed for the Final Design effort and were selected as critical
for fuselage design. The asymmetric accelerated roll condition was not included
for the final loads run. The roll case resulted in maximum inplane loads in
local regions of the strength-designed wing tip structure. However, with the
added stiffness requirements in this region to suppress flutter, the condition
was deleted from the list of potentially critical conditions.
Theoretical Aerodynamics
Subsonic and supersonic airloads distribution were determined using the
Discrete Load Line Element (DLLE) and Mach Box computer programs, respectively.
The DLLE method is theoretically the same as the Doublet Lattice Method of
Reference 2; the Mach Box method is described in Reference 3. Typical aero-
dynamic grids used for determination of subsonic and supersonic aerodynamics are
displayed in Figures 21-13 and 21-lb.
• ¢
° zo az ' ,,. 21-16

m
\
,\\
I I l = I i ! i i -§
| _ § | ! ii m _ o
,ri_
21-1"{

8O
7O
ORIGINAL PAGE IS
Op POOR QUALIT_
6O
%50
#
2
w
2O
I0
0 100 2(30 300 400 500 600
EQUIVALENT AIRSPEED _ KNOTS
Figure 21-15. Design Load Conditions - Strength/Stiffness
The above theoretical subsonic and supersonic airload distributions were
reviewed for correlation with data developed from the results of NASA wind
tunnel tests of the Arrow-Wing configuration.
To assess the net loads effect, static aeroelastic loads were generated for
a Mach 2.7 symmetrical maneuver condition using both the wind tunnel measured
pressures and the theoretical airload distribution based on Mach box theory.
For the airloads based on the wind tunnel data, the pressures on the wing grid
system were obtained by interpolation of the corrected data and factored to
obtain the lift on each grid element area. These distributions at each angle
of attack were combined into a matrix format for application to the net loads
program, The data in these matrices were used to define all the airloads on the
airplane due to angle of attack. Redistribution of airloads due to flexibility
was computed from theoretical aerodynamic influence coefficients.
A comparison of the net integrated wing shears derived by the Mach box
method and by the application of the measured pressure data is shown in Fig-
ure 21-16. In addition to the wing shears, reduced values of bending moment
and torsion at all wing span stations and reduced shears at all fuselage sta-
tions were noted for the loads generated using the pressure data. These results
occur primarily from the large reduction in tip loading by the measured data
causing a significant inboard shift of the spanwise center of pressure.
¢
21-18

=JR
Reductions in net torsion were less pronounced in the vicinity of the fuselage
due to the more forward location of the chordwise center of pressure frommeasured data at these inboard locations.
Figure 21,17 presents the results of another investigation which was con-
ducted to evaluate the spanwise loading distributions over a wide range of angles
of attack at Maoh 2.7. Loading distributions were developed Using both wind
tunnel force and pressure data and a theoretical method using the Mach Box
Program.
Span loading distributions fromthese methods are shown at two airplane
angles of attack. The lower angle of attack is within the linear range of
wing lift coefficient as a function of angle of attack. For the higher
angles, the wind tunnel measured data indicates a significant unloading of
outboard win_ stations with a high section loading near the fuselage.
The Math Box data represents a wing lift equal to that from integrated pressure
data although with a more outboard center-of-pressure location. Available force
data indicate a higher wing lift but with the same slope.
Differences between the span loading distributions beyond the linear CLversus _ range are more pronounced with the relationships between the several
distributions as previously described. Both force data and integrated pressure
data displayed on Figure 21-18 confirm the non-linear trend of wing lift coef-ficient at higher angles of attack. The Mach Box method is linear and does not
display this tendency.
Results of the loading investigations, which were based on limited amount
of wind tunnel measured pressure data at Mach 2.7, were inconclusive concerning
the choice between using the theoretical aerodynamics or the wind tunn_el test data
for generating the panel point loads. Even though correlation was not obtained,
some geometric similarities were noted between the curves generated using the
theoretical aerodynamics and the measured data. For example, approximately
equal wing lift slopes were noted for the Math 2.7 condition using the Mach Box
and force data, with higher wing lift values noted for the force data.-!
Since correlation was not obtained, the design loads for both subsonic and
supersonic aerodynamics were based on the applicable theoretical aerodynamics(DLLE and Mach Box) and adjusted to reflect the measured steady state lift coeffi-
cients and aerodynamic centers derived from the wind tunnel force data.
Table 21-h presents a summary of the Task I aerodynamic coefficient matrices
with their respective wing lift and aerodynamic centers data.
Grid Transform
Grid transforms were required for transferring aerodynamic loadings from the
aerodynamic influence coefficient (load point) model to a system compatible with
21-19

lZ0Xl03
L_O_
10(
r Bot
40
20
o!
Figure 21-16.
I I
2 51 MANEUVER _ MACH 27
\
THEORETICAL A;C
MEASUREDPRESSUREDATA WiTH NACELLES
tl_ 200 300 400 500 600 700 I_
BUTT LiNE _ iNCH
t I | i J
0 5 10 15 20
BUTT L_NE _ METER
Net Integrated Wing Shears - Theoretical vs Measured
15
i
0
15
0
0
- 5-DEGREE5
2 .4 8 8
q- FRACTION OF SEMI_AN
Figure 21-17. Span LoadingDistribution - Mach 2.7
1,0
24
,20
,16
12
,04
//
I i I2 4 6
ANGLE OF ATTACK - OEG.
Figure 21-18. Wing Lift
Coefficients - Mach 2.7
4
21-20

i- -_ £--
=_
MACH
NUMBER
0.60
0.90
1.25
2.0
2.70
TABLE 21-4. SUMMARY OF ADJUSTED AERODYNAMIC COEFFICIENT
MATRICES -- TASK I (k=O)
BOUNDARY
CONDITION
Symmetric
Antisymmetric
Symmetric
Antisymmetric
Symmetric
Antisymmetric
Symmetric
Symmetric
MATRIX SIZE
274 x 325
274 x 233
274 x 325
27h x 233
27h x 536
274 x 487
274 x 621
274 x 621
TOTAL
EFFECTIVE CL
2.42
2.58
2.52
1.92
1.55
LOCATION
OF A. C.
FS 2324
FS2324
FS 2391
FS 2356
FS 2324
r
the structural influence coefficient (stress and weight) grid. The transforma-
tion matrices [Dz] and [De] express deflection, z, and chordwise slope, 8 ,
respectively, at the AIC points in terms of the deflection, z, at the SIC
"given" points. An equivalent set of forces at the structural grid is obtained
when the column of lumped aerodynamic forces and pitching moments were pre-
multiplied by the matrices [Dz]T and [De]T.
The [Q] matrix, obtained from the aerodynamic influence coefficient program,relates the loading at load points (SIC points) to deflection at control points.
Since load points correspond to SIC points on the structural model, a Unit [Dz]
matrix was used. Determination of angular deflections requires that the deflec-
tion at SIC points due to load at control points be defined. One set of control
points was used in determining subsonic A.I.C.'s; however, each supersonic speed
condition requires a set of control points since their number and location were
a function of Mach number.
Mass Distribution
Inertia data were based on the mass distribution commensurate with each of
the design stages. These masses were distributed as panel point loads concen-
trated at the load panel grid, Figure 21-19. This grid system is identical to
the Structural Influence Coefficient (SIC) grid system of the structural model.
Mass distributions were derived for the operating weight empty condition, and
for the payload and fuel, respectively. Using these distributions, which.repre-
sent one-half airplane values, and the pertinent flight data (n z, 8, and @ ) the
inertia loadings at the S.I.C. grid points were determined for the flight con-
ditions investigated. These inertia loading were stored in matrix format for
the net loads program.
21-21

Figure 21-19. Load Panel Grid
Jig Shape Definition
The aerodynamic shape of the aircraft changes during flight due to aero-thermoelastic and inertial effects. This is a result of inflight variations in
dynamic pressure, Mach number, gross weight, and weight distribution_ the latter
two result from fuel consumption.
The governing aerodynamic shape serving as the analytical starting point,
was the shape providing the optimum performance characteristics in one-g mid-
cruise flight. The initial shape of the aircraft was defined at the design cruiselift coefficient by a computer card deck supplied by NASA. This external shape
reflected the NASA 15F airplane without a canard or inboard leading edge devices.
During the course of this study additional modifications, mainly in the fuselage
and wing tip areas, were adopted and incorporated into the configuration as
defined by the data deck. Section 2 of this report contains a description of
these configuration requirements.
The zero-load shape was designed into the aircraft so that when it was sub-
Jected to one-g level-flight loads and to temperatures occurring in the mid-cruise
environment, the airframe elastic deformations resulted in an aircraft that had
the desired optimum aerodynamic shape. The manufacture of the aircraft was then
made in accordance to this zero-load shape in the Jig, where the weight was sup-
ported in a manner that precludes elastic deformations.
The procedure to establish the jig shape was as follows:
(i) The analytical starting point was the description (camber and twist)
Of the mid-cruise shape.
I_C & T, mid-crl
(2) _alysis was performed to calculate structural deflections due to
flight loads occurring during mid-cruise flight. Where the deflection
matrix [_Sz] is defined by the product of the structural influence
+
¢
,+ .
21-22
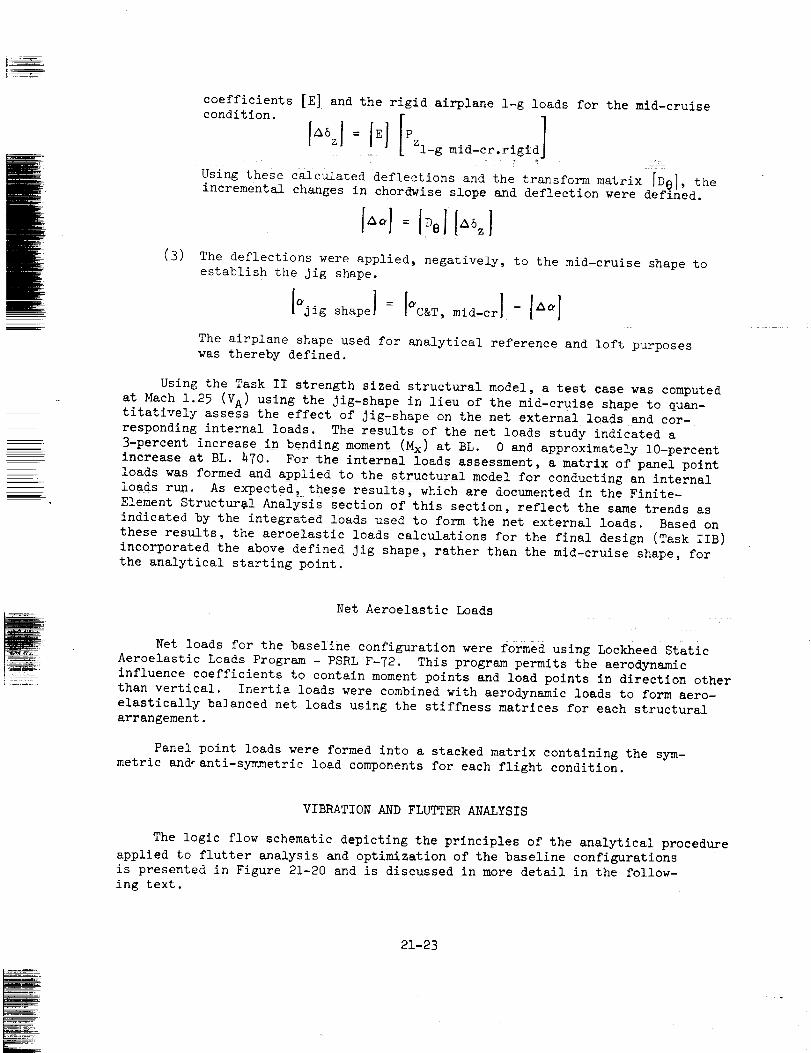
coefficients [E] and the rigid airplane l-g loads for the mid-cruise
condition. [ ]_ l-g mid-cr.rigid
Using these calculated deflections and the transform matrix IDel , theincremental changes in chordwise slope and deflection were defined.
(3) The deflections were applied, negatively, to the mid-cruise shape to
establish the jig shape.
I_Jig shapel = I_C&T, mid-crl- I_l
The airplane shape used for analytical reference and loft purposes
was thereby defined.
Using the Task II strength sized structural model, a test case was computed
at Mach 1.25 (V A) using the Jig-shape in lieu of the mid-cruise shape to quan-
titatively assess the effect of Jig-shape on the net external loads and cor-
responding internal loads. The results of the net loads study indicated a
3-percent increase in bending moment(Mx) at BL. 0 and approximately 10-percent
increase at BL. 470. For the internal loads assessment, a matrix of panel point
loads was formed and applied to the structural model for conducting an internal
loads run. As expected, these results, which are documented in the Finite-
Element Structural Analysis section of this section, reflect the same trends as
indicated by the integrated loads used to form the net external loads Based on
these results, the aeroelastic loads calculations for the final design (Task lIB)
incorporated the above defined Jig shape, rather than the mid-cruise shape, for
the analytical starting point.
Net Aeroelastic Loads
Net loads for the baseline configuration were formed using Lockheed Static
Aeroelastic Loads Program - PSRL F-72. This program permits the aerodynamic
influence coefficients to contain moment points and load points in direction other
than vertical. Inertia loads were combined with aerodynamic loads to form aero-
elastically balanced net loads using the stiffness matrices for each structural
arrangement.
Panel point loads were formed into a stacked matrix containing the sym-
metric and-anti-symmetric load components for each flight condition.
VIBRATION AND FLUTTER ANALYSIS
The logic flow schematic depicting the principles of the analytical procedure
applied to flutter analysis and optimization of the baseline configurations
is presented in Figure 21-20 and is discussed in more detail in the follow-
ing text.
21-23
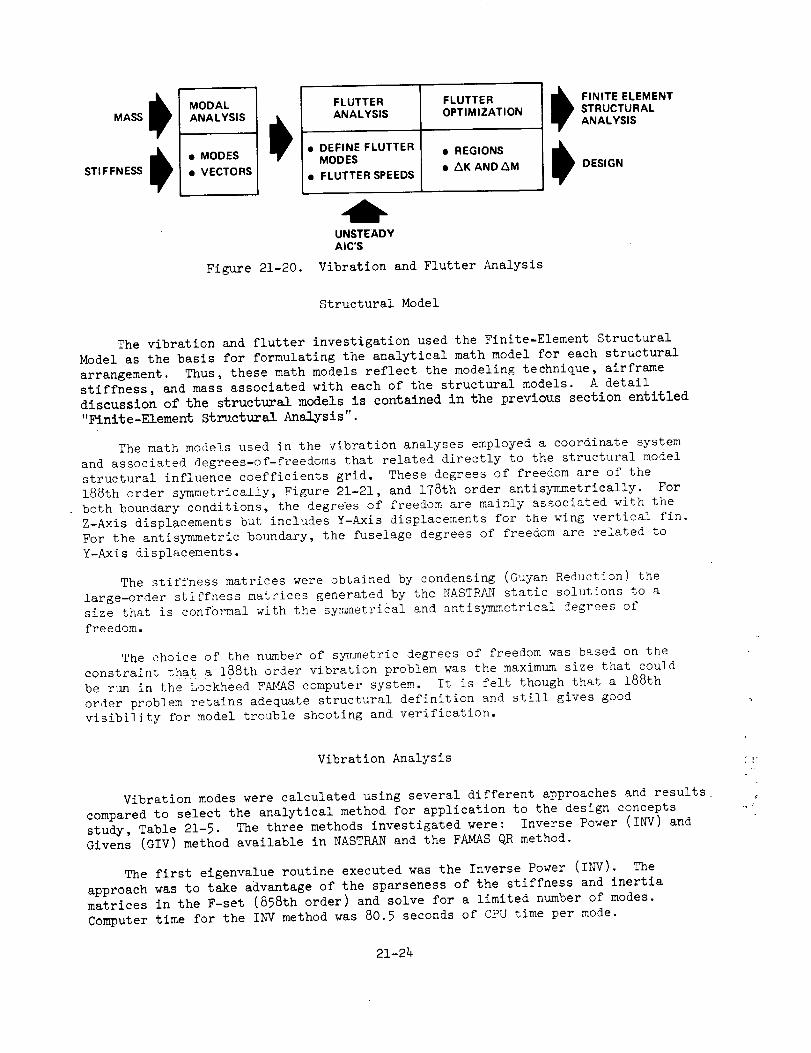
STIFFNESS
MODALANALYSIS
• MODES
• VECTORS
FLUTTERANALYSIS
• DEFINE FLUTTERMODES
• FLUTTER SPEEDS
FLUTTEROPTIMIZATION
• REGIONS
• AK AND AM
FINITE ELEMENTSTRUCTURALANALYSIS
DESIGN
Figure 21-20.
UNSTEADYAIC'S
Vibration and Flutter Analysis
Structural Model
The vibration and flutter investigation used the Finite-Element Structural
Model as the basis for formulating the analytical math model for each structural
arrangement. Thus, these math models reflect the modeling technique, airframe
stiffness, and mass associated with each of the structural models. A detail
discussion of the structural models is contained in the previous section entitled
"Finite-Element Structural Analysis".
The math models used in the vibration analyses employed a coordinate system
and associated degrees-of-freedoms that related directly to the structural model
structural influence coefficients grid. These degrees of freedom are of the
188th order symmetrically, Figure 21-21, and 178th order antisymmetrically. For
both boundary conditions, the degrees of freedom are mainly associated with the
Z-Axis displacements but includes Y-Axis displacements for the wing vertical fin.
For the antisymmetric boundary, the fuselage degrees of freedom are related to
Y-Axis displacements.
The stiffness matrices were obtained by condensing (Ouyan Reduction) the
large-order stiffness matrices generated by the NASTRA_ static solutions to a
size that is conformal with the symmetrical and antisymmetrical degrees of
freedom.
The choice of the number of symmetric degrees of freedom was based on the
constraint that a 188th order vibration problem was the maximum size that could
be run in the Lockheed FAMAS computer system. It is felt though that a 188th
order problem retains adequate structural definition and still gives good
visibility for model trouble shooting and verification.
Vibration Analysis
Vibration modes were calculated using several different approaches and results
compared to select the analytical method for application to the design concepts
study, Table 21-5. The three methods investigated were: Inverse Power (INV) and
Givens (GIV) method available in NASTRAN and the FAMAS QR method.
The first eigenvalue routine executed was the Inverse Power (INV). The
approach was to take advantage of the sparseness of the stiffness and inertia
matrices in the F-set (858th order) and solve for a limited number of modes.
Computer time for the INV method was 80.5 seconds of CPU time per mode.
7i-
¢
21-24

I LOCATION OF DEGREE OF FREEDOM 159 163
141 147 _ 164
,_;_._'_,_._/,_ \• "j/__"_£Y/,j" \
t t / /--tl -,°o-,=
_...-74._d"_[ i I I 1 ]/ /_---.&sJ,___cfL[_[_[ LLI I I I [[ _ .,_-,.
_..---"_J"'T_-CT_I__-LI._I-I I I I I J_ (ENC'NE_
FUSELAGE
Figure 21-21. Symmetric Degrees of Freedom for Vibration Analysis
Because of the very high computer times, the problem was reduced to the
188th order. This matrix reduction required 89 seconds. The INV method was
again executed and resulted in 60.5 seconds of CPU time per mode; _hereas, the
Givens method for the same reduced order problem resulted in 2.3 seconds of
CPU time per mode.
The reduction to 188th order eliminated only a few inertial deErees of
freedom (approximately 10-percent) and resulted in a problem size small enough
so that the FAMAS QR method could also be exercised. The QR method resulted
in 3.6 seconds of CPU time per mode.
The Givens and QR methods not only result in a marked reduction in computer
time but_also solve for all 188 roots, a definite advantage over the INV.
TABLE 21-5. ANALYTICAL METHODS FOR VIBRATION ANALYSIS
MATRIX
METHOD SIZE
INVE RSE K)WE R
INVERSE POWER lira
GIVENS 188
GIVENS
QR
188
18e
CPU TIMEN_ BE R (SEC I
ROOTS TOTAL FE R MODIE (1)
20 1610 80.5
2 I;11 605
18g 113 :11
140 VECTORS
188 g3 2 3
I40 VECTORS)
188 14S 3.6(40 VECTORS
FREOUENCY 12){HZ)
MGOE 1 MOOE' :1
1470223 2 049_00
1 471204 ;t.0f_224
1 4712Q3 2055210
09275528 10077311
092_19 1_7_
(|) BASED ON NUMBER OF EIGEN VECTORS FOUND
{21 FREQUSNCIE$1 AND2 ARE NOT NECESSARILY THE LOWEST
FREQUENCIES, ALSO THE LAST TWO CASES (GIVEN AND OR}USED A DIF FERENT MASS MATRIX THAN THE FIRST THREE CASES
21-25

method where it is possible to miss a mode. No significant differences in
accuracy was noted between the three methods.
Based on the results presented the Givens Method is superior to the other
methods and was selected as the vibration analysis method for the study.
The stiffness matrices of each structural arrangement, as derived from the
structural models, were combined with the appropriate inertia matrices to compute
the symmetric and anti-symmetric eigenvectors and eigenvalues of the free-free
airplane. The inertia matrices were formed for two airplane weight conditions
namely: the operating weight empty (OWE), and the full fuel and full payload
(FFFP). These weight conditions represent the extremes of minimum and maximum
weight. No intermediate weight conditions were examined. In general, 50 vibra-
tion modes were extracted from each vibration solution for use in the flutter
analysis and flutter optimization.
Aerodynamic Formulation
The steady and unsteady aerodynamic influence coefficients (AIC) were com-
puted for Mach 0.60, 0.90, 1.25 and 1.85. The flutter analyses conducted on the
Task II final design airplane included an analysis of these Mach numbers with the
exception of the Mach 1.25 condition; whereas, the Task I analytical design
studies encompassed only the first three Mach numbers. The Maeh 0.60 and 0.90
AIC's were computed by the Doublet-Lattice method of Reference 2, while the
Mach 1.25 and 1.85 AIC's were computed by the Mach Box method of Reference 3.
The AIC's were computed for the wing, the wing fi b and the empennage surfaces,
and were adjusted, when required, to reflect measured wind tunnel force data
steady state lift coefficients and aerodynamic centers. The Mach 0.60 and 0.90
AIC calculations account for the interference between the wing and the wing fin;
whereas, the Mach 1.25 and 1.85 AIC's do not include this effect.
The significance of the aerodynamic interference between the wing and wing
fin is shown by Figure 21-22, which presents CC_/CCL_ and aerodynamic center (a.c.)
versus fraction of the semispan. The data visually relates the wing fin inter-
ference effect on the distribution for the applicable Mach numbers. For the Mach
0.60 and 0.90 conditions, which include the interference effect, an increase in
the CC_/CCL_ distribution inboard of the wing fin and a decrease in the CC_/CCLe
distribution outboard of the wing fin is noted in contrast to the clean-wing
aerodynamics calculated for Mach 1.85.
The normalized CL_ versus reduced frequency is presented in Figure 21-23.
The normalized CL_ is CL_ at a finite reduced frequency divided by CL_ for a
reduced frequency of zero. The figure presents the real and imaginary parts
of the normalized CL_ for Mach 0.90 and 1.85 and thus shows the variation in
amplitude/phase as a function of Mach number and reduced frequency. As can be
seen the Mach 1.85 aerodynamics is composed primarily of the real ,part. This
differs from the Mach 0.90 aerodynamics which exhibits a mix of the real and
the imaginary parts.
O IG VA, .
21-26
• ¢

1,5
t_..f 1.0
CJ
_ u
_ 0.5
REDUCED FREQUENCY = 0, o_= UNIT DOWNWASH
I MACH NUMBER
o5oO o,_• 1.85
METHOD 1
DOUBLET - LATTICE
DOUBLET - LATTICE
MACH BOX
G 0.6- WING
B_wQIJll I
I I I _=' i'l _
0.2 0.4 0.6 0.8 1.0
17 _FRACTION OF SEMISPAN
_) 0.4
0.2
<_ o
WING
FIN
.._ _ ,l_ ll_l I
I I I i i
0.2 0.4 0.6 0.8 1.0
17 _ FRACTION OF SEMISPAN
NOTE: THE WING/WING FIN AERODYNAMIC INTERFERENCE EFFECT:
• INCLUDED IN THE MACH 0.60 AND 0.90 AERODYNAMICS
• NOT INCLUDED IN THE MACH 1.85 AERODYNAMICS
Figure 21-22. Theoretical Aerodynamic Distribution
i.75
1.50
1 25
1.90
/CL_)
.75
.50
.25
Figure 21-23.
LEGEND
,_ MACH 0.90 REAL
• MACH 0.90 tMAGINARY
Q MACH 1.85 REAL
• MACH 1,85 IMAGINARY
/
/
fJ
J
fI
/
/
//
/
f
/
sr
I 2 3 4 5 6 7
Re_EO r.E_ENCY_o/v)
Normalized CL Versus Reduced Frequency
21-27

Flutter Analysis
The flutter analyses of each of the structural arrangements investigated for
application to the arrow-wing configuration was conducted using the method of
solution described in Reference 4 as the p-k method. This method is contained
in the FAMAS library and results in a solution which defines rate of decay and
frequency for preselected values of speed and gives matched altitude, Mach number,
and reduced frequency (k) for each mode at each preselected velocity.
All matrices involved in this solution are real and uniquely defined, except
for the aerodynamic influence coefficient matrix which is complex and must be
given for a sufficient number of k values. For the p-k method, the flutter
equation is solved at several values of airspeed and air density, or combinations
thereof, for complex roots p associated with the modes of interest. These modes
of interest were determined from a review of the vibration analysis and/or from
previous flutter analysis. In addition, all analyses assume a structural damping
of 2-percent.
Two fundamental questions arose during the flutter analysis, namely:
(i) How many vibration modes are required to arrive at the converged
flutter solution?
(2) How many AIC matrices, as a function of reduced frequency (k), are
required to arrive at a converged flutter solution?
Both of these questions were investigated during the course of the flutter
studies.
In response to the first question, velocity versus aamping for the i0, 15
and 20 vibration mode flutter analyses are shown in Figure 21-2h. Tt can be seer_
that the character of the flutter modes can be significantly changed by going
from 20 to i0 vibration modes. Figure 21-25 shows the flutter velocity ,_f the
bending and torsion flutter mode as a function of the number of vibration modes
used in the flutter analysis. This figure shows that the flutter velocity
changes only 1-percent when the number of vibration modes vary from 20 to 50.
As a consequence of this study, 20 or more vibration modes were used in all
subsequent flutter analyses.
The number of AIC matrices required to arrive at a converged flutter solution
was investigated by running a flutter analysis with AIC matrices corresponding to
17 k values and then repeating this analysis with every other AIC matrix elimi-
nated (9 k values). Within the reading accuracy of the flutter plots the results
from these analyses were identical. As a consequence of this study, AIC matrices
corresponding to at least 9 k values were used in all subsequent flutter analyses.
Symmetric and antisymmetric flutter solutions were conducted at sufficient
Maeh numbers to assess the structural dynamic characteristics of the various
structural arrangements. And in general, these solutions were conducted for both
operating weight empty (0_) and full fuel and full payload (FFFP) airplane
weight conditions. As an example of these solutions, the symmetric flutter solu-
tion for the OWE Final Design airplane at Mach 0.90 is shown in Figure 21-26. For
this condition, the critical flutter mode was the wing bending and torsion mode.
The figure also presgnts a trace of the critical flutter speed for this mode on
ORIGINAL PAGE IS
OF POOR QUALIT?
21-28
.]"
E ¢
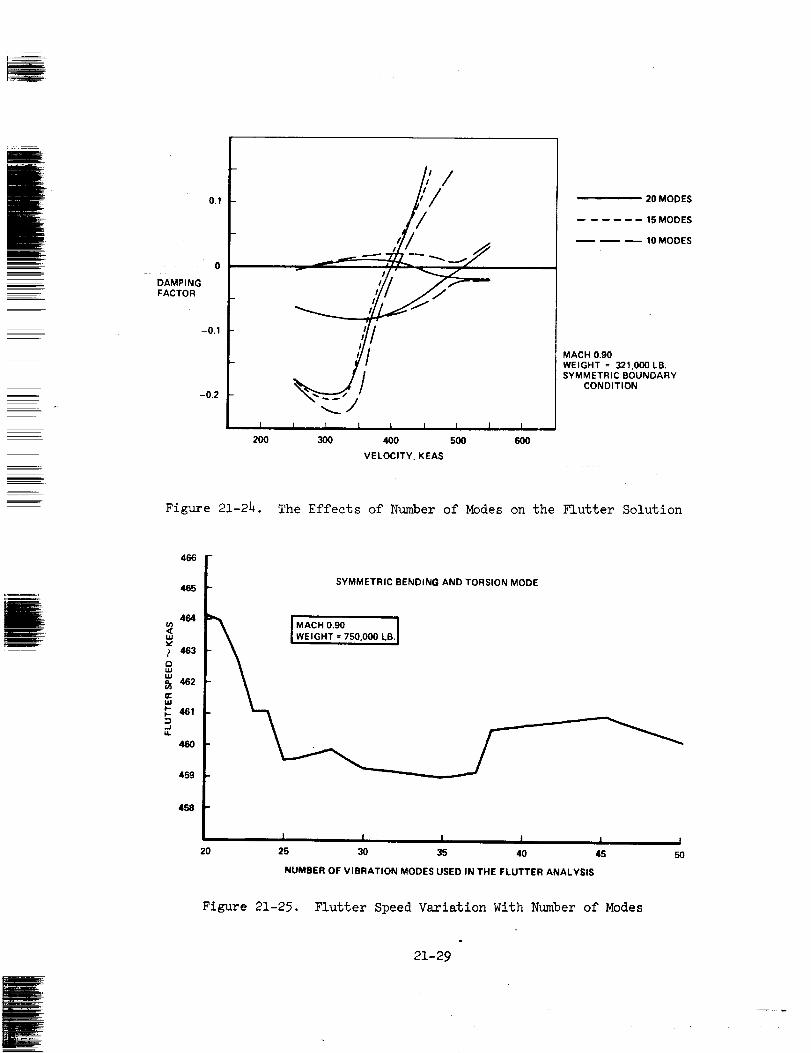
DAMPINGFACTOR
0.1
-0.1
-0.2
/
200 300 400 500 600
VELOCITY. KEAS
20 MODES
15 MODES
10 MODES
MACH 0.90WEIGHT = 321.000 LB,SYMMETRIC BOUNDARY
CONDITION
Figure 21-24. The Effects of Number of Modes on the Flutter Solution
465
464
w
t 463O
m
458
20
SYMMETRIC BENDING AND TORSION MODE
I MACH 0.90WEIGHT = 750,000 LB. I
I , | ! I I2=3 30 35 40 45
NUMBER OF VIBRATION MODES USED IN THE FLUTTER ANALYSIS
I
5O
Figure 21-25. Flutter Speed Variation With Number of Modes
21-29

MACH 0.90
OEW = 314.000
°'I0.10
i 0.1o
.0.2_
.0.30
1 L_,J* I BENDING AND ¢ / ]
.....1........1....l....VELOCITY _ KEA$
FLUTTER ANALYSIS
x
i_.,: . ,E_E.o .Ol1¢ IIVSEIGHT " 314,000L Im
_oFLUTTE" _ 18 _'_ _LUTTE.
MACH 0.1
EQUIVALENT AI RSPEIED _ KNOTS
FLUTTER SPEEDS
Figure 21-26. Flutter Analysis Results
SYMMETRICFLUTTERANALYSIS - CHORDWISESTIFFENEDARRANGEMENT
MACH NO. - 0.90 WEIGHT• 750.000LBS.
PARTICIPATION COEFFICIENTS- FLUTTERMODE8 - BENDINGAND TOR'SIONMODE
FLUTTER_ 379 KEAS
I
I "° ZERO AIRSPEED MODE_
o • ,..l/l',_...._ 2_ _<.
I BENDING M O_I . _ ,_ ;OR,ION MODE
' F T " " vv_,v
I !-o., t 1
I |
o.5
PARTICIPATIONCOEFFICIENTS
0
oi.0
i I0 I OO 200 300 400 500
VELOCITY _ KEAS
6OO
Figure 21-27. Participation Coefficients - Mach 0.9 - FFFP-Mode 8
!
r
21-30
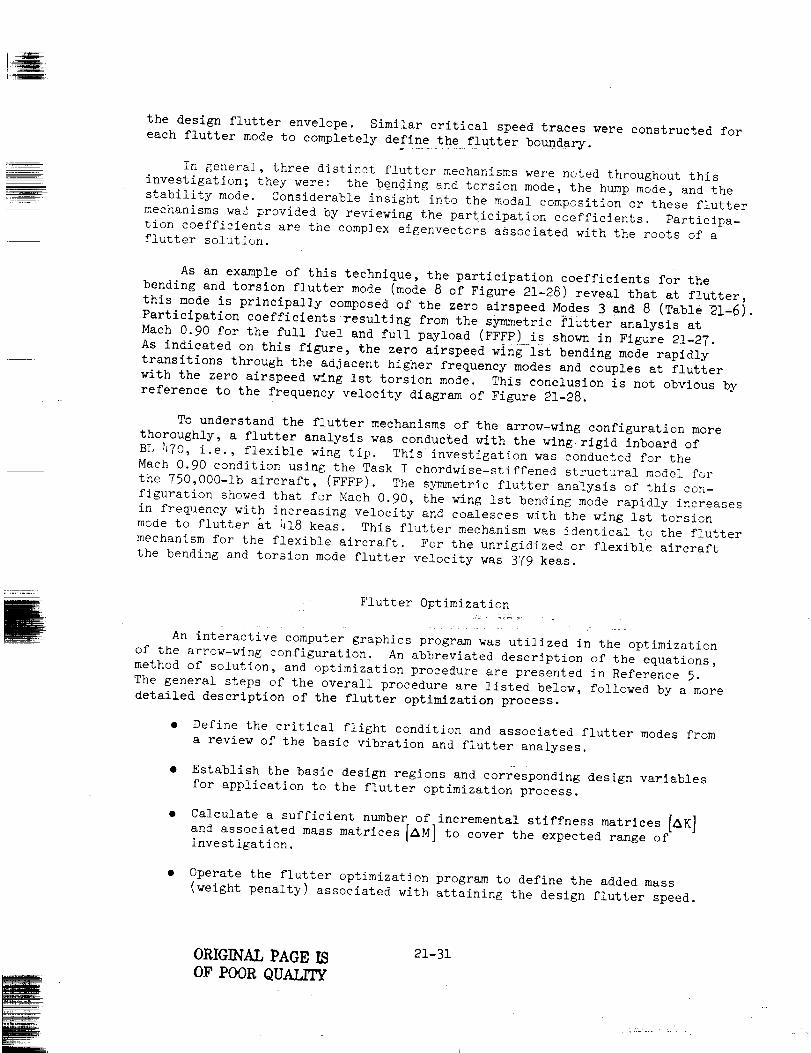
the design flutter envelope. Similar critical speed traces were constructed for
each flutter mode to completely define the flutter boundary.
In general, three distinct flutter mechanisms were noted throughout this
investigation; they were: the ......... and torsion mode, the hump mode, and the
stability mode. Considerable insight into the modal composition or these flutter
mechanisms wa_ provided by reviewing the participation coefficients. Participa-
tion coefficients are the complex eigenvectors associated with the roots of a
flutter solution.
As an example of this technique, the participation coefficients for the
bending and torsion flutter mode (mode 8 of Figure 21-28) reveal that at flutter,
this mode is principally composed of the zero airspeed Modes 3 and 8 (Table 2!-6).
Participation coeffieients_resulting from the symmetric flutter analysis at
Mach 0.90 for the full fuel and full payload (FFFP) is shown in Figure 21-27.
As indicated on this figure, the zero airspeed wing ist bending mode rapidly
transitions through the adjacent higher frequency modes and couples at flutter
with the zero airspeed wing 1st torsion mode. This conclusion is not obvious by
reference to the frequency velocity diagram of Figure 21-28.
To understand the flutter mechanisms of the arrow-wing configuration more
thoroughly, a flutter analysis was conducted with the wing rigid inboard of
BL 470, i.e., flexible wing tip. This investigation was conducted for the
Math 0.90 condition using the Task I chordwise-stiffened structural model for
the 750,000-ib aircraft, (FFFP). The symmetric flutter analysis of this con-
figuration showed that for Mach 0.90, the wing 1st bending mode rapidly increases
in frequency with increasing velocity and coalesces with the wing 1st torsion
mode to flutter at 418 keas. This flutter mechanism was identical to the flutter
mechanism for the flexible aircraft. For the unrigidized or flexible aircraft
the bending and torsion mode flutter velocity was 379 keas.
_ Flutter Optimization
An interactive computer graphics program was utilized in the optimization
of the arrow-wing configuration. An abbreviated description of the equations,
method of solution, and optimization procedure are presented in Reference 5.
The general steps of the overall procedure are listed below, followed by a more
detailed description of the flutter optimization process.
Define the critical flight condition and associated flutter modes from
a review of the basic vibration and flutter analyses.
Establish the basic design regions and corresponding design variables
for application to the flutter optimization process.
Calculate a sufficient number of incremental stiffness matrices [AK]
and associated mass matrices [AM] to cover the expected range of
investigation.
• Operate the flutter optimization program to define the added mass
(weight penalty) associated with attaining the design flutter speed.
ORIGINAL PAGE IS
OF POOR QUALITY
21-31

SYMMETRIC FLUTTER ANALYSIS -CHORDWISE STI FFENED ARRANGEM ENTMACH NO. = 0,9
WEIGHT = 750.000 LBS
60
50
40
FREQUENCY
HERTZ
30 7, r7
5
10 3mmmm _
2 RIGID BODY MODES NOT SHOWN
o 1 1 I I0 1_ 21111 300 400 51111
VE LOCITY_ KEAS
030
020
010
DAMPING
FACTOR
00
0.10
O20
/BENDING AND TORSION MODE
/!
6
3.u
600 0 100
#8
c
j4"
200 300 40O
VELOCITY _ KEAS
5OO 6OO
Figure 21-28. Symmetric Flutter Analysis -Mach 0,9 - FFFP
TABLE 21-6. LOWER FREQUENCY SYMMETRIC VIBRATIONMODES - CHORDWISE STIFFENED
MODE DESCRIPTION
MODE
FREQUENCY _ HERTZ
1 RIGID 8ODY
2 RIGID BODY
3 WING 1ST BENDING
4 FUSELAGE 1ST BENDING
ENGINE PITCH IN PHASE
ENGINE PITCH OUT OF PHASE
7 FUSELAGE 2NO BENDING
8 WING 1ST TORSION
OWE FFFP
0000 0 000
0001 0.001
1009 0933
1381 1.206
1641 1.627
1.817 1 815
2,784 2,261
3 288 3 104
• ¢
OWE _ WEIGHT =321,000 LBS
FFFP _ WEIGHT =750,000LBS
21-32

Basic Design Regions.- For the initial optimization studies conducted in
Task I, the selection of design regions was of an exploratory nature to provide
a general assessment of the effectiveness and optimum distribution of material
for the overall wing planform. Thus, the wing planform was divided into i0
general regions (Figure 21-29), which included the two engine support beam
locations. Natural boundaries were retained in the establishment of these
regions as indicated by their location with respect to the landing gear well,
major chordwise ribs, wing vertical, etc.
The application of the coarse-grid modeling philosophy to the optimization
procedure provided the necessary insight for the investigator to eliminate the
regions which least _ffected the critical flutter mechanism under investigation.
Thus, a more detailed grid system, with fewer overall regions, can be concentrated
at the most efficient wing location. As an example, the solution for the Task I
monocoque de'sign, which used the coarse grid system shown in Figure 21-29, indicated
the wing tip structure to be the most effective region for adding stiffness and
mass to achieve the desired flutter speed. It was also shown that the bending
and torsion mode flutter mechanism was controlled by the wing inertial and
....f!exibility characteristic_ outboard of BL h70. Thus, for the more detailed
evaluation of the stiffness requirements for the Final Design airplane the
optimization effort focused on the wing tip structure. Five design regions
were defined for the wing tip structure planform (in lieu of 2 for Task I) as
indicated on Figure 21-30. The establishment of the design region boundaries
considered the location of the wing vertical and appropriate ribs and spars as
may be required. However, the primary influence in the selection was the
natural boundaries defined by the structural model.
Design Variables.- The flutter optimization procedure uses incremental
stiffness and mass parameters as a set of structural design variables. Using
these parameters, the expressions for mass and stiffness take the following
form:
i 01+ii=l
I l:I 0J I ili=l
where [M], [K] are the matrices of total massr_and stiffness_r_ [Mo]' [Ko] arematrices of the fixed mass and stiffness; [Mi] and [Ki] are mass and stiffness
matrices ass6ciated with a unit of the design variable _. The design variaole
can be a unit of area or thickness as related to their respective axial ele-
ment or shear panel element defined in the structural model.
For the flutter calculations, a reduction in the size of stiffness
matrix is required over the large-order stiffness matrix obtained from the struc-
tural model. As a result of this coordinate reduction, the relationship between
the design variable _ and its associated stiffness K are nonlinear and require
additional computer runs to define this relationship with sufficient accuracy.
Data points to define this nonlinear relationship are derived by formulating a
21-33

Figure 21-29. Design Regions for Flutter Optimization - Task I
BL 470
BL 795
¢
Figure 21-30. Design Regions for Flutter Optimization - Task II
21-34

separate NASTRAN bulk data deck for each of the basic design regions. These
decks contain the element property cards with the incremental changes in geometry.
Using these decks, the stiffness matrices are obtained from the NASTRAN static
solution and condensed to the desired size for the flutter optimization process.
An example of this effect is shown in Figure 21-31, which shows the increments
in four elements of the Arrow Wing stiffness matrix as a function of increments
in cover sheet thickness of the appropriate design variable. The stiffness
matrices from which these results were obtained are from the Task I chordwise-
stiffened arrangement.
Optimization Procedure.- Once the basic design regions were established the
optimization process was initiated. This involved the following steps:
(i) The basline stiffness, [K0] , and mass matrices,[Mo], were formed using
NASTRAN in a large order system. [Mo] was input as a matrix in the
NASTRAN Bulk Data Deck.
(2) These matrices were condensed to 188th order using the Guyan Reduction
so that a vibration case could be more readily obtained.
(3) The vibration calculation which was then performed produced 50 normal
mode shapes. These can be used to reduce the problem size to 50th order
by a pre- and post-multiplication of the baseline 188th order [K0]
andIn0](4) A flutter solution was then obtained using these matrices. This
yielded the flutter speed for the baseline configuration.
(5) NASTRAN was used to generate [_K] and [_M] matrices. Only the incre-ment in element sizing for a particular [_KI was input for the struc-
tural model. The base stiffness, [Ko] , wasJthen added to [_K] in the
large order system, and the resulting [K0 + _K] was condensed by the
_Ouyan Reduction to 188th order. The NASTRAN mass generator program
was used to form [_M] directly from the sizing increments (_t) on the
element property cards in the NASTRAN Bulk Data Deck. This matrix
was then reduced to 188th order by the same technique. [_K] matrices
in this system were formed by subtracting [Ko] from [K 0 + _K].
(6) These [_K] and [_M] matrices were reduced to 50th order bY modalizing
with the normal mode shapes from the basline vibration analysis.
(7) All of these 50th order matrices were input into an interactive computer
graphics flutter optimization program. This program allows the engineer
to choose a flutter speed and then calculate _- "how much" of each
[_K], taken one at a time, is necessary to satisfy this constraint.
The engineer may update the structure to any combination of [_K] and
[_M] matrices desired. In doing this, the _ solutions are taken into
account, and the structure is modified so that an optimum structure
(minimum weight) results.
21-35

o
¢
N!
/
b I"
_ x
O0
#
I
N_ ./
yI
mb I
X
I I
I
m_ <_ mm
I
I
\g
0
X
o
.H
.H
o
0
dI
¢
21-36
(8) Because the modifications made to the structure above were not reflected
in the vibration modes used in the analysis, it was necessary to define
a new baseline configuration. Thus the resulting structure from (7)" was
defined as a new baseline configuration and the process was repeated in
an iterative manner until the distribution of _'s converged on a solu-
tion and gave the desired flutter speed. This was the optimum design
for flutter.
REFERENCES
l°
o
.
.
Schultz, H.D., "Thermal Analyzer Computer Program for the Solution of
General Heat Transfer Problems", Lockheed-California Company
Report LR 18902, 1965.
Albano, E. and Rodden, W.P., "A Doublet-Lattice Method for Calculating
Lift Distributions on Oscillating Surfaces in Subsonic Flows," AIAA
Journal, Volume 7, February 1969, pp 279-285, Errata AIAA Journal,
Volume 7, November 1969, p 2192.
Pines, S., DugundJi, J., and Neuringer, J., "Aerodynamic Flutter
Derivatives for a Flexible Wing with Supersonic and Subsonic Edges,
J. Aeronaut. Sci. 22, pp 693-700 (1955).
Hassig, H.J., "An Approximate True Damping Solution of the Flutter
Equation by Determinate Iteration," Journal of Aircraft, Volume 8,
November 1971, pp 885-889.
Radovcich, N.A., "Structural 0ptimization with Flutter Speed and
Minimum Gage Constraints," Lockheed-California Company Report LR 26405,
April 15, 19714.
OFpOOaQu rZ
21-37