Strength characterization of knee flexor and extensor muscles in Prader-Willi and obese patients
8
BioMed Central Page 1 of 8 (page number not for citation purposes) BMC Musculoskeletal Disorders Open Access Research article Strength characterization of knee flexor and extensor muscles in Prader-Willi and obese patients Paolo Capodaglio* 1 , Luca Vismara 1 , Francesco Menegoni 1,2 , Gabriele Baccalaro 1 , Manuela Galli 2 and Graziano Grugni 3 Address: 1 Orthopaedic Rehabilitation Unit and Clinical Lab for Gait Analysis and Posture, Ospedale San Giuseppe, Istituto Auxologico Italiano IRCCS, Piancavallo (Verbania), Italy, 2 Bioengineering Department, Politecnico di Milano, Milano, Italy and 3 Division of Auxology, Ospedale San Giuseppe, Istituto Auxologico Italiano IRCCS, Piancavallo (Verbania), Italy Email: Paolo Capodaglio* - [email protected]; Luca Vismara - [email protected]; Francesco Menegoni - [email protected]; Gabriele Baccalaro - [email protected]; Manuela Galli - [email protected]; Graziano Grugni - [email protected] * Corresponding author Abstract Background: despite evidence of an obesity-related disability, there is a lack of objective muscle functional data in overweight subjects. Only few studies provide instrumental strength measurements in non-syndromal obesity, whereas no data about Prader-Willi syndrome (PWS) are reported. The aim of our study was to characterize the lower limb muscle function of patients affected by PWS as compared to non-syndromal obesity and normal-weight subjects. Methods: We enrolled 20 obese (O) females (age: 29.1 ± 6.5 years; BMI: 38.1 ± 3.1), 6 PWS females (age: 27.2 ± 4.9 years; BMI: 45.8 ± 4.4) and 14 healthy normal-weight (H) females (age: 30.1 ± 4.7 years; BMI: 21 ± 1.6). Isokinetic strength during knee flexion and extension in both lower limbs at the fixed angular velocities of 60°/s, 180°/s, 240°/s was measured with a Cybex Norm dynamometer. Results: the H, O and PWS populations appear to be clearly stratified with regard to muscle strength.: PWS showed the lowest absolute peak torque (PT) for knee flexor and extensor muscles as compared to O (-55%) and H (-47%) (P = 0.00001). O showed significantly higher strength values than H as regard to knee extension only (P = 0.0014). When strength data were normalised by body weight, PWS showed a 50% and a 70% reduction in PT as compared to O and H, respectively. Knee flexors strength values were on average half of those reported for extension in all of the three populations. Conclusion: the novel aspect of our study is the determination of objective measures of muscle strength in PWS and the comparison with O and H patients. The objective characterization of muscle function performed in this study provides baseline and outcome measures that may quantify specific strength deficits amendable with tailored rehabilitation programs and monitor effectiveness of treatments. Published: 6 May 2009 BMC Musculoskeletal Disorders 2009, 10:47 doi:10.1186/1471-2474-10-47 Received: 10 September 2008 Accepted: 6 May 2009 This article is available from: http://www.biomedcentral.com/1471-2474/10/47 © 2009 Capodaglio et al; licensee BioMed Central Ltd. This is an Open Access article distributed under the terms of the Creative Commons Attribution License (http://creativecommons.org/licenses/by/2.0 ), which permits unrestricted use, distribution, and reproduction in any medium, provided the original work is properly cited.
-
Upload
independent -
Category
Documents
-
view
0 -
download
0
Transcript of Strength characterization of knee flexor and extensor muscles in Prader-Willi and obese patients

BioMed CentralBMC Musculoskeletal Disorders
ss
Open AcceResearch articleStrength characterization of knee flexor and extensor muscles in Prader-Willi and obese patientsPaolo Capodaglio*1, Luca Vismara1, Francesco Menegoni1,2, Gabriele Baccalaro1, Manuela Galli2 and Graziano Grugni3Address: 1Orthopaedic Rehabilitation Unit and Clinical Lab for Gait Analysis and Posture, Ospedale San Giuseppe, Istituto Auxologico Italiano IRCCS, Piancavallo (Verbania), Italy, 2Bioengineering Department, Politecnico di Milano, Milano, Italy and 3Division of Auxology, Ospedale San Giuseppe, Istituto Auxologico Italiano IRCCS, Piancavallo (Verbania), Italy
Email: Paolo Capodaglio* - [email protected]; Luca Vismara - [email protected]; Francesco Menegoni - [email protected]; Gabriele Baccalaro - [email protected]; Manuela Galli - [email protected]; Graziano Grugni - [email protected]
* Corresponding author
AbstractBackground: despite evidence of an obesity-related disability, there is a lack of objective musclefunctional data in overweight subjects. Only few studies provide instrumental strengthmeasurements in non-syndromal obesity, whereas no data about Prader-Willi syndrome (PWS) arereported. The aim of our study was to characterize the lower limb muscle function of patientsaffected by PWS as compared to non-syndromal obesity and normal-weight subjects.
Methods: We enrolled 20 obese (O) females (age: 29.1 ± 6.5 years; BMI: 38.1 ± 3.1), 6 PWSfemales (age: 27.2 ± 4.9 years; BMI: 45.8 ± 4.4) and 14 healthy normal-weight (H) females (age: 30.1± 4.7 years; BMI: 21 ± 1.6). Isokinetic strength during knee flexion and extension in both lowerlimbs at the fixed angular velocities of 60°/s, 180°/s, 240°/s was measured with a Cybex Normdynamometer.
Results: the H, O and PWS populations appear to be clearly stratified with regard to musclestrength.: PWS showed the lowest absolute peak torque (PT) for knee flexor and extensor musclesas compared to O (-55%) and H (-47%) (P = 0.00001). O showed significantly higher strength valuesthan H as regard to knee extension only (P = 0.0014). When strength data were normalised bybody weight, PWS showed a 50% and a 70% reduction in PT as compared to O and H, respectively.Knee flexors strength values were on average half of those reported for extension in all of the threepopulations.
Conclusion: the novel aspect of our study is the determination of objective measures of musclestrength in PWS and the comparison with O and H patients. The objective characterization ofmuscle function performed in this study provides baseline and outcome measures that may quantifyspecific strength deficits amendable with tailored rehabilitation programs and monitor effectivenessof treatments.
Published: 6 May 2009
BMC Musculoskeletal Disorders 2009, 10:47 doi:10.1186/1471-2474-10-47
Received: 10 September 2008Accepted: 6 May 2009
This article is available from: http://www.biomedcentral.com/1471-2474/10/47
© 2009 Capodaglio et al; licensee BioMed Central Ltd. This is an Open Access article distributed under the terms of the Creative Commons Attribution License (http://creativecommons.org/licenses/by/2.0), which permits unrestricted use, distribution, and reproduction in any medium, provided the original work is properly cited.
Page 1 of 8(page number not for citation purposes)

BMC Musculoskeletal Disorders 2009, 10:47 http://www.biomedcentral.com/1471-2474/10/47
BackgroundObesity has a profound relationship with disability and,at severe levels, is itself disabling in terms of mobility andexercise capacity. Excessive body weight is an independentrisk factor for various conditions many of which are disa-bling (i.e. stroke, diabetes, osteoarthritis, etc). Further-more, many persons with an existing disability maybecome obese often due to impaired mobility and activitylimitations. As the prevalence of obesity is increasing at analarming rate worldwide, obesity-related disabilities willeventually become a serious threat to national health sys-tems, specially if, in regard to children and adolescents,they occur in early life and continue for a longer life span.
Despite this evidence, supported by more than 100 paperspublished in the last two years with the key-words "obes-ity and disability", the physiopathological determinantsof the obesity-related disability have been scarcely investi-gated.
Prader-Willi syndrome (PWS) is the most frequent causeof syndromic obesity and occurs in 1 in 25,000 live births.Its major clinical features include muscular hypotonia,childhood-onset obesity, short stature, small hands andfeet, scoliosis, hypogonadism and developmental delay,resulting from a loss of the paternal copy ofchromosome15q11-q13. The syndrome has two phases.Initially, PWS is characterized by severe neonatal hypoto-nia, feeding problems and a failure to thrive. This is fol-lowed by hyperphagia and weight gain between the agesof 1 and 6, leading most PWS subjects to develop morbidobesity. Both hypotonia and obesity affect the develop-ment of motor and functional skills that children usuallylearn at that age [1]. PWS children's ability in sitting,kneeling, standing and walking is delayed compared withchildren with the same age. These patients develop theirtypical gait pattern already influenced by obesity. In adultlife, the progressive effects of obesity on joints, small feet,hypotonia and the other orthopaedic problems producefurther gait deviations [2].
Typically, PWS patients present with reduced lean bodymass and increased fat to lean mass ratio not only if com-pared with lean subjects but also in relation to simpleobese patients [3,4]. Body composition abnormalities ofPWS subjects resemble that of individuals with severegrowth hormone deficiency or even of frail elderly people[5]. In this respect, administration of growth hormone hasbeen shown to increase lean body mass and decreases fatmass, and to improve physical strength, and agility [6].However, long-term treatments appear to only partiallycompensate the lean mass deficit [7].
Decreased muscle mass represents the proximate cause ofthe hypotonia but the pathogenesis of this condition is
unclear. Neuromuscular studies and muscular ultrasoundanalysis are usually normal [8]. Histologic and ultrastruc-tural evaluation of muscle fibers in PWS are scarce. Sone[9] reported histochemical abnormalities such as fibersize variation of both type 1 and 2 fibers, type 2 fiber atro-phy, increased number of type 2C fibres and decreasednumber of type 2B fiber, thus suggesting that primarymuscle pathology play a role in hypotonia and weakness.Other studies demonstrated an abnormal proportions oftype 2 muscle fiber subtypes[10-12]
In addition to such relative sarcopenia and abnormalmuscle fibres composition, PWS patients show a reducedpattern of spontaneous physical activity [13]. Evidenceexists that a short (up to 10 minutes) daily muscle trainingprograms in a home setting may increase lean mass andspontaneous physical activity, as assessed by DEXA andpedometer registration, respectively [14]. Adequateincrease in muscle mass in response to enhanced physicalactivity seems to point to the diminished spontaneousphysical activity as the main cause for decreased musclemass in PWS subjects, but further research is needed.
Together with the determination of muscle mass andfibres composition, objective characterization of musclefunction may ultimately help identifying specific deficitsamendable with tailored rehabilitation programs andproviding baseline and outcome measures. From a func-tional perspective, to date there are only few papers pro-viding quantitative data of lower limb muscle strength innon-syndromal obese subjects [15-17]. Physical strengthand functional capacities of PWS subjects has been previ-ously performed by manual non-instrumental testing [13]and with a modified Bruininks-Oseretsky test [6].
The literature fails to provide objective instrumental dataregarding physical capacities in PWS. The objective char-acterization of muscle function could quantify specificstrength deficits and provide baseline and outcome meas-ures in the rehabilitation of PWS.
In this wake, the aim of our study was therefore to providesome preliminary reference data of lower limb musclestrength in a group of adult patients with PWS using adynamometer. In order to ascertain whether differences inperformance are related solely to excessive body weight,the results were compared with those obtained both inpatients affected by non-syndromal obesity and in agroup of normal-weight subjects.
MethodsSubjectsOver a period of six months, 26 female subjects consecu-tively admitted to our rehabilitation institute wereenrolled in this study (Additional file 1): 20 obese (O),
Page 2 of 8(page number not for citation purposes)
BMC Musculoskeletal Disorders 2009, 10:47 http://www.biomedcentral.com/1471-2474/10/47
age mean 29,1 years (range, 20–40); Body Mass Index(BMI) mean 38.1 (range, 31–43), and 6 PWS, age mean27.2 years (range, 21–36); BMI mean 45.8 (range, 38–51). In addition, a control group of 14 healthy normal-weight (H) age mean 30.1 years (range, 23–38); BMImean 21 (range 19–23) was recruited. Physical examina-tion included determination of height and weight in fast-ing conditions and after voiding. BMI was defined asweight/height2 (kg/m2). Standing height was determinedby a Harpenden Stadiometer, while body weight wasmeasured to the nearest 0.1 kg, by using standardizedequipment. PWS patients showed the typical clinical phe-notype [18], and all underwent cytogenetic analysis: 4 hadinterstitial deletion of the proximal long arm of chromo-some 15 while 2 had uniparental maternal disomy forchromosome 15. All PWS adults suffered from childhoodobesity and were undergoing strict parental guidance forcontrol of feeding obsession. Four PWS females had pri-mary amenorrhea, and the remaining suffered from oli-gomenorrhea. Characteristic facial features (narrowbifrontal diameter, almond-shaped eyes, and downturnedmouth with thin upper lip) as well as small hands and feetwere present. Typical behaviour problems were reported,including temper tantrums and obsessive-compulsive fea-tures. In addition, all PWS subjects showed a mild mentalretardation. In this respect, the inclusion criteria for par-ticipating in the study were a score over cut-off value of 24in the Mini Mental State Examination (MMSE) Italian ver-sion [19] in order to obtain a minimum intellective levelallowing the administration of the tests. All PWS patientsshowed normal findings on the main laboratory test,including adrenal and thyroid functions. O groupincluded only patients with essential obesity and BMI >30. None of them reported orthopaedic conditions limit-ing the range of motion of the knee. No patient was underany medications expected to alter the results of the study,including growth hormone. Control subjects were all freeof pathological conditions and had a sedentary life style.
The study was approved by the Ethic Committee of theIstituto Auxologico Italiano. Written informed consentwas given by the patients and, where applicable, the par-ents.
EquipmentKnee flexors and extensors strength was assessed using anisokinetic dynamometer (Cybex Norm). Muscle strengthwas measured in both lower limbs with the subjects in asitting position with hip flexed at 90°. The trunk and thethigh of lower limb to be tested were tightly secured byvelcro-straps to the experimental chair. The mechanicallever arm was aligned to the axis of rotation of the knee.To account for the influence of the gravity effect torque,data were corrected by the weight of the subject's lowerlimb at 45°. Subjects were tested at three fixed angular
velocities: 60°/s, 180°/s, 240°/s. The subjects began eachisokinetic contraction with the knee flexed at 90° andcontinued through the full range of motion.
On the test day, PWS subjects performed several warm-uptrials at submaximal levels to ensure a thorough familiar-ization with the equipment because of their need for rou-tine sameness and consistency in the learningenvironment. They were then asked to complete five max-imal contractions at each angular velocity in a rand-omized order, but only the best value was retained forfurther statistical analysis.
All participants were verbally encouraged to perform eachtest as maximally as possible. Visual feed back during thetest was also provided. The same investigator conductedthe tests for all the subjects. The impact artefact was notincluded in the measurement of maximal torque. A recov-ery of 1 minute was allowed between each maximal con-traction, to minimize fatigue.
Selected parametersThe following parameters were obtained from the maxi-mum isokinetic tests and subsequently analyzed: peaktorque (PT, [Nm]), peak torque relative to body weight(PT%BW), angle at peak torque (AnPT, [deg]), and flexor/extensor ratio.
Statistical AnalysisUnless otherwise noted, all data are presented as mean(one standard deviation, SD). Before using parametric sta-tistical procedures, the assumptions of normality, homo-geneity and sphericity were verified. Three-way mixedAnalysis of Variance (ANOVA, 2 × 3 × 3 design) was usedon each dependent variable (PT, PT%BW, AnPT, andhamstring/quadriceps ratio, measured on the right andleft side of flexors and extensors). The independent varia-bles included one within-subject factor, side, with two lev-els (right and left), one within-subject factor, speed, withthree levels (60, 180, and 240°/s), and one between-sub-ject factor, group, with three levels (normal, obese, andPrader-Willi syndrome patients). AnPT violated the nor-mality in 20% of the subgroup data. Visual inspection ofthe normality plots showed slight deviation from normal-ity. Therefore, we applied both parametric and non-para-metric ANOVA (after rank transformation of the data).Since results were similar, to facilitate the reader, wedecided to present the results of the parametric analysis toavoid reporting transformed data instead of raw values.Post-hoc analysis was performed using LSD test. Given thedescriptive nature of the studies, we presented when pos-sible the raw data and not only the estimated marginalmeans according to the results of the ANOVAs. The prob-ability of Type I error was set a priori at 0.05 for all statis-tical analysis.
Page 3 of 8(page number not for citation purposes)

BMC Musculoskeletal Disorders 2009, 10:47 http://www.biomedcentral.com/1471-2474/10/47
ResultsPeak TorqueA significant speed × group interaction was found forextensor PT (F4,74 = 12.877, p < 0.001). Estimated mar-ginal means are presented in Additional file 2. Post hocanalysis showed that PT was lower in PWS compared toboth O and H (p < 0.001) at all speeds, and in H com-pared to O (p < 0.001). PT decreased increasing the speed.The PT at 60°/s was higher than 180°/s and 240°/s (p <0.001) for all groups. Similarly PT at 180°/s was higherthan 240°/s for H and O (p < 0.001) and PWS (p =0.013). No other significant interactions were found (p >0.769).
A significant speed × group interaction was also found forflexor PT (F4,74 = 10.926, p < 0.001). Estimated marginalmeans are presented in Additional file 2. Post hoc analysisshowed that PT was lower in PWS compared to both Oand H (p < 0.001) at all speeds, while no differences werefound between O and H (p > 0.13).
PT decreased increasing the speed. The PT at 60°/s washigher than 180°/s (p < 0.001) for O and H, and PWS (p= 0.005). Similarly PT at 180°/s was higher than 240°/sfor H and O (p < 0.001) and PWS (p = 0.009). No othersignificant interactions were found (p > 0.527).
Peak torques relative to body weightSimilar results were obtained for PT%BW. A significantspeed × group interaction was found for extensor PT%BW(F4,74 = 29.686, p < 0.001). Estimated marginal means arepresented in Additional file 3. Post hoc analysis showedthat PT%BW was lower in PWS compared to both O andH (p < 0.001) at all speeds, and in O compared to H (p <0.001). PT%BW decreased increasing the speed: thePT%BW 240°/s was lower than 180°/s (p < 0.001) for allgroups. Similarly PT%BW 180°/s was lower than 60°/sfor H and O (p < 0.001), and PWS (p = 0.003). No othersignificant interactions were found (p > 0.813).
Even for flexors a significant speed × group interactionwas found (F4,74 = 48.052, p < 0.001). Estimated marginalmeans are presented in Additional file 3. Results were sim-ilar to those pertaining the extensors, with post hoc anal-ysis showing lower PT%BW in PWS compared to both Oand H (p < 0.001) at all speeds, and in O compared to H(p < 0.001). PT%BW decreased increasing the speed: thePT%BW 240°/s was lower than 180°/s for O and H (p <0.001), and PWS (p = 0.01), as well as 180°/s was lowerthan 60°/s for H and O (p < 0.001), and PWS (p = 0.004).No other significant interactions were found (p > 0.388).
Angle at peak torqueA significant speed × group interaction was found forAnPT of extensors (F4,74 = 5.683, p < 0.001). Post hoc anal-ysis showed a significant higher value of AnPT between
PWS and control groups (PWS vs O: p = 0.004; PWS vs H:p = 0.002) only at maximum speed (Additional file 4).AnPT was influenced by speed in O (p < 0.001) and H (p= 0.003), but not in PWS (p > 0.303). No other significantinteractions were found (p > 0.343).
Similarly to extensors, a significant speed × group interac-tion was found in flexors (F4,74 = 9.335, p < 0.001). Posthoc analysis showed significant different values amonggroups only at 60°/s, with O showing higher AnPT than H(p = 0.008) and PWS showing higher angle than O (p =0.007) and H (p < 0.001) (Additional file 4). AnPTincreased with increasing speed in H among all speeds (p< 0.001) and in O between 180°/s and 240°/s (p <0.001), while in PWS the angle at 60°/s was higher than180°/s (p = 0.007). No other interactions were found (p> 0.338)
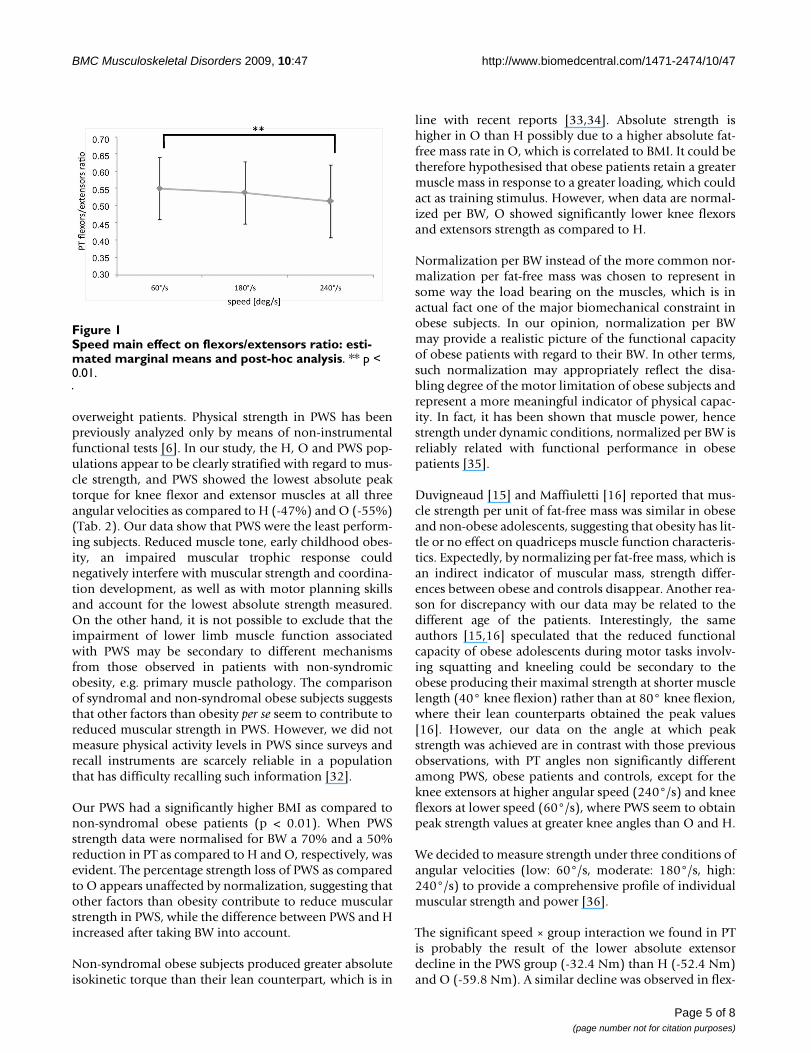
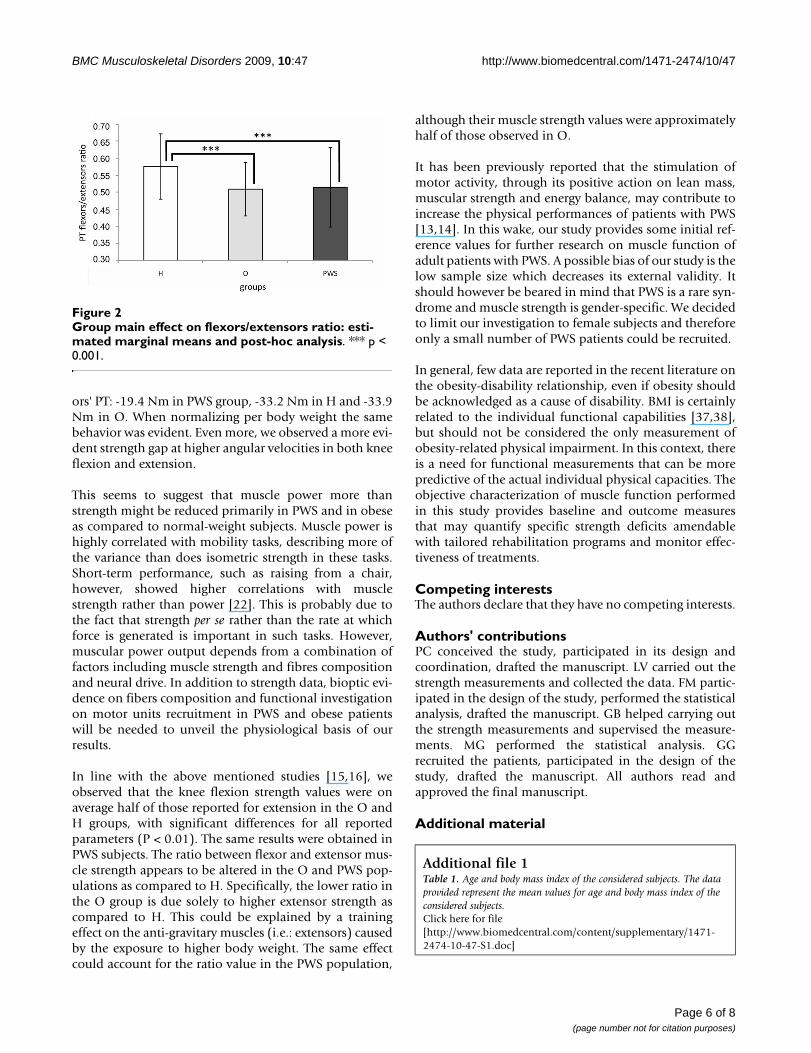
PT flexors/extensors ratioA significant main effect was found for speed (F2,74 =7.967, p < 0.001) and group (F2,37 = 3.650, p = 0.0357).No other significant interactions were found (p > 0.232).Raw data are presented in Additional file 5, while esti-mated marginal means and post hoc results are presentedin Figure 1 and 2.
Discussion and conclusionOur results provide an objective functional picture charac-terizing the muscle function of PWS and obese popula-tion as compared to normal-weight control subjects. Thenovel aspect of our study is the determination of objectivemeasures of lower limbs muscle strength in PWS and thecomparison with non-syndromal obese patients.
Efficient lower limb muscles are the key to independentmobility and strength of the flexor and extensor musclesis highly correlated with the capacity to execute daily taskssafely [20]. The relationship between strength and mobil-ity tasks is curvilinear, suggesting that other factors thanmuscle function contribute to mobility, still musclestrength is considered the most important factor toenhance mobility [21,22]. It has been shown that reducedmuscle strength relative to body weight induces earlierfatigue of the quadriceps muscles in the obese which, inturn, reduces shock attenuation and increases the loadingrate and variability at the knee during gait [23]. Quadri-ceps muscle strength is known to be an important factorgoverning the vibration dampening of the lower limb [24]and its weakness is known to be a risk factor for the devel-opment of knee osteoarthritis [25-30]. Lower rates ofmusculoskeletal loading have been found in strength-trained females when compared with sedentary femaleswalking at similar speeds, suggesting that increased mus-cular strength may enhance shock attenuation [31].Despite the implications of such biomechanical data,there is scanty evidence of functional quantification in
Page 4 of 8(page number not for citation purposes)
BMC Musculoskeletal Disorders 2009, 10:47 http://www.biomedcentral.com/1471-2474/10/47
overweight patients. Physical strength in PWS has beenpreviously analyzed only by means of non-instrumentalfunctional tests [6]. In our study, the H, O and PWS pop-ulations appear to be clearly stratified with regard to mus-cle strength, and PWS showed the lowest absolute peaktorque for knee flexor and extensor muscles at all threeangular velocities as compared to H (-47%) and O (-55%)(Tab. 2). Our data show that PWS were the least perform-ing subjects. Reduced muscle tone, early childhood obes-ity, an impaired muscular trophic response couldnegatively interfere with muscular strength and coordina-tion development, as well as with motor planning skillsand account for the lowest absolute strength measured.On the other hand, it is not possible to exclude that theimpairment of lower limb muscle function associatedwith PWS may be secondary to different mechanismsfrom those observed in patients with non-syndromicobesity, e.g. primary muscle pathology. The comparisonof syndromal and non-syndromal obese subjects suggeststhat other factors than obesity per se seem to contribute toreduced muscular strength in PWS. However, we did notmeasure physical activity levels in PWS since surveys andrecall instruments are scarcely reliable in a populationthat has difficulty recalling such information [32].
Our PWS had a significantly higher BMI as compared tonon-syndromal obese patients (p < 0.01). When PWSstrength data were normalised for BW a 70% and a 50%reduction in PT as compared to H and O, respectively, wasevident. The percentage strength loss of PWS as comparedto O appears unaffected by normalization, suggesting thatother factors than obesity contribute to reduce muscularstrength in PWS, while the difference between PWS and Hincreased after taking BW into account.
Non-syndromal obese subjects produced greater absoluteisokinetic torque than their lean counterpart, which is in
line with recent reports [33,34]. Absolute strength ishigher in O than H possibly due to a higher absolute fat-free mass rate in O, which is correlated to BMI. It could betherefore hypothesised that obese patients retain a greatermuscle mass in response to a greater loading, which couldact as training stimulus. However, when data are normal-ized per BW, O showed significantly lower knee flexorsand extensors strength as compared to H.
Normalization per BW instead of the more common nor-malization per fat-free mass was chosen to represent insome way the load bearing on the muscles, which is inactual fact one of the major biomechanical constraint inobese subjects. In our opinion, normalization per BWmay provide a realistic picture of the functional capacityof obese patients with regard to their BW. In other terms,such normalization may appropriately reflect the disa-bling degree of the motor limitation of obese subjects andrepresent a more meaningful indicator of physical capac-ity. In fact, it has been shown that muscle power, hencestrength under dynamic conditions, normalized per BW isreliably related with functional performance in obesepatients [35].
Duvigneaud [15] and Maffiuletti [16] reported that mus-cle strength per unit of fat-free mass was similar in obeseand non-obese adolescents, suggesting that obesity has lit-tle or no effect on quadriceps muscle function characteris-tics. Expectedly, by normalizing per fat-free mass, which isan indirect indicator of muscular mass, strength differ-ences between obese and controls disappear. Another rea-son for discrepancy with our data may be related to thedifferent age of the patients. Interestingly, the sameauthors [15,16] speculated that the reduced functionalcapacity of obese adolescents during motor tasks involv-ing squatting and kneeling could be secondary to theobese producing their maximal strength at shorter musclelength (40° knee flexion) rather than at 80° knee flexion,where their lean counterparts obtained the peak values[16]. However, our data on the angle at which peakstrength was achieved are in contrast with those previousobservations, with PT angles non significantly differentamong PWS, obese patients and controls, except for theknee extensors at higher angular speed (240°/s) and kneeflexors at lower speed (60°/s), where PWS seem to obtainpeak strength values at greater knee angles than O and H.
We decided to measure strength under three conditions ofangular velocities (low: 60°/s, moderate: 180°/s, high:240°/s) to provide a comprehensive profile of individualmuscular strength and power [36].
The significant speed × group interaction we found in PTis probably the result of the lower absolute extensordecline in the PWS group (-32.4 Nm) than H (-52.4 Nm)and O (-59.8 Nm). A similar decline was observed in flex-
Speed main effect on flexors/extensors ratio: estimated mar-ginal means and post-hoc analysisFigure 1Speed main effect on flexors/extensors ratio: esti-mated marginal means and post-hoc analysis. ** p < 0.01.
Page 5 of 8(page number not for citation purposes)
BMC Musculoskeletal Disorders 2009, 10:47 http://www.biomedcentral.com/1471-2474/10/47
ors' PT: -19.4 Nm in PWS group, -33.2 Nm in H and -33.9Nm in O. When normalizing per body weight the samebehavior was evident. Even more, we observed a more evi-dent strength gap at higher angular velocities in both kneeflexion and extension.
This seems to suggest that muscle power more thanstrength might be reduced primarily in PWS and in obeseas compared to normal-weight subjects. Muscle power ishighly correlated with mobility tasks, describing more ofthe variance than does isometric strength in these tasks.Short-term performance, such as raising from a chair,however, showed higher correlations with musclestrength rather than power [22]. This is probably due tothe fact that strength per se rather than the rate at whichforce is generated is important in such tasks. However,muscular power output depends from a combination offactors including muscle strength and fibres compositionand neural drive. In addition to strength data, bioptic evi-dence on fibers composition and functional investigationon motor units recruitment in PWS and obese patientswill be needed to unveil the physiological basis of ourresults.
In line with the above mentioned studies [15,16], weobserved that the knee flexion strength values were onaverage half of those reported for extension in the O andH groups, with significant differences for all reportedparameters (P < 0.01). The same results were obtained inPWS subjects. The ratio between flexor and extensor mus-cle strength appears to be altered in the O and PWS pop-ulations as compared to H. Specifically, the lower ratio inthe O group is due solely to higher extensor strength ascompared to H. This could be explained by a trainingeffect on the anti-gravitary muscles (i.e.: extensors) causedby the exposure to higher body weight. The same effectcould account for the ratio value in the PWS population,
although their muscle strength values were approximatelyhalf of those observed in O.
It has been previously reported that the stimulation ofmotor activity, through its positive action on lean mass,muscular strength and energy balance, may contribute toincrease the physical performances of patients with PWS[13,14]. In this wake, our study provides some initial ref-erence values for further research on muscle function ofadult patients with PWS. A possible bias of our study is thelow sample size which decreases its external validity. Itshould however be beared in mind that PWS is a rare syn-drome and muscle strength is gender-specific. We decidedto limit our investigation to female subjects and thereforeonly a small number of PWS patients could be recruited.
In general, few data are reported in the recent literature onthe obesity-disability relationship, even if obesity shouldbe acknowledged as a cause of disability. BMI is certainlyrelated to the individual functional capabilities [37,38],but should not be considered the only measurement ofobesity-related physical impairment. In this context, thereis a need for functional measurements that can be morepredictive of the actual individual physical capacities. Theobjective characterization of muscle function performedin this study provides baseline and outcome measuresthat may quantify specific strength deficits amendablewith tailored rehabilitation programs and monitor effec-tiveness of treatments.
Competing interestsThe authors declare that they have no competing interests.
Authors' contributionsPC conceived the study, participated in its design andcoordination, drafted the manuscript. LV carried out thestrength measurements and collected the data. FM partic-ipated in the design of the study, performed the statisticalanalysis, drafted the manuscript. GB helped carrying outthe strength measurements and supervised the measure-ments. MG performed the statistical analysis. GGrecruited the patients, participated in the design of thestudy, drafted the manuscript. All authors read andapproved the final manuscript.
Additional material
Additional file 1Table 1. Age and body mass index of the considered subjects. The data provided represent the mean values for age and body mass index of the considered subjects.Click here for file[http://www.biomedcentral.com/content/supplementary/1471-2474-10-47-S1.doc]
Group main effect on flexors/extensors ratio: estimated mar-ginal means and post-hoc analysisFigure 2Group main effect on flexors/extensors ratio: esti-mated marginal means and post-hoc analysis. *** p < 0.001.
Page 6 of 8(page number not for citation purposes)

BMC Musculoskeletal Disorders 2009, 10:47 http://www.biomedcentral.com/1471-2474/10/47
AcknowledgementsThe authors wish to thank Dr Claudio Lafortuna for precious feedback and support and Dr Gian Mauro Manzoni for his help in the statistical analysis.
References1. Hallemans A, De Clercq D, Otten B, Aerts P: 3d Joint Dynamics
Of Walking In Toddlers A Cross-Sectional Study SpanningThe First Rapid Development Phase Of Walking. Gait & Pos-ture 2005, 22:107-118.
2. Vismara L, Romei M, Galli M, Montesano A, Baccalaro G, Crivellini M,Grugni G: Clinical Implications Of Gait Analysis In The Reha-bilitation Of Adult Patients With "Prader-Willi" Syndrome:A Cross-Sectional Comparative Study ("Prader-Willi" Syn-drome Vs Matched Obese Patients And Healthy Subjects). JNeuroeng Rehabil 2007, 4:14.
3. Kennedy L, Bittel DC, Kibiryeva N, Kalra SP, Torto R, Butler MG:Circulating Adiponectin Levels, Body Composition AndObesity-related Variables In Prader-Willi Syndrome: Com-parison With Obese Subjects. Int J Obes 2006, 30:382-387.
4. Theodoro MF, Talebizadeh Z, Butler MG: Body composition andfatness patterns in Prader-Willi syndrome: comparison withsimple obesity. Obesity (Silver Spring) 2006, 14(10):1685-90.
5. Brambilla P, Bosio L, Manzoni P, Pietrobelli A, Beccaria L, ChiumelloG: Peculiar Body composition in patients with Prader-Lab-hart-Willi sindrome. Am J Clin Nutr 1997, 65:1369-74.
6. Myers S, Carrel AL, Whitman BY, Allen DB: Sustained BenefitAfter 2 Years Of Growth Hormone On Body Composition,Fat Utilization, Physical Strength And Agility, And GrowthIn Prader-Willi Syndrome. J Pediatr 2000, 137(1):42-9.
7. Carrel AL, Myers SE, Whitman BY, Allen DB: Benefits of long-term GH therapy in Prader-Willi syndrome: a 4-year study.J Clin Endocrinol Metab 2002, 87(4):1581-5.
8. Eiholzer U, Lee PDK: Medical Considerations In Prader-WilliSyndrome. In Management of Prader-Willi Syndrome 3rd edition.Edited by: Butler MG, Lee PDK, Whitman BY. New York: Springer:97-152.
9. Sone S: Muscle histochemistry in the Prader-Willi syndrome.Brain Dev 1994, 16(3):183-8.
10. Argov Z, Gardner-Medwin D, Johnson MA, Mastaglia FL: Patterns ofmuscle fiber-type disproportion in hypotonic infants. ArchNeurol 1984, 41(1):53-7.
11. Miike T, Ogata T, Ohtani Y, Yamaguchi H, Yokoyama Y: AtypicalPrader-Willi syndrome with severe developmental delay andemaciation. Brain Dev 1988, 10(3):186-8.
12. Chitayat D, Davis EB, McGillivray BC, Hayden MR, Hall JG: Perinataland first year follow-up of patients with Prader-Willi syn-drome: normal size of hands and feet. Clin Genet 1989,35(3):161-6.
13. Schlumpf M, Eiholzer U, Gygax M, Schmid S, Sluis I van der, l'AllemandD: A daily comprehensive muscle training programmeincreases lean mass and spontaneous activity in childrenwith Prader-Willi syndrome after 6 months. J Pediatr EndocrinolMetab 2006, 19(1):65-74.
14. Eiholzer U, Nordmann Y, L'allemand D, Schlumpf M, Schmid S,Kromeyer-Hauschild K: Improving Body Composition AndPhysical Activity In Prader-Willi Syndrome. J Pediatr 2003,142:73-8.
15. Duvigneaud N, Matton L, Wijndaele K, Deriemaeker P, Lefevre J,Philippaerts R, Thomis M, Delecluse C, Duquet W: Relationship OfObesity With Physical Activity, Aerobic Fitness And MuscleStrength In Flemish Adults. J Sports Med Phys Fitness 2008,48(2):201-10.
16. Maffiuletti NA, Jubeau M, Munzinger U, Bizzini M, Agosti F, De Col A,Lafortuna CL, Sartorio A: Differences In Quadriceps MuscleStrenght And Fatigue Between Lean And Obese Patients.Eur J Appl Physiol 2007, 101:1. (51–59)
17. Hulens M, Vansant G, Lysens R, Claessens Al, Muls E: AssessmentsOf Isokinetic Muscle Strength In Women Who Are Obese. JOrthop Sports Phys Ther 2002, 32:347-356.
18. Holm VA, Cassidy SB, Butler MG, Hanchett JM, Greenswag LR, Whit-man BY, Greenberg F: Prader-Willi Syndrome: ConsensusDiagnostic Criteria. Pediatrics 1993, 91:398-402.
19. Neri M, Andermacher E, Spanó A, Salvioli G, Cipolli C: ValidationStudy of the Italian Version of the Cambridge Mental Disor-ders of the Elderly Examination: Preliminary Findings. Cogni-tive Disorders 1992, 3:70-77.
20. Ferrucci L, Guralnik JM, Buchner D, et al.: (1997) DeparturesFrom Linearity In The Relationship Between Measures OfMuscular Strength And Physical Performance Of The LowerExtremities: The Women's Health And Ageing Study. J Ger-ontol A Biol Sci Med Sci 1997, 52(5):M275-M285.
21. Keysor JJ: Does Late-Life Physical Activity Or Exercise Pre-vent Or Minimize Disablement? Am J Prev Med 2003, 25(3Suppl 2):129-136.
22. Capodaglio P, Capodaglio Em, Facioli M, Saibene F: Long-TermStrength Training For Community-Dwelling People Over75: Impact On Muscle Function, Functional Ability And LifeStyle. Eur J Appl Physiol 2007, 5:535-542.
23. Syed IY, Davis BL: Obesity and osteoarthritis of the knee:hypotheses concerning the relationship between groundreaction forces and quadriceps fatigue in long-duration walk-ing. Med Hypotheses 2000, 54:182-185.
24. Wakeling JM, Liphardt AM, Nigg BM: Muscle activity reduces soft-tissue resonance at heel-strike during walking. J Biomech 2003,36:1761-1769.
25. Slemenda C, Brandt KD: Quadriceps Weakness And Osteoar-thritis Of The Knee. Ann Intern Med 1997, 127:97-104.
26. Slemenda C, Heilman DK, Brandt KD, Katz BP, Mazzuca SA, Braun-stein EM, Byrd D: Reduced Quadriceps Strength Relative ToBody Weight: A Risk Factor For Knee Osteoarthritis InWomen? Arthritis Rheum 1998, 41:1951-59.
27. Baker KR, Xu L, Zhang Y, Nevitt M, Niu J, Aliabadi P, Yu W, FelsonD: Quadriceps weakness and its relationship to tibiofemoraland patellofemoral knee osteoarthritis in Chinese: the Bei-jing osteoarthritis study. Arthritis Rheum 2004, 50:1815-1821.
28. Hortobagyi T, Garry J, Holbert D, Devita P: Aberrations In TheControl Of Quadriceps Muscle Force In Patients With KneeOsteoarthritis. Arthritis Rheum 2004, 51:562-569.
Additional file 2Table 2 – Peak torque (PT) values expressed as Nm. Estimated mar-ginal mean values of peak torque are presented for the three experimental groups.Click here for file[http://www.biomedcentral.com/content/supplementary/1471-2474-10-47-S2.doc]
Additional file 3Table 3 – Mean Peak Torque values expressed in percent of body weight (PT%BW). Estimated marginal mean values of peak torque expressed in percent of body weight are presented for the three experimen-tal groups.Click here for file[http://www.biomedcentral.com/content/supplementary/1471-2474-10-47-S3.doc]
Additional file 4Table 4 – Angle (°) at Peak Torque (AnPT) values. Mean values of angles at Peak Torque are presented for the three experimental groupsClick here for file[http://www.biomedcentral.com/content/supplementary/1471-2474-10-47-S4.doc]
Additional file 5Table 5 – Descriptive flexors/extensors ratio data. Mean values of the flexors/extensors ratio are presented for the three experimental groups.Click here for file[http://www.biomedcentral.com/content/supplementary/1471-2474-10-47-S5.doc]
Page 7 of 8(page number not for citation purposes)
http://www.ncbi.nlm.nih.gov/entrez/query.fcgi?cmd=Retrieve&db=PubMed&dopt=Abstract&list_uids=9129464
http://www.ncbi.nlm.nih.gov/entrez/query.fcgi?cmd=Retrieve&db=PubMed&dopt=Abstract&list_uids=9129464
http://www.ncbi.nlm.nih.gov/entrez/query.fcgi?cmd=Retrieve&db=PubMed&dopt=Abstract&list_uids=7943601
http://www.ncbi.nlm.nih.gov/entrez/query.fcgi?cmd=Retrieve&db=PubMed&dopt=Abstract&list_uids=6689888
http://www.ncbi.nlm.nih.gov/entrez/query.fcgi?cmd=Retrieve&db=PubMed&dopt=Abstract&list_uids=6689888
http://www.ncbi.nlm.nih.gov/entrez/query.fcgi?cmd=Retrieve&db=PubMed&dopt=Abstract&list_uids=2457332
http://www.ncbi.nlm.nih.gov/entrez/query.fcgi?cmd=Retrieve&db=PubMed&dopt=Abstract&list_uids=2457332
http://www.ncbi.nlm.nih.gov/entrez/query.fcgi?cmd=Retrieve&db=PubMed&dopt=Abstract&list_uids=2457332
http://www.ncbi.nlm.nih.gov/entrez/query.fcgi?cmd=Retrieve&db=PubMed&dopt=Abstract&list_uids=2706799
http://www.ncbi.nlm.nih.gov/entrez/query.fcgi?cmd=Retrieve&db=PubMed&dopt=Abstract&list_uids=2706799
http://www.ncbi.nlm.nih.gov/entrez/query.fcgi?cmd=Retrieve&db=PubMed&dopt=Abstract&list_uids=2706799
http://www.ncbi.nlm.nih.gov/entrez/query.fcgi?cmd=Retrieve&db=PubMed&dopt=Abstract&list_uids=8424017
http://www.ncbi.nlm.nih.gov/entrez/query.fcgi?cmd=Retrieve&db=PubMed&dopt=Abstract&list_uids=8424017
http://www.ncbi.nlm.nih.gov/entrez/query.fcgi?cmd=Retrieve&db=PubMed&dopt=Abstract&list_uids=9310081
http://www.ncbi.nlm.nih.gov/entrez/query.fcgi?cmd=Retrieve&db=PubMed&dopt=Abstract&list_uids=9310081
http://www.ncbi.nlm.nih.gov/entrez/query.fcgi?cmd=Retrieve&db=PubMed&dopt=Abstract&list_uids=9310081
http://www.ncbi.nlm.nih.gov/entrez/query.fcgi?cmd=Retrieve&db=PubMed&dopt=Abstract&list_uids=9230035
http://www.ncbi.nlm.nih.gov/entrez/query.fcgi?cmd=Retrieve&db=PubMed&dopt=Abstract&list_uids=9230035
http://www.ncbi.nlm.nih.gov/entrez/query.fcgi?cmd=Retrieve&db=PubMed&dopt=Abstract&list_uids=9811049
http://www.ncbi.nlm.nih.gov/entrez/query.fcgi?cmd=Retrieve&db=PubMed&dopt=Abstract&list_uids=9811049
BMC Musculoskeletal Disorders 2009, 10:47 http://www.biomedcentral.com/1471-2474/10/47
Publish with BioMed Central and every scientist can read your work free of charge
"BioMed Central will be the most significant development for disseminating the results of biomedical research in our lifetime."
Sir Paul Nurse, Cancer Research UK
Your research papers will be:
available free of charge to the entire biomedical community
peer reviewed and published immediately upon acceptance
cited in PubMed and archived on PubMed Central
yours — you keep the copyright
Submit your manuscript here:http://www.biomedcentral.com/info/publishing_adv.asp
BioMedcentral
29. Becker R, Berth A, Nehring M, Awiszus F: Neuromuscular Quad-riceps Dysfunction Prior To Osteoarthritis Of The Knee. JOrthop Res 2004, 22:768-773.
30. Thorstensson CA, Petersson IF, Jacobsson LT, Boegard TL, Roos EM:Reduced Functional Performance In The Lower ExtremityPredicted Radiographic Knee Osteoarthritis Five YearsLater. Ann Rheum Dis 2004, 63:402-407.
31. Mikesky AE, Meyer A, Thompson KL: Relationship between quad-riceps strength and rate of loading during gait in women. JOrthop Res 2000, 18:171-175.
32. Sirard JR, Pate RR: Physical activity assessment in children andadolescents. Sports Med 2001, 31(6):439-54.
33. Lafortuna CL, Maffiuletti NA, Agosti F, Sartorio A: Gender varia-tions of body composition, muscle strength and power out-put in morbid obesity. Int J Obes 2005, 29:833-841.
34. Lafortuna CL, Agosti F, Marinone PG, Marazzi N, Sartorio A: Therelationship between body composition and muscle poweroutput in men and women with obesity. J Endocrinol Invest 2004,27:854-861.
35. Lafortuna C, Fumagalli E, Vangeli V, Sartorio A: Lower limb alacticanaerobic power output assessed with different techniquesin mordib obesità. J Endocrinol Invest 2002, 25:134-141.
36. Gore CJ, (ed): Physiological tests for elite athletes. In AustralianSports Commission Human Kinetics:Champaign, Illinois; 2000:465.
37. Galanos AN, Pieper CF, Cornoni-Huntley JC, Bales CW, FillenbaumGG: Nutrition And Function: Is There A RelationshipBetween Body Mass Index And The Functional CapabilitiesOf Community-Dwelling Elderly? J Am Geriatr Soc 1994,42(4):368-373.
38. Butler MG, Theodoro MF, Bittel DC, Donnelly JE: Energy expend-iture and physical activity in Prader-Willi syndrome: com-parison with obese subjects. Am J Med Genet A 2007,143(5):449-59.
Pre-publication historyThe pre-publication history for this paper can be accessedhere:
http://www.biomedcentral.com/1471-2474/10/47/prepub
Page 8 of 8(page number not for citation purposes)
http://www.ncbi.nlm.nih.gov/entrez/query.fcgi?cmd=Retrieve&db=PubMed&dopt=Abstract&list_uids=8144820
http://www.ncbi.nlm.nih.gov/entrez/query.fcgi?cmd=Retrieve&db=PubMed&dopt=Abstract&list_uids=8144820