Molybdenum isotope evidence for mild environmental oxygenation before the Great Oxidation Event
Upload
independentCategory
view
1download
0
Available online at www.sciencedirect.com
Journal of Electromyography and Kinesiology 19 (2009) 398–406
www.elsevier.com/locate/jelekin
Low-level activity of the trunk extensor musclescauses electromyographic manifestations of fatigue
in absence of decreased oxygenation
Jaap H. van Dieen a,b,*, Eleonora P. Westebring-van der Putten a,Idsart Kingma a, Michiel P. de Looze a,b,c
a Research Institute MOVE, Faculty of Human Movement Sciences, VU University Amsterdam, VanderBoechortstraat 9,
NL-1081 BT Amsterdam, The Netherlandsb Body@Work, Research Centre Physical Activity, Work and Health, The Netherlands
c TNO-Quality of Life, Hoofddorp, The Netherlands
Received 15 October 2007; received in revised form 16 November 2007; accepted 16 November 2007
Abstract
This study was designed to determine whether trunk extensor fatigue occurs during low-level activity and whether this is associatedwith a drop in muscle tissue oxygenation. Electromyography (EMG) feedback was used to impose constant activity in a part of the trunkextensor muscles. We hypothesized that electromyographic manifestations of fatigue and decreased oxygenation would be observed atthe feedback site and that EMG activity at other sites would be more variable without fatigue manifestations. Twelve volunteers per-formed 30-min contractions at 2% and 5% of the maximum EMG amplitude (EMGmax) at the feedback site. EMG was recorded fromsix sites over the lumbar extensor muscles and near-infrared spectroscopy was used to measure changes in oxygenation at the feedbacksite (left L3 level, 3 cm paravertebral). In both conditions, mean EMG activity was not significantly different between electrode sites,whereas the coefficient of variation was lower at the feedback site compared to other recording sites. The EMG mean power frequency(MPF) decreased consistently at the feedback site only. At 5% EMGmax, the decrease in MPF was significant at the group level at allsites ipsilateral to the feedback site. These results suggest that the limited variability of muscle activity at the EMG feedback site and atipsilateral locations enhances fatigue development. No decreases in tissue oxygenation were detected. In conclusion, even at mean activ-ity levels as low as 2% EMGmax, fatigue manifestations were found in the trunk extensors. These occured in absence of changes in oxy-genation of the muscle tissue.� 2007 Elsevier Ltd. All rights reserved.
Keywords: Muscle fatigue; Near-infrared spectroscopy; Electromyography; Erector spinae
1. Introduction
Studies using long-term electromyographic recordings(EMG) during every-day activities have shown that
1050-6411/$ - see front matter � 2007 Elsevier Ltd. All rights reserved.
doi:10.1016/j.jelekin.2007.11.010
* Corresponding author. Address: Research Institute MOVE, Faculty ofHuman Movement Sciences, VU University Amsterdam, Vander-Boechortstraat 9, NL-1081 BT Amsterdam, The Netherlands. Tel.: +3120 444 8501; fax: +31 20 444 8529.
E-mail address: [email protected] (J.H. van Dieen).
postural muscles such as the trunk extensors are mostlyactive at very low intensities with median EMG amplitudesnot exceeding 10% of maximum (Dieen et al., 2001; Morkand Westgaard, 2005). While the activity levels are lowerthan in muscles of the upper and lower extremities, activityis of longer duration (Mork and Westgaard, 2005). Pre-sumably, this low-level sustained activity is required to pro-vide equilibrium against gravity and to provide stability ofthe spine. Because of the instability of the spine (Crisco andPanjabi, 1992), this requirement can be expected to be

VCR
EMG
NIRS
Fig. 1. Schematic of the experimental setup.
\J.H. van Dieen et al. / Journal of Electromyography and Kinesiology 19 (2009) 398–406 399
operative as long as an upright posture is maintainedregardless of the activity performed. A laboratory studyon 3 h of office work, performed seated with back support,found the trunk extensor muscles to be active for 93–98%of the time (Dieen et al., 2001).
While activity at levels below 10% of maximum can besustained for a long time, fatigue, i.e. a decrease in theforce generating capacity of the muscle, (Blangstedet al., 2005; Fallentin et al., 1985; Krogh-Lund, 1993),does develop, accompanied by electromyographic manifes-tations of fatigue (Blangsted et al., 2005; Bystrom and Kil-bom, 1990; Fallentin et al., 1985; Krogh-Lund, 1993), aswell as subjective experiences of fatigue (Bystrom and Kil-bom, 1990; Sjøgaard et al., 1986). Evidence on fatiguedevelopment in low-level activity was, however, obtainedin muscles of the extremities, not habitually exposed tosustained activity. Recent studies on sustained low-levelactivity in another postural muscle, the descending partof the trapezius muscle, have revealed electromyographicand subjective manifestations of fatigue (Bosch et al.,2007; Rosendal et al., 2004), coinciding with indicationsof increased interstitial lactate and potassium concentra-tions (Rosendal et al., 2004). Studies on trunk extensorfatigue have, to our knowledge, not addressed low-levelactivity.
McGill et al. (2000) reported a decrease in oxygenationin the trunk extensor muscles at forces as low as 2% ofmaximum and suggested that this would lead to fatiguein sustained activity. However, because the contractionslasted only 30 s, it is unknown whether the drop in oxygen-ation would remain during a sustained contraction. Onemight expect that the trunk extensor muscles are adaptedto the sustained activity associated with their postural role.Indeed a predominance of type I fibers has been found inthe trunk extensor muscles (Mannion, 1999). Furthermore,these muscles have a well-developed capillary network andglycogen concentration and aerobic metabolic enzymeactivity are pronounced compared to other muscles (Jor-gensen et al., 1993). In addition, it has been suggested thatthe mechanical redundancy of this muscle group isexploited to prevent or delay fatigue development by alter-nating activity between muscle parts (Dieen et al., 1993;McLean et al., 2000).
The aim of present study was to determine whetherelectromyographic manifestations of trunk extensor fati-gue occur during sustained low-level activity and whetherthese are associated with a drop in muscle oxygenation.We used EMG feedback to impose a fixed level ofactivity in one part of the trunk extensor muscles, whilenot constraining activity in other parts. We hypothesizedthat electromyographic manifestations of fatigue anddecreased oxygenation would be observed at the site onwhich EMG feedback was provided. Furthermore, wehypothesized that other parts of the trunk extensorswould show more variable activity than the feedback siteand would show no consistent indications of fatigue inthe EMG signal.
2. Methods
2.1. Subjects
Twelve healthy volunteers (three males, nine females)volunteered to participate in this experiment. Inclusion criteriawere: age between 18 and 65; no current low-back pain; no historyof low-back pain; no metabolic, cardiovascular, pulmonary, ororthopedic disorders; BMI below 28.6; skinfold thickness lateralof the L3 spinous process below 18 mm. The average physicalcharacteristics were: age 27.6 (SD 12.5) yr; length 1.72 (SD 0.08)m; body mass 638 (SD 9.4) kg; BMI 21.4 (SD 1.4) kg/m2; L3skinfold thickness 12.1 (SD 2.5) mm. The experimental procedurehad been approved by the local ethical committee and all subjectssigned informed consent prior to participation.
2.2. Instrumentation
To exclude effects of gravitational loading, experiments wereperformed with the subject lying on the left side. The upper bodywas supported on a memory foam mattress on a board that couldfreely move in the horizontal plane on frictionless gliders (Fig. 1).Memory foam blocks were used to support the head and right leg.The lower body was also placed on a memory foam mattress withthe pelvis strapped to a rigid fixation with hips flexed 45�, to allowfull relaxation of lumbar musculature (Keegan, 1953). A chest
400 J.H. van Dieen et al. / Journal of Electromyography and Kinesiology 19 (2009) 398–406
harness connected via a horizontal cable to a force transducer wasused to measure trunk extension force. Feedback of the linearenvelope of the EMG signal (0.1 Hz low-pass filtered, full-waverectified signal) measured 3 cm to the left of the L3 spinous pro-cess was provided on a computer monitor placed at eye level.
EMG electrodes (Blue Sensor; lead-off area 1.0 cm2, inter-electrode distance 3 cm) were attached to the skin after abradingand cleaning with alcohol. Electrodes were placed bilaterally in alongitudinal orientation, 3 cm lateral of the L1 spinous process(lL1 and rL1), 3 cm lateral of L3 spinous process (lL3m andrL3m) and 5 cm left of the L3 spinous process (lL3l and rL3l). Thereference electrode was placed on the right acromion. EMG sig-nals were amplified 20 times (Porti-17TM, TMSi, the Netherlands;input impedance > 1012 X, CMRR > 90 dB), band-pass filtered(10–400 Hz) and A–D converted (22 bits at 1000 Hz). Force datawere amplified and stored on the same system.
Near-infrared spectroscopy (NIRS) optodes were placed at3-cm interoptode distance on the left 3 cm lateral to the L3spinous process, such that one optode was placed between thelL3m EMG electrodes and the second just below the electrodes.The optodes were carefully covered with tape such that ambientlight could not affect the measurements. To fix the optodes anelastic band around the waist was used. NIRS was measured at10 Hz using the Oxymon system (Artinis Medical Systems b.v.,the Netherlands, Lasertype: semiconductor, pulsed laser diodes,20 W peak output, laser class IIb (1 mW average power output), 1kHz repetition rate per laser with wave lengths of 850 nm and780 nm). The estimated penetration depth was 18 mm.
2.3. Procedure
Each subject first performed a series of 3 maximum trunkextensor contractions by pulling on the cable. Each contractionlasted 3 s, and 2 min rest were given in between contractions.The test in which the maximum voluntary contraction force(MVC) was produced was used to obtain target values for theexertions during the actual experiment. After an additional restperiod of 15 min, the subject performed a 30-s contraction at50% MVC. Force, EMG and NIRS data were stored during thiscontraction. After this contraction, the subject rested for 10 min,before data collection was started again. In the subsequent2 min, the subject was instructed to relax as much as possible,after which a 30-min contraction was performed in which theEMG signal that was fed back to the subject (lL3m) had to bemaintained at either 2% or 5% of the corresponding highest 1-saveraged rectified EMG (EMGmax) obtained during the MVCcontraction. A 30-s, 50% MVC contraction was again performedimmediately after the 30-min contraction to verify stability of theNIRS recordings. Contractions at the two exertion levels wereperformed on separate days and the order was systematicallyvaried over subjects.
2.4. Data analysis and statistics
To estimate muscle activation levels, EMG signals were highpass filtered at 30 Hz (to remove ECG interference), full-waverectified and averaged over 1-s intervals. The first 10 s of eachtrial were discarded, because subjects usually needed some time toachieve a stable activation at the target level. EMG ampli-tudes were normalized to EMGmax and the overall averageamplitude and the coefficient of variation of the amplitude(COV = 100 * SD/mean) were calculated. In addition, to deter-
mine fatigue related changes in the frequency content of the EMGsignal, the mean power frequency (MPF) over each 1 s widow wascalculated using Fast Fourier Transformation. Linear regression ofthe MPF versus time was performed and for each subject it wastested whether the slope of the regression line deviated significantlyfrom zero. Repeated-measures ANOVA with muscle as a factorand mean and COV of the normalized EMG amplitude as well asthe slopes of the MPF as dependent variables were performed, witha planned comparison (simple contrast) between the EMG at thefeedback site and all other electrode sites. This analysis was per-formed separately for the 2% and 5% EMG max contractions.Additional analyses were performed with 2-way ANOVA with side(left/right) and muscle as factors. The group-averages of the MPFslopes for all muscles were tested against zero using the Studentt-test and a 2-way repeated-measures ANOVA (contractionlevel * muscle) was used to compare MPF slopes between con-traction levels.
From the changes in optical density measured with NIRS,contents of oxygenated hemoglobin (O2Hb) and de-oxygenatedhemoglobine (HHb) were calculated (Hamaoka et al., 1996).The sum of the O2Hb and HHb content was used as an esti-mate of total hemoglobin content (tHb). The time-series ofO2Hb content during the two 30-s contractions were comparedby calculating the cross-correlation. It has previously beenshown that for each individual a reproducible pattern of changein O2Hb content can be found at exertion levels similar to the50% MVC used here (Kell et al., 2004). Hence, this comparisonwas used to verify that NIRS recordings were made of activemuscle tissue and that the recordings were stable over the entireprotocol. For the 30-min contractions, linear regression analysiswas used to characterize changes in the hemoglobine contentsover time. The slope of the regression line was tested againstzero for each subject separately. The group-averaged values ofthe hemoglobine contents slopes were tested against zero usingthe Student t-test and repeated-measures MANOVA was usedto compare slopes between contraction levels. In addition,average values were calculated over 120 s preceding the con-traction and the first 30 s of the contraction, for comparisonwith previous literature. To test whether hemoglobine contentschanged during the contraction relative to the period justbefore the contraction, repeated-measures MANOVA was per-formed on O2Hb, HHb, and tHB, comparing these two epi-sodes. This analysis was performed separately for the 2% and5% EMG max contractions.
3. Results
Subjects were able to maintain the amplitude at the feed-back site quite constant (see Fig. 2 for an example). At theother electrode sites, EMG amplitudes were more variableover time, while the mean was sometimes higher and some-times lower than the target value. At the group level, nosignificant differences in mean EMG amplitudes werefound between muscles, but the COV was significantly dif-ferent between muscles (Fig. 3; Table 1). In line with ourhypothesis, the COV was significantly smaller at the feed-back site (lL3m) than at most other electrode sites.
For all muscles on the left side, the side from which thefeedback signal was derived, the COV of the EMG ampli-tudes was lower than at the right side (Fig. 3). This side

0 500 1000 1500 2000
lL3m 0
5
rL3m 0
5
lL3l 0
5
rL3l 0
5
lL1 0
5
rL1 0
5
2% EMGmax
ampl
itude
(%
EM
Gm
ax)
time (s)0 500 1000 1500 2000
lL3m 0
5
rL3m 0
5
lL3l 0
5
rL3l 0
5
lL1 0
5
rL1 0
5
5% EMGmax
time (s)
Fig. 2. Example of the EMG-amplitudes at all electrode sites in both contractions. lL3m = electrode site to left of L3 medial (3 cm) feedback site,rL3m = right of L3 medial, lL3l = left of L3 lateral (5 cm), rL3l = right of L3 lateral; lL1 = left of L1 (3 cm), rL1 = right of L1.
lL3m rL3m lL3l rL3l lL1 rL10
20
40
60
80
100
CO
V E
MG
(%
)
lL3m rL3m lL3l rL3l lL1 rL10
20
40
60
80
100
CO
V E
MG
(%
)
lL3m rL3m lL3l rL3l lL1 rL10
5
10
152% EMGmax
norm
aliz
ed E
MG
(%
EM
Gm
ax)
lL3m rL3m lL3l rL3l lL1 rL10
5
10
155% EMGmax
norm
aliz
ed E
MG
(%
EM
Gm
ax)
Fig. 3. Group-averages of the means and coefficients of variation of the EMG amplitudes at all electrode sites at both contraction levels. Error barsindicate the standard deviation. lL3m = electrode site to left of L3 medial (3 cm) feedback site, rL3m = right of L3 medial, lL3l = left of L3 lateral (5 cm),rL3l = right of L3 lateral; lL1 = left of L1 (3 cm), rL1 = right of L1.
\J.H. van Dieen et al. / Journal of Electromyography and Kinesiology 19 (2009) 398–406 401
difference was significant in both the 2% and 5% EMGmaxconditions (p = 0.002 and p = 0.003 respectively). Themean amplitudes did not differ between sides (p > 0.180).
In line with our hypothesis, the MPF of the EMG signalat the feedback site (lL3m) generally declined in a linearfashion over time. At other electrode sites, variability over
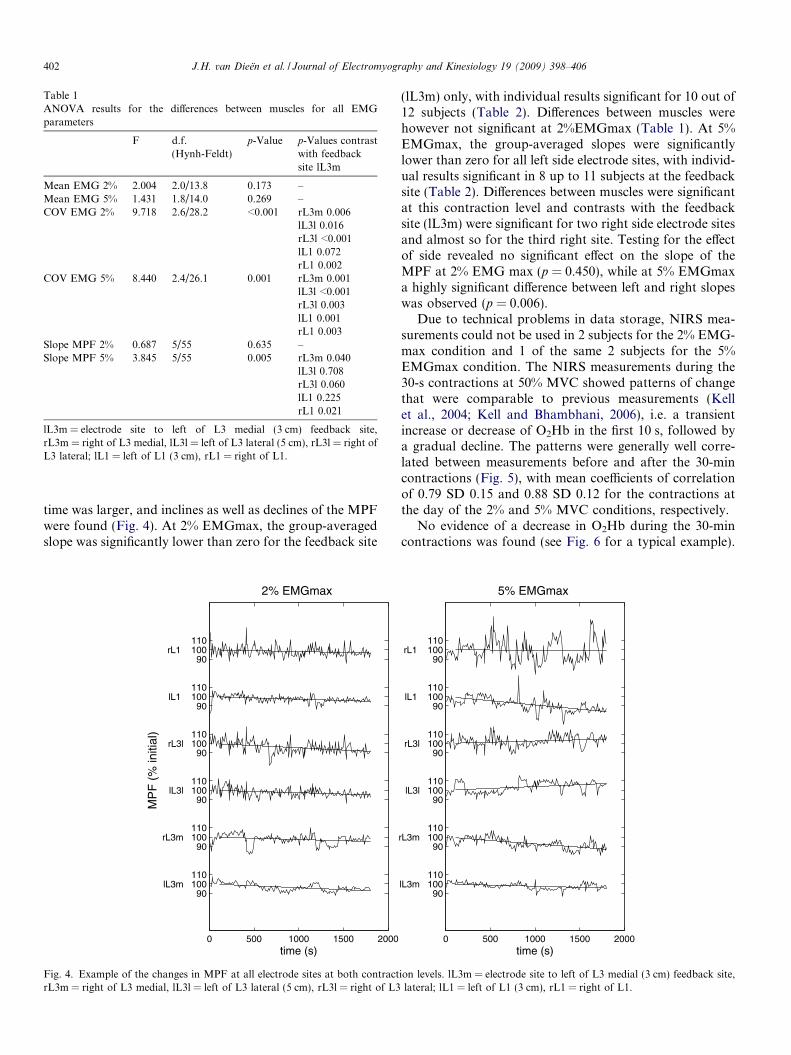
Table 1ANOVA results for the differences between muscles for all EMGparameters
F d.f.(Hynh-Feldt)
p-Value p-Values contrastwith feedbacksite lL3m
Mean EMG 2% 2.004 2.0/13.8 0.173 –Mean EMG 5% 1.431 1.8/14.0 0.269 –COV EMG 2% 9.718 2.6/28.2 <0.001 rL3m 0.006
lL3l 0.016rL3l <0.001lL1 0.072rL1 0.002
COV EMG 5% 8.440 2.4/26.1 0.001 rL3m 0.001lL3l <0.001rL3l 0.003lL1 0.001rL1 0.003
Slope MPF 2% 0.687 5/55 0.635 –Slope MPF 5% 3.845 5/55 0.005 rL3m 0.040
lL3l 0.708rL3l 0.060lL1 0.225rL1 0.021
lL3m = electrode site to left of L3 medial (3 cm) feedback site,rL3m = right of L3 medial, lL3l = left of L3 lateral (5 cm), rL3l = right ofL3 lateral; lL1 = left of L1 (3 cm), rL1 = right of L1.
402 J.H. van Dieen et al. / Journal of Electromyography and Kinesiology 19 (2009) 398–406
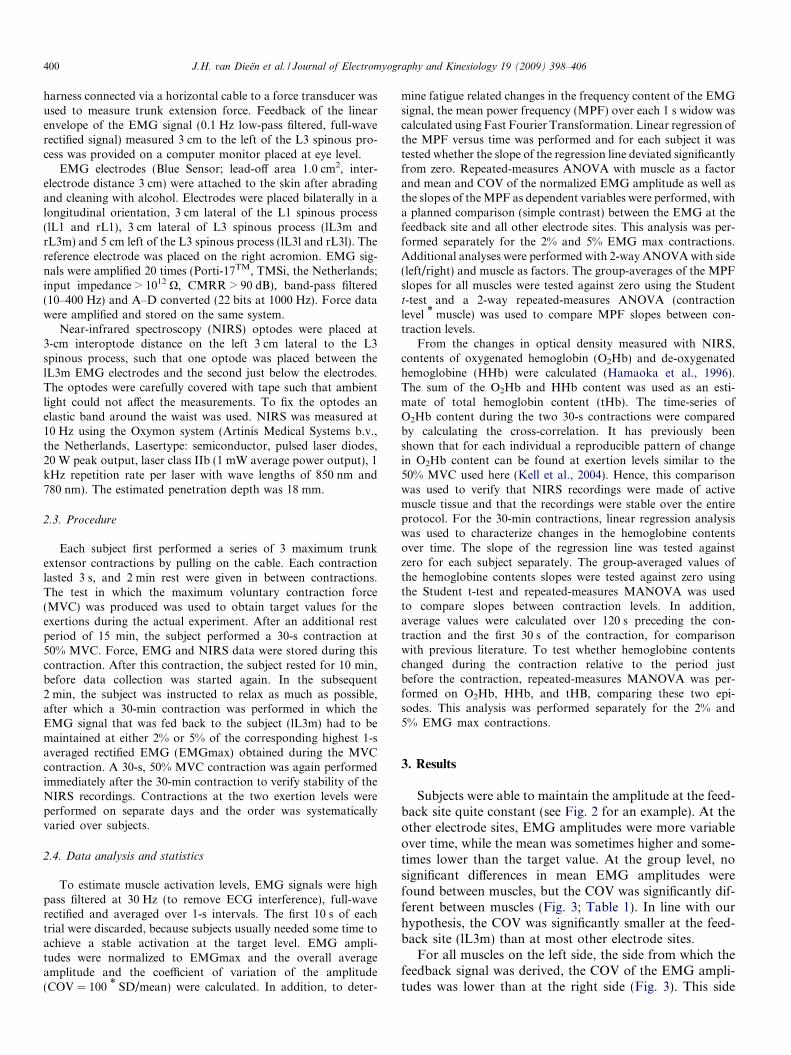
time was larger, and inclines as well as declines of the MPFwere found (Fig. 4). At 2% EMGmax, the group-averagedslope was significantly lower than zero for the feedback site
0 500 1000 1500 2000
90lL3m 100
110
90rL3m 100
110
90lL3l 100 110
90rL3l 100
110
90lL1 100 110
90rL1 100
110
time (s)
MP
F (
% in
itial
)
2% EMGmax
Fig. 4. Example of the changes in MPF at all electrode sites at both contractrL3m = right of L3 medial, lL3l = left of L3 lateral (5 cm), rL3l = right of L3
(lL3m) only, with individual results significant for 10 out of12 subjects (Table 2). Differences between muscles werehowever not significant at 2%EMGmax (Table 1). At 5%EMGmax, the group-averaged slopes were significantlylower than zero for all left side electrode sites, with individ-ual results significant in 8 up to 11 subjects at the feedbacksite (Table 2). Differences between muscles were significantat this contraction level and contrasts with the feedbacksite (lL3m) were significant for two right side electrode sitesand almost so for the third right site. Testing for the effectof side revealed no significant effect on the slope of theMPF at 2% EMG max (p = 0.450), while at 5% EMGmaxa highly significant difference between left and right slopeswas observed (p = 0.006).
Due to technical problems in data storage, NIRS mea-surements could not be used in 2 subjects for the 2% EMG-max condition and 1 of the same 2 subjects for the 5%EMGmax condition. The NIRS measurements during the30-s contractions at 50% MVC showed patterns of changethat were comparable to previous measurements (Kellet al., 2004; Kell and Bhambhani, 2006), i.e. a transientincrease or decrease of O2Hb in the first 10 s, followed bya gradual decline. The patterns were generally well corre-lated between measurements before and after the 30-mincontractions (Fig. 5), with mean coefficients of correlationof 0.79 SD 0.15 and 0.88 SD 0.12 for the contractions atthe day of the 2% and 5% MVC conditions, respectively.
No evidence of a decrease in O2Hb during the 30-mincontractions was found (see Fig. 6 for a typical example).
0 500 1000 1500 2000
90lL3m 100
110
90rL3m 100
110
90lL3l 100 110
90rL3l 100
110
90lL1 100 110
90rL1 100
110
time (s)
5% EMGmax
ion levels. lL3m = electrode site to left of L3 medial (3 cm) feedback site,lateral; lL1 = left of L1 (3 cm), rL1 = right of L1.
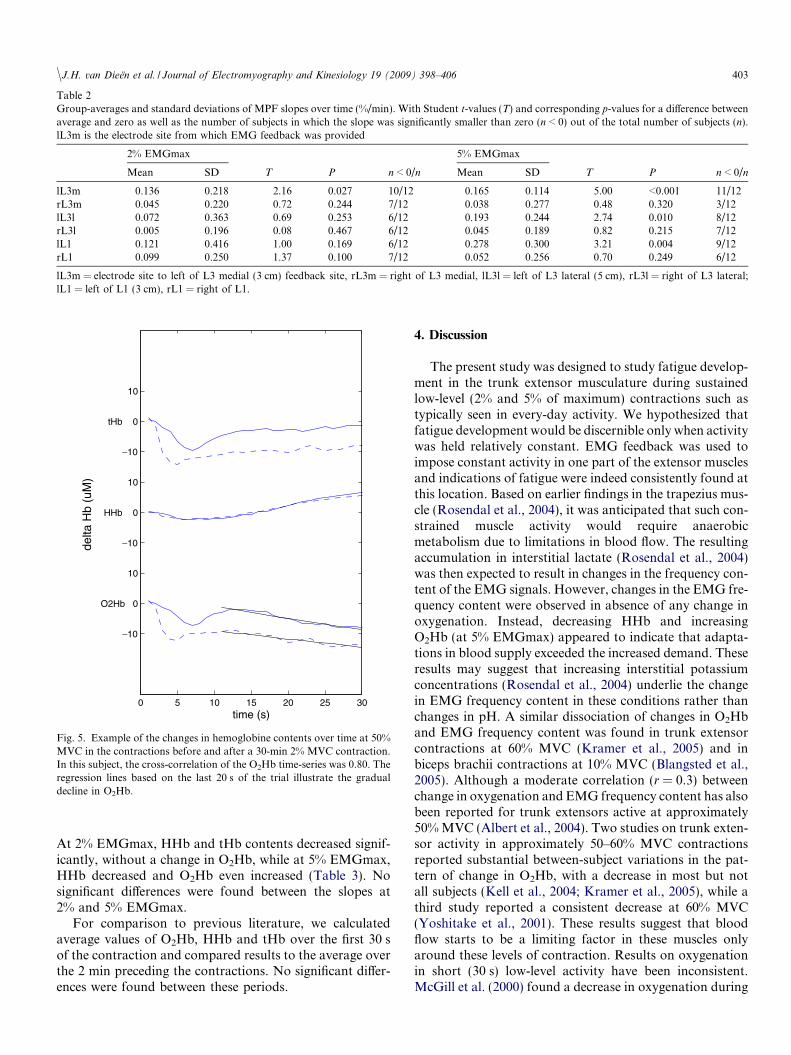
Table 2Group-averages and standard deviations of MPF slopes over time (%/min). With Student t-values (T) and corresponding p-values for a difference betweenaverage and zero as well as the number of subjects in which the slope was significantly smaller than zero (n < 0) out of the total number of subjects (n).lL3m is the electrode site from which EMG feedback was provided
2% EMGmax 5% EMGmax
Mean SD T P n < 0/n Mean SD T P n < 0/n
lL3m �0.136 0.218 �2.16 0.027 10/12 �0.165 0.114 �5.00 <0.001 11/12rL3m �0.045 0.220 �0.72 0.244 7/12 0.038 0.277 0.48 0.320 3/12lL3l �0.072 0.363 �0.69 0.253 6/12 �0.193 0.244 �2.74 0.010 8/12rL3l �0.005 0.196 �0.08 0.467 6/12 �0.045 0.189 �0.82 0.215 7/12lL1 �0.121 0.416 �1.00 0.169 6/12 �0.278 0.300 �3.21 0.004 9/12rL1 �0.099 0.250 �1.37 0.100 7/12 0.052 0.256 0.70 0.249 6/12
lL3m = electrode site to left of L3 medial (3 cm) feedback site, rL3m = right of L3 medial, lL3l = left of L3 lateral (5 cm), rL3l = right of L3 lateral;lL1 = left of L1 (3 cm), rL1 = right of L1.
0 5 10 15 20 25 30
−10
O2Hb 0
10
−10
HHb 0
10
−10
tHb 0
10
time (s)
delta
Hb
(uM
)
Fig. 5. Example of the changes in hemoglobine contents over time at 50%MVC in the contractions before and after a 30-min 2% MVC contraction.In this subject, the cross-correlation of the O2Hb time-series was 0.80. Theregression lines based on the last 20 s of the trial illustrate the gradualdecline in O2Hb.
\J.H. van Dieen et al. / Journal of Electromyography and Kinesiology 19 (2009) 398–406 403
At 2% EMGmax, HHb and tHb contents decreased signif-icantly, without a change in O2Hb, while at 5% EMGmax,HHb decreased and O2Hb even increased (Table 3). Nosignificant differences were found between the slopes at2% and 5% EMGmax.
For comparison to previous literature, we calculatedaverage values of O2Hb, HHb and tHb over the first 30 sof the contraction and compared results to the average overthe 2 min preceding the contractions. No significant differ-ences were found between these periods.
4. Discussion
The present study was designed to study fatigue develop-ment in the trunk extensor musculature during sustainedlow-level (2% and 5% of maximum) contractions such astypically seen in every-day activity. We hypothesized thatfatigue development would be discernible only when activitywas held relatively constant. EMG feedback was used toimpose constant activity in one part of the extensor musclesand indications of fatigue were indeed consistently found atthis location. Based on earlier findings in the trapezius mus-cle (Rosendal et al., 2004), it was anticipated that such con-strained muscle activity would require anaerobicmetabolism due to limitations in blood flow. The resultingaccumulation in interstitial lactate (Rosendal et al., 2004)was then expected to result in changes in the frequency con-tent of the EMG signals. However, changes in the EMG fre-quency content were observed in absence of any change inoxygenation. Instead, decreasing HHb and increasingO2Hb (at 5% EMGmax) appeared to indicate that adapta-tions in blood supply exceeded the increased demand. Theseresults may suggest that increasing interstitial potassiumconcentrations (Rosendal et al., 2004) underlie the changein EMG frequency content in these conditions rather thanchanges in pH. A similar dissociation of changes in O2Hband EMG frequency content was found in trunk extensorcontractions at 60% MVC (Kramer et al., 2005) and inbiceps brachii contractions at 10% MVC (Blangsted et al.,2005). Although a moderate correlation (r = 0.3) betweenchange in oxygenation and EMG frequency content has alsobeen reported for trunk extensors active at approximately50% MVC (Albert et al., 2004). Two studies on trunk exten-sor activity in approximately 50–60% MVC contractionsreported substantial between-subject variations in the pat-tern of change in O2Hb, with a decrease in most but notall subjects (Kell et al., 2004; Kramer et al., 2005), while athird study reported a consistent decrease at 60% MVC(Yoshitake et al., 2001). These results suggest that bloodflow starts to be a limiting factor in these muscles onlyaround these levels of contraction. Results on oxygenationin short (30 s) low-level activity have been inconsistent.McGill et al. (2000) found a decrease in oxygenation during

0 500 1000 1500 2000
−2
O2Hb 0
2
−2
HHb 0
2
−2
tHb 0
2
time (s)
2% EMGmax
delta
Hb
(uM
)
0 500 1000 1500 2000
−2
O2Hb 0
2
−2
HHb 0
2
−2
tHb 0
2
time (s)
5% EMGmax
Fig. 6. Example of the changes in hemoglobine contents over time at both contraction levels. The vertical line marks the start of the contraction.
Table 3Group-averages and standard deviations of slope of hemoglobin content changes over time (lM/min). With Student t-values (T) and correspondingp-values for a difference between average and zero as well as the number of subjects in which the slope was significantly smaller than zero (n < 0) out of thetotal number of subjects (n)
2% EMGmax 5% EMGmax
Mean SD T p n < 0/n Mean SD T p n < 0/n
O2Hb �0.0013 0.0625 �0.066 0.4744 6/10 0.0406 0.0463 2.773 0.0098 1/11HHb �0.0487 0.0261 �5.901 0.0001 10/10 �0.0402 0.0357 �3.560 0.0026 9/11tHb �0.0500 0.0608 �2.602 0.0143 7/10 0.0004 0.0588 0.024 0.4908 6/11
404 J.H. van Dieen et al. / Journal of Electromyography and Kinesiology 19 (2009) 398–406
30-s contractions at 2% and 5% of maximum force, whereasJensen et al. (1999) found no change at 5% of maximumforce. We observed initial changes in oxygenation in mostsubjects that could however be either positive or negative,both in the low-intensity contractions and in the 50%MVC contractions. We therefore submit that NIRS maynot yield a reliable results in short-lasting contractions, pos-sibly due to changes in posture, muscle shape or movementsof the optodes at the initiation of the contraction (Masudaet al., 2005). This may be especially problematic in low-levelcontractions where changes will be limited anyway.
We furthermore hypothesized that the redundancy ofthe extensor musculature at these low contraction levels,would allow substantial variability of activity in other partsof the extensor musculature such that fatigue developmentwould be avoided. In contrast, significant fatigue-relatedchanges in the EMG frequency content were found at loca-tions other than the feedback site in all subjects. The loca-tion of these changes varied between subjects, althougheffects were found mainly ipsilateral to the feedback site.
We conclude that the experimental task used entailed somedegree of co-activation between the different parts of theextensor musculature, in particular between ipsilateralparts, such that fatigue did occur at other locations as well.
To some extent the results support the assumption thatthe trunk extensor muscles are adapted to sustained low-level activity, i.e. we found no decrease in oxygenation atthe feedback site and found considerable variability in activ-ity at other sites that appeared to prevent fatigue locally. Onthe other hand, the results also show that sustained activityas lows as 2% EMGmax can cause consistent fatigue-relatedchanges in the EMG frequency content. Obviously, the lat-ter conclusion depends on the assumption that such changesare valid indications of muscle fatigue. We have previouslyshown that the rate of change of the MPF of trunk extensorEMG is a predictor of the rate of fatigue development inthese muscles (Dieen et al., 1993; Dieen et al., 1998). Themain determinant of the MPF decline with fatigue appearsto be a reduction of the action potential conduction velocity(CV), although other factors such as changes in motor unit

\J.H. van Dieen et al. / Journal of Electromyography and Kinesiology 19 (2009) 398–406 405
firing behavior may contribute (Hagg, 1992; Linssen et al.,1993). Farina et al. (2006) showed a reduction in CV in indi-vidual motor units active throughout contractions of thetrapezius muscles under force feedback at 2 and 5% of max-imum. This effect was however masked in the frequency con-tent of the surface EMG due to recruitment of additionalmotor units. The changes in CV occurred six times fasterthan the changes in MPF found in the present study(approximately 5% in 5 min instead of 30 min). SinceEMG feedback should largely prevent additional recruit-ment, this might indicate a difference in fatigability betweenthe trapezius and trunk extensor muscles.
The rate of fatigue development as evidenced by thedecreases in MPF was not significantly different betweenthe 2% and 5% EMGmax conditions. At 5% EMGmax,the significant increase in O2Hb content and concomitantdecrease in HHb content suggest that blood flow isincreased during these contractions with the increasedinflow of oxygen rich blood exceeding the O2 consumptionrelated to the contraction. At 2% EMGmax, no significantincrease in O2Hb content was observed, suggesting thatsuch a response in blood flow would be lacking or be lesspronounced than at 5% EMGmax. Such a difference inblood flow responses might explain a difference in fatiguedevelopment between the conditions. Increased blood flowmight in particular limit the accumulation of interstitialpotassium that was assumed to cause the changes inEMG frequency content. Nevertheless, compared to 2%EMGmax, 5% EMGmax contractions elicited fatigue man-ifestations, i.e. significant negative slopes of the MPF, moreconsistently at the feedback site and more frequently atother sites as well.
The results of the present study suggest that motor tasksrequiring low-level activity of trunk extensor muscles couldlead to fatigue development, resulting in impaired functionand discomfort or pain. It should be noted that in terms offorce level the contraction intensities may have deviatedslightly from 2% and 5% of maximum. Previous studieshave indicated non-linear relationships between trunkextensor EMG and the extensor moment generated (Potvinet al., 1996; Vink et al., 1988). It is however unclear to whatextent this is due to load sharing between trunk extensormuscles, or due to non-linearity of the EMG force relation-ship of each of the extensor muscles (Staudenmann et al.,2007). It would also suggest that even slight increases intrunk extensor activity, such as associated with small pos-tural changes (Andersson et al., 1974) or disorders likelow-back pain (Dieen et al., 2003), could have negativeeffects. However, the difference in fatigue developmentbetween muscles and between the left and right side foundcoincided with a similar pattern of differences in the COVof muscle activation. This implies that in addition to themean activity, variation of activity is a co-determinant ofthe rate of fatigue development. Since, to our knowledge,no data are available on the variability of trunk extensoractivity during realistic tasks, generalizability of the presentfindings is unknown.
In conclusion, the present study showed that even atmean activity levels as low as 2% EMGmax indicationsof muscle fatigue could be found in the trunk extensorsalready after 30 min. These effects occurred in absence ofchanges in oxygenation of the muscle tissue and appearedaffected by the variability of the activity level.
References
Albert WJ, Sleivert GG, Neary JP, Bhambhani YN. Monitoring individ-ual erector spinae fatigue responses using electromyography and nearinfrared spectroscopy. Can J Appl Physiol 2004;29:363–78.
Andersson GBJ, Ortengren R, Nachemson A, Elfstrom G. Lumbar discpressure and myo-electric back muscle activity during sitting. Scand JRehab Med 1974;6:101–21.
Blangsted AK, Sjogaard G, Madeleine P, Olsen HB, Sogaard K.Voluntary low-force contraction elicits prolonged low-frequencyfatigue and changes in surface electromyography and mechanomyog-raphy. J Electromyogr Kinesiol 2005;15:138–48.
Blangsted AK, Vedsted P, Sjogaard G, Sogaard K. Intramuscular pressureand tissue oxygenation during low-force static contraction do notunderlie muscle fatigue. Acta Physiol Scand 2005;183:379–88.
Bosch T, Looze MPd, Dieen JHv. Development of muscle fatigue anddiscomfort during light manual work. Appl Ergon 2007;50:161–77.
Bystrom SE, Kilbom A. Physiological response in the forearm during andafter isometric intermittent handgrip. Eur J Appl Physiol1990;60:457–66.
Crisco JJ, Panjabi MM. Euler stability of the human ligamentous spine.Part II Experiment. Clin Biomech 1992;7:27–32.
Dieen JHv, Oude Vrielink HHE, Housheer FAF, Lotters FJB, ToussaintHM. Trunk extensor endurance and its relationship to electromyo-gram parameters. Eur J Appl Physiol 1993;66:388–96.
Dieen JHv, Oude Vrielink HHE, Toussaint HM. An investigation into therelevance of the pattern of temporal activation with respect to erectorspinae muscle endurance. Eur J Appl Physiol 1993;66:70–5.
Dieen JHv, Heijblom P, Bunkens H. Extrapolation of time series of EMGpower spectrum parameters in isometric endurance tests of trunkextensor muscles. J Electromyogr Kinesiol 1998;8:35–45.
Dieen JHv, Looze MPd, Hermans V. Effects of dynamic office chairs ontrunk kinematics, trunk extensor EMG, and spinal shrinkage. ApplErgon 2001;44:739–50.
Dieen JHv, Selen LPJ, Cholewicki J. Trunk muscle activation in low-backpain patients, an analysis of the literature. J Electromyogr Kinesiol2003;13:333–51.
Fallentin N, Sidenius B, Jorgensen K. Blood pressure, heart rate andEMG in low-level static contractions. Acta Physiol Scand1985;125:265–75.
Farina D, Zennaro D, Pozzo M, Merletti R, Laubli T. Single motor unitand spectral surface EMG analysis during low-force, sustainedcontractions of the upper trapezius muscle. Eur J Appl Physiol2006;96:157–64.
Hamaoka T, Iwane H, Shimomitsu T, Katsumura T, Murase N, Nishio S,et al. Noninvasive measures of oxidative metabolism on workinghuman muscles by near-infrared spectroscopy. J Appl Physiol1996;81:1410–7.
Hagg GM. Interpretation of EMG spectral alterations and alterationindexes at sustained contraction. J Appl Physiol 1992;73:1211–7.
Jensen BR, Jorgensen K, Hargens AR, Nielsen PK, Nicolaisen T.Physiological response to submaximal isometric contractions of theparavertebral muscles. Spine 1999;24:2332–8.
Jorgensen K, Nicholaisen T, Kato M. Muscle fiber distribution, capillarydensity, and enzymatic activities in the lumbar paravertebral musclesof young men. Significance for isometric endurance. Spine1993;18:1439–50.
Keegan JJ. Alterations of the lumbar curve related to posture and seating.J Bone Joint Surg 1953;35A:589–603.

406 J.H. van Dieen et al. / Journal of Electromyography and Kinesiology 19 (2009) 398–406
Kell RT, Farag M, Bhambhani Y. Reliability of erector spinae oxygen-ation and blood volume responses using near-infrared spectroscopy inhealthy males. Eur J Appl Physiol 2004;91:499–507.
Kell RT, Bhambhani Y. Relationship between erector spinae staticendurance and muscle oxygenation-blood volume changes in healthyand low back pain subjects. Eur J Appl Physiol 2006;96:241–8.
Kramer M, Dehner C, Hartwig E, Volker HU, Sterk J, Elbel M, et al.Intramuscular pressure, tissue oxygenation and EMG fatigue mea-sured during isometric fatigue-inducing contraction of the multifidusmuscle. Eur Spine J 2005;14:578–85.
Krogh-Lund C. Myo-electric fatigue and force failure from submaximalstatic elbow flexion sustained to exhaustion. Eur J Appl Physiol1993;67:389–401.
Linssen WH, Stegeman DF, Joosten EM, van’t Hof MA, Binkhorst RA,Notermans SL. Variability and interrelationships of surface EMGparameters during local muscle fatigue. Muscle Nerve 1993;16:849–56.
Mannion AF. Fibre type characteristics and function of the humanparaspinal muscles: normal values and changes in association with lowback pain. J Electromyogr Kinesiol 1999;9:363–77.
Masuda T, Miyamoto K, Oguri K, Matsuoka T, Shimizu K. Relationshipbetween the thickness and hemodynamics of the erector spinae musclesin various lumbar curvatures. Clin Biomech 2005;20:247–53.
McGill SM, Hughson RL, Parks K. Lumbar erector spinae oxygenationduring prolonged contractions: implications for prolonged work. ApplErgon 2000;43:486–93.
McLean L, Tingley M, Scott RN, Rickards J. Myoelectric signalmeasurement during prolonged computer terminal work. J Electro-myogr Kinesiol 2000;10:33–45.
Mork PJ, Westgaard RH. Long-term electromyographic activity in uppertrapezius and low back muscles of women with moderate physicalactivity. J Appl Physiol 2005;99:570–8.
Potvin JR, Norman RW, McGill SM. Mechanically corrected EMG forthe continuous estimation of erector spinae muscle loading duringrepetitive lifting. Eur J Appl Physiol 1996;74:119–32.
Rosendal L, Blangsted AK, Kristiansen J, Sogaard K, Langberg H,Sjogaard G, et al. Interstitial muscle lactate, pyruvate and potassiumdynamics in the trapezius muscle during repetitive low-force armmovements, measured with microdialysis. Acta Physiol Scand2004;182:379–88.
Sjøgaard G, Kiens B, Jorgensen K, Saltin B. Intramuscular pressure,EMG and blood flow during low-level prolonged static contraction inman. Acta Physiol Scand 1986;128:475–84.
Staudenmann D, Potvin JR, Kingma I, Stegeman DF, Dieen JHv. Effectsof EMG processing on biomechanical models of muscle joint systems:sensitivity of trunk muscle moments, spinal forces, and stability. JBiomech 2007;40:900–9.
Vink P, Velde EAvd, Verbout AJ. A functional subdivision of the lumbarextensor musculature, recruitment patterns and force ra-emg relation-ships under isometric conditions. Electromyogr Clin Neurophysiol1988;28:517–25.
Yoshitake Y, Ue H, Miyazaki M, Moritani T. Assessment of lower-backmuscle fatigue using electromyography, mechanomyography, andnear-infrared spectroscopy. Eur J Appl Physiol 2001;84:174–9.
Jaap H. van Dieen obtained a PhD in HumanMovement Sciences from the Faculty of HumanMovement Sciences at the VU UniversityAmsterdam the Netherlands in 1993. Since 1996he has been affiliated to this faculty, since 2002 asprofessor of biomechanics. He leads a researchgroup focusing on mechanical aspects of mus-culoskeletal injuries. His main research interestis on the interaction of muscle coordination,fatigue, musculoskeletal disorders, joint loadand stability. He has (co-)authored over 120
papers in international scientific journals and numerous abstracts and bookchapters in the international literature and technical reports and publica-
tions in Dutch. He is an editor of the European Journal of Applied Physi-ology, section editor of Human Movement Sciences and serves on theeditorial advisory board of the Journal of Electromyography and Kinesi-ology and the editorial board of Clinical Biomechanics and is currently amember of the boards of ISEK and the Dutch Society for Human Move-ment Sciences.
Eleonora Westebring-van der Putten graduatedas a Master in Industrial Design Engineering atDelft University of Technology in 1997. In2006, she obtained her Master degree inHuman Movement Sciences from the VUUniversity Amsterdam. Her MSc thesis con-cerned oxygenation of the trunk extensormuscles during low-level activity. Since 2006,she is working as a scientific researcher(obtaining a PhD) at the Faculty of industrialDesign Engineering at the Delft University of
Technology. The aim of her research is to obtain a validated interactionmodel for controlling grasp forces, using haptic information in MinimallyInvasive Surgery. In 2007, she got an appointment as a guest Professor in
Product Ergonomics at the HA in Antwerp, Belgium.Idsart Kingma is an assistant professor at theFaculty of Human Movement Sciences of theVU University Amsterdam where he is teach-ing courses on ergonomics and biomechanics.He has an MSc in human movement sciencesand he finished his PhD on the biomechanics oflifting in 1998. Currently, his main researchinterests are mechanical aspects of low-backloading and neuromuscular control of jointstability. He was (co-)author of over 60 papersin international scientific journals and he serves
on the editorial board of the Journal of Electromyography andKinesiology.
Michiel P. de Looze graduated as a HumanMovement Scientist in 1988. He got his PhD in1992. Until 1998 he has worked as a scientificresearcher at the Faculty of Human MovementSciences at the VU University Amsterdam. Thefocus of his work was on biomechanics (tor-ques and forces) and physiology (energy, fati-gue) during occupational activities such aslifting, carrying, pushing and pulling. Since1998 he is working at TNO (NetherlandsInstitute for Applied Research), where he is
involved in applied research projects in close cooperation with industrialpartners. The focus of his work has shifted towards the prolonged,repetitive, low-force activities that are typical for contemporary office
work, light manual work and manual assembly. In 2005, he got a (part-time) appointment at the VU University in Amsterdam as a Professor inProduction Ergonomics. Major research topic: What are the effects ofvarious occupational activities over time on the feelings of comfort anddiscomfort, and how does fatigue and performance develop. Over theyears, he has (co-)authored 45 full papers that have been published inscientific journals.Copyright © 2022 FDOKUMEN