Structure and spectroscopy of hydrated neptunyl(VI) nitrate ...
Upload
independentCategory
view
2download
0
Nitric Oxide 39 (2014) 51–58
Contents lists available at ScienceDirect
Nitric Oxide
journal homepage: www.elsevier .com/locate /yniox
Dose dependent effects of nitrate supplementation on cardiovascularcontrol and microvascular oxygenation dynamics in healthy rats
http://dx.doi.org/10.1016/j.niox.2014.04.0071089-8603/� 2014 Elsevier Inc. All rights reserved.
⇑ Corresponding author. Address: Department of Anatomy and Physiology,College of Veterinary Medicine, Kansas State University, Manhattan, KS 66506-5802, USA.
E-mail address: [email protected] (S.K. Ferguson).
Scott K. Ferguson a,⇑, Daniel M. Hirai a, Steven W. Copp a, Clark T. Holdsworth a, Jason D. Allen c,Andrew M. Jones d, Timothy I. Musch a,b, David C. Poole a,b
a Department of Anatomy and Physiology, Kansas State University, Manhattan, KS 66506, USAb Department of Kinesiology, Kansas State University, Manhattan, KS 66506, USAc Department of Community and Family Medicine, Department of Medicine, Duke University, Durham, NC 27710, USAd Sport and Health Sciences, University of Exeter, St. Luke’s Campus, Exeter EX12LU, UK
a r t i c l e i n f o a b s t r a c t
Article history:Received 20 January 2014Revised 11 April 2014Available online 21 April 2014
Keywords:Nitric oxideExerciseDietary nitrateNitriteMean arterial pressureBlood flow
High dose nitrate (NO3�) supplementation via beetroot juice (BR, 1 mmol/kg/day) lowers mean arterial
blood pressure (MAP) and improves skeletal muscle blood flow and O2 delivery/utilization matchingthereby raising microvascular O2 pressure (PO2mv). We tested the hypothesis that a low dose of NO3
� sup-plementation, consistent with a diet containing NO3
� rich vegetables (BRLD, 0.3 mmol/kg/day), would besufficient to cause these effects. Male Sprague–Dawley rats were administered a low dose of NO3
�
(0.3 mmol/kg/day; n = 12), a high dose (1 mmol/kg/day; BRHD, n = 6) or tap water (control, n = 10) for5 days. MAP, heart rate (HR), blood flow (radiolabeled microspheres) and vascular conductance (VC) weremeasured during submaximal treadmill exercise (20 m/min, 5% grade, equivalent to �60% of maximal O2
uptake). Subsequently, PO2mv (phosphorescence quenching) was measured at rest and during 180 s ofelectrically-induced twitch contractions (1 Hz, �6 V) of the surgically-exposed spinotrapezius muscle.BRLD and BRHD lowered resting (control: 139 ± 4, BRLD: 124 ± 5, BRHD: 128 ± 9 mmHg, P < 0.05, BRLDvs. control) and exercising (control: 138 ± 3, BRLD: 126 ± 4, BRHD: 125 ± 5 mmHg, P < 0.05) MAP to a sim-ilar extent. For BRLD this effect occurred in the absence of altered exercising hindlimb muscle(s) bloodflow or spinotrapezius PO2mv (rest and across the transient response at the onset of contractions, allP > 0.05), each of which increased significantly for the BRHD condition (all P < 0.05). Whereas BRHD slo-wed the PO2mv kinetics significantly (i.e., >mean response time, MRT; control: 16.6 ± 2.1, BRHD:23.3 ± 4.7 s) following the onset of contractions compared to control, in the BRLD group this effect didnot reach statistical significance (BRLD: 20.9 ± 1.9 s, P = 0.14). These data demonstrate that while lowdose NO3
� supplementation lowers MAP during exercise it does so in the absence of augmented muscleblood flow, VC and PO2mv; all of which are elevated at a higher dose. Thus, in healthy animals, a high doseof NO3
� supplementation seems necessary to elicit significant changes in exercising skeletal muscle O2
delivery/utilization.� 2014 Elsevier Inc. All rights reserved.
1. Introduction
A fundamental tenet of exercise physiology is that blood flow(BF) increases following exercise onset to meet the rising skeletalmuscle energetic demands. This hyperemic response is mediatedby a host of vasodilatory controllers [19] and it is now widelyaccepted that nitric oxide (NO) plays a deterministic role inregulating not only O2 delivery ( _QO2) ([17], reviewed by Joyner
and Tschakovsky [18]), but also O2 utilization ( _VO2) within theskeletal muscle [1,26]. A growing body of evidence suggests thatingestion of inorganic nitrate (NO3
�), for example via beetroot juice(BR), can, following a step-wise reduction, elevate NO bioavailabil-ity and thus impact skeletal muscle hemodynamic and metabolicfunction during exercise [25,5,43,20,22,23,9,10].
In humans, NO3� supplementation via BR reduces blood pressure
and enhances exercise tolerance in both healthy [5,43,22,23,7,46]and patient populations (i.e., peripheral arterial disease [20]).These effects appear to have a dose–dependent response with noadditional improvement in exercise tolerance after ingesting BRcontaining 16.8 compared to 8.4 mmol NO3
� [45]. The precisemechanisms for these improvements are not yet fully understood.

52 S.K. Ferguson et al. / Nitric Oxide 39 (2014) 51–58
However, recent investigations using murine models implicateenhanced exercising muscle BF (i.e., " _QO2 [9]), and _QO2= _VO2
matching (e.g. microvascular PO2; PO2mv [10]), combined withgreater contractile efficiency (e.g. ; _VO2; [16]).
Many disease states impair exercise tolerance and its restorationis a primary therapeutic goal. What is not known is whether lowerdoses of NO3
� alter cardiovascular control and muscle oxygenation(i.e. PO2mv, which sets the pressure head for capillary–myocyteO2 flux) during exercise. Specifically, one question of paramountecological importance is whether NO3
� dosing consistent with anindividual eating a diet rich in leafy greens and other NO3
� sourcescan achieve the cardiovascular and muscular benefits without thenecessity for supplementation per se. Thus, we tested the hypothe-ses that a low dose of NO3
� supplementation (i.e. consistent with adiet containing NO3
� rich vegetables, 0.3 mmol/kg/day) would besufficient to (1) raise plasma [NO3
�] and [NO2�], (2) lower mean arte-
rial pressure (MAP) at rest and during exercise, (3) elevate BF andvascular conductance (VC) in locomotory muscles of the hindlimband (4) raise the PO2mv of the mixed fiber-type spinotrapeziusmuscle during the crucial rest-contractions transient.
2. Methods
2.1. Animal selection and care
Thirty-one young adult male Sprague–Dawley rats(�3–4 months of age, Charles River Laboratories, Wilmington,MA, USA) were used in this investigation. Rats were maintainedin accredited animal facilities at Kansas State University on a 12/12 h light–dark cycle with food and water provided ad libitum.All procedures were approved by the Institutional Animal Careand Use Committee of Kansas State University and conductedaccording to National Institutes of Health guidelines. All rats werefamiliarized with running on a custom-built motor-driven tread-mill for 5 min/day at a speed of 20 m/min up a 5% grade for�5 days.
2.2. Supplementation protocol
Rats were randomly assigned to receive 5 days of BR supple-mentation with either a low NO3
� dose of 0.3 mmol/kg/day (BRLD;n = 14), a higher NO3
� dose of 1 mmol/kg/day (BRHD; n = 6, Beetit™, James White Drinks, Ipswich, UK) or untreated tap water (con-trol; n = 11) with consumption monitored. For both BRLD andBRHD rats, 2 days’ worth of BR was diluted in 100 ml of tap water(average daily fluid consumption �50–60 ml/day). This lower NO3
�
dose (0.3 mmol/kg/day) represents a dose found in a diet contain-ing NO3
� rich vegetables, while the higher NO3� dose (1 mmol/kg/
day) represents a dietary supplement with a NO3� concentration
similar to that used by Jones and colleagues [5,43,22,23] afteraccounting for the resting metabolic rate of rats (�7� that ofhumans [15,37]). In an effort to minimize the unnecessary utiliza-tion of additional animals, both control and BRHD data presentedherein represent a randomly selected subset of animals publishedrecently. The BRHD data represent a NO3
� dose of 1 mmol/kg/dayand demonstrate a significant vascular effect of supplementation[9,10]. Data from the BRLD group were obtained within the sametime-frame as control and BRHD groups presented in Fergusonet al. ([9,10], e.g. within 16 weeks). In this way any potential sea-sonal differences or variations in rat-chow content were avoided.
2.3. Surgical instrumentation
Rats were anaesthetized with a 5% isoflurane–O2 mixture andmaintained subsequently on 3% isoflurane–O2. The carotid artery
was isolated and cannulated with a catheter (PE-10 connected toPE-50, Intra-Medic polyethylene tubing, Clay Adams Brand, Becton,Dickinson and Company, Sparks, MD) for the measurement of MAPand HR, infusion of the phosphorescent probe (see below), andarterial blood sampling. A second catheter was placed in the caudalartery. The incisions were then closed and rats were given >1 h torecover [11].
2.4. Protocol 1: measurement of hindlimb skeletal muscle blood flow
After recovery, rats were placed on the treadmill and the caudalartery catheter was connected to a 1 ml syringe chambered in aHarvard infusion/withdrawal pump (model 907, Cambridge, MA,USA). The carotid artery catheter was connected to a pressuretransducer (Gould Statham P23ID, Valley View, OH, USA) main-tained at the same height as the animal. Exercise was initiatedand treadmill speed was increased progressively over a �30 s per-iod to a speed of 20 m/min (5% grade, �60% _VO2 max; [37]). The ratcontinued to exercise for another 2.5 min until a total time of3 min was reached. At 3 min the Harvard pump was activatedand withdrawal was initiated at a rate of 0.25 ml min�1. Simulta-neously, HR and MAP were measured and recorded using the car-otid artery catheter. The carotid artery catheter was thendisconnected from the pressure transducer and 0.5–0.6 � 106
15 lm diameter radiolabeled microspheres (57Co or 85Sr in randomorder; Perkin Elmer, Waltham, MA, USA) were infused into the aor-tic arch for determination of regional BF. Following the micro-sphere infusion �0.2 ml of blood was sampled from the carotidartery catheter for the determination of blood lactate concentra-tion ([lactate]) (Nova Stat Profile M, Nova Biomedical, Waltham,MA, USA) after which exercise was terminated.
Following a minimum 1 h recovery period, a second micro-sphere infusion (differently radio-labeled than the first) was per-formed while the rat sat quietly on the treadmill for thedetermination of resting BF, HR and MAP. This experimental strat-egy (i.e. exercise before rest) mitigates potential influences of thepre-exercise anticipatory response on resting skeletal muscle BFmeasurements [2].
2.5. Protocol 2: measurement of spinotrapezius muscle PO2mv
Following the second (resting) microsphere infusion, rats wereanesthetized progressively using diluted pentobarbital sodiumanesthesia (administered into the caudal artery catheter to effect)with the level of anesthesia monitored continuously via the toe-pinch and blink reflexes. Rats were then placed on a heating padto maintain core temperature at �38 �C (measured via rectalprobe). Overlying skin and fascia were reflected carefully fromthe mid-dorsal caudal region of each rat and the right spinotrapez-ius muscle was carefully exposed in a manner that ensured theintegrity of the neural and vascular supply to the muscle [3]. Silverwire electrodes were sutured (6–0 silk) to the rostral (cathode) andcaudal (anode) regions of the muscle. The exposed spinotrapeziusmuscle was continuously superfused with a warmed (38 �C)Krebs–Henseleit bicarbonate buffered solution equilibrated with5% CO2–95% N2 and surrounding exposed tissue was covered withSaran wrap (Dow Brands, Indianapolis, IN). The spinotrapeziusmuscle was selected specifically based on its mixed muscle fiber-type composition and citrate synthase activity close to that foundin human quadriceps muscle [8,29].
The phosphorescent probe palladium meso-tetra (4 carboxy-phenyl)porphyrin dendrimer (R2: 15–20 mg kg�1 dissolved in0.4 ml saline) was infused via the carotid artery catheter. After abrief stabilization period (�10 min), the common end of the lightguide of a frequency domain phosphorometer (PMOD 5000,Oxygen Enterprises, Philadelphia, PA) was positioned �2–4 mm

S.K. Ferguson et al. / Nitric Oxide 39 (2014) 51–58 53
superficial to the dorsal surface of the exposed right spinotrapeziusmuscle over a randomly selected muscle field absent of large ves-sels thus ensuring that the region contained principally capillaryblood. PO2mv was measured via phosphorescence quenching (seebelow) and reported at 2 s intervals throughout the duration ofthe 180 s contraction protocol (1 Hz, �6 V, 2 ms pulse duration)elicited via a Grass stimulator (model S88, Quincy, MA). Followingthe contraction period it was ensured that PO2mv returned to base-line values (indicative of preserved vasomotor function). Rats wereeuthanized via pentobarbital sodium overdose (� 50 mg=kgadministered into the carotid artery catheter).
2.6. PO2mv measurement and curve-fitting
The Stern–Volmer relationship allows the calculation of PO2mvthrough the direct measurement of a phosphorescence lifetime viathe following equation [41]:
PO2mv ¼ ½ðs�=sÞ � 1�=ðkQ � s� Þ
where kQ is the quenching constant and s� and s are the phospho-rescence lifetimes in the absence of O2 and the ambient O2 concen-tration, respectively. For R2, kQ is 409 mmHg�1 s�1 and s� is 601 ls[31] and these characteristics do not change over the physiologicalrange of pH and temperature in the rat in vivo and, therefore, thephosphorescence lifetime is determined directly by the O2 pressure[41,31].
The R2 phosphorescent probe binds to albumin, and conse-quently, is uniformly distributed throughout the plasma. A previ-ous study from our laboratory investigated systematically thecompartmentalization of R2 and confirmed that it remains withinthe microvasculature of exposed muscle over the duration consid-ered in the present experiments, thereby ensuring a valid PO2mvmeasurement [40].
Curve-fitting of the measured PO2mv responses was performedwith commercially available software (SigmaPlot 11.01, SystatSoftware, San Jose, CA) and the data were fit with either a one-or two-component model as described below:
One component : PO2mv ðtÞ ¼ PO2mv ðBLÞ � DPO2mvð1� e�ðt�TDÞ=sÞ
Two component : PO2mv ðtÞ¼ PO2mv ðBLÞ � D1PO2mvð1� e�ðt�TD1Þ=s1 Þþ D2PO2mvð1� e�ðt�TD2Þ=s2 Þ
where PO2mv(t) represents the PO2mv at any given time t, PO2mv(BL)
corresponds to the pre-contracting resting baseline PO2mv, D1 andD2 are the amplitudes for the first and second components, respec-tively, TD1 and TD2 are the time delays for each component, and s1
and s2 are the time constants (i.e., time to 63% of the final responsevalue) for each component. Goodness of fit was determined usingthe following criteria: (1) the coefficient of determination, (2)sum of the squared residuals, and (3) visual inspection and analysisof the model fits to the data and the residuals. The mean responsetime (MRT) of the kinetics response was calculated for the first com-ponent in order to provide an index of the overall principal kineticsresponse according to the following equation:
MRT1 ¼ TD1 þ s1
where TD1 and s1 are as described above. The delta of the initialPO2mv fall following contractions onset was normalized to s1 (D1
PO2mv/s1) to provide an index of the relative rate of fall. Addition-ally, the time taken to reach 63% of the initial PO2mv fall was deter-mined independently from the modeling procedures (T63) to ensureappropriateness of the model fits. Specifically, the raw PO2mv data
were interpolated, and the time coinciding with 63% of the totalamplitude (Dtotal PO2mv) was determined.
2.7. Determination of BF and VC
Following euthanasia, the thorax of each rat was opened andplacement of the carotid artery catheter was confirmed beforethe internal organs and individual muscles and muscle parts ofthe hindlimb were identified and excised. Upon removal, tissueswere weighed and placed promptly into counting vials. Radioactiv-ity of each tissue was determined with a gamma scintillation coun-ter (Packard Auto Gamma Spectrometer, model 5230, DownersGrove, IL, USA). Tissue BF was then calculated using the referencesample method [38] and expressed as ml/min/100 g. Adequatemixing of the microspheres was verified for each microsphere infu-sion as demonstrated by a <15% difference in BF to the right andleft kidneys and to the right and left hindlimb musculature. VCwas calculated by normalizing BF to MAP and expressed as ml/min/100 g/mmHg.
2.8. Blood sampling and measurement of plasma [NO3�] and [NO2
�]
Post-supplementation blood samples were collected followingsurgical instrumentation via the caudal artery catheter to assess(1) plasma [NO3
�] and [NO2�] and (2) pH, PO2, and %O2 saturation.
For plasma [NO3�] and [NO2
�], �0.8 ml of blood was drawn into hep-arinized tubes and rapidly centrifuged at 6000g at 4 �C for 6 min.Plasma was then extracted and frozen immediately at �80 �C forlater analysis. A second �0.3 ml blood sample was drawn and ana-lyzed for pH, PO2, and %O2 saturation (Nova Stat Profile M, NovaBiomedical, Waltham, MA, USA).
All measurements of plasma NO3� and NO2
� were performedwithin 30 min of thawing via chemiluminescence with an Ionic/Sievers NO analyzer (NOA 280i, Sievers Instruments, Boulder, CO,USA). In order to obtain plasma NO2
� levels and to avoid potentialreduction of NO3
�, potassium iodide in acetic acid was used as areductant. This reductant possesses the ability to reduce NO2
� toNO but is incapable of reducing higher oxides of nitrogen (i.e.NO3�) thus increasing the specificity for NO2
�. Plasma NO3� concen-
trations were then obtained using the same apparatus with thestronger reductant vanadium chloride in hydrochloric acid at atemperature of 95 �C. This stronger reductant reduces the sum ofall nitrogen oxides with an oxidation state of +2 or higher (pre-dominantly NO3
� [lM]) but also includes NO2� and nitrosothiols
[nM]. Consequently, the signals obtained using potassium iodidewere subtracted from those with vanadium chloride to provide aclearer representation of the NO3
� concentrations.
2.9. Statistical analysis
Data are presented as mean ± standard error of the mean (SEM).Results were compared within (rest vs. exercise) and between(control vs. BRLD vs. BRHD) using mixed 2-way analysis of variance(ANOVA) with Student–Newman–Keuls post hoc tests whereappropriate. Significance was accepted at P < 0.05.
3. Results
There were no between-group differences in the total hindlimbmuscle/body mass ratio (control: 4.4 ± 0.1, BRLD: 4.3 ± 0.1, BRHD:4.2 ± 0.2, P > 0.05). BRHD, but not BRLD, rats had significantlyhigher plasma [NO3
�] and [NO2�] when compared to control (Fig. 1).

*
*
Plas
ma
[NO
3- ] ( µ
M)
0
50
100
150
200
* #
Plas
ma
[NO
2- ] (n
M)
0
200
400
600
800 *#
Control BRLD BRHD
Fig. 1. Top panel: Post-supplementation plasma [NO3�] for control, BRLD and BRHD
rats. Bottom panel: Post-supplementation plasma [NO2�] for control, BRLD and BR
rats. ⁄P < 0.05 vs. control #P < 0.05 vs. BRLD.
54 S.K. Ferguson et al. / Nitric Oxide 39 (2014) 51–58
3.1. Protocol 1: BF and VC at rest and during exercise
3.1.1. MAP and HRMAP at rest was reduced in BRLD rats compared to control.
However, despite >10 mmHg lower average, resting MAP was notsignificantly different in BRHD rats when compared to control(P = 0.10, Fig. 2). During treadmill exercise MAP was reduced forboth BRLD and BRHD groups when compared to control (Fig. 2).Neither HR at rest (control: 408 ± 8, BRLD: 408 ± 17, BRHD:407 ± 18 beats/min, P > 0.05) or during exercise (control:528 ± 10, BRLD: 508 ± 14, BRHD: 525 ± 7 beats/min, P > 0.05) wasaltered for BRLD or BRHD.
3.1.2. Blood gases, blood [lactate], hematocritThere were no between-group differences in arterial PO2, PCO2,
or hematocrit at rest or during exercise (data not shown, P > 0.05for all). Resting and exercising arterial blood [lactate] were not
Rest Exercise
MAP
(mm
Hg)
0110
115
120
125
130
135
140
145ControlBRLDBRHD
***
Fig. 2. Resting and exercising mean arterial pressures for control, BRLD and BRHDrats. ⁄P < 0.05 vs. control.
different among groups (control: 2.64 ± 0.3, BRLD: 2.95 ± 0.3,BRHD: 2.1 ± 0.3, P > 0.05 for all) but tended (P = 0.12) to be lowerfor BRHD during exercise.
3.1.3. BF and VCThere were no differences in resting total hindlimb skeletal
muscle BF (control: 16 ± 2, BRLD: 19 ± 2, BRHD: 21 ± 5 ml/min/100 g, P > 0.05) or VC (control: 0.12 ± 0.01, BRLD: 0.15 ± 0.02,BRHD: 0.16 ± 0.03 ml/min/100 g/mmHg, P > 0.05) between groups.Similarly, there were no differences in resting BF or VC in any of the28 individual hindlimb muscles or muscle parts (Table 1).
Total exercising hindlimb muscle BF and VC were greater inBRHD rats when compared to BRLD and control rats (Fig. 3). Specif-ically, BRHD supplemented rats had greater BF in 14, and VC in 20,of the 28 individual hindlimb muscles and muscle parts (Table 2)when compared to control and BRLD rats. There were nobetween-group differences in BF or VC at rest or during exercisefor organs of the splanchnic region (Table 3).
3.2. Protocol 2: PO2mv parameters
Representative raw PO2mv profiles of control, BRLD and BRHDrats are presented in Fig. 4. The responses were fit by a one-compo-nent model in 2 of 11 control, 6 of 12 BRLD and 2 of 5 BRHD ratswhile the more complex two-component model was utilized forthe remainder. The r2 (control: 0.99 ± 0.01, BRLD: 0.98 ± 0.01, BRHD:0.98 ± 0.01) and low sum of squared residuals (control: 20.2 ± 3.1,BRLD: 18.3 ± 2.7, BRHD: 21.1 ± 7 mmHg) for both groups supportedthat the model fits were suitable. Table 4 presents the average PO2-
mv baselines and kinetics parameters. There were no differences inthe PO2mv(BL) between groups. However, following the onset ofcontractions BRHD, but not BRLD, demonstrated a longer TD1, smal-ler first-component amplitude and slower PO2mv kinetics (i.e.,longer MRT1). Overall (i.e., PO2mv(BL) minus PO2mv(steady-state), Dtotal
PO2mv) amplitudes tended to be less in BRHD (P = 0.06) but failed toreach statistical significance. There were no differences in PO2-
mv(steady-state) during contractions between groups.
4. Discussion
The principal original finding of this investigation is that lowdose NO3
� supplementation via beetroot juice (0.3 mmol/kg/day,BRLD), at levels consistent with a diet rich in leafy green vegetablesconsumed by humans, lowers resting and exercising MAP. More-over, this occurred in the absence of increased exercising skeletalmuscle BF and VC which are both elevated after higher supplemen-tation doses (1 mmol/kg/day, BRHD). That BRLD impacts cardio-vascular control at levels that do not detectably increasecirculating NO3
� or NO2� suggests that central mechanisms of car-
diovascular control, possibly within the rostral ventrolateralmedulla (RVLM) region of the brain, are extremely sensitive toaltered dietary NO3
� intake. Given that, in humans, reductions insystolic blood pressure of �10 mmHg (as seen with BRLD herein)have been estimated to decrease the risk of stroke by �35% andischemic heart disease by �25% [34,30,27,28,25,24], these findingshave strong potential clinical significance. It is also pertinent thatemploying low dose inorganic NO3
� supplementation may avoidor reduce the opportunity for development of NO3
� tolerance andendothelial dysfunction [43,39] which occur especially afterchronic administration of organic NO3
� (see [45] for discussion).
4.1. Relationship to existing literature
The randomly selected subset of data from results initiallyreported from our laboratory [9] demonstrate clearly the effects
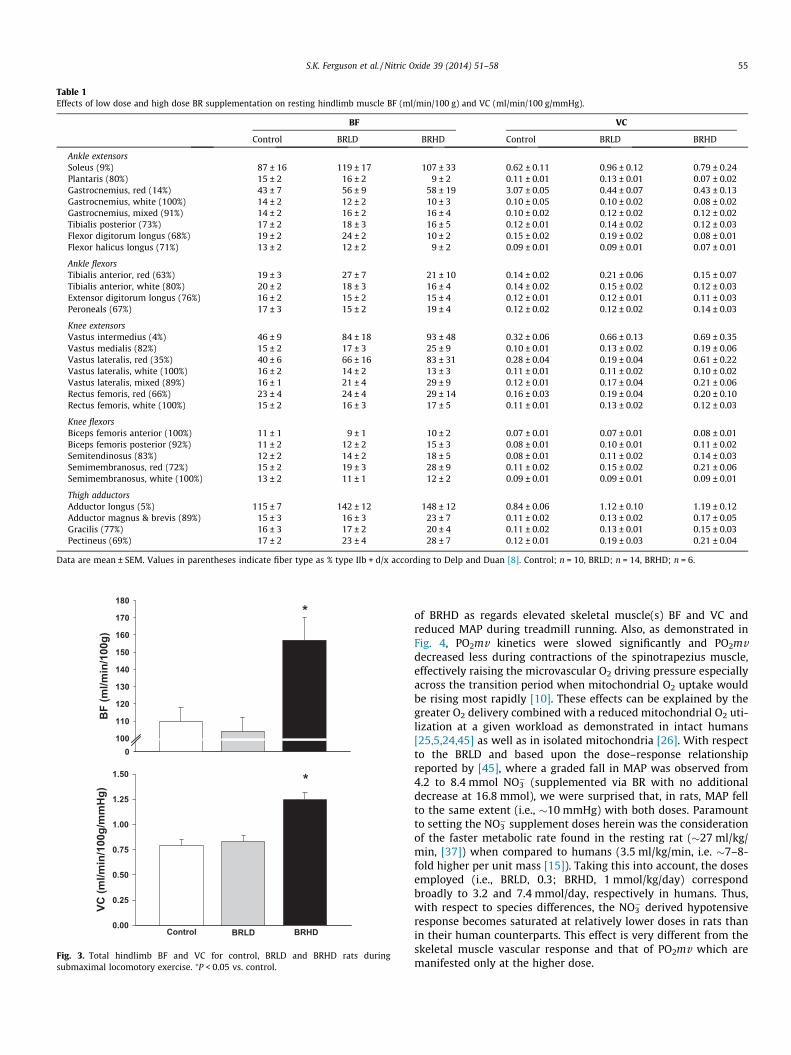
Table 1Effects of low dose and high dose BR supplementation on resting hindlimb muscle BF (ml/min/100 g) and VC (ml/min/100 g/mmHg).
BF VC
Control BRLD BRHD Control BRLD BRHD
Ankle extensorsSoleus (9%) 87 ± 16 119 ± 17 107 ± 33 0.62 ± 0.11 0.96 ± 0.12 0.79 ± 0.24Plantaris (80%) 15 ± 2 16 ± 2 9 ± 2 0.11 ± 0.01 0.13 ± 0.01 0.07 ± 0.02Gastrocnemius, red (14%) 43 ± 7 56 ± 9 58 ± 19 3.07 ± 0.05 0.44 ± 0.07 0.43 ± 0.13Gastrocnemius, white (100%) 14 ± 2 12 ± 2 10 ± 3 0.10 ± 0.05 0.10 ± 0.02 0.08 ± 0.02Gastrocnemius, mixed (91%) 14 ± 2 16 ± 2 16 ± 4 0.10 ± 0.02 0.12 ± 0.02 0.12 ± 0.02Tibialis posterior (73%) 17 ± 2 18 ± 3 16 ± 5 0.12 ± 0.01 0.14 ± 0.02 0.12 ± 0.03Flexor digitorum longus (68%) 19 ± 2 24 ± 2 10 ± 2 0.15 ± 0.02 0.19 ± 0.02 0.08 ± 0.01Flexor halicus longus (71%) 13 ± 2 12 ± 2 9 ± 2 0.09 ± 0.01 0.09 ± 0.01 0.07 ± 0.01
Ankle flexorsTibialis anterior, red (63%) 19 ± 3 27 ± 7 21 ± 10 0.14 ± 0.02 0.21 ± 0.06 0.15 ± 0.07Tibialis anterior, white (80%) 20 ± 2 18 ± 3 16 ± 4 0.14 ± 0.02 0.15 ± 0.02 0.12 ± 0.03Extensor digitorum longus (76%) 16 ± 2 15 ± 2 15 ± 4 0.12 ± 0.01 0.12 ± 0.01 0.11 ± 0.03Peroneals (67%) 17 ± 3 15 ± 2 19 ± 4 0.12 ± 0.02 0.12 ± 0.02 0.14 ± 0.03
Knee extensorsVastus intermedius (4%) 46 ± 9 84 ± 18 93 ± 48 0.32 ± 0.06 0.66 ± 0.13 0.69 ± 0.35Vastus medialis (82%) 15 ± 2 17 ± 3 25 ± 9 0.10 ± 0.01 0.13 ± 0.02 0.19 ± 0.06Vastus lateralis, red (35%) 40 ± 6 66 ± 16 83 ± 31 0.28 ± 0.04 0.19 ± 0.04 0.61 ± 0.22Vastus lateralis, white (100%) 16 ± 2 14 ± 2 13 ± 3 0.11 ± 0.01 0.11 ± 0.02 0.10 ± 0.02Vastus lateralis, mixed (89%) 16 ± 1 21 ± 4 29 ± 9 0.12 ± 0.01 0.17 ± 0.04 0.21 ± 0.06Rectus femoris, red (66%) 23 ± 4 24 ± 4 29 ± 14 0.16 ± 0.03 0.19 ± 0.04 0.20 ± 0.10Rectus femoris, white (100%) 15 ± 2 16 ± 3 17 ± 5 0.11 ± 0.01 0.13 ± 0.02 0.12 ± 0.03
Knee flexorsBiceps femoris anterior (100%) 11 ± 1 9 ± 1 10 ± 2 0.07 ± 0.01 0.07 ± 0.01 0.08 ± 0.01Biceps femoris posterior (92%) 11 ± 2 12 ± 2 15 ± 3 0.08 ± 0.01 0.10 ± 0.01 0.11 ± 0.02Semitendinosus (83%) 12 ± 2 14 ± 2 18 ± 5 0.08 ± 0.01 0.11 ± 0.02 0.14 ± 0.03Semimembranosus, red (72%) 15 ± 2 19 ± 3 28 ± 9 0.11 ± 0.02 0.15 ± 0.02 0.21 ± 0.06Semimembranosus, white (100%) 13 ± 2 11 ± 1 12 ± 2 0.09 ± 0.01 0.09 ± 0.01 0.09 ± 0.01
Thigh adductorsAdductor longus (5%) 115 ± 7 142 ± 12 148 ± 12 0.84 ± 0.06 1.12 ± 0.10 1.19 ± 0.12Adductor magnus & brevis (89%) 15 ± 3 16 ± 3 23 ± 7 0.11 ± 0.02 0.13 ± 0.02 0.17 ± 0.05Gracilis (77%) 16 ± 3 17 ± 2 20 ± 4 0.11 ± 0.02 0.13 ± 0.01 0.15 ± 0.03Pectineus (69%) 17 ± 2 23 ± 4 28 ± 7 0.12 ± 0.01 0.19 ± 0.03 0.21 ± 0.04
Data are mean ± SEM. Values in parentheses indicate fiber type as % type IIb + d/x according to Delp and Duan [8]. Control; n = 10, BRLD; n = 14, BRHD; n = 6.
BF
(ml/m
in/1
00g)
0100
110
120
130
140
150
160
170
180*
VC (m
l/min
/100
g/m
mH
g)
0.00
0.25
0.50
0.75
1.00
1.25
1.50
Control BRLD BRHD
*
Fig. 3. Total hindlimb BF and VC for control, BRLD and BRHD rats duringsubmaximal locomotory exercise. ⁄P < 0.05 vs. control.
S.K. Ferguson et al. / Nitric Oxide 39 (2014) 51–58 55
of BRHD as regards elevated skeletal muscle(s) BF and VC andreduced MAP during treadmill running. Also, as demonstrated inFig. 4, PO2mv kinetics were slowed significantly and PO2mvdecreased less during contractions of the spinotrapezius muscle,effectively raising the microvascular O2 driving pressure especiallyacross the transition period when mitochondrial O2 uptake wouldbe rising most rapidly [10]. These effects can be explained by thegreater O2 delivery combined with a reduced mitochondrial O2 uti-lization at a given workload as demonstrated in intact humans[25,5,24,45] as well as in isolated mitochondria [26]. With respectto the BRLD and based upon the dose–response relationshipreported by [45], where a graded fall in MAP was observed from4.2 to 8.4 mmol NO3
� (supplemented via BR with no additionaldecrease at 16.8 mmol), we were surprised that, in rats, MAP fellto the same extent (i.e., �10 mmHg) with both doses. Paramountto setting the NO3
� supplement doses herein was the considerationof the faster metabolic rate found in the resting rat (�27 ml/kg/min, [37]) when compared to humans (3.5 ml/kg/min, i.e. �7–8-fold higher per unit mass [15]). Taking this into account, the dosesemployed (i.e., BRLD, 0.3; BRHD, 1 mmol/kg/day) correspondbroadly to 3.2 and 7.4 mmol/day, respectively in humans. Thus,with respect to species differences, the NO3
� derived hypotensiveresponse becomes saturated at relatively lower doses in rats thanin their human counterparts. This effect is very different from theskeletal muscle vascular response and that of PO2mv which aremanifested only at the higher dose.

Table 2Effects of low dose and high dose BR supplementation on exercising hindlimb muscle BF (ml/min/100 g) and VC (ml/min/100 g/mmHg).
BF VC
Control BRLD BRHD Control BRLD BRHD
Ankle extensorsSoleus (9%) 297 ± 46 251 ± 19 328 ± 39 2.15 ± 0.33 2.04 ± 0.20 2.60 ± 0.26Plantaris (80%) 208 ± 17 194 ± 18 249 ± 10� 1.51 ± 0.11 1.56 ± 0.17 2.00 ± 0.06*,�
Gastrocnemius, red (14%) 444 ± 48 391 ± 40 507 ± 42 3.21 ± 0.32 3.13 ± 0.28 4.07 ± 0.31*,�
Gastrocnemius, white (100%) 44 ± 7 42 ± 8 71 ± 14*,� 0.31 ± 0.05 0.32 ± 0.05 0.56 ± 0.10*,�
Gastrocnemius, mixed (91%) 153 ± 13 135 ± 12 214 ± 19*,� 1.11 ± 0.08 1.08 ± 0.10 1.71 ± 0.11*,�
Tibialis posterior (73%) 121 ± 18 111 ± 11 137 ± 22 0.88 ± 0.13 0.89 ± 0.09 1.10 ± 0.18Flexor digitorum longus (68%) 103 ± 15 113 ± 19 106 ± 19 0.74 ± 0.10 0.92 ± 0.17 0.84 ± 0.15Flexor halicus longus (71%) 74 ± 11 69 ± 11 88 ± 11 0.53 ± 0.07 0.55 ± 0.08 0.70 ± 0.07
Ankle flexorsTibialis anterior, red (63%) 347 ± 38 303 ± 22 388 ± 35� 2.50 ± 0.26 2.38 ± 0.16 3.08 ± 0.19�
Tibialis anterior, white (80%) 120 ± 15 109 ± 11 170 ± 24*,� 0.86 ± 0.10 0.86 ± 0.08 1.34 ± 0.16*,�
Extensor digitorum longus (76%) 57 ± 8 60 ± 6 83 ± 13*,� 0.46 ± 0.05 0.47 ± 0.04 0.66 ± 0.09*,�
Peroneals (67%) 129 ± 13 123 ± 10 172 ± 8*,� 0.93 ± 0.09 0.98 ± 0.08 1.38 ± 0.05*,�
Knee extensorsVastus intermedius (4%) 371 ± 41 320 ± 28 358 ± 54 2.68 ± 0.29 2.54 ± 0.23 2.88 ± 0.41Vastus medialis (82%) 122 ± 18 111 ± 13 185 ± 36 0.88 ± 0.12 0.87 ± 0.10 1.48 ± 0.28*,�
Vastus lateralis, red (35%) 393 ± 47 327 ± 29 486 ± 48� 2.84 ± 0.32 2.60 ± 0.23 3.91 ± 0.39*,�
Vastus lateralis, white (100%) 32 ± 5 33 ± 5 51 ± 10*,� 0.23 ± 0.03 0.26 ± 0.04 0.40 ± 0.07*,�
Vastus lateralis, mixed (89%) 169 ± 23 151 ± 14 243 ± 17*,� 1.23 ± 0.16 1.20 ± 0.11 1.95 ± 0.13*,�
Rectus femoris, red (66%) 233 ± 35 245 ± 15 33 ± 37*,� 1.69 ± 0.24 1.95 ± 0.13 2.64 ± 0.30*,�
Rectus femoris, white (100%) 103 ± 14 94 ± 8 197 ± 38*,� 0.74 ± 0.09 0.75 ± 0.06 1.55 ± 0.27*,�
Knee flexorsBiceps femoris anterior (100%) 49 ± 9 50 ± 7 77 ± 16*,� 0.36 ± 0.06 0.40 ± 0.05 0.63 ± 0.13*,�
Biceps femoris posterior (92%) 79 ± 9 81 ± 9 135 ± 13 0.57 ± 0.07 0.65 ± 0.07 1.09 ± 0.10*,�
Semitendinosus (83%) 57 ± 7 51 ± 5 80 ± 13*,� 0.41 ± 0.05 0.40 ± 0.04 0.63 ± 0.11*,�
Semimembranosus, red (72%) 120 ± 16 116 ± 10 172 ± 17*,� 0.87 ± 0.11 0.93 ± 0.10 1.38 ± 0.13*,�
Semimembranosus, white (100%) 34 ± 6 32 ± 4 67 ± 14*,� 0.25 ± 0.04 0.25 ± 0.03 0.54 ± 0.11*,�
Thigh adductorsAdductor longus (5%) 321 ± 42 268 ± 20 333 ± 51 2.32 ± 0.29 2.17 ± 0.20 2.66 ± 0.40Adductor magnus & brevis (89%) 82 ± 9 71 ± 7 116 ± 19*,� 0.59 ± 0.06 0.60 ± 0.06 0.93 ± 0.14*,�
Gracilis (77%) 42 ± 5 41 ± 6 60 ± 11 0.30 ± 0.03 0.33 ± 0.06 0.48 ± 0.08*
Pectineus (69%) 49 ± 7 59 ± 8 84 ± 17* 0.35 ± 0.05 0.46 ± 0.06 0.68 ± 0.14*,�
Data are mean ± SEM. Values in parentheses indicate fiber types as % type IIb + d/x according to Delp and Duan [8]. Control; n = 10, BRLD; n = 14 BRHD; n = 6.* P < 0.05 vs. control.� P < 0.05 vs. BRLD.
Table 3Effects of low dose and high dose BR supplementation on kidney and splanchnic region organ BF (ml/min/100 g) and VC (ml/min/100 g/mmHg) at rest and during exercise.
Rest Exercise
Control BRLD BRHD Control BRLD BRHD
BFKidney 414 ± 29 447 ± 32 521 ± 32* 421 ± 47 372 ± 35 436 ± 52�
Stomach 82 ± 8 94 ± 13 71 ± 16 68 ± 15 51 ± 6� 49 ± 9Adrenals 557 ± 91 601 ± 57 667 ± 67 349 ± 79 321 ± 49 594 ± 188Spleen 345 ± 54 332 ± 37 501 ± 134 63 ± 16� 81 ± 14� 99 ± 33�
Pancreas 117 ± 11 112 ± 14 86 ± 15 115 ± 15 103 ± 10 116 ± 28Sm. Intestine 304 ± 17 361 ± 38 269 ± 38 247 ± 30 238 ± 21� 255 ± 53Lg. Intestine 131 ± 13 153 ± 18 139 ± 18 135 ± 15 126 ± 13 142 ± 21Liver** 37 ± 13 32 ± 6 40 ± 8 17 ± 4 18 ± 2 41 ± 11
VCKidney 3.04 ± 0.27 3.65 ± 0.32 4.15 ± 0.27* 3.04 ± 0.31 3.13 ± 0.43 3.51 ± 0.44Stomach 0.59 ± 0.06 0.75 ± 0.10 0.54 ± 0.09 0.50 ± 0.11 0.41 ± 0.05� 0.39 ± 0.07Adrenals 4.06 ± 0.72 4.71 ± 0.37 5.42 ± 0.80 2.86 ± 0.49 2.51 ± 0.37� 4.79 ± 1.57Spleen 2.50 ± 0.40 2.63 ± 0.27 3.71 ± 0.85 0.45 ± 0.11� 0.64 ± 0.28� 0.79 ± 0.28Pancreas 0.85 ± 0.08 0.88 ± 0.11 0.65 ± 0.09 0.83 ± 0.11 0.83 ± 0.08 0.92 ± 0.23�
Sm. Intestine 2.18 ± 0.14 2.87 ± 0.28 2.06 ± 0.25 1.72 ± 0.20 1.89 ± 0.17� 2.00 ± 0.43Lg. Intestine 0.95 ± 0.10 1.21 ± 0.14 1.09 ± 0.11 0.98 ± 0.10 1.00 ± 0.10 1.13 ± 0.16Liver** 0.26 ± 0.12 0.21 ± 0.04 0.26 ± 0.05 0.12 ± 0.03 0.15 ± 0.02 0.32 ± 0.08
Data are mean ± SEM.* P < 0.05 vs. Control.** Indicates arterial, not portal, BF and VC.� P < 0.05 vs. rest.
56 S.K. Ferguson et al. / Nitric Oxide 39 (2014) 51–58

Time (s)0 30 60 90 120 150 180
PO2mv
(mm
Hg)
10
15
20
25
30
35
40 ControlBRLDBRHD
1-Hz twitch contractions
Fig. 4. Raw representative PO2mv profiles for control, BRLD and BRHD rats during180 s of 1-Hz twitch contractions.
Table 4Microvascular partial pressure of O2 (PO2mv) kinetics parameters at rest and duringcontractions for control, BRLD and BRHD rats.
Control BRLD BRHD
PO2mv (BL) (mmHg) 31.1 ± 2.0 30.1 ± 1.9 26.4 ± 2.8D1 PO2mv (mmHg) 16.7 ± 1.5 12.9 ± 0.7* 11.8 ± 0.9*
D2 PO2mv (mmHg) 3.9 ± 0.8 3.6 ± .3 3.8 ± 0.4Dtotal PO2mv (mmHg) 13.6 ± 1.6 11.1 ± 1 9.6 ± 1.5PO2mv(steady-state)(mmHg) 18 ± 1.7 19 ± 1.4 17.7 ± 2.0TD1 (s) 6.7 ± 1.5 8.6 ± 0.9 12.9 ± 2.8*
TD2 (s) 49.8 ± 11.2 54 ± 15.6 27 ± 5.5s1 (s) 9.9 ± 1.2 8.6 ± 0.9 10.4 ± 2.2s2 (s) 89.4 ± 18.7 93.9 ± 21.2 86.1 ± 10.9MRT1 (s) 16.6 ± 2.1 20.9 ± 1.9 23.3 ± 4.7*
D1 PO2mv/s1 (mmHg/s) 1.9 ± 0.3 1.3 ± 0.2 1.4 ± 0.3
Values are mean ± SEM. Where second component model averages are shown thevalue reflects only those rats where a two-component model was applied todescribe the PO2mv data (control: n = 9, BRLD: n = 6, BRHD: n = 3). PmvO2(BL), pre-contraction PO2mv; D1 PO2mv, amplitude of the first component; D2 PO2mv,amplitude of the second component; Dtotal PO2mv, overall amplitude regardless ofone- or two-component model fit; PO2mv(steady-state), PO2mv during contractingsteady-state; TD1, time delay for the first component; TD2, time delay for the secondcomponent; s1, time constant for the first component; s2, time constant for thesecond component; MRT1, mean response time describing the overall kineticsresponse; D1 PO2mv/s1, parameter describing the relative rate of PO2mv fall.* P < 0.05 vs. control.
S.K. Ferguson et al. / Nitric Oxide 39 (2014) 51–58 57
4.2. Mechanisms for reduction of mean arterial pressure
The increased VC observed in the skeletal muscle(s) of BRHDrats explain, at least in part, the reduction in MAP found at thehigher dose. However, in marked contrast, skeletal muscle VCand BF were unchanged for BRLD (which was not unexpected giventhat circulating NO3
�/NO2� levels were not different from control
values) and thus, the reduced MAP for these animals must have adifferent explanation. There is evidence that NO bioavailability(from both endothelial and neuronal nitric oxide synthase, eNOSand nNOS) in higher cardiovascular neural control centers, forexample the RVLM, impacts sympathetic outflow and controls, orat least influences, MAP regulation and can lead to a reductionand/or redistribution of cardiac output (e.g. [36,13]). Althoughnot measured in this investigation, it is possible that BRLD mayhave altered NO bioavailability in the RVLM. Indeed, elevated NObioavailability via overexpression of eNOS in the RVLM inducessignificant hypotension by elevating gamma-aminobutyric acid(GABA) production [21]. Thus, one putative mechanism for thehypotensive response invoked by BRLD relates to increased NObioavailability in the RVLM from non-nNOS/eNOS dependent
sources which may ultimately reduce sympathetic outflow. Agreater NO3
� dose may intensify this effect which could be respon-sible, at least in part, for the elevated renal BF and VC seen in BRHDrats herein. Furthermore, the presence of antioxidants in the BRsupplement may contribute to this effect [12] and thus play a syn-ergistic role with NO3
�. This novel aspect of BR and NO3� mediated
cardiovascular control carries clinical implications for those suffer-ing from renal vascular diseases [33,6] and warrants futureinvestigation.
Alternative mechanisms of BR induced reductions in MAPinclude impacts on other vascular beds, apart from the skeletalmuscle vasculature. For example, BRHD rats demonstrated 26%greater renal BF at rest (Table 3) suggesting that the renal circula-tion may be prone to NO2
� induced vascular effects. Given that rest-ing renal BF was not significantly elevated in BRLD rats, thisparticular effect may require greater local concentrations of NO2
�
to elicit significant vascular effects within the renal circulation.While not statistically significant, a mild impact of the renal circu-lation on the resting MAP of BRLD rats is certainly plausible andshould be investigated further. What’s more, the lower PO2 envi-ronment of the venous circulation may enhance the reduction ofcirculating NO2
� to NO and other reactive nitrogen species, whichwould likely cause venodilation and a reduction in MAP. This effectwould likely be exacerbated during exercise due to the robustreductions in venous blood PO2 (to values <30 mmHg, [14])offering a partial explanation for the lower exercising MAP valuespresented in Fig. 2.
4.3. Experimental considerations
The rat is a widely used and valuable experimental model tostudy cardiovascular and muscle metabolic control particularlyduring exercise. Moreover, dietary, pharmaceutical and exerciseconditions can be well controlled and standardized within this spe-cies. However, determination of ‘‘equivalent’’ NO3
� doses is chal-lenging and basing such on resting metabolic rate differencesfound between rats and humans is only a first approximation.Importantly, in the BRHD group plasma [NO3
�] and [NO2�] were
raised to levels approximating those seen in humans followingconsumption of a dietary supplement high in NO3
� [32,20] provid-ing additional confidence in the doses used herein. What is partic-ularly exciting with respect to the present results is that BRLDrepresented a dose that evinced clear cardiovascular responses inthe absence of a significant increase in plasma NO3
� or NO2� and
the vascular and metabolic consequences of such. This observationunveils a novel, potentially clinically valuable, and heretoforeunappreciated consequence of BR-derived NO3
� supplementation.
5. Conclusions
This investigation was the first to examine the effects of a low(0.3 mmol/kg/day) and high (1 mmol/kg/day) dose of NO3
� supple-mentation on vascular responses at rest and during submaximallocomotory exercise in the rat. Despite the absence of elevationsof plasma [NO3
�] or [NO2�], BRLD evoked reductions in MAP at rest
and during exercise. These cardiovascular improvements werefurther amplified in BRHD rats which demonstrated augmentedskeletal muscle BF and VC, which likely resulted in the slowed PO2-
mv fall during the crucial rest-contraction transition presentedherein. These results carry tremendous clinical implications partic-ularly for those at risk for stroke, renal, and ischemic heart diseases[34,30,27,28,25,24,42,6]. Given the sensitivity of the RVLM to NObioavailability [36,13], it seems logical to postulate an interactionbetween NO3
�, NO2� and central cardiovascular control centers
located in the brain (i.e. RVLM). Understanding these interactions
58 S.K. Ferguson et al. / Nitric Oxide 39 (2014) 51–58
will further provide a mechanistic linkage between elevated NO3�
ingestion and the improved cardiovascular and metabolic functionseen in humans [5,4,24,20,44,35,46] and animals [9,10,16] andthus should be the focus of future investigations.
Acknowledgments
The authors would like to thank Ms. K. Sue Hageman, Ms. Gabri-elle E. Rico, Thomas Stabler, and Dr. Tadakatsu Inagaki for excellenttechnical assistance. These experiments were funded by a KansasState University SMILE award to T.I.M., and American Heart Asso-ciation Midwest Affiliate (10GRNT4350011) and NIH (HL-108328) awards to D.C.P.
References
[1] F.H. Andrade, M.B. Reid, D.G. Allen, H. Westerblad, Effect of nitric oxide onsingle skeletal muscle fibres from the mouse, J. Physiol. (Lond.) 509 (1998)577–586.
[2] R.B. Armstrong, D.A. Hayes, M.D. Delp, Blood flow distribution in rat musclesduring preexercise anticipatory response, J. Appl. Physiol. 67 (1989) 1855–1861.
[3] J.K. Bailey, C.A. Kindig, B.J. Behnke, T.I. Musch, G.W. Schmid Schoenbein, D.C.Poole, Spinotrapezius muscle microcirculatory function: effects of surgicalexteriorization, Am. J. Physiol. Heart Circ. Physiol. 279 (2000) H3131–H3137.
[4] S.J. Bailey, J. Fulford, A. Vanhatalo, P.G. Winyard, J.R. Blackwell, F.J. DiMenna,D.P. Wilkerson, N. Benjamin, A.M. Jones, Dietary nitrate supplementationenhances muscle contractile efficiency during knee-extensor exercise inhumans, J. Appl. Physiol. 109 (2010) 135–148.
[5] S.J. Bailey, P. Winyard, A. Vanhatalo, J.R. Blackwell, F.J. Dimenna, D.P.Wilkerson, J. Tarr, N. Benjamin, A.M. Jones, Dietary nitrate supplementationreduces the O2 cost of low-intensity exercise and enhances tolerance to high-intensity exercise in humans, J. Appl. Physiol. 107 (2009) 1144–1155.
[6] M. CarlstrÖm, A.E. Persson, E. Larsson, M. Hezel, P.G. Scheffer, T. Teerlink, E.Weitzberg, J.O. Lundberg, Dietary nitrate attenuates oxidative stress, preventscardiac and renal injuries, and reduces blood pressure in salt-inducedhypertension, Cardiovasc. Res. 89 (2011) 574–585.
[7] N.M. Cermak, M.J. Gibala, L.J. van Loon, Nitrate supplementation’simprovement of 10-km time-trial performance in trained cyclists, Int. J.Sport. Nutr. Exe. 22 (2012) 64–71.
[8] M.D. Delp, C. Duan, Composition and size of type I, IIA, IID/X, and IIB fibers andcitrate synthase activity of rat muscle, J. Appl. Physiol. 80 (1996) 261–270.
[9] S.K. Ferguson, D.M. Hirai, S.W. Copp, C.T. Holdsworth, J.D. Allen, A.M. Jones, T.I.Musch, D.C. Poole, Effects of nitrate supplementation via beetroot juice oncontracting rat skeletal muscle microvascular oxygen pressure dynamics,Respir. Physiol. Neurobiol. 187 (2013) 250–255.
[10] S.K. Ferguson, D.M. Hirai, S.W. Copp, C.T. Holdsworth, J.D. Allen, A.M. Jones, T.I.Musch, D.C. Poole, Impact of dietary nitrate supplementation via beetroot juiceon exercising muscle vascular control in rats, J. Physiol. (Lond.) 591 (2013)547–557.
[11] S.F. Flaim, S.H. Nellis, E.J. Toggart, H. Drexler, K. Kanda, E.D. Newman, Multiplesimultaneous determinations of hemodynamics and flow distribution inconscious rat, J. Pharmacol. Methods 11 (1984) 1–39.
[12] L. Gao, W. Wang, D. Liu, I.L. Zucker, Exercise training normalizes sympatheticoutflow by central antioxidant mechanisms in rabbits with pacing-inducedchronic heart failure, Circulation 115 (2007) 3095–3102.
[13] L. Gao, W. Wang, I.L. Zucker, Simvastatin inhibits central sympathetic outflowin heart failure by a nitric-oxide synthase mechanism, J. Pharmacol. Exp. Ther.326 (2008) 278–285.
[14] N.C. Gonzalez, L.P. Erwid, C.F. Painter 3rd, R.L. Clancy, P.D. Wagner, Effect ofhematocrit on systemic O2 transport in hypoxic and normoxic exercise in rats,J. Appl. Physiol. 77 (1994) 1341–1348.
[15] L.C. Henson, D.C. Poole, C.P. Donahoe, D. Heber, Effects of exercise training onresting energy expenditure during caloric restriction, Am. J. Clin. Nutr. 46(1987) 893–899.
[16] A. Hernández, T.A. Schiffer, N. Ivarsson, A.J. Cheng, J.D. Bruton, J.O. Lundberg, E.Weitzberg, H. Westerblad, Dietary nitrate increases tetanic [Ca2+] andcontractile force in mouse fast-twitch muscle, J. Physiol. (Lond.) 590 (2012)3575–3583.
[17] T. Hirai, M.D. Visneski, K.J. Kearns, R. Zelis, T.I. Musch, Effects of NO synthaseinhibition on the muscular blood flow response to treadmill exercise in rats, J.Appl. Physiol. 77 (1994) 1288–1293.
[18] M.J. Joyner, M.E. Tschakovsky, Nitric oxide and physiologic vasodilation inhuman limbs: where do we go from here?, Can J. Appl. Physiol. 28 (2003) 475–490.
[19] M.J. Joyner, B.W. Wilkins, Exercise hyperaemia: is anything obligatory but thehyperaemia?, J Physiol. (Lond.) 583 (2007) 855–860.
[20] A.A. Kenjale, K.L. Ham, T. Stabler, J.L. Robbins, J. Johnson, M. Vanbruggen, G.Privette, E. Yim, W.E. Kraus, J.D. Allen, Dietary nitrate supplementationenhances exercise performance in peripheral arterial disease, J. Appl. Physiol.110 (2011) 1582–1591.
[21] T. Kishi, Y. Hirooka, K. Sakai, H. Shigematsu, H. Shimokawa, A. Takeshita,Overexpression of eNOS in the RVLM causes hypotension and bradycardia viaGABA release, Hypertension 38 (2001) 896–901.
[22] K.E. Lansley, P.G. Winyard, S.J. Bailey, A. Vanhatalo, D.P. Wilkerson, J.R.Blackwell, M. Gilchrist, N. Benjamin, A.M. Jones, Acute dietary nitratesupplementation improves cycling time trial performance, Med. Sci. SportsExerc. 43 (2011) 1125–1131.
[23] K.E. Lansley, P.G. Winyard, J. Fulford, A. Vanhatalo, S.J. Bailey, J.R. Blackwell, F.J.Dimenna, M. Gilchrist, N. Benjamin, A.M. Jones, Dietary nitratesupplementation reduces the O2 cost of walking and running: a placebo-controlled study, J. Appl. Physiol. 110 (2011) 591–600.
[24] F.J. Larsen, E. Weitzberg, J.O. Lundberg, B. Ekblom, Dietary nitrate reducesmaximal oxygen consumption while maintaining work performance inmaximal exercise, Free Radic. Biol. Med. 48 (2010) 342–347.
[25] F.J. Larsen, E. Weitzberg, J.O. Lundberg, B. Ekblom, Effects of dietary nitrate onoxygen cost during exercise, Acta Physiol. 191 (2007) 59–66.
[26] F.J. Larsen, T.A. Schiffer, E. Weitzberg, J.O. Lundberg, Regulation ofmitochondrial function and energetics by reactive nitrogen oxides, FreeRadic. Biol. Med. 53 (2012) 1919–1928.
[27] M.R. Law, N.J. Wald, J.K. Morris, R.E. Jordan, Value of low dose combinationtreatment with blood pressure lowering drugs: analysis of 354 randomizedtrials, BMJ 326 (2003) 1427.
[28] C.M. Lawes, A. Rodgers, D.A. Bennett, V. Parag, I. Suh, H. Ueshima, S.MacMahon, Blood pressure and cardiovascular disease in the Asia Pacificregion, J. Hypertens. 21 (2003) 707–716.
[29] B.T. Leek, S.R. Mudaliar, R. Henry, O. Mathieu Costello, R.S. Richardson, Effect ofacute exercise on citrate synthase activity in untrained and trained humanskeletal muscle, Am. J. Physiol. Regul. Integr. Comp. Physiol. 280 (2001) R441–R447.
[30] S. Lewington, R. Clarke, N. Qizilbash, R. Peto, R. Collins, Age-specific relevanceof usual blood pressure to vascular mortality: a meta-analysis of individualdata for one million adults in 61 prospective studies, Lancet (London, England)360 (2002) 1903–1913.
[31] L.W. Lo, S.A. Vinogradov, C.J. Koch, D.F. Wilson, A new, water soluble, phosphorfor oxygen measurements in vivo, Adv. Exp. Med. Biol. 428 (1997) 651–656.
[32] J.O. Lundberg, M. Govoni, Inorganic nitrate is a possible source for systemicgeneration of nitric oxide, Free. Radic. Biol. Med. 37 (2004) 395–400.
[33] J.O. Lundberg, E. Weitzberg, M.T. Gladwin, The nitrate–nitrite–nitric oxidepathway in physiology and therapeutics, Nat. Rev. Drug Discov. 7 (2008) 156–167.
[34] S. MacMahon, R. Peto, J. Cutler, R. Collins, P. Sorlie, J. Neaton, R. Abbott, J.Godwin, A. Dyer, J. Stamler, Blood pressure, stroke, and coronary heart disease.Part 1, prolonged differences in blood pressure: prospective observationalstudies corrected for the regression dilution bias, Lancet (London, England)335 (1990) 765–774.
[35] E. Masschelein, R. Van Thienen, X. Wang, A. Van Schepdael, M. Thomis, P.Hespel, Dietary nitrate improves muscle but not cerebral oxygenation statusduring exercise in hypoxia, J. Appl. Physiol. 113 (2012) 736–745.
[36] D.N. Mayorov, Selective sensitization by nitric oxide of sympathetic baroreflexin rostral ventrolateral medulla of conscious rabbits, Hypertension 45 (2005)901–906.
[37] T.I. Musch, A. Bruno, G.E. Bradford, A. Vayonis, R.L. Moore, Measurements ofmetabolic rate in rats: a comparison of techniques, J. Appl. Physiol. 65 (1988)964–970.
[38] T.I. Musch, J.A. Terrell, Skeletal muscle blood flow abnormalities in rats with achronic myocardial infarction: rest and exercise, Am. J. Physiol. 262 (1992)H411–H419.
[39] S.A. Omar, E. Artime, A.J. Webb, A comparison of organic and inorganicnitrates/nitrites, Nitric Oxide 26 (2012) 229–240.
[40] D.C. Poole, B.J. Behnke, P. McDonough, R.M. McAllister, D.F. Wilson,Measurement of muscle microvascular oxygen pressures:compartmentalization of phosphorescent probe, Microcirculation 11 (2004)317–326.
[41] W.L. Rumsey, J.M. Vanderkooi, D.F. Wilson, Imaging of phosphorescence: anovel method for measuring oxygen distribution in perfused tissue, Science241 (1988) 1649–1651.
[42] K. Tsuchiya, S. Tomita, K. Ishizawa, S. Abe, Y. Ikeda, Y. Kihira, T. Tamaki, Dietarynitrite ameliorates renal injury in L-NAME-induced hypertensive rats, NitricOxide 22 (2010) 98–103.
[43] A. Vanhatalo, S.J. Bailey, J.R. Blackwell, F.J. DiMenna, T. Pavey, D.P. Wilkerson,N. Benjamin, P.G. Winyard, A.M. Jones, Acute and chronic effects of dietarynitrate supplementation on blood pressure and the physiological responses tomoderate-intensity and incremental exercise, Am. J. Physiol. Regul. Integr.Comp. Physiol. 299 (2010) R1121–R1131.
[44] A. Vanhatalo, J. Fulford, S.J. Bailey, J.R. Blackwell, P.J. Winyard, A.M. Jones,Dietary nitrate reduces muscle metabolic perturbation and improves exercisetolerance in hypoxia, J. Physiol. (Lond.) 589 (2011) 5517–5528.
[45] L.J. Wylie, J. Kelly, S.J. Bailey, J.R. Blackwell, P.F. Skiba, P.G. Winyard, A.E.Jeukendrup, A. Vanhatalo, A.M. Jones, Beetroot juice and exercise:pharmacodynamic and dose–response relationships, J. Appl. Physiol. 115(2013) 325–336.
[46] L.J. Wylie, M. Mohr, P. Krustrup, S.R. Jackman, G. Ermidis, J. Kelly, M.I. Black, S.J.Bailey, A. Vanhatalo, A.M. Jones, Dietary nitrate supplementation improvesteam sport-specific intense intermittent exercise performance, Eur. J. Appl.Physiol. 113 (2013) 1673–1684.
Copyright © 2022 FDOKUMEN