Time-dependent blood flow and oxygenation in human skeletal muscles measured with noninvasive...
12
Time-dependent blood flow and oxygenation in human skeletal muscles measured with noninvasive near-infrared diffuse optical spectroscopies Guoqiang Yu Turgut Durduran University of Pennsylvania Department of Physics and Astronomy Philadelphia, Pennsylvania 19104 Gwen Lech University of Pennsylvania Department of Biochemistry and Biophysics Philadelphia, Pennsylvania 19104 Chao Zhou University of Pennsylvania Department of Physics and Astronomy Philadelphia, Pennsylvania 19104 Britton Chance University of Pennsylvania Department of Biochemistry and Biophysics Philadelphia, Pennsylvania 19104 Emile R. Mohler III University of Pennsylvania School of Medicine Department of Medicine, Cardiovascular Division Philadelphia, Pennsylvania 19104 Arjun G. Yodh University of Pennsylvania Department of Physics and Astronomy Philadelphia, Pennsylvania 19104 Abstract. We have employed near-infrared optical methods to mea- sure noninvasively the dynamics of muscle blood flow and oxygen saturation ( S t O 2 ) during cuff occlusion and plantar flexion exercise. Relative muscle oxygen consumption ( rVO 2 ) was also computed from these data. Diffuse correlation spectroscopy provides information about blood flow, and diffuse reflectance spectroscopy provides infor- mation about blood oxygenation. Ten healthy subjects and one pa- tient with peripheral arterial disease (PAD) were studied during 3-min arterial cuff occlusion of arm and leg, and during 1-min plantar flex- ion exercise. Signals from different layers (cutaneous tissues and muscles) during cuff occlusion were differentiated, revealing strong hemodynamic responses from muscle layers. During exercise in healthy legs, the observed ;4.7 fold increase in relative blood flow (rBF) was significantly lower than the corresponding increase in rVO 2 ( ;7 fold). The magnitudes of rBF and rVO 2 during exercise in the PAD patient were ;1/2 of the healthy controls, and the S t O 2 recovery time was twice that of the controls. The hybrid instrument improves upon current technologies for measuring muscle responses by simul- taneously measuring rBF and S t O 2 . The instrument thus provides a method for evaluation of microcirculation and muscle metabolism in patients with vascular diseases. © 2005 Society of Photo-Optical Instrumentation Engineers. [DOI: 10.1117/1.1884603] Keywords: dynamic light scattering; photon migration; light diffusion; diffuse corre- lation spectroscopy; diffuse reflectance spectroscopy; near-infrared spectroscopy; arterial cuff occlusion; plantar flexion exercise; peripheral arterial disease. Paper JBO 04098R received Jun. 11, 2004; revised manuscript received Sep. 30, 2004; accepted for publication Nov. 2, 2004; published onlineApr. 11, 2005. 1 Introduction Noninvasive characterization of oxygen consumption and me- tabolism in skeletal muscles has important applications in ex- ercise medicine 1,2 and for understanding of vascular condi- tions such as peripheral arterial disease ~PAD!. 3,4 Improved measurements of these quantities may lead to improved screening and treatment assessment, as well as to improved fundamental understanding of muscle function. Over the years, a variety of noninvasive techniques have been developed to study tissue hemodynamics of muscle. Conventional venous occlusion plethysmography has been employed for more than 50 years in muscle perfusion investigations. 5,6 This method, however, does not provide re- gional information and can be used only in the static state or during brief exercise, since venous occlusion interrupts blood flow. Ultrasound Doppler is a common clinical tool used to measure blood flow in large vessels. 7,8 However it is not sen- sitive to flow in smaller vessels, and does not readily permit continuous measurements during exercise. Laser Doppler can noninvasively monitor flow changes, but most systems mea- sure the tissue surface only ~i.e., penetration depth ,500 m m) ; 9,10 very recently, Binzoni et al. have extended its application to relatively deeper tissues using larger source- detector separations ~1.5 cm!. 11 Magnetic resonance spectros- copy or imaging ~MRS/MRI! has high temporal and spatial resolution, 12 however, its clinical use is limited due to high cost and poor mobility. Positron emission tomography ~PET! has similar clinical limitations, and also has poor spatiotem- poral resolution compared to MRS/MRI. 13 Near-infrared spectroscopy ~NIRS! has the potential to fill part of this void. Unlike ultrasound Doppler, it is sensitive to smaller vessels such as arterioles, capillaries, and venules. 14 In principle it can provide dynamic information about oxy- and deoxy-hemoglobin concentrations, total hemoglobin con- centration ~THC!, and tissue blood oxygen saturation ( S t O 2 ) in deep muscle tissues. 3,15 It provides high temporal resolu- tion, relatively low spatial resolution, and is inexpensive and portable. Previously blood flow and oxygen consumption in muscle tissue have been estimated from changes of THC or Address all correspondence to Guoqiang Yu, University of Pennsylvania, Dept. of Physics and Astronomy, Philadelphia, PA 19104. Tel: (215)573-3463; Fax: (215)573-6391; E-mail: [email protected] 1083-3668/2005/$22.00 © 2005 SPIE Journal of Biomedical Optics 10(2), 024027 (March/April 2005) 024027-1 Journal of Biomedical Optics March/April 2005 d Vol. 10(2)
-
Upload
independent -
Category
Documents
-
view
2 -
download
0
Transcript of Time-dependent blood flow and oxygenation in human skeletal muscles measured with noninvasive...
Journal of Biomedical Optics 10(2), 024027 (March/April 2005)
Time-dependent blood flow and oxygenation in humanskeletal muscles measured with noninvasivenear-infrared diffuse optical spectroscopies
Guoqiang YuTurgut DurduranUniversity of PennsylvaniaDepartment of Physics and AstronomyPhiladelphia, Pennsylvania 19104
Gwen LechUniversity of PennsylvaniaDepartment of Biochemistry and BiophysicsPhiladelphia, Pennsylvania 19104
Chao ZhouUniversity of PennsylvaniaDepartment of Physics and AstronomyPhiladelphia, Pennsylvania 19104
Britton ChanceUniversity of PennsylvaniaDepartment of Biochemistry and BiophysicsPhiladelphia, Pennsylvania 19104
Emile R. Mohler IIIUniversity of PennsylvaniaSchool of MedicineDepartment of Medicine, Cardiovascular DivisionPhiladelphia, Pennsylvania 19104
Arjun G. YodhUniversity of PennsylvaniaDepartment of Physics and AstronomyPhiladelphia, Pennsylvania 19104
Abstract. We have employed near-infrared optical methods to mea-sure noninvasively the dynamics of muscle blood flow and oxygensaturation (StO2) during cuff occlusion and plantar flexion exercise.Relative muscle oxygen consumption (rVO2) was also computed fromthese data. Diffuse correlation spectroscopy provides informationabout blood flow, and diffuse reflectance spectroscopy provides infor-mation about blood oxygenation. Ten healthy subjects and one pa-tient with peripheral arterial disease (PAD) were studied during 3-minarterial cuff occlusion of arm and leg, and during 1-min plantar flex-ion exercise. Signals from different layers (cutaneous tissues andmuscles) during cuff occlusion were differentiated, revealing stronghemodynamic responses from muscle layers. During exercise inhealthy legs, the observed ;4.7 fold increase in relative blood flow(rBF) was significantly lower than the corresponding increase in rVO2(;7 fold). The magnitudes of rBF and rVO2 during exercise in thePAD patient were ;1/2 of the healthy controls, and the StO2 recoverytime was twice that of the controls. The hybrid instrument improvesupon current technologies for measuring muscle responses by simul-taneously measuring rBF and StO2 . The instrument thus provides amethod for evaluation of microcirculation and muscle metabolism inpatients with vascular diseases. © 2005 Society of Photo-Optical InstrumentationEngineers. [DOI: 10.1117/1.1884603]
Keywords: dynamic light scattering; photon migration; light diffusion; diffuse corre-lation spectroscopy; diffuse reflectance spectroscopy; near-infrared spectroscopy;arterial cuff occlusion; plantar flexion exercise; peripheral arterial disease.
Paper JBO 04098R received Jun. 11, 2004; revised manuscript received Sep. 30,2004; accepted for publication Nov. 2, 2004; published online Apr. 11, 2005.
--
de
e
n
r
t
ea-
tsce-
s-l
h
m-
toes.-
on-
-ndinor
1 IntroductionNoninvasive characterization of oxygen consumption and metabolism in skeletal muscles has important applications in exercise medicine1,2 and for understanding of vascular condi-tions such as peripheral arterial disease~PAD!.3,4 Improvedmeasurements of these quantities may lead to improvescreening and treatment assessment, as well as to improvfundamental understanding of muscle function.
Over the years, a variety of noninvasive techniques havbeen developed to study tissue hemodynamics of muscleConventional venous occlusion plethysmography has beeemployed for more than 50 years in muscle perfusioninvestigations.5,6 This method, however, does not provide re-gional information and can be used only in the static state oduring brief exercise, since venous occlusion interrupts bloodflow. Ultrasound Doppler is a common clinical tool used tomeasure blood flow in large vessels.7,8 However it is not sen-sitive to flow in smaller vessels, and does not readily permicontinuous measurements during exercise. Laser Doppler ca
Address all correspondence to Guoqiang Yu, University of Pennsylvania, Dept.of Physics and Astronomy, Philadelphia, PA 19104. Tel: (215)573-3463; Fax:(215)573-6391; E-mail: [email protected]
024027Journal of Biomedical Optics
d
.
n
noninvasively monitor flow changes, but most systems msure the tissue surface only~i.e., penetration depth,500mm);9,10 very recently, Binzoni et al. have extended iapplication to relatively deeper tissues using larger sourdetector separations~1.5 cm!.11 Magnetic resonance spectrocopy or imaging~MRS/MRI! has high temporal and spatiaresolution,12 however, its clinical use is limited due to higcost and poor mobility. Positron emission tomography~PET!has similar clinical limitations, and also has poor spatioteporal resolution compared to MRS/MRI.13
Near-infrared spectroscopy~NIRS! has the potential to fillpart of this void. Unlike ultrasound Doppler, it is sensitivesmaller vessels such as arterioles, capillaries, and venul14
In principle it can provide dynamic information about oxyand deoxy-hemoglobin concentrations, total hemoglobin ccentration~THC!, and tissue blood oxygen saturation(StO2)in deep muscle tissues.3,15 It provides high temporal resolution, relatively low spatial resolution, and is inexpensive aportable. Previously blood flow and oxygen consumptionmuscle tissue have been estimated from changes of THC
1083-3668/2005/$22.00 © 2005 SPIE
-1 March/April 2005 d Vol. 10(2)
-
ny
-
-
ds
tb
y-
-
ee-e
, a-the
erd tore-ea-
n ofse itper-
eup-p-ti-.PADun-iseun-ced
ewcethy
5,
ac-
la-
-
che-
ectorcmlytheem-si-elss.. Ator
Yu et al.
deoxy-hemoglobin concentration by applying venous or arterial occlusion to a limb;16–18 unfortunately, these applicationsof NIRS to flow studies face the same limitations as venousocclusion plethysmography.
Near-infrared diffuse correlation spectroscopy~DCS! is anemerging technique for continuous noninvasive measuremeof relative blood flow in deep tissues. It has been successfullapplied in studies of brain hemodynamics,19,20 photodynamictherapy ~PDT! dosimetry,21 and for measurement of tissueburn depth.22 Measurements of relative blood flow by DCShave also been validated against color power Doppler ultrasound in animal tumor studies21,23and laser Doppler in animalbrain studies.19,20 DCS enables measurements of relativeblood flow ~rBF! with high temporal~;100 ms! and limitedspatial~;mm! resolution in tissue. To date most applicationsof DCS have been in small animal studies wherein sourcedetector separations were comparatively small(,1 cm).19–23
Very recently, DCS measurements have been performethrough an adult human skull with source-detector separationup to 3 cm.24 Nevertheless, the major challenge for humanapplications remains; improvement of DCS signal-to-noise athe large source-detector separations is necessary to prothrough thick near-surface tissue layers above muscle, e.gskin and adipose tissue.
The lack of portable, noninvasive technologies for continu-ous monitoring of both blood flow and oxygenation in thedeep microcirculation~capillary bed! has led us to develop ahybrid instrument combining near-infrared DCS and diffusereflectance spectroscopy~DRS!.19,20DCS monitors blood flowby effectively measuring the optical phase shifts caused bmoving blood cells, while DRS measures tissue optical properties~absorption and scattering!. The purpose of this paper isto report concurrent measurements of blood flow and oxygenation in cuffed and exercising human muscle. To our knowl-edge we demonstrate the first clinical use of DCS for moni-toring flow dynamics in muscle, and the first clinical use ofall-optical methods for simultaneously measuring multiple he-modynamic parameters in muscle. These hemodynamic parameters include relative blood flow~rBF!, tissue blood oxy-gen saturation(StO2), and total hemoglobin concentration~THC!, permitting estimation of changes in oxygen metabo-lism.
2 Materials and Methods2.1 ProtocolsThe experimental protocol used in this study has three partscuff occlusion of the arm flexor, cuff occlusion of the thigh,and plantar flexion~PF! exercise. For cuff occlusion of armand leg, the subjects were asked to lie supine. The opticaprobe was placed over the wrist flexor or calf flexor~medialgastronemius! and secured with an elastic bandage. After 3min of resting baseline measurements, the blood pressure cuwas manually inflated to 180 mmHg for arm and 220 mmHgfor leg, held for 3 min, and then rapidly released. The recov-ery measurement was made for approximately 3 min. For thplantar flexion exercise, the subjects remained in a stablstanding position during the test protocol. Both legs were positioned at shoulder width and the probe was placed over thcalf flexor. After a 3-min baseline, the subjects performed 30plantar flexion exercises~toe up-downs! within one minute,
024027Journal of Biomedical Optics
t
e.,
-
:
l
ff
followed by a 3-min recovery measurement. In additionskinfold caliper ~Beta Technology Inc., Cambridge, Maryland! was used to mechanically measure the thickness ofupper layers~skin and adipose! above muscle.
Cuff occlusion was used to investigate the different layresponses in order to estimate light penetration depth anvalidate results in the ischemic states. The hemodynamicsponse to extended cuff occlusion has been thoroughly msured and characterized and is a good model for validatioour results. Plantar flexion exercise was selected becauselectively works the gastrocnemius muscle and can beformed by patients with peripheral arterial disease~PAD!.This muscle is used in both stair climbing and walking. Wchose to study a PAD patient because insufficient blood sply to this muscle in PAD patients commonly results in symtomatic calf pain and walking disability. PAD affects an esmated 25% of the elderly population in North America25
Thus improvements in technology to screen and assesstreatment can have a substantial impact. All healthy volteers rated the intensity of the 30-min plantar flexion exercas an easy-to-somewhat-difficult exercise. No healthy volteer experienced leg discomfort. The PAD subject experienslight cramping pain after;20 plantar flexion exercises.
The studies were approved by the Institutional ReviBoard~IRB! at the University of Pennsylvania and took plaat the Hospital of the University of Pennsylvania. Ten healsubjects~eight males and two females! with ages between24–34 years(28.463.0), and one male PAD patient, age 6were measured. The ankle brachial index~ABI ! of the healthysubjects was1.0160.02.The ABI of the PAD patient was 0.4in the leg studied; this index is considered severe PADcording to the Rutherford-Becker Classification.26
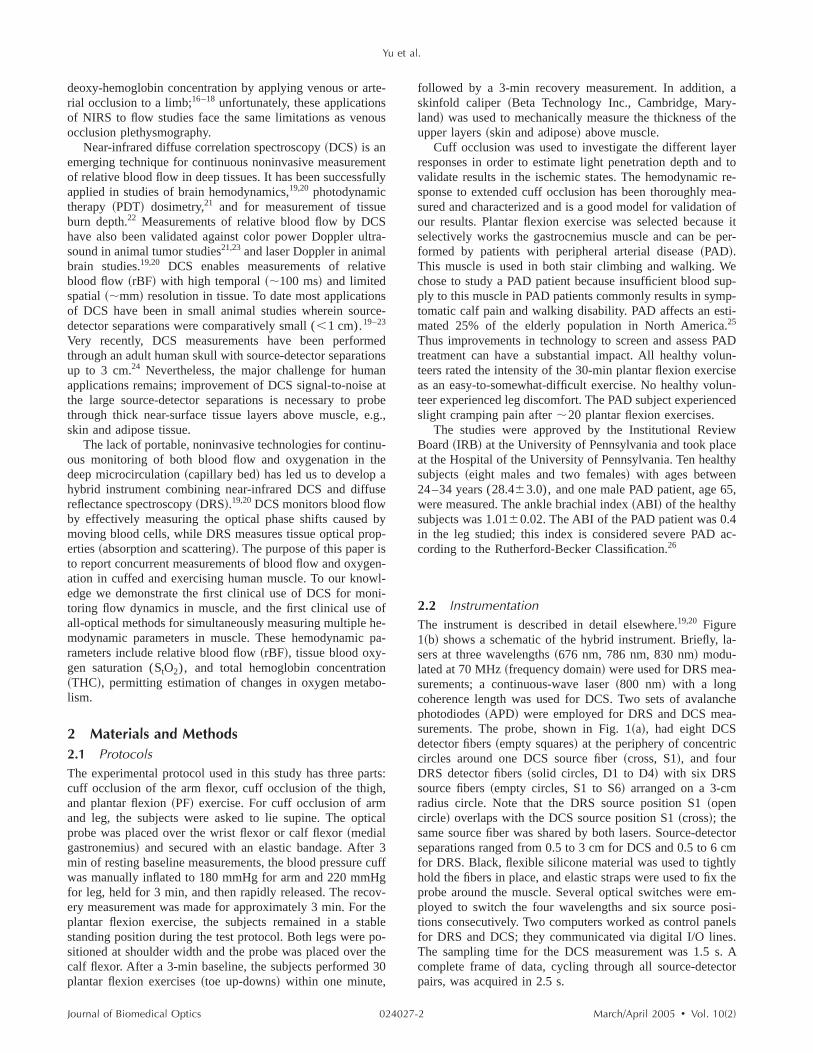
2.2 InstrumentationThe instrument is described in detail elsewhere.19,20 Figure1~b! shows a schematic of the hybrid instrument. Briefly,sers at three wavelengths~676 nm, 786 nm, 830 nm! modu-lated at 70 MHz~frequency domain! were used for DRS measurements; a continuous-wave laser~800 nm! with a longcoherence length was used for DCS. Two sets of avalanphotodiodes~APD! were employed for DRS and DCS measurements. The probe, shown in Fig. 1~a!, had eight DCSdetector fibers~empty squares! at the periphery of concentriccircles around one DCS source fiber~cross, S1!, and fourDRS detector fibers~solid circles, D1 to D4! with six DRSsource fibers~empty circles, S1 to S6! arranged on a 3-cmradius circle. Note that the DRS source position S1~opencircle! overlaps with the DCS source position S1~cross!; thesame source fiber was shared by both lasers. Source-detseparations ranged from 0.5 to 3 cm for DCS and 0.5 to 6for DRS. Black, flexible silicone material was used to tighthold the fibers in place, and elastic straps were used to fixprobe around the muscle. Several optical switches wereployed to switch the four wavelengths and six source potions consecutively. Two computers worked as control panfor DRS and DCS; they communicated via digital I/O lineThe sampling time for the DCS measurement was 1.5 scomplete frame of data, cycling through all source-detecpairs, was acquired in 2.5 s.
-2 March/April 2005 d Vol. 10(2)
Time-dependent blood flow and oxygenation . . .
Fig. 1 A schematic of the hybrid instrument (panel b) combining diffuse correlation spectroscopy (DCS) and diffuse reflectance spectroscopy (DRS)for measuring of blood flow and oxygenation. The probe head (panel a) used in this study has eight DCS detector fibers (empty squares) at theperiphery of concentric circles around one DCS source fiber (cross, S1); it also has four DRS detector fibers (solid circles, D1 to D4) with six sourcefibers (empty circles, S1 to S6) arranged on a 3-cm radius circle. The sampling time for a complete set of data was 2.5 s.
hn
-
n
l
oe-
-ote
d
i
-
-
-f
-orb-tal
in
ersa-
e
gthea-orr-s toheteon
g
par-he
ela-
tives-
2.3 Data AnalysisOur experiments derive tissue physiological properties sucas hemoglobin concentration and blood oxygen saturatiofrom DRS measurements, and derive blood flow from DCSmeasurements. Information about changes in tissue oxygemetabolism rely on a simple model that utilizes the parameters we measure directly.
DRS for blood oxygenation. The procedures to obtain timecurves of (StO2) and THC have been describedpreviously.19,20 Briefly, we model the tissue as a semi-infinitehomogeneous medium and use a wavelength-dependent seminfinite analytical solution to the photon diffusion equation tofit for the bulk optical properties of the underlying tissue. Thebulk optical properties of muscle all derived from data at largesource-detector separations~i.e., .1 cm). The optical proper-ties of the tissue are characterized by an absorption coefficiema and a reduced scattering coefficientms8 . The probe designshown in Fig. 1~a! exploits the symmetry of source and de-tector positions in order to calibrate the source and detectocoupling coefficients~e.g., tissue-fiber coupling, light trans-mission efficiency, detector gain!. For calibration, we first as-sume the underlying tissue to be homogeneous. Since onrelative amplitudes and phases are of concern, we next assume the coupling coefficients for D1 and S1 to be unity andemploy the symmetry to find coefficients for other sourcesand detectors. For example, D1 is at the center of all sourceand is thus used to calibrate the source coefficients relative tS1. S1 is then used to calibrate D2 and D4 relative to D1 sincthey are equidistant. Similarly, S5 is used to calibrate D3 relative to D1. The coupling coefficients are multiplicative foramplitude and additive for phase. We have validated this procedure on phantoms and obtained good agreement with theretical predictions over a large range of optical properties. Ihas also worked well for amplitude signals in tissues but sincthe phase signal is more sensitive and more noisy~in part, dueto large dynamic range of our measurements!, we ignorephase from our analysis. This analysis, therefore, requireknowledge of the reduced scattering coefficient, which weassumed. Our model assumes a baseline reduced scattercoefficient,ms855 cm21 at 785 nm.3,27 The influence of thisapproximation on the extracted relative changes will be discussed.
024027Journal of Biomedical Optics
n
i-
t
r
y-
s
-
ng
The wavelength-dependentma is decomposed into contributions from different tissue chromophores, i.e.,ma(l)5( i« i(l)ci . The sum is over all relevant tissue chromophores;« i(l) is the extinction coefficient as a function owavelength for thei ’ th chromophore, andci is the unknownconcentration of thei ’ th chromophore. Oxy- and deoxyhemoglobin and water are the most significant tissue absers in the NIR. Combinations of these parameters yield tohemoglobin concentration(THC5CHb1CHbO2
) and blood
oxygen saturation $StO25@CHbO2/(CHb1CHbO2
)#3100%.Here CHbO2
and CHb are tissue oxy- and deoxy-hemoglob
concentrations, respectively.DCS for relative blood flow. Speckle fluctuations of the
diffuse light are sensitive to the motions of tissue scattersuch as red blood cells. The quantity containing this informtion is the electric field(E(r ,t)). The electric field temporalautocorrelation function,G1(r ,t)5^E(r ,t)E* (r ,t1t)&, orits Fourier transform is explicitly related to the motion of thscatters~e.g., red blood cells!. Here the angle brackets^ & de-note averages over time andt is called the correlation delaytime. A continuous-wave laser with a long coherence lenand a single photon counting APD are needed for DCS msurements. A special piece of equipment called an autocelator takes the APD output and uses photon arrival timecompute the light intensity autocorrelation function. From tnormalized intensity autocorrelation function, we calculathe normalized diffuse electric field temporal autocorrelatifunction g1(r ,t)5G1(r ,t)/^E(r ,t)E* (r ,t)&; G1(r ,t) satis-fies the correlation diffusion equation in highly scatterinmedia.22,28–30 The exact form of the correlation diffusionequation depends on the nature and heterogeneity of theticle motion. For the important case of random flow in ttissue vasculature, the mean-square displacement,^Dr 2(t)&,of the scattering particles~e.g., blood cells! in time t is^Dr 2(t)&5^V2&t2. Here ^V2& is the second moment of thcell velocity distribution. In this case the normalized corretion functiong1(r ,t) will decay at early time approximatelyexponentially int. Its decay depends on a parametera ~pro-portional to the tissue blood volume fraction!, and on themean-square displacement of the blood cells. Relachanges inA^V2& are correlated with relative changes in ti
-3 March/April 2005 d Vol. 10(2)
i
dtot
dn
tn
e
n
:
-
-
t
ntce
-
ve
toents,feles
umementde-
the
stan-
nse
a-
eces
fi-
ln a0.5,nc-ni-
n
Yu et al.
sue blood flow. In this study onlyrelative blood flow is re-ported. A detailed description of these concepts and approxmations can be found in Refs. 19 and 20.
DCS data at the same source-detector separations were aeraged. The bulk muscle flow responses derived in this papeutilize only data from large source-detector separations~i.e., .1 cm).
Blood oxygenation and flow in different layers. The tissueswe investigate are layered~skin, adipose tissue, and muscle!.From diffusion theory, the maximum penetration depth of dif-fuse light in tissue depends on tissue optical properties ansource-detector separation. Therefore, specific source-detecseparation pairs predominately provide the information abouparticular tissue layers~see also Sec. 4!. To study the re-sponses from different layers, flow properties were extractefrom sets of source-detector pairs with the same separatioSimilarly, DRS data from sets of source-detector pairs withthe same separation was normalized by its baseline valuederive the relative change of tissue blood oxygen saturatio(DStO2) for the corresponding layer. Absolute baselineStO2was estimated from our multi-distance DRS measuremen~described above!.
Influence ofms8 approximation. In the calculation of bloodoxygenation and flow, it is possible the assumed baselinvalue of the scattering coefficientms8 may influence calcula-tion accuracy. This influence was investigated by varying theassumed value ofms8 and then comparing the relative changesof oxygenation and flow. We found empirically that a;100%change in baselinems8 introduced less than a 5% error in thecalculatedrelative change of chromophore concentration andoxygen saturation. The error induced in the calculated rBFwas less than 1%.
Tissue oxygen consumption. We model tissue oxygen con-sumption(VO2) in muscle in the same manner as is donewith the cerebral metabolic rate of oxygen consumption.19,31
In steady-state,VO2 depends on the difference in oxygen con-centration across the vasculature~i.e., arteriole minus venule!times the blood flow rate:VO25(OEF)3(BF)3(@O2#a).This equation is sometimes referred to as Fick’s law.16,31Here@O2#a is the arterial oxygen concentration, OEF is the tissueoxygen extraction fraction defined as (@O2#a2@O2#v)/(@O2#a), subscriptsv anda denote venous and ar-terial sides, and BF is tissue blood flow. This general equatiois used in the analysis of many oxygen metabolism problemsparticularly those associated with activation in brain19,20 andmuscle.16,27,32,33
For relative changes in these variables we definerBF5BF/BFbaseline, rOEF5OEF/OEFbaseline, and rVO25VO2 /VO2baseline. Assuming the arterial oxygen concentra-tion, @O2#a , does not change, the relative change in muscleoxygen consumption is:rVO25rOEF3rBF. Here r denotesrelative change. The oxygen extraction fraction, OEF, is related to tissue blood oxygen saturation:OEF5(SaO22StO2)/(g3SaO2). HereSaO2 andStO2 are arterial and tis-sue saturations, respectively, andg indicates percentage ofblood volume contained in the venous component of the vascular system.19,31
Our DCS measurement enables us to determine rBF. OuDRS measurement enables us to determineStO2 . SaO2 is notmeasured by DRS, but is assumed to stay constant near uni
024027Journal of Biomedical Optics
-
v-r
r
.
o
t
,
r
y.
This assumption was verified experimentally; anSaO2 of 98%was found during mild plantar flexion exercise.34 Thus, wecan obtain OEF directly from the measuredStO2 . Notice fur-ther, if we assumeg remains constant, then this compartmeparameter divides out of our estimate of rOEF. The influenof this assumption aboutg is discussed in Sec. 4.
Characterization of responses. Time traces for tissue oxygen saturation@StO2(%)#, total hemoglobin concentration@THC ~mM!#, and relative blood flow@rBF ~%!# are derivedfor both cuff occlusion and exercise. A time curve for relatitissue oxygen consumption@rVO2 ~%!# is then calculated andpresented for plantar flexion exercise; According31P-nuclear magnetic resonance spectroscopy measuremVO2 does not change(rVO251) throughout a short period oarterial occlusion(,5 min),35 and neither does rOEF. Wassign 100% as the baseline value for all relative variab~e.g., rBF, rOEF, andrVO2).
In order to evaluate the measurement accuracy we asssignal fluctuations as measured at rest are due to measureerrors. Thus a percent error is estimated by the standardviation of 50 measurement time points at rest, divided bymean of these values.
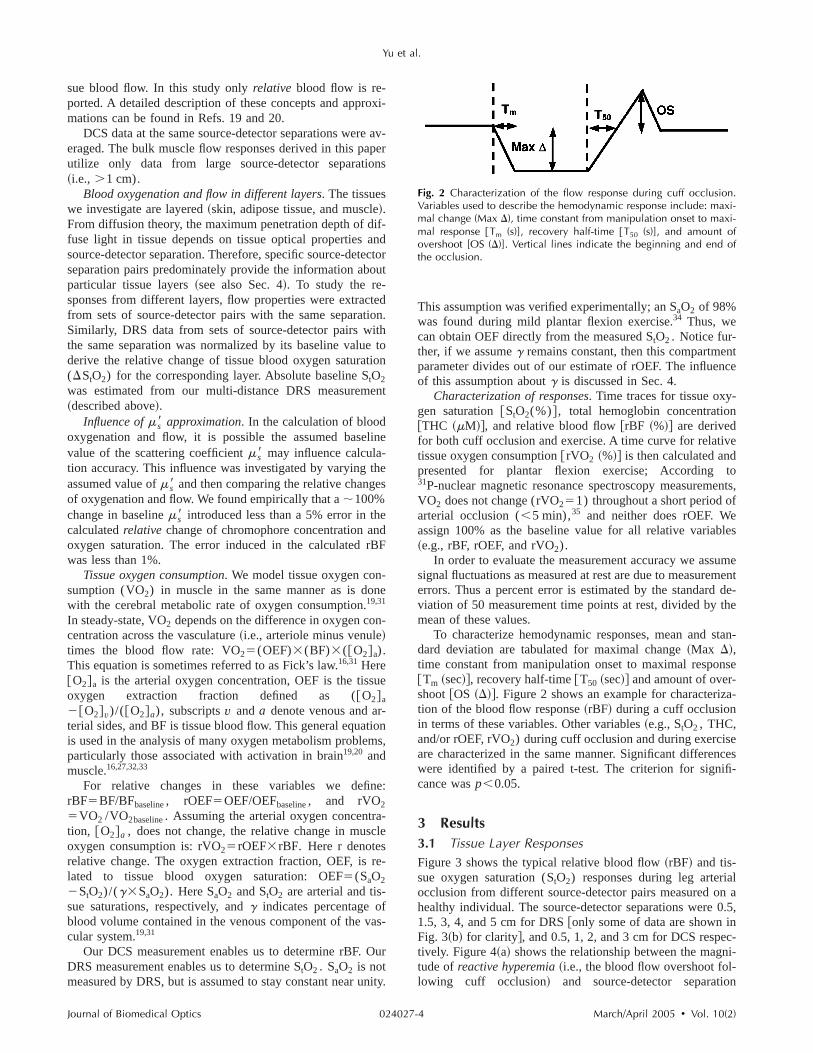
To characterize hemodynamic responses, mean anddard deviation are tabulated for maximal change~Max D!,time constant from manipulation onset to maximal respo@Tm ~sec!#, recovery half-time@T50 ~sec!# and amount of over-shoot@OS ~D!#. Figure 2 shows an example for characteriztion of the blood flow response~rBF! during a cuff occlusionin terms of these variables. Other variables~e.g.,StO2 , THC,and/or rOEF,rVO2) during cuff occlusion and during exercisare characterized in the same manner. Significant differenwere identified by a paired t-test. The criterion for signicance wasp,0.05.
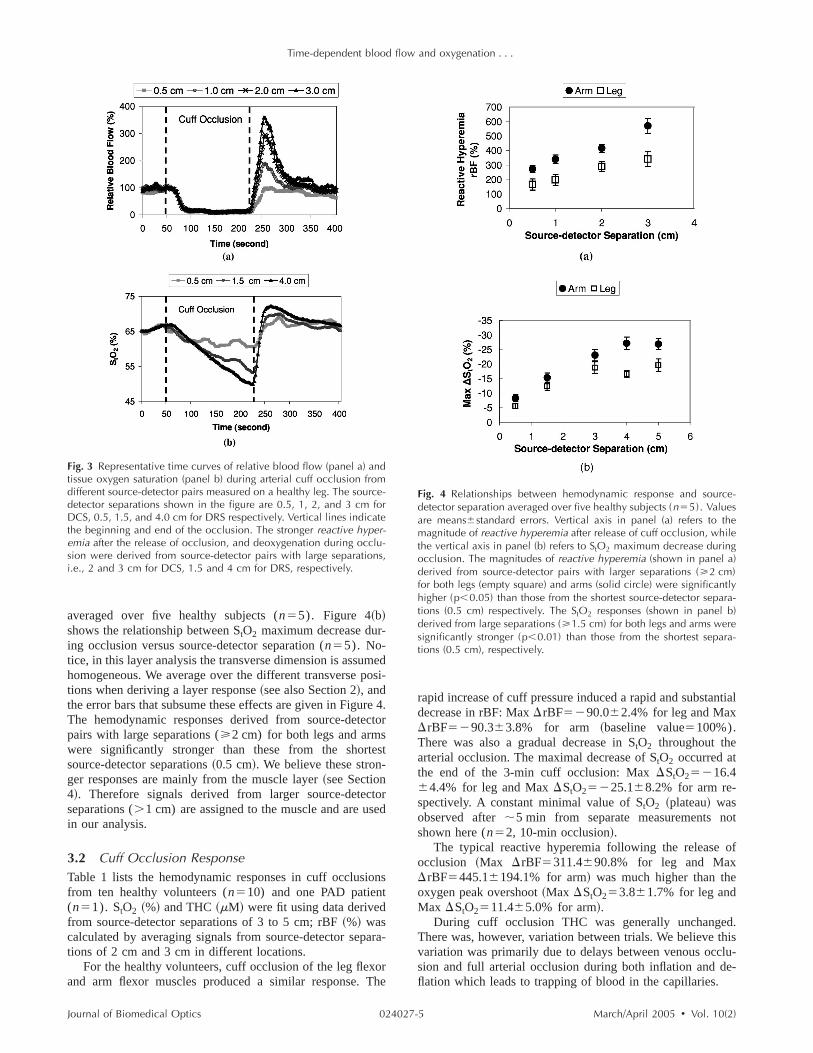
3 Results3.1 Tissue Layer ResponsesFigure 3 shows the typical relative blood flow~rBF! and tis-sue oxygen saturation(StO2) responses during leg arteriaocclusion from different source-detector pairs measured ohealthy individual. The source-detector separations were1.5, 3, 4, and 5 cm for DRS@only some of data are shown iFig. 3~b! for clarity#, and 0.5, 1, 2, and 3 cm for DCS respetively. Figure 4~a! shows the relationship between the magtude ofreactive hyperemia~i.e., the blood flow overshoot fol-lowing cuff occlusion! and source-detector separatio
Fig. 2 Characterization of the flow response during cuff occlusion.Variables used to describe the hemodynamic response include: maxi-mal change (Max D), time constant from manipulation onset to maxi-mal response @Tm (s)], recovery half-time @T50 (s)], and amount ofovershoot [OS (D)]. Vertical lines indicate the beginning and end ofthe occlusion.
-4 March/April 2005 d Vol. 10(2)
Time-dependent blood flow and oxygenation . . .
Fig. 3 Representative time curves of relative blood flow (panel a) andtissue oxygen saturation (panel b) during arterial cuff occlusion fromdifferent source-detector pairs measured on a healthy leg. The source-detector separations shown in the figure are 0.5, 1, 2, and 3 cm forDCS, 0.5, 1.5, and 4.0 cm for DRS respectively. Vertical lines indicatethe beginning and end of the occlusion. The stronger reactive hyper-emia after the release of occlusion, and deoxygenation during occlu-sion were derived from source-detector pairs with large separations,i.e., 2 and 3 cm for DCS, 1.5 and 4 cm for DRS, respectively.
4o
t
r
s
a
e
ntial
ot
of
d.thislu-e-
averaged over five healthy subjects(n55). Figure 4~b!shows the relationship betweenStO2 maximum decrease dur-ing occlusion versus source-detector separation(n55). No-tice, in this layer analysis the transverse dimension is assumehomogeneous. We average over the different transverse postions when deriving a layer response~see also Section 2!, andthe error bars that subsume these effects are given in FigureThe hemodynamic responses derived from source-detectpairs with large separations(>2 cm) for both legs and armswere significantly stronger than these from the shortessource-detector separations~0.5 cm!. We believe these stron-ger responses are mainly from the muscle layer~see Section4!. Therefore signals derived from larger source-detectoseparations(.1 cm) are assigned to the muscle and are usedin our analysis.
3.2 Cuff Occlusion ResponseTable 1 lists the hemodynamic responses in cuff occlusionfrom ten healthy volunteers(n510) and one PAD patient(n51). StO2 ~%! and THC~mM! were fit using data derivedfrom source-detector separations of 3 to 5 cm; rBF~%! wascalculated by averaging signals from source-detector separtions of 2 cm and 3 cm in different locations.
For the healthy volunteers, cuff occlusion of the leg flexorand arm flexor muscles produced a similar response. Th
024027Journal of Biomedical Optics
di-
.r
-
rapid increase of cuff pressure induced a rapid and substadecrease in rBF: MaxDrBF5290.062.4% for leg and MaxDrBF5290.363.8% for arm ~baseline value5100%).There was also a gradual decrease inStO2 throughout thearterial occlusion. The maximal decrease ofStO2 occurred atthe end of the 3-min cuff occlusion: MaxDStO25216.464.4% for leg and MaxDStO25225.168.2% for arm re-spectively. A constant minimal value ofStO2 ~plateau! wasobserved after;5 min from separate measurements nshown here(n52, 10-min occlusion!.
The typical reactive hyperemia following the releaseocclusion ~Max DrBF5311.4690.8% for leg and MaxDrBF5445.16194.1% for arm! was much higher than theoxygen peak overshoot~Max DStO253.861.7% for leg andMax DStO2511.465.0% for arm!.
During cuff occlusion THC was generally unchangeThere was, however, variation between trials. We believevariation was primarily due to delays between venous occsion and full arterial occlusion during both inflation and dflation which leads to trapping of blood in the capillaries.
Fig. 4 Relationships between hemodynamic response and source-detector separation averaged over five healthy subjects (n55). Valuesare means6standard errors. Vertical axis in panel (a) refers to themagnitude of reactive hyperemia after release of cuff occlusion, whilethe vertical axis in panel (b) refers to StO2 maximum decrease duringocclusion. The magnitudes of reactive hyperemia (shown in panel a)derived from source-detector pairs with larger separations (>2 cm)for both legs (empty square) and arms (solid circle) were significantlyhigher (p,0.05) than those from the shortest source-detector separa-tions (0.5 cm) respectively. The StO2 responses (shown in panel b)derived from large separations (>1.5 cm) for both legs and arms weresignificantly stronger (p,0.01) than those from the shortest separa-tions (0.5 cm), respectively.
-5 March/April 2005 d Vol. 10(2)

Yu et al.
Table 1 Responses in cuff occlusions from ten healthy volunteers and one PAD patient. Time to reach maximal change (Tm), maximal change(Max D), recovery half-time (T50), and hyperemic overshoot (OS) are shown for StO2 (%), THC (mM), and rBF (%). Means6SD are reported.
Parameters Subjects Tm (s) Max D T50 (s) OS (D)
Leg occlusionStO2 (%) Healthy 177.1620.7 216.464.4 33.7626.0 3.861.7
PAD 180.0 215.0 96.0* 3.0THC (mM) Healthy 88.1681.9 21.865.9 16.2618.3 2.863.1
PAD 25.0 210.0 36.0 5.0rBF (%) Healthy 51.0611.5 290.062.4 25.6614.5 311.4690.8
PAD 60.0 293.0 90.0* 165.0*
Arm occlusionStO2 (%) Healthy 174.7615.3 225.168.2 19.4615.2 11.465.0
PAD 180.0 223.0 23.0 10.0THC (mM) Healthy 46.6661.2 21.466.4 13.667.3 8.665.0
PAD 111.0 216.0 20.0 22.0rBF (%) Healthy 14.067.4 290.363.8 11.366.1 445.16194.1
PAD 11.0 292.0 12.0 450.0*Substantially different, healthy volunteers vs. the PAD patient.
e
r
d-
g
-
dm
wasey
ed
eat-t re-
2.of
ilar
r-ge
etra-en
manise,ech-ourmp-
sclenuatere-
The hemodynamic response trends in the PAD patient wersimilar to those of the healthy volunteers~data are not shownhere!, and different responses were not found in the armmuscles of healthy controls compared to the patient. Howevein the patient leg muscle, the relative magnitude of reactivehyperemia was;1/2 of the controls and the recovery half-times of bothStO2 and rBF after occlusion were about triplethose of the controls~see Table 1!.
3.3 Plantar Flexion Exercise ResponseFigure 5 shows the typical time curves of rBF &rVO2 ~panela, b!, and StO2 & THC ~panel c, d! during plantar flexionexercise from a healthy individual~panel a, c! and a PADpatient~panel b, d!. rBF during exercise did not exhibit dif-ferent phases of the muscle activity~contraction and relax-ation! due to the comparatively long sampling time~2.5 s!. Aseparate trial with higher temporal resolution(;1 Hz),achieved by changing the measurement duration for DCS anusing only one source position for DCS and DRS measurements, exhibited flow oscillations that correlated well withmuscle contraction and relaxation~see Fig. 6!.
Table 2 summarizes the hemodynamic responses durinexercise from ten healthy volunteers(n510) and one PADpatient(n51). The healthy muscle responses showed variation among subjects. After the exercise began,rVO2 increased;7 fold (694.56176.5%) within a short time(14.968.1 s)while rOEF also increased;1.5 fold (146.6656.8%) in29.468.7 s. To meet the increase in oxygen demand, rBFincreased rapidly and reached a maximum(473.76138.6%)in the same short time(14.968.1 s). This increase in flowduring exercise is termedactive hyperemia. The greatest dis-crepancy between rBF andrVO2 occurred for;15 sdemon-strating the maximum mismatch between oxygen delivery anoxygen demand. THC decreased and reached a minimu~Max DTHC5217.669.9mM) almost as fast as rBF(18.369.6 s), while StO2 also decreased rapidly and reached aminimum~Max DStO25217.167.9%) in 29.468.7 s.Afterreaching a maximum or minimum, the variables fluctuated
024027Journal of Biomedical Optics
,
randomly around their extremes. Once the exercisestopped, rBF andrVO2 recovered rapidly to their baselinvalues, whereas THC,StO2 and rOEF recovered more slowltoward their baseline values. The recovery half-times(T50) ofrBF andrVO2 after occlusion were too fast to be measurwith our present temporal resolution~i.e., 2.5-s samplingtime!.
We were able to quantify these healthy responses repedly. In studies not shown here, we tested measuremenpeatability on healthy individuals~two trials, n52); thevariation fell within the range shown in Table 1 and TableA similar variation was observed between left/right arm/leghealthy individuals.
The PAD patient and the healthy volunteers had simdynamic response trends in the plantar flexion exercise~seeFigure 5!. However, the relative magnitudes of active hypeemia, THC, andrVO2 during exercise in the diseased lewere half of the healthy controls, and the recovery half-timof StO2 after exercise was double the controls~see Table 2and Figure 5!.
4 DiscussionIn this section we first address the issue of adequate pention of DCS and DRS for probing deep muscle tissue. We thdiscuss our observations of hemodynamic response in humuscle during arterial occlusion and plantar flexion exercand compare them with previous studies based on other tnologies. We also discuss the myoglobin contributions toNIRS measurements, and the influence of our model assution on the calculation ofrVO2 .
4.1 Does Our Instrument Probe Deep Muscle Tissue?DRS has been applied and validated in studies of deep mutissue and adipose tissue.36–38 DCS, however, has not beeapplied in muscle studies. We addressed the issue of adeqpenetration by experimentally investigating tissue layersponses during cuff occlusion.
-6 March/April 2005 d Vol. 10(2)

Time-dependent blood flow and oxygenation . . .
Fig. 5 Hemodynamic responses during one-minute plantar flexion exercise from a healthy individual (panel a, c) and a PAD patient (panel b, d).The time curves of rBF and rVO2 (panel a, b), StO2 and THC (panel c, d) are shown and the error bars are estimated by the standard deviation of50 time points during the baseline converted to percent error (see text). Vertical lines indicate the beginning and end of the exercise. The samplingrate for a complete set of data was 0.4 Hz.
s
yeren-im-
re
Skin and adipose tissue layers generally lie above muscleAccording to the skinfold caliper, the thickness of the upperlayers~skin and adipose tissues! above leg flexors and wristflexors in our volunteer population were5.560.4 mm and2.860.6 mm respectively(n510). From diffusion theory,light penetration depth depends on tissue optical propertie
forts,s at
.ara-er,up-
epa-omioncalelsd
ionon
c-anto
024027Journal of Biomedical Optics
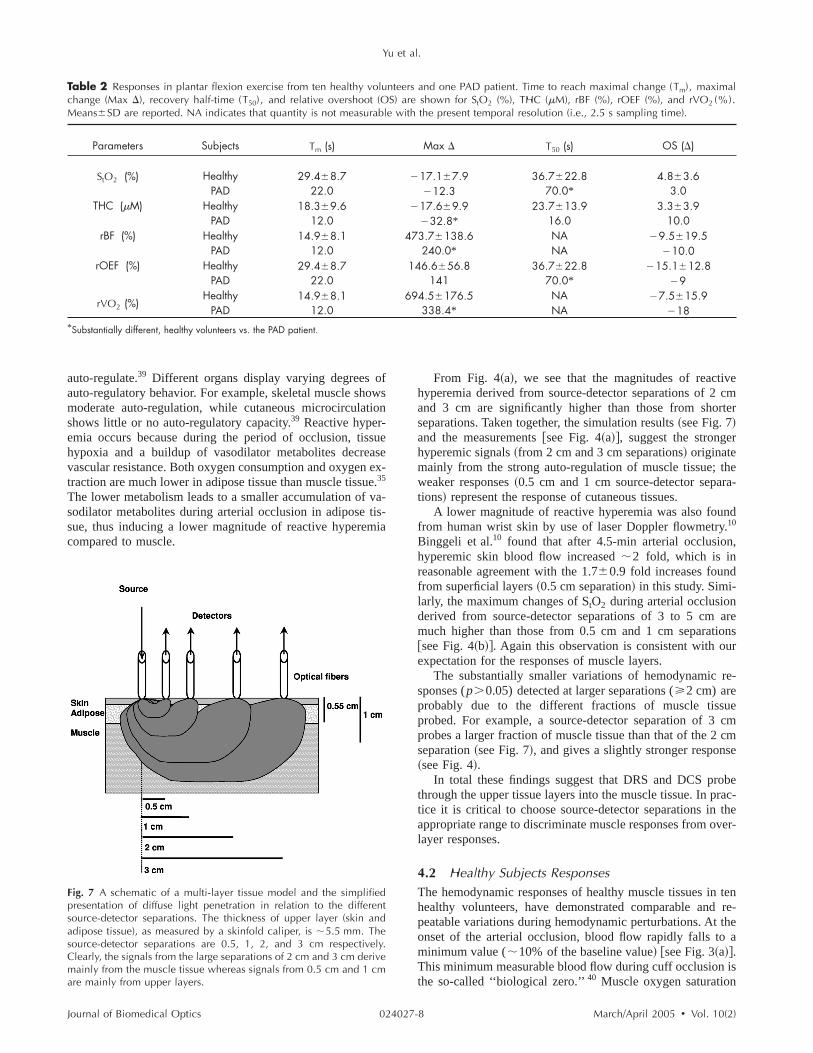
.and source-detector separation. Figure 7 displays a multi-latissue model and a simulated schematic of diffuse light petration for the different source-detector separations. For splicity, tissue was assumed homogeneous~tissue absorptioncoefficientma50.1 cm21; reduced scattering coefficientms855 cm-1). Semi-infinite, three-point Green’s functions weused to simulate the photon path distribution in the tissueeach source-detector pair. The shaded areas define poinrW,such that the probability a photon leaves the source, arrivethe detector, and passes throughrW is greater than 50%Clearly, signals detected by source-detector pairs with septions of 2 cm and 3 cm derive mainly from the muscle laywhereas signals from shorter separations are derived fromper layers. Note, however, even at large source-detector srations there is always some contribution to the signal frthe overlaying tissue. In order to quantify the penetratdepth of diffuse light, accurate knowledge of tissue optiproperties, layer thickness, and multi-layer theoretical modare desirable.36–38 We avoided the complexities associatewith measuring these variables by experimental calibratbased on reactive hyperemia following arterial occlusirelease.
Reactive hyperemia, following rapid release of arterial oclusion, is a transient increase in blood flow. The ability oforgan to display reactive hyperemia is related to its ability
Fig. 6 Representative time curve of relative blood flow (rBF) duringone-minute plantar flexion exercise from a healthy individual. Verticallines indicate the beginning and end of the exercise. With the highertemporal resolution (;1 Hz), diffuse correlation spectroscopy (DCS)detects the two phases during rhythmical exercise: a decrease flowduring muscle contraction and an increase flow during musclerelaxation.
-7 March/April 2005 d Vol. 10(2)
Yu et al.
Table 2 Responses in plantar flexion exercise from ten healthy volunteers and one PAD patient. Time to reach maximal change (Tm), maximalchange (Max D), recovery half-time (T50), and relative overshoot (OS) are shown for StO2 (%), THC (mM), rBF (%), rOEF (%), and rVO2 (%).Means6SD are reported. NA indicates that quantity is not measurable with the present temporal resolution (i.e., 2.5 s sampling time).
Parameters Subjects Tm (s) Max D T50 (s) OS (D)
StO2 (%) Healthy 29.468.7 217.167.9 36.7622.8 4.863.6PAD 22.0 212.3 70.0* 3.0
THC (mM) Healthy 18.369.6 217.669.9 23.7613.9 3.363.9PAD 12.0 232.8* 16.0 10.0
rBF (%) Healthy 14.968.1 473.76138.6 NA 29.5619.5PAD 12.0 240.0* NA 210.0
rOEF (%) Healthy 29.468.7 146.6656.8 36.7622.8 215.1612.8PAD 22.0 141 70.0* 29
rVO2 (%)Healthy 14.968.1 694.56176.5 NA 27.5615.9
PAD 12.0 338.4* NA 218*Substantially different, healthy volunteers vs. the PAD patient.
s
eex
--
vecmter
r
thera-
nd.,
auto-regulate.39 Different organs display varying degrees ofauto-regulatory behavior. For example, skeletal muscle showmoderate auto-regulation, while cutaneous microcirculationshows little or no auto-regulatory capacity.39 Reactive hyper-emia occurs because during the period of occlusion, tissuhypoxia and a buildup of vasodilator metabolites decreasvascular resistance. Both oxygen consumption and oxygen etraction are much lower in adipose tissue than muscle tissue.35
The lower metabolism leads to a smaller accumulation of vasodilator metabolites during arterial occlusion in adipose tissue, thus inducing a lower magnitude of reactive hyperemiacompared to muscle.
areonsr
re-
uecmcm
se
berac-thever-
tenre-
thea
is
024027Journal of Biomedical Optics
-
From Fig. 4~a!, we see that the magnitudes of reactihyperemia derived from source-detector separations of 2and 3 cm are significantly higher than those from shorseparations. Taken together, the simulation results~see Fig. 7!and the measurements@see Fig. 4~a!#, suggest the strongehyperemic signals~from 2 cm and 3 cm separations! originatemainly from the strong auto-regulation of muscle tissue;weaker responses~0.5 cm and 1 cm source-detector sepations! represent the response of cutaneous tissues.
A lower magnitude of reactive hyperemia was also foufrom human wrist skin by use of laser Doppler flowmetry10
Binggeli et al.10 found that after 4.5-min arterial occlusionhyperemic skin blood flow increased;2 fold, which is inreasonable agreement with the1.760.9 fold increases foundfrom superficial layers~0.5 cm separation! in this study. Simi-larly, the maximum changes ofStO2 during arterial occlusionderived from source-detector separations of 3 to 5 cmmuch higher than those from 0.5 cm and 1 cm separati@see Fig. 4~b!#. Again this observation is consistent with ouexpectation for the responses of muscle layers.
The substantially smaller variations of hemodynamicsponses(p.0.05) detected at larger separations(>2 cm) areprobably due to the different fractions of muscle tissprobed. For example, a source-detector separation of 3probes a larger fraction of muscle tissue than that of the 2separation~see Fig. 7!, and gives a slightly stronger respon~see Fig. 4!.
In total these findings suggest that DRS and DCS prothrough the upper tissue layers into the muscle tissue. In ptice it is critical to choose source-detector separations inappropriate range to discriminate muscle responses from olayer responses.
4.2 Healthy Subjects ResponsesThe hemodynamic responses of healthy muscle tissues inhealthy volunteers, have demonstrated comparable andpeatable variations during hemodynamic perturbations. Atonset of the arterial occlusion, blood flow rapidly falls tominimum value(;10% of the baseline value! @see Fig. 3~a!#.This minimum measurable blood flow during cuff occlusionthe so-called ‘‘biological zero.’’40 Muscle oxygen saturation
Fig. 7 A schematic of a multi-layer tissue model and the simplifiedpresentation of diffuse light penetration in relation to the differentsource-detector separations. The thickness of upper layer (skin andadipose tissue), as measured by a skinfold caliper, is ;5.5 mm. Thesource-detector separations are 0.5, 1, 2, and 3 cm respectively.Clearly, the signals from the large separations of 2 cm and 3 cm derivemainly from the muscle tissue whereas signals from 0.5 cm and 1 cmare mainly from upper layers.
-8 March/April 2005 d Vol. 10(2)

-
o
d
-ed
-
a
--
n
e.
r
d
e
ADfiesersurof
theof
deionsueeliv-
ed
ereus
te-
udyourof
roleofre-ellsinsnald
m
estessti-en
e
u-huse
s-ed
-
Time-dependent blood flow and oxygenation . . .
(StO2) on the other hand, decreases gradually@see Fig. 3~b!#during the occlusion, as a result of continuous oxygen consumption in tissues and minimal blood flow~oxygen deliv-ery!. The declining rate of muscle oxygenation reflects thelevel of muscle oxygen consumption at rest.35 When the oc-clusion is released, there is a reactive hyperemia becausethe auto-regulation~vasodilation! of muscle vasculature in re-sponse to metabolites~e.g.,CO2 , H1, lactate! created duringischemia. During the hyperemia, oxygen is replenished anthe metabolic stimulus for vasodilation is washed out, causingvasoconstriction. Thus blood flow and oxygen return to theirnormal resting levels.
Characterization of dynamic exercise is more difficult be-cause of its complexity and the speed of metabolic mechanisms. Exercise consumes large amounts of energy and therfore requires delivery of considerable amounts of oxygen ansubstrate, as well as the removal of waste metabolites~e.g.,CO2 , H1, lactate!. The intrinsic auto-regulation ability inmuscle vasculature increases blood flow to meet the increaseneed for delivery and removal.
Mean blood flow increases during plantar flexion exercise~see Fig. 5!. However, if blood flow is measured without av-eraging, the flow will be seen in two phases—a decrease flowduring contraction and an increase flow during relaxation.39,41
With higher temporal resolution(;1 Hz), DCS capturesthese two phases~see Fig. 6!. The increased blood volumeduring muscle relaxation mainly increases blood in the capillary component, i.e., the previously ‘‘clamped’’ capillariesopen~vascular recruitment!. In contrast, the muscle contrac-tion mainly compresses the venous component of the vascultree propelling blood toward the heart.42 Notice further thatthe comparatively larger fluctuations following exercise inboth muscle blood flow and oxygen consumption are connected with the recovery period of muscle blood oxygen saturation (StO2) ~see Fig. 5 and Fig. 6!.
The magnitude of the active hyperemia~rBF! found in thisstudy was closely related to the increase in muscle oxygeconsumption(rVO2) throughout the period of exercise; how-ever, the average increases were quite different~Fig. 5 andTable 2!. The average increase in blood flow at the transitionfrom rest to the exercise was;4.7 fold whereas the averageincrease inrVO2 was;7 fold. The increase in rBF was sig-nificantly lower than the increase inrVO2 (p,0.05). Thus adecrease in muscle oxygenation saturation(StO2) was pro-duced. This observation suggests that increased oxygen dmand cannot be completely met by an increase in blood flowOur finding is in agreement with the results obtained byBeekvelt et al.,43 who found in the active flexor digitorumsuperficialis ~FDS! that increased demand for oxygen ismostly met by an increase in oxygen extraction. The mis-match between blood supply and oxygen demand is an impotant factor in determining the cellular depletion of energeticmetabolites,44 and the magnitude of active hyperemia duringexercise is believed to be related to the metabolite-inducevascular response. Thus the ability to track muscle flow andenergy demand may be very useful for assessment in thclinic.
024027Journal of Biomedical Optics
f
-
d
r
-
-
4.3 The Patient with Peripheral Arterial Disease(PAD)In this section we discuss our observations of the single Ppatient; we note, however, that our small sample size qualiour conclusions. The different responses of healthy volunteand the PAD patient are listed in Table 1 and Table 2. Oobservation of substantially longer recovery half-timesStO2 (T50596 sfor cuff occlusion andT50570 sfor exercise!in the diseased leg were consistent with previous studies.3,45Alonger recovery half-time of rBF(T50590 s) was also foundin the diseased leg after release of cuff occlusion. Whilelonger recovery times are not surprising, the magnitudeactive hyperemia~rBF! and rVO2 during the exercise in thediseased leg were only half of those in healthy volunteers~seeTable 2!. A similar observation was made about the magnituof reactive hyperemia in the diseased leg during occlus~see Table 1!. These weaker flow responses of diseased tismay have important consequences affecting the oxygen dery and ability to support muscle metabolism.
Less blood flow delivery during exercise in the diseasleg leads to a greater decrease of tissue THC as well~seeTable 2!. In contrast, all responses from the patient arm wwithin the normal range; the patient arm also had no obviosymptoms. Using NIRS or PET, Wolf et al.,18 Burchertet al.,13 and Paunescu27 independently found no significandifference in blood flow and oxygen consumption at rest btween PAD patients and healthy subjects. Although our sthas no statistical power for the patients at the moment,work is potentially indicative of the need for measurementthe dynamic responses during exercise or cuff occlusion.
4.4 Myoglobin Contribution to the NIRSMeasurementsAn important issue in muscle studies centers around theof myoglobin ~Mb! for oxygen regulation. The presencemyoglobin does not influence our DCS blood flow measument, because DCS is sensitive to the motion of blood cand myoglobin is an oxygen storage protein that remastatic in muscle cells. However, the near-infrared DRS sigcan be ‘‘contaminated’’ by myoglobin, since myoglobin anhemoglobin~Hb! have very similar optical spectra.
Most of the optical signals in our study originate frohemoglobin because of the following.~1! Within a given vol-ume of muscle, the concentration of Hb is about 1.5 timhigher than that of Mb, and Hb has four oxygen binding sicompared to the one binding site of Mb. Therefore we emate the Mb mass affects less than 20% of oxygresponse.14,35 ~2! During suprasystolic cuff occlusion, thdeoxy-Mb signal as measured by1H MRS appeared after 4min.46 Conversely, tissue oxygen saturation(StO2) during our3-min cuff occlusion decreased immediately following occlsion and reached a maximum at the end of occlusion. Tthis gradual decrease ofStO2 during occlusion must due to thhemoglobin deoxygenation.~3! In a study of 4-min peak plan-tar flexion, as measured by the continuous wave NIRS and1HMRS, Mancini et al. found that NIRS absorption in the gatrocnemius muscle is primarily derived from deoxygenathemoglobin and not myoglobin.47 Their protocol is similar toours except the exercise period~4 min! is longer than ours~1min!. Therefore, during our relatively mild 3-min cuff occlu
-9 March/April 2005 d Vol. 10(2)

.
-
o
-
e
s
.
a-
e
and-
odandhice
-de-
r ex-%
s
ialthicro-e--
ate
ive
sue
om-
-per-can
eure,
s-clethis
era
he
to
-the
Yu et al.
sion and 1-min plantar flexion exercises we expect myoglobinto remain mostly oxygenated due to their higher affinity foroxygen compared to hemoglobin.
Our study is not designed to resolve the Hb-Mb issueTherefore, the oxygenation changes presented here are moaccurately viewed as a combination of hemoglobin and myoglobin with a relatively low contribution(,20%) from myo-globin. The effect of this contribution on the calculation of thechanges in muscle oxygen consumption can be the subjectfuture studies where measures of myoglobin and metabolismthrough magnetic resonance spectroscopic methods12 will becompared to optical results.
4.5 Comparison of Responses with Other StudiesBlood oxygenation (DRS). The observed maximum decreaseof StO2 at the end of the 3-min arterial cuff occlusion~seeTable 1! is in good agreement with other published results inthe arm48,49and leg.3 This is not surprising since similar NIRStechnology and similar source-detector separations~2 to 5 cm!were used. Although the occlusion duration of 5 to 10 minapplied in these early studies3,48,49 was longer than ours~3min!, duration does not influence the comparison of maxi-mum decreases ofStO2 at the 3-min time point. Furthermore,as mentioned before, in a subset of subjects(n52) we ob-served a constant minimal value ofStO2 ~plateau! after 5 minfollowing occlusion, consistent with the literature.
There are only a few published studies using plantar flexion exercise as the clinical protocol to study the blood oxy-genation in humans,34,50,51and some of them did not report theabsolute change ofStO2 .50,51 Quaresima et al.34 used NIRSwith a protocol of 40–80 plantar flexion/min in a supine po-sition. They reportedStO2 of medial gastrocnemius began todecrease substantially from a baseline value of 69% abou15 s after the onset of exercise, reaching a minimal value~;30%! about 15 s later; it recovered to the baseline value 32to 45 s after the end of the exercise. The trend, baseline valuand temporal responses(Tm and T50) of StO2 are in goodagreement with our observations shown in Fig. 5 and Table 2The maximal change ofStO2 (DStO2'240%) during exer-cise was approximately two times larger than our observation(217.167.9%,n510), and this difference is attributable tothe different intensity of the exercise affecting the responseOther factors could also contribute to this difference, includ-ing age and gender of the subjects, and methodology.
Blood flow (DCS). Many noninvasive techniques havebeen applied to study perfusion changes in human skeletmuscle during reactive hyperemia. Doppler ultrasound imaging measured a 3 to 6fold peak hyperemic flow after 2 min offorearm occlusion,7,8 which compares well to the;4.5 foldreactive hyperemia found by our DCS in arm occlusion~seeTable 1!.
Both conventional venous occlusion plethysmography6 andMRS plethysmography52,53present mean reperfusion peaks of25– 35 ml•100 ml21
•min21 after 3 to 5 min forearm or calfarterial occlusion, and mean muscle perfusion at rest in thrange of 3 – 5 ml•100 ml21
•min21.6,52,53 This is approxi-mately equivalent to a 7.5 fold~i.e., a range of 5–12! flowincrease relative to the baseline, and approximately2 timeshigher than the 3.8 fold~i.e., a range of 3.1–4.5! reactivehyperemia found in our study~see Table 1!. Other studies also
024027Journal of Biomedical Optics
re
f
t
,
.
l
found that plethysmographic flow was 2–3 times higher ththe NIRS flow.43,44 Beekvelt et al. hypothesized a methoological difference exists between these two techniques.43 Pl-ethysmography reflects a total limb flow which contains blocoming from skeletal muscle, cutaneous tissues, bone,tendons and might thus lead to a higher plethysmograpflow. In contrast, NIRS reflects only the local flow in thregion of interest and primarily monitors small vessels~i.e.,arterioles, capillaries, venules!. Small vessels have lower hematocrit compared to big vessels, because hematocritcreases with the decrease of the diameter of vessels. Foample, in capillaries the hematocrit is lowest, about 25lower than in whole body.27 Lower hematocrit in small vesselresults in a lower NIRS flow.43
T1 based MRI of blood reperfusion on the basis of arterspin labeling~ASL! was found to be in good agreement withe established standards, such as PET and radioactive msphere measurements.54 Since muscle perfusion at rest is blow the detection threshold ofT1 based MRI, the plethysmographic flow at rest was generally used as baseline to estimthe relative peak reperfusion.54 However, this estimation mayintroduce large overestimates in the calculation of relatpeak reperfusion, since plethysmographic flow is3.8 timeslower than theT1 based MRI flow.52,53 Thus, we do not com-pare our relative DCS flow to MRI flow.
To our knowledge there have been no reports of tisoxygen consumption(rVO2) during plantar flexion using thesame exercise protocol as ours. Thus it is impossible to cpare ourrVO2 measurements with other research.
4.6 Modeling Assumptions for Relative OxygenConsumption (rVO2)One assumption made in the calculation ofrVO2 was thatvascular compartmentalization,g, does not change. This assumption may not be true throughout exercise, since thecentage of blood contained in the venous componentchange due to exercise. Error inrVO2 will arise from differentg, before and during exercise. At rest, before exercise, thgreatest blood volume resides in the venous vasculatwhere normally 65–70% of the blood volume is found.41 Ac-cordingly we assumeg rest>67.5%.During exercise, muscleis very effective in returning blood to the heart by compresion of venules and veins. Thus total blood volume in musdecreases due to muscular compression. We found instudy that THC decreased during exercise by;15% from abaseline of;115mM ~see Fig. 5 and Table 2!. THC reflectsblood volume. Thus we may assume a;15% decrease intotal blood volume during exercise. For simplicity, we furthassume this;15% decrease in total blood volume is due todecrease in venous vasculature. We then can estimate tgduring exercise:gexercise>61.8%. Overall, exercise induceda decrease ofg from ;67.5% to ;61.8%.
A decrease ing during exercise compared to rest leadsan overestimate of rOEF by a factor,(g rest /gexercise21)310059.2%.The;9.2% overestimate of rOEF will lead inturn to a;9.2% overestimate ofrVO2 . Considering the sev-eral fold changes ofrVO2 during exercise~see Table 2!, thisoverestimate ofrVO2 may be considered unimportant.
The metabolic responses(rVO2), as measured by our optical method, require more validation studies based on
-10 March/April 2005 d Vol. 10(2)
r
e
oe-
r
-
-
r
d
-t
-a
rai
h-
,
ear-
geral
an
.ve
.nic
.er-
C.-o,’’
D.ic
: a
eand
L.le
x-nt of
S.y-eps
.anose
in
n-by
.n-
wlar
and,
. G.se
.ngT,’’
es
Time-dependent blood flow and oxygenation . . .
established techniques, such as MRS which can measumetabolic responses directly.12 Taken together the unresolvedissues described above suggest that our calculation is bettregarded as an index ofrVO2 rather than an absolute measure.
4.7 ConclusionsDiffuse correlation spectroscopy~DCS! has been shown inthis study to penetrate through layers of upper tissues tmuscle tissue. This technique can therefore give accuratmeasurements of blood flow in the muscle capillary bed compared to plethysmography, because it is much less affected bblood flow from the surrounding tissues~e.g., cutaneous tis-sues, bone, tendons!. Unlike venous occlusion NIRS and pl-ethysmography for flow measurements, DCS does not interupt the blood flow during measurement and is simple toperform.
The combination of DCS and diffuse reflectance spectroscopy ~DRS! has allowed us to use both optical methods non-invasively and continuously, to measure relative blood flow~rBF!, blood oxygen saturation(StO2) and total hemoglobinconcentration~THC! in deep muscle tissues under rest, duringmild exercise and during extreme cuff occlusion. These hemodynamic parameters permit an estimation of the relativemuscle oxygen consumption(rVO2). Our hybrid instrumen-tation used in this study is portable, inexpensive, and safe folongitudinal studies. It has potential to become a clinical rou-tine examination tool supplementary to MRS/MRI or PET.
Measurements on healthy volunteers(n510) allowed usto quantify healthy muscle responses~e.g., reactive hyper-emia, active hyperemia, mismatch between blood supply anoxygen demand, recovery half-time!, which were consistentwith known physiology. Muscle responses have large variation and are reported to be heterogeneous in differenlocations.18 Pilot studies on a single PAD patient suggest weare able to distinguish features differentiating normal and diseased responses, but while these observations are encouring, they cannot be extrapolated broadly until more statisti-cally significant sample sizes are employed. Multi-parametedynamic measurements such as these are essential for thesessment of disease and for evaluating of healthy muscle oxdative metabolism. Such information has potential to improvediagnostic and treatment options for PAD patients.
AcknowledgmentsThe authors acknowledge useful discussions with T. ChanceS. Nioka, J. Im, and T. Floyd. E. R. Mohler was supported inpart through a grant from the Juvenile Diabetes ResearcFoundation. B. Chance acknowledges support from NIH5R01-HL44125-15. A. G. Yodh acknowledges support fromNIH 2-R01-HL57835-04.
References1. B. Chance, M. T. Dait, C. Zhang, T. Hamaoka, and F. Hagerman
‘‘Recovery from exercise-induced desaturation in the quadricepsmuscles of elite competitive rowers,’’Am. J. Physiol.262~3Pt 1!,C766–775~1992!.
2. T. Binzoni, L. Ngo, E. Hiltbrand, R. Springett, and D. Delpy, ‘‘Non-standard O~2! consumption-temperature curves during rest and iso-metric exercise in human skeletal muscle,’’Comp. Biochem. Physiol.,Part A: Mol. Integr. Physiol.132~1!, 27–32~2002!.
3. D. J. Wallace, B. Michener, D. Choudhury, M. Levi, P. Fennelly, D.M. Hueber, and B. B. Barbieri, ‘‘Results of a 95-subject human clini-
024027Journal of Biomedical Optics
e
r
y
-
g-
s--
,
cal trial for the diagnosis of peripheral vascular disease using a ninfrared frequency domain hemoglobin spectrometer,’’Proc. SPIE3597, 300–316~1999!.
4. T. R. Cheatle, L. A. Potter, M. Cope, D. T. Delpy, P. D. ColeridSmith, and J. H. Scurr, ‘‘Near-infrared spectroscopy in periphevascular disease,’’Br. J. Surg78~4!, 405–408~1991!.
5. R. J. Whitney, ‘‘The measurement of volume changes in humlimbs,’’ J. Physiol. (London)121~1!, 1–27~1953!.
6. K. A. Engelke, J. R. Halliwill, D. N. Proctor, N. M. Dietz, and M. JJoyner, ‘‘Contribution of nitric oxide and prostaglandins to reactihyperemia in human forearm,’’J. Appl. Physiol.81~4!, 1807–1814~1996!.
7. J. R. Libonati, A. K. Howell, N. M. Incanno, K. K. Pettee, and H. LGlassberg, ‘‘Brief muscle hypoperfusion/hyperemia: an ergogeaid?,’’ J. Strength Cond. Res.15~3!, 362–366~2001!.
8. J. R. Libonati, M. Cox, N. Incanno, S. K. Melville, F. C. Musante, HL. Glassberg, and M. Guazzi, ‘‘Brief periods of occlusion and repfusion increase skeletal muscle force output in humans,’’Cardiologia43~12!, 1355–1360~1998!.
9. R. Joannides, W. E. Haefeli, L. Linder, V. Richard, E. H. Bakkali,Thuillez, and T. F. Luscher, ‘‘Nitric oxide is responsible for flowdependent dilatation of human peripheral conduit arteries in vivCirculation 91~5!, 1314–1319~1995!.
10. C. Binggeli, L. E. Spieker, R. Corti, I. Sudano, V. Stojanovic,Hayoz, T. F. Luscher, and G. Noll, ‘‘Statins enhance postischemhyperemia in the skin circulation of hypercholesterolemic patientsmonitoring test of endothelial dysfunction for clinical practice?,’’J.Am. Coll. Cardiol.42~1!, 71–77~2003!.
11. T. Binzoni, T. S. Leung, D. Boggett, and D. Delpy, ‘‘Non-invasivlaser Doppler perfusion measurements of large tissue volumeshuman skeletal muscle blood RMS velocity,’’Phys. Med. Biol.48~15!, 2527–2549~2003!.
12. R. S. Richardson, E. A. Noyszewski, L. J. Haseler, S. Bluml, andR. Frank, ‘‘Evolving techniques for the investigation of muscbioenergetics and oxygenation,’’Biochem. Soc. Trans.30~2!, 232–237 ~2002!.
13. W. Burchert, S. Schellong, J. van den Hoff, G. J. Meyer, K. Aleander, and H. Hundeshagen, ‘‘Oxygen-15-water PET assessmemuscular blood flow in peripheral vascular disease,’’J. Nucl. Med.38~1!, 93–98~1997!.
14. V. Quaresima, M. Ferrari, M. A. Franceschini, M. L. Hoimes, andFantini, ‘‘Spatial distribution of vastus lateralis blood flow and oxhemoglobin saturation measured at the end of isometric quadriccontraction by multichannel near-infrared spectroscopy,’’J. Biomed.Opt. 9~2!, 413–420~2004!.
15. U. Wolf, M. Wolf, J. H. Choi, L. A. Paunescu, L. P. Safonova, AMichalos, and E. Gratton, ‘‘Mapping of hemodynamics on the humcalf with near infrared spectroscopy and the influence of the adiptissue thickness,’’Adv. Exp. Med. Biol.510, 225–230~2003!.
16. M. Ferrari, T. Binzoni, and V. Quaresima, ‘‘Oxidative metabolismmuscle,’’Philos. Trans. R. Soc. London, Ser. B352~1354!, 677–683~1997!.
17. R. A. De Blasi, M. Cope, C. Elwell, F. Safoue, and M. Ferrari, ‘‘Noinvasive measurement of human forearm oxygen consumptionnear infrared spectroscopy,’’Eur. J. Appl. Physiol.67~1!, 20–25~1993!.
18. U. Wolf, M. Wolf, J. H. Choi, M. Levi, D. Choudhury, S. Hull, DCoussirat, L. A. Paunescu, L. P. Safonova, A. Michalos, W. W. Matulin, and E. Gratton, ‘‘Localized irregularities in hemoglobin floand oxygenation in calf muscle in patients with peripheral vascudisease detected with near-infrared spectrophotometry,’’J. Vasc.Surg.37~5!, 1017–1026~2003!.
19. J. P. Culver, T. Durduran, D. Furuya, C. Cheung, J. H. Greenberg,A. G. Yodh, ‘‘Diffuse optical tomography of cerebral blood flowoxygenation, and metabolism in rat during focal ischemia,’’J. Cereb.Blood Flow Metab.23~8!, 911–924~2003!.
20. C. Cheung, J. P. Culver, K. Takahashi, J. H. Greenberg, and AYodh, ‘‘In vivo cerebrovascular measurement combining diffunear-infrared absorption and correlation spectroscopies,’’Phys. Med.Biol. 46~8!, 2053–2065~2001!.
21. G. Yu, T. Durduran, T. M. Busch, H. W. Wang, C. Zhou, H. MSaunders, C. M. Seghal, and A. G. Yodh, ‘‘Non-Invasive Monitoriof hemodynamic responses in RIF tumors during and after PDProc. SPIE4952, 131–139~2003!.
22. D. A. Boas and A. G. Yodh, ‘‘Spatially varying dynamical properti
-11 March/April 2005 d Vol. 10(2)
,l
-
.
-
g
tial
k,ign,
le
nring
.nd
lu-nce’’ ines
lez-al
.
E.t by
-hu-
ce,xer-
alex-
J.ananar
J.mtal
oy-n
th
Yu et al.
of turbid media probed with diffusing temporal light correlation,’’J.Opt. Soc. Am.14~1!, 192–215~1997!.
23. C. Menon, G. M. Polin, I. Prabakaran, A. Hsi, C. Cheung, J. P. Cul-ver, J. F. Pingpank, C. S. Sehgal, A. G. Yodh, D. G. Buerk, and D. L.Fraker, ‘‘An integrated approach to measuring tumor oxygen statususing human melanoma xenografts as a model,’’Cancer Res.63~21!,7232–7240~2003!.
24. T. Durduran, G. Yu, M. G. Burnett, J. A. Detre, J. H. Greenberg, J.Wang, C. Zhou, and A. G. Yodh, ‘‘Diffuse optical measurement ofblood flow, blood oxygenation, and metabolism in a human brainduring sensorimotor cortex activation,’’Opt. Lett.29~15!, 1766–1768~2004!.
25. E. R. Mohler, ‘‘Peripheral arterial disease: identification and implica-tions,’’ Arch. Intern Med.163~19!, 2306–2314~2003!.
26. R. B. Rutherford, J. D. Baker, C. Ernst, K. W. Johnston, J. M. PorterS. Ahn, and D. N. Jones, ‘‘Recommended standards for reports deaing with lower extremity ischemia: revised version,’’J. Vasc. Surg.26~3!, 517–538~1997!.
27. L. A. Paunescu, ‘‘Tissue blood flow and oxygen consumption measured with near-infrared frequency-domain spectroscopy,’’ PhD The-sis, University of Illinois, Urbana~2001!.
28. D. A. Boas, L. E. Campbell, and A. G. Yodh, ‘‘Scattering and Imag-ing with Diffusing Temporal Field Correlations,’’Phys. Rev. Lett.75~9!, 1855–1858~1995!.
29. D. J. Pine, D. A. Weitz, P. M. Chaikin, and E. Herbolzheimer, ‘‘Dif-fusing wave spectroscopy,’’Phys. Rev. Lett.60, 1134–1137~1988!.
30. G. Maret and P. E. Wolf, ‘‘Multiple light scattering from disorderedmedia. The effect of Brownian motion of scatterers,’’Z. Phys.65,409–413~1987!.
31. J. Mayhew, D. Johnston, J. Martindale, M. Jones, J. Berwick, and YZheng, ‘‘Increased oxygen consumption following activation ofbrain: Theoretical footnotes using spectroscopic data from barrel cortex,’’ Neuroimage13~6!, 975–987~2001!.
32. M. Cicoira, L. Zanolla, L. Franceschini, A. Rossi, G. Golia, M. Zam-boni, P. Tosoni, and P. Zardini, ‘‘Skeletal muscle mass independentlypredicts peak oxygen consumption and ventilatory response durinexercise in noncachectic patients with chronic heart failure,’’J. Am.Coll. Cardiol. 37~8!, 2080–2085~2001!.
33. S. Homma, H. Eda, S. Ogasawara, and A. Kagaya, ‘‘Near-infraredestimation of O2 supply and consumption in forearm muscles work-ing at varying intensity,’’J. Appl. Physiol.80~4!, 1279–1284~1996!.
34. V. Quaresima, S. Homma, K. Azuma, S. Shimizu, F. Chiarotti, M.Ferrari, and A. Kagaya, ‘‘Calf and shin muscle oxygenation patternsand femoral artery blood flow during dynamic plantar flexion exer-cise in humans,’’Eur. J. Appl. Physiol.84~5!, 387–394~2001!.
35. T. Binzoni, V. Quaresima, G. Barattelli, E. Hiltbrand, L. Gurke, F.Terrier, P. Cerretelli, and M. Ferrari, ‘‘Energy metabolism and inter-stitial fluid displacement in human gastrocnemius during short is-chemic cycles,’’J. Appl. Physiol.85~4!, 1244–1251~1998!.
36. A. Kienle and T. Glanzmann, ‘‘In vivo determination of the opticalproperties of muscle with time-resolved reflectance using a layeredmodel,’’ Phys. Med. Biol.44~11!, 2689–2702~1999!.
37. T. J. Farrell, M. S. Patterson, and M. Essenpreis, ‘‘Influence of lay-ered tissue architecture on estimates of tissue optical propertis obtained from spatially resolved diffuse reflectometry,’’Appl. Opt.37~10!, 1958–1972~1998!.
38. M. C. van Beekvelt, M. S. Borghuis, B. G. van Engelen, R. A.Wevers, and W. N. Colier, ‘‘Adipose tissue thickness affects in vivoquantitative near-IR spectroscopy in human skeletal muscle,’’Clin.Sci.101~1!, 21–28~2001!.
024027Journal of Biomedical Optics
-
-
39. R. E. Klabunde, ‘‘Cardiovascular Physiology Concepts@Online#’’~03/08/2005!, http://www.cvphysiology.com/
40. T. Tenland, E. G. Salerud, G. E. Nilsson, and P. A. Oberg, ‘‘Spaand temporal variations in human skin blood flow,’’Int. J. Microcirc.:Clin. Exp.2~2!, 81–90~1983!.
41. P. O. Astrand, K. Rodahl, H. Dahl, and S. Stromme,Textbook of WorkPhysiology, 4th ed., S. B. Michael, S. Myles, B. Kathleen, C. Dereand L. D. Jennifer, Eds., pp. 146–148, Human Kinetics, ChampaIL ~2003!.
42. M. H. Laughlin, ‘‘Skeletal muscle blood flow capacity: role of muscpump in exercise hyperemia,’’Am. J. Physiol.253~5Pt 2!, H993–1004 ~1987!.
43. M. C. Van Beekvelt, W. N. Colier, R. A. Wevers, and B. G. VaEngelen, ‘‘Performance of near-infrared spectroscopy in measulocal O~2! consumption and blood flow in skeletal muscle,’’J. Appl.Physiol.90~2!, 511–519~2001!.
44. R. A. De Blasi, M. Ferrari, A. Natali, G. Conti, A. Mega, and AGasparetto, ‘‘Noninvasive measurement of forearm blood flow aoxygen consumption by near-infrared spectroscopy,’’J. Appl.Physiol.76~3!, 1388–1393~1994!.
45. J. R. Kappa, H. D. Berkowitz, R. Seestedt, and B. Chance, ‘‘Evaation of calf muscle oxygen content using near-infrared refecta~NIR! spectroscopy in patients with peripheral vascular disease,Vascular Surgery 2000, J. R. Cohen, Ed., pp. 10–16, R. G. LandCo. ~1992!.
46. R. S. Richardson, E. A. Noyszewski, B. Saltin, and J. GonzaAlonso, ‘‘Effect of mild carboxy-hemoglobin on exercising skeletmuscle: intravascular and intracellular evidence,’’Am. J. Physiol.Regul. Integr. Comp. Physiol.283~5!, R1131–1139~2002!.
47. D. M. Mancini, L. Bolinger, H. Li, K. Kendrick, B. Chance, and J. RWilson, ‘‘Validation of near-infrared spectroscopy in humans,’’J.Appl. Physiol.77~6!, 2740–2747~1994!.
48. R. A. De Blasi, S. Fantini, M. A. Franceschini, M. Ferrari, andGratton, ‘‘Cerebral and muscle oxygen saturation measuremenfrequency-domain near-infra-red spectrometer,’’Med. Biol. Eng.Comput.33~2!, 228–230~1995!.
49. T. Muellner, A. Nikolic, W. Schramm, and V. Vecsei, ‘‘New instrument that uses near-infrared spectroscopy for the monitoring ofman muscle oxygenation,’’J. Trauma46~6!, 1082–1084~1999!.
50. S. Nioka, D. Moser, G. Lech, M. Evengelisti, T. Verde, B. Chanand S. Kuno, ‘‘Muscle deoxygenation in aerobic and anaerobic ecise,’’ Adv. Exp. Med. Biol.454, 63–70~1998!.
51. H. Miura, K. McCully, L. Hong, S. Nioka, and B. Chance, ‘‘Regiondifference of muscle oxygen saturation and blood volume duringercise determined by near infrared imaging device,’’Jpn. J. Physiol.51, 599–606~2001!.
52. J. F. Toussaint, K. K. Kwong, F. O. Mkparu, R. M. Weisskoff, P.LaRaia, H. L. Kantor, and F. M’Kparu, ‘‘Perfusion changes in humskeletal muscle during reactive hyperemia measured by echo-plimaging,’’ Magn. Reson. Med.35~1!, 62–69~1996!.
53. J. F. Toussaint, K. K. Kwong, F. M’Kparu, R. M. Weisskoff, P.LaRaia, and H. L. Kantor, ‘‘Interrelationship of oxidative metabolisand local perfusion demonstrated by NMR in human skelemuscle,’’J. Appl. Physiol.81~5!, 2221–2228~1996!.
54. J. S. Raynaud, S. Duteil, J. T. Vaughan, F. Hennel, C. Wary, A. LerWillig, and P. G. Carlier, ‘‘Determination of skeletal muscle perfusiousing arterial spin labeling NMRI: validation by comparison wivenous occlusion plethysmography,’’Magn. Reson. Med.46~2!, 305–311 ~2001!.
-12 March/April 2005 d Vol. 10(2)