A novel method for noninvasive detection of neuromodulatory changes in specific neurotransmitter...
12
A novel method for noninvasive detection of neuromodulatory changes in specific neurotransmitter systems Nathaniel M. Alpert,* Rajendra D. Badgaiyan, Elijahu Livni, and Alan J. Fischman Division of Nuclear Medicine, Massachusetts General Hospital, Boston, MA 02114, USA Received 2 December 2002; revised 13 February 2003; accepted 18 March 2003 Abstract Over the last decade, it has become possible to study theories of cognition using positron emission tomography (PET) and functional magnetic resonance imaging (fMRI). These methods yield statistical parametric maps of changes in cerebral blood flow (CBF) elicited by cognitive tasks. A limitation of these studies is that they provide no information about the underlying neurochemistry. However, it is possible to extend the concept of activation studies to include measurements targeting neurotransmitters and specific receptor populations. Cognitive activation increases neuronal firing rate, increasing the endogenous neurotransmitter level. The increased neurotransmitter level can be used to alter the kinetics of specifically bound radioligands. We describe a new approach to the design and analysis of neuromodulation experiments. This approach uses PET, a single-scan session design, and a linear extension of the simplified reference region model (LSSRM) that accounts for changes in ligand binding induced by cognitive tasks or drug challenge. In the LSSRM, an “activation” parameter is included that represents the presence or absence of change in apparent dissociation rate. Activation of the neurotransmitter is detected statistically when the activation parameter is shown to violate the null hypothesis. Simulation was used to explore the properties of the LSSRM with regard to model identifiability, effect of statistical noise, and confounding effects of CBF-related changes. Simulation predicted that it is possible to detect and map neuromodulatory changes in single-subject designs. A human study was conducted to confirm the predictions of simulation using 11 C-raclopride and a motor planning task. Parametric images of transport, binding potential, areas of significant dopamine release, and statistical parameters were computed. Examination of the kinetics of activation demonstrated that maximum dopamine release occurred immediately following task initiation and then decreased with a half-time of about 3 min. This method can be extended to explore neurotransmitter involvement in other behavioral and cognitive domains. © 2003 Elsevier Science (USA). All rights reserved. Introduction In recent years positron emission tomography (PET) and functional magnetic resonance imaging (fMRI) techniques have been used to detect changes in cerebral blood flow (CBF) elicited by cognitive or behavioral tasks. These “ac- tivation” studies have successfully identified a number of cortical and subcortical areas that process a variety of cog- nitive activities. However, these experiments are limited by their inability to identify cellular mechanisms associated with cognitive changes. Since the CBF-related changes are nonspecific, these studies do not provide information about the nature of the underlying neurochemistry and neurotrans- mitter systems involved in performing specific cognitive tasks. Because of these limitations, activation studies are not likely to explain neurophysiological mechanisms of cogni- tion. One of the challenges for neuroimaging experiments is to advance the methodology to the point where one can not only identify the regions of brain that are activated by a stimulus, but also determine the chemical systems that me- diate these responses (Coull, 1998; Granon et al., 2000; Kahkonen et al., 2001; Lawrence et al., 1998). Experiments conducted on human volunteers and labo- ratory animals have provided reliable data suggesting that neurotransmitters and neuromodulators significantly influ- ence a variety of cognitive functions (Jentsch et al., 2000; Kulisevsky, 2000; Oak et al., 2000; Robbins, 2000; Robbins et al., 1997). It has been shown that activation or inhibition of neurotransmitter systems causes significant alteration in performance of human volunteers and laboratory animals on a variety of tasks of spatial attention (Jackson et al., 1994; Perry et al., 1999; Witte and Marrocco, 1997; Robbins, 2000), and working memory (Granon et al., 2000; Green- wald and Davis, 1983; Jaber et al., 1996; Kimberg et al., * Corresponding author. Fax: 1-617-726-6165. E-mail address: [email protected] (N.M. Alpert). NeuroImage 19 (2003) 1049 –1060 www.elsevier.com/locate/ynimg 1053-8119/03/$ – see front matter © 2003 Elsevier Science (USA). All rights reserved. doi:10.1016/S1053-8119(03)00186-1
Transcript of A novel method for noninvasive detection of neuromodulatory changes in specific neurotransmitter...

A novel method for noninvasive detection of neuromodulatory changesin specific neurotransmitter systems
Nathaniel M. Alpert,* Rajendra D. Badgaiyan, Elijahu Livni, and Alan J. FischmanDivision of Nuclear Medicine, Massachusetts General Hospital, Boston, MA 02114, USA
Received 2 December 2002; revised 13 February 2003; accepted 18 March 2003
Abstract
Over the last decade, it has become possible to study theories of cognition using positron emission tomography (PET) and functional magneticresonance imaging (fMRI). These methods yield statistical parametric maps of changes in cerebral blood flow (CBF) elicited by cognitive tasks.A limitation of these studies is that they provide no information about the underlying neurochemistry. However, it is possible to extend the conceptof activation studies to include measurements targeting neurotransmitters and specific receptor populations. Cognitive activation increases neuronalfiring rate, increasing the endogenous neurotransmitter level. The increased neurotransmitter level can be used to alter the kinetics of specificallybound radioligands. We describe a new approach to the design and analysis of neuromodulation experiments. This approach uses PET, asingle-scan session design, and a linear extension of the simplified reference region model (LSSRM) that accounts for changes in ligand bindinginduced by cognitive tasks or drug challenge. In the LSSRM, an “activation” parameter is included that represents the presence or absence ofchange in apparent dissociation rate. Activation of the neurotransmitter is detected statistically when the activation parameter is shown to violatethe null hypothesis. Simulation was used to explore the properties of the LSSRM with regard to model identifiability, effect of statistical noise,and confounding effects of CBF-related changes. Simulation predicted that it is possible to detect and map neuromodulatory changes insingle-subject designs. A human study was conducted to confirm the predictions of simulation using 11C-raclopride and a motor planning task.Parametric images of transport, binding potential, areas of significant dopamine release, and statistical parameters were computed. Examinationof the kinetics of activation demonstrated that maximum dopamine release occurred immediately following task initiation and then decreased witha half-time of about 3 min. This method can be extended to explore neurotransmitter involvement in other behavioral and cognitive domains.© 2003 Elsevier Science (USA). All rights reserved.
Introduction
In recent years positron emission tomography (PET) andfunctional magnetic resonance imaging (fMRI) techniqueshave been used to detect changes in cerebral blood flow(CBF) elicited by cognitive or behavioral tasks. These “ac-tivation” studies have successfully identified a number ofcortical and subcortical areas that process a variety of cog-nitive activities. However, these experiments are limited bytheir inability to identify cellular mechanisms associatedwith cognitive changes. Since the CBF-related changes arenonspecific, these studies do not provide information aboutthe nature of the underlying neurochemistry and neurotrans-mitter systems involved in performing specific cognitivetasks. Because of these limitations, activation studies are notlikely to explain neurophysiological mechanisms of cogni-
tion. One of the challenges for neuroimaging experiments isto advance the methodology to the point where one can notonly identify the regions of brain that are activated by astimulus, but also determine the chemical systems that me-diate these responses (Coull, 1998; Granon et al., 2000;Kahkonen et al., 2001; Lawrence et al., 1998).
Experiments conducted on human volunteers and labo-ratory animals have provided reliable data suggesting thatneurotransmitters and neuromodulators significantly influ-ence a variety of cognitive functions (Jentsch et al., 2000;Kulisevsky, 2000; Oak et al., 2000; Robbins, 2000; Robbinset al., 1997). It has been shown that activation or inhibitionof neurotransmitter systems causes significant alteration inperformance of human volunteers and laboratory animals ona variety of tasks of spatial attention (Jackson et al., 1994;Perry et al., 1999; Witte and Marrocco, 1997; Robbins,2000), and working memory (Granon et al., 2000; Green-wald and Davis, 1983; Jaber et al., 1996; Kimberg et al.,
* Corresponding author. Fax: �1-617-726-6165.E-mail address: [email protected] (N.M. Alpert).
NeuroImage 19 (2003) 1049–1060 www.elsevier.com/locate/ynimg
1053-8119/03/$ – see front matter © 2003 Elsevier Science (USA). All rights reserved.doi:10.1016/S1053-8119(03)00186-1

2001). There is, however, no direct evidence that associatesa specific neurotransmitter system with a cognitive function.
In 1995 Fisher et al. and Morris et al. suggested that itmight be possible to use PET and specifically bound radio-ligands to detect changes in the binding kinetics of revers-ibly bound radioligands. The prediction was based on theidea that neurons involved in a cognitive task increase theirfiring rate, causing an increase in the synaptic level ofendogenous neurotransmitter. This mechanism can be usedto perturb the kinetics of specifically bound receptor li-gands, making it possible to detect the effect with PET.Koepp et al. (1998) performed the first study testing thefeasibility of the idea; but their experiment involved a com-plex task (a video game) and required two scan sessions anda cohort of subjects to detect an effect. A ground-breakingstudy by Friston et al. (1997) proposed and demonstrated amethod for assessing time-dependent changes in ligand dis-placement by using a single-scan design and a pharmaco-logical challenge. Recently, Pappata et al. (2002) have ap-plied and extended Friston’s method to study a gambling/reward task. In this study, we present a novel methodologydesigned to increase the sensitivity of single-scan sessiondesigns so that activation might be detected in individualsubjects. This report presents the theory, discusses its im-plementation, evaluates elements of the theory by simula-tion, and demonstrates feasibility in a human experiment.
Theory
We derive a kinetic theory capable of describing non-steady-state (i.e., time dependent) fluctuations of receptor pa-rameters. This theory rests on the reference region models(Lammertsma et al., 1996) and the simplified reference regionmodel (SRRM) of Lammertsma and Hume (1996) and Gunn etal. (1997). Our theory extends the SRRM in two ways: first, itallows the parameters to be time dependent and second, allparameters enter linearly. To review briefly, the SRRM fol-lows from the following basic equations:
dC�t�
dt� K1aCp�t� � k2aC�t� (1)
dCr�t�
dt� K1rCp�t� � k2rCr�t� (2)
Cp(t) denotes the plasma concentration of radioligand at time t. Cand Cr are instantaneous quantities denoting radioactivity concen-tration in a binding and reference region respectively. The refer-ence region is assumed to be devoid of specific binding. Thesubscript r refers to the reference region parameters and the sub-script a refers to an “apparent” volume containing both free andnonspecifically bound tracer as well as specifically bound tracer.This apparent volume is assumed to be adequately described by asingle compartment model, with the bound and free tracer ininstantaneous equilibrium. In the limit of instantaneous equilib-rium, the SRRM parameters are related to the standard receptormodel with two compartments and four parameters, K1, k2, k3, andk4. By assuming that the volume of distribution of the nonspecifi-
cally bound tracer is the same in the reference and the bindingregion, one can derive a series of convenient equations. By sub-stitution for Cr , the binding equation can be rewritten as
dC�t�
dt�
K1a
K1r�dCr�t�
dt� k2r · Cr�t�� � k2a · C�t� (3)
and directly integrated to yield
C�t� � RCr�t� � k2�0
t
Cr�u�du � k2a�0
t
C�u�du (4)
where:
R �K1a
K1r�
k2
k2r
k2a �k2
1 � BP
BP �k3
k4
Including the effect of activation
In this theory we consider activation to be any cognitiveeffect or drug challenge that can render any, or all, of the modelparameters to be time dependent, i.e., the non- steady-statesituation. For this approach to be useful we have to “know” orhypothesize the time dependence of the parameters. In additionto changes in the endogenous neurotransmitter level, changesin blood flow may cause time-dependent changes in the modelparameters (Dagher et al., 1997; Pappata et al., 2002). Thenon-steady-state equation is obtained by integrating Eq. (3)assuming that the parameters are time dependent.
C�t� � �0
t
R�u� ·dCr
dudu � �
0
t
k2�u� · Cr�u�du
� �0
t
k2a�u� · C�u�du (5)
We propose a basic activation model that includes acontrol state with parameters R, k2, and k2a. The activationstate is parameterized as R � � h(t), k2 � � h (t), and k2a
� � h(t), where we assume a common time dependence forthe activated state described by h(t). The basic equation is:
C�t� � RCr�t� � k2�0
t
Cr�u�du � k2a�0
t
· C�u�du
� ��0
tdCr
duh�u�du � ��
0
t
Cr�u�h�u�du
� ��0
t
C�u�h�u�du (6)
1050 N.M. Alpert et al. / NeuroImage 19 (2003) 1049–1060

Because there is a paucity of relevant experimental data,it is not possible to specify h(t) with great certainty. Basedon the available data (see Fisher et al., 1995), we canassume that changes in endogenous neurotransmitter levelsoccur on a time scale that is very fast compared to PETimaging times. The available data also support the assump-tions that the major effects of activation occur immediatelyafter the onset of the task and that the effects diminish overtime. More discussion of this point is presented later. For
the purpose of this study we consider an exponential formfor h(t) (Endres and Carson, 1998), with activation com-mencing at time T.
h�t� � � 0, t � Te���t�T�, t T � (7)
where � controls the rate at which activation effects dieaway. The model equation
C�t� � �RCr�t� � k2�
0
t
Cr�u�du � k2a�0
t
C�u�du 0 � t � T
RCr�t� � k2�0
t
Cr�u�du � k2a�0
t
C�u�du � . . .
���Cr�t�e���t�T� � Cr�T�� � ��T
t
Cr�u�e���u�T�du� � . . .
��T
t
e���u�T�Cr�u�du � ��T
t
e���u�T�C�u�du t T
� (8)
predicts the instantaneous concentration curve.To derive an operational equation for this theory, we take
note of the fact that the concentrations in Eq. (8) are instan-taneous quantities. Denote the measurable quantities as petand ref. pet is the concentration value measured by the PETscanner in a binding region and ref is the concentrationmeasured in a region devoid of specific binding. In terms ofthe instantaneous quantities the ith measurement is
peti �1
�i�
ti
ti��i
C�u�du (9)
refi �1
�i�
ti
ti��i
Cr�u�du (10)
where �i represents the duration of the ith frame and ti
is the start time of the ith frame. Integrating Eq. (8),we can closely approximate the integrals as sums, yield-ing an operational equation suitable for numeric compu-tation,
peti � �1 � i � js
R · refi � k2��j�1
j�i �jrefj �1
2�i · refi � k2a��
j�1
j�i �jpetj �1
2�i · peti
i js
R · refi � k2��j�1
j�i �jrefj �1
2�i · refi � k2a��
j�1
j�i �jpetj �1
2�i · peti � . . .
� · �refi · e���ti��i/ 2�T� � refjs� � . . .
� � · ��j�js
j�i refj · e���tj��j/ 2�T� �1
2�i refie
���ti��i/ 2�T� . . .
� � · ��j�js
j�i �j · petj · e���tj � �j/ 2 � T� �1
2�i · peti · e���ti��i/ 2�T�
� (11)
where js is the frame in which the activation task begins.
1051N.M. Alpert et al. / NeuroImage 19 (2003) 1049–1060

Parameter estimation and hypothesis testing
To simplify the exposition, assume that � is known; wewill describe how we estimated � in the materials andmethods section of this report. With this assumption, themodel equations are linear in the parameters. We will referto this as the linear simplified reference region model(LSSRM). Linear least squares provides estimates of themodel parameters and their covariance matrix. In statisticalparlance, the effects of interest are R, k2, k2a, �, �, and �,with � being the parameter of greatest interest. An importantpoint in this study is that while the LSSRM provides quan-titative estimates of the parameters, our interest will often besatisfied if we can reject the null hypothesis � � 0. Simplehypotheses are tested by using the estimated covariancematrix to compute t statistics for the parameters of interest(Searle, 1971; Friston et al., 1995; 1997). The t statistic hasn � p � 1 degrees of freedom where n is the number offrames and p the number of model parameters. For region ofinterest (ROI) analysis, the percentage points of the t dis-tribution can be used to test for significance. For parametricimaging, the use of random field theory and the concepts ofSPM analysis (Friston et al., 1995, 1997) is required to setappropriate significance thresholds when there are noapriori localizing hypotheses. In principle, hypothesis test-ing can detect significant changes in � and �, protectingagainst CBF-related confounds with changes in �; butwhether this can be achieved in practice depends on theidentifiability of the model parameters. We will return tothis point in the discussion.
Materials and methods
To evaluate the theory we performed simulation studiesand experiments with human subjects. The simulations ex-amine basic questions about model, parameter identifiabilityin the face of random noise, and the confounding effects ofchanges in blood flow. The human studies attempt to dem-onstrate the feasibility of detecting changes in receptorbinding due to a motor planning task. For this study we usea single human study as an example to show proof ofprinciple; the results of the human studies have been re-ported elsewhere (Badgaiyan et al., 2003).
Simulation studies
All simulations were programmed in the MATLAB comput-ing environment (Release 13, The Mathworks, Natick, MA). Dif-ferential equations were solved using ode23s, a solver designedfor so-called stiff equations. To mimic experimental protocols, wesimulated an acquisition with 59 frames (10 at 30 s, 45 at 1 min,and 4 at 5 min). Fitting parameters and their covariance matrixwere determined analytically, using weighted linear least squares.
The first set of simulations addressed the issue of biasedestimation by comparing the LSSRM with the standardfour-parameter, two-compartment model of receptor bind-ing, as applied to 11C-raclopride. The endpoint of the sim-ulation was to determine whether the LSSRM could fit datagenerated with the standard model and whether the LSSRMparameters matched the values used in the standard model.The instantaneous values for reference and binding regionconcentrations were determined by solving the correspond-ing differential equations with parameters appropriate toraclopride binding (see Table 1), using a measured inputfunction. The expected values for the PET curves (i.e.,simulated) were determined by integrating the instantaneousconcentration values to compute the average concentrationsfor the simulated scan protocol. The simulated referenceregion curve was used as the input function with Eq. (11)and linear least squares estimation to “fit” the simulatedbinding curve (�, �, and � were set to 0). The same calcu-lation was also performed with the original method of Gunnet al. (1997), which solves the nonlinear SRRM equationsby a combination of linear least squares and table lookup.
The second set of simulations, again with noise-free data,studied a range of possible effects that may accompanycognitive activation or pharmacological challenge. Theseinclude the effects of increased ligand displacement andincreased blood flow. We considered possibilities such asproportional increase in K1 and k2, so that the distributionvolume remained constant, and separate changes in k2 andk1. The differential equations were modified to allow fortime-dependent parameters. All of these simulations as-sumed a time-dependent parameter(s) of the form
p�t� � � po t � T� po � �p�e���t�T� t T � (12)
Simulations were performed for perturbations beginningat T � 38 min after injection. Tests were performed to
Table 1Simulation parameters
Reference region Binding region LSSRM
K1R k2R K1 k2 k3 k4 R BP R k2 k2a BP Notes
0.092 0.45 0.092 0.45 0.062 0.014 1 4.54 0.83 0.29 0.052 4.57 a
0.18 0.326 0.18 0.37 0.38 0.11 1 3.45 0.85 0.20 0.044 3.50 b
a,b Adapted from aPappata et al. (2002) and bFarde et al. (1989), Subject C. The parameters listed in the Binding region section of the table were thoseindicated in notes (a) and (b) and they were used to simulate positron emission tomographic (PET) curves with the standard two compartment PET receptormodel. The parameters listed under LSSRM were those estimated with the linear simplified reference region model.
1052 N.M. Alpert et al. / NeuroImage 19 (2003) 1049–1060

determine the degree of bias in the parameters, the goodnessof fit, and model identifiability.
The third set of simulations examined the feasibility ofdetecting ligand displacement in individual subjects at thevoxel level. In essence, these simulations examined theeffect of statistical noise on detection of effects. We simu-lated PET curves with the LSSRM and the parameters R, k2,and k2a shown in Table 1 for Subject C in Farde et al.(1989). The effect of increased dopamine level was set asdescribed above. Simulation of noisy data was computed byadding Gaussian random noise with variance proportional toCm · e t/dt, where Cm was the peak value of the noise-freesimulation and denotes the decay constant for 11C. Theproportionality constant was adjusted to yield results similarto that observed in human studies with racolpride at a spatialresolution of 10 mm. To gauge the level of type II errorthat might affect this type of analysis, we analyzed anotherensemble of 10,000 simulations having the same noise leveladded to a simulation with � � 0.
Human studies
A set of pilot studies studies were performed in 5 younghealthy human volunteers, under the supervision of theCommittee on Human Research at the Massachusetts Gen-eral Hospital. The general nature of the experiments wasexplained and subjects gave written informed consent. Theobject of these initial studies was to test the predictions ofsimulations suggesting the possibility of detecting liganddisplacement in individual subjects during a well-definedmotor planning task. Because this study is methodologicalin nature and because the results of the human study will beof interest to a wider community, we present the results ofone study in this report.
The test subject reported here received a bolus injection(1 min duration) of 14 mCi of 11C-raclopride, with spe-cific activity 900 mCi/�mol, in the left antecubittal vein.The subject was imaged in the supine position with headrestrained by a custom-molded thermoplastic mask, usingan ECAT EXACT HR� PET scanner operating in the three-dimensional mode. The ECAT HR� records 63 slices si-multaneously, with an intrinsic resolution of about 4-mmFWHM in all spatial dimensions (Adam et al., 1997). Theacquisition protocol recorded frames over a 90-min period.Images were reconstructed as 128 128 63 elementvolumes using an OSEM algorithm, with corrections forphoton attenuation, random coincidences, scatter, and deadtime. To minimize the residual effects of head movements,image registration was performed to align each frame to acommon orientation (Alpert et al., 1996). To effect theimage registration, we used the following multistep proce-dure: First, all frames were smoothed with a 10-mm FWHM
Gaussian filter. Second, all frames were aligned to the frametaken at 25 min. Next, the aligned frames were summed toform a new reference volume and all frames were alignedagain to the sum image.
A task was designed to focus on motor planning. Thecore element of the task was the opposition of the thumband fingers in response to visual cues presented on a com-puter monitor. The same visual cues, the presentation of asingle random digit (1, 2, 3, or 4) once every 2 s, werevisible to the subject throughout the experiment. During thecontrol phase of the study, the subject was instructed to liestill without moving. In the study presented here fingeropposition started 38 min after raclopride injection andcontinued for the duration of the experiment. The subjectwas instructed to oppose the right thumb and forefingerupon seeing the digit 1, their thumb and middle finger onseeing the digit 2, and so on. Compliance with all instruc-tions was observed by closed-circuit television.
Image analysis was performed by using a combination ofROI analysis and parametric imaging. Visual examinationof the image data was used to identify the cerebellum, athree-dimensional ROI was defined, and a time activitycurve (TAC) was extracted to serve as the reference regionTAC. All frames were smoothed with a 10-mm FWHMGaussian filter. To reduce the computational load, a maskindicating the “important voxels” was determined by sum-ming all frames and using a threshold 1.3 times the mean ofall voxels. The LSSRM model with � and � fixed to zerowas used to fit all voxels within the mask. Parametricimages of the R, k2, k2a, BP � k2/k2a � 1 , �, thecovariance matrix, and the t score for � were computed. Apresentation image of the t map for the � parameter wasdetermined by including only those voxels for which k2 �1.5 · k2a � 0. In the fusion of the t map and bindingpotential, the binding potential image was filtered with a 3 3 median filter to suppress high frequency noise.
The analysis proceeded as a two-step process. First, datawere analyzed assuming h(t) was a step function (i.e., � �0). Following that analysis the t map was examined forevidence of increased ligand displacement. Regions of in-creased displacement were further analyzed by ROI analy-sis. TACs were extracted and fit with a model that allowed� to vary. Following estimation of �, the parametric mapswere recomputed.
Statistical analysis
The LSSRM model uses weighted linear least squaresanalysis for parameter estimation. The theory of leastsquares analysis also provides an estimate of the covariancematrix of the parameters [see Friston et al. (1997) for rele-vant details]. Accordingly, parameter values are presentedwith estimates of their standard error (SE). The hypothesis� � 0 is tested by computing t � �/SE(�).
1053N.M. Alpert et al. / NeuroImage 19 (2003) 1049–1060

Results
Basic simulations
In all cases the LSSRM made excellent fits to the sim-ulated noise-free data. With graphical display, only verysmall differences between data and fit could be seen. How-ever, as seen in Table 1, the parameter values for theLSSRM were biased and, as expected from the structureof the model, the covariance matrix of the parameter esti-mates showed high correlation between k2 and k2a. Despitethis bias, values of binding potential determined from BP� k2/k2a � 1 were close to the “true value.” The samesimulation performed with the original nonlinear method,described by Gunn et al. (1997), gave very similar results,with the small differences likely due to the difference infitting method employed.
Simulation
Fig. 1 shows simulations that predict the kinetics ofraclopride under the following four conditions: (1) displace-ment resulting from increased levels of endogenous dopa-mine; (2) perturbation resulting from increases in K1 and k2
(holding the distribution volume constant); (3) displacementresulting from increase of k2; and (4) perturbation resultingfrom increase in K1. These data illustrate the magnitude ofthe effects. Increasing transport and clearance 20% while
holding the distribution volume constant has negligible ef-fect; whereas, 20% increases in k2 alone may be difficult toseparate from displacement due to increasing levels of en-dogenous dopamine. Increasing K1 results in an increasedPET concentration. Fitting the LSSRM model to these datayielded good fits to the simulation curves and the differ-ences between simulation and fit were difficult to visualizewith graphical display. All cases could be fit with � � 0 and� � 0; in the case of increased K1, the estimates of � werenegative. When two or more of the “activation” parameterswere included, the estimates were unreliable. Examinationof the covariance matrix of the parameter estimates showedvery high correlation among two or more activation param-eters. We will discuss this point more fully later.
Simulation 3, effect of statistical noise
Fig. 2 shows an example of the LSSRM fit to noisy data.The parameters of this fit were close to the input values, R� 0.854 � 0.020, k2 � 0.195 � 0.004, k2a � 0.043 �0.001, and � � 0.020 � 0.004. For an ensemble of 10,000simulations with � 0, the mean t score for estimation of� 0 was 3.7. Examination of the distribution of t scoresobtained for the ensemble showed that t was greater than 3in 93% of the simulations. When the same simulation wasrun with � � 0, we found the mean t score for estimation of� 0 was �0.07, with 7% of t scores greater than 2 and0.7% greater than 3.
Fig. 1. Simulation of raclopride kinetics. In all cases the solid line is the control condition (see Table 1 for details) and all effects begin 38 min post injectionwith � � 0.22 1/min. (A) 33% increase in endogenous dopamine. (B) 20% increase in both K1 and k2. (C) 20% increase in k2 with K1 unchanged. (D) 20%increase in K1.
1054 N.M. Alpert et al. / NeuroImage 19 (2003) 1049–1060

Human study
Analysis of measurements analyzed with the LSSRMand � � 0 showed clear evidence for displacement of
raclopride by the motor planning task. Bilateral activationwas detected in the putamen and the caudate nucleus. Fig. 3shows the TAC extracted from an activated region and thefit obtained after varying �. Immediately following the ini-
Fig. 2. Effect of noise on raclopride kinetics. The solid line is the control condition (see Table 1 for details) and all effects begin 38 min post injection with� � 0.22 1/min. Simulation of 33% increase in endogenous dopamine plus noise (circles). Fit to the noisy data (dashed line). See text for details.
Fig. 3. Time activity curve (TAC) and fit to data from a human study. The circles symbols indicate the positron emission tomographic (PET) concentrationin an “activated” putamen voxel. The vertical line at t � 38 min denotes the start time of the activation task. The symbols indicate PET concentrationsfrom the reference region TAC. The solid line is the linear simplified reference region model (LSSRM) fit with � � 0.221/min.
1055N.M. Alpert et al. / NeuroImage 19 (2003) 1049–1060

tiation of the task, a change in the putamen TAC (circlesymbols) suggestive of ligand displacement can be ob-served; whereas, no changes is seen in the reference TAC.The LSSRM parameter estimates were R � 1.154 � 0.0451,k2 � 0.242 � 0.010, k2a � 0.0653 � 0.0035, and � �0.0283 � 0.0054. This leads to an estimate of BP � 2.704and an observed t score of 5.3, with df � 56, rejects the nullhypothesis � � 0. The parametric maps were recomputedwith � � 0.22 min�1.
Fig. 4 presents an example of the parametric imagingresults. There are six panels, all from the same slice. Thebasic parameters of the SRRM are illustrated in the top row.The binding potential (panel D) is computed from panel B
and C as k2/k2a � 1. Panel E shows the image of �; whereas,panel F shows the standard error of � as computed voxel-by-voxel from the estimate of the covariance matrix. PanelE presents both positive (yellow 3 red) and negative esti-mates of � (blue3 yellow). Examination of panel F showshigh values of the standard error in � everywhere except inthe striatum. Accordingly, computation of t scores willtypically yield smaller values outside the striatum.
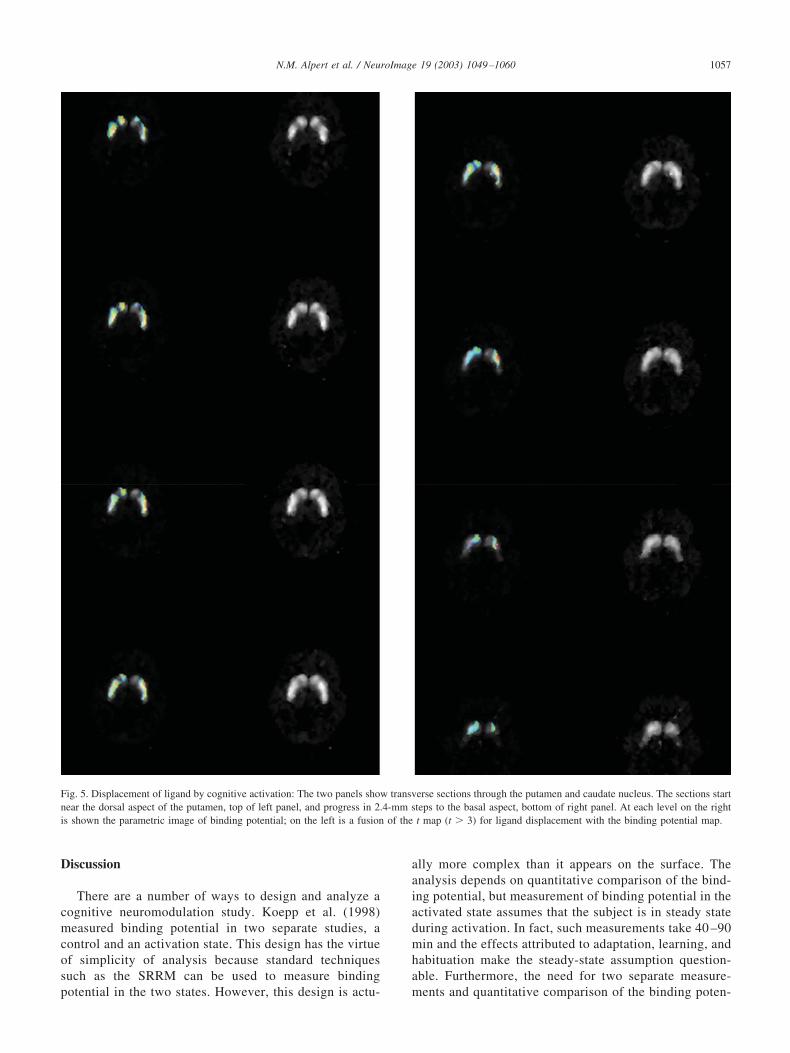
Fig. 5 illustrates the fusion of the t score (t � 3, df � 56)computed voxel-by-voxel as the ratio �/SE(�). Visual in-spection shows that there is statistically significant increasein ligand displacement rate bilaterally in the putamen andright caudate nucleus.
Fig. 4. Parametric images in transverse section. (A) Image of R. (B) Image of k2. (C) Image of k2a. (D) Image of binding potential. (E) Image of �. (F) Imageof SE(�).
1056 N.M. Alpert et al. / NeuroImage 19 (2003) 1049–1060
Discussion
There are a number of ways to design and analyze acognitive neuromodulation study. Koepp et al. (1998)measured binding potential in two separate studies, acontrol and an activation state. This design has the virtueof simplicity of analysis because standard techniquessuch as the SRRM can be used to measure bindingpotential in the two states. However, this design is actu-
ally more complex than it appears on the surface. Theanalysis depends on quantitative comparison of the bind-ing potential, but measurement of binding potential in theactivated state assumes that the subject is in steady stateduring activation. In fact, such measurements take 40 –90min and the effects attributed to adaptation, learning, andhabituation make the steady-state assumption question-able. Furthermore, the need for two separate measure-ments and quantitative comparison of the binding poten-
Fig. 5. Displacement of ligand by cognitive activation: The two panels show transverse sections through the putamen and caudate nucleus. The sections startnear the dorsal aspect of the putamen, top of left panel, and progress in 2.4-mm steps to the basal aspect, bottom of right panel. At each level on the rightis shown the parametric image of binding potential; on the left is a fusion of the t map (t � 3) for ligand displacement with the binding potential map.
1057N.M. Alpert et al. / NeuroImage 19 (2003) 1049–1060

tial introduces a source of experimental error that mayreduce the sensitivity of this design.
The design employed by Pappata et al. (2002) is a clearadvance since it accepts that effects may be transient anduses alternating blocked stimuli (i.e., different tasks) in asingle-scan design. Their analysis follows the approach ofFriston et al. (1997). The PET curve is modeled as aweighted sum of curve shapes describing the null hypothe-sis (i.e., no activation), shapes describing the effects ofcognitive ligand displacement, and CBF-related changes.The curve shape for the null hypothesis of no activation isbased on previous measurements in other subjects; whereas,curve shapes modeling cognitive ligand displacement orCBF-related changes come from simulation. Hypothesistesting is effected within the general linear statistical modelby testing whether the weight of a particular curve shape issignificantly greater than zero. However, the curve shapesfor the control state are not specific to the subjects analyzed;and while the simulated curves are likely to be similar to theeffects they model, they are not derived from real data. Onthis basis, one expects the model predictions to resemble themeasured data but not to fit it in detail. No data werepresented regarding the ability of this model to fit measureddata and no data were presented regarding the covariance ofthe model parameters. The use of canonical curve shapes isguaranteed to inflate the sum of squared differences be-tween the model prediction and the data, and since the errorvariance is directly proportional to the sum of squares, thevariance of parameter estimates will increase as well. Ac-cordingly, it is likely that the approach of Friston andcolleagues (1997) is not optimal in a statistical sense.
This study proposes an analysis, the LSSRM, that isbased on a kinetic model of the processes involved. Theeffects, or lack thereof, are estimated by fitting the model todata from individual subjects. Non-steady-state effects areincluded by making the parameters time dependent. Thesimulations reported here were informed and focused byanalyzing data from human studies. We used results from ahuman study to set �, the rate of decline in activation effect,in our simulations. We found that � � 0.2 min�1, suggest-ing, for the task studied, that the effect is nearly abolishedby 10 min after the activation is initiated. A series ofsimulation studies, using the standard receptor model asinput, illustrate the basic properties of the method. Wefound using simulations of the “no activation” state withnoise-free data that the LSSRM fit the data very well. Therewas significant bias in the parameter estimates; but the biasin the binding potential was very small. Due to the structureof the model, there is high correlation between k2 and k2a.The bias in the parameter estimates is a characteristic of thesimplified reference region model and arises from the factthat the assumption of instantaneous equilibrium is not trulysatisfied.
In our examination of the LSRRM, we found that modelidentifiability is limited to one time-dependent parameter.This finding is due to the simple shape of the PET curves.It may be possible to employ different experimental designs
or task strategies to make more complex alterations in thekinetics and hence to improve identifiability. With � � 0.22min�1 the duration of the perturbation is limited and thecovariance structure of model parameters reduces the modelidentifiability, a finding that can be understood on an intu-itive basis. That is, when the perturbing effects are short-lived, there are likely to be an infinite number of parametersets that can fit the data about as well as one another.Simulations with noisy data, similar in amplitude to thatobserved in experiment, show that a high detection thresh-old will be necessary for single-subject designs to controlthe false positive rate because with noisy data and lowthresholds one expects a higher type II error. A more con-servative approach to control of type I and type II errorwould be to use cohorts of subjects, combining the LSSRMwith the methodology described by Aston et al. (2000) orpossibly with an SPM-like analysis that accounts for be-tween-subject variability.
Dagher et al. (1997) and Pappata et al. (2002) havediscussed the ambiguities that can arise from CBF-relatedeffects. As noted in these studies, the available data are notdefinitive regarding how serious these effects are in prac-tice. We know from activation studies with 15O-H2O (e.g.,Hurtig et al., 1994) and fMRI that sensory-motor tasksproduce large flow changes. Changes from cognitive acti-vation tasks are usually much smaller, typically less than15% (Andreasen et al., 1996). Jueptner et al. (1997) re-ported striatial activation in motor learning tasks with CBFincreases in the range of 2–4%. Simulations of the activa-tion state demonstrated that the LSSRM fits the data welleven in situations where CBF-related effects were on theorder of 20%. We distinguish the following three cases: (1)ligand transport rate increases with constant distributionvolume, (2) plasma to tissue transport (K1) increases morethan clearance rate, and (3) clearance rate increases morethan transport. In the first case, our simulations as well asthose of Dahger et al. (1997) and Pappata et al. (2002) showthat the changes in the PET binding curve are negligible. Inthe second case, transient increase in the PET binding curvewas demonstrated by simulation. When analyzed with theLSRRM (fixing � � 0 and � � 0 and letting � vary), wewere able to fit the data with negative values of �. Weinterpret that to mean that increased transport, without li-gand displacement, can be distinguished from the effect ofinterest. In the third case, the binding curve is similar to thatobtained with ligand displacement and the LSRRM is un-able to distinguish CBF-related effects. We do not know if,or to what degree, case 3 exists in practice; however, it doesnot seem likely that CBF-related changes will be a seriousproblem in ligand displacement studies using cognitive ac-tivation.
The results of our simulations should be evaluated in thelight of the assumptions we made. First, we assumed thatchanges in model parameters occurred immediately afteractivation was initiated. Second, we not only assumed thatthe activation effect diminished with time but also that thedecrease in effect was exponential. Therefore, these simu-
1058 N.M. Alpert et al. / NeuroImage 19 (2003) 1049–1060

lations could be taken as a point of departure for experi-mental designs that might seek to increase sensitivity byprolonging the effects or otherwise blunting habituation oroverlearning of a cognitive or behavioral task.
A number of observations can be made about theLSSRM approach. First, LSSRM offers a simple computa-tional scheme. The data indicate it can make high qualityparametric maps of the parameters of the SRRM of Gunn etal. (1997). Second, we found strong evidence of liganddisplacement. Using an ROI targeted to a single voxel in theactivated region we extracted a TAC whose shape was verysimilar to the predictions of the simulations. Third, thesedata provide the first direct evidence for the short durationof neuromodulatory effects in human subjects performing acognitive task. Finally, further research is needed to evalu-ate the possibility of extending the method to differentdopaminergic receptors and to other neurotransmitters.
Conclusions
This study describes a novel approach to the design andanalysis of experiments whose goal is to detect changes inradioligand binding elicited by cognitive/behavioral tasks orpharmacological challenge. We have presented a new the-oretical approach, the LSSRM, that is model driven andfacilitates computation of parametric maps. The propertiesof the LSSRM were studied by simulation, showing that thetheory and analytic approach can accommodate the effectsof CBF-related changes as well as ligand displacement.Simulations of the noise properties of the LSSRM suggestedthat under realistic circumstances it is possible to detect andmap neuromodulation. Mapping of increased dopamine re-lease was demonstrated in a human study.
Acknowledgments
The authors wish to thank the staff of the PET Imagingand Cyclotron Laboratories for their technical assistance.We also thank Evan Morris for valuable suggestions.R.D.B. acknowledges the support of grant T32CA09362.
References
Adam, L.E., Zaers, J., Ostertag, H., Trojan, H., Bellemann, M.E., Brix, G.,1997. Performance evaluation of the whole-body PET scanner ECATEXACT HR� following the IEC standard. IEEE Trans. Nucl. Sci. 44,1172–1179.
Alpert, N., Badgaiyan, R., Fischman, A., 2002. Detection of neuromodu-latory changes in specific neurotransmitter systems: experimental de-sign and strategy. Neuroimage 16, Part 2, Abst. S53.
Alpert, N.M., Berdichevsky, D., Levin, Z., Morris, E.D., Fischman, A.J.,1996. Improved methods for image registration. Neuroimage 3, 10–18.
Andreasen, N.C., Arndt, S.C., Cizadlo, T., O’Leary, D.S., Watkins, G.L.,Boles-Ponto, L.L., Hichwa, R.D., 1996. Sample size and statisticalpower in [15O]H2O studies of human cognition. J. Cereb. Blood FlowMetab. 16, 804–816.
Aston, J.A., Gunn, R.N., Worsley, K.J., Ma, Y., Evans, A.C., Dagher, A.,2000. A statistical method for the analysis of positron emission tomog-raphy neuroreceptor ligand data. Neuroimage 12, 245–256.
Badgaiyan, R.D., Fischman, A.J., Alpert, N.M., 2003. Striatal dopaminerelease during unrewarded motor task in human volunteers. NeuroRe-port 14(8), in press.
Coull, J.T., 1998. Neural correlates of attention and arousal: insights fromelectrophysiology, functional neuroimaging and psychopharmacology.Prog. Neurobiol. 55, 343–361.
Dagher, A., Gunn, R.N., Lockwood, G., Cunningham, V.J., Grasby, P.M.,Brooks, D.J., 1998. Measuring neurotransmitter release with PositronEmission Tomography: methodological issues, in: Carson, R., Daube-Witherspoon, M., Herscovitch, P. (Eds.), Quantitative Functional BrainImaging with Positron Emission Tomography. Academic Press, SanDiego, pp. 449–454.
Endres, C.J., Carson, R.E., 1998. Assessment of dynamic neurotransmitterchanges with bolus or infusion delivery of neuroreceptor ligands.J. Cereb. Blood Flow Metab. 18, 1196–210.
Farde, L., Eriksson, L., Blomquist, G., Halldin, C., 1989. Kinetic analysisof central [11C]Raclopride binding D2dopamine receptors studied byPET—a comparison to the equilibrium analysis. J. Cereb. Blood FlowMetab. 9, 696–708.
Fisher, R.E., Morris, E.D., Alpert, N.M., Fischman, A.J., 1995. In vivoimaging of neuromodulatory synaptic transmission using PET: a re-view of relevant neurophysiology. Hum. Brain Mapp. 3, 24–34.
Friston, K.J., Holmes, A.P., Worsley, K.J., Poline, J.B., Frith, C.D., Frack-owiak, R.S.J., 1995. Statistical parametric maps in functional imaging:a general approach. Hum. Brain Mapp. 2, 189–210.
Friston, K.J., Malizia, A.L., Wilson, S., Cunningham, V.J., Jones, T., Nutt,D.J., 1997. Analysis of dynamic radioligand displacement or “activa-tion” studies. J. Cereb. Blood Flow Metab. 17, 80–93.
Granon, S., Passetti, F., Thomas, K.L., Dalley, J.W., Everitt, B.J., Robbins,T.W., 2000. Enhanced and impaired attentional performance after in-fusion of D1 dopaminergic receptor agents into rat prefrontal cortex.J. Neurosci. 20, 1208–1215.
Greenwald, B.S., Davis, K.L., 1983. Experimental pharmacology of Alz-heimer disease. Adv. Neurol. 38, 87–102.
Gunn, R.N., Lammertsma, A.A., Hume, S.P., Cunningham, V.J., 1997.Parametric imaging of ligand-receptor binding in PET using a simpli-fied reference region model. Neuroimage 6, 279–287.
Hurtig, R.R., Hichwa, R.D., O’leary, D.S., Boles-Ponto, L.L., Narayana,S., Watkins, L., Andreasen, N.C., 1994. The effects of timing andduration of cognitive activation in 15O water PET studies. J. Cereb.Blood Flow Metab. 14, 423–440.
Jaber, M., Robinson, S.W., Missale, C., Caron, M.G., 1996. Dopaminereceptors and brain function. Neuropharmacology 35, 1503–1519.
Jackson, S.R., Marrocco, R., Posner, M.I., 1994. Networks of anatomicalareas controlling visuospatial attention: Models of neurodynamics andbehavior. Neural Networks 7, 925–944.
Jentsch, J.D., Roth, R.H., Taylor, J.R., 2000. Role for dopamine in thebehavioral functions of the prefrontal corticostriatal system: implica-tions for mental disorders and psychotropic drug action. Prog. BrainRes. 126, 433–453.
Jueptner, M., Frith, C.D., Brooks, D.J., Frackowiak, R.S., Passingham,R.E., 1997. Anatomy of motor learning. II. Subcortical structures andlearning by trial and error. J. Neurophysiol. 77, 1325–1337.
Kahkonen, S., Ahveninen, J., Jaaskelainen, I.P., Kaakkola, S., Naatanen,R., Huttunen, J., Pekkonen, E., 2001. Effects of haloperidol on selectiveattention: a combined whole-head MEG and high-resolution EEGstudy. Neuropsychopharmacology 25, 498–504.
Kimberg, D.Y., Aguirre, G.K., Lease, J., D’Esposito, M., 2001. Corticaleffects of bromocriptine, a D-2 dopamine receptor agonist, in humansubjects, revealed by fMRI. Hum. Brain Mapp. 12, 246–257.
Koepp, M.J., Gunn, R.N., Lawrence, A.D., Cunningham, V.J., Dagher, A.,Jones, T., Brooks, D.J., Bench, C.J., Grasby, P.M., 1998. Evidence forstriatal dopamine release during a video game. Nature 393, 266–268.
1059N.M. Alpert et al. / NeuroImage 19 (2003) 1049–1060

Kulisevsky, J., 2000. Role of dopamine in learning and memory: implica-tions for the treatment of cognitive dysfunction in patients with Par-kinson’s disease. Drugs Aging 16, 365–379.
Lammertsma, A.A., Bench, C.J., Hume, S.P., Osman, S., Gunn, K.,Brooks, D.J., Frackowiak, R.S., 1996. Comparison of methods foranalysis of clinical [11C]raclopride studies. J. Cereb. Blood FlowMetab. 16, 42–52.
Lammertsma, A.A., Hume, S.P., 1996. Simplified reference tissue modelfor PET receptor studies. Neuroimage 4, 153–158.
Lawrence, A.D., Weeks, R.A., Brooks, D.J., Andrews, T.C., Watkins,L.H., Harding, A.E., Robbins, T.W., Sahakian, B.J., 1998. The rela-tionship between striatal dopamine receptor binding and cognitiveperformance in Huntington’s disease. Brain 121, 1343–1355.
Morris, E.D., Fisher, R.E., Alpert, N.M., Rauch, S.L., Fischman, A.J.,1995. In vivo imaging of neuromodulation using positron emissiontomography: optimal ligand characteristics and task length for detec-tion of activation. Hum. Brain Mapp. 3, 35–55.
Oak, J.N., Oldenhof, J., Van Tol, H.H., 2000. The dopamine D(4) receptor:one decade of research. Eur.J. Pharmacol. 405, 303–327.
Pappata, S., Dehaene, S., Poline, J.B., Gregoire, M.C., Jobert, A., Delforge,J., Frouin, V., Bottlaender, M., Dolle, F., Di Giamberardino, L., Syrota,A., 2002. In vivo detection of striatal dopamine release during reward:a PET study with [11C]raclopride and a single dynamic scan approach.Neuroimage 16, 1015–1027.
Perry, E., Walker, M., Grace, J., Perry, R., 1999. Acetylcholine in mind: aneurotransmitter correlate of consciousness? Trends Neurosci. 22, 273–280.
Robbins, T.W., 2000. Chemical neuromodulation of frontal-executivefunctions in humans and other animals. Exp. Brain Res. 133, 130 –138.
Robbins, T.W., McAlonan, G., Muir, J.L., Everitt, B.J., 1997. Cognitiveenhancers in theory and practice: studies of the cholinergic hypothesisof cognitive deficits in Alzheimer’s disease. Behav. Brain Res. 83,15–23.
Searle, S.R., 1971. Linear Models. John Wiley & Sons, New York.Witte, E.A., Marrocco, R.T., 1997. Alteration of brain noradrenergic ac-
tivity in rhesus monkeys affects the alerting component of covertorienting. Psychopharmacology (Berl.) 132, 315–323.
1060 N.M. Alpert et al. / NeuroImage 19 (2003) 1049–1060