Mother-young relationships in captive ungulates: variability and clustering
Upload
independentCategory
view
2download
0
Genetic identification of endangered North African ungulatesusing noninvasive sampling
TERESA LU�ISA SILVA,*†‡ RAQUEL GODINHO,*† DIANA CASTRO,* TERESA AB �AIGAR,‡
JOS�E CARLOS BRITO*† and PAULO C �ELIO ALVES*†§
*CIBIO/InBIO, Centro de Investigac�~ao em Biodiversidade e Recursos Gen�eticos, Universidade do Porto, Campus de Vair~ao, Vair~ao
4485-661, Portugal, †Departamento de Biologia, Faculdade de Ciencias, Universidade do Porto, Rua do Campo Alegre s/n, Porto
4169-007, Portugal, ‡Estaci�on Experimental de Zonas �Aridas (EEZA), CSIC, Carretera de Sacramento s/n, Almer�ıa, Spain,
§Wildlife Biology Program, University of Montana, Missoula, MT 59812, USA
Abstract
North African ungulates include several threatened and emblematic species, yet are poorly studied mainly due to
their remoteness and elusiveness. Noninvasive sampling provides a useful approach to obtain ecological and genetic
information essential to guide conservation actions. The very first and most important step in conservation planning
is to accurately identify species, and molecular genetics has been proved to be a useful tool. Several molecular genet-
ics protocols are available for species identification, even for samples with poor quality DNA, such as faeces, hairs or
bones. Most of these protocols use mitochondrial DNA for barcoding despite this marker being especially prone to
problems, including mtDNA introgression, nuclear insert copies, high intraspecific diversity or heteroplasmy. In this
work, we developed a molecular method based on polymorphisms in small fragments of the mitochondrial cyto-
chrome b (cytb, mtDNA) and the nuclear kappa casein genes (KCAS, nDNA) for identifying endangered North
African ungulates. These fragments revealed polymorphisms, including species-specific variation, which allowed
species identification of nine ungulate species that co-occur in North Africa. The method was validated across more
than 400 samples, including different types of noninvasive samples collected in the field. The simplicity, high reli-
ability and relative low cost of the described method make it a promising tool to improve ecological studies of the
North African ungulates and consequently, the implementation of more efficient management and conservation
plans for these endangered ungulates.
Keywords: conservation genetics, cytochrome b, deserts, gazelles, kappa casein, molecular method, species ID
Received 8 March 2014; revision received 19 September 2014; accepted 22 September 2014
Introduction
Accurate species identification is an essential tool in
many disciplines, including conservation biology, ecol-
ogy and forensics sciences (Long et al. 2008; Steele &
Pires 2011). For elusive, rare and/or endangered species
the use of noninvasive genetic sampling is particularly
relevant, as it allows important data collection from the
simple use of hairs, faeces, urine, skulls, egg shells, feath-
ers, among others, avoiding the capture, handling or
even the observation of individuals (Beja-Pereira et al.
2009; Lampa et al. 2013). The molecular identification of
species through the use of noninvasive sampling is rela-
tively recent (Waits & Paetkau 2005) and has contributed
in the last decade to the study of elusive or rare species
(Van Vliet et al. 2008; Beja-Pereira et al. 2009; Oliveira
et al. 2009; Chaves et al. 2012; Godinho et al. 2012;
Barbosa et al. 2013; Monterroso et al. 2013), mainly due
to the powerful technical advances in areas such as DNA
extraction, sequencing, microsatellite analysis and SNPs
development, which expanded the use of molecular
methods in conservation (DeSalle & Amato 2004; Beja-
Pereira et al. 2009).
In the last decade, the concept of DNA barcoding has
profoundly increased the molecular identification of spe-
cies (Floyd et al. 2002; Hebert et al. 2004) and barcoding
initiatives highly accelerated biodiversity assessments
(Smith et al. 2005; Hajibabaei et al. 2007). The idea behind
the barcoding concept was to select a universally recog-
nized gene for identification of most, if not all, organisms
on Earth. This gene, or few genes, would show high
interspecific but low intraspecific levels of variation thus
establishing a barcoding gap (Hebert et al. 2003). TheCorrespondence: Teresa Lu�ısa Silva, Fax: 351 252661780;
E-mail: [email protected]
© 2014 John Wiley & Sons Ltd
Molecular Ecology Resources (2014) doi: 10.1111/1755-0998.12335
sequences of such gene(s) could then become the equiva-
lent of species-specific barcodes, providing a data set
representative of Earth’s biodiversity. The mitochondrial
gene cytochrome c oxidase I (COI) is the most popular
marker for a global identification system for animals, as
it has been proved to be useful for identifying many dif-
ferent organisms, from insects to fishes and birds (e.g.
Hebert et al. 2004; Vila & Bj€orklund 2004). However, this
gene is still not the most used for several taxa, and in
these cases, few or no data are available in public data-
bases, as for the North African ungulates. On the other
hand, cytochrome b (cytb) is a widely used mtDNA gene
for phylogenetic studies and species assignment (e.g.
Hassanin et al. 1998; Fernandes et al. 2007; Chaves et al.
2012; Barbosa et al. 2013; D’Amato et al. 2013; Fadakar
et al. 2013). Despite its usefulness, mtDNA is especially
prone to problems due to the occurrence of nuclear
inserted copies, high intraspecific diversity, introgression
or heteroplasmy (Alves et al. 2008; Song et al. 2008; White
et al. 2008; Galtier et al. 2009), and thus species identifica-
tion should be enhanced by the complementary use of a
nuclear gene. Additionally, the inclusion of nuclear
markers can complement mitochondrial data by allow-
ing the detection of incomplete lineage sorting, mito-
chondrial introgression and hybridization (Heckman
et al. 2007; Godinho et al. 2011; Melo-Ferreira et al. 2012).
North African ungulates, and in general highly
mobile mammals in this region, are poorly studied
mainly because of the remoteness and political instability
of the region, added to the difficulty of observing or/and
capturing these species (Brito et al. 2014). Eight wild
North African ungulate species are categorized as threa-
tened on IUCN, Red Lists (www.iucnredlist.org): Gazella
dorcas, Ammotragus lervia and Eudorcas rufifrons as ‘Vul-
nerable’; G. cuvieri and G. leptoceros as ‘Endangered’;
Nanger dama, and Addax nasomaculatus as ‘Critically
Endangered’; and Oryx dammah is now considered
‘Extinct in the Wild’. To preserve North African ungu-
lates, both in situ and ex situ conservation programmes
(including re-introduction efforts), have been carried out
in several research programmes and zoological institu-
tions (for details see the Sahelo-Saharan Interest Group
annual reports: www.scf.org). In addition, semi-captive
wild populations are kept to reinforce remnant wild pop-
ulations in several countries, including Morocco, Algeria,
Tunisia and Senegal (Ab�aigar et al. 1997; Aulagnier et al.
2001; De Smet & Smith 2001; Smith et al. 2001).
Knowledge of the geographical distribution and pop-
ulation abundance of wild ungulates in North Africa is
crucial to improve their management and long-term con-
servation programmes, especially given the growing
hunting pressure observed in this region (Brito et al.
2014; Durant et al. 2014). However, the identification of
wild ungulates species has been made primarily on the
basis of field identifications of footprints, latrines, tracks
and faeces (Attum et al. 2006; Wronski & Plath 2010; At-
tum & Mahmoud 2012; Ab�aigar et al. 2013), which may
lead to identification errors when species occur in symp-
atry due to high similarity in both diet and body size
(mainly when considering juveniles). For example,
doubts may arrive for distinguishing faeces from G. dor-
cas and G. leptoceros, or from G. cuvieri and A. lervia, par-
ticularly when including juveniles of the latter species-
pair. Additionally, domestic ungulates (namely goat and
sheep) are often present in sympatry in many areas,
which hampers species identification, and consequently
increases errors. Early studies demonstrated the useful-
ness of using the cytochrome b gene for distinguishing
the lineages or subspecies within Gazella species (Reb-
holz & Harley 1999; Wacher et al. 2010; Wronski et al.
2010; Lerp et al. 2011; Godinho et al. 2012; Fadakar et al.
2013), suggesting therefore that this gene is a good candi-
date molecular marker for barcoding these species. On
the other hand, the kappa casein (KCAS) gene was suc-
cessfully used in phylogenetic studies of Antilopini
(Bovidae) species (Matthee & Davis 2001; B€armann et al.
2013a), highlighting the potential of this gene for the
molecular identification of antelopes.
Here, we developed a simple molecular method to
identify the endangered ungulate species present in
North Africa and to discriminate these species from their
domestic forms that inhabit the same areas. By improv-
ing the knowledge on these species, we believe that the
proposed molecular method can enhance the general
understanding of North Africa biodiversity (Brito et al.
2014). We selected a mitochondrial (cytb) and a nuclear
(KCAS) gene to find diagnostic positions within each
gene to enable species identification. Because DNA
recovered from noninvasive samples is highly frag-
mented, we selected only physically close variant posi-
tions, to maximize its successful application in
noninvasive samples. Finally, we evaluated the existence
of a barcoding gap and identify potential genetic variants
within the species.
Materials and methods
Study area and sample collection
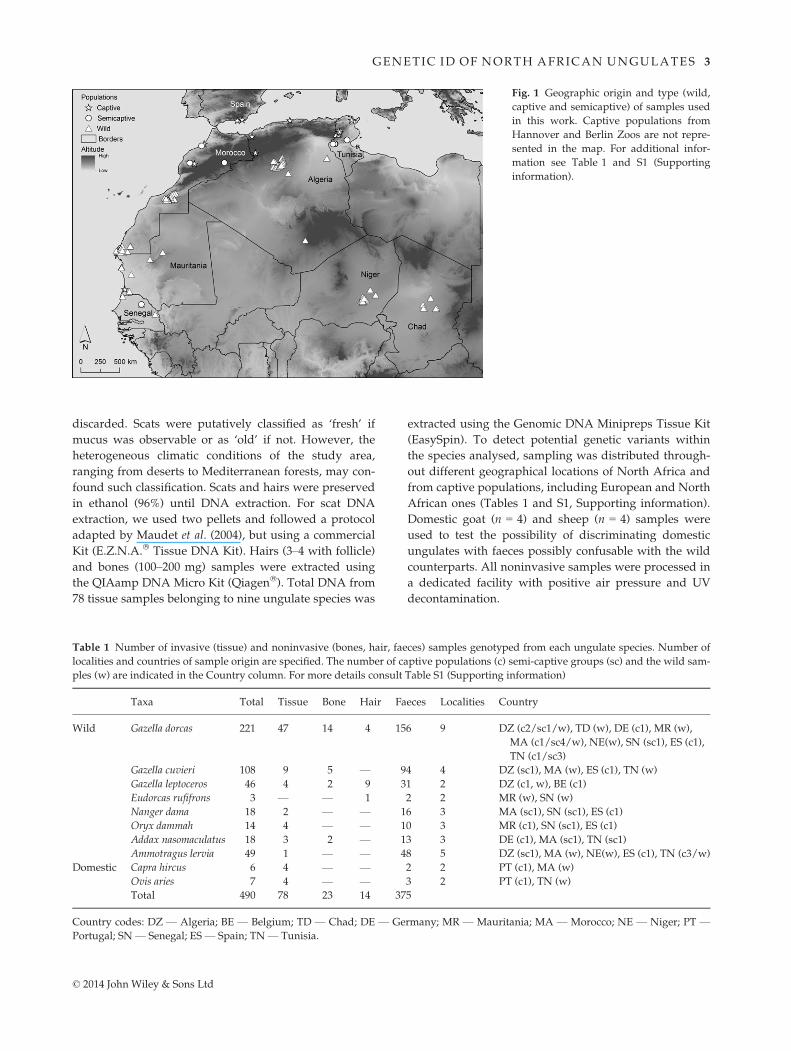
A total of 456 noninvasive samples, comprising 415 scats
(both fresh and old), 15 hairs (collected directly from car-
casses) and 26 bones (collected in the field, undeter-
mined age) of ten species and known geographic origin
encompassing seven North African countries (Fig. 1 and
Table 1) were subjected to total DNA extraction. All scat
samples were of at least four pellets per pile; each pile
consisted of pellets produced presumably by a unique
individual at once. Scats scattered by the wind were
© 2014 John Wiley & Sons Ltd
2 T . L . S ILVA ET AL .
discarded. Scats were putatively classified as ‘fresh’ if
mucus was observable or as ‘old’ if not. However, the
heterogeneous climatic conditions of the study area,
ranging from deserts to Mediterranean forests, may con-
found such classification. Scats and hairs were preserved
in ethanol (96%) until DNA extraction. For scat DNA
extraction, we used two pellets and followed a protocol
adapted by Maudet et al. (2004), but using a commercial
Kit (E.Z.N.A.� Tissue DNA Kit). Hairs (3–4 with follicle)
and bones (100–200 mg) samples were extracted using
the QIAamp DNA Micro Kit (Qiagen�). Total DNA from
78 tissue samples belonging to nine ungulate species was
extracted using the Genomic DNA Minipreps Tissue Kit
(EasySpin). To detect potential genetic variants within
the species analysed, sampling was distributed through-
out different geographical locations of North Africa and
from captive populations, including European and North
African ones (Tables 1 and S1, Supporting information).
Domestic goat (n = 4) and sheep (n = 4) samples were
used to test the possibility of discriminating domestic
ungulates with faeces possibly confusable with the wild
counterparts. All noninvasive samples were processed in
a dedicated facility with positive air pressure and UV
decontamination.
Table 1 Number of invasive (tissue) and noninvasive (bones, hair, faeces) samples genotyped from each ungulate species. Number of
localities and countries of sample origin are specified. The number of captive populations (c) semi-captive groups (sc) and the wild sam-
ples (w) are indicated in the Country column. For more details consult Table S1 (Supporting information)
Taxa Total Tissue Bone Hair Faeces Localities Country
Wild Gazella dorcas 221 47 14 4 156 9 DZ (c2/sc1/w), TD (w), DE (c1), MR (w),
MA (c1/sc4/w), NE(w), SN (sc1), ES (c1),
TN (c1/sc3)
Gazella cuvieri 108 9 5 — 94 4 DZ (sc1), MA (w), ES (c1), TN (w)
Gazella leptoceros 46 4 2 9 31 2 DZ (c1, w), BE (c1)
Eudorcas rufifrons 3 — — 1 2 2 MR (w), SN (w)
Nanger dama 18 2 — — 16 3 MA (sc1), SN (sc1), ES (c1)
Oryx dammah 14 4 — — 10 3 MR (c1), SN (sc1), ES (c1)
Addax nasomaculatus 18 3 2 — 13 3 DE (c1), MA (sc1), TN (sc1)
Ammotragus lervia 49 1 — — 48 5 DZ (sc1), MA (w), NE(w), ES (c1), TN (c3/w)
Domestic Capra hircus 6 4 — — 2 2 PT (c1), MA (w)
Ovis aries 7 4 — — 3 2 PT (c1), TN (w)
Total 490 78 23 14 375
Country codes: DZ — Algeria; BE — Belgium; TD — Chad; DE — Germany; MR — Mauritania; MA — Morocco; NE — Niger; PT —Portugal; SN — Senegal; ES — Spain; TN — Tunisia.
Fig. 1 Geographic origin and type (wild,
captive and semicaptive) of samples used
in this work. Captive populations from
Hannover and Berlin Zoos are not repre-
sented in the map. For additional infor-
mation see Table 1 and S1 (Supporting
information).
© 2014 John Wiley & Sons Ltd
GENETIC ID OF NORTH AFRICAN UNGULATES 3

Molecular analysis
Two genes were selected for species identification: the
mitochondrial cytochrome b (cytb) and the nuclear
kappa casein (KCAS). A small fragment (450 bp) of the
cytb gene was amplified using universal primers L14724
(50-TGACTAATGATAGAAAAACCATCGTTG; Irwin
et al. 1991; modified by Lerp et al. 2011) and H15149
(50-TAACTGTTGCTCCTCAAAAAGATATTTGTCCTCA;
Kocher et al. 1989). A fragment comprising part of the
exon 4 of the KCAS gene (367 bp) was amplified using
primers targeting conserved regions among Bovidae spe-
cies (Matthee et al. 2001): KCAS_E (50-GTGGAAGGAAG
ATGTACAAATC), and KCAS_D (50-CTAACTGCAA
CTGGCTTTGCATA). Amplifications were performed in
a final volume of 10 lL using 5 lL of QIAGEN PCR
MasterMix [consisting of QIAGEN Multiplex PCR buffer
with a final concentration of 3 mM MgCl2, dNTP mix, Q
solution and HotStart Taq DNA polymerase (QIAGEN,
Valencia, CA)], 0.2 lM of each primer and 2 lL of DNA
extract (approximately 10 ng of genomic DNA). The
thermocycling for both PCRs was performed in a MyCy-
cler (BIO-RAD) and carried out with a first denaturation
step at 95 °C for 15 min, followed by 45 cycles at 95 °Cfor 30 s, 56 °C for 30 s, 72 °C for 30 s and then a final
extension step at 60 °C for 10 min. PCR amplifications of
both fragments were obtained for all target ungulate spe-
cies. The highest annealing temperature for both frag-
ments, without compromising amplification yield, was
selected to reduce unwanted PCR products and maxi-
mize specificity (56 °C), although lower temperatures
may be used to facilitate amplification of poorer quality
samples (55–51 °C; e.g. bones).Pre- and post-PCR manipulations were conducted in
physically separated rooms, always including negative
controls, that allowed confirming absence of contamina-
tions. PCR products were purified using ExoSAP-IT�
PCR clean-up Kit (GE Healthcare, Piscataway, NJ, USA).
Both strand sequences were generated using the amplifi-
cation primers, as it is recommended for example, by
Tiedemann et al. (2012), allowing the confirmation of
sequence consistency and quality. Cycle sequencing reac-
tions were carried out using BIGDYE�
TERMINATOR v3.1
Cycle Sequencing Kit (Applied Biosystems, Carlsbad,
CA, USA). Sequencing products were subsequently sepa-
rated on a 3130xl Genetic Analyser (Applied Biosys-
tems). Sequence alignment was performed using Clustal
W (Thompson et al. 1994) implemented in BIOEDIT soft-
ware (Hall 1999) and was manually checked and reas-
sessed for any discrepancy. Additionally, published
sequences of the ten species were included in the align-
ment (see Table S2, Supporting information). All new
sequences were submitted to NCBI GenBank (Access-
sions KM582053–KM582129).
Consensus haplotypes for each species were aligned
for both cytb and KCAS fragments, using new and avail-
able GenBank sequences. Species-specific polymor-
phisms were identified manually.
Bayesian inference was used for both cytb and KCAS
to build phylogenetic trees and determine species
boundaries. The best-fit model of sequence evolution for
each locus alignment was selected based on the Akaike
information criterion and using the software JMODELTEST
version 1.0 (Posada 2008). Haplotype trees were gener-
ated by the software MRBAYES 3.1 (Huelsenbeck &
Ronquist 2001) at the Bioportal web-based portal
(www.bioportal.uio.no), using the mouse deer (Tragulus
napu) as outgroup for the cytb tree and klipspringer
(Oreotragus oreotragus) for the concatenated tree. Bayes-
ian posterior probabilities were estimated from two runs
with four chains of 10 million generations, with a
sampling frequency that provided a total of 10 000
samples for each run, excluding 25% burn-in. Tree visu-
alization was conducted using the software FIGTREE 1.3.1
(Rambaut 2009).
Intraspecific and interspecific mean pairwise genetic
divergences were calculated for both loci employing
Tamura 3 parameter model-T92 (Tamura 1992) distances
using MEGA 5 (Tamura et al. 2011). On the basis of these
divergence estimates, histograms were built for each spe-
cies independently, to test for the existence of a barcod-
ing gap between intra- and interspecific genetic
divergence (Hebert et al. 2003). The extent of divergence
was further evaluated using a second graphical analysis
of pairwise divergence, which compares the mean and
maximum intraspecific divergence of each taxon with
the mean and the minimum interspecific divergence of
that taxon with the remaining species. We used the Pois-
son Tree Processes (PTP) model to delimit species on a
rooted phylogenetic tree (Zhang et al. 2013). In PTP, spe-
ciation or branching events are modelled in terms of
number of substitutions (represented by branch lengths),
estimating species clusters using a phylogenetic tree as
input. PTP program assumes that each nucleotide substi-
tution has a fixed probability of being the basis for a spe-
ciation event. We used PTP test to assess, in parallel to
histograms for each species independently, the existence
of a barcoding gap between intra- and interspecific
genetic divergence. Analyses were conducted on the web
server for PTP (Zhang 2013-2014) using phylogenetic
trees obtained with MrBayes 3.1 (Huelsenbeck &
Ronquist 2001).
Results
All tissue samples (78) and 412 (90.4%) out of 456
(90.4%) noninvasive samples were successfully ampli-
fied for the mitochondrial fragment (cytb). High
© 2014 John Wiley & Sons Ltd
4 T . L . S ILVA ET AL .

success rates were achieved for the three types of
noninvasive samples tested: bones (88.5%), hairs
(93.3%) and scats (90.4%). Ultimately, a fragment of
450 base pairs of the cytb gene was analysed in 571
sequences from eight wild and two domestic ungu-
lates species, including 81 sequences from GenBank.
The first position of the alignment corresponds to
position 14 515 in Bos taurus, complete mitochondrial
genome, Accession no. NC_006853 (Table S3, Support-
ing information). These sequences resulted in 131 dif-
ferent haplotypes with 161 variable sites, of which
28.51% are parsimony informative.
The Bayesian tree inference for cytb was performed
using the GTR + I + G model: the general time-revers-
ible substitution model with a proportion of invariable
sites and a gamma-distributed rate variation across sites.
The tree recovered nine species of ungulates (Fig. 2)
with posterior probabilities ≥0.85, with the exception
of Gazella cuvieri and G. leptoceros, which formed a mono-
phyletic group (posterior probability of 1). Therefore, in
the following analyses, these two species were treated as
a single taxon (GC_GL: Gazella cuvieri and G. leptoceros,
respectively).
Intraspecific variability did not overlap with the inter-
specific variability (Fig. 3A), proving the existence of a
barcoding gap. The intraspecific values varied from zero
(Addax nasomaculatus and Oryx dammah do not present
intraspecific divergence) to 4.8% (Eudorcas rufifrons). The
maximum interspecific divergence was observed in Ca-
pra sp (21.9%) and the minimum in Gazella dorcas (5.2%).
Even with the small divergence difference of 0.4%
between the highest intraspecific divergence and the
lowest interspecific, the barcoding gap is observed in all
taxa (Fig. 3B).
For the nuclear fragment, all tissue samples and 359
out of 456 (78.7%) noninvasive samples were success-
fully amplified. High success rates were achieved for the
three types of noninvasive samples used: bones (60.0%),
hairs (69.2%) and scats (80.0%). A fragment of 367 bp of
the KCAS gene was analysed on 444 samples across eight
wild and two domestic ungulates present in North
Africa (the first position of our sequences correspond to
position 12 366 in Bos taurus kappa casein (CSN3) gene,
CSN3-A allele, complete coding sequence; Accession no.
AY380228). Sequence assemblage of our data together
with seven sequences from GenBank showed a total of
14 of 23 polymorphic sites exhibiting potential
interspecific diagnostic polymorphisms (Table 2) and
representing a total of nine different haplotypes. This
diversity corresponds to 7.33% parsimony informative
sites. Gazella cuvieri and Gazella leptoceros (GC and GL,
respectively) did not show any distinctive position for
the KCAS region analysed. No overlap between intraspe-
cific and interspecific KCAS divergences was observed
(Fig. 4A), nor intraspecific divergence for any species.
Moreover, a barcoding gap was exhibited in all taxa
(Fig. 4B). The values of interspecific divergences between
species pairs ranged from 0.3% (Addax nasomaculatus and
Oryx dammah) to 4.3% (Ammotragus lervia and Eudorcas
rufifrons). Ammotragus lervia showed the highest mean
interspecific divergence.
Both mitochondrial and nuclear markers were useful
for identifying and differentiating the studied species.
The levels of genetic divergence for the cytb gene were
generally higher than those observed for KCAS (Figs 3
and 4), and a barcoding gap was observed between the
intraspecific and the interspecific divergences in both
molecular markers. Cytb and KCAS sequences produced
in this study were combined in order to improve the res-
olution of the phylogenetic trees and therefore to better
detect intra- and interspecific variations (Fig. S1, Sup-
porting information). Together with histograms for each
species independently, the PTP method was able to dis-
criminate species regardless of the amount of sequence
similarity between the species under comparison. The
trees submitted to the species delimitation server con-
firmed the nine species identified, for both cytb and com-
bined cytb/KCAS.
Discussion
In the last decade, DNA techniques have proved
common, inexpensive, rapid and accurate means for
identifying species and assessing biodiversity (Darling &
Blum 2007). These techniques have allowed or improved
many studies concerning wildlife conservation, ecology
and animal forensics. Despite the threatened status of
North African ungulates, no DNA-based protocol allow-
ing the unequivocal identification of these species was
available to date, especially concerning the application to
noninvasive sampling. Our relatively inexpensive, easy
and quick molecular method fills this gap, being useful
for distinguishing several ungulate species, both wild
and domestic, cohabiting in North Africa. Concomi-
tantly, this method has several potential advantages:
(i) samples (invasive or noninvasive) can be analysed
without any prior assumptions based on morphologic
identifications; (ii) it overcomes problems associated
with the single use of mitochondrial DNA to species
identification because it relies on a co-amplification
of a nuclear fragment; (iii) it can be directly applied to
noninvasive samples.
The selected fragments exhibited high amplification
success rates (around 90% and 80% for mtDNA and
nDNA, respectively) in agreement with what is generally
described for noninvasive samples, in particular to herbi-
vores (Maudet et al. 2004; Luikart et al. 2008). The main
factor that limits such success is the age of the sample, as
© 2014 John Wiley & Sons Ltd
GENETIC ID OF NORTH AFRICAN UNGULATES 5

DNA is easier to amplify in fresher samples (DeMay
et al. 2013), although relationships between diet and
amplification success in herbivores has also been
observed (Wehausen et al. 2004). In our study, diet was
not monitored but the fresh scats collected in captivity
had a 100% successful extraction rate, while scats col-
lected in the field had lower rates, which could be related
to the freshness at the moment of sample collection.
Thus, to maximize amplification success across samples,
irrespective of freshness, we used 45 PCR cycles. The
few field samples that did not amplify most likely were
old or contained inhibitors that affected PCRs (DeMay
et al. 2013).
Both selected fragments show high variability among
species allowing the identification of all North African
endangered ungulate species. Despite not being com-
monly used for barcoding purposes, the chosen molecu-
lar markers are widely used for species assignment,
especially the mitochondrial cytb. Although our frag-
ments were longer than the recommended size for
noninvasive genetic samples (300 bp; Waits & Paetkau
2005), the amplified fragments are not excessively long,
indeed having a size similar to the barcoding fragments
(Maudet et al. 2004; Harris et al. 2010; Adams et al. 2011;
Kekkonen & Hebert 2014). Additionally, a longer size
fragment allows a better resolution of the phylogenies
and increases the ability to distinguish intra- and inter-
specific variations. In our study, the proposed methodol-
ogy was able to highlight some uncertainties on the
systematics within Gazella genus, for instance, no diag-
nostic positions between G. cuvieri and G. leptoceros were
found, further supporting these species as a monophy-
letic group (Rebholz & Harley 1999; Wacher et al. 2010;
Wronski et al. 2010; Lerp et al. 2011). The lack of genetic
differentiation between these two species emphasizes the
need for further studies based on additional nuclear
markers to clarify their phylogeny and systematics.
As expected, the intraspecific variability found in this
study was higher for the mitochondrial cytb than for the
nuclear KCAS locus, for which no intraspecific variabil-
ity was found (Figs 3 and 4, Tables 2 and Fig. S1, Sup-
porting information). The haplotype diversity for each
Fig. 2 Bayesian inference tree for the cytb
fragment showing the phylogenetic rela-
tionship of all endangered North African
ungulates and the domestic species. Pos-
terior probabilities of major nodes are
indicated. Tragulus napu was used as out-
group.
© 2014 John Wiley & Sons Ltd
6 T . L . S ILVA ET AL .

species, as well as the interspecific divergence, was
always lower for the KCAS locus. However, the genetic
information retrieved from this locus was useful to dis-
tinguish the eight endangered ungulate species,
including congeneric species of the Gazella genus, which
validates its ability as a barcoding marker for species
delimitation (Havermans et al. 2011). A barcoding gap
was detected for all species in both genes, although more
pronounced for cytb than for KCAS (Figs 3B and 4B).
Both histograms for each independent species and the
Poisson Tree Processes model were able to distinguish
intra and interspecific differences. However, the short
fragment of the KCAS locus revealed higher interspecific
diagnostic polymorphism. The threshold for species
delimitation using the cytb was about 3%, which is
0
5000
10 000
15 000
20 000
25 000
00.
81.
62.
43.
2 44.
85.
66.
47.
2 88.
89.
610
.411
.2 1212
.813
.614
.415
.2 1616
.817
.618
.419
.2 2020
.821
.622
.423
.2 24
Freq
uenc
y
% divergence
IntraspecificInterspecific
0
2
4
6
8
10
12
14
16
18
20
GD GC_GL ER ND Addax Oryx AL CP OV
% d
iver
genc
e
Max Intra
Mean_Intra
Mean_Inter
Min_Inter
(A)
(B)
Fig. 3 (A) Histogram of T92 (Tamura 3-parameter model) cytb
divergence values (intraspecific and interspecific), for eight wild
and two domestic North African ungulates. (B) Summary of
pairwise divergences involving sequences of each species show-
ing mean (circle) and maximum (square) intraspecific diver-
gences and mean (triangle) and minimum (dash) interspecific
divergences (comparing sequence from the named species with
other species). Grey bars characterize the extent of the barcoding
gap. GD: Gazella dorcas; GC_GL: Gazella cuvieri and Gazella leptoc-
eros group ER: Eudorcas rufifrons; ND: Nanger dama; Addax:
Addax nasomaculatus; Oryx: Oryx dammah; AL: Ammotragus lervia;
CP: Capra sp; OV: Ovis sp. Given the unresolved separation
between Gazella cuvieri and Gazella leptoceros these taxa were
combined and are referred to as GC_GL.
Tab
le2
Interspecificpolymorphicpositionsofa367-bpfrag
men
toftheKCASgen
ein
endan
gered
ungulatessp
eciesofNorthAfrica.
First
positioncorrespondsto
position12
366of
Bos
tauruskap
pacasein
(CSN3)
gen
e,CSN3-A
allele,complete
cds(A
ccessionno.AY380228).Boxes
representsp
ecies-sp
ecificnucleo
tidevariations.Points
representsimilar
positions
anddashes
representindels
Tax
a/Position
5479
90105
108
128
134
137
140
144
161
181
200
204
221
235
243
252
258
259
332
345
362
Gazelladorcas
GC
GG
TA
AA
AT
TT
TG
CG
GT
AA
CG
T
Gazellacuvieri
..
..
..
..
..
..
.A
..
A.
..
..
.
Gazellaleptoceros
..
..
..
..
..
..
.A
..
A.
..
..
.
Eudorcas
rufifrons
..
..
..
..
..
..
.A
..
..
.G
.T
.
Nangerdama
..
..
..
.G
..
..
.A
..
..
..
..
.
Oryxdammah
AA
.A
C.
G.
GC
..
.A
.T
.G
..
..
.
Addax
nasom
aculatus
.A
.A
C.
G.
GC
..
.A
YT
.G
..
..
.
Ammotragu
slervia
.A
AA
CG
G.
GC
CC
.A
..
..
R.
..
C
Capra
sp.
A.
AC
.G
.G
C.
.C
A.
..
.G
.T
..
Ovissp
.A
.A
C.
G.
GC
..
–A
..
..
G.
..
.
© 2014 John Wiley & Sons Ltd
GENETIC ID OF NORTH AFRICAN UNGULATES 7

consistent with the maximum limit of intraspecific varia-
tion detected for the mitochondrial COI in mammals, the
gene commonly used for DNA barcoding studies (Luo
et al. 2011).
The use of single primer pairs for each gene covering
all ungulate species is a major advantage for species
identification, both concerning laboratory costs and time-
consuming processes. Other methods could be used for
species identification, based on next-generation sequenc-
ing technology (NGS) or in the development of specific
primers for each species under analysis (Adams et al.
2011). However, despite the ability of these methods to
provide huge amounts of data and specificity for species
identification, NGS requires the processing of a large
number of samples to be cost-efficient and the use of spe-
cific primers would have increased costs. Therefore, sin-
gle primer pair sequencing is a balanced choice,
providing additional information for phylogenetic and
population studies and allowing for prompt conserva-
tion measures.
The number of North African ungulate samples used
in the present study provides the largest set of sequences
(nuclear and mitochondrial) currently available. Large
sequence databases are essential to assure accurate
genetic species identification (Darling & Blum 2007). The
described methodology will assist for ecological and
population genetic studies using noninvasive samples of
endangered ungulates in this region, where ascertaining
the species identification is crucial. In addition, the frag-
ment size of both genes tested in this study can be
directly applicable in the high throughput sequencing
technologies, which allows other possibilities of analysis,
for instance, the simultaneous determination of species
and diet using scats (Shehzad et al. 2012). Our work
reveals, foremost, that we have now a new set of tools
amenable for ungulate identification, a pertinent issue
given the conservation concern of several species in
North Africa. The reported method is therefore useful
for biodiversity conservation in North Africa and the
management of ungulates in the region and elsewhere.
Acknowledgements
We thank to JM Gil-Sanch�ez, A Fellous, H Fernand�ez (Barcelona
Zoo), M Kummrow (Hannover Zoo), J Layana, C Mart�ınez, J
Newby, M Papies (Antwerp Zoo), M Petretto, T Rabeil, AJ
Rodr�ıguez, JM Valderrama and T Wacher for generously pro-
viding us with samples. We thank the Director of Estaci�on
Experimental de Zonas �Aridas (EEZA, CSIC, Almer�ıa, Spain) for
the permit to access animals in the ‘la hoya’ Field Station, as well
as to the technical staff in ‘la hoya’ and J Benzal, curator of the
EEZA collection, for providing samples. We acknowledge S
Mour~ao for laboratory support, and S Barbosa, S Ferreira, and J
Paup�erio for support with analysis and figures editing. We
thank F �Alvares, A Ara�ujo, Z Boraty�nski, JC Campos, M Feriche,
DV Gonc�alves, F Mart�ınez-Freir�ıa, J Pleguezuelos, X Santos, AS
Sow, CG Vale, Dr. K Zahzah and M. Jamel for sample collection.
This study was partially supported by FCT-Fundac�~ao para a
Ciencia e a Tecnologia (PTDC/BIA-BEC/099934/2008) through
EU Programme COMPETE. TL Silva, RG and JCB are supported
by FCT (SFRH/BD/73680/2010, IF/564/2012 and IF/459/2013,
respectively). We thank University of Oslo Bioportal for provid-
ing a platform for running the statistical software MRBAYES v3.1.
Logistic support for fieldwork was given by Pedro Santos Lda
(Trimble GPS), Off Road Power Shop, P.N. Banc d’Arguin (Mau-
ritania), Minist�ere D�el�egu�e aupr�es du Premier Ministre Charg�e
de l’Environnement et du D�eveloppement durable of Maurita-
nia and Direction General des Forest (Agriculture Ministry,
Tunisia).
References
Ab�aigar T, Cano M, Espeso G, Ortiz J (1997) Introduction of Mhorr
gazelle Gazella dama mhorr in Bou-Hedma National Park, Tunisia. The
International Zoo Yearbook, 35, 311–316.
Ab�aigar T, Cano M, Ensenyat C (2013) Habitat preference of reintroduced
dorcas gazelles (Gazella dorcas neglecta) in North Ferlo, Senegal. Journal
of Arid Environments, 97, 176–181.
Adams JR, Goldberg CS, Bosworth WR, Rachlow JL, Waits LP (2011)
Rapid species identification of pygmy rabbits (Brachylagus idahoensis)
from faecal pellet DNA. Molecular Ecology Resources, 11, 808–812.
0
0.5
1
1.5
2
2.5
3
3.5
4
GD GC_GL ER ND Addax Oryx AL CP OV
% d
iver
genc
e
Taxa
Max Intra
Mean_Intra
Mean_Inter
Min_Inter
0
200
400
600
800
1000
1200
0 0.4 0.8 1.2 1.6 2 2.4 2.8 3.2 3.6 4 4.4 4.8 5.2
Freq
uenc
y
% divergence
IntraspecificInterspecific
(A)
(B)
Fig. 4 (A) Histogram of T92 (Tamura 3-parameter model)
KCAS divergence values (intraspecific and interspecific), for
eight wild and two domestic North African ungulates. (B) Sum-
mary of pairwise divergences involving sequences of each spe-
cies showing mean (circle) and maximum (square) intraspecific
divergences and mean (triangle) and minimum (dash) interspe-
cific divergences. Grey bars characterize the extent of the bar-
coding gap. GD: Gazella dorcas; GC_GL: Gazella cuvieri and
Gazella leptoceros group; ER: Eudorcas rufifrons; ND: Nanger dama;
Addax: Addax nasomaculatus; Oryx: Oryx dammah; AL: Ammotra-
gus lervia; CP: Capra sp; OV: Ovis sp Given the unresolved sepa-
ration between Gazella cuvieri and Gazella leptoceros these taxa
were combined and are referred to as GC_GL.
© 2014 John Wiley & Sons Ltd
8 T . L . S ILVA ET AL .

Alves PC, Melo-Ferreira J, Freitas H, Boursot P (2008) The ubiquitous
mountain hare mitochondria: multiple introgressive hybridization in
hares, genus Lepus. Philosophical Transactions of the Royal Society of Lon-
don. Series B, Biological Sciences, 363, 2831–2839.
Attum O, Mahmoud T (2012) Dorcas gazelle and livestock use of trees
according to size in a hyper-arid landscape. Journal of Arid Environ-
ments, 76, 49–53.
Attum O, Eason P, Wakefield S (2006) Conservation implications of mid-
den selection and use in an endangered gazelle (Gazella gazella). Journal
of Zoology, 268, 255–260.
Aulagnier S, Cuzin F, Th�evenot M, Loggers C (2001) Morocco. Chapter 3.
In: Antelopes. Part 4: North Africa, the Middle East and Asia. Global Survey
and Regional Action Plans. ASS Antelope Specialist Group (eds Mallon DP
& Kingswood SC (compilers)), pp. 13–21. IUCN, Gland, Switzerland
and Cambridge, UK
Barbosa S, Paup�erio J, Searle JB, Alves PC (2013) Genetic identification of
Iberian rodent species using both mitochondrial and nuclear loci:
application to noninvasive sampling. Molecular Ecology Resources, 13,
43–56.
B€armann EV, R€ossner GE, W€orheide G (2013a) A revised phylogeny of
Antilopini (Bovidae, Artiodactyla) using combined mitochondrial and
nuclear genes. Molecular Phylogenetics and Evolution, 67, 484–493.
Beja-Pereira A, Oliveira R, Alves PC, Schwartz M, Luikart G (2009)
Advancing ecological understandings through technological transfor-
mations in noninvasive genetics. Molecular Ecology Resources, 9, 1279–
1301.
Brito JC, Godinho R, Mart�ınez-Freir�ıa F et al. (2014) Unravelling biodiver-
sity, evolution and threats to conservation in the Sahara-Sahel. Biologi-
cal Reviews, 89, 215–231.
Chaves PB, Graeff VG, Lion MB, Oliveira LR, Eizirik E (2012) DNA bar-
coding meets molecular scatology: short mtDNA sequences for stan-
dardized species assignment of carnivore noninvasive samples.
Molecular Ecology Resources, 12, 18–35.
D’Amato ME, Alechine E, Cloete KW, Davison S, Corach D (2013) Where
is the game? Wild meat products authentication in South Africa: a case
study. Investigative Genetics, 4, 6.
Darling J, Blum M (2007) DNA-based methods for monitoring
invasive species: a review and prospectus. Biological Invasions, 9,
751–765.
De Smet K, Smith TR (2001) Algeria. Chapter 4. In: Antelopes. Part 4: North
Africa, the Middle East and Asia. Global Survey and Regional Action
Plans. ASS Antelope Specialist Group (eds Mallon DP & Kingswood SC
(compilers)), pp. 22–29. IUCN, Gland, Switzerland and Cambridge,
UK.
DeMay SM, Becker P, Eidson C, Rachlow JL, Johnson TR, Waits LP (2013)
Evaluating DNA degradation rates in faecal pellets of the endangered
pygmy rabbit. Molecular Ecology Resources, 13, 654–662.
DeSalle R, Amato G (2004) The expansion of conservation genetics. Nat-
ure Reviews Genetics, 5, 702–712.
Durant SM, Wacher T, Bashir S et al. (2014) Fiddling in biodiversity hot-
spots while deserts burn? Collapse of the Sahara’s megafauna Diversity
and Distributions, 20, 114–122.
Fadakar D, Rezaei HR, Naseri M, Mirzakhah M, Naderi S, Zamani W
(2013) Phylogenetic analysis of Persian Gazella, Gazella subgutturosa
(Artiodactyla: Bovidae) based on cytochrome b in central Iran. Molecu-
lar Biology Research Communications, 2, 151–159.
Fernandes CA, Ginja C, Pereira I, Tenreiro R, Bruford MW, Santos-Reis
M (2007) Species-specific mitochondrial DNA markers for identifica-
tion of non-invasive samples from sympatric carnivores in the Iberian
Peninsula. Conservation Genetics, 9, 681–690.
Floyd R, Abebe E, Papert A, Blaxter M (2002) Molecular barcodes for soil
nematode identification. Molecular Ecology, 11, 839–850.
Galtier N, Nabholz B, Gl�emin S, Hurst GDD (2009) Mitochondrial DNA
as a marker of molecular diversity: a reappraisal. Molecular Ecology, 18,
4541–4550.
Godinho R, Llaneza L, Blanco JC et al. (2011) Genetic evidence for multi-
ple events of hybridization between wolves and domestic dogs in the
Iberian Peninsula. Molecular Ecology, 20, 5154–5166.
Godinho R, Ab�aigar T, Lopes S et al. (2012) Conservation genetics of the
endangered Dorcas gazelle (Gazella dorcas spp.) in Northwestern
Africa. Conservation Genetics, 13, 1003–1015.
Hajibabaei M, Singer GAC, Hebert PDN, Hickey DA (2007) DNA barcod-
ing: how it complements taxonomy, molecular phylogenetics and pop-
ulation genetics. Trends in Genetics, 23, 167–172.
Hall TA (1999) BIOEDIT: a user-friendly biological sequence alignment edi-
tor and analysis program for Windows 95/98/NT. Nucleic Acids Sym-
posium Series, 41, 95–98.
Harris RB, Winnie J, Amish SJ et al. (2010) Argali abundance in the
Afghan Pamir using capture-recapture modeling from fecal DNA. The
Journal of Wildlife Management, 74, 668–677.
Hassanin A, Pasquet E, Vigne J-D (1998) Molecular systematics of the
Subfamily Caprinae (Artiodactyla, Bovidae) as determined from cyto-
chrome b sequences. Journal of Mammalian Evolution, 5, 217–236.
Havermans C, Nagy ZT, Sonet G, De Broyer C, Martin P (2011) DNA bar-
coding reveals new insights into the diversity of Antarctic species of
Orchomene sensu lato (Crustacea: Amphipoda: Lysianassoidea). Deep
Sea Research Part II: Topical Studies in Oceanography, 58, 230–241.
Hebert PDN, Cywinska A, Ball SL, DeWaard JR (2003) Biological identifi-
cations through DNA barcodes. Proceedings of the Royal Society of
London. Series B, Biological Sciences, 270, 313–321.
Hebert PDN, Stoeckle MY, Zemlak TS, Francis CM (2004) Identification
of birds through DNA Barcodes. PLoS Biology, 2, e312.
Heckman KL, Mariani CL, Rasoloarison R, Yoder AD (2007) Multiple
nuclear loci reveal patterns of incomplete lineage sorting and complex
species history within western mouse lemurs (Microcebus). Molecular
Phylogenetics and Evolution, 43, 353–367.
Huelsenbeck JP, Ronquist F (2001) MRBAYES: Bayesian inference of phy-
logenetic trees. Bioinformatics, 17, 754–755.
Irwin DM, Kocher TD, Wilson AC (1991) Evolution of the cytochrome b
gene of mammals. Journal of Molecular Evolution, 32, 128–144.
IUCN, SSC Antelope Specialist Group (2008) IUCN Red List of Threa-
tened Species. Version 2009.1. www.iucnredlist.org
Kekkonen M, Hebert PDN (2014) DNA barcode-based delineation of
putative species: efficient start for taxonomic workflows. Molecular
Ecology Resources, 2014 Jul;14: 706–15 doi:10.1111/1755-0998.12233.
Kocher TD, Thomas WK, Meyer A et al. (1989) Dynamics of mitochon-
drial DNA evolution in animals: amplification and sequencing with
conserved primers. Proceedings of the National Academy of Sciences of the
United States of America, 86, 6196–6200.
Lampa S, Henle K, Klenke R, Hoehn M, Gruber B (2013) How to over-
come genotyping errors in non-invasive genetic mark-recapture popu-
lation size estimation – a review of available methods illustrated by a
case study. The Journal of Wildlife Management, 77, 1490–1511.
Lerp H, Wronski T, Pfenninger M, Plath M (2011) A phylogeographic
framework for the conservation of Saharan and Arabian Dorcas
gazelles (Artiodactyla: Bovidae). Organisms Diversity & Evolution, 11,
317–329.
Long RA, Mackay P, Ray J, Zielinski WJ (2008) Noninvasive Survey Meth-
ods for Carnivores. Island Press, Washington, DC.
Luikart G, Zundel S, Rioux D et al. (2008) Low genotyping error
rates for microsatellite multiplexes and noninvasive fecal DNA
samples from bighorn sheep. The Journal of Wildlife Management, 72,
299–304.
Luo A, Zhang A, Ho SY et al. (2011) Potential efficacy of mitochondrial
genes for animal DNA barcoding: a case study using eutherian mam-
mals. BMC Genomics, 12, 84.
Matthee CA, Davis SK (2001) Molecular insights into the evolution of the
Family Bovidae: a nuclear DNA perspective. Molecular Biology and Evo-
lution, 18, 1220–1230.
Matthee CA, Burzlaff JD, Taylor JF, Davis SK (2001) Mining the mamma-
lian genome for artiodactyla systematics. Systematic Biology, 50, s3–s90.
Maudet C, Luikart G, Dubray D, von Hardenberg A, Taberlet P (2004)
Low genotyping error rates in wild ungulate faeces sampled in winter.
Molecular Ecology Notes, 4, 772–775.
Melo-Ferreira J, Boursot P, Carneiro M, Esteves PJ, Farelo L, Alves PC
(2012) Recurrent introgression of mitochondrial DNA among Hares
© 2014 John Wiley & Sons Ltd
GENETIC ID OF NORTH AFRICAN UNGULATES 9
(Lepus spp.) revealed by species-tree inference and coalescent simula-
tion. Systematic Biology, 61, 367–381.
Monterroso P, Castro D, Silva TL, Ferreras P, Godinho R, Alves PC (2013)
Factors affecting the (in)accuracy of mammalian mesocarnivore scat
identification in South-western Europe. Journal of Zoology, 289, 243–
250.
Oliveira R, Castro D, Godinho R, Luikart G, Alves PC (2009) Species
identification using a small nuclear gene fragment: application to sym-
patric wild carnivores from South-western Europe. Conservation Genet-
ics, 11, 1023–1032.
Posada D (2008) jModelTest: phylogenetic model averaging. Molecular
Biology and Evolution, 25, 1253–1256.
Rambaut A (2009) FIGTREE v1.3.1. Institute of Evolutionary Biology, Uni-
versity of Edinburgh, Edinburgh.
Rebholz W, Harley E (1999) Phylogenetic relationships in the Bovid Sub-
family Antilopinae based on mitochondrial DNA sequences. Molecular
Phylogenetics and Evolution, 12, 87–94.
Shehzad W, Riaz T, Nawaz M et al. (2012) Carnivore diet analysis
based on next-generation sequencing: application to the leopard
cat (Prionailurus bengalensis) in Pakistan. Molecular Ecology, 21,
1951–1965.
Smith TR, Mallon DP, De Smet K (2001) Tunisia. Chapter 5. In: Antelopes.
Part 4: North Africa, the Middle East and Asia. Global Survey and Regional
Action Plans. ASS Antelope Specialist Group (eds Mallon DP & Kings-
wood SC (compilers)), pp. 30–40. IUCN, Gland, Switzerland and Cam-
bridge, UK.
Smith MA, Fisher BL, Hebert PDN (2005) DNA barcoding for effective
biodiversity assessment of a hyperdiverse arthropod group: the ants of
Madagascar. Philosophical Transactions of the Royal Society of London. Ser-
ies B, Biological Sciences, 360, 1825–1834.
Song H, Buhay JE, Whiting MF, Crandall KA (2008) Many species in
one: DNA barcoding overestimates the number of species when
nuclear mitochondrial pseudogenes are coamplified. Proceedings of
the National Academy of Sciences of the United States of America, 105,
13486–13491.
Steele PR, Pires JC (2011) Biodiversity assessment: state-of-the-art tech-
niques in phylogenomics and species identification. American Journal of
Botany, 98, 415–425.
Tamura K (1992) Estimation of the number of nucleotide substitutions
when there are strong transition-transversion and G+C-content biases.Molecular Biology and Evolution, 9, 678–687.
Tamura K, Peterson D, Peterson N, Stecher G, Nei M, Kumar S (2011)
MEGA5: molecular evolutionary genetics analysis using maximum
likelihood, evolutionary distance, and maximum parsimony methods.
Molecular Biology and Evolution, 28, 2731–2739.
Thompson JD, Higgins DG, Gibson TJ (1994) CLUSTAL W: improving
the sensitivity of progressive multiple sequence alignment through
sequence weighting, position-specific gap penalties and weight matrix
choice. Nucleic Acids Research, 22, 4673–4680.
Tiedemann R, Cipriano F, Morin PA et al. (2012) Updated guidelines for
DNA data quality control and error rate estimation, for genetic studies
relevant to IWC management advice. Report to the Scientific Commit-
tee of the International Whaling Commission.
Van Vliet N, Zundel S, Miquel C, Taberlet P, Nasi R (2008) Distinguishing
dung from blue, red and yellow-backed duikers through noninvasive
genetic techniques. African Journal of Ecology, 46, 411–417.
Vila M, Bj€orklund M (2004) The utility of the neglected mitochondrial
control region for evolutionary studies in lepidoptera (insecta). Journal
of Molecular Evolution, 58, 280–290.
Wacher T, Wronski T, Hammond RL et al. (2010) Phylogenetic analy-
sis of mitochondrial DNA sequences reveals polyphyly in the
Goitered gazelle (Gazella subgutturosa). Conservation Genetics, 12,
827–831.
Waits LP, Paetkau D (2005) Noninvasive genetic sampling tools for
wildlife biologists : a review of applications and recommendations
for accurate data collection. Journal of Wildlife Management, 69,
1419–1433.
Wehausen JD, Ramey RR, Epps CW (2004) Experiments in DNA extrac-
tion and PCR amplification from bighorn sheep feces: the importance
of DNA extraction method. The Journal of Heredity, 95, 503–509.
White DJ, Wolff JN, Pierson M, Gemmell NJ (2008) Revealing the
hidden complexities of mtDNA inheritance. Molecular Ecology, 17,
4925–4942.
Wronski T, Plath M (2010) Characterization of the spatial distribution of
latrines in reintroduced mountain gazelles: do latrines demarcate
female group home ranges? Journal of Zoology, 280, 92–101.
Wronski T, Wacher T, Hammond RL et al. (2010) Two reciprocally
monophyletic mtDNA lineages elucidate the taxonomic status of
Mountain gazelles (Gazella gazella). Systematics and Biodiversity, 8,
119–129.
Zhang J (2013-2014) Species delimitation server. Available online: http://
species.h-its.org/ptp/
Zhang J, Kapli P, Pavlidis P, Stamatakis A (2013) A general species delim-
itation method with applications to phylogenetic placements. Bioinfor-
matics, 29, 2869–2876.
T.L.S., R.G., T.A., P.C.A. and J.C.B. conceived and
designed the study; T.L.S., T.A. and J.C.B. collected sam-
ples in the field and from collections; T.L.S. and D.C. per-
formed laboratory work, T.L.S. analysed the data and
wrote the first draft of the manuscript; T. L. S., R.G., T.A.,
P.C.A. and J.C.B. discussed the results and contributed
to the writing of the final version of the manuscript.
Data Accessibility
Refer to Table S1 for the DNA sequence data accessi-
bility and sample locations; DNA sequences: GenBank
Accession nos from KM582053 to KM582129; DNA
haplotype alignments: DRYAD entry doi: 10.5061/
dryad.ns7gp.
Supporting Information
Additional Supporting Information may be found in the online
version of this article:
Fig. S1 Bayesian inference tree for the cytb and KCAS concate-
nated fragments showing the phylogenetic relationship of all
endangered North African ungulates and the domestic species.
Table S1 Species, type, origin, haplotype codes, GenBank acces-
sion numbers and country of the North African ungulate sam-
ples used in this study.
Table S2 GenBank sequences for Cytb and KCAS genes from
North African ungulates included in this study.
Table S3 Interspecific polymorphic positions of the cytb 450 bp
fragment analysed in endangered ungulates species from North
Africa.
© 2014 John Wiley & Sons Ltd
10 T . L . S ILVA ET AL .
Copyright © 2022 FDOKUMEN