UNDERSTANDING ECOLOGICAL INTERACTIONS AMONG CARNIVORES, UNGULATES AND FARMERS IN BHUTAN'S JIGME...
151
UNDERSTANDING ECOLOGICAL INTERACTIONS AMONG CARNIVORES, UNGULATES AND FARMERS IN BHUTAN'S JIGME SINGYE WANGCHUCK NATIONAL PARK A Dissertation Presented to the Faculty of the Graduate School of Cornell University In Partial Fulfillment of the Requirements for the Degree of Doctor of Philosophy by Sonam Wangyel Wang May 2008
Transcript of UNDERSTANDING ECOLOGICAL INTERACTIONS AMONG CARNIVORES, UNGULATES AND FARMERS IN BHUTAN'S JIGME...

UNDERSTANDING ECOLOGICAL INTERACTIONS AMONG
CARNIVORES, UNGULATES AND FARMERS IN BHUTAN'S JIGME
SINGYE WANGCHUCK NATIONAL PARK
A Dissertation
Presented to the Faculty of the Graduate School
of Cornell University
In Partial Fulfillment of the Requirements for the Degree of
Doctor of Philosophy
by
Sonam Wangyel Wang
May 2008

© 2008 Sonam Wangyel Wang

UNDERSTANDING ECOLOGICAL INTERACTIONS AMONG
CARNIVORES, UNGULATES AND FARMERS IN BHUTAN'S JIGME
SINGYE WANGCHUCK NATIONAL PARK
Sonam Wangyel Wang, Ph. D.
Cornell University 2008
This study examined livestock predation patterns and economic losses suffered
by farmers; estimated predator and prey densities and investigated food habits, niche
overlap and prey preferences in a predator guild with high grazing pressures in
Bhutan’s Jigme Singye Wangchuck National Park. Farmer interviews indicated that
they lost a total of 2.3% of their livestock to predators over 12 months, primarily due
to tigers (Panthera tigris) and leopards (Panthera pardus). Scat analyses confirmed
that livestock dominated tiger and leopard diets, while wild ungulates dominated dhole
(Cuon alpinus) diet. Primary wild prey such as wild pig (Sus scrofa), muntjac
(Munticus muntjac) and sambar (Cervus unicolor) provided 37.9%, 29.8% and 71.1%
of the prey consumed by tigers, leopards and dholes, respectively. The study also
revealed that assuming equal availability all three predators would avoid cattle. Line
transects revealed low mean prey densities: 3.68 wild pig km-2, 2.17 muntjac km-2 and
1.19 sambar km-2. These provided a biomass density of 379 kg km-2, which could
support about 1.2 tigers 100 km-2; while more abundant livestock (6.0 km-2) provided
a supplementary biomass of 615 kg km-2. Camera trapping yielded a capture
probability of 0.04 for both tigers and leopards, population estimates of 8 tigers and 16
leopards and densities of 0.52 tiger 100 km-2 and 1.03 leopards 100 km-2. Spatial
analysis of habitats indicated that tigers preferred less disturbed areas located further
away from settlements, while leopards were found nearer to settlements. This study

confirmed that although predators and prey existed in low densities, farmers suffered
significant losses due to predation and a high intra-guild competition and diet overlap
among the three sympatric carnivores. Under these conditions, prey types and sizes
did not necessarily influence prey selection especially for tigers. The study supported
the feasibility of using distance sampling and camera trapping methods for studying
predators and prey in Bhutan’s rugged terrain. It is recommended that managers devise
conservation management strategies that accommodate the needs of both wildlife and
farmers by restoring an adequate natural prey base and developing a program of
compensation for livestock lost to predators.

iii
BIOGRAPHICAL SKETCH
Sonam Wangyel Wang was born on the fourth day of the sixth month of the
Bhutanese Calendar to Wangzam Tauchum and Ap Thinley of Wang Simu. His name
means blessed with good luck, he shall rule in victory and his birthday coincides with
the enlightenment and consequent first sermon of Lord Buddha, founder of Buddhism.
Being the eldest, he was expected to stay with the family in order to care for their
welfare. Mr. Wang grew up in close contact with nature, herding cattle and horses.
Unfortunately, at the age of ten he lost his mother. After which, his aunt sent him to
school.
Although Wang entered school late, he studied hard soon catching up with his
own age group. Upon graduating from high school, in March 1991, Wang married his
high school sweetheart, Karma Hangzo and is a proud father of Sonam Tandin Wang
(son) and Rigzang Pamela Wang (Daughter). Mr. Wang has a first division honors
degree in Forestry from the University of Wales, United Kingdom (1999) and MS
from Cornell University (2004).
In August 1999, Mr. Wang entered the Royal Bhutan Civil Service as an
Assistant Director of Forests. He quickly advanced to the position of National Park
Manager, which enabled him to reconnect with his rural upbringing. It also provided a
wonderful opportunity to collaborate with farmers to conserve biodiversity. In 2007,
Mr. Wang was selected by the Royal Civil Service Commission to head Bhutan’s
Nature Conservation Division, which is responsible for overall conservation programs
and policies.

iv
Dedicted to:
His Majesty
Jigme Khesar Namgyel Wangchuck
The King of Bhutan

v
ACKNOWLEDGMENTS
I would like to thank my father and sisters for their love and support. My
deepest love and appreciation lies with Karma Hangzo, my wife, who has supported
me throughout my academic life with great patience and understanding. My son,
Sonam Tandin Wang, and daughter Rigzang Pamela Wang have been the greatest
motivation behind my success.
I am greatly indebted to my doctoral committee members, Professors James P.
Lassoie, David W. Macdonald, Paul D. Curtis and Milo E. Richmond for their
unending support and guidance. All of the committee members very patiently
reviewed and edited my dissertation and made many critical, but constructive
comments. To my committee I want to say that you are truly great.
Thanks are also due to my research assistants (Kuenzang Dorji, Jigme
Wangchuk, K.B. Gurung, Sonam Dorji, Kinzang Lham, Nawang Tenzin) and other
field staff and local guides who helped me collect data. In addition, I would like to
thank Drs. Ullas Karanth, A.J.T. Johnsingh and Koustubh Sharma for their generous
support with methods and for reviewing the papers that constitute this dissertation.
I am extremely grateful to Save the Tiger Fund-USA, Disney Wildlife
Conservation Fund-USA and Whitley Fund for Nature-UK for their financial support
and cooperation. Finally, my sincere thanks to Dasho Sangay Thinley, the former
Secretary of Ministry of Agriculture and Dasho Bap Kesang, Secretary of Royal Civil
Service, Bhutan for their support to complete my PhD.

vi
TABLE OF CONTENTS
Biographical sketch……………………………………………..………………...
Dedication………………………………………………………..……………….
Acknowledgements………………………………………………..……………...
Table of contents…………………………………………………..……………...
List of figures………………………………………………………..……………
List of tables…………………………………………………………..…………..
List of abbreviations………………………………………………….…………..
CHAPTER I: Towards a win-win situation: understanding the sociological and ecological dynamics of human-carnivore conflicts-an introduction
Introduction…………………………………………………….……...…...General literature review……………………………………….…...……...References………………………………………………………...…….....
CHAPTER II: Livestock predation by carnivores in Jigme Singye Wangchuck National Park, Bhutan
Abstract…………………………………………………………...…….….Introduction….…………………………………………………...…….…..Study area………………………………………………………...…….…..Methods………………………………………………………..….…….….Results………………………………………………………..…….……....Discussion…………………………………………………………..………References………………………………………………..…………..….….
CHAPTER III: Feeding habits and niche partitioning in a predator guild composed of tigers, leopards and dholes in Jigme Singye Wangchuck National Park, Bhutan
Abstract………………………………………………...……………..…….Introduction…………………………………………………………….…..Study area.………………………………………...…………………….….Methods…………………………………………..……………………..….Results…………………………………………...………………………....
iii
iv
v
vi
viii
x
xii
1 6 20 27 28 29 31 32 39 44 47 48 51 53 57

vii
Discussion………………………………...………………………………..References…………………………………...……………………………..
CHAPTER IV: Population densities, biomass and potential habitats of ungulates in Jigme Singye Wangchuck National Park, Bhutan
Abstract…………………………………………………………………..…Introduction……………………………………………………….…..…....Study area…………………………………………………………...……...Methods………………………………………………………...….……….Results……………………………………………………………..……... Discussion……………………………………………………………..……References…………………………………………………...………….….
CHAPTER V: The use of camera traps for estimating high altitude tiger and leopard populations in Jigme Singye Wangchuck National Park, Bhutan
Abstract……………………………………………...………………….….Introduction…………………………………...…………………………....Study area……………………………………..…………………………....Methods………………………………...…………………………….…….Results…………………………...…………………………………….…...Discussion………………...……………………………………………..….References…...……………………………………………………………..
CHAPTER VI: Creating a win-win situation: integrating the sociological and ecological understanding to reduce human-carnivore conflicts-A synthesis
Introduction…...…………………………………………………….……...Findings...…………………………………………………………….…….Conservation management implications…...…………………………..…...References…...…………………………………………………………..….
64 67 73 74 77 79 83 90 95 100 101 103 105 114 122 127 131 132 134 137

viii
LIST OF FIGURES
Figure 2.1. Location of Jigme Singye Wangchuck National Park and study sites in Bhutan……………………………………………….…... Figure 2.2. Methods of night-time livestock management practiced by the farmers in Jigme Singye Wangchuck National Park (2000) (livestock penned below living quarters were included with those housed in separate stables)…...……………………………...………….……………... Figure 3.1. Map of Jigme Singye Wangchuck National Park in relation to the protected areas of Bhutan……………………………………………. Figure 3.2. Contributions of prey species in tiger diet with number of scats examined from Jigme Singye Wangchuck National Park, Bhutan (2007)..... Figure 3.3. Contributions of prey species in leopard diet with number of scats examined from Jigme Singye Wangchuck National Park, Bhutan (2007)…………………………….……………..………………………...… Figure 3.4. Contributions of prey species in Dhole diet with number of scats examined from Jigme Singye Wangchuck National Park,Bhutan (2007)...……………..………………………………………………………. Figure 4.1. Study area map of Jigme Singye Wangchuck National Park with transects (red lines) in relation to protected areas map of Bhutan....….. Figure 4.2. Half normal key fitted to primate detections showing evasion of the transect line and outliers in un-truncated primate data (2006).……… Figure 4.3. Density and distribution of prey species across five study zones in Jigme Singye Wanghcuck National Park, Bhutan (2006)………………... Figure 4.4. Habitat suitability map of wild pig based on resource selectivity function with darker areas having higher probability of selection than the lighter areas in Jigme Singye Wangchuck National Park, Bhutan (2006)……………………………………………………………………….. Figure 4.5. Habitat suitability map of muntjac based on resource selectivity function with darker areas having higher probability of selection than the lighter areas in Jigme Singye Wangchuck National Park, Bhutan (2006)………………………………………………………………………..
30 36 52 60 60 61 78 83 86 88 89

ix
Figure 4.6. Habitat suitability map of sambar based on resource selectivity function with darker areas having higher probability of selection than the lighter areas in Jigme Singye Wangchuck National Park, Bhutan (2006)...... Figure 5.1. Camera trap location map of Jigme Singye Wangchuck National Park in relation to Bhutan’s protected area system...…………..…. Figure 5.2a. Example of using stripe patterns from camera traps photos for identification of tigers T01 and T05 in Jigme Singye Wangchuck National Park, Bhutan (2007)….…………………………………………… Figure 5.2b. Example of using different rosette patterns from camera trap photos for identification of leopards L04 and L011 in Jigme Singye Wangchuck National Park, Bhutan (2007)………….……………………… Figure 5.3. Number of different species photographed (including blank exposures) by camera traps in Jigme Singye Wangchuck National Park, Bhutan (2007)………………………………………………………….….… Figure 5.4. Cumulative number of tiger photographs indicating number of individual tigers captured with increasing sampling occasion in Jigme Singye Wangchuck National Park, Bhutan (2007)…………….. ……….…. Figure 5.5. Cumulative number of leopard photographs indicating number of individual leopards captured with increasing sampling occasion in Jigme Singye Wangchuck National Park, Bhutan (2007)………………...………. Figure 5.6. Potential habitats preferred by tigers in Jigme Singye Wangchuck National Park, Bhutan (2007)…….…………………….……... Figure 5.7. Potential habitats preferred by leopards in Jigme Singye Wangchuck National Park, Bhutan (2007).………………………….……... Figure 6.1. Integreated human wildlife conflict management strategy to slowly change the spatial distribution of predators, prey, livestock and herders from the current situation (simplified co-existence) to the desired future situation (more robust co-existence)………………………………...
90 104 109 110 115 116 116 121 122 134

x
LIST OF TABLES
Table 2.1. Comparison of sources of cash incomes from livestock in inner and buffer zones of Jigme Singye Wangchuck National Park (2000)…….... Table 2.2. Average composition of livestock herds per household in the study geogs of Jigme Singye Wangchuck National Park (2000)………….... Table 2.3. Economic valuation of reported livestock kills (n) by wild predators in the study geogs in (2000).…………………………………..…. Table 2.4. Showing differences in mean predation in time from establishment of Jigme Singye Wangchuck National Park……………..…... Table 2.5. Predation ‘hotspots’ in Jigme Singye Wangchuck National Park according to each of three criteria for each species of predator………..…… Table 3.1. Density (animals km-2) of major prey species in Jigme Singye Wangchuck National Park, Bhutan (2006)….………………….…………… Table 3.2. Number (n), frequency of occurrence (F), relative occurrence (R), weight of prey in one field collectable scat (Y), relative biomass consumed (D) and relative number of prey individuals consumed (E) by tiger, leopard and dhole from Jigme Singye Wangchuck National Park, Bhutan (2007)…………………………………………………………..….. Table 3.3. Results of prey preference analyses using program SCATMAN and Manly’s selection ratio in Jigme Singye Wangchuck National Park, Bhutan (2007)…………………...……………………………..…………... Table 4.1. Number of detections from 32 transects (849 km) in Jigme Singye Wangchuck National Park, Bhutan (2006)………………..……….. Table 4.2. Prey density, biomass and distribution in Jigme Singye Wangchuck National Park, Bhutan (2006)…………….…………..……….. Table 4.3. Estimated coefficients of the resource selection function for wild pig model in Jigme Singye Wangchuck National Park, Bhutan (2006).. Table 4.4. Estimated coefficients of the resource selection function for muntjac model in Jigme Singye Wangchuck National Park, Bhutan (2006).. Table 4.5. Estimated coefficients of the resource selection function for sambar model in Jigme Singye Wangchuck National Park, Bhutan (2006)...
34 34 37 39 39 57 59 62 84 85 87 88 89

xi
Table 4.6. Estimates of wild ungulate density (animals km-2); total density (D) and biomass (kg km-2) from different studies across the Indian sub-continent compared to Jigme Singye Wangchuck National Park, Bhutan (2006)……………………..………………………………………………... Table 5.1. Capture history of photographed tigers in Jigme Singye Wangchuck National Park, Bhutan. 1 = capture, 0 = no capture (2007)……. Table 5.2. Capture history of photographed leopards in Jigme Singye Wangchuck National Park, Bhutan. 1 = capture, 0 = no capture (2007)…....
Table 5.3. Results of testing assumptions used by CAPTURE to select the best fit model for analyzing tiger and leopard data from Jigme Singye Wangchuck National Park, Bhutan (2007)………………………….
Table 5.4. Comparison of model selection criteria from program CAPTURE for tiger and leopard data from Jigme Singye Wangchuck National Park, Bhutan (2007)……………………………………………… Table 5.5. Results of test for population closure (Z = test statistic, P = significance level), estimated population (n), standard error (SE) and capture probabilities (p-hat) of tigers and leopards from Jigme Singye Wangchuck National Park, Bhutan (2007)..........................................………
Table 5.6. Estimated densities of tigers and leopards in Jigme Singye Wangchuck National Park, Bhutan (2007).………………………………….
Table 5.7. Estimates of tiger density (D[tigers km-2]) from different camera trap studies across the Indian sub-continent compared to Jigme Singye Wangchuck National Park, Bhutan (2007).………………………...
92 111 112 118 118 119 120 124

xii
LIST OF ABBREVIATIONS
AIC Akiake information criteria
GIS geographic information systems
GPS global positioning system
JSWNP Jigme Singye Wangchuck National Park
RGoB Royal Government of Bhutan
MoA Ministry of Agriculture
WildCRU Wildlife Conservation Research Unit

1
CHAPTER I
TOWARDS A WIN-WIN SITUATION: UNDERSTANDING THE SOCIAL AND ECOLOGICAL DYNAMICS OF HUMAN-CARNIVORE CONFLICTS-
AN INTRODUCTION
Introduction
Conservation of large carnivores such as tigers (Panthera tigris) is a global
priority due to numerous socio-cultural values and the critical roles they play in
maintaining a working ecosystem. Studies from a widely divergent number of
ecosystems all agree that the conservation of tigers and their sympatric predators such
as leopards (Panthera pardus) and dholes (Cuon alpinus) will lead to conservation of
all the attributes of a healthy ecosystem (Steneck, 2005). However in recent years,
carnivore populations have been on the decline mainly due to loss of habitat,
poaching, reduction in prey populations and persecution in retaliation by grieved and
angered humans. Tigers along with co-predators like leopards are the most vulnerable
to such human induced changes in the landscape due to their large home range
requirement, predation on livestock and humans and decreasing prey populations.
Conflicts with humans have driven three tiger subspecies into extinction (Bali tiger,
Panthera tigris balica; Caspian tiger, P.t. virgata; Javan tiger, P.t. sondaica),
endangered tigers and drastically reduced numbers of many other felids (Sunquist, et
al., 1999). Only 7% of the original tiger habitat remains and conflict with humans
poses a significant threat, which if unchecked, could reduce tiger populations beyond
recovery (Karanth and Stith, 1999; Sunquist et al., 1999). This problem is further
exacerbated by the fact that a large portion of the tiger’s remaining range is situated in
developing countries with high human populations, a majority of which depends on
livestock rearing for a variety of reasons including draught power, sources of protein,
etc. To these millions of farmers, one head of livestock is worth almost a year’s

2
earning and losing it to a tiger is highly undesirable (Wang and Macdonald, 2006).
Under such situations, human-carnivore conflicts must be quickly addressed to
enhance co-existence between these high profile predators, farmers and their much
coveted livestock. Failure to establish such a tolerance would greatly jeopardize the
survival of top predators and the associated ecosystem.
Conflicts between humans and wildlife occur whenever any action by humans
or wildlife has an adverse impact upon the other. Often it is a product of socio-
economic development and political landscapes (Conforti and de Azevedo, 2003).
Human-wildlife conflicts occur when wildlife attack humans or damage their property.
Problems may also be related to human activities, such as building a highway through
a forest where wild animals live, or grazing livestock in wild animals’ habitat. Human-
wildlife conflicts have a reputation for tarnishing conservation prospects, threatening
livelihoods for poor farmers and extinction of wildlife species. One approach to
reducing human-wildlife conflicts is to create preserves, wildlife refuges or parks
where human impacts on wildlife are minimized (Conover, 2002). Since the early
1970s, there has been a global upsurge in the creation of protected areas, which
became a key component in many countries’ conservation strategies. Many of these
protected areas haave been established in developing countries where there are people
living in and around the preserves. Most of the protected areas in the South Asian and
Trans-Himalayan region (which includes, Bhutan, India, Nepal, northeast Pakistan and
southern Tibet) support various forms of land use, such as agriculture, livestock
grazing and collecting of minor forest products. However, the needs and aspirations of
rural people living next to the protected areas have been largely overlooked when
implementing conservation strategies. Successful conservation has in fact been linked
to the need to protect natural areas from traditional uses by local people (Zube and
Bush, 1990). These actions have made rural villagers in developing countries

3
vulnerable to the establishment of protected areas, as they depend primarily on locally
available resources for their physical livelihood and spiritual needs (Shiva et al., 1982;
Saberwal et al., 1994; Nepal and Weber, 1995; Gadgil, 1990; Jackson, 1999; Jackson
and Wangchuk, 2000; Maikhuri et al., 2001). They also set the stage for increased
human-wildlife conflicts.
Aside from having to live with restrictions on traditional resource uses, farmers
also have to bear heavy losses in terms of property damage by wildlife. Wildlife
inflicts various forms of damage, such as crop loss by direct feeding and destruction
(Wang, et al., 2006a), and prevents farmers from using arable land due to fear of crop
losses, livestock depredation by park animals and harassment or injuries to local
people (Saberwal et al., 1994; Studsrod and Wegge, 1995). Crop raiding and livestock
predation by park wildlife can threaten the ability of people to secure sustainable
livelihoods (Nepal and Webber; 1995; Studsrod and Wegge, 1995; Jackson and
Wangchuk, 2000). In addition, guarding property and the construction and
maintenance of various protective measures bear heavy indirect costs owing to the
time and financial investments involved. In communities with subsistence economies,
even small losses can be economically important, and can generate negative attitudes
toward wildlife and conservation in general.
Several mitigating methods such as direct cash compensation (Jackson 1999;
Jackson and Wangchuk, 2000; Yoder, 2002) indirect compensation through integrated
conservation development programs (Jackson, 1999; Michaelidou, 2002) and selective
sustainable extraction of resources (Saberwal et al., 1994; Studsrod and Wegge, 1995)
have been instituted to align conservation with local socio-economical interests.
Parallel to this, there is an overwhelming effort to understand the complex biological
and environmental factors associated with livestock depredation including herd size
and kind, guarding and herding patterns, type of predator species, habitat type,

4
distance from forest and the effect of human settlements (Jackson, 1996; Linnell, et
al., 1996). In spite of the efforts being made by park authorities around the world to
conserve biodiversity without hurting the sentiments of local people, recent studies on
abundance, prey species, feeding habits and the magnitude and socio-ecological
dynamics of predation on livestock have suggested that conflicts between wildlife and
humans are increasing, especially in and around protected areas (Shiva et al., 1982;
Saberwal et al., 1994; Nepal and Weber, 1995; Gadgil, 1990; Jackson, 1999; Jackson
and Wangchuk, 2000; Maikhuri et al., 2001). Little or no effort has been made to
integrate this knowledge to manage the emerging conflicts.
My quest for simple answers to the complexities of human tiger conflicts has
been hindered by the paucity of scientific investigations addressing human-wildlife
conflicts as a collaborative science. Most scientific investigations and discussions
were polarized either towards humans or towards wildlife protection. My attempts
were further complicated by the fact that, even if enough scientific information was
available, the answers were still vulnerable to being greatly influenced by the context
and the intricate mixture of rich ethics and values. The science of human-wildlife
conflict craves for a multidisciplinary approach based on scientific knowledge
generated through transparent collaboration between social and wildlife scientists.
Understanding the dynamics of competition between humans (and their livestock) and
large predator (and their prey) that co-exist in an natural setting will advance our
knowledge and the ability to develop an effective strategy to resolve conflicts between
humans and wildlife.
Bhutan’s Jigme Singye Wangchuck National Park (JSWNP) presents an
excellent platform for investigating competitive interactions between humans and
wildlife in the most ideal environment. The park has unusually high levels of
biological diversity due to its position at the center of Bhutan (which is a biodiversity

5
hot spot) including a unique predator guild comprising tiger, leopard and dholes and
their prey. These sympatric carnivores share the park’s resources with 6,000
households and their livestock (Wang, 2004) and occasionally enter into conflict with
each other through livestock losses (Wang, et al., 2006a; Wang et al., 2006b). In
addition, leopards and tigers are also killed for fur while their habitat is degraded
through excessive grazing by domestic livestock (Wang, 2004). On the contrary,
wildlife and the government have been accused of inflicting immense losses on
farmers in terms of crop and livestock damage (Wang, 2004; Wang, et al., 2006b).
These allegations are now gaining support from the National Assembly (the highest
legislative body in Bhutan) and media. If not recognized, this could seriously
jeopardize conservation prospects in Bhutan and tarnish Bhutan’s globally applauded
conservation efforts. Past management efforts based on anecdotal information have
not only failed to validate these allegations but also proved unsuccessful addressing
the losses. Real conflicts exists, which, if they are to be solved, require research to
underpin long-term and practical solutions acceptable to the people of Bhutan.
Taking advantage of a system where predators and prey occur in a multi-
species guild, and co-exist in a competitive interaction with farmers and their
livestock, this dissertation research investigates the dynamics of livestock loss,
predation patterns and intra-guild competition. Primary questions include: (1) What
factors regulate wildlife populations, and why is livestock predation being reported on
an increasing scale if there are many deer, pigs and predators as claimed by farmers;
(2) how can we integrate our understanding and knowledge of human dimensions and
wildlife ecology to reduce human-carnivore conflicts; and (3) How can we promote
effective conservation of leopards and tigers in Bhutan without compromising
farmers’ basic needs?

6
In my attempt to provide simple answers to this complex problem, I start out
by assessing the magnitude and the underlying causes of livestock loss to predation.
Next, I validate the allegation that tigers and leopards are causing significant economic
losses by examining diet profiles of predators. Using the most recent and scientifically
robust methods I then go on to estimate prey and predator numbers in the area to
complete the equation. Each of these variables, as it pertains to tigers and leopards
(dholes in case of diet), is addressed in different chapters of this dissertation. Finally, I
synthesized the findings from each dimension into comprehensive approaches for
felid-human conflict management in Bhutan. Knowledge gaps that should be
addressed by further research are also included in this chapter.
These studies were written developed as four scientific papers for publication
in international peer-reviewed journals. These four papers (chapters II, III, IV, V)
along with the introductory and synthesis chapters, make up this dissertation. The
ensuing sections provide a general review of the literature supporting the dissertation.
General literature review
Livestock predation
Predation is a perennial and controversial complaint wherever livestock and
wildlife co-exists (Macdonald, et al. 2004). Predation is an extremely complex issue
especially when domestic stock is involved, as it is affected by breed, stock
management, predator density, individual predator behaviour and even the prey’s
experience with predators (Wang and Macdonald, 2006).
Carnivores, large and small, kill livestock around the world: coyotes (Canis
latrans) kill sheep and goats in parts of North America (Pearson and Caroline 1981,
Robel, et al., 1981; Nass, et al., 1984; Sacks, et al., 1999), wolverines (Gulo gulo) kill
sheep and domestic reindeer in Norway (Landa, 1999), golden jackals (Canis aureus)

7
can kill cattle in Israel (Yom-Tov, et al., 1995), grey wolves (Canis lupus) kill
livestock in southern Europe (Cozza, et al., 1996; Meriggi and Lovari, 1996; Ciucci
and Boitani, 1998) and red foxes (Vulpes vulpes) kill lambs in Australia (Greentree, et
al., 2000). The conflict is most acute where peoples’ livelihoods depend entirely on
livestock and where there are limited alternatives. In areas like the Trans-Himalayan
region, successful conservation measures have allowed predator and prey populations
to recover, sometimes beyond the carrying capacity of the protected areas, and
livestock depredation is emerging as a significant problem (Mishra, 1997).
Conceptually, there are two possible categories of problem animals (Linnell, et
al., 1999). Where most individual carnivores do not have livestock within their home
ranges, a problem animal may be one individual predator killing prey in the wrong
place. However, where livestock are present within the home ranges of most
carnivores, a problem animal may be the one that kills more livestock than the others.
The underlying assumption of the problem individual paradigm, according to Linnell,
et al. (1999) is that only a small proportion of the individuals in a carnivore population
are responsible for most livestock depredation.
For many carnivore species, inexperienced, juvenile or old, infirm and injured
adult predators are more likely to attack livestock (Fox and Chundawat, 1988;
Jackson, 1996; Linnell, et al., 1999). In protected areas, young animals, especially
males, are more likely to disperse into poorer quality habitats with no wild prey and
where interaction with humans and livestock is much higher (Saberwal, et al., 1994).
Males are more often shot or trapped following depredation by solitary species of
large cats and bears (Butlar, 2000; Mizutani, 1993; Jackson, 1996; Mishra, 2001; Fox
and Chundawat, 1988; Oli, et al., 1994; Saberwal, et al., 1994). However, these
patterns do not hold for social species like grey wolves, red foxes, coyotes, golden
jackals, lynxes and wolverines (Ciucci and Boitani, 1998; Cozza, et al., 1996; Meriggi

8
and Lovari, 1996; Greentree, et al., 2000; Pearson and Caroline, 1981; Robel, et al.,
1981; Sacks, et al., 1999; Yom-Tov, et al., 1995; Stahl, et al., 2001; Landa, et al.,
1999). Body size may explain a greater role for males in killing large livestock like
cattle, but gender-specific predation behaviour such as the wider-ranging movements
of males, might also play a part (Sukumar, 1991; Linnell, et al.1999).
Habitat loss and fragmentation, along with poaching and competition with
domestic livestock can deplete the natural prey base (Saberwal, et al., 1994;
Jackson,1996; Mishra, 1997, 2001), forcing predators to turn to domestic stock for
their survival. The shifting balance of availability of livestock and natural prey can
shift predator preferences and incidences of depredation (e.g., Knowlton, et al., 1999;
Meriggi and Lovari, 1996). For example, Boggess, et al. (1978) found no relationship
between the number of sheep killed by coyotes and the number killed by dogs in Iowa,
US. However, they did find a positive relationship between the number of sheep killed
by dogs and sheep numbers in the area, and also showed that a positive relationship
existed between the number of lambs born annually and the number killed by
predators. They suggested that the losses were more closely related to the availability
of sheep than to the number of predators.
Livestock size also plays a role in patterns of actual and perceived predation
losses (Mishra, 1997). Small-bodied stock like goats, sheep and poultry are vulnerable
to a wide range of predators, from eagles to feral dogs to leopards. By comparison,
fully-grown yaks are rarely killed, except by large packs of dholes and large predators
like leopards and tigers (Bhatnagaer, et al., 2000).
Establishment of protected areas is associated with restrictions on farmers’
traditional ways of life and intensified level of livestock predation, crop damage and
even loss of human life. These factors often generate adverse feelings among the
affected farmers towards conservation (Wang, et al., 2006a). In extreme cases angry
9
farmers can retaliate by killing wildlife. If conservation is to succeed then farmers
must be encouraged to support conservation.
Attitudes are not easy to define (Mordi, 1991) their concrete denotation is
elusive to specify explicitly (McGuire, 1969). Public attitudes need to be fully
understood to determine reasons for conservation policy failures (Mordi, 1991). Socio-
economic conditions are important in explaining people’s attitudes to conservation.
For example in Nepal, people living closer to the Royal Chitwan National Park were
more negative towards it than those with larger landholdings, who visited the park less
frequently and who lived further away (Nepal and Weber, 1995). Restrictions imposed
on firewood and fodder collection and damage by wildlife were also associated with a
negative attitude towards the park. In India’s Nanda Devi Biosphere Reserve 75% of
419 respondents had a negative attitude towards the reserve, 15% had a positive
attitude and 10% were neutral (Maikhuri, et al., 2001). A positive attitude was based
on the expectation of benefits from conservation, while a negative attitude arose from
wildlife damage to crops and livestock and restrictions imposed on resource use by the
authorities.
Distribution, abundance, home range and behaviour
Of the 36 species of cats extant in the world, four large cats are found in Bhutan:
tiger, leopard, snow leopard (Uncia uncia) and clouded leopard (Neofelis nebulosa)
(RGoB, 2002).
The leopard is the most widely distributed of all the wild cats (Nowell and
Jackson, 1996). It is found in almost every kind of habitat, from the rainforests of the
tropics to desert and temperate regions (Kitchener, 1991). It is known to occur from
across Africa to south Asia northwards to central Asia and east to the Amur valley in
Russia (Bailey, 1993). Leopards in Bhutan are believed to occur throughout the country,
10
although these claims need to be confirmed with scientific study. Although it is the most
common of the large cats, it is included in the Appendix 1 of CITES because extensive
hunting had depressed populations in several parts of Africa. In Bhutan, leopards and
tigers are included in schedule I of the Bhutan Forest and Nature Conservation Act of
1995 (Wang, 2001).
The leopard shows considerable variation in its physical appearance, having a
coat of any color from pale yellow to deep gold, patterned with black rosettes. Melanistic
individuals, in which the rosettes are faintly seen, are also found. Average adult weights,
obtained from Sri Lanka, are 56 kg for males and 29 kg for females, while two males
from Central India weighed 50 and 70 kg (Nowell and Jackson, 1996).
Tigers are the largest of the cats, weighing up to about 250 kg and measuring
about 3.2 meters from the tip of the nose to the tip of tail. Although tigers existed in large
numbers during the last century, they are now being threatened due to habitat
fragmentation, poaching for wildlife trade and decreasing prey populations (Karanth and
Sunquist, 1995). About 70 tigers are believed to be living in the wild in Bhutan (MoA,
1998).
Cats exhibit a wide range of social grouping behaviour, ranging from the group
living lions to the solitary leopard. Most species are markedly asocial (Kitchener, 1991).
Among the larger felids the lion is the most sociable. Both cheetahs (Acinonyx jubatus)
and tigers are both considered more likely to be found in groups than the leopard (Bailey,
1993).
Leopards have been found to be essentially solitary and territorial animals by
Hamilton (1976), who found that they were most likely to socialize at the carcass of large
prey. Ten percent of his 122 sightings at baits were of two leopards. In Wilpattu, out of
96 sightings of leopards, 78 were of solitary animals, 10 were of adult male and adult
female, presumably courting pairs, four were females with juveniles, and four were

11
unclassified. The only social groupings seen were thus mothers with cubs and courting
pairs (Eisenberg and Lockhart, 1972). In Ruhuna National Park, also in Sri Lanka,
Santiapillai, et al. (1982) recorded 84.4% of their 32 observations as solitary, 6.3% as
pairs, two observations of three and one observation of four animals together. The groups
were of females with cubs. Schaller (1972) observed pairs in three instances out of a total
of 155 observations, the rest of which were of solitary leopards. Bailey (1993) found that
no interactions occurred between resident males in his study area and that most
interactions that occurred between males and females were associated with courtship.
Communication among leopards and tigers have been speculated by Bailey
(1993) to serve several functions, chief among which are to allow them to separate
themselves in space and time; to attract the opposite sex during courtship and to
distinguish each other by age, sex and individual status. Scent marking is the primary
mode of communication. This includes scraping, marking with scats and spraying of
urine. In tigers, these have been found to be used most often along trails and trail
intersections that serve as common boundaries between territories (Smith, et al., 1989).
In Nepal the leopard land tenure system was suggested as one in which the home
range of a male enclosed the home ranges of many females (Seidensticker, 1976). In
Wilpattu, a male enclosed the home range of a single female (Muckenhirn and Eisenberg,
1973). Rabinowitz (1989) in Thailand found that male leopards had slightly overlapping
home ranges of 27-37 km2 enclosing female ranges of between 11-17 km2.
Bailey (1993), in South Africa, found little spatial overlap between home ranges
of adult male leopards, which decreased even further during the wet season. Female
home ranges also overlapped a little, while male home ranges completely overlapped
many female home ranges, as in the Nepal study. Female home ranges appeared to be
related to availability of prey needed to successfully raise young ones. He visualised the
land tenure system of leopards as a superimposition of three layers of mosaics. The first
12
layer would be that of female home ranges with various degrees of overlap on which
would be superimposed the second layer of male home ranges displaying little overlap
amongst them but each male range covering the ranges of several females. A third layer
would be that of the floaters or transients, mostly juvenile and non-resident individuals
without territories. Eisenberg and Lockhart (1972) found that until the age of puberty
juveniles were tolerated, after which they became transient until they could find a
suitable undefended portion of habitat where they could establish and defend a territory.
Tigers are behaviourally flexible and can adapt to a host of alteration in their
landscape (O’Brien, 2003). Tigers tend to have larger home ranges than leopards, mostly
due to low density in the central Himalayan region of 0.54 adult tigers 100 km-2.
However this density is influenced by prey base and habitat conditions. For instance,
MoA (1998) reported a much higher density of 2 adult tigers100 km-2 in Bhutan.
Feeding habits and prey species
Leopards and tigers are both opportunistic feeders only differing in that leopards
take medium bodied prey while tigers tend to go after larger prey. Leopards tend to be
more flexible with their diet than tigers, especially under deteriorating habitat conditions
(Ramakrishnan, et al., 1999). This makes leopards more successful than tigers at adapting
to their environment.
In southern India, leopards are thought to be more successful than dholes and
tigers because of their ability to climb, cache their prey in trees, take small sized prey and
be relatively independent of water (Johnsingh, 1983). They have been shown to kill
medium sized prey, mainly impala (Aepyceros melampus), but also take a very wide
variety of small animals in Kruger National Park, South Africa (Bailey, 1993). Hamilton
(1976), in his pioneering study on leopards in Tsavo found that their diet consisted of a
significant number of small prey. In the Kalahari desert leopards have been known to

13
take small prey like bat-eared fox (Otocyon megalotis), jackal (Canis spp), genet
(Genetta spp), hare (Lepus spp), duiker (Cephalopus spp) and porcupine (Hystrix spp)
(Bothma and Le Riche, 1984). Bertram (1978) found that a sample of 150 kills
comprised over 30 different species in the Serengeti.
In Sri Lanka, based on a sample of 29 kills, attempted kills and evidence from
scats, leopards took mainly chital (Axis axis) and wild pig (Sus scrofa), but also sambar
(Cervus unicolor), langur (Presbytis entellus), hare (Lepus nigricollis), porcupine
(Hystrix indica) and domestic buffalo calves (Muckenhirn and Eisenberg, 1973).
In Nepal, Seidensticker, et al. (1990) found wild pig, sambar, chital, hog deer
(Axis porcinus), barking deer (Muntiacus muntjac) and domestic cattle as part of the
leopard's diet. Prey below 50 kg in weight made up the bulk of the diet. Outside the
boundaries of Royal Chitawan National Park domestic livestock made up much of the
diet and seemed to be sustaining the leopard population.
In the Pakistan Himalayas, Schaller (1967) found leopards preying mainly on
wild goats (Capra aegagrus) but also on livestock, hare and porcupine. Rabinowitz
(1989) in Thailand found leopards preying on primates as did the rainforest leopards in
the Tai National Park of the Ivory Coast (Jenny 1996). Ravi (1993) found leopards to be
preying on langurs (Presbytis spp) in Gir.
In the Himalayas, leopards have been known to take goral (Nemorrhaedus goral).
In the Shivalik hills of Rajaji National Park, analysis of scats has shown that leopards eat
chital, sambar, barking deer, goral and livestock. In Sariska Tiger Reserve a large
proportion of leopard scats contained rodents. The leopards on the Mundanthurai plateau
were reported to be preying mainly on sambar (Sathyakumar, 1992), while Johnsingh
(1983) in Bandipur found that 66% of leopard kills were chital. Fifteen and a half percent
of the kills weighed more than 100 kg. Ravi (1993) found that of the 200 scats that he
14
analyzed from Gir, 40% contained chital remains while langur remains were found in
25% of the scats.
Tigers are also opportunistic predators feeding on larger prey species weighing
on average between 50 and 100 kg. In areas where prey density is low, tigers may kill
heavier animals like adult gaur (Bos gaurus), weighing about 900 kg, or other times it
may attack smaller prey and even livestock. It is under such circumstance that tigers then
come in conflict with smaller cats such as leopards and with humans. Tigers in Bhutan
were known to mainly predate on sambar, barking deer, and at higher elevations, serow
(Capricornis sumatraensis) and takin (Budorcus taxicolor) (MoA, 1998). A tiger makes
about 40 to 50 kills representing approximately 3,000 kg of prey in a year (Karanth,
1995).
Interactions with humans
The growing human population in the tropical regions of the world has resulted in
extensive habitat loss for large predators, and poses the main threat to the conservation of
wild cats (Kitchener, 1991). In addition to this, the fur and body parts of many cat species
have considerable value in the wildlife trade, encouraging poaching and endangering
their continued survival (Fitzgerald, 1989). All over its range, leopard populations have
declined severely and predictions have been made that in another twenty years available
range in sub-Saharan Africa will decline by half (Martin and de Meulenaer, 1988).
Opinion about its future in Africa outside protected areas has been pessimistic with Cobb
(1981) saying that we must accept the fact that man will not co-exist with leopards and
will continue to kill them. Habitat destruction; loss of wild prey; poaching for skins,
bones and claws and poisoning carcasses of livestock killed by leopards are significant
threats to the animal (Nowell and Jackson, 1996).

15
Strategies targeted at conservation of leopards and tigers will need to take into
account the fact that many leopards and tigers exist outside protected areas and close to
human habitation. Any long-term strategy has to therefore have the involvement of rural
people (Anderson and Grove 1989). Amelioration of conflict resulting from livestock
killing and occasional ‘human-eating’ is especially important in the Bhutanese context.
Control of illegal international markets for skin and bones is also vital. Bailey (1993)
suggested a three-pronged strategy for conservation of the African leopard involving
education and awareness programs for children, strengthening of protected areas and
utilization of leopards on a sustainable basis for the benefit of people living in and around
leopard habitats.
Eighty percent of Bhutan’s population is involved in agriculture and livestock
herding is an integral part of agriculture (Wang, 2004). Because leopards and tigers in
Bhutan share their habitat with domestic livestock, there will inevitably be some level of
predation on them. Leopards and tigers accounted for about 82% of the total livestock
killed by wildlife in Jigme Singye Wangchuck National Park (Wang and Macdonald,
2006). Norton, et al. (1986), however, found in Africa that a negligible number of
leopard scats examined contained remains of sheep or goat in areas with plentiful natural
prey. A study on a ranch in Africa concluded that compared to total losses due to all
causes, the proportion of livestock lost to leopards was small (Mizutami, 1993).
However, Schaller (1967) thought that leopards on the periphery of Kanha Tiger Reserve
subsisted almost entirely on livestock. Compared to tigers, the leopard's habit of breaking
into sheds and living near villages makes it a greater potential threat to livestock.
Leopards have also been known to turn to killing humans. The ‘human-eater’ of
Rudraprayag claimed about 125 victims before being shot (Corbett, 1981). Between
1982-1989, 170 people were killed by leopards in India, the majority of them being in the
Garhwal, Kumaon and Chamoli hill districts of Uttar Pradesh (Johnsingh, et al., 1991).
16
The leopard has been documented to be adaptable with respect to its habitat and
food requirements, being found in intensively cultivated and inhabited areas as well as in
and around urban development (Nowell and Jackson, 1996). The generalist nature of this
species implies a wide variation in its ecology across its range. The food habits,
abundance, activity patterns and the nature of the leopard's interaction with humans and
domestic animals in various types of ecosystems in Bhutan needs to be studied so as to
formulate site-specific management strategies to ensure its long-term conservation.
Reconciliation strategies
Conflicts between wild carnivores and farmers must be resolved if
conservation is to succeed into the next century. Farmers are the people closest to the
environment and they understand it better than anyone. It is therefore of great
importance to get their support in conservation efforts. They must be involved in
carrying out conservation tasks and there must exist some mechanism to reward them
for their sacrifices, be it livestock loss or crop damage. While compensation may
reduce hostility towards wild predators and improve farmers’ attitudes towards
conservation, co-management may make them more responsible for conserving their
environment.
Compensation
Protected area management can only be effective and sustainable if the basic
concerns, needs and aspirations of the local people are addressed in parallel with those
of wildlife. Thus, protected area managers must find acceptable and sustainable
solutions to satisfy agropastoralists who have lost their stock and crops to wildlife.
Over the long-term, the natural prey base must be expanded so that predator
dependency upon livestock and livestock-predator conflicts are reduced. The question

17
remains whether or not compensation is a feasible solution given that many
researchers have reported mixed results (Sharma 1990; Oli, et al., 1994; Saberwal, et
al., 1994; Studsrod and Wegge, 1995; Cozza, et al., 1996; Mishra and Madhusudan,
2002; Naughton-Treves, 1998; Allen and McCarthy, 2001; Maikhuri, et al., 2001;
Yoder, 2002).
Compensation programs have been adopted in many countries to reduce
wildlife-human conflicts and they are generally believed to be worth their costs,
especially in reducing animosity in agricultural communities (Conover, 2002). Many
respondents that Allen and McCarthy (2001) interviewed in Mongolia suggested that
the government should compensate herders for losses due to snow leopard predation.
Farmers in the U.S. have argued that wildlife are managed by the government, and
therefore, the government should be liable for any damages inflicted on private
property by wildlife, just as farmers are liable if their domestic animal destroyed a
neighbor’s property (Conover, 2002). In addition agricultural landowners provide
much of the wildlife habitat throughout the U.S. and the world, and wildlife-inflicted
damage to crops, livestock and other property is among the costs of maintaining
wildlife populations. Hence, cooperation of farmers is essential for successful
conservation of wildlife. Realizing this fact, most agencies in the U.S. and Canada
maintain some form of program to address wildlife-inflicted damage, and many
provide consultation services, direct abatement and subsidies for fences and dispersal
devices (Conover, 2002). Some states maintain compensation programs to reimburse
agricultural landowners for wildlife-inflicted damage (Yoder, 2002). The
compensation and abatement programs also inexpensively generate damage data as a
byproduct, which would otherwise have to be obtained through costly surveys. These
data can be used to make very important inferences regarding wildlife population
densities, hotspots and prices of livestock and agricultural commodities, as well as the

18
extent of economic losses, all of which can be used for management planning and
policy formulation purposes.
Compensation may be problematic in other parts of the world, as it can be a
drain on the financial resources of governments and protected areas. In many
developing countries, compensation is not a viable option, as it requires huge budgets.
Also, there is a lack of effective means for validating claims, dispensing funds and
minimizing potential fraudulent claims. If compensation is to be implemented, it
should be targeted at disadvantaged individuals who have suffered depredation losses,
rather than at an entire community. Studies from Trans-Himalayan region indicate that
there is dissatisfaction with the system used by governments to compensate villagers
for livestock losses (Saberwal, et al., 1994; Maikhuri, et al., 2001). Eighty-six percent
of the respondents (n = 61) interviewed by Saberwal, et al. (1994) complained that
compensation levels for livestock kills were too low in comparison to the purchase
price of replacement animals. Furthermore, 81% of the respondents stated that they
did not file for compensation upon losing livestock to lions because of the procedural
problems associated with filing such claims. Problems cited included excessive travel
to report losses, the likelihood that an official would not be available to register a
reported livestock depredation within the mandatory reporting period (less than 24
hours after the kill), subjective assessment by the officials of the worth of depredated
livestock and difficulties associated with receiving payments for settlements
(Maikhuri, et al., 2001; Saberwal, et al., 1994). Villagers living adjacent to Nepal’s
Royal Bardia National Park were allowed to collect grass for a period of two weeks as
a compensation for damage caused by wildlife. More than 70% of the respondents
(N=181), stated this as a reason for positive attitudes towards the Park (Mishra, 1982;
Sharma, 1990; Studsrod and Wegge, 1995). Studsrod and Wegge (1995) also warned

19
that a well-established system of compensation might serve to attract more immigrants
to the protected areas.
Experiences in Italy found that compensation programs alone were not
effective in reducing conflicts or in preventing illegal, private efforts to control wolf
numbers (Cozza, et al., 1996; Ciucci and Boitani, 1998). In addition, under some
conditions, financial compensation for predator attacks may actually encourage a state
of permanent conflict. In this context, compensation should not be seen as the only
means of managing depredation problems, but should be effectively integrated into a
broader strategy in which preventative husbandry practices play a critical role, and
whereby claims involving faulty husbandry practice should be either reduced or
denied.
Considering the abysmal record of compensation schemes elsewhere, direct
monetary compensation should be considered cautiously and only in the cases
involving losses due to species of conservation importance (Naughton-Treves, 1998).
Because compensation involves an instant financial incentive, such programs may
help change livestock farmers’ attitudes toward predators and improve their
communication with wildlife managers. In the long run, a combination of a carefully
designed compensation program, improved husbandry practices, and education may
resolve many conflicts. A successful resolution of the livestock predation issue is
important for the future of both local farmers and wildlife (Oli, et al., 1994).

20
REFERENCES
Allen, P. and McCarthy, T. 2001 Herders and predators in Western Mongolia- preliminary report. http://www.snowleopard.org/islt/procite. Anderson, D. and Grove, R. 1989. Conservation in Africa: people, politics and practice. Cambridge University Press, New York. Bailey, T.N. 1993. The African leopard: ecology and behaviour of a solitary felid. Columbia University Press, New York. Bertram, B.C.R. 1978. A pride of lions. Scribner's, New York. Bhatnagaer, Y.V., Stakrey, R.W., Jackson, R. 2000. A survey of depredation and related wildlife-human conflicts in the Hemis National Park, Ladakh (India). Snowline, Bulletin of International Snow Leopard Trust. Vol. XVII. Boggess, E.K., Andrews, R.D., Bishop, R.A. 1978. Domestic animal losses to coyote and dogs in Iowa. Journal of Wildlife Management. 42: 362-372 Bothma, J. Du, P. and Riche, E.A.N. 1984. Aspects of the ecology and the behaviour of the leopard Panthera pardus in the Kalahari desert. Koedoe Suppl. 27: 259-279. Butlar, J.R.A. 2000. The economic costs of wildlife predation on livestock in Gokwe communal land, Zimbabwe. African Journal of Ecology. 38: 23-30. Ciucci, P. and Boitani, L. 1998. Wolf and dog depredation on livestock in central Italy. Wildlife Society Bulletin. 26: 504-514. Cobb, S. 1981. The leopard- problems of an overabundant, threatened, terrestrial carnivore. In Problems in management of locally abundant wild mammals. pp 191-192 Jewell, P.A. and S. Holt (eds.) Academic Press, Ne York, Ny. Conforti, V.A and de Azevedo, F.C.C. 2003. Local perceptions of jagurs (Panthera onca) and pumas (Puma concolor) in the Iguacu National Park area, south Brazil. Biological Conservation. 111: 215-221. Conover, M.R. 2002. Resolving human-wildlife conflicts. Lewis Publishers, Boca Raton, Florida. Corbett, J. 1981. The man-eating leopard of Rudraprayag. Oxford Univ. Press, New Delhi.

21
Cozza, K., Fico, R., Battistini, M.L. 1996. The damage–conservation interface illustrated by predation on domestic livestock in central Italy. Biological Conservation. 78: 329 –336. Eisenberg, J.F. and Lockhart, M. 1972. An ecological reconnaissance of Wilpattu National Park, Ceylon. Smithsonian Contributions to Zoology No 110, Washington D.C. Fitzgerald, S. 1989. International wildlife trade: whose business is it? World Wildlife Fund, Washington D.C. Fox, J.L. and Chundawat, R.S. 1988. Observations of snow leopard stalking, killing and feeding behaviour. Mammalia. 52:137-140. Gadgil, M. 1990. India's deforestation: patterns and processes. Society and Natural Resources. 3: 131-143. Gadgil, M. Berkes, F., Folke, C. 1993. Indigenous knowledge of biodiversity conservation. Ambio. 22: 151-156. Greentree, C. Saunders, G. Macleod, L., Hone, J. 2000. Lamb predation and fox control in south-eastern Australia. Journal of Applied Ecology. 37: 935-943. Hamilton, P.H. 1976. The movements of leopards in Tsavo National Park, Kenya, as determined by radio-tracking. M.S. thesis, University of Nairobi, Nairobi, Kenya. Jackson, R. M. 1996. Home range, movements and habitat use of snow leopard (Uncia uncia) in Nepal. Ph. D. dissertation, University of London, UK.
Jackson, R. M. 1999. Managing people-wildlife conflict in Tibet’s Qomolangma National Nature Preserve. http://www.snowleopard.org/islt/procite/rjmp99 Jackson, R.M. and Wangchuk, R. 2000. People-wildlife conflicts in the trans-Himalaya. Workshop for the Trans-Himalayan protected areas, 25-29 August, 2000, Leh, Ladakh. Wildlife Institute of India, US Fish and Wildlife Service Himalayan Biodiversity Project and International Snow Leopard Trust. Jackson, R.M. and Wangchuk, R. 2001. Linking snow leopard conservation and people-wildlife conflict resolution: grassroots measures to protect the endangered snow leopard from herder retribution. Endangered Species Update, 18: 138-141. Johnsingh, A.J.T. 1983 Large mammalian predators in Bandipur. Journal of Bombay Natural History Society. 80: 1-57.

22
Johnsingh, A.J.T., Panwar, H.S., Rodgers, W.A. 1991. Ecology and conservation of large felids in India. In Wildlife Conservation: present trends and perspectives for the 21st century. Maruyama et al. (eds.) Procedings of the V International Congress on Ecol.ogy, Yokohama, Japan. Karanth, K.U. and Sunquist, ME. 1995. Prey selection by tiger, leopard and dhole in tropical forests. Journal of Animal Ecology. 64: 439- 450. Karanth, K.U. and Stith, B.M. 1999. Prey depletion as a critical determinant of tiger densities. In Riding the tiger: tiger conservation in human dominated landscapes. Seidensticker, J., Christie, S. and Jackson, P. (eds.). Cambridge University Press, Cambridge, UK. Kitchener, A. 1991. The natural history of the wild cats. Christopher Helm, A. and C. Black, London, UK. Knowlton, F.F., Gese, E.M., Jaeger, M.M. 1999. Coyote depredation control: an interface between biology and management. Journal of Range Management. 52: 398-412. Landa, A., Gudvangen, K., Swenson, J.E., Roskaft, E. 1999. Factors associated with wolverine Gulo gulo predation on domestic sheep. Journal of Applied Ecology. 36: 963-973. Linnell, J.C., Smith, M.E., Odden, J., Kaczensky, P., Swenson, J.E. 1996. Strategies for the reduction of carnivore – livestock conflicts: a review. NINA Opdragsmelding, 443: 1-118. Linnell, J.C., Odden, J., Smith, M.E., Aanes, R., Swenson, J.E. 1999. Large carnivores that kill livestock: do ‘problem individuals’ really exist? Wildlife Society Bulletin. 27: 698-705. Macdonald, W.D., Sillero-Zubiri, C., Wang, S. W., Wilson, D. 2004. Wildlife in conflicts-lessons from a wider context. WildCRU Lions Review. Oxford, UK. Maikhuri, R.K., Nautiyal, S., Rao, K.S., Saxena, K.G. 2001. Conservation policy- people conflicts: a case study from Nanda Devi Biosphere Reserve (a World Heritage Site), India. Forest Policy and Economics. 2: 355-365. Martin, R.B. and de Meulenaer, T. 1988. Survey of the status of the leopard (Panthera pardus ) in Sub-Saharan Africa. Secretariat on the Convention on International Trade in Endangered Species of Wild Fauna and Flora, Lausanne, Switzerland:

23
McGuire, W. J. 1969. The nature of attitudes and attitude change. In the handbook of social psychology (2nd edition). Lindzay, G. and Aronson E. (eds.). Addison-Wesley Publ. Co., Reading, MA. Meriggi, A. and Lovari, S. 1996. A review of wolf predation in southern Europe: does the wolf prefer wild prey to livestock? Journal of Applied Ecology. 33: 1561-1571.
Michaelidou, M. 2002. Moving beyond colonial perspectives in conservation: sustaining forests, wildlife, and mountain villages in Cyprus. Ph.D. dissertation, Cornell, Ithaca, New York.
Mishra, H.R. 1982. Balancing human need and conservation in Nepal's Royal Chitwan Park. Ambio. 11: 246-251.
Mishra, C. 1997.Livestock depredation by large carnivores in the Indian trans-Himalaya: conflict perceptions and conservation prospects. Environmental Conservation. 24: 338-343. Mishra, C. 2001. High altitude survival: conflicts between pastoralism and wildlife in the Trans-Himalaya. Ph. D. dissertation, Wageningen University, The Netherlands. Mishra, C. and Madhusudan, M.D. 2002. An incentive scheme for wildlife conservation in the Indian Trans-Himalaya. Proceedings of the Snow Leopard Survival Summit, May 2002, Seattle, WA. http://www.snowleopard.org/islt/procite/mcis02 Mizutani, F. 1993. Home range of leopards and their impact on livestock on Kenyan ranches. Symposium Zoological Society, London. 65: 425-439. MoA.1998. Tiger conservation strategy for the kingdom of Bhutan. Nature Conservation Division. Ministry of Agriculture, Thimphu, Bhutan. Mordi, A.R. 1991. Attitudes toward wildlife in Botswana. Garland Publishing, Inc. Ny. Muckenhirn, N. and Eisenberg, J.F. 1973. Home ranges and predation in the Ceylon leopard. In the Worlds Cats. Vol 1: Ecology and Conservation. pp 142-175, R.L. Eaton (ed.). World Wildlife Safari, Winstone, Oregon. Nass, R.D. Lynch, G., Theade, J. 1984. Circumstances associated with predation rates on sheep and goats. Journal of Range Management. 37: 423-426.
Naughton-Treves, L. 1998. Predicting patterns of crop damage by wildlife around Kibale National Park, Uganda. Conservation Biology. 12: 156-168.

24
Nepal, S.K. and Weber, K.E. 1995. Prospects for coexistence: wildlife and local people. Ambio. 24: 238-245. Norton, P.M., Lawson, A.B., Henley, S.R., Avery, G. 1986. Prey of leopards in four mountainous areas of the South-Western Cape Province. South African Journal of Wildlife Resource. 16: 47-52. Nowell , K and Jackson, P. 1996. Status and conservation of action plan: wild cats. IUCN/SSC Cat Specialist Group, IUCN.pp. 382. Gland, Switzerland: O’Brien, T.G., Kinnaird, M., Wibisono, H.T. 2003. Crouching tigers, hidden prey: Sumatran tiger and prey populations in a tropical forest landscape. Animal Conservation, 6:131-139. Oli, M.K., Taylor, I.R., Rogers, M.E. 1994. Snow leopard Panthera uncia predation of livestock: an assessment of local perceptions in the Annapurna Conservation Area, Nepal. Biological Conservation. 68: 63–68. Pearson, E.W. and Caroline, M. 1981. Predator control in relation to livestock losses in central Texas. Journal of Range Management. 34: 435-441. Rabinowitz, A.R. 1989. The density and behaviour of large cats in a dry tropical forest in Huai Kha Khaeng Wildlife Sanctuary, Thailand. Natural History Society Bulletin. 37: 235-251. Ramakrishnan, U., Coss, R.G., Pelkey, N. (1999). Tiger decline caused by the reduction of large ungulate prey: evidence from a study of leopard diets in southern India. Biological Conservation. 889: 113-120. Ravi, C. 1993. Ecology of the Asiatic lion Panthera leo persica. Ph.D. dissertation, Saurashtra University, Gujarat, India. RGoB 2002. Biodiversity action plan. Ministry of Agriculture, Thimphu Bhutan. Robel, R.J., Dayton, A.D., Henderson, R.R., Meduna, R.L., Spaeth, C.W. 1981. Relationships between husbandry methods and sheep losses to canine predators. Journal of Wildlife Management. 45: 894-911. Saberwal, V.K., Gibss, J.P., Chellam R., Johnsingh, A.J.T. 1994. Lion-human conflict in the Gir Forest, India. Conservation Biology. 8: 501-507. Sacks, B.J., Jaeger, M.M., Neale, J.C.C., McCullough, D.R. 1999. Territoriality and breeding status of coyotes relative to sheep predation. Journal of Wildlife Management. 63: 593-605.

25
Santiapillai, C., Chambers, M.R., Ishwaran, N. 1982. The leopard Panthera pardus fusca (Meyer 1794) in the Ruhuna National Park, Sri Lanka and observations relevant to its conservation. Biological Conservation. 23: 5-14. Sathyakumar, S. 1992. Food habits of leopard (Panthera pardus) on Mundanthurai plateau, Tamil Nadu, India. Tiger Paper Vol XIX, 8-9. Schaller, G.B. 1967. The deer and the tiger. University of Chicago Press, Chicago. Schaller, G.B. 1972. The Serengeti lion. University of Chicago Press, Chicago. Seidensticker, J.C. 1976. On the ecological separation between tigers and leopards. Biotropica. 8: 225-34. Seidensticker, J.C., Sunquist, M.E., McDougal, C.W. 1990. Leopards living at the edge of Royal Chitwan National Park. Bombay Natural History Society centennial publication. India
Sharma, U.R. 1990. An overview of park-people interaction in Royal Chitwan National Park, Nepal. Landscape and Urban Planning. 19: 133-144.
Shiva, V., Sharatchandra, H.C., Bandyophadhyay, J. 1982. Social forestry-no solution within the market. The Ecologist. 12: 158-168. Smith, J.L.D., McDougal, C.W., Miquelle, D. 1989. Scent marking in free-ranging tigers, Panthera tigris. Animal Behaviour. 37: 1-10. Stahl, P., Vandel, J.M., Herrenschmidt, V., Migot, P. 2001. Predation on livestock by an expanding reintroduced lynx population: long-term trend and spatial variability. Journal of Applied Ecology. 38: 674-687. Steneck, R.S. (2005). An ecological context for the role of large carnivores in conserving biodiversity. In Large carnivores and the conservation of biodiversity. pp. 9-32. Ray, J.C., Redford, K.H., Steneck, R.S., Berger J. (eds.). Island Press, Washington, D.C. Studsrod, J.E. and Wegge, P. 1995. Park-people relationships: the case of damage caused by park animals around the Royal Bardia National Park, Nepal. Environmental Conservation. 22: 133-142.
Sukumar, R. 1991. The management of large mammals in relation to male strategies and conflicts with people. Biological Conservation. 55: 93-102.
Sunquist, M.E., Karanth, K.U., Sunquist, F. (1999). Ecology, behavior and resilience of the tiger and its conservation needs. In riding the tiger: tiger conservation in human-

26
dominated landscapes. Seidensticker, J., Christie, S., Jackson, P. (eds.). Cambridge University Press. Cambridge, UK. Wang, S. W. 2001. Conservation management plan for the Black Mountains National Park, Ministry of Agriculture, Thimphu, Bhutan. Wang, S.W. 2004. The impacts of wildlife damage and conservation policies on farmer attitudes in Jigme Singye Wangchuck National Park, Bhutan. M.S. thesis, Cornell University. Ithaca, NY. Wang, S.W. and Macdonald, D.W. 2006. Livestock predation by carnivores in Jigme Singye Wangchuck National Park, Bhutan. Biological Conservation.129: 558-565. Wang, S.W., Curtis, P., Lassoie, J.P. 2006a. Farmer perceptions of crop damage by wildlife in Jigme Singye Wangchuck National Park, Bhutan. Wildlife Society Bulletin. 34: 359-365. Wang, S.W., Lassoie, J.P., Curtis, P. 2006b. Farmer attitudes towards conservation in Jigme Singye Wangchuck National Park, Bhutan. Environmental Conservation. 33: 1-9. Yoder, J. 2002. Estimation of wildlife-inflicted property damage and abatement based on compensation program. Land Economics. 78: 45-59.
Yom-Tov, Y., Ashkenazi, S., Viner, O. 1995. Cattle predation by the golden jackal Canis aureus in the Golan Heights, Israel. Biological Conservation. 73:19-22. Zube, E.H and Busch, M.L. 1990. Park-people relationships: and international review. Landscape and Urban Planning. 19:117-131.

27
CHAPTER II
LIVESTOCK PREDATION BY CARNIVORES IN JIGME SINGYE WANGCHUCK NATIONAL PARK, BHUTAN
Abstract
Villages in Jigme Singye Wangchuck National Park, central Bhutan, report
livestock depredation by wild carnivores including leopard (Panthera pardus), tiger
(Panthera tigris), Himalayan black bear (Ursus thibettanus) and dhole (Cuon alpinus).
In a survey of 274 households in six different geogs (sub-districts) within the park,
21.2% of households surveyed reported losses of a total of 2.3% of their domestic
animals to wild predators over 12 months. This loss equated to an average annual
financial loss equal to 17% (US$ 44.72) of their total per-capita cash income. Total
reported losses during 2000 amounted to US$ 12,252, of which leopard and tiger kills
accounted for 82% (US$ 10,047). Annual mean livestock loss per household reporting
loss was 1.29 head of stock, equating to more than two-thirds of their annual cash
income of US$250. Lax herding, inadequate guarding practices and overgrazing may
have contributed to livestock losses. About 60% of the households lacked proper
stables for corralling their livestock at night and there was a significant correlation
between the number of livestock lost and the distance between the household and the
grazing pasture. Overall, reported predation rates have increased since the inception of
the Park in 1993 and since implementation of the Forest and Nature Conservation Act
in 1995, which prioritizes some of Bhutan’s key livestock predators for conservation. I
propose livestock intensification programs, including pasture improvement, and
financial compensation as short-term measures to reduce conflict between people and
predators. In the long-term, I recommend that the feasibility of an insurance scheme
should be tested, the possibility of relaxing the resource use restrictions in the Forest
and Nature Conservation Act of 1995 be explored, and that farmers should be

28
involved in managing human–wildlife conflicts, particularly through improving their
own herding and guarding practices, and building proper corralling facilities and
adopting reliable corralling procedures.
Introduction
Conflict between wildlife and humans is a significant problem in many parts of
the world. Influential factors include increasing human populations, loss of natural
habitat, and, in some regions, growing wildlife populations resulting from successful
conservation programs (Saberwal, et al., 1994). Conflict can be particularly serious,
where rural people live in close association with protected areas (Mishra, 2001;
Conforti and de Azevedo, 2003). Most protected areas in Bhutan support some form of
land use, such as agriculture, livestock grazing and/or the harvesting of timber and
non-timber forest products (Wang, 2004). Livestock holdings form an integral part of
the local pastoral and agricultural economy and grazing of substantial herds is
widespread in, or adjacent to, protected areas. Predators attack livestock that are
grazed in, or close to, forest areas, and venture into farms to take livestock, as well as
posing risks to humans. Such damage to local livelihoods angers farmers who may
resort to retribution (Conforti and de Azevedo, 2003), thereby breeding a conflict of
interest between local communities and wildlife managers.
Human–wildlife conflict attracts greatest attention when the wildlife species
involved is endangered or where the conflict poses a serious threat to human welfare
(Saberwal, et al., 1994). Both conditions apply to the situation in Jigme Singye
Wangchuck National Park. The Park harbors 17 of those mammals listed in Schedule I
of Bhutan’s Forest and Nature Conservation Act of 1995, of which tiger (Panthera
tigris), leopard (Panthera pardus), Himalayan black bear (Ursus thibetanus) and dhole
(Cuon alpinus) are among the highest priorities for conservation. In Bhutan, their

29
survival is threatened by deteriorating habitat (due to overuse of the forest for grazing
and collection of forest products), declining numbers of wild prey and poaching.
Dhole were previously widespread in Bhutan, but were perceived as pests of livestock
and poisoning by farmers exterminated most of the population. Seemingly as a result
the wild pig (Sus scrofa) population increased, this resulting in serious crop damage
(Choden and Namgay, 1996; Wang, 2004). In an attempt to rectify the pig-damage
problem dhole were reintroduced into Bhutan in the early nineties and the species is
now becoming reestablished. A parallel exists in the eradication of African wild dog
(Lycaon pictus) partly due to conflict with cattle ranchers (Rasmussen, 1999).
For the first time in Bhutan, I examine the extent and magnitude of conflict
between carnivores and agropastoralists in Jigme Singye Wangchuck National Park,
and I propose measures that may reduce this conflict. I also describe traditional
livestock-herding practices used in the Park, quantify the perceived economic losses to
local communities and document their retaliatory actions. This chapter also evaluates
the impact of the Forest and Nature Conservation Act of 1995, by comparing reported
predation patterns before and after implementation of the Act.
Study area
Jigme Singye Wangchuck National Park was selected as an appropriate study
area (Figure 2.1). The great altitudinal range within the park (150–5,000 above mean
sea level [amsl]) accommodates extremely diverse habitats, from subtropical
rainforests to alpine meadows and snow-capped peaks. The Park contains more than
5,000 species of vascular plants, as well as 40 species of mammals (of which tigers
and red panda [Alurus fulgens] are endangered and 15 other species are either
vulnerable or threatened) and 391 species of birds (of which the white-bellied heron
[Ardea insignis] is endangered and another 16 species are either vulnerable. The Park

30
Figure 2.1. Location of Jigme Singye Wangchuck National Park and study sites in Bhutan.

31
supports 10–15% of Bhutan’s tiger population in its cool and warm broadleaved
forests. Important populations of red panda and musk deer (Moschus chrysogaster)
live in the sub-alpine forests, and during the winter, black-necked cranes (Grus
nigricollis) frequent the northern part of the glacier valley (3500 amsl). The Park acts
as a corridor between national parks (the Royal Manas National Park, in the south, and
Jigme Dorji National Park and Trumshingla National Park, in the north), and has a
reputation for conflict between its wildlife and its 5,000–6,000 human inhabitants.
Methods
I conducted a questionnaire survey in 2000 that canvassed 274 (50% of total
households) randomly selected households from within six geogs (sub-districts) of the
Park (Figure 2.1): Athang (56 households), Trong (44), Korphu (32), Phobji (21),
Langthel (59), and Tangsibji (62).
The geogs of Phobji, Langthel and Tangsibji were defined as the ‘buffer zone’
because they lie along the boundary of the Park and have greater access to roads and
other sources of livelihood. Athang, Trong and Korphu, which lie further away from
the Park boundary, were defined as the ‘inner zone’. Respondents (the head of the
household or their spouse) were asked questions relating to household demographics,
education and employment; number of livestock owned; livestock management;
number of livestock lost to predation; perceived problem carnivores; resource
extraction (including collection of non-timber forest products) and livelihood issues
including financial self-sufficiency.
Interviews were conducted by members of park staff who have worked with
these communities for several years, in order to minimize the likelihood of receiving
inaccurate responses. Livestock kills were verified by a team comprising a local park
official, a livestock extension agent (an official posted to a village to regulate livestock

32
related issues, who is required to authenticate livestock kills by wildlife) and the head
of the particular community. I trained park officials to identify the predator
responsible for livestock kills using a combination of signs (such as pug marks,
scrapes, scats, attack marks, etc.). Demographic and livelihood data were cross
validated with records held by local government administrators. Information on
livestock holdings, the number reported lost to predation and details regarding grazing
areas, were cross-checked with records maintained at the park head office. Secondary
data on livestock numbers and numbers lost to predation for the years 1993, 1995
(before enforcement of the act), and 2001 (after both the Park and the act came into
being) were collected from archival records kept at the Park office. These data were
used to evaluate questionnaire responses on changes in human and livestock
demographics and to compare conflict trends before and after the establishment of the
Park in 1993 and enforcement of the Forest and Nature Conservation Act of 1995.
Data were analyzed using Minitab version 13 (Hampton, 1994). Data were tested
for normality using the Anderson-Darling test and the Levene’s statistic was used to
test for homogeneity of variance. Data were transformed by their natural logarithm
when testing correlation between loss and grazing in the far pastures and statistical
tests used included simple t-tests, analysis of variance (ANOVA), Chi square test and
Tukey’s test. Predator ‘hotspots’ were characterized following Spearing (in litt.) and
were ranked according to each of the following three criteria: number of livestock
killed, percentage of herd killed, and percentage of stockholdings killed.
Results
Livelihood strategies
Park residents are primarily subsistence farmers within the local market
economy. Livestock (20%) and cultivation (42%) formed the main sources of rural

33
livelihoods, supplemented by non-farm activities (26%), such as business, government
service or casual labor (n = 274). Twelve percent (12%) of farmers (n = 274)
supplemented their livelihood by collecting forest products. Non-farm activities were
more common (59%) in the buffer zone (n = 142), than in the inner zone (41%) (n =
132). Main sources of cash income among park residents were the sale of livestock
(32%) and agricultural products (38%), non-farm products (16%), and forest products
(14%) (n = 274). Most households in the higher altitude geogs of Phobji and Tangsibji
obtained cash income from selling potatoes, yak meat and yak products. People at
lower elevations, in Langthel and Trong, depended on livestock and crops, such as
mustard, oranges, cardamom or guava. Annual cash income per household was about
11,000 Bhutanese Ngultrums (about US$ 250 [range; US$5–US$2500]). A few
individuals reaped substantial benefits from salaried or casual employment, but several
families (14%) received remittances from family members working in office jobs in
cities. Most households (95%) incurred cash expenditures for basic goods, such as salt,
kerosene or schooling, while the others (5%) bartered.
Most of the vegetables and fruits sold came from kitchen gardens, while potatoes
in the buffer zone were grown in the dry lands, especially in Phobji geog. Many
households in both zones sold animal meat and/or products (Table 2.1).
Herd dynamics or livestock holdings
In 2000, 85% of households (n = 274) reared a total of 3,275 head of livestock,
with an average herd size of 12 head (SD = ±11.5) of stock per household (Table 2.2).
Ownership of livestock by households was highly skewed (range: 0–105 stock per
household). Most households (80%) owned 20 or less animals; 16% of households
owned 21 or more animals and 4% did not own any animals.

34
Table 2.1. Comparison of sources of cash incomes from livestock in inner and buffer zones of Jigme Singye Wangchuck National Park (2000). Livestock Inner zone (%) Buffer zone (%)
Milk/butter 32 53
Pig/pork 17 11
Poultry/poultry meat 16 1
Eggs 30 18
n for inner zone = 132; n for buffer zone = 142
Table 2.2. Average composition of livestock herds per household in the study geogs of Jigme Singye Wangchuck National Park (2000). Geog n Cattle Yak Horse Sheep Pig Averagea
Athang 56 9.6 0.3 0.9 0.7 0.2 11.7 Trong 44 8.0 0.0 0.5 0.0 0.5 9.0
Korphu 32 7.3 0.0 0.6 0.0 0.1 8.0
Phobji 21 7.7 4.4 1.2 8.1 1.7 23.2
Langthel 59 7.5 0.0 0.2 0.1 0.4 8.1
Tangsibji 62 11.8 0.0 0.4 1.9 2.2 16.2
Livestock/household 9.0 0.4 0.5 1.2 0.8 12
% of the total herd 75.0 3.3 4.6 10.1 7.0 100
n = number of households in the study geogs. a = average number of livestock held by a household.
Significantly more households grazed their cattle in fallow fields in forest near
their villages (55%), than in distant pastures (more than one day’s walk from human
settlement) (21%) or in a combination of these two areas (24%) (T = 9.28, p < 0.001).
Loss of livestock was significantly and positively correlated with the percentage of the
herd that was grazed in distant pastures (coefficient of correlation, r = 0.7, p < 0.001),
but not with the percentage grazed near to the village.

35
Farmers either penned their livestock below their living quarters (when they had
small herds), kept them in purpose built stables, left them unattended at night in the
pasture or forest (particularly when livestock were in distant pastures) or tethered them
in fields (Figure 2.2). Approximately 60% of the households in the study geogs lacked
proper stables for corralling their livestock and consequently left them unprotected at
night.
Livestock losses
Respondents reported a total of 76 (2.3%) domestic animals killed by predators
in a period of one year. Farmers attributed 40 kills (53%) to leopards, 20 (26%) to
tigers, 10 (13%) to dhole and 6 (8%) to bears (Table 2.3). The majority of tiger kills
were cows (95%), mostly occurring in Trong (42%) and Langthel (37%). The greatest
proportion of leopard kills (35%) was reported in Athang, where there were no reports
of tiger predation, and the fewest were in Tangsibji and Phobji (5%). Losses attributed
to bears were most frequent in Athang (50%), while reported losses to dhole were
most frequent in Phobji (40%).
Frequency of reported livestock losses was significantly greater in the inner zone
(n = 41) than in the buffer (n = 35) zone (F = 7.23, p < 0.01). The greatest proportion
of reported livestock loss occurred in Langthel (4.2%) and Trong (4%). Mean loss per
household (that lost livestock) was 1.29 head of livestock per annum (Table 2.3),
which would cost 84% of their annual cash income to replace these animals. This
mean loss was considerably higher for households in Trong (3.2 per household) than
in other geogs.
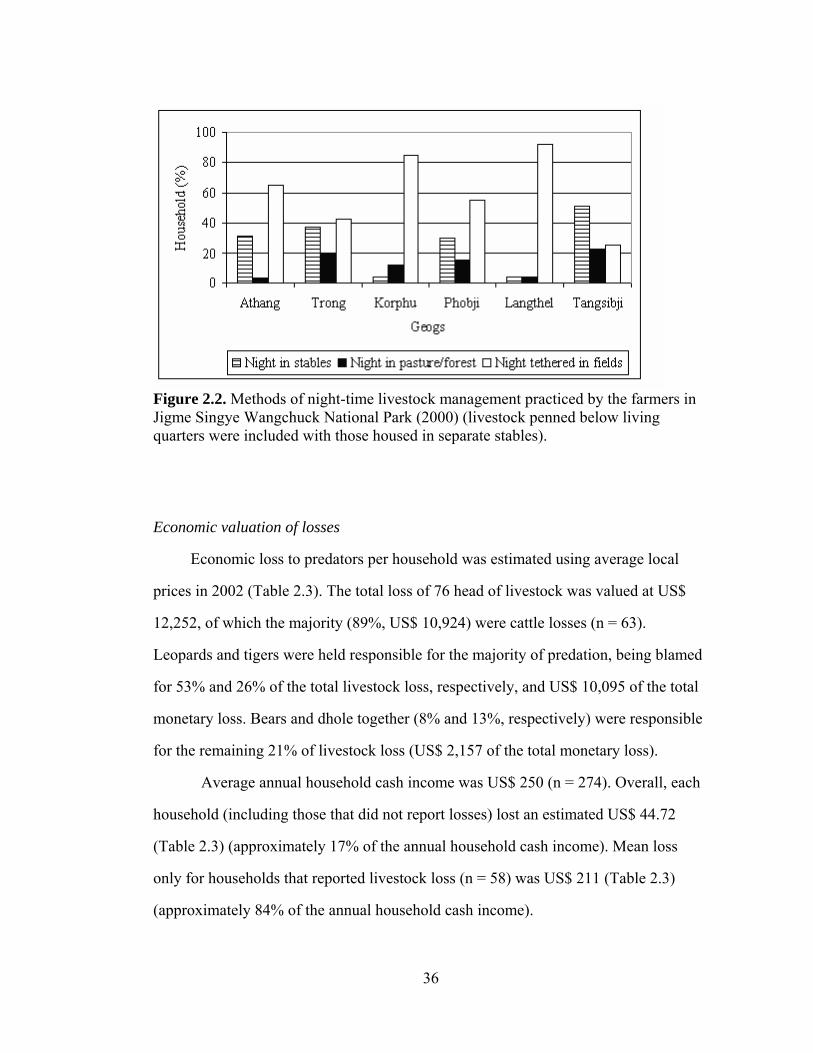
36
Figure 2.2. Methods of night-time livestock management practiced by the farmers in Jigme Singye Wangchuck National Park (2000) (livestock penned below living quarters were included with those housed in separate stables).
Economic valuation of losses
Economic loss to predators per household was estimated using average local
prices in 2002 (Table 2.3). The total loss of 76 head of livestock was valued at US$
12,252, of which the majority (89%, US$ 10,924) were cattle losses (n = 63).
Leopards and tigers were held responsible for the majority of predation, being blamed
for 53% and 26% of the total livestock loss, respectively, and US$ 10,095 of the total
monetary loss. Bears and dhole together (8% and 13%, respectively) were responsible
for the remaining 21% of livestock loss (US$ 2,157 of the total monetary loss).
Average annual household cash income was US$ 250 (n = 274). Overall, each
household (including those that did not report losses) lost an estimated US$ 44.72
(Table 2.3) (approximately 17% of the annual household cash income). Mean loss
only for households that reported livestock loss (n = 58) was US$ 211 (Table 2.3)
(approximately 84% of the annual household cash income).

37
Table 2.3. Economic valuation of reported livestock kills (n) by wild predators in the study geogs in 2000. Unit value
(US $) Tiger
(US $) Leopard (US $)
Bear (US $)
Dhole (US $)
Overall (US $)
Cattle 173.40 3295 (19) 5549 (32) 1040 (6) 1040 (6) 10924 (63)
Yak 319.10 0 319 (1) 0 0 319 (1)
Horse 187.70 0 536 (3) 0 0 536 (3)
Sheep 19.10 0 38 (2) 0 77 (4) 115 (6)
Pig 119.10 119 (1) 238 (2) 0 0 357 (3)
Total loss 3414 (20) 6681 (40) 1040 (6) 1117 (10) 12252 (76)
Mean loss -per hha 12.46
(0.07)
24.38
(0.15)
3.80
(0.02)
4.08
(0.04)
44.72
(0.27)
-per hhb 58.86
(0.33)
115.19
(0.69)
17.94
(0.10)
19.26
(0.17)
211.24
(1.29)
Loss as a % of -total herd 26 53 8 13 100 -per capita incomea 4.98 9.75 1.52 1.63 17.88 -per capita incomeb 23.53 46.06 7.17 7.70 84.46 -per capita incomec 10.94 21.41 3.33 3.58 9.81
Numbers in parenthesis represent numbers of individual killed. The conversion rate from Bhutanese Ngulturm was 1US$ = 47 Ngulturms hh = household. a = Considering all the respondents (n = 274) b = Considering only the affected respondents (n = 58)
Predation trends before and after 1995
Overall predation increased significantly between 1993 and 2001 (F = 3.09,
p<0.01: Table 2.4). This comprised a significant increase in recorded predation
between 1993 (mean = 0.16, SE = ±0.05,) and 1995 (mean = 0.29, SE = ±0.03) (F =
3.9, p < 0.01), no significant change between 1995 and 2000 (mean = 0.27, SE =
±0.04) and a non-significant increase between 2000 and 2001 (mean = 0.42, SE =
±0.08) (Table 2.4). There was a significant interaction between predator and year (F =

38
3.2, p < 0.001). According to my survey responses, leopards were responsible for most
of the predation loss (n = 40), followed by tiger (n = 20), dhole (n = 10) and bear (n =
6) (see Table 2.3).
There was a significant difference (p < 0.001) in reported predation loss between
each pair of predators, tiger and leopard (+0.0105:+0.1428), leopard and bear (-
0.1902:-0.0579), leopard and dhole (-0.1756:-0.0433), except bear and dhole (-
0.0807:+0.0515): tiger and dhole (-0.0990:+0.0333), tiger and bear (-
0.1136:+0.0187). Reported predation by each of leopard and dhole was significantly
higher in 2001 (mean = 0.29, F = 3.9, p < 0.01 and mean = 0.07, F = 5.20, p < 0.01,
respectively) than in all other years; there was no significant difference between the
other years). Losses due to tiger and bear predation did not differ significantly between
the four years (F = 1.86, p > 0.05; F = 2.13, p > 0.05, respectively).
Identifying predator ‘hotspots’
The top predation ‘hotspots’ in 2000 were ranked for each of the predators
(Table 2.5). Trong was the top hotspot for tigers followed by Langthel and Tangsibji.
Tigers were thought to be responsible for 42%, 37% and 16% of the total livestock
kills in the three geogs, respectively. Athang, Langthel, and Korphu were leopard
hotspots; losing 35%, 23% and 18% of the total livestock, respectively. Primary
hotspots for predation by tigers and leopards were spatially distinct, with leopards
predominating at higher altitudes than tigers, except in Langthel, where both felids
seem to co-exist. Bear damage appeared to be widespread although Athang suffered
the greatest number of losses. Dhole populations appeared to be recovering in Phobji
and Langthel, being considered responsible for 40% and 30% of the livestock taken in
these areas.

39
Table 2.4. Showing differences in mean predation in time from establishment of Jigme Singye Wangchuck National Park. Year 1993 1995 2000 2001 1993
Mean 0.16 0.29 0.27 0.42 0.16
Standard error (+/-) 0.05 0.03 0.04 0.08 0.05
P value ** NS NS ***
* = significant (p<0.05); ** = very significant (p<0.01); *** = highly significant (p<0.001); NS = non significant
Table 2.5. Predation ‘hotspots’ in Jigme Singye Wangchuck National Park according to each of three criteria for each species of predator.
Tiger Leopard Bear Dhole Hotspot
criteria n %a %b n %a %b n %a %b n %a %b
Hotspot 1 Tr Tr Tr A K A A A A P P P
Hotspot 2 L L L L A L TrPL Tr TrPL L L L
Hotspot 3 T K T K L K KT L KT T Tr T
n = number of livestock killed A = Athang; Tr = Trong; K = Korphu; P = Phobji; L = Langthel and T = Tangsibji a = percentage of the herd size b = percentage of the total livestock population of the park
Discussion
Protected areas in Bhutan, instituted barely a decade ago, involve powerful
conservation laws, strong ethics and the Bhutan government prioritizing conservation
– this all within a cultural setting, where religious ethics are resonant with
environmental protection. However, a disadvantage of strict conservation policies
combined with a lax herding system within the Park is the loss of livestock to wild
carnivores. This sparks conflict between people and wildlife. My survey of 274

40
households in 2000 in the Jigme Singye Wangchuck National Park revealed that
21.2% (58) of households believed they had lost livestock to wild predators during the
previous year (averaging approximately 2.3% of their herd), and that perceived losses
had increased significantly since 1993. Nonetheless, the percentage of households
reporting lost livestock in my study was lower than figures reported elsewhere in the
region (46% in Mongolia [Allen and McCarthy, in Litt.]); 38% in Nepal [Oli et al.,
1994]; and 45% in Tsarap Valley of India [Spearing, in Litt.]). The financial loss
represented by the livestock predation – about US$ 44.72 per household (over all
households) – was also lower than losses reported from other countries in the region
(these ranging from one quarter to almost half of the household cash incomes [Oli, et
al., 1994; Mishra, 1997; Jackson, 1999; Stahl et al., 2001; Spearing, in Litt.]).
Nevertheless, the farmers responding to my survey considered the losses they reported
to be significant, and they were greater than losses reported elsewhere in India (Kibber
wildlife sanctuary, 12% [Mishra, 1997]; Hemis National Park, 2.3% in 1991 [Fox, et
al., 1991] and 12.4% in 2000 [Bhatnagaer, et al., 2000]; Tibet 9.5% [Jackson, 1999];
and China, 7.6% [Schaller et al., 1987]).
When losses were calculated for only those households that reported loss the
average was 1.29 head of livestock lost per annum (US$ 211) which may represent as
much as 84.5% of their average annual cash income (US$ 250, Planning Commission,
2002). Similar levels of livestock loss were reported by Spearing (in Litt., 2000) in the
Tsarap Valley in North India, although there the financial value of US$ 203.9
represented about 54% of their annual cash income. Such losses, combined with
restrictions on the use of natural resources, are likely to generate a hostile attitude
towards conservation and may provoke retaliatory action by farmers (Schaller and
Crawshaw, 1980; Rabinowitz, 1986; Conforti and de Azevedo, 2003). Farmers in my
study expressed the opinion that it had become more difficult to rear livestock in the

41
Park. The top five reasons they gave, in order of decreasing severity, were: (1)
increased predation, (2) lack of fodder, (3) increased incidence of disease, (4)
insufficient pasture and (5) reduced milk quality. Fifty-two percent of the Park
residents blamed their present hardships on the Park and the Forest and Nature
Conservation Act of 1995, which had introduced a ban on the killing of wildlife
together with restrictions on grazing and the collection of non-timber forest products
(medicinal plants, aromatic plants, mushrooms, cane and bamboo, etc.).
In agreement with the findings of Jackson (1999) and Jackson and Wangchuk (in
litt.), livestock kills in my study area varied by site, livestock type and presence or
absence of a herder (herders were generally absent when stock were grazed at remote
pastures). Tigers and leopards attacked cattle, mostly in areas with less human activity.
Dhole mostly killed sheep. Heavy predation on cattle by tigers and leopards is of
serious concern because cattle are very valuable. Predation is known to be higher in
heavily- or over-stocked areas (Oli, et al., 1994; Jackson, 1999), and this sometimes
leads to surplus killing (Stuart, 1988) as I too observed. In my study, this pressure was
further compounded by transient grazers coming from outside the Park.
My analyses supported the general finding that where food – in this case
domestic stock is abundant, predation losses increase, leading to predation hotspots
(Nass, et al., 1984; Yom-Tov, et al., 1995). In the French Jura, roe deer (Capreolus
capreolus) abundance was greater in predator hotspots and areas rich in roe deer were
more intensively used by lynx (Felids lynx), producing higher encounter rates between
sheep and lynx (Stahl, et al., 2001). My study identified heightened predation levels,
where livestock were heavily grazed in forest habitats used by predators. The hotspots
for tigers and leopards did not overlap, except in Langthel, raising the possibility that
leopards are excluded by tigers. It is important to educate farmers to avoid grazing
their livestock in predator hotspots or, at least, to be especially vigilant there.

42
In other parts of the world, herd management has also been identified as a factor
in predation rate (Robel, et al., 1981; Oli, et al., 1994; Mishra, 1997; Landa, et al.,
1999; Linnell, et al., 1999; Bhatnagaer, et al., 2000; Jackson and Wangchuk, in litt.;
Allen and McCarthy, in litt.; Patterson, et al., 2004) and it is obvious that more
thoughtful and informed herd management has the potential to reduce losses
(Rasmussen, 1999). Herds taken to graze different pastures were generally left
unattended and were clearly associated with higher rates of reported predation, while
the large numbers of households that grazed their livestock in the forests near the
village suffered fewer losses. Grazing in distant pastures has similarly been found to
increase the vulnerability of livestock to predation elsewhere (Jackson, 1996; Mishra,
1997; McCarthy, 2000; Allen and McCarthy, in litt.). Nocturnal management of
livestock in some villages was very poor. Approximately 60% of households did not
pen their livestock and when livestock were penned, the pens were poorly constructed
and unlikely to be predator-proof.
Reported predation increased significantly between 1993 and 2001, with
leopards being the main cause of livestock loss. Some respondents’ claimed that
increased predation was linked to the establishment of the Park in 1993 and
implementation of the Forest and Nature Conservation Act of 1995. Increases in
depredation rates following establishment of protected areas and implementation of
conservation rules have similarly been documented in India (Saberwal, et al., 1994;
Mishra, 1997; Jackson and Wangchuk, in litt.; Maikhuri, et al., 2001), Nepal (Oli, et
al., 1994; Studsrod and Wegge, 1995) and Tibet (McCarthy, 2000).
My study suggests that a combination of lax herding, poor guarding practices, a
lack of favorable cover, poor habitat condition and high predator densities combine to
create conditions where depredation rates are high. Conservation success (apparently
leading to a perceived increase in predator populations) and the imposition of strict

43
restrictions on farmers’ use of resources (by the Forest and Nature Conservation Act
of 1995) may have exacerbated human-wildlife conflict in the Park. With losses during
2000 almost equal to annual cash incomes for those households affected, there is an
urgent need to address this problem. I suggest that government managers, researchers
and farmers work together to devise a conservation management strategy that
accommodates the needs of both wildlife and farmers. Restoration of an adequate
natural prey base together with a program of compensation for livestock lost may
minimize conflict by increasing farmers’ tolerance of wildlife (Michelle and Smirnov,
1999). A suitable management strategy should be evidence-based, and should explore
methods to improve livestock management, monitoring the abundance of prey species,
assessing the ecological impacts of over-grazing and the feasibility of a sustainable
compensation scheme. In the short-term, a ban on transient grazers entering the Park
and on grazing in predator hotspots should reduce encounter rates between livestock
and predators. Alternative benefits from community-based eco-tourism, livestock
intensification and sustainable harvesting of non-timber forest products should be
explored as such benefits could generate more favorable attitudes towards
conservation (Conforti and de Azevedo, 2003). Emphasis should be on involving
farmers in managing human–wildlife conflict and developing ways of enabling them
to benefit from the existence of the park.

44
REFERENCES
Bhatnagaer, Y.V., Stakrey, R.W., Jackson, R. 2000. A survey of depredation and related wildlife–human conflicts in the Hemis National Park, Ladakh, India. Snowline, Bulletin of International Snow Leopard Trust. Vol. XVII. Choden, D. and Namgay, K. 1996. Report on the findings and recommendations of the wild boar survey. Project for assessment of crop damage by wild boar. National Plant Protection Center. Ministry of Agriculture, Royal Government of Bhutan, Thimphu Bhutan. Conforti, V.A. and de Azevedo, F.C.C. 2003. Local perceptions of jagurs (Panthera onca) and pumas (Puma concolor) in the Iguacu National Park area, south Brazil. Biological Conservation. 111: 215-221. Fox, J.L., Norbu, C., Chundawat, R.S. 1991. The mountain ungulates of Ladakh, India. Biological Conservation. 58: 167-190. Hampton, R.E. 1994. Introductory Biological Statistics. Waveland Press, Inc., Long Grove, IL. Jackson, R.M., 1996. Home range, movements and habitat use of snow leopard (Uncia uncia) in Nepal. Ph.D. dissertation, University of London, UK. Jackson, R.M. 1999. Managing people-wildlife conflict in Tibet’s Qomolangma National Nature Preserve. http://www.snowleopard.org/islt/procite/rjmp99>. Landa, A., Gudvangen, K., Sournson, J.E., Roskaft, E. 1999. Factors associated with wolverine Gulo gulo predation on domestic sheep. Journal of Applied Ecology. 36: 963-973. Linnell, J.C., Odden, J., Smith, M.E., Aanes, R., Sournson, J.E. 1999. Large carnivores that kill livestock: do ‘problem individuals’ really exist? Wildlife Society Bulletin. 27: 698-705. Maikhuri, R.K., Nautiyal, S., Rao, K.S., Saxena, K.G. 2001. Conservation policy- people conflicts: a case study from Nanda Devi biodiversity reserve (a World Heritage Site, India). Forest Policy Economics. 2: 355-365. McCarthy, T. 2000. Ecology and conservation of snow leopards, Gobi brown bears, and wild Bactrian camels in Mongolia. Ph.D. dissertatin, University of Massachusetts, Amherst, MA.

45
Michelle, D.G. and Smirnov, E.N. 1999. People and tigers in the Russian Far East: searching for the ‘co-existence recipe’. In Riding the tiger-tiger conservation efforts in human-dominated landscapes. pp. 273–29, Seidensticker, J., Christie, S., Jackson, P. (eds.). Cambridge University Press, Cambridge, UK,. Mishra, C. 1997. Livestock depredation by large carnivores in the Indian trans- Himalaya: conflict perceptions and conservation prospects. Environmental Conservation. 24: 338-343. Mishra, C. 2001. High altitude survival: conflicts between pastoralism and wildlife in the trans-Himalaya. Ph.D. dissertation, Wageningen University, The Netherlands. Nass, R.D., Lynch, G., Theade, J. 1984. Circumstances associated with predation rates on sheep and goats. Journal of Range Management. 37: 423-426. Oli, M.K., Taylor, I.R., Rogers, M.E. 1994. Snow leopard Panthera uncia predation of livestock: an assessment of local perceptions in the Annapurna conservation area, Nepal. Biological Conservation. 68: 63-68. Patterson, B.D., Kasiki, S.M., Selempo, E., Kays, R.W. 2004. Livestock predation by lions (Panthera leo) and other carnivores on ranches neighboring Tsavo National Parks, Kenya. Biological Conservation. 119: 507-516. Planning Commission. 2002. Bhutan poverty assessment and analysis report. Planning Commission, Royal Government of Bhutan, Thimphu, Bhutan. Rabinowitz, A.R. 1986. Jaguar predation on domestic livestock in Belize. Wildlife Society Bulletin. 14: 170-174. Rasmussen, G.S.A. 1999. Livestock predation by the painted hunting dog Lycaon pictus in a cattle ranching region of Zimbabwe: a case study. Biological Conservation. 88: 133-139. Robel, R.J., Dayton, A.D., Henderson, R.R., Meduna, R.L., Spaeth, C.W. 1981. Relationships between husbandry methods and sheep losses to canine predators. Journal of Wildlife Management. 45: 894-911. Saberwal, V.K., Gibs, J.P., Chellam, R., Johnsingh, A.T.J. 1994. Lion-human conflict in the Gir forest, India. Conservation Biology. 8: 501-507. Schaller, G.B. and Crawshaw Jr., P.G. 1980. Movement patterns of jaguar. Biotropica. 12: 161-168.

46
Schaller, G.B., Li Hong, T., Ren, J., Qiu, M., Wang, H. 1987. Status of large mammals in the Taxkorgan Reserve, Xingjiang, China. Biological Conservation. 42: 53-71. Stahl, P., Vandel, J.M., Herrenschmidt, V., Migot, P. 2001. Predation on livestock by an expanding reintroduced lynx population: long-term trend and spatial variability. Journal of Applied Ecology. 38: 674-687. Stuart, C.T. 1988. The incidence of surplus killing by Panthera pardus and Felis caracal in Cape Province, South Africa. Mammalia. 50: 556-558. Studsrod, J.E. and Wegge, P. 1995. Park-people relationships: the case of damage caused by park animals around the Royal Bardia National Park, Nepal. Environmental Conservation. 22: 133-142. Wang, S.W. 2004. The impacts of wildlife damage and conservation policies on farmer attitudes in Jigme Singye Wangchuck National Park, Bhutan. MS thesis, Cornell University, Ithaca NY, USA. Yom-Tov, Y., Ashkenazi, S., Viner, O. 1995. Cattle predation by the golden jackal Canis aureus in the Golan Heights, Israel. Biological Conservation. 73: 19-22.

47
CHAPTER III
FEEDING HABITS AND NICHE PARTITIONING IN A PREDATOR GUILD COMPOSED OF TIGERS, LEOPARDS AND DHOLES IN JIGME SINGYE
WANGCHUCK NATIONAL PARK, BHUTAN
Abstract
I describe the food habits, niche overlap and prey preferences in a predator
guild comprised of tigers (Panthera tigris), leopards (P. pardus) and dholes (Cuon
alpinus) in a mountainous region of central Bhutan. Scat analyses revealed that these
predators consumed 11 different prey species including livestock and rodents with
leopard scat showing consumption of all 11. Sambar (Cervus unicolor), mutjac
(munticus muntjac) and wild pig (Sus scrofa) together provided 37.9%, 29.8% and
71.1%, while domestic livestock constituted 48.3%, 40.2% and 15.9% of prey
consumed by tigers, leopards and dholes, respectively. There was a high dietary niche
overlap between the predators (Pianka’s overlap index of 0.58-0.97), with higher
overlap between the two felid species than between felids and canids. Regression
equations from earlier feeding trials were used to estimate relative biomass and
numbers of prey consumed. Results showed that while relative frequency featured
muntjac (16.3%) more than sambar (12.3%) in tiger diets, sambar contributed more
relative biomass (18.6%) than muntjac (6.6%). Sambar, muntjac and wild pig provided
28.5%, 28% and 63.1% of the biomass consumed by tigers, leopards and dholes,
respectively. Livestock dominated tiger (71.5%) and leopard (62.1%) diets but made
up only 31.4% of the dhole diets. Although sambar was the least abundant prey, it
provided the largest portions of the biomass consumed by the predators. Results of
prey selectivity showed no selection by tigers for any particular prey species, while
leopards and dholes preferred sambar. Given equal availability, all three predators
avoided livestock, which was the most abundant in the area and provided the

48
maximum biomass available. There was a high intra-guild competition and diet
overlap among the three sympatric carnivores. Under these conditions, prey selection
was not necessarily influenced by prey types and sizes, especially for tigers where
plenty of livestock was available to supplement their diets.
Introduction
Tigers (Panther tigris) are a global priority for conservation. Along with other
large carnivores, tiger conservation has been used as an umbrella for the conservation
of biodiversity in general (Steneck, 2005). However, tiger densities and distribution
have been significantly reduced over the last few decades including extinction of three
subspecies (Bali tiger, P. tigris balica; Caspian tiger, P.t. virgata; Javan tiger, P.t.
sondaica). Continued depletion of prey base, habitat loss, poaching for trade and
retaliatory killing by aggrieved farmers are further reducing tiger and other large
carnivore populations (Sunquist, et al., 1999). Habitat loss combined with decreasing
prey numbers can intensify sympatric competition for food and space in predator
guilds (Weins, 1993). Under these circumstances, knowledge on intra-guild
competition, prey selection and niche partitioning will be useful for guiding
management of these sympatric carnivores in a human-dominated landscape.
Resource partitioning has been used to explain inter-and intra-guild
competition and co-existence among carnivores (Sunquist and Sunquist, 1989;
Meriggi, et al., 1991, 1996; Meriggi and Lovari, 1996; Ciucci, et al., 1996). Resource
partitioning by selection for prey species (Karanth & Sunquist, 2000), sizes
(Gittleman, 1985; Karnath and Sunquist, 2000), foraging habits (Palomares, et al.,
1996), activity patterns (Fedriani, et al., 1999; Karanth and Sunquist, 2000) and use of
space (Palomares, et al., 1996; Durant, 1998) have all been used to explain co-
existence among predators. Co-existence between felids and canids is also facilitated

49
by evolution of different anatomical adaptations for prey selection (Ewer, 1973;
Biknevicius and Van Valkenburgh, 1996) and competitive interactions within predator
guilds may further develop selective pressures depending on differences in body size,
dentition, shape and other traits (e.g. Kiltie, 1998; Jones, 1997). Differential prey
selection based on species and size by predators of different body sizes is thought to
be key to co-existence among carnivores (Gittleman, 1985; Karanth and Sunquist,
2000). Carnivores with similar morphology can co-exist if the larger carnivores
specialize in, and select for larger prey (Rosenzweig, 1966; Gittleman, 1985).
Carnivore guilds of differing morphology have evolved to take prey species of
different types (Krebs, 1978). For example, selecting prey species of different sizes
has been reported as a co-existence strategy between jaguars (P. Onca) and puma (P.
concolor) in the dry forests of Paraguay (Taber, et al., 1997) and between leopards (P.
pardus) and golden cats (Felis aurate) in humid forests of central Africa (Hart, et al.,
1996).
Tigers, leopards (Panthera pardus) and dholes (Cuon alpinus) that co-exist in
South Asian forests play a critical role in the ecosystem by shaping prey communities
(Karanth, et al., 2004) and are known to be morphologically specialized for killing
prey larger than themselves (Karanth and Sunquist, 2000). Tigers prefer less disturbed
habitats where they feed on large sized prey (Karanth and Sunquist, 1995). Leopards
occur across a wide range of ecosystems and feed opportunistically on a large variety
of prey (Bailey, 1993) and as social hunters, dholes are capable of feeding on small to
large prey species (Johnsingh, 1983; Pole, et al., 2004; Grassman, et al., 2005).
Behavioral mechanisms may also promote co-existence among these predator guilds
(Seidensticker, 1976; Johnsingh, 1983). However, these studies lacked data on
predator diets, space use and prey abundance. A later study by Karanth and Sunquist
(1995) found that predators selectively preyed upon different species, body sizes and

50
age classes and that adequate availability of prey of varying size facilitated co-
existence among them. Karanth and Sunquist (1995), however, mentioned that
selective predation was mediated by adequate availability of different size classes of
prey but did not provide information on how prey-selection may be influenced by low
prey population densities.
Supplementary prey (e.g., livestock; Wang and Macdonald, 2006) resulting
from chance encounters are known to act as buffers and can potentially enhance co-
existence among some sympatric carnivores (Kok and Nel, 2004). Supplementary prey
may become more valuable in supporting sympatric carnivores when natural prey
populations are low. The role of livestock in the feeding habits of large carnivores is
relevant not only to their guild structure, but also to understanding, and thus
managing, their conflict with farmers. Carnivore feeding habits are known to reflect
both availability of potential prey as well as a suite of morphological, behavioral and
physiological adaptations that allow individuals to capture and consume prey (Krebs,
1978; Sunquist and Sunquist, 1989).
While studies from India (e.g., Schaller, 1967; Sunquist, 1981; Johnsingh,
1983; Sankar, 1994; Karanth and Sunquist, 1995; Avinandan, 2003) have increased
knowledge of the predatory behavior of these species, similar field studies in multi-
species guilds from temperate ecosystems have not been conducted.
An effective and noninvasive method for determining predator diets is the
microscopic identification of prey hairs from predator scats using reference hair
samples from known prey species (Sunquist, 1981; Mukerjee, et al., 1994; Andheria,
et al., 2007). Together with advanced analytical methods (Floyd, et al., 1978;
Ackerman, et al., 1984; Reynolds and Aebischer, 1991; Atkinson, et al., 2002) scat
data can generate reliable profiles of predator diets.
51
Tigers, leopards and dholes co-exist with herders and livestock in Bhutan’s
Jigme Singye Wangchuck National Park, providing an ideal platform to study intra-
guild competition and niche partitioning in a temperate mountain ecosystem. Based on
carnivore feeding habits in this park, I attempted to understand ecological sympatry
and niche partitioning in a multi-species predator guild with the additional aim of
guiding conservation of predators, prey and their habitat to reduce predation losses
experienced by farmers. Specifically the study: (1) determines diet composition of
tigers, leopards and dholes as represented by prey species in scats (and compares diet
contribution by domestic livestock vs. wild ungulates); (2) evaluates the degree of
dietary overlap among the carnivores; (3) ascertains relative biomass and relative
numbers of different species of principal prey in predator diets and (4) ascertains prey
preferences by tigers, leopards and dholes.
Study area
This study was conducted in the Jigme Singye Wangchuck National Park
(JSWNP), located in central Bhutan (Figure 3.1). The Park is bordered to the east and
west, respectively, by the rivers Mangde chu and Sunkosh chu. The Park’s diverse
physical features, temperature and rainfall have created climatic zones ranging from
wet sub-tropical in the south, to permanent alpine pastures and glaciers in the north
(Wang, 2001). Elevation rises sharply from 150 meters above mean sea level (amsl) in
Tingtibi (south) to over 4900 meters (amsl) at the peak of Mt. Jo-Durshing la. This
ruggedness renders approximately 15-20% of the Park inaccessible for sampling
especially during summer and winter.
This Park together with Royal Manas National Park and Indian Manas Tiger
Reserve form the largest tiger conservation area in South Asia, representing the full
range of habitats from the plains to the alpine zone with high species diversity.
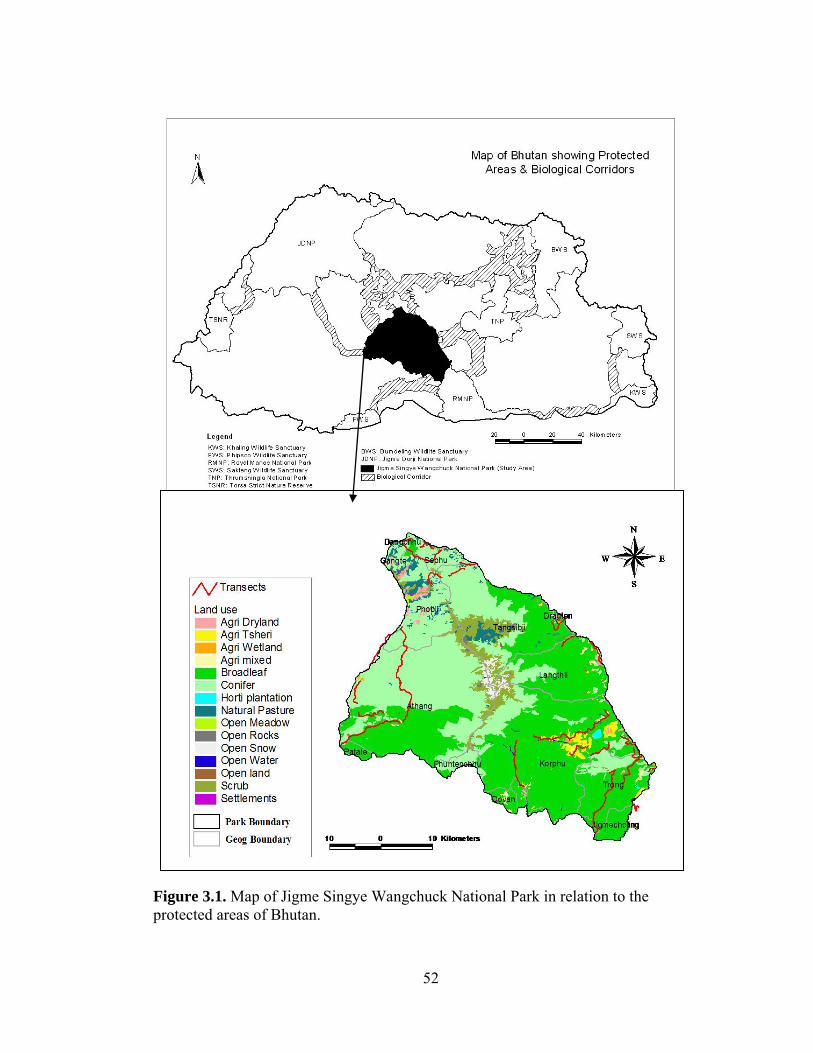
52
Figure 3.1. Map of Jigme Singye Wangchuck National Park in relation to the protected areas of Bhutan.

53
These diverse habitats host important populations of predators (e.g., tiger, leopard,
dhole, etc.) and prey (e.g., guar Bos gaurus, sambar Cervus unicolor, wild pig Sus
scrofa, serow Carpicornis sumatraensi, langur Trachypithecus geei, macaque Macaca
mulatta [Wang, 2001]). The Park, including part of the Manas-JSWNP link areas is
thought to support up to 10% of Bhutan’s total tiger population (Wang, 2001).
Almost six thousand farmers live in 34 villages spread across the Park. Most of
the farmers are either settled in the rich river valleys, or on the gentle shoulders of the
hills or in the glacier valleys. Agriculture and livestock rearing are the major sources
of livelihood including cash income (Wang, et al., 2006a) with farmers from lower
altitudes keeping cattle and farmers in the alpine regions preferring yak.
Methods
Scat Collection
Due to the secretive and nocturnal behavior of most large predators, scat
analysis has been used as a tool to examine their feeding habits, especially for
leopards, tigers and dholes (Mukherjee, et al., 1994; Karanth and Sunquist, 1995,
2000). Scats were opportunistically collected and associated signs (scrapes, tracks,
rubbings, diggings, etc.) were recorded from November 2004 through July 2006, and
from October 2007 through December 2007, by walking all available trails in the
study area. Date, location, scat size (diameter and length), elevation, associated signs
of predator species and substrate type were also documented. All scat locations and/or
other evidence were mapped using a handheld Garmin EtrexTM Global Positioning
System (GPS) receiver (Garmin EtrexTM, U.S.). Tiger and leopard scats are much
larger than dhole scats, which were often found in clusters (Johnsingh, 1983; Karanth
and Sunquist, 1995). Tiger scats were distinguished from leopard scats by using
associated signs and pugmarks, size (diameter and length) and general appearances.

54
Tiger scats were coiled less than leopard scats, and had relatively longer distances
between successive constrictions within a single piece of scat. Scats that were not
identifiable in the field with certainty were discarded. After drying, scats were stored
in paper bags and individually labeled with date, GPS location and species.
Reference samples creation, scat processing and prey hair identification
Prior to this study, neither reference samples nor laboratory facilities existed in
Bhutan for analyzing hair samples. With technical advice from scientists at the
Wildlife Institute of India, reference samples for both domestic livestock and wild
prey species found in the study area were created using hair samples from known
animals. A prototype laboratory was also set up with necessary equipment including a
compound microscope.
Air dried scats were dissected, washed and remains such as bones, hooves,
teeth and hair of the prey consumed were separated for species identification (Grober
and Wilson, 1972; Mukherjee, et al., 1994; Henschel and Ray, 2003). Following
methods described by Mukherjee, et al., (1994), 20 prey hairs were randomly sampled
from each scat and compared with reference slides using a compound electronic
microscope. Identification was based on the general appearance of hair, color, length,
width, medullary width and cuticular patterns. Data were quantified in terms of both
frequency of occurrence (proportion of total scats in which an item was found) and
percent occurrence (number of times a specific item was found as a percentage of all
items found).
To assess whether the number of scats analyzed reflect accurately the diet of
the predators studied, an observation area curve (Odum and Keunzler, 1955) was
plotted at an interval of 5-10 scats. This was continued until all scats were included

55
and cumulative frequency of occurrence of different prey was used to test the effect of
sample size on the results.
Species availability
Abundance of major prey species found in the study area were estimated using
methods of distance sampling (Burnham, et al., 1980; Buckland, et al., 1993) and is
reported elsewhere (Wang, 2008).
Relative frequency, biomass and relative number of prey consumed
When prey species of different body sizes are consumed, frequency of
occurrence does not adequately represent the proportion of different prey species
(Andheria, et al., 2007). As a result smaller prey species with more hair per unit body
weight, produce more scats per unit prey weight, and consumption may be
overestimated in carnivore diets (Floyd, et al., 1978; Ackerman, et al., 1984). To
correct for this bias, relative numbers of prey species killed by predators were
analyzed using regression equations (Ackerman, et al. [1984]; Yi = 1.98 + 0.035 [Xi]
for tigers and leopards and Floyd, et al. [1978] Yi = 0.035 + 0.020 [Xi] for dholes). As
for other studies (Karanth and Sunquist, 1995; Biswas and Sankar, 2002; Baghi, et al.,
2003; Suja, 2004; Andheria, et al., 2007), I assumed that the digestive system and
degree of utilization of a kill by tigers and leopards were comparable to that of the
puma (Felis concolor). We also assumed dhole diets would be similar to those for the
wolf (Canis lupus), where Xi represents the live weight of the prey species i and Yi is
the weight of prey i in one collectable scat Y. The average number of collectable scats
(λi) produced per prey species i is given as (λi = Xi/Yi) and the relative biomass and
numbers of each prey killed were computed.

56
The relative biomass (D = [A x Y]/∑[A x Y]) consumed was computed using
the proportion of frequency of occurrence (A) of a species corrected for its body
weight and the cumulative corrected frequency of occurrence of all prey species
(Andheria, et al., 2007). The relative number of prey individuals consumed (E =
[D/X]/∑[D/X]) was calculated using average unit weigh per prey species (X) and the
relative biomass consumed (D).
A variety of indices have been used to measure dietary overlap or ecological
niche separation (Pianka, 1973; Feinsinger, et al., 1981). I selected Pianka’s index,
which varies from 0 (complete dietary isolation) to 1 (complete overlap), to measure
diet overlap among tigers, leopards and dholes. This model was developed using
robust statistical methods, and has worked well in multi-species studies.
Prey selection
Counts of each prey item observed in each scat were compared with estimated
prey availability (Manley, et al., 2002). The expected number of felid scats having a
particular prey species under non selective predation was calculated using the
relationship developed by Karanth and Sunquist (1995); πi = (di.λi/Σ di.λi), where
prey species i has population density of di and λi is the average number of field
collectable scat produced by predator from a single prey species i (λi = Xi/Yi).
Karanth and Sunquist (1995) recommended the use of group rather than
individual densities because encountering prey groups determined predation events by
a predator. I, therefore, used group densities to estimate the expected proportion of
prey species under non-selective predation using SCATMAN (Hines, 1999). Link and
Karanth (1994) also cautioned that variability in density estimates for each prey
species and the number of scats produced from a particular kill of any prey species
may increase the chance of type I errors. To alleviate this problem I used 1000

57
bootstrap iterations in SCATMAN. Prey selectivity was then assessed by a
multinomial likelihood ratio test (Link and Karnath, 1994, Biswas and Sankar, 2002;
Bagchi, et al., 2003) between the observed and expected contribution by each prey
species at α = 0.05. Manly’s selection ratio (Manly, et al., 2002) which estimates the
standardized proportion of prey consumed based on its availability, allowed me to
confirm my multinomial results.
Results
Availability of prey species
We calculated group and individual densities of wild prey species in the study area
(Table 3.1). Individually, wild pig was the most abundant animal, followed by
primates, muntjac and sambar. Prey species were classified into small (<20 kg),
medium (20-50 kg) and large (>50 kg) based on their body mass (Karanth 1995).
Using census records from the community livestock officers in the study area, I
estimated a livestock density of 6 animals km-2. Detailed results and discussions of
prey density are described elsewhere (Wang, 2008).
Table 3.1. Density (animals km-2) of major wild prey species in Jigme Singye Wangchuck National Park, Bhutan (2006).
Density (SE) Species Individual Group 95% CI
Wild pig 3.68 (1.39) 0.91(0.27) 1.78-7.58
Muntjac 2.17 (0.36) 1.96 (0.32) 1.55-3.03
Sambar 1.19 (0.31) 0.98 (0.25) 0.71-1.98
Primates 2.37 (0.89) 0.28 (0.01) 1.14-4.90

58
Species composition of predator diets
I collected and identified 29 tiger, 113 leopard and 138 dhole scats from the
field. Eight prey species including domestic livestock and rodents were identified in
the 29 tiger scats examined and each scat contained the remains of only single prey
species. From the 113 leopard scats examined, ten prey species including domestic
livestock and rodents were identified. While 105 scats (92.9%) contained remains of a
single prey species, eight scats (7.1%) contained two prey items. Eight prey species
were also identified in the 138 dhole scats. A total of 111 dhole scats (80.0%)
contained presence of only one prey species, and the remaining 28 scats (20.2%) had
remains of two prey species. In addition bones, claws and nails, hoofs and vegetable
matter were found in 51.2%, 3.4%, 10.3% and 13.8% of the tiger scats, respectively.
Bones were found in 70.4% of leopard scats, vegetable matter in 17.6% and quills and
spines in 12%. Bones also were represented in 31.4% of the dhole scats.
Sambar, muntjac and wild pig constituted 37.9%, 29.8% and 71.1% of the wild
prey consumed by tigers, leopards and dholes, respectively. Goral (Nemorhaedus
goral) present in leopard (7.7%) and dhole (12.3%) diets, but was absent in tiger diets.
Langur also constituted 4.3% of leopard diets but was absent in both tiger and dhole
diets. Domestic livestock, consisting of cattle, yak, horse and sheep constituted 48.3%,
40.2% and 15.9% of prey consumed by tigers, leopards and dholes, respectively.
Domestic dog was taken only by leopards (Table 3.2). The relative contribution of
each prey species in tiger, leopard and dhole diets stabilized after examining 25 tiger,
40 leopard and 60 dhole scats, so my sample sizes were deemed sufficient (Figures
3.2, 3.3, 3.4). I used Pianka’s Index (Pianka, 1974) to test the hypothesis that there
was significant overlap in the carnivore diets. The dietary overlap between tiger and
leopard was 0.97, between tiger and dhole, 0.58 and between leopard and dhole 0.66.

59
Table 3.2. Number (n), frequency of occurrence (F), relative occurrence (R), weight of prey in one field collectable scat (Y), relative biomass consumed (D) and relative number of prey individuals consumed (E) by tiger, leopard and dhole from Jigme Singye Wangchuck National Park, Bhutan (2007).
Predator Prey Xa
(Kg) n F
(%) R
(%) Y
(kg/scat) D
(%) E
(%) Tiger Sambar 212.0 4 13.8 12.3 9.4 18.6 10.1 (n=29) Muntjac 20.0 5 17.2 16.3 2.7 6.6 39.8 Gaur 287.0 0 0.0 0.0 12.0 0.0 0.0 Langur 8.0 0 0.0 0.0 2.3 0.0 0.0 Goral 27.0 0 0.0 0.0 2.9 0.0 0.0 Wild pig 38.0 2 6.9 6.5 3.3 3.3 10.4 Cattle 275.0 8 27.6 26.1 11.6 45.8 20.1 Yak 275.0 4 13.8 13.0 11.6 22.9 10.0 Horse 175.0 0 0.0 0.0 8.1 0.0 0.0 Sheep 25.0 2 6.9 6.5 2.9 2.8 13.6
Domestic dog 12.0 0 0.0 0.0 2.4 0.0 0.0
Leopard Sambar 62.0 19 16.8 15.9 4.2 17.6 13.9 (n=113) Muntjac 20.0 10 8.8 8.4 2.7 6.0 15.2 Gaur 85.0 0 0.0 0.0 5.0 0.0 0.0 Langur 8.0 5 4.4 7.8 2.3 2.5 16.0 Goral 27.0 9 8.0 14.0 2.9 5.9 11.1 Wild pig 37.0 6 5.3 9.4 3.3 4.4 6.0 Cattle 140.0 29 25.7 45.3 6.9 44.4 16.2 Yak 140.0 7 6.2 10.9 6.9 10.7 3.9 Horse 140.0 0 0.0 0.0 6.9 0.0 0.0 Sheep 25.0 11 9.7 17.2 2.9 7.0 14.3
Domestic dog 12.0 3 2.7 4.7 2.4 1.6 6.8
Dhole Sambar 70.0 84 60.9 51.5 1.4 56.5 50.6 (n=138) Muntjac 20.0 31 22.5 19.0 0.4 6.3 19.8 Gaur 75.0 0 0.0 0.0 1.5 0.0 0.0 Langur 8.0 1 0.7 0.6 0.2 0.1 0.7 Goral 27.0 20 14.5 12.3 0.6 5.4 12.5 Wild pig 31.0 1 0.7 0.6 0.7 0.3 0.6 Cattle 140.0 13 9.4 8.0 2.8 17.3 7.7 Yak 140.0 10 7.2 6.1 2.8 13.3 6.0 Horse 140.0 0 0.0 0.0 2.8 0.0 0.0 Sheep 25.0 3 2.2 1.8 0.5 0.8 1.9
Domestic dog 12.0 0 0.0 0.0 0.3 0.0 0.0
a = Live weights (X) of prey species were taken from Karanth and Sunquist, 1995, MoA, 2002 and Information Management System, Department of Livestock, MoA.

60
0
5
10
15
20
25
30
35
40
45
5 10 15 20 25 29
No of scats
Sambar Muntjac Wild pig Cow Yak Sheep Rodents Figure 3.2. Contributions of prey species in tiger diet with number of scats examined from Jigme Singye Wangchuck National Park, Bhutan (2007).
0
10
20
30
40
50
60
10 20 30 40 50 60 70 80 90 100 110 113
No of scatsSambar Muntjac Cow Langur Yak Dog Goral Wild pig Sheep Rodent
Figure 3.3. Contributions of prey species in leopard diet with number of scats examined from Jigme Singye Wangchuck National Park, Bhutan (2007).

61
0
10
20
30
40
50
60
70
10 20 30 40 50 60 70 80 90 100 110 120 130 140
No of scats
Sambar Muntjac Cow Yak Goral Sheep Figure 3.4. Contributions of prey species in Dhole diet with number of scats examined from Jigme Singye Wangchuck National Park, Bhutan (2007).
Relative biomass and number of prey killed
The number and frequency of occurrence, relative biomass and estimates of
relative number of individuals consumed were compared for tigers, leopards and
dholes (Table 3.2). The average weight of each prey species killed separately for the
three predators were taken from Karanth and Sunquist (1995) and MoA (2002). The
estimated numbers of field collectable scats produced by predators from kills of
different prey (λ) are shown in Table 3.3. Although the three predators consumed
several prey species, the bulk of the biomass was provided by domestic livestock
(71.5% for tigers, 62.1% for leopards, and 31.4% for dholes) and wild ungulates,
consisting of sambar, muntjac and wild pig (28.5% for tigers, 28% for leopards and
63.1% for dholes).

62
Table 3.3. Results of prey preference analyses using program SCATMAN and Manly’s selection ratio in Jigme Singye Wangchuck National Park, Bhutan (2007). Sambar Muntjac Wild pigTiger Scat frequency 4.0 5.0 2.0 Expected 5.2 3.4 2.4 Manley's selection ratio 0.25 0.48 0.27 χ2 0.49 1.08 0.10 P value 0.489 0.304 0.753 SE 0.001 0.000 0.001 λi 22.56 7.46 11.48 Dg 0.98 1.96 0.91 SE (dg) 0.25 0.32 0.27Leopard Scat frequency 19.0 10.0 6.0 Expected 13.0 12.9 9.1 Manley's selection ratio 0.51 0.27 0.23 χ2 4.47 1.06 1.43 P value 0.040 0.318 0.247 SE 0.000 0.001 0.001 λi 14.94 7.46 11.30 Dg 0.98 1.96 0.91 SE (dg) 0.25 0.32 0.27Dhole Scat frequency 84.0 31.0 1.0 Expected 30.6 57.8 27.6 Manley's selection ratio 0.83 0.16 0.01 χ2 126.30 24.69 33.65 P value 0.000 0.000 0.000 SE 0.000 0.000 0.000 λi 48.79 45.98 47.33 Dg 0.98 1.96 0.91 SE (dg) 0.25 0.32 0.27
Dg = group density; SE (dg) = standard error for group density; λI = no of scats produced from a single kill; χ2 = chi-square value; b = Manly’s selection ratio; P value = significance level at α = 0.05.

63
Selectivity for prey species
I tested prey selection using both group and individual densities of prey
species in separate bootstrap simulations in SCATMAN (Hines, 1999). Bootstrap was
also run for wild ungulates only, ungulates with cattle and ungulates with cattle and
primates. In addition, Manly’s selection ratio (b) confirmed the test for selectivity
using the expected and observed frequencies (Manly, et al., 2002). Multinomial
likelihood ratio tests indicated random selection of prey species by tigers. However,
leopards and dholes showed preference for certain prey species. Further analyses were
carried out using group densities (Table 3.3). Tigers displayed no significant
preference for or avoidance of a particular ungulate species. However, when livestock
data were combined with the ungulate data, tigers exhibited a significant preference
for muntjac (b = 41%; χ2 = 2.23; P = 0.05) and avoided other species including cattle.
There was no effect on prey preferences for tigers when primate data were added. In
comparison, leopards showed a significant preference towards sambar (b = 51%;
χ2 = 4.47; P = 0.04) and tended to avoid muntjac and wild pig when only the ungulate
data were considered. When data for ungulates, livestock and primates were
combined, leopards showed a preference for sambar (b = 16%; χ2 = 8.17; P = 0.006)
and langur (b = 61%; χ2 = 26.54; P = 0.000) but avoided cattle (b = 6%; χ2 = 6.6; P =
0.014) and wild pig (b = 7%; χ2 = 0.25; P = 0.632). Dholes revealed a highly
significant preference for sambar (b = 83%; χ2 = 126.30; P = 0.000) and strong
avoidance for wild pig (b = 0.01%; χ2 = 33.65; P = 0.000). When diet data for
ungulates, cattle and primates were combined dhole preference remained significant
only for sambar (b = 76%; χ2 = 384.41; P = 0.000) with significant avoidance of
muntjac (b = 16%; χ2 = 24.69; P = 0.000), wild pig (b = 0.01%; χ2 = 11.83; P = 0.001)
and cattle (b = 3.9%; χ2 = 105.95; P = 0.000). Exclusion of primate data from
analyses did not change preference for or avoidance of any species by dholes.

64
Discussion
The co-existence of predators such as tigers, leopards and dholes can often be
greatly influenced by the relative abundance of different size classes of available prey,
(Sunquist, et al., 1999; Karnath and Sunquist, 2000; Karanth, et al., 2004). Studies
addressing food habits of large cats such as tigers in the Indian sub-continent, have
attributed the great range of variation in their dietary preferences to the abundance and
distribution of prey species in the area, presence of sympatric predators and varying
level of anthropogenic pressures (Pandav and Goyal, 2005). However, the majority of
these studies (Schaller, 1967; Sunquist, 1981; Rabinowitz, 1989; Johnsingh, 1992;
Venkatarama, et al., 1995) used raw frequency of occurrence data to estimate prey
items in predator diets and hence failed to account for variation due to prey sizes.
Species composition of predator diets
Because scats from tiger, leopard and dhole mostly contained one or two prey
species, the frequency of occurrence and relative occurrence did not differ greatly.
Relatively more dhole scats had multiple prey items, compared to those for leopard
and tiger scats. Multiple prey items in the diets of tigers (Biswas and Sankar, 2002)
and leopards (Mukherjee, et al., 1994) are not common, but are frequent in the diets of
smaller carnivores (Reynolds and Aebischer, 1991; Capitani, et al., 2004).
My results also showed that large-sized prey (sambar, cattle, yak and horse)
comprised the bulk of prey biomass for tigers (87.3%), leopards (72.7%), and dholes
(87.1%). Medium-sized prey, represented by wild pig, contributed the least biomass to
the diet of all three predators. Sambar, muntjac and livestock were the staple prey for
tigers, leopards and dholes in my study, as elsewhere, (Karanth and Sitth, 1999;
Karanth, et al., 2004). Despite their abundance, wild pigs were less important.
Livestock accounted for almost half of tiger diets whereas sambar comprised a larger
65
proportion of both leopard (16.8% compared to muntjac at 8.8%) and dhole (56.5%)
diets. In general, these three predators appeared to take prey in proportion to their
abundance, but rugged terrain with thick cover may have rendered the agile, fast
moving wild pigs less available. Eisenberg and Lockhart (1972) suggested that wild
pig were too aggressive and dangerous to be tackled by leopards in Sri Lanka (also
see, Ramakrishnan, et al., 1999) but may be more vulnerable to predation by pack-
hunting predators like dholes. Despite differences in body size, there was substantial
dietary overlap between the three predators, although to a lesser extent between the
two felids and the dhole. Similar to Emmons (1978), I found no evidence of prey
selection by tigers. This supports the prediction of Griffiths (1975) that vertebrate
predators would be selective energy maximizers in prey-rich habitats, but would be
non-selective number maximizers where large prey were scarce.
Prey abundance and selection
My wild prey density was among the lowest reported for many studies across
the Indian sub-continent (Schaller, 1967; Sunquist, 1981; Rabinowitz, 1989;
Johnsingh, 1992; Venkatarama, et al., 1995) at 7.4 animals km-2 with wild pig
predominating, followed by muntjac and sambar (see chapter IV). These estimates
correspond with the extent of crop damage reported by farmers with almost 100% of
the respondents experiencing damage by wild pigs (Wang, 2006b). The highest
densities of ungulates have been reported from Rajaji National Park, India (Harihar,
2005) and the lowest previously from India is from Bhadra at 16.3 animals km-2
(Jathanna, 2003). Excluding birds, 57.5% of transect sightings were small-bodied
animals, followed by medium (23.6%) and large (18.9%) bodied animals. The
percentage of large bodied animals sighted in this study is lower than reported by
Bagchi, et al. (2003) from Ranthambore Tiger Reserve and higher than those reported

66
by Karnath and Sunquist (1995) from Nagarahole National Park. Earlier studies have
reported prey selection based on body size (Karanth and Sunquist, 1995; Avinandan,
2003). Tigers may have a predilection for medium and small prey or for easily
targetable large-bodied domestic livestock (Karanth and Sunquist, 1995).
While sambar provided the largest prey biomass in tiger diets, tigers did not
select for prey size, but rather cropped what was available. That is at odds with other
studies (Schaller, 1967; Sunquist, 1981; Johnsingh, 1983, 1992; Karnath and Sunquist,
1995; Harihar, 2005), that predicted tigers prefer large-bodied prey in order to
maximize energy intake. However, when sambar availability is scarce predators are
likely to prey upon more available species. In my study, muntjac was present in larger
numbers. Leopards and dholes took relatively more sambar then muntjacs, and the
climbing ability of leopards may explain their preference for langurs (Karanth and
Sunquist, 1995; Hayward, et al., 2006). All else being equal, these predators might
avoid killing domestic livestock (also see, Biswas and Sankar, 2002; Reddy, 2004).
However, in my study area, where wild prey occurred at low densities, livestock were
frequently killed (also see, Karanth and Sunquist, 1995).
The very high representation of livestock in predator diets was not surprising
considering the abundance of livestock in the forest. Livestock were grazed in these
forests at numbers which could lead to competition with wild ungulates for food and
shelter (Berkmuller, et al., 1990; Mishra, 2001). The result is that wild ungulates may
be forced into the marginal lands around the farms, where they come into conflict with
farmers and provoke retaliatory killings. Thus wild ungulates are made less available
to tigers. The apparent lack of preference for cattle by all three predators raises the
possibility that livestock depredation might be reduced if populations of wild prey
were restored. This approach has been successful elsewhere (e.g., Kitchener, 1991;
Chellam, 1993).
67
REFERENCES
Ackerman, B.B., Linzey, F.G., Hernker, T.P. 1984. Cougar food habits in southern Utah. Journal of Wildlife Management. 48: 147-155. Andheria, A.P., Karanth, K.U. Kumar, N.S. 2007. Diet and prey profiles of three sympatric large carnivores in Bandipur Tiger Reserve, India. Journal of Zoology, London. 273: 169-175. Atkinson, R.P.D., Macdonald, D.W., Kamizola, R. 2002. Dietary opportunism in side-striped jackals Canis adustus Sundevall. Journal of Zoology, London. 257: 129-139. Avinandan, D. 2003. Food habits of tigers (Panthera tigris tigris) in Sariska tiger reserve, Rajasthan. M.S. thesis, Saurastra University, Gujarat, India. Bagchi, S., Goyal, S.P., Sankar, K. 2003. Prey abundance and prey selection by tigers (Panthera tigris) in a semi-arid, dry deciduous forest in western India. Journal of Zoology, London. 260: 285-290. Bailey, T.N. 1993. The African leopard: a study of the ecology and behavior of a solitary felid. Columbia University Press, New York. Berkmuller, K., Mukherjee, S.K., Mishra, B.K. 1990. Grazing and cutting pressures on Ranthambhore National Park, Rajasthan, India. Environmental Conservation. 17: 135-140. Biknevicius, A.R. and Van Valkenburgh, B. 1996. Design for killing: craniodental adaptations of predators. In Carnivore behavior, ecology and evolution, Vol. 2. pp. 393-428. Gittleman, J.L. (ed.). Comstock Publishing Associates, Ithaca, NY. Biswas, S. and Sankar, K. 2002. Prey abundance and food habit of tigers (Panthera tigris tigris) in Pench National Park, Madhya Pradesh, India. Journal of Zoology, London. 256: 411-40. Buckland, S.T., Anderson, D.R., Burnham, K.P., Laake, J.L. 1993. Distance sampling: estimating abundance of biological populations. Chapman and Hall, New York, Ny. Burnham, K.P. Anderson, D.R., Lake, J.L. 1980. Estimation of density from line transect sampling of biological populations. Wildlife Monograph. 72: 7-202. Capitani, C., Bertelli, I., Varuzza, P., Apollonio, M. 2004. A comparative analysis of wolf (Canis lupus) diet in three different Italian ecosystems. Mammalian Biology. 69: 1-10. Chellam, R. 1993. Ecology of the Asiatic Lion (Panthera leo persica). Ph.D. dissertation, Saurashtra University, Gujarat, India.

68
Ciucci, P., Boitani, L., Pelliccioni, E.R., Rocco, M., Guy, I. 1996. A comparison of scat analysis methods to assess the diet of the wolf. Wildlife Biology. 2: 37-48. Durant, S.M. 1998. Competition refuges and co-existence: an example from Serengeti carnivores. Journal of Animal Ecology. 67: 370-386. Eisenberg, J.F. and Lockhart, M. 1972. An ecological reconnaissance of Wilpattu National Park, Ceylon. Smithsonian Contributions to Zoology. 101: 1-118. Emmon, L.H. 1987. Comparative feeding ecology of felids in a neotropical rainforest. Behavioral Ecology and Sociobiology. 20: 271-283. Ewer, R.F. 1973. The carnivores. Weidenfeld and Nicholson, London, UK. Fedriani, J.M., Palomares, F., Delibes, M. 1999. Niche relationships among three sympatric Mediterranean carnivores. Oecologia. 121: 138-148. Feinsinger, P., Spears, E.E., Poole, R.W. 1981. A simple measure of niche breath. Ecology. 62:27-32. Floyd, T.J., Mech, L.D., Jordon, P.J. 1978. Relating wolf scat contents to prey consumed. Journal of Wildlife Management. 42: 528 -532. Gittleman, J.L. 1985. Carnivore body size; ecological and taxonomical correlates. Oecologica. 67: 540-554. Grassman, L.I. Jr., Tewes, M.E., Silvy, N.J., Kreetiyutanont, K. 2005. Spatial ecology and diet of the dhole Cuon alpinus (Canidae, Carnivora) in north central Thailand. Mammalia. 69: 11-20. Griffiths, D. 1975. Prey availability and the food of predator. Ecology. 56: 1209-1214. Grobler, J.H. and Wilson, V.J. 1972. Food of the leopard Panthera pardus (Linn.) in the Rhodes Matopos National Park, as determined by fecal analysis. Aronldia. 5: 1-10. Harihar, A. 2005. Population, food habitats and prey densities of tiger in Chilla Range, Rajaji National Park, Uttaranchal, India. M.S. thesis, Saurashtra University, Gujarat, India. Hart, J.A., Katembo, M., Punga, K. 1996. Diet of equivalent populations of North American small mammals. American Midland Nature. 37:223-247. Hayward, M.W., Henschel, P., O’Brien, J., Hofmeyr, M., Balme, G. Kerley G.I.H. 2006. Prey preferences of the leopard (Panthera pardus). Journal of Zoology, London. 270: 298-313.

69
Henschel, P. and Ray, J.C. 2003. Leopards in African rain forest: survey and monitoring techniques. Unpublished report no. 54. Wildlife Conservation Society, New York, Ny. Hines, J.E. 1999. SCATMAN-software to test the hypothesis of prey selectivity based on random samples of predator scats. USGS-PWRC. www.mbr.nbs.gov:80/scatman.html. Jathanna, D., Karanth, K.U., Johnsingh, A.J.T. 2003. Estimation of large herbivore densities in the tropical forests of southern India using distance sampling. Journal of Zoology, London. 261: 285–290. Johannes, M.E. 1997. Character displacement in Australian dasyurid carnivores: size relationships and prey size patterns. Ecology. 78: 2569-2587 Johnsingh, A.J.T. (1983). Large mammalian prey-predators in Bandipur. Journal of the Bombay Natural History Society. 80: 1-57. Johnsing, A.J.T. (1992). Prey selection in three sympatric carnivores in Bandipur. Mammalia. 56: 517-526. Karanth, K.U. and Sunquist, ME. 1995. Prey selection by tiger, leopard and dhole in tropical forests. Journal of Animal Ecology. 64: 439-450. Karanth, K.U. and Sunquist, M.E. 2000. Behavioral correlates of predation by tiger (Panthera tigris), leopard (Panthera pardus) and dhole (Cuon alpinus) in Nagarahole, India. Journal of Zoology, London. 250: 255-265. Karanth, K.U. and Stith, B.M. 1999. Prey depletion as a critical determinant of tiger densities. In Riding the tiger- tiger conservation in human dominated landscapes. Seidensticker, J., Christie, S., Jackson, P. (eds.). pp.100-113. Cambridge University Press, Cambridge, UK. Karanth, K.U., Nichols, J.D., Kumar, N.S., Link, W.A., Hines, J.E. 2004. Tigers and their prey: predicting carnivore densities from prey abundance. Proceedings of National Academy of Science. USA. 101: 4854-4858. Kiltie, R.R. 1988. Interspecific size regularities in tropical felid assemblages. Oecologica. 76: 97-105. Kitchner, A. 1991. The natural history of the wild cats. Christopher Helm, A. and C. Black. London, UK.

70
Kok, O.B. and Nel, J.A.J. 2004. Convergence and divergence in prey of sympatric canids and felid: opportunism or phylogenetic constraint? Biological Journal of the Linnean Society. 83:527-538. Krebs, J.R. 1978. Optimal foraging: decision rules for predators. In Behavioral ecology, an evolutionary approach. pp. 23-62. Krebs, J.R. and Davis, N.J. (eds.). Blackwell Scientific Publications, Oxford, UK. Link, W.A. and Karanth, K.U. 1994. Correcting for over-dispersion in tests of prey selectivity. Ecology. 75: 2456-2459. Manley, B.F.J., McDonald, L.L., Thomas, D.L., McDonald, T.L., Erickson, W.P. 2002. Resource selection by animals: statistical design and analysis for field studies, 2nd edition. Kluwer Academic Publishers, Boston, MA. MoA 2002. Field guide to the mammals of Bhutan. Nature Conservation Division, Ministry of Agriculture. Thimphu, Bhutan. Meriggi, A. and Lovari, S. 1996. A review of wolf predation in southern Europe: does the wolf prefer wild prey to livestock? Journal of Applied Ecology. 33:1561-1571. Meriggi, A., Rosa, P., Brangi, A., Matteucci, C. 1991. Habitat use and diet of the wolf in northern Italy. Acta Theriology. 36: 141-151. Meriggi, A., Brangi, A., Matteucci, C., Sacchi, O. 1996. The feeding habits of wolves in relation to large prey availability in northern Italy. Ecography. 19: 287-295. Mishra, C. 2001. High altitude survival: conflicts between pastoralism and wildlife in theTrans-Himalaya. Ph. D. dissertation, Wageningen University, The Netherlands. Mukherjee, S., Goyal, S.P., Chellam, R. 1994. Standardization of scat analysis techniques for leopard (Panthera pardus) in Gir National Park, Western India. Mammalia. 58:139-143. Odum, E.P. and Kuenzler, E.J. 1955. Measurement of territory and home range size in birds. Auk. 72: 128-137. Paddle, R. 2000. The last Tasmanian tiger: the history and extinction of the thylacine. Cambridge University Press, Cambridge, UK. Palmoares, F., Ferreras, P., Fedriani, J., Delibes, M. 1996. Spatial relationships between Iberian lynx and other carnivores in an area of south-western Spain. Journal of Applied Ecology. 33: 5-13.

71
Pandav, B. and Goyal, S.P. 2005. Population, food habits and prey densities of tiger in Chila Range, Rajaji National Park. Wildlife Insitute of India, Uttaranchal, India. Pianka, E.R. 1973. The structure of lizard communities. Annual Review of Ecology and Systematics. 4: 53-74. Pianka, E.R. 1974. Niche overlap and diffuse competition. Proceedings of National Academy of Science, USA. 71: 2141-2145. Pole, A., Gordon, I.J., Gorman, M.L., MacAskill, M. 2004. Prey selection by African wild dogs (Lycaon pictus) in southern Zimbabwe. Journal of Zoology, London. 262: 207-215. Rabinowitz, A. 1989. The density and behavior of large cats in a dry tropical forest mosaic in Huai Kha Khaeng Wildlife Sanctuary, Thailand. Natural History Bulletin. Siam Society. 37: 235-251. Ramakrishnan, U., Coss, R.G., Pelkey, N. 1999. Tiger decline caused by the reduction of large ungulate prey: evidence from a study of leopard diets in southern India. Biological Conservation. 889: 113-120. Reddy, H.S., Srinivasula, C., Rao, K.T. 2004. Prey selection by the Indian tiger (Panthera tigris tigris) in Nagarjunasagar Srisailam Tiger Reserve, India. Mammalian Biology. 69: 384 – 391. Reynolds, J.C. and Aebischer, N.J. 1991. Comparison and quantification of carnivore diet by fecal analysis: a critique, with recommendations, based on a study of the fox, Vulpes vulpes. Mammlian Rev. 21: 97-122. Rosenzweig, M.L. 1996. Community structure in sympatric carnivora. Journal of Mammalogy. 47: 602-612. Sankar, K. 1994. The ecology of three large sympatric herbivores (chital, sambar and nilgai) with special reference for reserve management in Sariska Tiger Reserve, Rajasthan, Ph.D. dissertation, University of Rajasthan, Jaipur, India. Schaller, G.B. 1967. The deer and the tiger. University of Chicago Press. Chicago, IL. Seidenticker, J. 1976. On the ecological separation between tigers and leopards. Biotropica. 8: 225-234. Steneck, R.S. 2005. An ecological context for the role of large carnivores in conserving biodiversity. In Large carnivores and the conservation of biodiversity.pp. 9-32, Ray, J.C., Redford, K.H., Steneck, R.S., Berger J. (eds.). Island Press, Washington, D.C.

72
Suja, R. 2004. Diet profile of three large sympatric carnivores in Central India. M.S. thesis. Bhharathidasan University, Tamil Nadu, India. Sunquist, M.E. 1981. The Social organization of tigers (Panthera tigris) in Royal Chitwan National Park. Smithsonian Contribution to Zoology. 336: 1-98. Sunquist, M.E. and Sunquist, F.C. 1989. Ecological constraints on predation by large felids. In carnivore behavior, ecology and evolution. Pp. 283-301, Gittleman, J.L. (ed.). Cornell University Press, Ithaca, NY. Sunquist, M.E., Karanth, K.U., Sunquist, F. 1999. Ecology, behavior and resilience of the tiger and its conservation needs. In Riding the tiger: tiger conservation in human-dominated landscapes. Seidensticker, J., Christie, S., Jackson, P. (eds.). pp. 5-18. Cambridge University Press. Cambridge, UK. Taber, A.B., Novaro, A.J., Neris, N., Colman, F.H. 1997. The food habits of sympatric jaguar and puma in the Paraguayan Chaco. Biotropica. 29:204-213. Venkataraman, A.B., Arumugam, R., Sukumar, R. 1995. The foraging ecology of dhole (Cuon alpinus) in Mudumalai Sanctuary, southern India. Journal of Zoology, London. 237: 543-561. Wang, S. W. 2001. Conservation Management Plan for the Black Mountains National Park. Ministry of Agriculture, Thimphu, Bhutan. Wang, S.W. and Macdonald, D.W. 2006. Livestock predation by carnivores in Jigme Singye Wangchuck National Park, Bhutan. Biological Conservation.129: 558-565. Wang, S.W., Lassoie, J.P., Curtis, P. 2006a. Farmer attitudes towards conservation in Jigme Singye Wangchuck National Park, Bhutan. Environmental Conservation. 33: 1-9. Wang, S.W., Curtis, P., Lassoie, J.P. 2006b. Farmer perceptions of crop damage by wildlife in Jigme Singye Wangchuck National Park, Bhutan. Wildlife Society Bulletin. 34: 359-365. Weins, J.A. 1993. Fat times, lean times and competition among predators. Trends Ecology and Evolution. 8:348-349.

73
CHAPTER IV
POPULATION DENSITIES, BIOMASS AND POTENTIAL HABITATS OF UNGULATES IN JIGME SINGYE WANGCHUCK NATIONAL PARK,
BHUTAN
Abstract
Ecological knowledge of prey population densities, biomass and distribution
derived from biologically and statistically robust methods, are important for protection
and monitoring prey populations which are critical for survival of large carnivores.
Thirty-two transects (ranging from 2 to 14 km) were walked at least four times each to
estimate densities, biomass and potential habitats of ungulates and primates in
Bhutan’s Jigme Singye Wangchuck National Park during 2005-2006. A total of 849
km was walked during the survey resulting in 285 sightings for 13 different wildlife
species. Adequate detections (>40 sightings) were available only for wild pig (Sus
scrofa, n = 54), muntjac (Munticus muntjac, n = 102) and sambar (Cervus unicolor, n
= 48). Due to similarity in morphology and habitat use, serow (Capricornis
sumatraensis) density was estimated using the detection probability for sambar as a
surrogate. Detections for langur (Trachypithecus geei) and macaque (Macca mulatta)
were combined (n = 39) to estimate primate density. Mean estimated densities for
different species were 3.68 wild pig km-2, 2.17 muntjac km-2, 1.19 sambar km-2, 2.37
primates km-2 and 0.36 serow km-2. The three primary prey species, wild pig, sambar
and muntjac, provided a biomass of 379 kg km-2, which could support up to 1.2 tigers
100 km-2. However, the presence of other sympatric carnivores competing for prey in
the same area suggests that the actual number of tigers supported would likely be
fewer than 1.2 100 km-2. Livestock density (6.0 km-2, estimate based on population
figures obtained from village livestock officers), and biomass (615 kg km-2)
apparently supplements prey requirements. Resource selection functions for potential

74
ungulate habitats were modeled using GIS and multiple regressions of prey sightings
and habitat variables. Both wild pigs and muntjacs were found at lower elevations near
agricultural fields associated with human settlements. Sambars were found both near
settlements and in deep forests. Ungulate density in the study area was found to be
extremely low compared to those from other areas in the Indian sub-continent.
Conflicts with farmers, excessive grazing in the forest by livestock, and rugged terrain
may be associated with lower ungulate densities.
Introduction
The inherent economic, aesthetic and food values of the ungulates, and their
ability to influence forest structure, composition and dispersal of seeds, nutrient
cycling, soil structure and succession (McNaughton, 1979; Crawley, 1983), make
them a valuable part of the natural assemblage and for large carnivore conservation.
Ungulates such as guar (Bos gaurus), sambar (Cervus unicolor), chital (Axis axis) and
wild pigs (Sus scrofa) were known to provide 60-70% of biomass consumed by tigers
(Panther tigris), leopards (Panthera pardus) and dholes (Cuon alpinus) (Johnsingh,
1992; Venkataraman, et al., 1995). Ungulates form a major part of carnivore diets
(Schaller, 1967; Seidensticker, 1976; Johnsingh, 1983; Karanth and Sunquist, 1995;
Karanth and Nichols, 1998; Biswas and Sankar, 2002; Bagchi, et al., 2003; Jathanna,
et al., 2003). Consequently, their conservation is essential for sustaining populations of
predators. Declines in tiger populations have been attributed to low prey populations
(Karnath and Stith, 1999), which poses a challenge in our efforts to recover tiger
populations. Studies by Schaller (1967), Sunquist (1981), Seidensticker and
McDougal (1993) and Karanth (1995) have established a direct correlation between
tiger and prey densities. More recent studies (Karnath and Sunquist, 1995; Miquelle, et
al., 1996; Karanth and Nichols, 1998; Carbone and Gittleman, 2002; Karanth, et al.,

75
2004) also proposed that abundance of carnivores were largely dependent on densities
of different sizes of ungulate prey and biomass. Karanth and Stith (1999) also reported
that tiger populations thrive, even with low levels of poaching, if their prey base is
protected and maintained at adequate density.
If declining prey populations are a threat to the survival of predators species,
then conservation strategies must surely focus on protection of key prey populations.
Ecological knowledge on prey densities, biomass and distribution derived using valid
methods are important for monitoring prey populations (Karanth, 1995). However,
relatively low population densities, unique habitat requirements, crop raiding, their
consumption by local people and lack of scientifically valid studies makes their
conservation difficult (Karanth and Sunquist, 1992).
Several studies in the sub-tropical forests of Asia have estimated population
parameters for ungulates in India (Schaller, 1967; Berwick, 1974; Johnsingh, 1983;
Karanth and Sunquist, 1992; Karanth and Sunquist, 1995; Khan, et al., 1996; Biswas
and Sankar, 2002; Bagchi, et al., 2003; Jathanna, et al., 2003), Sri Lanka (Eisenberg
and Lockhart, 1972) and Nepal (Seidentiscker, 1976; Dinerstein, 1979; Tamang,
1982). However, these studies relied on non-standard methods and failed to address
important questions relating to probabilities of detection and representative sampling
(Karanth and Sunquist, 1992; Buckland, et al., 1993; Karanth and Stith, 1999). After
Karanth (1987) emphasized the importance of using statistically and biologically valid
methods, few studies based in tropical India (Karanth and Sunquist, 1992; Varman and
Sukumar, 1995; Khan, et al., 1996; Karanth and Nichols, 1998; Biswas and Sankar,
2002; Jathanna, et al., 2003) have generated more reliable estimates of herbivore
densities based on distance sampling. While these studies have advanced our
understanding of ungulate ecology in a tropical ecosystem in Asia, similar studies
focusing on ungulate densities, biomass and distribution from temperate forest

76
ecosystems will advance our understanding of prey populations in different
ecosystems and their interactions with predators especially in human-dominated
landscapes.
Seidensticker (1976) reported that ungulate species varied in their occurrence
in different vegetation types. Later studies on ungulates from India have also revealed
varying densities from 10 animals km-2 (Jathanna, et al., 2003) to 90.3 animas km-2
(Biswas and Sankar, 2002) which Karanth, et al. (2004) attributed to different habitat
types. Consequently, biomass ranging from 1,064 kg km-2 (Jathanna, 2001) to 7,638
kg km-2, (Karanth and Nichols, 1998) also varied among habitat types. This would
influence predator abundance and population dynamics (Karanth, et al., 2004).
Knowing the potential habitats for prey species is therefore important for assessing
habitat quality and management (Whittaker and Lindzey, 2004; Kushwaha, et al.,
2004; Krebs, et al., 2007). Resource selection studies have been widely used for
assessing habitat suitability for wild animals (Manly, et al., 2002; Krebs, et al., 2007).
Such analyses incorporate spatial behavior of prey species depending on habitat type
(Gilpin and Soule, 1986), proximity to human settlements, and other environmental
and socio-economic factors. This knowledge is important to identify and protect
critical habitats of prey species, and help farmers manage their crops near habitats
preferred by ungulates
Protected populations of wild ungulates, sharing resources with livestock and
herders in Bhutan’s temperate forests, provides an excellent opportunity to evaluate
ungulate dynamics, their interaction with livestock and other anthropogenic factors.
Using distance sampling methods (Eberhardt, 1978; Burnham, et al., 1980, Buckland,
et al., 1993), this study was designed to provide scientific knowledge about ungulate
ecology and abundance in Bhutan. Data gathered will help formulate management
strategies targeted at protecting predators and prey and reduce wildlife conflict with

77
farmers. Specifically the study was designed to: (1) estimate population densities and
biomass for major prey species of tiger, leopard and dhole; (2) understand the
distribution and habitat preferences of ungulates; and (3) recommend measures for
reducing crop damage while simultaneously protecting ungulate populations.
Study area
This study was conducted in five warden jurisdictions (Chendebji, Athang,
Langthel, Korphu and Trong) within Bhutan’s Jigme Singye Wangchuck National
Park (JSWNP), located in central Bhutan. (Figure 4.1). The Park is bordered to the
east and west respectively by the rivers Mangde chu and Sunkosh chu. The Park’s
diverse physical features, temperature and rainfall have created climatic zones ranging
from wet sub-tropical in the south to permanent alpine pastures and glaciers in the
north (Wang, 2001). Elevation rises sharply from 150 meters amsl from Tingtibi
(south) to over 4900 meters (amsl) at the peak of Mt. Jo-Durshing la. This ruggedness
renders approximately 20% of the park inaccessible for sampling especially during
summer and winter.
The Park has large areas of mature fir (Abies spp) and pine (Pinus spp) forests,
ranging from sub-alpine to temperate and large areas of climax broadleaf forest,
ranging from temperate to subtropical. Along with Indian manas and Bhutan manas, it
is among the largest tiger conservation areas in South Asia and represents the full
range of habitats from the plains to the alpine zone with high species diversity. These
diverse habitats host important populations of predators (such as tiger, leopard, dhole,
etc.) and prey (such as guar, sambar, muntjac [Munticus muntjac], wild pig, serow
[Carpicornis sumatraensis], langur [Trachypithecus geei] and macaque [Macaca
mulatta]). The Park is thought to function as a crucial link between the northern and

78
Figure 4.1. Study area map of Jigme Singye Wangchuck National Park with transects (red lines) in relation to protected areas map of Bhutan.

79
southern tiger populations of Bhutan (Wang, 2001). The east side of the Park, is
thought to support up to 10% of Bhutan’s total tiger population (Wang, 2001).
Amost six thousand farmers live in 34 villages that spread across the Park.
Most of the farmers are either settled in the rich river valleys, or on the gentle
shoulders of the hills or in the glaciers valleys. Agriculture (Wang, et al., 2006a) and
livestock rearing (Wang and Macdonald, 2006) are the major sources of livelihood
including cash income. All farmers residing lower altitudes keep cattle, while farmers
who live in alpine regions prefer yak.
Methods
Training research assistants
Six research assistants were trained to help conduct transect surveys in the
field. The training consisted of a week long class room session, and field experience
with the various methods. In the class, I explained the basic theory of wildlife surveys,
specifically direct sighting along transects. The behavior and habitat preferences of
major prey species were also discussed. Based on the objectives of the study, a simple
data sheet for collecting direct sighting data was also developed. All research
assistants were familiarized with field equipment including Geographic Positioning
Systems (GPS), compass and range finders. The team was trained to be quiet and
vigilant when walking in the forest.
During the field tests, I assessed what was recalled from class under various
field conditions. Research assistants were trained to be very quiet to increase the
sighting frequencies (Karanth and Nichols, 2002), and emphasis was given to
accurately estimating distances by cross-checking the estimated distances with range
finders. The field training lasted more than two weeks. At the end field training, the
group was reassembled at the Park’s head office to assess the methodology. An

80
important outcome was the low frequency of sightings, which improved with smaller
groups and less noise made by the group. To increase sightings, the group was
reminded to take extra care when walking transects especially when over dry litter.
The most effective group size was decided to be three, with one person each looking
left and right, while the third person looked ahead.
Field survey
Line transect methods (Eberhardt, 1978; Burnham, et al., 1980, Buckland, et
al., 1993) were used to sight wild ungulates. Transects have provided credible results
(Anderson, et al., 1979), and have been successfully used to estimate animal densities
in south Asia (Karanth and Sunquist, 1992, 1995; Varman and Sukumar, 1995; Khan,
et al., 1996; Biswas and Sankar, 2002; Bagchi, et al., 2003; Jathanna, et al., 2003).
Thirty-two line transects (ranging from 2 to 14.5 km) were identified for the study in a
stratified random manner, representing the five warden jurisdictions and different
habitat types, elevation and proximity to waterholes and human settlement. The
location and length of the transects were limited by accessibility on foot and by
season. Field crews walked the 32 transects 4-5 times each from September 2005
through July 2006, covering a total length of 849 kilometers. Transects were mostly
walked early in the morning (0600-1000 hrs) or in the evening (1500-1800 hrs). For
each transect, total length of the transect walked, the number of clusters detected,
cluster size, sighting distance (measured with a range finder) and sighting angle
(measured with compass) were recorded for every prey species encountered. For
species occurring in clusters (e.g., wild pigs and primates), the distances and angles
were recorded to the center of the cluster. Cattle populations were found in large
clusters confined to certain areas and hence population estimation by the line transect

81
method was not done for livestock. Instead, cattle population data were obtained from
village livestock officers.
Analysis
Using program DISTANCE (Thomas, et al., 2006) analyses were carried out
for each species for each of the study zones. Error checking and reformatting of the
data were done before exporting it to the DISTANCE software (Jathanna, et al., 2003).
While a total of 13 different prey species was sighted, adequate numbers (≥40) were
available only for sambar, muntjac and wild pig. Sightings for langur and macaque
were combined to obtain primate density estimates. Due to similarity in body sizes and
habitat used, serow density was estimated using the detection probability for sambar as
a surrogate.
Prior to generating final results using program DISTANCE, exploratory
analyses of the data were carried out (Buckland, et al., 2001) to check for any
evidence of evasive movement before detection, ‘rounding’ and ‘heaping’ of data and
to truncate outlier observations, if necessary, for improving model fitting (Jathanna, et
al., 2003). The fit of possible alternative models to each data set was judged using
Akiake’s information criteria (AIC) values (Buckland, et al., 2001) which presented a
compromise between the quality of fit and increased number of model parameters and
the goodness of fit tests generated by program DISTANCE. AIC was computed as
AIC = -2 loge( + 2q; where loge( ) represents the log likelihood function evaluated at
the maximum likelihood estimates of the model parameters and q is the number of
parameters in the model (Buckland et al., 1993, 2001; Burnham and Anderson, 1998).
Once an appropriate model was selected in program DISTANCE, parameters such as
encounter rate (n/L), strip width (ESW), average probability of detection (p), cluster
density (Ds), cluster size (Y) and prey density (D) were estimated (Burnham et al.

82
1980; Buckland et al. 1993). Analysis of Variance (ANOVA) was used to test for
differences in density estimates of prey species across zones. Density estimates were
then used to estimate the biomass of prey species in the study area.
Habitat suitability for major prey species
Wildlife location information collected from field surveys (e.g., radio
telemetry, aerial observation and transect walks) combined with habitat variables in
GIS model has been widely used to study habitat selection by wildlife (Manly, et al.,
2002; Whittaker and Lindzey, 2004; Kushwaha, et al., 2004; Krebs, et al., 2007). We
imported sightings of prey species (sambar, muntjac and wild pig) and transect
coordinates into the GIS database of the study area and generated values for the
habitat variables such as elevation, slope, aspect, forest types, human settlement and
land-use types (Kushwaha, et al., 2004; Whittaker and Lindzey, 2004). To model
potential suitable habitat (see equations 1, 2, 3) for each of the three prey species, I
used multiple regression to estimate coefficients in an exponential resource selection
function using methods detailed by Manly, et al. (2002), in which animal sightings
were used as a dependent variable and the habitat features were independent variables.
The regression coefficients thus obtained were then used to map suitable prey habitats.
Equation 1. Wild pig habitat suitability =( ([Elevation]* (-0.007)) + ([Slope] * (-0.286)+([Settlement_estimator] * (-0.001))+([ Agricultural_landuse] * (-6.411))+([Broadleaf_landuse] * (0.753))+([Coniferous landuse] * (-4.762))+([ Natural Pasture landuse] * (5.911))+([ Open land] * (-9.160))+([Open_rock] * (1.882))+([Open_water] * (-3.621))+([ Scrub] * (2.46))+38.648)
Equation 2. Muntjac habitat suitability = ( ([Elevation]* (-0.003)) + ([Slope] * (-0.093))+([Settlement estimator] * (-0.0000169))+([Agricultural landuse] * (-2.676))+([Broadleaf forest] * (-0.236))+([Coniferous forest] * (-2.162))+([Natural pasture] * (3.331))+([Open_land] * (-2.953))+([Open_rock] * (-0.364))+([Open_water] * (-4.243))+([Scrub] * (0.528))+12.958)

83
Equation 3. Sambar habitat suitability = ( ([Elevation]* (-0.001)) + ([Slope] * (-0.062))+([Settlemnt HM estimator] * (-0.000))+([Agricultural landuse] * (-0.202))+([Broadleaf forest] * (1.920))+([Coniferous forest] * (-1.173))+([Natural Pasture] * (1.919))+([Open_land] * (-0.513))+([Open_rock] * (-3.252))+([Open_water] * (-2.254))+([ Scrub] * (2.361))+8.203)
Results
Prey sightings and applicability of distance sampling
In total, 849 km were traversed with a total of 285 animal sightings belonging
to 13 different species (Table 4.1). Preliminary analysis revealed low detections
frequency. The number of detections for serow, langur and macaques were well below
the minimum of 40 recommended by Burnham, et al. (1980) and Buckland, et al.
(1993). Primate data also showed evidence of evasive movements before detections
(Figure 4.2) and ‘heaping’ of data was also evident (Table 4.2).
Figure 4.2. Half normal key fitted to primate detections showing evasion of the transect line and outliers in un-truncated primate data (2006).
0.0
0.2
0.4
0.6
0.8
1.0
1.2
0 10 20 30 40 50 60 70 80 90 100
Perpendicular distance in meters

84
Table 4.1. Number of detections from 32 transects (849 km) in Jigme Singye Wangchuck National Park, Bhutan (2006).
Prey species Total sightings Wild pig (Sus scrofa) 54 Serow (Carpicornis sumatraensis 6 Sambar (Cervus unicolor) 48 Musk Deer (Moschus chrysogaster) 1 Muntjac (Munticus muntjac) 102 Monal pheasant (Lophophorus impejanus) 1 Macaque (Macaca mulatta) 15 Langur (Trachypithecus geei) 24 Kalij (Lophura leucomelanos) 12 Hornbill (Aceros nipalensis) 9 Heron (Ardea insignis) 7 Goral (Nemorhaedus goral) 4 Bear (Ursus thibetanus) 2 Total 285
Prey density and biomass
A Half-normal key function, with no adjustment terms best described the
detection functions of muntjac (AIC = 760.61), wild pig (AIC = 437.45) and sambar
(AIC = 383.58) (Table 4.2). With a lower detection probability compared to muntjac
at 0.33, wild pig density was the highest at 3.68 (+/-0.39) km-2 with comparatively low
coefficient of variation. Sambar, which is believed to be the most preferred prey for
tiger has an estimated density of 1.19 (+/-0.31) animals km-2 with a detection
probability of 0.35 (Table 4.2). Using sambar detection function as surrogate, the
density of serow is estimated at 0.36 individuals km-2. Similar to the ungulates, a half-
normal key function also best fit the primate data (density of 2.37 (+/-0.89) animals
km-2. Estimates of density based on study zone stratification explained the distribution
of prey species in more detail (Figure 4.3). Of the five study zones, Trong had the
highest density (D = 16.2 animals km-2) followed by Chendebji

85
Bio
mas
s kg
km
-2
139.
78
43.3
5
163.
06
18.9
6
95%
C
I
1.78
-7.
58
1.55
-3.
03
0.71
-1.
98
1.14
-4.
9
CV
(%)
(D)
37.7
8
16.8
4
25.9
3
37.5
6
D (S
E)
3.68
(1
.39)
2.17
(0
.36)
1.19
(0
.31)
2.37
(0
.90)
CV
(%)
(Dg)
29.9
3
16.5
5
25.5
35.4
3
Dg
(SE)
0.91
(0
.27)
1.96
(0
.32)
0.98
(0
.25)
0.28
(0
.01)
Clu
ster
37.2
3.4
3.3
11.0
ESW
33.4
29.2
28.8
49.0
P-ha
t
0.33
0.41
0.35
0.49
f(0)
0.03
0.03
0.03
0.02
AIC
437.
45
760.
61
383.
58
238.
43
Mod
el
Hal
f –no
rmal
ke
y
Hal
f –no
rmal
ke
y
Hal
f –no
rmal
ke
y
Hal
f –no
rmal
ke
y
Tab
le 4
.2. P
rey
dens
ity, b
iom
ass a
nd d
istri
butio
n in
Jigm
e Si
ngye
Wan
gchu
ck N
atio
nal P
ark,
Bhu
tan
(200
6).
Spec
ies
Wild
pig
Mun
tjac
Sam
bar
Prim
ate
AIC
= A
kiak
e In
form
atio
n C
riter
ia; f
(0) =
Pro
babi
lity
Den
sity
Fun
ctio
n at
zer
o; p
-hat
= d
etec
tion
prob
abili
ty; E
SW =
Eff
ectiv
e
strip
wid
th; C
lust
er =
ave
rage
clu
ster
size
; Dg =
gro
up d
ensi
ty; D
= in
divi
dual
den
sity
; CV
%(D
g) a
nd C
V%
(D) =
coe
ffic
ient
of
varia
tion
on e
stim
ate
of D
g and
D re
spec
tivel
y an
d th
e 95
% C
onfid
ence
Inte
rval
(95%
CI)
on
the
estim
ates
of i
ndiv
idua
l den
sity
D; S
E =
stan
dard
err
or.

86
(D= 12.6 animals km-2) and Langthel (D= 12.3 animals km-2). Athang and Korphu had
less than 4 animals km-2 (Figure 4.3). Muntjac, wild pig and sambar were sighted in all
the study zones. Primate density was highest in Langthel (D = 12 animals km-2)
followed by Korphu (D = 9.1 animals km-2) and Trong (D = 4.5 animals km-2) (Figure
4.3). Athang had both low ungulate and primate densities. Analysis of variance
(ANOVA) revealed that the prey species densities for both ungulates (F = 17.66, P =
0.000) and primates (F = 11, P = 0.000) differed across the study zones.
Prey biomass was estimated using prey densities and average body sizes (also
see, chapter III). The study area harbored a low ungulate biomass of 379 kg km-2.
Muntjac (11%) and sambar (43%) together contributed 54% of the total biomass with
wild pig contributing 37%. Given annual prey intake of about 3000 kg per tiger
(Karanth and Nichols, 1998), this biomass can support only up to 1.2 tigers 100 km-2.
Based on the figures obtained from the records maintained by village livestock
officers, livestock density was estimated at 6 animals km-2 with a biomass of 615 kg
km-2.
16.16
12.64
3.52
12.34
3.39
0.00
2.00
4.00
6.00
8.00
10.00
12.00
14.00
16.00
18.00
Athang Langthel Korphu Chendebji Trong
Zone
Serow
Sambar
Muntjac
Wild Pig
All Ungulates
Primates
Figure 4.3. Density and distribution of prey species across five study zones in Jigme Singye Wanghcuck National Park, Bhutan (2006).

87
Habitat selection of prey species
Multiple regressions analyses were used to model the resource selection
function for the three primary prey species. Wild pig density was significantly
associated with elevation; settlement and presence of agricultural land-use also
showed some affect compared to other model parameters (Table 4.3, Figure 4.4).
Other variables had little impact on the model. The model significantly predicted
higher density of wild pig in areas where there was low elevation (t = -3.374; P =
0.003). The muntjac model showed significant impact of elevation (t = -3.770; P =
0.001) and open water (t = -2.429; P = 0.025); and presence of agricultural landuse,
conifer areas and natural pastures also influenced muntjac presence (Table 4.4, Figure
4.5). Muntjac preferred areas with low elevation and open water. Muntjac avoided
natural pastures. The model for sambar showed no significant variables (Table 4.5).
However, there was some indication of preference for broadleaved and scrubland and
low elevation (Figure 4.6). Table 4.3. Estimated coefficients of the resource selection function for wild pig model in Jigme Singye Wangchuck National Park, Bhutan (2006).
Variable Coefficient Std Error t-value P-value Elevation -0.007 0.002 -3.374 0.003 Slope -0.286 0.233 -1.223 0.236 Stlmnt_HM -0.001 0.000 -1.951 0.066 Agri_pres -6.411 4.458 -1.438 0.167 Broadleaf_pres 0.753 3.693 0.204 0.841 Conifer_pres -4.762 3.502 -1.360 0.190 Natpast_pres 5.911 4.381 1.349 0.193 Opn_lnd_pres -9.160 8.568 -1.069 0.298 Opn_rck_pres 1.882 5.214 0.361 0.722 Opn_wtr_pres -3.621 4.131 -0.877 0.392 Scrub_pres 2.460 4.322 0.569 0.576

88
Figure 4.4. Habitat suitability map of wild pig based on resource selectivity function with darker areas having higher probability of selection than the lighter areas in Jigme Singye Wangchuck National Park, Bhutan (2006).
Table 4.4. Estimated coefficients of the resource selection function for muntjac model in Jigme Singye Wangchuck National Park, Bhutan (2006). Variable Coefficient Std. Error t-value P-value Elevation -0.003 0.001 -3.770 0.001 slope -0.093 0.099 -0.940 0.359 Stlmnt_HM 0.017 0.000 0.114 0.911 Agri_pres -2.676 1.885 -1.419 0.172 Broadleaf_pres -0.236 1.562 -0.151 0.882 Conifer_pres -2.162 1.481 -1.460 0.161 Natpast_pres 3.331 1.853 1.798 0.088 Opn_lnd_pres -2.953 3.623 -0.815 0.425 Opn_rck_pres -0.364 2.205 -0.165 0.871 Opn_wtr_pres -4.243 1.747 -2.429 0.025 Scrub_pres 0.528 1.827 0.289 0.776

89
Figure 4.5. Habitat suitability map of muntjac based on resource selectivity function with darker areas having higher probability of selection than the lighter areas in Jigme Singye Wangchuck National Park, Bhutan (2006).
Table 4.5. Estimated coefficients of the resource selection function for sambar model in Jigme Singye Wangchuck National Park, Bhutan (2006). Variable Coefficient Std. Error t-value P-value Elevation -0.001 0.001 -1.282 0.215 Slope -0.062 0.126 -0.489 0.630 Stlmnt_HM 0.000 0.000 -0.876 0.392 agri_pres -.202 2.407 -0.084 0.934 Broadleaf_pres 1.920 1.994 0.963 0.348 Conifer_pres -1.173 1.890 -0.621 0.542 Natpast_pres 1.919 2.365 0.811 0.427 Opn_lnd_pres -0.513 4.626 -0.111 0.913 Opn_rck_pres -3.252 2.815 -1.155 0.262 Opn_wtr_pres -2.254 2.230 -1.011 0.325 Scrub_pres 2.361 2.333 1.012 0.324

90
Figure 4.6. Habitat suitability map of sambar based on resource selectivity function with darker areas having higher probability of selection than the lighter areas in Jigme Singye Wangchuck National Park, Bhutan (2006).
Discussion
Although distance sampling has been widely used (Biswas and Sankar, 2002;
Bagchi et al., 2003) for estimating prey densities and biomass (Karnath and Sunquist,
1995; Karanth and Nichols, 1998), its applicability has been limited in low visibility
areas such as Bhutan due to the need for an adequate number of sightings at different
distances (Burnham, et al., 1980; Buckland, et al., 1993). After walking the 32
transects for 849 km, I gained sufficient sightings for principal prey species such as
the wild pig, muntjac, sambar and primates. The low detection probability in this study
91
was due to Bhutan’s unforgiving mountainous terrain, combined with low prey
population density, foggy weather and the presence of dry litter on forest floor.
Evasive movements triggered by survey team could have also contributed to low
sightings. Inspite of these limitations, if properly designed and rigorously
implemented with a large effort, distance sampling can be an effective tool in studying
prey populations in Bhutan’s difficult terrain.
The ungulate density estimates (7.4 animals km-2) were clearly much lower
then ungulate densities from other areas in South Asia (Seidensticker, 1976;
Dinerstein, 1979; Karanth and Nichols, 1998, Biswas and Sankar, 2002). The reported
estimated densities of ungulates ranged from to 16.3 animals km-2 (Karanth and
Nichols, 1995) to 90.8 animals km-2 (Harihar, 2005; Table 4.6). In addition to the
climatic and topographical factors, other possible reasons for these low densities in
Bhutan may include poaching of ungulates, both for consumption and in retaliation to
crop damage, and competition with local livestock for resources. Local farmers put out
snares and traps to protect their crops from wild ungulates and also graze large
population of livestock in the area (6 livestock km-2). Past studies (Sankar, 1994;
Mathai, 1999) have reported decreasing ungulate populations in areas with high
competition from livestock. Voluntary resettlement of residents and their stock from
Nagarahole (Karanth and Sunquist, 1992) and Gir (Khan, 1996) have succeeded in re-
emergence of prey populations. Hence, poaching and excessive grazing could have
reduced prey populations. However, long-term monitoring studies of ungulate
populations over time and space, in habitats with and without cattle grazing and
human pressures, can produce evidence to support these hypotheses.
Wild pig had the highest detection probability, possibly due to large cluster
sizes. The wild pig density (3.7 animals km-2) compared quite well with densities
reported from other studies in Asia (Table 4.6). The lowest wild pig density was
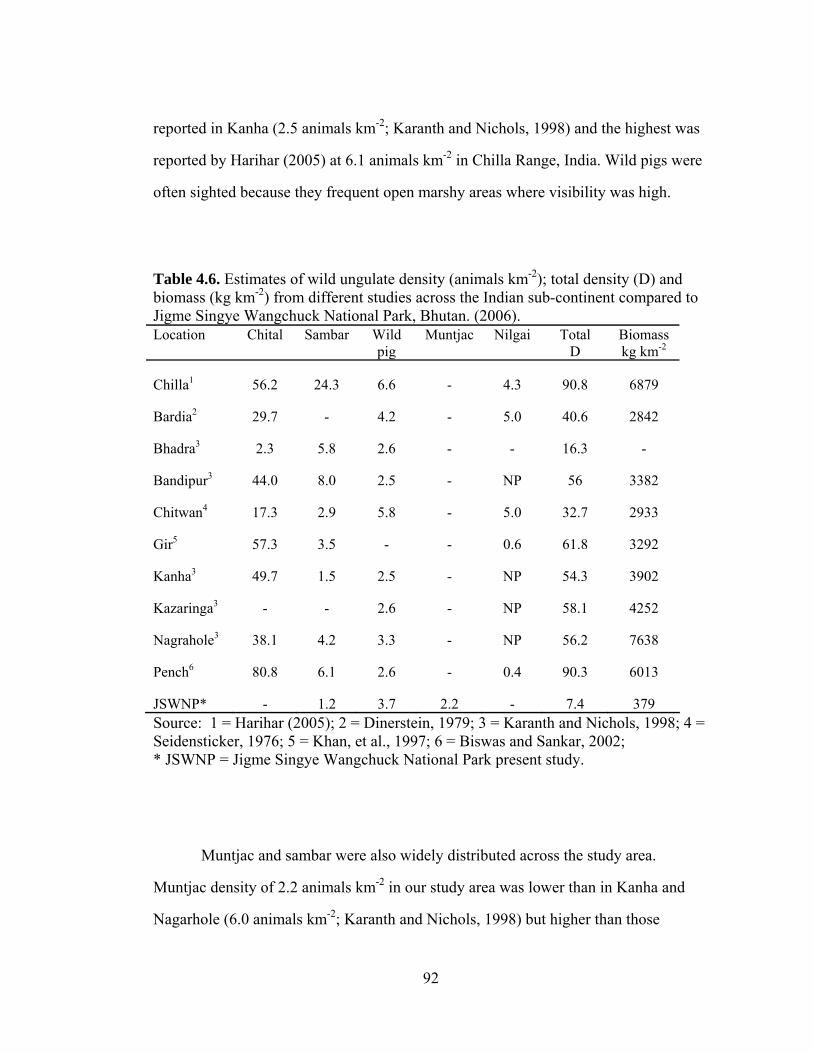
92
reported in Kanha (2.5 animals km-2; Karanth and Nichols, 1998) and the highest was
reported by Harihar (2005) at 6.1 animals km-2 in Chilla Range, India. Wild pigs were
often sighted because they frequent open marshy areas where visibility was high.
Table 4.6. Estimates of wild ungulate density (animals km-2); total density (D) and biomass (kg km-2) from different studies across the Indian sub-continent compared to Jigme Singye Wangchuck National Park, Bhutan. (2006). Location Chital Sambar Wild
pig Muntjac Nilgai Total
D Biomass kg km-2
Chilla1 56.2 24.3 6.6 - 4.3 90.8 6879
Bardia2 29.7 - 4.2 - 5.0 40.6 2842
Bhadra3 2.3 5.8 2.6 - - 16.3 -
Bandipur3 44.0 8.0 2.5 - NP 56 3382
Chitwan4 17.3 2.9 5.8 - 5.0 32.7 2933
Gir5 57.3 3.5 - - 0.6 61.8 3292
Kanha3 49.7 1.5 2.5 - NP 54.3 3902
Kazaringa3 - - 2.6 - NP 58.1 4252
Nagrahole3 38.1 4.2 3.3 - NP 56.2 7638
Pench6 80.8 6.1 2.6 - 0.4 90.3 6013
JSWNP* - 1.2 3.7 2.2 - 7.4 379 Source: 1 = Harihar (2005); 2 = Dinerstein, 1979; 3 = Karanth and Nichols, 1998; 4 = Seidensticker, 1976; 5 = Khan, et al., 1997; 6 = Biswas and Sankar, 2002; * JSWNP = Jigme Singye Wangchuck National Park present study.
Muntjac and sambar were also widely distributed across the study area.
Muntjac density of 2.2 animals km-2 in our study area was lower than in Kanha and
Nagarhole (6.0 animals km-2; Karanth and Nichols, 1998) but higher than those

93
reported in Bandipur (1.0 animal km-2; Johnsingh, 1983) and Bardia (1.7 animals km-2;
Dinerstein, 1980). Sambar, mostly sighted in hilly areas were the least abundant in the
study area (1.2 animals km-2) but similar to the density reported from Kanha (1.5
animals km-2 [Karanth and Nichols, 1998]). The highest density was reported by
Harihar (2005) with 24.3 animals km-2 from Chilla Range.
Models of resource selection indicated that both wild pigs and muntjacs were
found along the valleys nearer to agricultural settlements. The models predicted higher
densities of wild pigs and muntjacs at low elevations near agricultural fields and
conifer habitats. Muntjacs also avoided open water and conifer forests, which did not
offer much cover (Kushwaha, et al., 2004). While there was no significant variable
that predicted sambar habitat suitability, there was an indication that sambar used
broadleaved forests and scrublands with higher density. Similar to muntjac, sambar,
were seldom detected near open rocks and water, probably as anti-predatory strategy.
The ungulate biomass present in Bhutan was the lowest reported from studies
in Asia (379 kg km-2). The lowest biomass reported previously was from Bardia
(Dinerstien, 1979) at 2842 kg km-2 which is almost eight times more than in Bhutan
(Table 4.5). Large mammalian predators like tigers and leopards have been known to
respond to prey biomass and densities (Carbone and Gittleman, 2002; Karanth, et al.,
2004). In Bhutan, low ungulate densities may be responsible for low numbers of
predators. Using the relationship developed by Karanth et al., (2004), a minimum of
1.2 tigers can be supported by the wild ungulate biomass. However, if we consider
other predators such as leopards and dholes, which also share this ungulate biomass,
then the population of tigers supported could be much lower. Therefore, we must
acknowledge the important role that livestock are playing in supplementing predator
diets thereby maintaining a viable predator population (livestock density in the study

94
area is about 6 animals km-2 with a total biomass contribution twice that of all the
three ungulates at 615 kg km-2).
If conservation efforts are to maintain a viable predator population, then wild
prey densities must be increased. Under the present circumstances, I envision a two-
pronged approach to this challenge. First, reduce resource competition between
livestock and natural ungulates through reduction in forest grazing pressure. Secondly,
reduce livestock populations in the forest so that wild ungulates may re-colonize their
natural habitats. However, livestock currently provides a major proportion of predator
diets, especially for tigers and leopards (chapter III). Abrupt reductions in livestock
may lead to food scarcity and predator population may suffer. Habitat management
could attract natural ungulates back into forests and then initiate a program to reduce
livestock grazing pressure. If this second strategy proves successful, managers can
slowly ban grazing in areas of high ungulate density and biomass. This will provide
multiple benefits to conservation. For one, wild ungulates feeding in natural habitats
will reduce crop damage. Removing livestock from the forest will lower predation
rates. As a result farmers will not lose livestock to predators and will have greater
support for conservation.

95
REFERENCES Anderson, D.R., Laake, J.L. Crain, B.R., Burnham, K.P. 1979. Guidelines for the transect sampling of biological populations. Journal of Wildlife Management. 43: 70-78. Bagchi, S., Goyal, S.P., Sankar, K. 2003. Prey abundance and prey selection by tigers (Panthera tigris) in a semi-arid, dry deciduous forest in western India. Journal of Zoology, London. 260: 285-290. Berwick, S. 1974. The Gir Forest: an endangered ecosystem. American Scientist. 64: 28-440. Biswas, S. and Sankar, K. 2002. Prey abundance and food habit of tigers (Panthera tigris tigris) in Pench National Park, Madhya Pradesh, India. Journal of Zoology, London. 256: 411-40. Buckland, S.T., Anderson, D.R., Burnham, K.P., Laake, J.L. 1993. Distance sampling: estimating abundance of biological populations. Chapman and Hall, New York, Ny. Buckland, S.T., Anderson, D.R., Burnham, K.P., Laake, J.L. 2001. Introduction to distance sampling: Estimating abundance of biological populations. Oxford University Press, UK. Burnham, K.P., Anderson, D.J., Laake, J.L. 1980. Estimation of density from line transect sampling of biological populations. Wildlife Monographs. The Wildlife Society, Bethesda, MD. Burnham, K.P. and Anderson, D.J. 1998. Model selection and inference: a practical information-theoretic approach. Springer-Verlag, NY, Ny. Carbone, C. and Gittleman, J.L. 2002. A common rule for scaling of carnivore density. Science. 295: 2273-2276. Crawley, M.J. 1983. Herbivory: the dynamics of animal plant interactions. University of California Press, Berkeley, CA. Dinerstein, E. 1979. An ecological survey of the Royal Karnali-Bardia Wildlife Reserve, Nepal. Part 2. Habitat/Animal Interactions. Biological Conservation. 16: 265-300. Dinerstein, E. 1980. An ecological survey of the Royal Karnali-Bardia Wildlife Reserve, Nepal. Part 3: ungulate populations. Biological Conservation. 16: 265-300.

96
Eberhardt, L.L. 1978. Transect methods for population studies. Journal of Wildlife Management. 42: 1-31. Eisenberg, J.F. and Lockhart, M. 1972. An ecological reconnaissance of Wilpattu National Park, Ceylon. Smithsonian Contributions to Zoology. 101: 1-118. Gilpin, M.E. and Soule, M.E. 1986. Minimum viable populations: process of species extinction. In conservation biology: the science of scarcity and diversity. pp. 19-34. Soule, M.E. (ed.). Sinauer, Sunderland, MA.
Harihar, A. 2005. Population, food habitats and prey densities of tiger in Chilla Range, Rajaji National Park, Uttaranchal, India. M.S. Thesis, Saurashtra University, Gujarat, India. Jathanna, D. 2001. Density, biomass and habitat occupancy of ungulates in Bahdra Tiger Reserve, Karnataka. M.S. thesis, Saurashtra University, Gujarat, India. Jathanna, D., Karanth, K.U., Johnsingh, A.J.T. 2003. Estimation of large herbivore densities in the tropical forests of southern India using distance sampling. Journal of Zoology, London. 261: 285-290. Johnsingh, A.J.T. 1983. Large mammalian prey-predators in Bandipur. Journal of the Bombay Natural History Society. 80: 1-57. Johnsingh, A.J.T. 1992. Prey selection in three large sympatric carnivores in Bandipur. Mammalia. 56:517-526. Karanth, K.U. 1987. Analysis of predator-prey balance in Bandipur Tiger Reserve with reference to census reports. Journal of Bombay Natural History Society. 85: 1-8. Karanth, K.U. 1995. Estimating tiger Panther tigris populations from camera trapping data using capture-recapture models. Biological Conservation. 71: 333-338. Karanth, K.U. and Sunquist, M.E. 1992. Population structure, density and biomass of large herbivores in the tropical forests of Nagarhole, India. Journal of Tropical Ecology. 8: 21-35. Karanth, K.U. and Sunquist, M.E. 1995. Prey selection by tiger, leopard and dhole in tropical forests. Journal of Animal Ecology. 64: 439-450. Karanth, K.U. and Nichols, J.D. 1998. Estimation of tiger densities using photographic captures and recaptures. Ecology. 79: 2852-2862.

97
Karanth, K.U. and Stith, B.M. 1999. Prey depletion as a critical determinant of tiger densities. In Riding the tiger: tiger conservation in human dominated landscapes. Seidensticker, J., Christie, S. and Jackson, P. (eds.).pp. 100-113. Cambridge University Press, Cambridge, UK. Karanth, K.U. and Nichols, J.D. 2000. Ecological status and conservation of tigers in India. Center for Wildlife Studies, Bangalore, India. Karanth, K.U. and Nichols, J.D. 2002. Monitoring tigers and their prey: a manual for researchers, managers and conservationists in tropical Asia. Center for wildlife studies, Bangalore, India. Karanth, K.U., Nichols, J.D. Kumar, N.S., Link, W.A., Hines, J.E. 2004. Tigers and their prey: predicting carnivore densities from prey abundance. Proceedings of the Natural Academy of Sciences. 101: 4854-4858 Khan, J.A. 1996. Factors governing the habitat occupancy of ungulate in Gir Lions Sanctuary, Gujarat, India. International Journal of Ecology and Environmental Science. 22: 73-83.
Khan, J.A., Chellam, R., Rodgers, W.A., Johnsingh, A.J.T. 1996. Ungulate densities and biomass in tropical deciduous forests in Gir, Gujarat, India. Journal of Tropical Ecology. 12: 149-162. Krebs, J., Lofroth, E.C., Parfitt, I. 2007. Multiscale habitat use by wolverines in British Columbia, Canada. Journal of Wildlife Management. 71: 2180-2192. Kushwaha, S.P.S., Khan, A., Habib, B., Quadri, A., Singh, A. 2004. Evaluation of sambar and muntjac habitats using geostatistical modeling. Current Science. 86: 1390-1400. Manley, B.F.J., McDonald, L.L., Thomas, D.L., McDonald, T.L., Erickson, W.P. 2002. Resource selection by animals: statistical design and analysis for field studies, 2nd edition. Kluwer Academic Publishers, Boston, MA. Mathati, M. 1999. Habitat occupancy across anthropogenic disturbances by sympatric ungulate species in Panna Tiger reserve. M.S. Thesis, Saurashtra University, Gujarat, India. McNaughton, S.J. 1979. Grassland-herbivore dynamics. In Serengiti: Dynamics of an ecosystem. pp. 46–81. Sinclair, A.R.S. and Norton-Griffiths, M. (eds.). Chicago University Press, Chicago, IL.

98
Miquelle, D.G., Smirnov, E.N., Quigley, H.G., Hornocker, M.G., Nikalaev, I.G., Matyushkin E.N. 1996. Food habits of Amur tigers in Sikhote-Alin Zapovednik and the Russian far East and the implications for conservation. Journal of Wildlife Research. 1:138-147. Sankar, K. 1994. The ecology of three large sympatric herbivores (chital, sambar and nilgai) with special reference for reserve management in Sariska Tiger Reserve, Rajasthan, Ph.D. dissertation, University of Rajasthan, Jaipur, India. Schaller, G.B. 1967. The deer and the tiger. University of Chicago Press, Chicago, IL. Seidensticker, J. 1976. Ungulate populations in Chitwan Valley, Nepal. Biological Conservation. 10: 183-210. Seidensticker, J. and McDougal, C. 1993. Tiger predatory behavior, ecology and conservation. In mammals as predators: pp. 105-125. Dunstone, N. and Gorman, N.L. (eds.). Clarendon Press, Oxford, UK. Sunquist, M.E. 1981. The social organization of tigers (Panthera tigris) in Royal Chitwan National Park, Nepal. Smithsonian Contribution to Zoology. 336: 1-98. Tamang, K.M. 1982. The status of tiger (Panthera tigris) and its impact on principal prey populations in the Royal Chitwan National Park, Nepal. Ph.D. dissertation, Michigan State University, East Lansing, MI. Thomas, L., Laake, J.L., Strindberg, S., Marques, F.F.C., Buckland, S.T., Borchers, D.L., Anderson, D.R., Burnham, K.P., Hedley, S.L., Pollard, J.H., Bishop, J.R.B. and Marques, T.A. 2006. Distance 5.0. Release “x”. Research Unit for Wildlife Population Assessment, University of St. Andrews, UK. http://www.ruwpa.st-and.ac.uk/distance/ Varman, K.S. and Sukumar, R. 1995. The line transect method for estimating densities of large mammals in a tropical deciduous forest: an evaluation of modes and field experiments. Journal of Biosciences. 20: 273-287. Venkataraman, A.B., Arumugam, R., Sukumar, R. 1995. The foraging ecology of dhole (Cuon alpinus) in Mudumalai Sanctuary, Southern India. Journal of Zoology, London. 237: 543-561. Wang, S. W. 2001. Conservation Management Plan for the Black Mountains National Park. Nature Conservation Division, Ministry of Agriculture, Thimphu, Bhutan. Wang, S.W. and Macdonald, D.W. 2006. Livestock predation by carnivores in Jigme Singye Wangchuck National Park, Bhutan. Biological Conservation.129: 558-565.

99
Wang, S.W., Curtis, P., Lassoie, J.P. 2006a. Farmer perceptions of crop damage by wildlife in Jigme Singye Wangchuck National Park, Bhutan. Wildlife Society Bulletin. 34: 359-365. Whittaker, D.G.and Lindzey, F.G. 2004. Habitat use patterns of sympatric deer species on Rocky Mountains Arsenal, Colarado. Wildlife Society Bulletin. 32: 1114-1123.

100
CHAPTER V
THE USE OF CAMERA TRAPS FOR ESTIMATING HIGH ALTITUDE TIGER AND LEOPARD POPULATIONS IN JIGME SINGYE WANGCHUCK
NATIONAL PARK, BHUTAN
Abstract
Tigers in Bhutan are a global priority and are listed as ‘endangered’ in the
2000 IUCN Red List of Threatened Species and leopards are listed in Appendix 1 of
the CITES Red List. Both species are listed in Schedule I of the 1995 Forest and
Nature Conservation Act of Bhutan, a designation that affords them special protection.
Past conservation efforts have been based on anecdotal information, which have
lacked reliable baseline ecological information such as population estimates. We used
camera traps in combination with capture-recapture data analysis to estimate tiger and
leopard population size and densities in Bhutan’s Jigme Singye Wangchuck National
Park. Fifty days of camera trapping in each of five study zones resulted in a sampling
effort of 4,050 trap days in an effective sample area of 1,546 km2. Camera trapping
yielded 17 tiger photos and 48 leopard photos. Using photos of the left flank, the
closed capture-recapture Jackknife Model Mh was the best fit for the capture history
data. A capture probability (P) of 0.04 was obtained for both tigers and leopards, thus
generating population size (n) of 8 tigers (SE = 2.12) and 16 leopards (SE = 2.91) with
densities of 0.52 tiger 100 km-2 and 1.03 leopards 100 km-2. Spatial analysis of
habitats in which tigers and leopards were photographed indicated that tigers preferred
less disturbed areas located further away from settlements, while leopards were found
nearer to human settlements. Camera trapping using a capture-recapture framework
was an effective tool for assessing population size for tigers and leopards in low
density areas such as Bhutan.

101
Introduction
Bhutan is one of the 10 priority global hotspots for tiger (Panthera tigris)
conservation (Wang, 2004). Tigers in Bhutan are a global priority because the population
there is thought to have the highest probability of persistence of any worldwide
(Dinerstein, et al., 2006). Eleven of the 36 species of wild felids occur in Bhutan,
including tiger, leopard (Panthera parduus), snow leopard (Uncia uncia) and clouded
leopard (Neofelis nebulosa) (RGoB, 2002).
Tigers are listed as ‘endangered’ in the 2000 IUCN Red List of Threatened
Species, and leopards are listed in Appendix 1 of the CITES Red List (Nowell and
Jackson, 1996). Both species are listed in Schedule I of the 1995 Forest and Nature
Conservation Act of Bhutan, a designation that affords them special protection (Wang
and Macdonald, 2006; also see chapter II). Furthermore, in the Buddhist tradition,
tigers and leopards, along with other living things are revered by the Bhutanese.
Culturally, tigers are one of the four ‘protector’ animals (the others being dragon,
mountain lion, and garuda) and they, like leopards, feature conspicuously in local
culture and religion. An old Bhutanese aphorism is that, “for every mountain there is a
tiger and for every valley there is a king”, and their symbolic potency as lords of the
mountains emphasizes the cultural, as well as biological importance of conserving
tigers in Bhutan.
Despite their place in Bhutanese culture, tigers and leopards have been threatened
in Bhutan through habitat loss, disturbance, conflict with humans and poaching. Wang
and Macdonald (2006) reported that tigers and leopards were thought to be responsible
for 82% of the total annual predation on livestock by wild carnivores in Jigme Singye
Wangchuck National Park (tigers, leopards, dholes [Cuon alpinus] and Himalayan black
bears [Ursus thibettanus] together killed a total of 76 livestock amounting to a total
monetary loss of US$ 12,252), sparking retaliatory mortality by angry farmers. Livestock

102
losses together with crop damage (Wang, et al., 2006a) is a major cause of negative
attitudes towards wildlife and conservation policy around the park (Wang, et al., 2006b).
This conflict can be resolved only by understanding both the ecological and the human
dimensions. Progress is thwarted because little is known of the behaviour or population
ecology of these big cats in Bhutan. This study was a first step to generate critical
biological data based on scientific methodology for effective conservation of these
felids in a human dominated landscape.
Estimating population size for large and cryptic carnivores is, however,
technically difficult, especially when they occur in low numbers (Karanth, et al., [in
prep.]). Approaches include pugmark based expert systems (Choudary, 1970, 1971;
Sawarkar, 1987; Sharma, 2001) and camera trapping using capture-recapture analysis
(Karanth, 1995; Karanth and Nichols, 1998, 2000). Both tigers and leopards can be
individually identified by their uniques stripe or rosette patterns (Karanth, 1995;
Henschel and Ray, 2003) and therefore camera trapping and capture-recapture using
software, such as CAPTURE (Rexstad and Burnham, 1991) can be used to estimate
population size (White, 1996) from capture probability (Nichols, 1992).
Photographic capture-recapture analysis was pioneered by Karanth (1995) for
estimating tiger abundance and has subsequently been applied to a diverse range of
wild felids (Karanth and Nichols, 1998, 2000, 2002; Khorozyang and Malkhasyang,
2002; O’Brien, et al., 2003; Trolle and Kerry, 2003; Karanth, et al., 2004a; Jackson, et
al., 2006). I assessed the effectiveness of using camera traps for photographing tigers
and leopards in rugged high-altitude terrain such as Bhutan. In this study at Jigme
Singye Wangchuck National Park, I examined: (1) estimates of abundance and density
for tigers and leopards, thereby creating a baseline for subsequent monitoring; (2) the
impact of prey availability, park boundaries, proximity to settlements and habitat types
on tiger and leopard distribution and abundance; and (3) applied the findings as a basis

103
for conservation planning, and in particular produced recommendations to reduce
livestock losses to tigers and leopards.
Study area
The study was conducted in five warden jurisdictions (Chendebji, Athang,
Langthel, Korphu and Trong) of Jigme Singye Wangchuck National Park, located in
central Bhutan and joined in the south by Royal Manas National Park. The study was
zoned in phases according to warden jurisdictions (Figure 5.1). The Park is bordered
to the east and west respectively by the rivers Mangde chu and Sunkosh chu. The
Park’s diverse physical features, temperature and rainfall have created climatic zones
ranging from wet sub-tropical in the south to permanent alpine pastures and glaciers in
the north (Wang, 2001). Elevation rises sharply from 150 meters above mean sea level
(amsl) from Tingtibi (south) to over 4900 meters (amsl) at the peak of Mt. Jo-
Durshing la. This ruggedness renders approximately 15-20% of the park inaccessible
for sampling especially during summer and winter (Figure 5.1).
The Park has large areas of mature fir and pine forests, ranging from sub-
alpine to temperate and large areas of climax broadleaf forest, ranging from temperate
to tropical. These are among the last of the large, undisturbed tracts in the Eastern
Himalayans eco-region and together with Royal Manas National Park and Indian
Manas Tiger Reserve, this Park forms the largest tiger conservation area in South
Asia. The Park is thought to function as a crucial link between the northern and
southern tiger populations of Bhutan (Wang, 2001). The east side of the Park,
including part of the Manas-Jigme Singye Wangchuck National Park link areas is
suspected to support up to 10% of Bhutan’s total tiger population (Wang, 2001).

104
Figure 5.1. The camera trap location map of Jigme Singye Wangchuck National Park in relation to Bhutan’s protected area system.

105
Almost 6,000 farmers inhabit 34 villages spread throughout the Park. Most of
the farmers are either settled in the rich river valleys, on the gentle shoulders of the
hills, or in the glacial valleys. Agriculture and livestock rearing are the major sources
of livelihood including cash income (Wang, et al., 2006a). All farmers from lower
altitudes keep cattle, while farmers who live in alpine regions favor yak.
Methods
The study followed methods developed for estimating numbers of tiger and
leopard in India (Karanth, 1995; Karanth and Nichols, 1998, 2000; Karanth, et al.,
2001, Chauhan, et al., 2005a,b; Jackson, et al., 2006), and jaguar (Panthera onca )
studies in South America (Wallace, et al., 2003; Maffei, et al., 2004; Silver, et al.,
2004; Soisalo and Cavalcanti, 2006; Harmsen, 2006). A closed population capture-
recapture framework (Otis, et al., 1978; White, et al., 1982) was used to analyze the
camera-trapping data.
Preliminary survey
A preliminary survey for tiger and leopard sign was carried out in each of the
study zones by walking all available trails. All tiger and leopard sign was then plotted
in a Geographic Information System (GIS), along with associated details of elevation,
aspect and substrate. Sections of trails characterized by high concentrations of tiger
and leopard activity (inferred from sign such as pugmarks, scats, scrapes, etc.), narrow
trails below ridgelines near waterholes or passages between hills, or where movement
was basically constrained by relief or vegetation, were selected as potential camera
points, ensuring that sampling effort covered all areas where the large cats were likely
to be present (Karanth and Nichols, 2002). A pilot study over a period of one month,
106
using ten CuddebackTM [digital] and 4 DeercamTM [film] camera traps enabled me to
test battery life and camera effectiveness in JSWNP’s environment.
Setting cameras
Following previous studies (Karanth and Nichols, 1998; O’Brien, et al., 2003);
Henschel and Ray, 2003), camera traps were used to estimate tiger and leopard
population sizes and densities. It was not possible to set paired cameras 350 cm away
from the main trail, at a height of 45 cm to simultaneously photograph either flank of
an animal that passed through (Karanth, 1995), because most of the camera trap sites
fell on very steep and narrow trails leaving very little space for setting one camera, let
alone two. Most of the camera traps were set on trees growing near the lower side of
the trails and in some case even this provided very limited distance between the trail
and the camera. In such cases I oriented the camera traps at an angle toward or away
from the trail to increase the view. Generally, the shortage of sites to place camera
traps was overcome by building makeshift bridges to reach, and attach camera traps
onto trees growing from below the trail. Despite the constraints on camera trap
placement, these narrow trails had the advantage of channeling animals movements
into the camera’s field of view.
Following previous guidelines for survey design (Karanth and Nichols, 1998,
2002; Karanth, et al., 2002), and taking into account the results from the preliminary
sign survey, 81 camera locations were identified across the study area. Statistical
models assume that all the individuals in the population may be trapped, and therefore
camera traps were spaced to ensure that there were no potential home range gaps.
Tiger ranges tend to be larger than those of sympatric leopards (Karanth and
Chundawat, 2002) thus, spacing camera traps at an appropriate scale for leopards
ensured that tigers were adequately surveyed. I aimed at a trap spacing of 3.6 km, the

107
diameter of the smallest recorded home range size for leopards (10 km2; Smith, 1978).
In practice, the availability of suitable camera sites resulted in a spacing of 3-5 km.
The selected camera sites, were characterized by accumulated sign of tiger or leopard,
and most were situated below ridgelines, near water holes, where trails merged or
places where no alternative routes existed. With 20 working camera traps to cover 81
camera sites, I divided the study area into five trapping zones following park warden
jurisdiction. Camera trapping was conducted for 50 successive days in each zone and
each sampling occasion (Otis, et al., 1978) was a single day (24 hours). Once set, each
camera trap was checked by a person imitating the movements of a leopard to confirm
that the shutter was triggered. CuddebackTM camera traps were checked at least once
every two weeks (the maximum durability of the CuddebackTM alkaline battery
system) and the DeercamsTM were checked every other day (DeercamTM film cameras
were quickly exhausted by livestock and passers-by).
One critical assumption for the closed population estimate is that the
population should be demographically and geographically closed (Otis, et al., 1978;
Rexstad and Burnham, 1991). To meet the closure assumption, past studies (Karanth
and Nichols, 1998, 2000, 2002; Silver, et al., 2004; Chauhan, et al., 2005a,b) restricted
the trapping duration to less than 3 months. I also camera-trapped each zone for 50
days. The number of trap days were calculated for each camera location from the time
of mounting to the time of retrieval, or until the time and date stamped on the final
exposure (O’Brien, et al., 2003). At the end of the trapping period for a particular
zone, cameras were retrieved and images downloaded from the memory cards
(CuddebackTM) or for the DeercamTM, films were sent for processing. Once developed,
the film photos were scanned and digital photos were catalogued before creating a
digital identification for each individual.

108
Analysis
Identification of individual tigers and leopards from photographs
I obtained more photos of left than right flanks, therefore, I used left flanks to
identify individual tigers and leopards based on their distinct natural markings
(Figures 5.2a,b). Using computer software such as Adobe Photoshop, MicroSoft
Powerpoint and MicroSoft Photo Editor, each individual tiger or leopard photograph
was examined for position and shape of stripes and rosettes and other unique
markings, using guidelines developed by Heilbrun, et al. (2003) and later modified by
Jackson et al. (2005).
Program CAPTURE was used for population estimation (Rexstad and
Burnham, 1991). To prepare tiger and leopard data for analysis, I constructed
individual capture histories for the identified tigers and leopards using a standard ‘X-
matrix format’ (Otis, et al., 1978; Nichols, 1992). For an individual animal, the capture
history consisted of a row or vector of 50 entries, denoting the number of sampling
occasions. Each entry was denoted as Xij representing an individual i on occasion j. A
value of “1” was assigned if the ith animal was photographed on the jth occasion and a
“0” was assigned when the animal was not photographed on that occasion (Tables 5.1,
5.2). CAPTURE additionally statistically tests the assumption of population closure
(Karanth, et al., 2004a). I assumed that the sampled population was demographically
closed as tigers and leopards are long-lived animals (Otis, et al., 1978; Sunquist, 1981;
Smith, 1993; Karanth, 1995; Karanth and Nichols, 1998). There was also no known
report of any poaching or deaths of tigers and leopards during the study period.
This program also allows objective testing of several models, which differ in
their assumed sources of variation in capture probability. The program selects the most
appropriate model for a given dataset based on a series of hypothesis tests and the
results of an overall discriminate function test (Rexstad and Burnham, 1991).

109
Figure 5.2a. Example of using stripe patterns from camera traps photos for identification of tigers T01 (top captured at 2800 m) and T05 (bottom at 979 m) in Jigme Singye Wangchuck National Park, Bhutan (2007). Note: the stripe patterns on the shoulder of the tigers; high altitude tigers seem to have fewer stripes on the front shoulders.
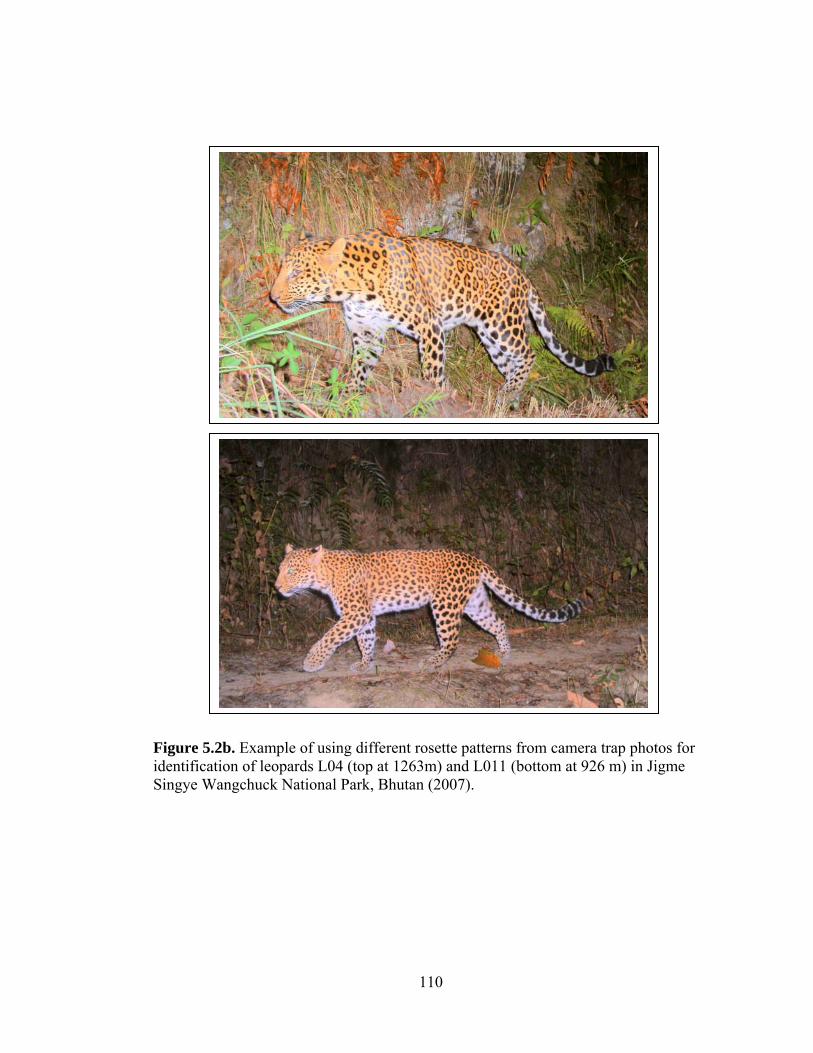
110
Figure 5.2b. Example of using different rosette patterns from camera trap photos for identification of leopards L04 (top at 1263m) and L011 (bottom at 926 m) in Jigme Singye Wangchuck National Park, Bhutan (2007).

111
Tab
le 5
.1. C
aptu
re h
isto
ry o
f pho
togr
aphe
d tig
ers i
n Ji
gme
Sing
ye W
angc
huck
Nat
iona
l Par
k, B
huta
n. 1
= c
aptu
re, 0
= n
o ca
ptur
e (2
007)
.
ID
1 2
3 4
5 6
7 8
9 10
11
12 1
3 14
15
16 1
6 17
18
19 2
0 21
22
23 2
4 25
26
27 2
8 29
30
31
32
33 3
4 35
36
37 3
8 39
40
41 4
2 43
44
45 4
6 47
48
49 5
0 00
01
0 1
0 1
1 0
0 0
0 0
1 0
0 0
0 0
0 0
0 0
0 0
0 0
0 0
0 0
0 0
0
0 0
0 0
0 0
0 0
0 0
0 0
0 0
0 0
0 0
0
0
0002
0
0 0
1 1
0 0
0 0
0 1
0 0
0 0
0 0
0 0
0 0
0 0
0 0
0 0
0 0
0 0
0
0 0
0 0
0 0
0 0
0 0
0 0
0 0
0 0
0 0
0
0003
0
1 0
0 0
0 0
0 0
0 0
0 0
0 0
0 0
0 0
0 0
0 0
0 0
0 0
0 0
0 0
0
0 0
0 0
0 0
0 0
0 0
0 0
0 0
0 0
0 0
0
0004
0
0 0
1 0
0 1
1 0
0 0
0 0
1 0
0 0
0 0
1 0
0 0
0 0
0 0
0 0
0 0
0
0 0
0 0
0 0
0 0
0 0
0 0
0 0
0 0
0 0
0
0005
0
1 0
1 0
0 0
0 0
0 0
0 0
0 0
0 0
0 0
0 0
0 0
0 0
0 0
0 0
0 0
0
0 0
0 0
0 0
0 0
0 0
0 0
1 0
0 0
0 0
0
00
06
0 0
0 0
0 0
0 0
1 0
0 0
0 0
0 0
0 0
0 0
0 0
0 0
0 0
0 0
0 0
0
0 0
0 0
0 0
0 0
0 0
0 0
0 0
0 0
0 0
0
0
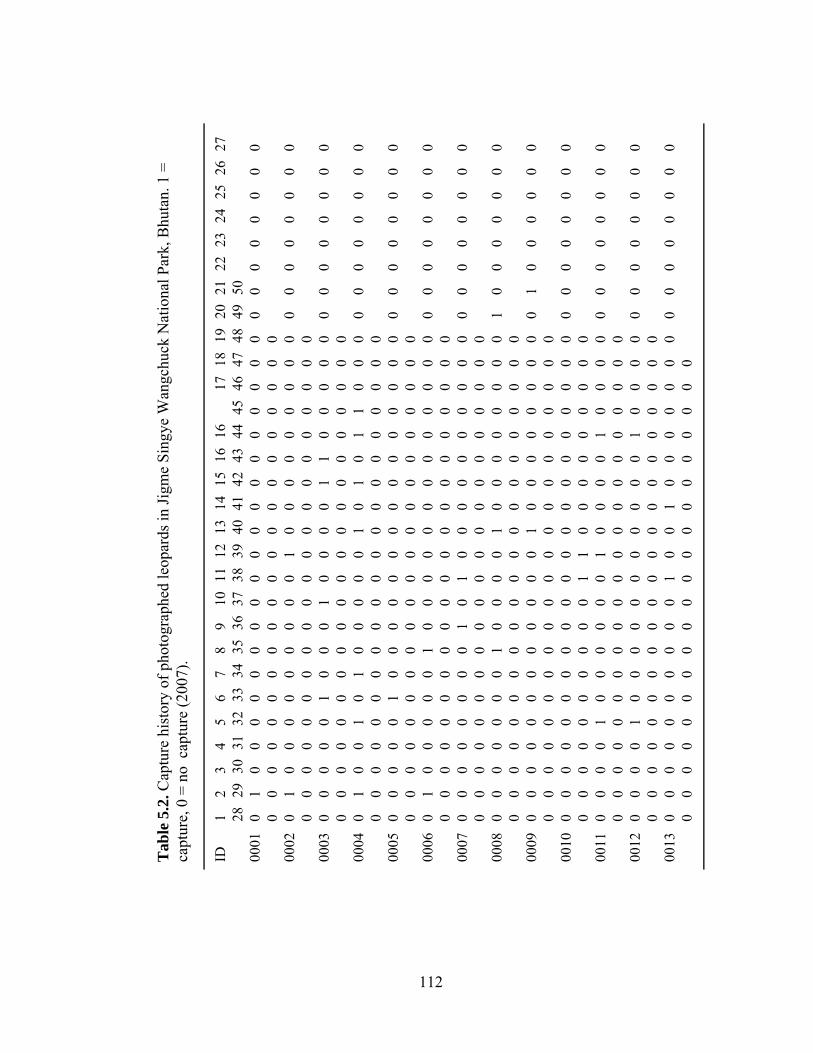
112
Tab
le 5
.2. C
aptu
re h
isto
ry o
f pho
togr
aphe
d le
opar
ds in
Jigm
e Si
ngye
Wan
gchu
ck N
atio
nal P
ark,
Bhu
tan.
1 =
capt
ure,
0 =
no
cap
ture
(200
7).
ID
1 2
3 4
5 6
7 8
9 10
11
12 1
3 14
15
16 1
6
17 1
8 19
20
21 2
2 23
24
25 2
6 27
28 2
9 30
31
32 3
3 34
35
36 3
7 38
39
40 4
1 42
43
44 4
5 46
47
48 4
9 50
00
01
0 1
0 0
0 0
0 0
0 0
0 0
0 0
0 0
0 0
0 0
0 0
0 0
0 0
0 0
0
0
0
0 0
0 0
0 0
0 0
0 0
0 0
0 0
0 0
0 0
0 00
02
0 1
0 0
0 0
0 0
0 0
0 1
0 0
0 0
0 0
0 0
0 0
0 0
0 0
0 0
0
0 0
0 0
0 0
0 0
0 0
0 0
0 0
0 0
0 0
0 0
0 00
03
0 0
0 0
0 1
0 0
0 1
0 0
0 0
1 1
0 0
0 0
0 0
0 0
0 0
0 0
0
0 0
0 0
0 0
0 0
0 0
0 0
0 0
0 0
0 0
0 0
0 00
04
0 1
0 0
1 0
1 0
0 0
0 0
1 0
1 0
1 1
0 0
0 0
0 0
0 0
0 0
0
0 0
0 0
0 0
0 0
0 0
0 0
0 0
0 0
0 0
0 0
0 00
05
0 0
0 0
0 1
0 0
0 0
0 0
0 0
0 0
0 0
0 0
0 0
0 0
0 0
0 0
0
0 0
0 0
0 0
0 0
0 0
0 0
0 0
0 0
0 0
0 0
0 00
06
0 1
0 0
0 0
0 1
0 0
0 0
0 0
0 0
0 0
0 0
0 0
0 0
0 0
0 0
0
0 0
0 0
0 0
0 0
0 0
0 0
0 0
0 0
0 0
0 0
0 00
07
0 0
0 0
0 0
0 0
1 0
1 0
0 0
0 0
0 0
0 0
0 0
0 0
0 0
0 0
0
0 0
0 0
0 0
0 0
0 0
0 0
0 0
0 0
0 0
0 0
0 00
08
0 0
0 0
0 0
0 1
0 0
0 0
1 0
0 0
0 0
0 0
0 1
0 0
0 0
0 0
0
0 0
0 0
0 0
0 0
0 0
0 0
0 0
0 0
0 0
0 0
0 00
09
0 0
0 0
0 0
0 0
0 0
0 0
1 0
0 0
0 0
0 0
0 0
1 0
0 0
0 0
0
0 0
0 0
0 0
0 0
0 0
0 0
0 0
0 0
0 0
0 0
0 00
10
0 0
0 0
0 0
0 0
0 0
0 0
0 0
0 0
0 0
0 0
0 0
0 0
0 0
0 0
0
0 0
0 0
0 0
0 0
0 0
1 1
0 0
0 0
0 0
0 0
0 00
11
0 0
0 0
1 0
0 0
0 0
0 1
0 0
0 0
1 0
0 0
0 0
0 0
0 0
0 0
0
0 0
0 0
0 0
0 0
0 0
0 0
0 0
0 0
0 0
0 0
0 00
12
0 0
0 0
1 0
0 0
0 0
0 0
0 0
0 0
1 0
0 0
0 0
0 0
0 0
0 0
0
0
0
0 0
0 0
0 0
0 0
0 0
0 0
0 0
0 0
0 0
0 00
13
0 0
0 0
0 0
0 0
0 0
1 0
0 1
0 0
0 0
0 0
0 0
0 0
0 0
0 0
0
0 0
0 0
0 0
0 0
0 0
0 0
0 0
0 0
0 0
0 0
113
These different models considered the potential effects of the behavioral
response of tigers and leopards to camera trapping (e.g., trap avoidance), time specific
variation (e.g., weekly weather changes) and heterogeneity between individual
animals (e.g., caused by factors such as territorial status or trap access) on capture
probabilities. Using program CAPTURE, I considered various models based on
methods descried elsewhere (Otis, et al., 1978; Nichols, 1992; Karanth et al., 2004b).
The overall model selection function (Otis et al., 1978) scored potential models
between 0.0 and 1.0 and generated capture statistics for all adequately fitted models.
Models with higher scores were a better fit for the data. A Jackknife estimator (Otis, et
al., 1978), successfully used in earlier photographic capture studies (Karanth, 1995;
Karanth and Nicholas, 1998) was used to generate parameter estimates under the Mh
model which was the best fit model in this study. Every model estimated capture
probabilities (P-hat) and tiger or leopard population size (n, i.e., the number of
individuals in the sampled area, inclusive of animals that were not photo captured at
all).
In order to estimate the density (D) of tigers and leopards in the study area, the
population size (n) was divided by the effective sample area (A(W)). For any two-
camera traps that recorded the same tiger, I estimated their distances apart (d) using
GIS. Half of the mean maximum distance (d/2) was the effective distance around the
sampled camera points, and hence defined the effective sample area (Dice, 1938;
Wilson and Anderson, 1985). This area was then used to generate density estimates
using the equation; D = n/A(W) derived by Karanth and Nichols (1998) and as
mentioned in Henschel and Ray (2003); where D is the resulting tiger or leopard
density, n the population size computed by CAPTURE, and A(W) the resulting area
sampled (including the boundary strip calculated by the formula W = (∑d/m)/2, where
W is the resulting boundary strip width, d the maximum distance moved, and m the

114
number of maximum distances compared). The standard error (SE[D]) was computed
as the square root of the variance of D(Var[D]) (Karanth and Nichols, 2002).
Spatial analysis of potential habitat use by tigers and leopards
A model of the habitat suitability for tigers and leopards was developed using
the resource selection maps for the three prey species (sambar [Cervus unicolor]
muntjac [Munticus muntjac] and wild pig [Sus scrofa]). A simple model was
developed by adding up the weighed estimates of habitat suitability for the three main
prey species. Prey preference of both tigers and leopards was estimated using scat
analysis (see chapter III). After ranking the consumption for the three prey species,
they were multiplied with suitable weights (with higher weights for more frequently
consumed prey) and summed to develop the equation modeling the potential habitat
for the tiger and leopard.
The diet of tiger and leopard consisted mainly of domesticated animals
including cattle, horse, dogs, mules and sheep (see chapter III), therefore the model
also incorporated an additional layer of human settlements apart from the three prey
species. The settlement layer was prepared using the Harmonic Mean Estimator
(HME) assuming that effect of a cluster of settlements will be greater than that of a
single settlement. The HME generated a layer with a smaller value in and around a
cluster of villages, and a larger value away from these.
Results
Capture success
Five zones were each sampled once during the trapping period, between 1
September 2006 and 30 June 2007. The total sampling effort was 4,050 trap days and
yielded 17 tiger photos (14 left flanks and three right flanks) and 48 leopard photos

115
(25 left flanks and 23 right flanks). Overall, a total of 3,301 exposures were obtained
including 1,308 blank photos (Figure 5.3). The cameras also recorded the presence of
many other animals including 76 photos (2.3%) of the Himalayan black bear, 187
(5.7%) photos of ungulates (comprising sambar, muntjac, wild pig, serow
[Capricornis sumatraensis] and goral [Nemorhaedus goral] and 62 (1.9%) of other
animals including smaller cats such as the Asiatic golden cats (Felis temnincki) and
leopard cats (Felis bengalensis) (Figure 5.3). Extensive use of these areas by humans
resulted in 1,283 (38.9%) of photographs of people and 320 (9.7%) of livestock.
During the camera trapping study, an asymptote in the cumulative
number of individuals identified was reached after the 9th day for tigers (Figure 5.4)
and at the 13th day for leopards (Figure 5.5). Using only photos of left flanks, we
identified six individual tigers from 14 left flank photographs (including a lactating
tigress) and 13 individual leopards from 25 left flank photographs. I developed capture
histories based on left flank photographs (Tables 5.1, 5.2).
Figure 5.3. Number of different species photographed (including blank exposures) by camera traps in Jigme Singye Wangchuck National Park, Bhutan (2007).
17 48
1283
320
18776
1308
620
200
400
600
800
1000
1200
1400
Tiger Leopard People Livestock Wild prey Blackbear
Blank others
Different species captured on camera traps (including blank captures)

116
Figure 5.4. Cumulative number of tiger photographs indicating number of individual tigers captured with increasing sampling occasion in Jigme Singye Wangchuck National Park, Bhutan (2007).
Figure 5.5. Cumulative number of leopard photographs indicating number of individual leopards captured with increasing sampling occasion in Jigme Singye Wangchuck National Park, Bhutan (2007).
0
2
4
6
8
10
12
14
16
18
1 2 3 4 5 6 7 8 91011121314151617181920212223242526272829303132333435363738394041424344454647484950
No. of d
No of photos No of individ
0
5
10
15
20
25
30
35
1 3 5 7 9 11 13 15 17 19 21 23 25 27 29 31 33 35 37 39 41 43 45 47 49
No. of day
No of photos No of individuals

117
Tests for population closure and model selection
The goodness of fit test revealed that the Jackknife Model (Mh) was the best fit
for tigers ( 2 = 108.274, df = 49, P = 0.000); and for leopards ( 2 = 84.714, df = 49, P
= 0.001) (Table 5.3). There was no time variation in capture probabilities (Mo vs Mt) (2
= 8.019, df = 49, P = 1.000 for tigers and 2 = 8.254, df = 49, P = 1.000 for leopards).
Model Mh scored the highest in the overall model selection test in CAPTURE for both
the tiger and leopard data followed by the models Mo, Mtb and Mo (Table 5.4).
Statistical tests for population closure in CAPTURE (Otis, et al., 1978; Rexstad and
Burnham, 1991) indicated that the sampled populations of both tigers and leopards
met the assumptions of closure during the 50-day sample periods (Z = -1.556, P =
0.059 for tigers and Z = -2.347, P = 0.053 for leopards) (Table 5.5).
Estimates of capture probabilities and population size
Varying capture probabilities from 0.053 (Mo), 0.040 (Mh) and 0.261 (Mb) for
tigers and 0.046 (Mo), 0.040 (Mh) and 0.130 (Mb) for leopards, were calculated (Table
5.5). I identified 6 tigers and 13 leopards based on photographs of left flanks. Of the
six individual tigers, two were captured once, two were captured thrice, one four times
and one individual five times (the lactating tigress). Among the leopards, two were
captured once, seven were captured twice, two individuals were captured three times,
one individual was captured four times and one captured seven times. The Mh
jackknife model produced an average capture probability (P-hat) of 0.040 with a
corresponding population size (n) of eight tigers (SE = 2.12, 95% CI = 7 – 16
individuals) and 16 leopards (SE = 2.91, 95% CI = 14-27 individuals). Thus, the
overall probability of capturing a tiger and a leopard present in the sampled area
(Mt+1/n) was 75% and 81%, respectively.

118
P
0.00
0
0.03
8
df
48
48
Mb go
odne
ss o
f fit
χ2
92.1
85
78.3
93
P
0.00
0
0.00
1
df
49
49
Mh go
odne
ss o
f fit
χ2
108.
274
84.
714
P
1.00
0
1.00
0
df
49
49
Mo v
s Mt
χ2
8.01
9
8.25
4
P
0.01
5
0.00
7
df
1 1
Mo
vs M
b
χ2
5.93
7
7.30
5
Tab
le 5
.3. R
esul
ts o
f tes
ting
assu
mpt
ions
use
d by
CA
PTU
RE
to se
lect
the
best
fit m
odel
for a
naly
zing
tige
r and
le
opar
d da
ta fr
om Ji
gme
Sing
ye W
angc
huck
Nat
iona
l Par
k, B
huta
n (2
007)
.
Pred
ator
Tige
r
Leop
ard
Mtb
h
0.74
0.69
Mtb
0.89
0.97
Mth
0.40
0.38
Mt
0.00
0.00
Mbh
0.73
0.88
Mb
0.73
0.95
Mh
1.00
1.00
Mo
0.95
0.96
Tige
r
Leop
ard
Tab
le 5
.4. C
ompa
rison
of
mod
el se
lect
ion
crite
ria fr
om p
rogr
am C
APT
UR
E fo
r tig
er a
nd le
opar
d da
ta fr
om Ji
gme
Sing
ye W
angc
huck
Nat
iona
l Par
k, B
huta
n (2
007)
.
Mod
el
Crit
eria
Mo =
Nul
l mod
el, M
h = H
eter
ogen
eity
eff
ects
mod
el; M
b = B
ehav
ior e
ffec
ts m
odel
; Mt =
Tim
e ef
fect
s m
odel
; Mbh
= B
ehav
ior a
nd h
eter
ngen
eity
eff
ects
mod
el; M
th =
tim
e an
d he
tero
gene
ity e
ffec
ts m
odel
; M
tb =
Tim
e an
d be
havi
or e
ffec
ts m
odel
; Mtb
h = ti
me,
beh
avio
r and
het
erog
enei
ty e
ffec
ts m
odel
.
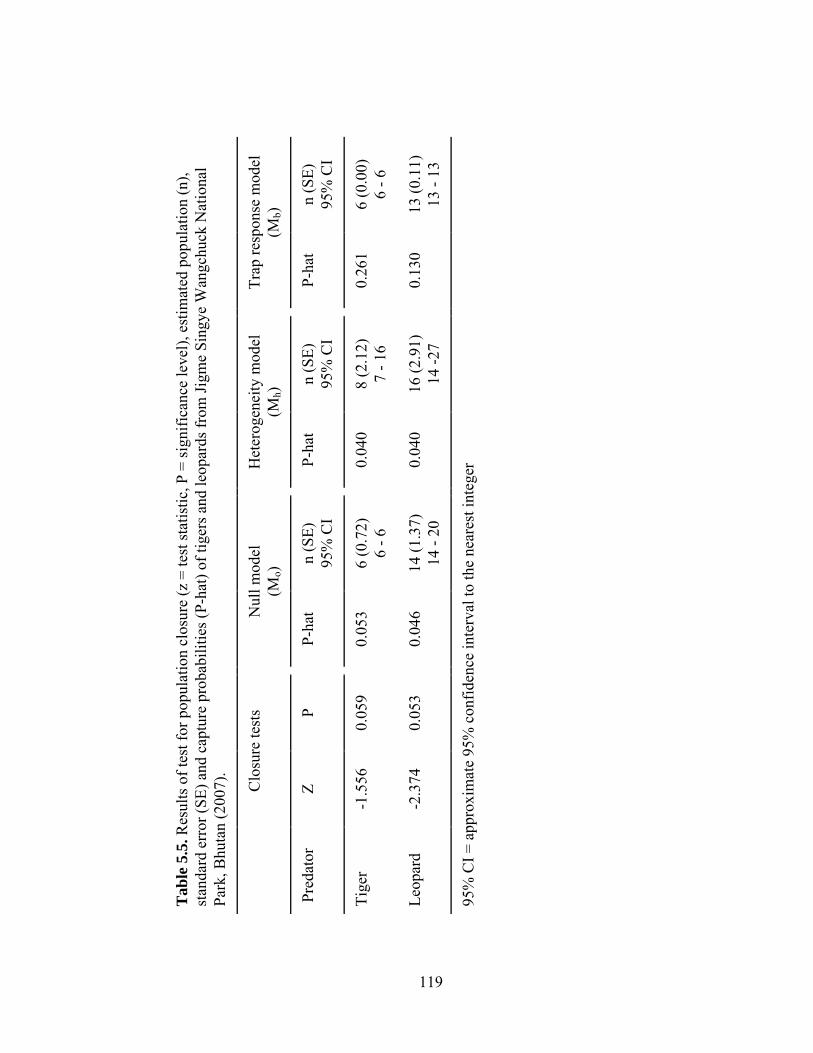
119
n (S
E)
95%
CI
6 (0
.00)
6
- 6
13 (0
.11)
13
- 13
Trap
resp
onse
mod
el
(Mb)
P-ha
t
0.26
1
0.13
0
n (S
E)
95%
CI
8 (2
.12)
7
- 16
16 (2
.91)
14
-27
Het
erog
enei
ty m
odel
(M
h)
P-ha
t
0.04
0
0.04
0
n (S
E)
95%
CI
6 (0
.72)
6
- 6
14 (1
.37)
14
- 20
Nul
l mod
el
(Mo)
P-ha
t
0.05
3
0.04
6
P
0.05
9
0.05
3
Clo
sure
test
s
Z
-1.5
56
-2.3
74
Tab
le 5
.5. R
esul
ts o
f tes
t for
pop
ulat
ion
clos
ure
(z =
test
stat
istic
, P =
sign
ifica
nce
leve
l), e
stim
ated
pop
ulat
ion
(n),
stan
dard
err
or (S
E) a
nd c
aptu
re p
roba
bilit
ies (
P-ha
t) of
tige
rs a
nd le
opar
ds fr
om Ji
gme
Sing
ye W
angc
huck
Nat
iona
l Pa
rk, B
huta
n (2
007)
.
Pre
dato
r
Tige
r
Leop
ard
95%
CI =
app
roxi
mat
e 95
% c
onfid
ence
inte
rval
to th
e ne
ares
t int
eger

120
Estimation of tiger and leopard density
The mean maximum distance moved by tigers and leopards between
successive captures (d) was 10 km giving an outer buffer strip width (W=d/2) of
5 km. I estimated the effective sampled area (A(W)) to be 1546.06 km2 (Table
5.6). The population size (n) was estimated as eight tigers and 16 leopards for the
whole study area (Table 5.6). Tiger and leopard densities were then obtained by
dividing the estimated population size (n) by effectively sampled area (A(W)) and
were estimated to be 0.52 (SE = 2.12) and 1.03 (SE = 2.91) individuals per 100
km2 , respectively.
Table 5.6. Estimated densities (animals km-2) of tigers and leopards in Jigme Singye Wangchuck National Park, Bhutan (2007). Predator Method Effective Sample
area (km2) n Density
(animals 100 km-2) SE
Tiger CAPTURE 1546.06 8 0.52 2.1.
Leopard CAPTURE 1546.06 16 1.03 2.91
n = estimated population size; SE = standard error
Modeling tiger and leopard distribution
The following model equation was developed giving highest weight to
muntjac, followed by sambar and wild pig, respectively, as indicated from the diet
profiles of tiger:
[Tiger suitability model] = ([Muntjac] * 5) + ([Sambar] * 3) +
([Wild pig] * 2) + ([Settlement HM Distance] * 0.005).

121
Compared to tigers, the leopard distribution and suitability area model showed
that leopards were found near human settlements, and their habitats rarely overlapped
with those of tigers (Figures 5.6, 5.7). This is further supported by the fact that
cameras with tiger captures had no leopard captures (except for one black leopard).
Leopards preferred dry coniferous forests with rocky outcrops as compared to dense
broadleaf forests. In comparison with tigers, scat analysis (see chapter III) indicated
that leopards showed a preference for sambar.
[Leopard suitability model] = ([Muntjac] * 2) + ([Sambar] * 4) +
([Wild pig] * 1) + ([Settlement HM Distance] * 0.005).
Figure 5.6. Potential habitats preferred by tigers in Jigme Singye Wangchuck National Park, Bhutan (2007).

122
Figure 5.7. Potential habitats preferred by leopards in Jigme Singye Wangchuck National Park, Bhutan (2007).
Discussion
Camera performance, applicability and sampling effort
Photographic capture-recapture analysis has been used for estimating
individually identifiable cryptic animals such as tigers (Karanth and Nichols, 1998,
2000, 2002, 2004), ocelot (Leopardus pardalis [Trolle and Kerry, 2003]), jaguar
(Silver, et al., 2004; Harmsen, 2006) and leopard (Chauhan, et al., 2005). Following
Karanth’s (1995) work on tigers in Nagarahole National Park in southern India, this
method has been adopted as the most efficient method for estimating tiger populations
in protected areas of India (Karanth and Nichols, 1998, 2000, 2002; Karanth, et al.,
2004a; Jackson, et al., 2006), Nepal (Wegge, et al., 2004) and Indonesia (O’Brien, et
al., 2003). Investing an total effort of 4,050 traps nights in a large effective sampling
area of over 1500 km2 my study not only supports earlier findings (Karanth, 1998;
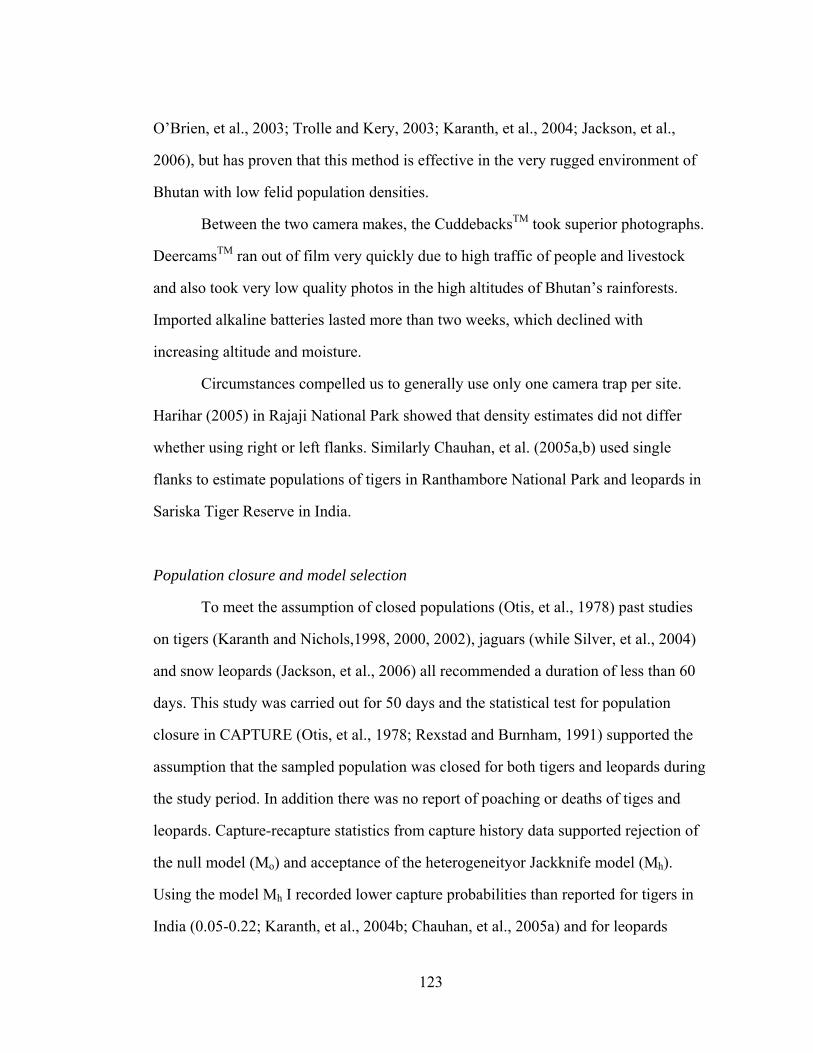
123
O’Brien, et al., 2003; Trolle and Kery, 2003; Karanth, et al., 2004; Jackson, et al.,
2006), but has proven that this method is effective in the very rugged environment of
Bhutan with low felid population densities.
Between the two camera makes, the CuddebacksTM took superior photographs.
DeercamsTM ran out of film very quickly due to high traffic of people and livestock
and also took very low quality photos in the high altitudes of Bhutan’s rainforests.
Imported alkaline batteries lasted more than two weeks, which declined with
increasing altitude and moisture.
Circumstances compelled us to generally use only one camera trap per site.
Harihar (2005) in Rajaji National Park showed that density estimates did not differ
whether using right or left flanks. Similarly Chauhan, et al. (2005a,b) used single
flanks to estimate populations of tigers in Ranthambore National Park and leopards in
Sariska Tiger Reserve in India.
Population closure and model selection
To meet the assumption of closed populations (Otis, et al., 1978) past studies
on tigers (Karanth and Nichols,1998, 2000, 2002), jaguars (while Silver, et al., 2004)
and snow leopards (Jackson, et al., 2006) all recommended a duration of less than 60
days. This study was carried out for 50 days and the statistical test for population
closure in CAPTURE (Otis, et al., 1978; Rexstad and Burnham, 1991) supported the
assumption that the sampled population was closed for both tigers and leopards during
the study period. In addition there was no report of poaching or deaths of tiges and
leopards. Capture-recapture statistics from capture history data supported rejection of
the null model (Mo) and acceptance of the heterogeneityor Jackknife model (Mh).
Using the model Mh I recorded lower capture probabilities than reported for tigers in
India (0.05-0.22; Karanth, et al., 2004b; Chauhan, et al., 2005a) and for leopards
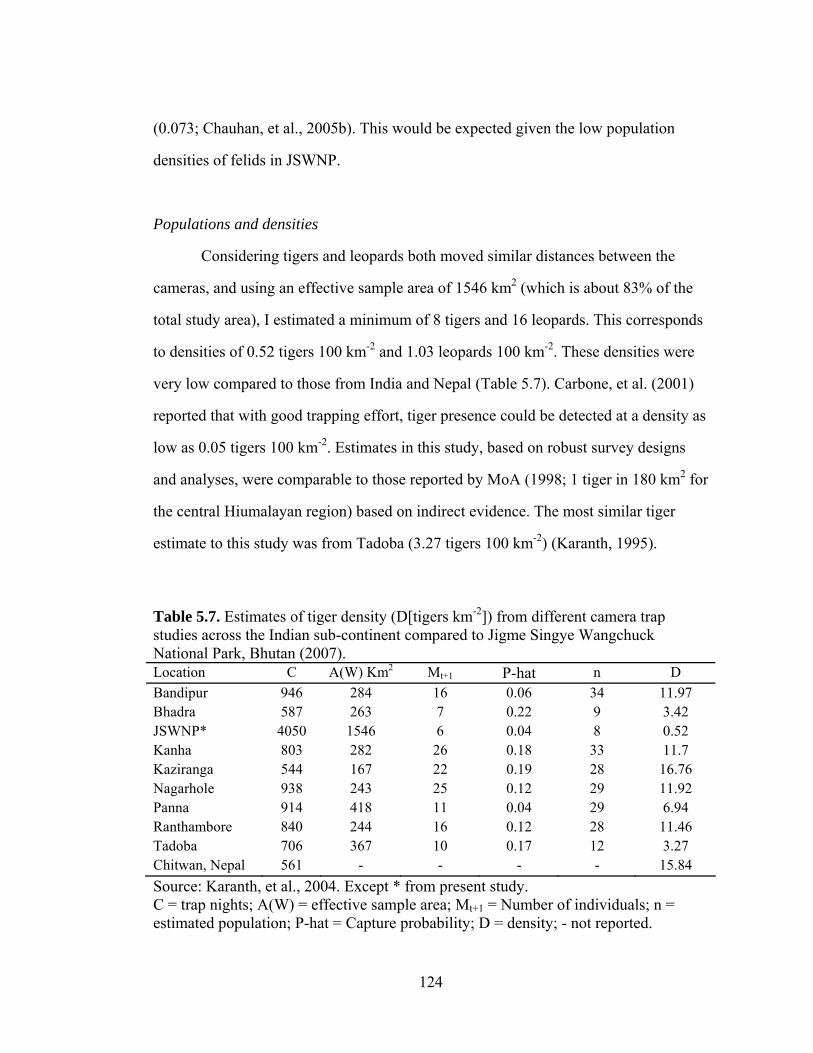
124
(0.073; Chauhan, et al., 2005b). This would be expected given the low population
densities of felids in JSWNP.
Populations and densities
Considering tigers and leopards both moved similar distances between the
cameras, and using an effective sample area of 1546 km2 (which is about 83% of the
total study area), I estimated a minimum of 8 tigers and 16 leopards. This corresponds
to densities of 0.52 tigers 100 km-2 and 1.03 leopards 100 km-2. These densities were
very low compared to those from India and Nepal (Table 5.7). Carbone, et al. (2001)
reported that with good trapping effort, tiger presence could be detected at a density as
low as 0.05 tigers 100 km-2. Estimates in this study, based on robust survey designs
and analyses, were comparable to those reported by MoA (1998; 1 tiger in 180 km2 for
the central Hiumalayan region) based on indirect evidence. The most similar tiger
estimate to this study was from Tadoba (3.27 tigers 100 km-2) (Karanth, 1995). Table 5.7. Estimates of tiger density (D[tigers km-2]) from different camera trap studies across the Indian sub-continent compared to Jigme Singye Wangchuck National Park, Bhutan (2007). Location C A(W) Km2 Mt+1 P-hat n D Bandipur 946 284 16 0.06 34 11.97 Bhadra 587 263 7 0.22 9 3.42 JSWNP* 4050 1546 6 0.04 8 0.52 Kanha 803 282 26 0.18 33 11.7 Kaziranga 544 167 22 0.19 28 16.76 Nagarhole 938 243 25 0.12 29 11.92 Panna 914 418 11 0.04 29 6.94 Ranthambore 840 244 16 0.12 28 11.46 Tadoba 706 367 10 0.17 12 3.27 Chitwan, Nepal 561 - - - - 15.84 Source: Karanth, et al., 2004. Except * from present study. C = trap nights; A(W) = effective sample area; Mt+1 = Number of individuals; n = estimated population; P-hat = Capture probability; D = density; - not reported.

125
Leopard density in JSWNP is very low compared to estimates reported from 0.11 to
23.5 leopards 100 km-2 (Khorozyan, 2003, Chauhan, et al., 2005b). Considering an
ungulate biomass density of 379 kg km-2 (see chapter III), and an annual biomass
cropping rate of 10% by tigers (Karanth, et al., 2004a) together with an average kill
rate of 3000 kg year-1 per tiger (Schaller, 1967; Sunquist, 1981), JSWNP could be
capable of supporting densities of up to 1.2 tiger 100 km-2. Theoretically, the prey
biomass may support lower tiger numbers than estimated, as tigers share the available
prey biomass with other predators such as leopards and dholes. In reality, the
estimated density may be true, as domestic livestock supplements prey biomass to a
large extent (chapter III).
Spatial analysis of potential habitat use by tigers and leopards
Habitat loss is strongly influenced by agriculture, livestock grazing and
resource extraction activities that increase with human presence. Wildlife are more
vulnerable to the effects of habitat loss at habitat edges (O’ Brian, et al., 2003). An
increase in edges and habitat loss is likely to reduce tiger and leopard numbers.
The resource selection maps indicated little overlap in tiger and leopard
territories. There was a significant direct correlation between tiger captures and
increasing distance from settlements whereas leopards were found nearer to
settlements. Wangchuk (2003) has reported similar results based on sign surveys.
Tigers and leopards were spatially separated, with tigers preferring broadleaved forests
at lower elevations, and fir (Abies spp) and hemlock (Tsuga spp) with bamboo
(Calamus spp) thickets at higher elevations. Leopards were mostly present in dry chir
pine (Pinus roxburghi) forests along the edge of settlements. From field observations,
the broadleaf, fir and hemlock forests, with more access to water tended to support
larger ungulate populations, thus these habitats were more preferred for predators.

126
Tigers may have displaced leopards to more marginal areas nearer to the human
settlements. It was also evident from field observations that some of the tigers used
habitats had very little or no prey activity.
Conservation impacts
A photographic capture-recapture survey has been successfully used to
estimate tiger and leopard populations in Bhutan’s high altitude and mountainous
terrain. With minor adaptations depending on specific localities, this study should
provide valuable information to efficiently conduct similar surveys in other parts of
Bhutan. I invested extensively in developing the optimal camera-trapping protocol for
Bhutan, which can serve as a long-term monitoring program for tigers and leopards in
Bhutan.
It is also evident that Bhutan certainly provides large and contiguous habitat
for tigers and leopards. It must also be remembered that these animals exist at very
low densities and hence, are vulnerable to a reduction in their populations. This
vulnerability is further exacerbated by low prey density and inter-carnivore
competition. Conservation efforts must seriously focus on protection of habitat,
increasing prey abumdamce and vigilant anti-poaching programs. A simultaneous
effort to discourage farmers from unattended grazing of livestock in the deep forests
and the possible reduction of livestock populations must be advocated to reduce
conflicts and threats to tigers and leopards. Compensation for livestock kills by tigers
and leopards must also be supported as livestock make up a large proportion of felid
diets. During fieldwork, Himalayan black bears were found scavenging at almost all
the tiger and leopard kills. It will be both interesting and valuable to investigate how
bear caching of tiger kills may affect the frequency of kills made by tigers and
leopards and the consequent impact on farmers.
127
REFERENCES Carbone, C., Christie, S., Conforti, K., Coulson, T., Franklin, N., Ginsberg, J.R., Griffiths, M., Holden, J., Kawanishi, K., Kinnaird, M., Laidlaw, R., Lyam, A., Macdonald, D.W., Martye, D., McDougal, C., Nath, L., B’Brien, T., Seidensticker, J., Chauhan, D.S., Harihar, A., Goyal, S.P., Qureshi, Q., Lal, P., Mathur, V.B. 2005a. Estimating tiger population using camera traps in Ranthambore National Park. Wildlife Institute of India. Dehra Dun, India. Chauhan, D.S., Harihar, A., Goyal, S.P., Qureshi, Q., Lal, P., Mathur, V.B. 2005b. Estimating leopard population using camera traps in Sariska Tiger Reserve. Wildlife Institute of India. Dehra Dun, India. Choudary, S.R. 1970. Let us count our tiger. Cheetal. 14: 41-51. Choudary, S.R. 1971. The tiger tracer. Cheetal. 13: 27-31. Dice, L.R. 1938. Some census of methods for mammals. Journal of Wildlife Management. 2: 119-130. Dinersten, E., Loucks, C., Heydlauff, A., Wikramanayake, E., Bryja, G., Forrest, J., Ginsberg, J., Klenzendorf, S., Leimgruber, P., O’Brien, T., Sanderson, E., Harihar, A. 2005. Population, food habits and prey densities of tiger in Chilla Range, Rajaji National Park, Uttranchal, India. M.S. Thesis. Saurashtra University, Gujarat, India. Harmsen, B.J. 2006. The use of camera traps for estimating abundance and studying the ecology of jaguars (Panthera onca). Ph.D. dissertation, University of Southampton, UK. Henschel, P. and Ray, J.C. 2003. Leopards in African rainforests: survey and monitoring techniques. Wildlife Conservation Society, Global Carnivore Program. Bronx NY, Ny. Jackson, R.M., Roe, J.D., Wangchuk, R., Hunter, D.O. 2006. Estimating snow leopard population abundance using photography and capture-recapture techniques. Wildlife Society Bulletin. 34: 772-781. Karanth, K.U. 1995. Estimating tiger (Panther tigris) populations from cameras trap data using capture-recapture models. Biological Conservation. 71: 333-338. Karanth, K.U. and Nichols, J.D. 1998. Estimation of tiger densities in India using photographic captures and recaptures. Ecology. 79:2852-2862.

128
Karanth, K.U. and Nichols, J.D. 2000. Ecological status and conservation of tigers in India. Center for Wildlife Studies, Bangalore, India. Karanth, K.U. and Nichols, J.D. 2002. Monitoring tigers and their preys: a manual for researchers, managers, and conservationists in Tropical Asia. Center for Wildlife Studies, Bangalore, India. Karanth, K.U., Bhargav, P., Kumar, S. 2001. Karnataka Tiger Conservation Project. Wildlife Conservation Society, International Programs, Bronx, NY, Ny. Karanth, K. U. and Chundawat, R.S. 2002. Ecology of tigers: implications for population monitoring. In monitoring tigers and their prey: A manual for researchers, managers and conservationists in tropical Asia. pp. 9-21. Karanth, K.U. and Nichols, J.D. (eds). Center for Wildlife Studies, Bangalore, India. Karanth, K.U., Nichols, J.D., Kumar, N.S., Link, W.A., Hines, J.E. 2004a. Tiger and their prey: predicting carnivore densities from prey abundance. Proceedings of the Natural Academy of Sciences. 101: 4854-4858. Karanth, K.U., Chundawat, R.S., Nichols, J.D., Kumar, N.S. 2004b. Estimation of tiger densities in the tropical dry forest of Panna, central India, using photographic capture-recapture sampling. Animal Conservation. 7: 285-290. Khorozyang, I. and Malkhasyangg, A. 2002. Ecology of leopards (Panthera pardus) in Khosrov Reserve, Armenia: implications for conservation. Scientific Reports 6, Societa Zoologica (La Torbiera), Italy. MoA. 1998. Tiger conservation strategy for the kingdom of Bhutan. Nature Conservation Division, Thimphu, Bhutan. Mafia, L., Cuellar, E., Noses, A. 2004. One thousand jaguars (Panthera onca) in Bolivia’s Chaco? Camera trapping in the Kaa-Iya National Park. Journal of Zoology. 262: 295-304. Nichols, J.D. 1992. Capture-recapture models: using marked animals to study population dynamics. Bioscience. 42: 94-102. Nowell K. and Jackson P. 1996. Status survey and conservation action plan: wild cats. IUCN, Gland, Switerland. O’Brien, T.G. Kinnaird, M.,Wibisono, H.T. 2003. Crouching tigers, hidden prey: Sumatran tiger and prey populations in a tropical forest landscape. Animal Conservation 6:131-139. Otis, D.L. Burnham, K.P. White, G.C., Anderson, D.R. 1978. Statistical inference from capture data on closed animal populations. Wildlife Monograph. 62:1-135.

129
RGoB. 2002. Biodiversity action plan. Ministry of Agriculture, Thimphu, Bhutan. Rexstad, E. and Burnham, K.P. 1991. User’s guide for interactive program CAPTURE. Colorado State University, Fort Collins, CO. Sawakar, V.B. 1987. Some more on tiger tracks. Cheetal. 28: 1-8. Schaller, G.B. 1967. The deer and the tiger. University of Chicago Press, Chicago, IL.
Sharma, S. 2001. Evaluation of pugmark census technique. MS. thesis, Saurashtra University, Gujarat and Wildlife Institute of India, Dehra Dun, Uttaranchal, India. Silver, S.C., Ostro, L.E., Marsh, L.K., Maffei, L., Noss, A.J., Kelly, M.J., Wallace, R.B., Gomez, H., Ayala, G. 2004. The use of camera traps for estimating jagur (Panthera onca) abundance and density using capture/recapture analysis. Oryx. 38: 148-154. Smith, J.L.D. 1993. The role of dispersal in structuring the Chitwan population. Behavior. 124: 165-195. Smith, R. M. 1978. Movement patterns and feeding behavior of the leopard in the Rhodes Matopos National Park, Rhodesia. Carnivore. 1: 58-68. Soisalo, M.K. and Cavalcanti, S.M.C. 2006. Estimating the density of a jaguar population in the Brazilian Pantanal using camera-traps and capture-recapture sampling in combination with GPS radio-telemetry. Biological Conservation. 129: 487 – 496. Sunquist, M.E. 1981. Social organization of tigers (Panthera tigris) in Royal Chitwan National Park, Nepal, Smithsonian Contributions to Zoology. 336: 1-98. Trolle, M. and Kerry, M. 2003. Estimation of ocelot density in the pantanal using capture-recapture analysis of camera-trapping data. Journal of Mammalogy. 84: 607-614. Wallace, R.B., Gomez, H., Ayala, G., Espinoza, F. 2003. Camera trapping capture frequencies for jaguar (Panthera onca) in the Tuichi Valley, Boliva. Mastozoologia Neotropical. 10: 133 – 139. Wang, S. W. 2001. Conservation management plan for the Black Mountains National Park. Ministry of Agriculture, Thimphu, Bhutan. Wang, S.W. 2004. The impacts of wildlife damage and conservation policies on farmer attitudes in Jigme Singye Wangchuck National Park, Bhutan. M.S. thesis, Cornell University. Ithaca, NY.

130
Wang, S.W. and Macdonald, D.W. 2006. Livestock predation by carnivores in Jigme Singye Wangchuck National Park, Bhutan. Biological Conservation.129: 558-565. Wang, S.W., Lassoie, J.P., Curtis, P. 2006a. Farmer attitudes towards conservation in Jigme Singye Wangchuck National Park, Bhutan. Environmental Conservation. 33: 1-9. Wang, S.W., Curtis, P., Lassoie, J.P. 2006b. Farmer perceptions of crop damage by wildlife in Jigme Singye Wangchuck National Park, Bhutan. Wildlife Society Bulletin. 34: 359-365. Wangchuk, T. 2003. Predator-prey dynamics: the role of predators in the control of problem species. Journal of Bhutan Studies. 2003: 68-89. Wegge, P., Pokheral, C., Jnawali, S.R. 2004. Effects of trapping effort and trap shyness on estimates of tiger abundance from camera trap studies. Animal Conservation. 7: 251-256. White, G.C. 1996. NOREMARK: population estimation from mark-resighting surveys, Wildlife Society Bulletin. 24: 50-52. White, G.C. Anderson, D.R. Burnham, K.P. and Otis, D.L. 1982. Capture-recapture and removal methods for sampling closed populations. Los Almos National Laboratory, Publication LA-8787-NERP, Los Almos, NM. Wilson, K.R. and Anderson, D.R. 1985. Evaluation of two density estimators of small mammal population size. Journal of Mammalogy. 66: 13-21.

131
CHAPTER VI
CREATING A WIN-WIN SITUATION: INTEGRATING THE SOCIOLOGICAL AND ECOLOGICAL UNDERSTANDING TO REDUCE
HUMAN-CARNIVORE CONFLICTS-A SYNTHESIS
Introduction
The drastic decrease in the populations of large carnivores such as tigers and
leopards, has attracted global attention from both the wildlife scientists and
governments (Weber and Rabinowitz, 1996). Despite the critical role large carnivores
play in maintaining healthy ecosystems and the social and religious values attached to
them by societies, their habitats have been drastically reduced thereby threatening
their survival (Karanth and Stith, 1999; Sunquist, et al., 1999). Human-wildlife
conflicts are at the heart of the present plight of large carnivores (Dinerstein, et al.
2006). Because of competitive demands for shared natural resources, large carnivores
like the tigers often enter into conflict with humans through direct attacks on people
and/or their livestock and often are persecuted in retaliation (Wang, 2004). Human
wildlife conflicts have already driven three tiger subspecies to extinction (Bali tiger
[P. tigris balica], Caspian tiger [P.t. virgata], Javan tiger [P.t. sondaica]), endangered
other tiger populations (Panthera tigris), and continues to drastically reduce the
numbers of many other felids (Sunquist, et al., 1999). If these large carnivores are to
roam freely in nature and help maintain healthy ecosystems, a way must be sought for
a sustainable solutions to these daunting human-wildlife conflicts.
However, my quest for answers to the complexities of human-wildlife conflicts
has been hindered by the paucity of scientific investigation addressing such issues in a
collaborative approach. Most scientific investigations and discussions in the past were
polarized either towards humans or wildlife protection. My attempts were further
complicated by the fact that even if enough scientific information becomes available,

132
the solutions would still be influenced by the specific context, and the intricate
mixture of rich ethics and values. The science of human-wildlife conflict craves for a
multidisciplinary approach developed and based on scientific knowledge, generated
through transparent collaboration between social and wildlife scientists.
My dissertation is in response to this knowledge gap. Focusing on the
agropastoralist, tigers and their prey in Bhutan’s Jigme Singye Wangchuck National
Park, I initiated this unprecedented research effort to understand the traditional
pastoral system and the ecology and behavior of large predators and prey, to better
guide conservation management and policy. My approach to developing an integrative
understanding of human wildlife conflicts was to investigate the issues, impacts and
dynamics that underlie human activities, livestock grazing systems, the extent and
magnitude of losses, wild prey populations, feeding habits of predators and tiger and
leopard abundance. Specifically, the research addressed the question: What factors
regulate predator populations and why is livestock predation being reported at an
increasing rate if there are many deer, pigs and predators as claimed by farmers and
the public? In this final chapter, I synthesize the important findings of the research,
establish coherence between the chapters and discuss the lessons learned from this
dissertation in a broader scientific and conservation context. I also describe
conservation impacts and possible options for reducing carnivore-human conflicts in a
landscape dominated by humans. I conclude with limitations of the present research
and recommendations for future research.
Findings
Recent reported increases in livestock predation by tigers, leopards and dholes
have quickly elevated conservation of these carnivores into political arenas. A large
majority of the Bhutanese population, backed by a few politicians, have condemned

133
such negative impacts and criticized the country’s conservation policy (Wang, 2004).
In chapter II, I described traditional livestock-herding practices used in the Park,
quantified the perceived economic losses to local communities, and documented their
retaliatory actions. I found that pastoralists suffered heavy livestock losses to tigers,
leopards and dholes. For farmers with livestock losses, the impact equated to more
than two-thirds of their annual cash income (US$ 250). A combination of lax herding,
poor guarding practices, herding in far pastures nearer to predator hotspots, lack of
favorable cover and poor habitat conditions contributed to high depredation rates.
Conservation success (apparently leading to a perceived increase in predator
populations), and the imposition of strict restrictions on farmers’ use of resources by
the Forest and Nature Conservation Act of 1995, may have exacerbated conflicts.
Chapter II established the social context with insights into the magnitude and
extent of livestock losses, and factors that make livestock vulnerable to predation. In
chapter III, I examined the diet profiles of tiger, leopard and dholes and investigated
what percentage of the predator’s diet was made up of domestic animals. The diet
study confirmed farmer claims as there was an overwhelming representation of cattle
biomass in tiger and leopard diets. There was higher diet overlap between tigers and
leopards as compared with dholes. By investigating natural prey selection, I showed
that given equal chance, predators did not naturally select for domestic stock.
In chapters IV and V, I estimated populations and densities of prey and
predators, as well as assesed their distribution in relation to various environmental and
anthropogenic factors. I found that both predator and prey existed in relatively low
numbers in JSWNP, compared to other sites in South Asia. Tigers used areas further
away from human settlements, while leopards and ungulates were mostly found near
human settlements (Figure 6.1). Consequently, large numbers of ungulates were not as
available to tigers, as they are spatially separated. Leopard and tiger territories rarely

134
overlapped. Population data also provided valuable information regarding not only the
numbers and densities of animals, but also critical demographic and behavioral
information, which is vital for assessing long-term conservation measures.
Current situation Desired future situation Core of the Park Core of the Park
Tigers
Tigers More ungulates Livestock Fewer livestock Herders Fewer herders
Few ungulates Leopards
Ungulates Few livestock
Herders Leopards More ungulates Few leopards Livestock Fewer ungulates Herders More livestock Herders Human settlements Human settlement Figure 6.1. Integreated human wildlife conflict management strategy to slowly change the spatial distribution of predators, prey, livestock and herders from the current situation (simplified co-existence) to the desired future situation (more robust co-existence).
Conservation management implications: towards a harmonious coexistence.
Large mammalian predators like tigers and leopards have been known to
respond to prey biomass and densities (Carbone and Gittleman, 2002; Karanth, et al.,
2004). This is evident in Bhutan where the densities of prey and predators are both
Human wildlife conflicts Management strategy
Incr
easi
ng d
ista
nce
from
hum
an se
ttlem
ent
Incr
easi
ng d
ista
nce
from
hum
an se
ttlem
ent

135
very low. Using the relationship developed by Karanth, et al. (2004), a minimum of
1.2 tigers 100 km-2 can be supported by the ungulate biomass reported here. However,
if I consider other predators such as leopards and dholes, which also share this
ungulate biomass, then the population of tigers supported will be much lower. In
addition, most of these ungulates are near the human settlements and not easily
available to tigers (Figure 6.1). Had it not been for livestock supplementing tiger diets,
tigers likely would be forced to follow ungulates into the villages and perhaps enter
into more serious conflicts with farmers and their families. Given this, we must
acknowledge the important role that livestock are playing in supplementing predator
diets, thereby maintaining a viable predator population. Livestock density in the study
area was about six animals km-2 with a total biomass contribution twice that of all the
three wild ungulates at 615 kg km-2. On the other hand, the muntjac and wild pigs that
were found near the settlements and agricultural fields, most probably were there
because they are being out-competed by livestock in deep forests.
Bhutan certainly provides large and contiguous habitats for tigers and leopards,
but it must be remembered that these animals exist at very low densities, and hence are
vulnerable to any reduction in their populations. Conservation efforts must seriously
focus on protecting habitats, prey species and vigilant anti-poaching programs. A
simultaneous effort to discourage farmers from grazing livestock in the deep forests
unattended and to possibly reduce livestock populations, must be advocated to
decrease conflicts and threats to tigers and leopards. Compensation for livestock kills
by tigers and leopards must also be supported as livestock do contribute to a large
proportion of predator diets. In the long term, a community-based insurance scheme
must replace cash compensation. Tigers use undisturbed habitats, which in Bhutan are
found in the mountains (Figure 6.1). On the contrary, wild prey species are most
abundant in the valleys nearer to settlements. There is an urgent need to determine if
136
wild ungulates are attracted to crops because they are being out-competed by livestock
in the forest, and if this is responsible for drawing predators into conflicts with
farmers. Another question that deserves further research is the role that competition
between carnivores plays in exacerbating predation on livestock. For instance, during
fieldwork, Himalayan black bears were found scavenging at almost all the tiger and
leopard kills. Are Bhutan bears playing the role of hyenas in Africa? If so, how are
they affecting the frequency of kills made by tigers and leopards and the consequent
impacts on farmers?
I suggest that government managers, researchers and farmers work together to
devise a highly integrated conflict management strategy that accommodates the needs
of both wildlife and farmers (Figure 6.1). Restoration of an adequate natural prey base,
together with a program of compensation for livestock lost, may minimize conflicts by
increasing farmers’ tolerance of wildlife damage (Michelle and Smirnov, 1999). Based
on the evidence, this management strategy should include methods to improve
livestock management, monitor abundance of prey species, assess the ecological
impacts of over-grazing and test the feasibility of a sustainable compensation scheme.
In the short-term, a ban on transient grazers entering the Park, and on grazing in
predator hotspots, should reduce encounter rates between livestock and predators.
Alternative benefits from community-based eco-tourism, livestock intensification and
sustainable harvesting of non-timber forest products should be explored as such
benefits could generate more favorable attitudes towards conservation (Conforti and
de Azevedo, 2003). In the long run, the earlier mentioned compensation scheme
should be tied into securing funds from community generated sources slowly
graduating into self-sustained insurance programs. Emphasis should be on involving
farmers in managing human–wildlife conflicts and developing ways of enabling them
to benefit from the existence of the Park.

137
REFERENCES Carbone, C. and Gittleman, J.L. 2002. A common rule for scaling of carnivore density. Science. 295: 2273-2276. Dinersten, E., Loucks, C., Heydlauff, A., Wikramanayake, E., Bryja, G., Forrest, J., Ginsberg, J., Klenzendorf, S., Leimgruber, P., O’Brien, T., Sanderson, E., Seidensticker, J., Songar, M. 2006. Setting Priorities for the conservation and recovery of wild tigers: 2005-2015. User’s guide. WWF, WCS, Smithsonian and NFEF-STF, Washington, D.C. Conforti, V.A. and de Azevedo, F.C.C. 2003. Local perceptions of jagurs (Panthera onca) and pumas (Puma concolor) in the Iguacu National Park area, south Brazil. Biological Conservation. 111: 215-221. Karanth, K.U. and Stith, B.M. (1999). Prey depletion as a critical determinant of tiger densities. In Riding the tiger: tiger conservation in human dominated landscapes. Seidensticker, J., Christie, S. and Jackson, P. (eds.). Cambridge University Press, Cambridge, UK. Karanth, K.U., Chundawat, R.S., Nichols, J.D., Kumar, N.S. 2004. Estimation of tiger densities in the tropical dry forest of Panna, Central India, using photographic capture-recapture sampling. Animal Conservation. 7: 285-290. Michelle, D.G. and Smirnov, E.N. 1999. People and tigers in the Russian Far East: searching for the ‘co-existence recipe’. In Riding the Tiger-Tiger Conservation Efforts in Human-Dominated Landscapes. pp. 273-295. Seidensticker, J., Christie, S., Jackson, P. (eds.). Cambridge University Press, Cambridge, UK.
Sunquist, M.E., Karanth, K.U., Sunquist, F. 1999. Ecology, behavior and resilience of the tiger and its conservation needs. In Riding the tiger: tiger conservation in human-dominated landscapes. Seidensticker, J., Christie, S. and Jackson, P. (eds.). Cambridge University Press, Cambridge, UK. Wang, S.W. 2004. The impacts of wildlife damage and conservation policies on farmer attitudes in Jigme Singye Wangchuck National Park, Bhutan. M.S. thesis, Cornell University. Ithaca, NY. Weber, W. and Rabinowitz, A. 1996. A global perspective on large carnivore conservation. Conservation Biology. 10: 1046-1055.