Farmers’ Seed Sources and Seed Quality:
39
This article was downloaded by: [Zewdie Bishaw] On: 13 September 2012, At: 09:56 Publisher: Taylor & Francis Informa Ltd Registered in England and Wales Registered Number: 1072954 Registered office: Mortimer House, 37-41 Mortimer Street, London W1T 3JH, UK Journal of Crop Improvement Publication details, including instructions for authors and subscription information: http://www.tandfonline.com/loi/wcim20 Farmers' Seed Sources and Seed Quality: 1. Physical and Physiological Quality Zewdie Bishaw a , P. C. Struik b & A. J. G. Van Gastel a c a Seed Section, International Center for Agricultural Research in the Dry Areas (ICARDA), Aleppo, Syria b Center for Crop Systems Analysis, Wageningen University and Research Center, Wageningen, The Netherlands c Freelance Consultant, Terherne, The Netherlands To cite this article: Zewdie Bishaw, P. C. Struik & A. J. G. Van Gastel (2012): Farmers' Seed Sources and Seed Quality: 1. Physical and Physiological Quality, Journal of Crop Improvement, 26:5, 655-692 To link to this article: http://dx.doi.org/10.1080/15427528.2012.670695 PLEASE SCROLL DOWN FOR ARTICLE Full terms and conditions of use: http://www.tandfonline.com/page/terms-and-conditions This article may be used for research, teaching, and private study purposes. Any substantial or systematic reproduction, redistribution, reselling, loan, sub-licensing, systematic supply, or distribution in any form to anyone is expressly forbidden. The publisher does not give any warranty express or implied or make any representation that the contents will be complete or accurate or up to date. The accuracy of any instructions, formulae, and drug doses should be independently verified with primary sources. The publisher shall not be liable for any loss, actions, claims, proceedings, demand, or costs or damages whatsoever or howsoever caused arising directly or indirectly in connection with or arising out of the use of this material.
Transcript of Farmers’ Seed Sources and Seed Quality:

This article was downloaded by: [Zewdie Bishaw]On: 13 September 2012, At: 09:56Publisher: Taylor & FrancisInforma Ltd Registered in England and Wales Registered Number: 1072954 Registeredoffice: Mortimer House, 37-41 Mortimer Street, London W1T 3JH, UK
Journal of Crop ImprovementPublication details, including instructions for authors andsubscription information:http://www.tandfonline.com/loi/wcim20
Farmers' Seed Sources and Seed Quality:1. Physical and Physiological QualityZewdie Bishaw a , P. C. Struik b & A. J. G. Van Gastel a ca Seed Section, International Center for Agricultural Research in theDry Areas (ICARDA), Aleppo, Syriab Center for Crop Systems Analysis, Wageningen University andResearch Center, Wageningen, The Netherlandsc Freelance Consultant, Terherne, The Netherlands
To cite this article: Zewdie Bishaw, P. C. Struik & A. J. G. Van Gastel (2012): Farmers' Seed Sourcesand Seed Quality: 1. Physical and Physiological Quality, Journal of Crop Improvement, 26:5, 655-692
To link to this article: http://dx.doi.org/10.1080/15427528.2012.670695
PLEASE SCROLL DOWN FOR ARTICLE
Full terms and conditions of use: http://www.tandfonline.com/page/terms-and-conditions
This article may be used for research, teaching, and private study purposes. Anysubstantial or systematic reproduction, redistribution, reselling, loan, sub-licensing,systematic supply, or distribution in any form to anyone is expressly forbidden.
The publisher does not give any warranty express or implied or make any representationthat the contents will be complete or accurate or up to date. The accuracy of anyinstructions, formulae, and drug doses should be independently verified with primarysources. The publisher shall not be liable for any loss, actions, claims, proceedings,demand, or costs or damages whatsoever or howsoever caused arising directly orindirectly in connection with or arising out of the use of this material.

Journal of Crop Improvement, 26:655–692, 2012Copyright © Taylor & Francis Group, LLCISSN: 1542-7528 print/1542-7536 onlineDOI: 10.1080/15427528.2012.670695
Farmers’ Seed Sources and Seed Quality:1. Physical and Physiological Quality
ZEWDIE BISHAW1, P. C. STRUIK2, and A. J. G. VAN GASTEL1,3
1Seed Section, International Center for Agricultural Research in the Dry Areas(ICARDA), Aleppo, Syria
2Center for Crop Systems Analysis, Wageningen University and Research Center,Wageningen, The Netherlands
3Freelance Consultant, Terherne, The Netherlands
Understanding farmers’ seed quality problem will enable farmers todevise strategies to improve quality at the farm level. The study wasconducted to assess the quality of seed used by farmers from differ-ent sources and regions. A total of 304 wheat (Trticium aestivum L.and T. durum L.) seed samples from Ethiopia and 206 wheat and200 barley (Hordeum vulgare L.) seed samples from Syria werecollected from major wheat and barley growing regions to investi-gate the quality of seed obtained from various sources and regionsand planted by farmers. A 1 kg sample was drawn from seed lotsintended for planting from each farmer. A detailed questionnairewas used to collect information on seed selection and manage-ment practices and farmers’ perception of seed quality. The physicaland physiological quality of seed samples was analyzed using stan-dard testing procedures. In Ethiopia, the mean physical purity andgermination of wheat seed was 98.92% and 96%, respectively, andthe majority of samples (93%; n = 303) met the minimum purityand germination standards for certified seed 2. Certified seed fromthe formal sector seed had the highest analytical purity (99.4%), butthis was not significantly different from other seed sources, such asneighbors/other farmers (98.8%), local traders/markets (98.6%),or own saved seed (98.9%). However, the mean germination forcertified seed (96%) showed a weak significant difference from seedobtained from other sources (94%). In Syria, mean physical purity
Received 3 February 2012; accepted 23 February 2012.Address correspondence to Zewdie Bishaw at Seed Section, International Center for
Agricultural Research in the Dry Areas (ICARDA), P.O. Box 5466, Aleppo, Syria. E-mail:[email protected]
655
Dow
nloa
ded
by [
Zew
die
Bis
haw
] at
09:
56 1
3 Se
ptem
ber
2012

656 Z. Bishaw et al.
and germination for wheat was 97.6% and 88%, respectively, andfor barley 95.5% and 86%, respectively. Seed quality was betterin wheat than in barley. The majority of wheat seed samples, i.e.,70.4% (n = 206) for physical purity and 78.2% for germination,met the minimum seed quality requirements of certified seed 2.In barley, only 10% of samples for physical purity and 72% ofsamples for germination met this standard. Contamination withweed seeds appeared to be the major constraint for seed samplesnot meeting the standard of formal sector. There was no significantdifference in physical and physiological quality of wheat seed sam-ples obtained from different sources. In barley, germination fromdifferent sources was significantly different. Highly significant dif-ferences in seed quality were observed for seed samples collectedfrom different regions and districts for wheat and barley crops inboth countries. Vigor indices showed significant differences amongwheat and barley seed samples from different regions and districts,but not among different sources. Simple correlation coefficientsshowed significant relationships among vigor tests. The standardgermination, speed of germination, and seedling root length werewell correlated with field emergence in wheat and barley in bothcountries. Farmers used local seed management practices, such asseed selection, cleaning, treatment, or separate storage to improveor maintain seed quality. A large number of seed samples man-aged differently by farmers met the minimum physical purity andgermination standard for certified seed 2, producing seed compa-rable to those from the formal sector. It is imperative that nationalseed polices equally recognize the role of both formal and infor-mal sectors and provide support to create an integrated seed systemcatering to the needs of a diverse group of farmers.
KEYWORDS Ethiopia, Syria, barley (Hordeum vulgare L.), wheat(Triticum aestivum L. and T. durum L.), seed quality, seed source,seed management
INTRODUCTION
High-quality seed is a critical input in crop production. Seed quality is a sumtotal of many aspects, including genetic, physical, physiological, and healthquality (Tripp et al. 1997). Seeds, which embody the genetic potential ofplants, can influence the productivity of other agricultural inputs (Jaffee &Srivastava 1994). Availability of, access to, and use of quality seed of adaptedand farmer-preferred crop varieties are determinants of the efficiency andproductivity of other technologies in increasing crop production. Empirical
Dow
nloa
ded
by [
Zew
die
Bis
haw
] at
09:
56 1
3 Se
ptem
ber
2012

Farmer’s Seed Sources and Seed Quality Part 1 657
evidence has shown that use of quality certified seed increases crop yields.It was reported that use of certified seed increased irrigated bread wheat(Triticum aestivum L.) yields by 28% in Afghanistan (Kugbei 2011), less than10% for cereals in Poland (Wicki & Dudek 2009), and 8%–10% for rice (Oryzasativa L.) in Bangladesh and the Philippines (Deb 2002). A yield increasefrom 50 kg ha−1 for rye (Secale cereale L.) to 300 kg ha−1 for winter wheatwas also reported in Poland (Oleksiak 1998).
Measurement of quality requires a set of standards defined by the seedindustry and probably backed by regulations. Seed quality standards are thefeatures of the formal sector and apply to seed production and certifica-tion for domestic and international seed trade. Seed from the formal sectormust meet specific quality standards prescribed by the national regulations.Although standards may vary between countries, they are mainly specifiedfor analytical purity, germination capacity, and health (Hampton 1998). In theformal sector, the certification agency establishes technical, administrative,and regulatory frameworks to produce quality seed that meets specified min-imum standards for marketing. Apart from good crop management used tomaintain varietal purity, laboratory tests are conducted to assess key seedquality attributes.
There is a growing recognition of the role of the informal sectorthat provides the bulk of seed planted by farmers in developing coun-tries (Almekinders, Louwaars & de Bruijin 1994; Bishaw 2004). However,most informal-sector studies have focused on institutional and organiza-tional issues, with little attention to the technical aspects of seed supply.The informal sector operates at the farm level and depends on local knowl-edge of plant or seed selection and management practices. The majority offarmers in Ethiopia and Syria recognize the value of seed quality, cleaning,and/or (sometimes) treating seed obtained from informal sources (Bishaw,Struik, & van Gastel 2010, 2011). Although the role of the informal sectoris recognized, few attempts have been made to assess the status of seedquality (Wright et al. 1994; Wright & Tyler 1994; Walker & Tripp 1997).Moreover, there is limited information on the local management practicesand the quality of seed used by farmers. Therefore, the main objectives ofthese studies were to: (i) assess the quality of seed used by farmers in differ-ent regions; (ii) assess the quality of wheat and barley seeds from differentsources; (iii) understand seed quality constraints in the informal sector; and(iv) recommend alternatives for improving seed quality at the farm level.
MATERIALS AND METHODS
A total of 304 wheat (bread and durum) farmers in Ethiopia, and 206 wheat(bread and durum) and 200 barley (Hordeum vulgare L.) farmers in Syria,were interviewed from major wheat and barley growing regions during the
Dow
nloa
ded
by [
Zew
die
Bis
haw
] at
09:
56 1
3 Se
ptem
ber
2012

658 Z. Bishaw et al.
1997 and 1998 crop seasons as part of wheat and barley seed system studies(Figure 1a, b). A stratified sampling procedure was employed, which wasbased on the proportion of wheat or barley area in each region combinedwith random sampling of farmers as described by Bishaw, Struik, and vanGastel (2010, 2011). In Ethiopia, four regions were included covering ninedistricts and 81 villages across the country. In Syria, three provinces wereincluded covering six districts and 59 villages. Farmers were asked abouttheir seed sources, perception of seed quality, and on-farm seed managementpractices for wheat and barley crops. After the interview, 1 kg of wheat orbarley seed sample was collected from each farmer from the seed lot plantedor intended for planting for analysis in the laboratory. To ensure uniformity,each sample was pre-cleaned to remove dust and small particles beforeconducting laboratory tests. Seed samples were fumigated against storagepests and kept under ambient conditions until testing.
Laboratory Tests
All samples collected during the survey were analyzed for seed qualityparameters (physical purity, species purity, weed contamination, thousand-seed weight, germination, and vigor). All tests were conducted accordingto the International Seed Testing Association (ISTA) rules, and tests outsidetolerance limits were repeated (ISTA 1999). All physical purity and physi-ological quality tests were conducted at the seed testing laboratory of theEthiopian Seed Enterprise (ESE), Addis Ababa, Ethiopia, and the seed testinglaboratory of the International Center for Agricultural Research in the DryAreas (ICARDA), Aleppo, Syria.
Physical Quality
NUMBER COUNT TEST
Each seed sample of both crops was subjected to number count test (ISTA1999), and the number of other crops and noxious weeds were recordedas prescribed by the national seed standards (ICARDA 2002). For wheat,presence of seeds of other crops, such as barley, rye, cultivated oats, etc.,and weeds such as Avena, Lolium, Bromus, Sinapis arvensis, etc., wasrecorded.
ANALYTICAL PURITY TEST
From each sample, two replicates of 60 g were analyzed, and the sampleswere divided into fractions (pure seed, other crop seed, and inert matter).The percentage of each fraction (based on weight) was calculated, and seedsof other crops and weeds identified and their numbers recorded.
Dow
nloa
ded
by [
Zew
die
Bis
haw
] at
09:
56 1
3 Se
ptem
ber
2012

(a)
(b)
FIG
UR
E1
Whea
tse
edsy
stem
study
area
s(s
had
ed)
inEth
iopia
(a)
and
Syria
(b)
(colo
rfigu
reav
aila
ble
onlin
e).
659
Dow
nloa
ded
by [
Zew
die
Bis
haw
] at
09:
56 1
3 Se
ptem
ber
2012

660 Z. Bishaw et al.
THOUSAND-SEED WEIGHT
In Ethiopia, eight replicates of 100 seeds each were weighed from the pureseed fraction. The coefficient of variation was calculated to assess the accept-ability of the test. In Syria, two replicates of 1,000 seeds were counted usinga seed counter and the average seed weight was calculated.
Physiological Quality
GERMINATION TEST
Four replicates of 100 seeds were planted from each sample in sterilizedsand media (Ethiopia) or pleated paper (Syria). After planting, seeds wereplaced in a germination room maintained at 20◦C for eight days for wheatand seven days for barley according to ISTA Rules (ISTA 1999). Both normaland abnormal seedlings, un-germinated, and dead seeds were recorded, andthe average germination was calculated on the basis of the final count. Thegermination tests were also used to evaluate seedling vigor.
VIGOR TESTS
Speed of germination. Four replicates of 25 seeds were planted fromeach sample and kept at 20 ± 1◦C for a maximum of 12 days in an incubatorin Ethiopia and in a germination room in Syria until no further germinationtook place. Each day, normal seedlings were removed at predeterminedsize and time until all seeds capable of producing normal seedlings hadgerminated. An index of germination was calculated by dividing the numberof seedlings removed each day by the number of days in which they wereremoved (Maguire 1962).
First seedling count. During the germination test, the first counts weremade and the number of normal seedlings recorded (fourth day after plant-ing). The final count was made on the last day as in standard germinationtests and the total number of normal seedlings was recorded (Srivastava &Simarski 1986).
Seedling vigor classification. After the standard germination test, thenormal seedlings were classified into vigorous seedlings and low vigorseedlings (Fiala 1989). Vigorous seedlings were normal seedlings with strong,well-developed, and dark green plumule and strong primary root. Low vigor-ous seedlings were normal seedlings with short or stunted plumule (<5 cm)or coleoptile with limited damage.
Seedling shoot and root length. The shoot and root length were mea-sured after the final count of standard germination. Ten normal seedlingswere randomly selected from each replicate and the shoot length and rootlength were measured. The average shoot or root length was computedby dividing the total shoot or root length by the total number of normalseedlings measured (Fiala 1987).
Dow
nloa
ded
by [
Zew
die
Bis
haw
] at
09:
56 1
3 Se
ptem
ber
2012

Farmer’s Seed Sources and Seed Quality Part 1 661
Seedling dry weight. The seedling dry weight was measured after thefinal count of standard germination. Ten seedlings randomly selected fromeach replicate were cut free from their cotyledons, placed in envelopes, anddried in an oven at 80 ± 1◦C for 24 hours. The dried seedlings were weighedto the nearest mg and the average seedling dry weight was calculated.
Vigor indexes. For each sample, two vigor indexes (Index 1 & 2) werecalculated (Abdul-Baki & Anderson 1973). Seedling vigor index 1 was cal-culated by multiplying the normal germination with the average sum ofshoot length and root length and vigor index 2 by multiplying the standardgermination with mean seedling dry weight.
FIELD EMERGENCE (FE)
In Ethiopia, wheat was planted at the rate of 30 g seeds per plot in six rowsof 2.5 m length with a spacing of 0.2 m between rows at Gonde-Ethaya seedfarm of ESE. In Syria, wheat was planted at the rate of 60 g for bread wheatand 70 g for durum wheat in eight rows of 2.5 m length, with a spacingof 0.25 m between rows. Barley was planted at the rate of 50 g per plotof eight rows of 2.5 m length, with a spacing of 0.25 cm at Tel Hadya, anexperimental farm of ICARDA. In all experiments, seedling emergence wasmeasured twice: first once emergence was stabilized and then two weeksafter the first count on an area of 1 m2. A randomized complete-block designwas used for the field experiments.
Experimental Design and Data Analysis
Completely randomized design was used for the laboratory tests. Analysisof variance was performed on physiological quality parameters measuredusing the Genstat 6.1 statistical package. Mean separation was done usingLSD (0.05%), and simple Pearson correlation coefficients were calculated toassess the association among different vigor indices and field emergence.
RESULTS AND DISCUSSION
Wheat and barley farmers in both countries obtained seed from four dif-ferent sources. These were the formal sector, neighbors/other farmers,traders/markets, or own saved seed.
Wheat Seed Quality in Ethiopia
PHYSICAL SEED QUALITY—PURITY
The physical quality of wheat seed samples collected from different regionsand sources are presented in Tables 1 and 2. The average physical purity
Dow
nloa
ded
by [
Zew
die
Bis
haw
] at
09:
56 1
3 Se
ptem
ber
2012

TAB
LE1
Phys
ical
purity
ofw
hea
tse
edfr
om
maj
or
whea
tgr
ow
ing
dis
tric
tsin
Eth
iopia
Com
posi
tion
by
wei
ght(%
120
g−1)
Conta
min
atio
nby
num
ber
(Num
ber
ofse
eds
kg−1
)
Dis
tric
tsA
nal
ytic
alpurity
Cro
pse
eds
Wee
dse
eds
Bar
ley
Oth
ercr
ops
Ave
na
Loli
um
Bro
mu
sCom
mon
wee
ds
Thousa
nd
seed
wei
ght
Ged
eb97
.55
0.17
80.
483
25.4
2.8
53.4
248
11.2
143
31.5
7M
unes
sa98
.17
0.01
70.
816
4.2
0.1
130.
930
88.
321
529
.80
Het
osa
99.1
10.
106
0.30
626
.81.
151
.625
35.
011
536
.14
Dodota
99.5
90.
032
0.19
52.
62.
63
139
0.2
145
38.0
6D
endie
98.9
60.
326
0.17
718
.542
.610
.974
0.4
2239
.73
Chel
ia99
.31
0.17
70.
219
27.2
0.6
1510
20.
034
40.4
7Ensa
roW
ayu
99.2
20.
169
0.24
50.
416
.75.
717
00.
28
36.1
4H
ule
tEju
99.1
60.
085
0.13
610
.98.
07.
875
0.02
332
.35
Mac
hak
al99
.42
0.05
30.
140
5.9
1.5
3.4
790
130
.05
Mea
n98
.92
0.13
60.
293
15.3
8.5
30.0
165
2.9
7235
.36
Sign
ifica
nce
<0.
001
<0.
001
<0.
001
<0.
001
<0.
006
<0.
001
<0.
001
<0.
001
<0.
001
<0.
001
662
Dow
nloa
ded
by [
Zew
die
Bis
haw
] at
09:
56 1
3 Se
ptem
ber
2012

TAB
LE2
Phys
ical
purity
ofw
hea
tse
edfr
om
diffe
rentse
edso
urc
esin
Eth
iopia
Com
posi
tion
by
wei
ght(%
120
g−1)
Conta
min
atio
nby
num
ber
(Num
ber
ofse
eds
kg−1
)
Seed
sourc
esA
nal
ytic
alpurity
OCS
WS
Bar
ley
Oth
ercr
ops
Ave
na
Loli
um
Bro
mu
sCom
mon
wee
ds
TSW
Form
alse
edse
ctor
99.4
10.
030
0.10
62.
93.
92.
543
1.3
637
.26
Nei
ghbors
/Fa
rmer
s98
.59
0.17
60.
257
30.1
0.7
63.3
143
8.2
9835
.01
Tra
der
s/M
arke
ts98
.89
0.23
70.
330
20.1
4.4
51.3
155
13.9
144
34.4
0O
wn
save
d98
.91
0.13
50.
305
15.0
9.4
28.8
173
2.2
7135
.26
Mea
n98
.92
0.13
50.
293
15.4
8.5
30.0
165
2.9
7235
.32
Sign
ifica
nce
0.44
70.
065
0.09
50.
042
0.87
00.
055
0.20
20.
004
0.37
50.
47
Note
:(O
CS)
oth
ercr
op
seed
s;(W
S)w
eed
seed
s;an
d(T
SW)
thousa
nd
seed
wei
ght.
663
Dow
nloa
ded
by [
Zew
die
Bis
haw
] at
09:
56 1
3 Se
ptem
ber
2012
664 Z. Bishaw et al.
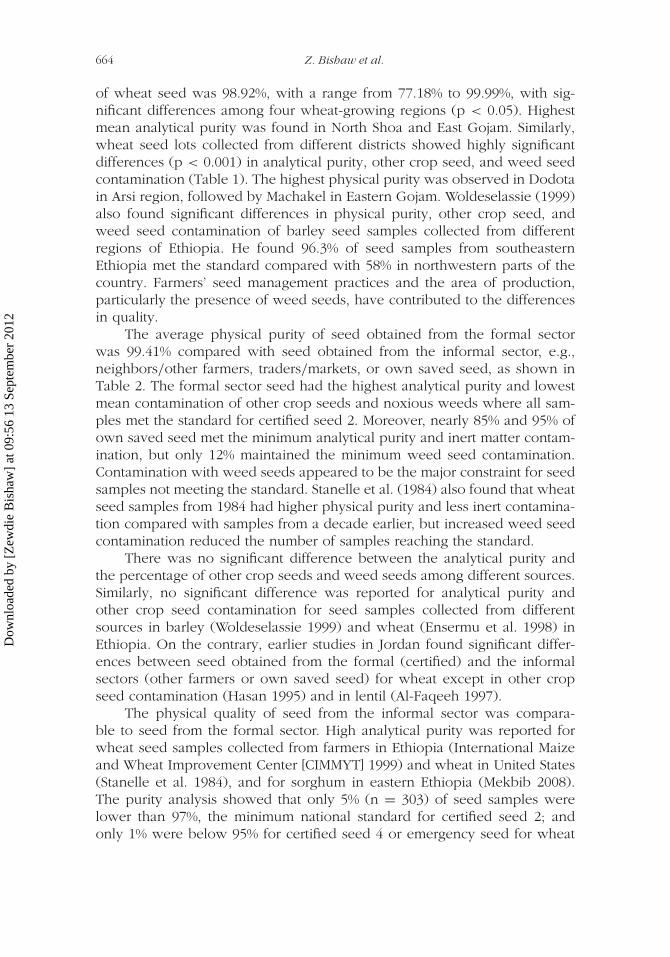
of wheat seed was 98.92%, with a range from 77.18% to 99.99%, with sig-nificant differences among four wheat-growing regions (p < 0.05). Highestmean analytical purity was found in North Shoa and East Gojam. Similarly,wheat seed lots collected from different districts showed highly significantdifferences (p < 0.001) in analytical purity, other crop seed, and weed seedcontamination (Table 1). The highest physical purity was observed in Dodotain Arsi region, followed by Machakel in Eastern Gojam. Woldeselassie (1999)also found significant differences in physical purity, other crop seed, andweed seed contamination of barley seed samples collected from differentregions of Ethiopia. He found 96.3% of seed samples from southeasternEthiopia met the standard compared with 58% in northwestern parts of thecountry. Farmers’ seed management practices and the area of production,particularly the presence of weed seeds, have contributed to the differencesin quality.
The average physical purity of seed obtained from the formal sectorwas 99.41% compared with seed obtained from the informal sector, e.g.,neighbors/other farmers, traders/markets, or own saved seed, as shown inTable 2. The formal sector seed had the highest analytical purity and lowestmean contamination of other crop seeds and noxious weeds where all sam-ples met the standard for certified seed 2. Moreover, nearly 85% and 95% ofown saved seed met the minimum analytical purity and inert matter contam-ination, but only 12% maintained the minimum weed seed contamination.Contamination with weed seeds appeared to be the major constraint for seedsamples not meeting the standard. Stanelle et al. (1984) also found that wheatseed samples from 1984 had higher physical purity and less inert contamina-tion compared with samples from a decade earlier, but increased weed seedcontamination reduced the number of samples reaching the standard.
There was no significant difference between the analytical purity andthe percentage of other crop seeds and weed seeds among different sources.Similarly, no significant difference was reported for analytical purity andother crop seed contamination for seed samples collected from differentsources in barley (Woldeselassie 1999) and wheat (Ensermu et al. 1998) inEthiopia. On the contrary, earlier studies in Jordan found significant differ-ences between seed obtained from the formal (certified) and the informalsectors (other farmers or own saved seed) for wheat except in other cropseed contamination (Hasan 1995) and in lentil (Al-Faqeeh 1997).
The physical quality of seed from the informal sector was compara-ble to seed from the formal sector. High analytical purity was reported forwheat seed samples collected from farmers in Ethiopia (International Maizeand Wheat Improvement Center [CIMMYT] 1999) and wheat in United States(Stanelle et al. 1984), and for sorghum in eastern Ethiopia (Mekbib 2008).The purity analysis showed that only 5% (n = 303) of seed samples werelower than 97%, the minimum national standard for certified seed 2; andonly 1% were below 95% for certified seed 4 or emergency seed for wheat
Dow
nloa
ded
by [
Zew
die
Bis
haw
] at
09:
56 1
3 Se
ptem
ber
2012

Farmer’s Seed Sources and Seed Quality Part 1 665
in Ethiopia (ICARDA 2002). The Ethiopian seed certification standards put inplace have alternative options for seed distribution in emergency situations.The standards for commercial or emergency seed are lowered to 95% purity,and almost all wheat seed samples collected from farmers during the surveycould easily meet these standards.
WEED SEED CONTAMINATION
The contamination of other crop seeds and weed seeds (number of seedskg−1) is presented in Table 1 (districts) and Table 2 (sources). A total of13 crop species and 15 weed species were found in wheat seed lots collectedfrom farmers with a minimum of one and a maximum of 11 species sample−1.The average number of other crop species, weed species, and total of allother species found sample−1 were 1.5, 3.4, and 4.5 species, respectively.A large number of other crop species and weed species were also foundin barley seed samples (ten crop and seven weed species) collected fromfarmers in Ethiopia (Woldeselassie 1999), in lentils (four crop and 13 weedspecies) from farmers across Jordan (Al-Faqqeeh 1997), and in rice (20 weedspecies) from farmers in the Philippines (Fujisaka et al. 1993).
In national seed standards, contamination of the seed with other cropor weed seeds of similar physical characteristics is restricted because clean-ing alone will not sufficiently remove such contaminants. Accordingly, weedseeds could be classified as restricted (objectionable) weeds (not permitted),noxious weeds (permitted with specified standards), and common weeds(no standards). The presence of such crop and weed seeds is determinedby examining a relatively bigger seed sample (e.g., 1 kg for wheat andbarley) because analytical purity tests do not reveal the extent of contam-ination, as percentage by weight varies among weed seeds (Thomson 1979).In Ethiopia, the national regulation requires that wheat seed be free fromother crop seeds (e.g., barley) and noxious weeds such as Avena, Bromus,Lolium spp., etc.
About 70% and 37% of the wheat seed samples (n = 303) were contam-inated with barley and other crop seeds, respectively. Mean contaminationwith other crop seeds was significantly different (P < 0.001) among districts.The overall mean contamination with barley seed was 15 grains kg−1 sam-ple, with the highest mean contamination of 27 grains in Chelia from WestShoa, followed by Hetosa (27 grains) and Gedeb (25) both in Arsi region.Samples from North Shoa showed the least contamination with barley seed.A maximum of 248 barley seeds kg−1 was found from farm saved seed.Barley is grown as a second crop and contamination can happen in the fieldbecause of a lack of proper crop rotation, at threshing floors, or in storagefacilities. While barley contamination was found throughout all regions anddistricts, contamination from other crops remained localized (e.g., grass peafrom districts in West Shoa).
Dow
nloa
ded
by [
Zew
die
Bis
haw
] at
09:
56 1
3 Se
ptem
ber
2012

666 Z. Bishaw et al.
The number of samples with noxious and common weed contaminationwas quite high and the level of contamination was significantly differentbetween districts (P < 0.001). In total, 75%, 89%, 24%, and 70% of wheatsamples (n = 303) had contamination with Avena, Lolium, Bromus, andcommon weeds, respectively. Three important noxious weed species, Avena,Bromus, and Lolium were found in samples from all districts. Although themaximum number of seeds kg−1 of wheat sample was as high as 489 forAvena, 1,448 for Lolium, and 150 for Bromus, the average contaminationwas relatively low (Tables 1 and 2). Badebo and Lindeman (1987) foundon average 706, 359, and 83 seeds kg−1 of noxious weeds, other commonweeds, and other crops, respectively, in seed samples collected from farmersin the Arsi region—comparatively higher than from seed lots from basic seedmultiplication fields. Woldeselassie (1999) also found that 97% of barley seedsamples collected from farmers in Ethiopia were contaminated with weedseeds, and contamination with Avena ranged from 44 to 73 seeds sample−1
and that of Lolium from 68 to 207 seeds sample−1. Kolk (1979) reported thatAvena spp. and Lolium temulentum were the two most important weeds inwheat and barley in Ethiopia.
The number of seeds of Avena and Lolium in seed lots collectedfrom the Arsi region was high compared with that of other regions. Thecereal monoculture dominated by wheat and/or barley production and thewidespread use of selective broadleaf herbicides led to the distribution ofsuch grass weeds across the region (Sahile & Tilahun 1997). More wildoats contamination was found with seed lots from improved varieties com-pared with local materials. Seed contaminated with weeds could be themeans for introduction and dissemination of noxious weeds. In Ethiopia,the widespread use of commercial seed appeared to be the main cause forspread of wild oats particularly in the state farms in Arsi region. Introductionof wild oats in Egypt and wild sorghum in Sudan have also been attributedto contaminated seed (Ageeb et al. 1996).
In the purity analyses, the highest other crop seeds (barley) andweed seed contaminations were observed in seed obtained from otherfarmers/neighbors, traders/markets, or own saved seed as compared withseed from the formal sector (Table 2). Although the certified seed from theformal sector had a lower average percentage and number of other cropand weed seed contaminations, it was not significantly different from seedobtained from other sources except for contamination with barley, Bromus,and wild oats (P < 0.05). Moreover, weed contamination was higher for seedobtained from other farmers or markets as compared with own seed (exceptLolium). Fujisaka et al. (1993) also found similar results where own seed hadfewer weed seeds compared with seed obtained from other farmers.
Apart from weed seeds found during quality analysis, farmers were alsoasked to identify major problematic weeds they encountered in wheat pro-duction. They reported that grass weeds, such as wild oats (31.3%; n = 304),
Dow
nloa
ded
by [
Zew
die
Bis
haw
] at
09:
56 1
3 Se
ptem
ber
2012

Farmer’s Seed Sources and Seed Quality Part 1 667
Lolium (3.6%), Snowdenia (48.4%), Phalaris (16.4%), and Setaria (2.3%),were important (Bishaw, Struik, & van Gastel 2010). Among grass weeds,wild oats was reported in all regions, although the majority of cases werefrom farmers in Arsi and western Shoa regions. Moreover, Snowdenia (exceptregion 3), Lolium, and Phalaris (except region 4) and Setaria (except regions3 and 4) were also reported. Farmers’ assessment of weed problems con-forms well to the results of weed surveys in wheat production areas inEthiopia (CIMMYT 2000).
The study demonstrated that contamination with weed seeds appearedto be the major constraint for seed samples not meeting the standard.It should be noted that noxious weeds have significant effect on wheat yield.A weed density of 25 plants m−2 of Lolium, Avena, Bromus, and Hordeumcould cause an estimated wheat yield loss of up to 16%, 11%, 9%, and 7%,respectively (Curtis, Rajaram, & Macpherson 2002).
THOUSAND-SEED WEIGHT
There were significant differences (P < 0.001) in thousand-seed weightbetween samples collected from different districts (Table 1) but not betweensamples from different sources (Table 2). Wheat seed samples collected fromEast Gojam had the lowest thousand-seed weight. Those from West Shoa hadthe highest thousand-seed weight, because some samples were of durumwheat. The lowest thousand-seed weight was from samples from Munessadistrict in Arsi region and the highest from Chelia in West Shoa.
Varietal differences were significant (P < 0.001). The mean seed weightwas 35.32 g, with a range from 31.63 g for HAR 1685, a bread wheatvariety, to 46.83 g for Boohai, a durum wheat variety. Apart from vari-etal differences, inter-plant competition for light, water, and nutrients andthe effect of diseases may contribute to a wide range of seed size withina seed lot. Seed size also varies according to the location on an inflores-cence, which reflects differences in flowering time (main and side tillers)and nutrition of the developing seeds (basal and apical flowers). Significantdifferences in thousand-seed weight among wheat varieties collected fromfarmers was reported and attributed the differences to the precursor cropsand level of weed infestations (Ensermu et al. 1998; CIMMYT 1999).In wheat, seed size or weight was found to correlate with seedling emer-gence and yield in wheat under late sown conditions (Khah, Roberts, & Ellis1989).
Physiological Seed Quality—Germination
The physiological quality of wheat seed samples is presented for dif-ferent districts (Table 3) and different sources (Table 4). The overallmean germination was 96%, with a range from 68% to 100%. The
Dow
nloa
ded
by [
Zew
die
Bis
haw
] at
09:
56 1
3 Se
ptem
ber
2012

668 Z. Bishaw et al.
TABLE 3 Physiological quality (germination) of wheat seed from major wheat growingdistricts in Ethiopia
DistrictsMean
germination (%)
Percent of sampleswith germination
of ≥85%Pure live seed
(PLS)
Percent ofsamples with PLS
of ≥85
Gedeb 95 98 93 95Munessa 94 100 92 100Hetosa 93 92 93 92Dodota 98 100 97 100Dendie 97 100 93 100Chelia 94 92 93 92Ensaro Wayu 98 100 98 100Hulet Eju 98 100 98 100Machakal 96 100 96 100Mean 96 95
Significance <0.001 NS <0.001
TABLE 4 Physiological quality (germination) of wheat seed from different sources in Ethiopia
Seed sources Germination (%)
Percent of sampleswith germination
of ≥85%Pure live seed
(PLS)
Percent ofsamples with PLS
of ≥85
Formal seeds sector 96 100 95 100Neighbors/Farmers 94 94 93 94Traders/markets 97 100 96 100Own seed 96 97 95 97Mean 96 95
Significance <0.041 0.786
wheat samples collected from the southeastern, central, and northwesternparts of the country showed remarkably higher germination percentages,with few samples below the standard; differences were highly significant(P < 0.001) between different regions and districts (Tables 3). Averagegermination was the highest in North Shoa and East Gojam (98%) and lowestin Arsi (95%). At district level, the mean germination ranged from the lowestin Hetosa (Arsi) to the highest in Machakal (East Gojam). The total numberof samples with a germination percentage of less than 85% was eight (2.6%;n = 303) samples (Table 3). The physiological quality of seed obtained fromdifferent geographic regions may vary because of environmental effects dur-ing the formation, development, and maturation of seed. Grass and Burris(1995) found that environmental factors, such as high temperature, had vari-able effect on germination but led to significant reduction in seedling vigorin durum wheat varieties.
The mean germination for certified seed from the formal sector wasthe highest compared with seed obtained from neighbors/other farmers,markets/traders, or own saved seed (Table 4). Most of the samples met the
Dow
nloa
ded
by [
Zew
die
Bis
haw
] at
09:
56 1
3 Se
ptem
ber
2012

Farmer’s Seed Sources and Seed Quality Part 1 669
minimum wheat seed standard for certified 2. Similar results were reportedwhere almost all samples collected from farmers reached the minimumgermination standards for certified seed of wheat (Ensermu et al. 1998;CIMMYT 1999) and sorghum (Mekbib 2008) in Ethiopia. There were sig-nificant (P < 0.05) differences in germination among seeds obtained fromdifferent sources. Al-Faqeeh (1997) found that certified seed had signifi-cantly higher germination in lentil compared with seed from other sources.Woldeselassie (1999) also found a very significant variation in germinationof barley seed collected from different regions and sources in Ethiopia. Hereported that nearly 90% were below the germination prescribed for certifiedseed of barley. This was attributed to extended rainfall during crop maturityand harvesting, causing pre-harvest sprouting in the survey year. However,Hassan (1995) found no significant differences in germination betweencertified wheat seed and that obtained from other farmers or own savedseed. Similarly, Ndjeunga (2002) also reported high average germination forsorghum seed samples collected from farmers in Niger with no differenceacross agro-ecological zones.
The pure live seed (PLS) results for wheat seed samples collected fromdifferent regions and sources are presented in Tables 3 and 4, respectively.The PLS was found to be significant at the district level, but not from differentsources. Germination capacity combined with analytical purity can be usedto determine the proportion of seed that can produce normal seedlings inthe field, called the PLS. The pure live seed is used to express seed qualityand can be employed to choose among different seed lots. The total numberof samples with a pure live seed of less than 85 was nine (3%).
Physiological Seed Quality—Vigor
Significant variations (p < 0.001) were observed among vigor indices exceptseedling root length, seedling dry weight, and vigor index 2 among seed lotscollected from different regions and districts but not from different sources(Table 5). Wheat seed samples from Dodota gave the highest values for stan-dard germination, seedling vigor classification, and first seedling counts androot length, though the latter was not significant. Seedling vigor classificationinto vigorous and non-vigorous categories showed the highest significantvariation, where as the results from Ensaro Wayu and Dendie showedthe least, i.e., 55% and 34%, respectively. The lowest vigor index 1 wasrecorded for samples collected from Chelia mainly because of short shootlength.
There was no variation in vigor indices from different seed sourcesexcept in root length and vigor index 1 (Table 6). Although not significant,wheat seed samples obtained from market/traders gave the highest valuesfor standard germination, first seedling count, seedling shoot length, seedlingroot length, seedling dry weight, and vigor indices 1 and 2. However, there
Dow
nloa
ded
by [
Zew
die
Bis
haw
] at
09:
56 1
3 Se
ptem
ber
2012

670 Z. Bishaw et al.
TABLE 5 Physiological quality (vigor) of wheat seed from major wheat growing districts inEthiopia
Districts SG (%) SVC (%) FSC (%) SPGSL
(cm)RL
(cm)SDWT
(g) VIG1 VIG2
Gedeb 86 71 82 12.65 9.32 9.55 0.05 1624 4.3Munessa 87 81 83 12.63 9.46 9.42 0.052 1646 4.6Hetosa 91 80 87 12.43 8.70 9.51 0.066 1669 6.1Dodota 97 93 95 12.52 9.28 10.06 0.056 1872 5.5Dendie 94 34 92 12.44 8.81 9.77 0.094 1741 8.8Chelia 88 82 85 11.30 8.32 9.65 0.071 1585 6.1Ensaro Wayu 97 55 94 13.52 8.73 9.98 0.067 1803 6.5Hulet Eju 95 93 94 12.53 9.64 10.33 0.054 1903 5.1Machakal 95 92 92 12.51 8.49 9.25 0.054 1676 5.1Mean 93 71 90 12.54 8.85 9.78 0.067 1730 6.2
Significance <0.001 <0.001 <0.001 <0.001 <0.001 0.17 0.136 <0.001 0.096
Note: (SG) standard germination; (SVC) seedling vigour classification; (FSC) first seedling count; (SPG)speed of germination; (SL) seedling shoot length; (RL) seedling root length; (SDWT) seedling dry weight;(VIG1) vigor index 1; and (VIG2) vigor index 2.
TABLE 6 Physiological quality (vigor) of wheat seed from different sources in Ethiopia
Seed sourcesSG(%)
SVC(%)
FSC(%) SPG
SL(cm)
RL(cm)
SDWT(g) VIG1 VIG2
Government 92 75 89 12.86 8.62 9.35 0.056 1662 5.1Neighbors/Farmers 92 86 89 12.92 9.38 8.48 0.054 1635 5.0Markets/Traders 97 73 96 12.42 9.76 11.38 0.089 2047 8.6Own seed 93 70 90 12.51 8.84 9.82 0.067 1733 6.2Mean 93 71 90 12.55 8.85 9.78 0.066 1730 6.2
Significance 0.52 0.29 0.486 0.39 0.21 <0.001 0.570 0.026 0.504
Note: (SG) standard germination; (SVC) seedling vigour classification; (FSC) first seedling count; (SPG)speed of germination; (SL) seedling shoot length; (RL) seedling root length; (SDWT) seedling dry weight;(VIG1) vigor index 1; and (VIG2) vigor index 2.
was some degree of inconsistency in ranking the seed lots relative to vigorby the different tests for seed obtained from different districts and sources.
Simple Pearson correlation coefficients of physiological tests and fieldemergence for wheat are presented in Table 7. Standard germination, speedof germination, first seedling count, root length, and seedling dry weightwere significantly correlated with each other and field emergence. Seedlingvigor classification did not correlate with most vigor tests or field emergencebut negatively correlated with seedling dry weight. Foster, Burchett, andPaulsen (1998) reported a significant correlation between germination testand field emergence of previously sprouted hard red wheat. Similarly, sig-nificant correlations have been reported among standard germination, shootlength, root length, seedling dry weight, and field emergence in pigeon pea(Ram et al. 1991). These authors reported no correlation between root and
Dow
nloa
ded
by [
Zew
die
Bis
haw
] at
09:
56 1
3 Se
ptem
ber
2012

TAB
LE7
Sim
ple
Pea
rson
corr
elat
ion
coef
fici
ents
bet
wee
nvi
gor
test
san
dfiel
dem
erge
nce
inw
hea
t,Eth
iopia
Labora
tory
test
sSG
SVC
SPG
FSC
SLRL
SDW
TV
IG1
VIG
2FE
Stan
dar
dge
rmin
atio
n1
0.09
20.
43∗∗
0.97
∗∗0.
160.
51∗∗
0.65
∗∗0.
71∗∗
0.21
∗0.
50∗∗
Vig
or
clas
sifica
tion
1−0
.18
0.09
0.09
−0.0
4−0
.23∗
0.07
−0.2
5∗−0
.11
Spee
dofge
rmin
atio
n1
0.36
∗∗0.
070.
150.
29∗∗
0.28
∗∗0.
130.
50∗∗
Firs
tse
edlin
gco
unt
10.
120.
51∗∗
0.63
∗∗0.
69∗∗
0.20
∗∗0.
43∗∗
Shootle
ngt
h1
0.59
∗∗0.
47∗∗
0.74
∗∗0.
010.
12Rootle
ngt
h1
0.62
∗∗0.
89∗∗
0.13
0.30
∗∗
Seed
ling
dry
wei
ght
10.
75∗∗
0.23
∗∗0.
32∗∗
Vig
or
index
11
0.15
0.39
∗∗
Vig
or
index
21
0.09
Fiel
dem
erge
nce
1
Note
:∗ ,
∗∗Si
gnifi
cantat
P<
0.05
and
P<
0.01
,re
spec
tivel
y;(S
G)
stan
dar
dge
rmin
atio
n;(S
VC)
seed
ling
vigo
ur
clas
sifica
tion;(F
SC)
firs
tse
edlin
gco
unt;
(SPG
)sp
eed
of
germ
inat
ion;(S
L)se
edlin
gsh
oot
lengt
h;(R
L)se
edlin
gro
ot
lengt
h;(S
DW
T)
seed
ling
dry
wei
ght;
(VIG
1)vi
gor
index
1;(V
IG2)
vigo
rin
dex
2;an
d(F
E)
fiel
dem
erge
nce
.
671
Dow
nloa
ded
by [
Zew
die
Bis
haw
] at
09:
56 1
3 Se
ptem
ber
2012

672 Z. Bishaw et al.
shoot length with field emergence, which is similar to our results whereshoot length did not correlate with field emergence.
Bishaw, Struik, and van Gastel (2010) reported that the majority ofEthiopian farmers indicated differences between wheat seed used for plant-ing and grain, and noted that quality seed should have high purity, be freefrom other crop and weed seeds, be intact with good germination, have bigkernel size, be free from diseases or pest damage, and have no admixturewith other varieties, in descending order. The formal sector should identifypotential seed quality aspects that could attract farmers to purchase freshcertified seed stock regularly. In Ethiopia, the quality standards of wheatrequire that certified seed meet minimum physical purity and germinationstandards before marketing. Accordingly, wheat certified seed 2 should havea minimum physical purity of 97%, minimum germination of 85%, and max-imum contamination of other crop seeds (0.2%), weed seeds (0.05%), andinert matter (2%). About 96% of wheat seed samples meet the physical puritystandards, whereas 97% (n = 303) could meet the germination requirementof certified seed 2. Combining physical purity and germination, about 95%samples met this standard. The results of the wheat seed samples suggestedthat farmers could produce high quality seed comparable to that from theformal sector. It is also important that the formal sector identifies seed qualityconstraints of the informal sector and assists farmers in improving the qualityof on-farm-produced seed.
Wheat and Barley Seed Quality in Syria
PHYSICAL SEED QUALITY—PURITY
The analytical purity of wheat and barley seed samples collected from differ-ent districts and sources is presented in Tables 8 and 9. The physical purityof wheat seed samples collected from different districts was not significant.For wheat, the overall average physical purity was 97.59% (with a rangefrom 79.94% to 99.95%). The mean physical purity was the highest in RasAl-Ain district in Hassaskeh province. The majority of seed samples (70.4%;n = 206) were above the minimum physical seed quality requirements of theformal sector (98%). Further analysis indicated that only three samples hadless than 90% physical purity. Although most wheat seed samples met theminimum physical purity of the formal sector, samples from Azaz and JebelSaman in Aleppo province showed the least number of samples reaching thestandard.
Differences in physical purity were highly significant among barley seedsamples collected from different regions and districts (P < 0.001). In bar-ley, the overall mean physical purity was 95.47% (range 83.36% to 99.44%),below the minimum standard. The mean physical purity was the highest inRas Al-Ain in Hasakeh province. The majority of samples (90%; n = 200)
Dow
nloa
ded
by [
Zew
die
Bis
haw
] at
09:
56 1
3 Se
ptem
ber
2012

TAB
LE8
Phys
ical
and
phys
iolo
gica
lqual
ityofw
hea
tan
dbar
ley
seed
colle
cted
from
diffe
rentdis
tric
tsin
Syria
Whea
tB
arle
y
Dis
tric
tsPurity
(%)
Per
centof
sam
ple
sw
ithpurity
of≥9
8%G
erm
inat
ion
(%)
Per
centof
sam
ple
sw
ithge
rmin
atio
nof
≥85%
Dis
tric
tsPurity
(%)
Per
centof
sam
ple
sw
ithpurity
of≥9
8%G
erm
inat
ion
(%)
Per
centof
sam
ple
sw
ithge
rmin
atio
nof
≥85%
Aza
z98
.17
6484
66A
inEl-A
rab
95.2
29
8149
Sem
a’an
97.9
768
8768
Man
bej
i95
.90
984
64A
l-B
ab93
.94
088
69Te
lA
bia
d95
.18
7186
87Raq
qa
94.4
313
9087
TelA
bia
d96
.01
1984
78K
ham
ishli
98.6
987
8670
Kham
ishli
95.4
218
8264
Has
akeh
96.7
651
8987
Has
akeh
94.9
43
9297
Ras
Al-A
in98
.74
9094
94Ras
Al-A
in96
.02
1390
87M
ean
97.5
987
Mea
n95
.47
86
Sign
ifica
nce
0.03
9<
0.00
1<
0.00
1<
0.00
1
673
Dow
nloa
ded
by [
Zew
die
Bis
haw
] at
09:
56 1
3 Se
ptem
ber
2012

TAB
LE9
Phys
ical
and
phys
iolo
gica
lqual
ity(g
erm
inat
ion)
ofw
hea
tan
dbar
ley
seed
colle
cted
from
diffe
rentso
urc
esin
Syria
Whea
tB
arle
y
Seed
sourc
ePurity
(%)
Per
centof
sam
ple
sw
ithpurity
of
≥98%
Ger
min
atio
n(%
)
Per
centof
sam
ple
sw
ithge
rmin
atio
nof
≥85%
Seed
sourc
ePurity
(%)
Per
centof
sam
ple
sw
ithpurity
of
≥98%
Ger
min
atio
n(%
)
Per
centof
sam
ple
sw
ithge
rmin
atio
nof
≥85%
Gove
rnm
ent
99.0
396
8873
Gove
rnm
ent
––
––
Farm
ers
97.8
867
8681
Farm
ers
94.9
70
8882
Tra
der
s99
.30
100
9286
Tra
der
s95
.44
892
85O
wn
seed
96.9
361
8780
Ow
nse
ed95
.54
1285
70M
ean
97.5
987
Mea
n95
.47
86
Sign
ifica
nce
0.08
70.
506
0.40
50.
014
674
Dow
nloa
ded
by [
Zew
die
Bis
haw
] at
09:
56 1
3 Se
ptem
ber
2012

Farmer’s Seed Sources and Seed Quality Part 1 675
were below the minimum physical purity standard (98%). Furthermore, only27% of samples fulfilled the less than 2% inert matter requirement, and fewerstill fulfilled the less than 0.05% specified for weed contamination. However,none of the samples from El-Bab met the minimum purity standard, and onlya few (3% to 19% of samples) from the other districts did. In general, sam-ples from Ain El-Arab, El-Bab, and Manbeji in Aleppo province once againhad the lowest number of samples that met the minimum physical puritystandards.
Wheat seed samples were obtained both from formal and informal sec-tors, whereas all barley samples were obtained from the informal sector(Table 9). Ninety-six percent of seed samples (n = 45) from the formalsector matched the minimum physical purity for wheat seed certification,substantially higher than seed from other sources (e.g., 61% for own savedseed). Van Gastel and Bishaw (1994) also found similar results on quality ofwheat seed obtained from different districts and seed sources in the Aleppoprovince where all samples from the formal sector maintained the minimumpurity standards compared with other sources.
WEED SEED CONTAMINATION
About one third of wheat seed samples (n = 206) were not contaminatedwith any restricted other crop seeds, although four other crop species wereidentified, barley being the predominant crop species. The mean numberof barley seeds sample−1 was six seeds in 120 g (range 0 to 123 seeds).About 50% of samples had more than the acceptable level of contamina-tion with barley seed. No significant differences were found among wheatseed samples collected from different provinces, districts, and seed sourcesfor contamination with barley. However, the highest mean contaminationwas observed on retained seed or seed obtained from other farmers com-pared with seed from the formal sector. Fifty-eight percent of wheat sampleswere contaminated with noxious weeds, with 44% of samples over the mini-mum standards. Avena spp, Lolium temulentum, Myagrum perfoliatum, andPhalaris spp. were found more regularly in samples collected throughoutthe major wheat growing areas of the country. The mean contaminationwith all noxious weeds was five seeds per 120 g (range 0 to 114). ForAvena (range 0 to 23 seeds) and Lolium (0 to 54) species, the mean waseach two seeds per 120 g with high variation among the samples. About 41(26% in excess of standard) and 28 (18%) of wheat samples were contam-inated with Avena and Lolium species, respectively. A total of 11 commonweed species were identified, with up to a maximum of five weed speciessample−1 for wheat seed. Some common weed species identified wereBrassica, Cephalaria, Centaurea, Galium, Polygonum, Scorpiurus, Vaccaria,and medics, although their presence was sporadic and only one third of thesamples had contamination with these weeds.
Dow
nloa
ded
by [
Zew
die
Bis
haw
] at
09:
56 1
3 Se
ptem
ber
2012

676 Z. Bishaw et al.
From 200 barley seed samples collected across different regions, 42%had no contamination with any restricted other crop seeds (e.g., wheat).Fifty-eight percent of samples were contaminated with wheat seeds, witha mean of six seeds per 120 g (with the range from 0 to 230 seeds).Moreover, 40% of the samples had contamination with wheat seed in excessof the prescribed standard. The level of contamination was not signifi-cant among different provinces, districts, and seed sources. However, seedobtained from other farmers and retained on the farm had the highest aver-age level of wheat contamination. Almost all barley seed samples (97%;n = 200) were contaminated with noxious weeds and all in excess of thestandard. Avena spp., Lolium temulentum, Myagrum perfoliatum, Phalarisparadoxa, and Convolovulus arvensis were prevalent in samples collectedfrom major barley growing areas. Contamination with Avena and Loliumwas found in 43% and 97% of the barley seed samples, respectively, withthe mean contamination of five and 288 seeds per 120 g in the sameorder. A total of 30 common weed species have been identified in barleyseed samples, and none of the samples was found to be without commonweed contaminations; the most common ones were Brassica, Centaurea,Echinaria, Galium, Lavatera, Neslia, Papaver, Medicago, Trifolium, andVaccaria.
Most wheat and barley seed samples were contaminated with othercrop seeds (including weed seeds) and inert matter in varying proportions.In wheat, however, 17% of seed samples were not contaminated with othercrop seed or weed seeds. The number and level of contamination of barleyseed samples was significantly higher than that of wheat seed samples. Thisindicates better on-farm seed management of wheat compared with barleyseed retained or obtained from other local sources. Fujisaka et al. (1993)found that 97% (n = 70) of rice seed samples collected from farmers in thePhilippines were contaminated with weed seeds, and 26% to 79% of riceseed samples were contaminated with four major weeds, with a range of56 to 110 seeds sample−1.
Avena spp., Convolovulus arvensis, Lisea syriaca, Lolium temulentum,Myagrum perfoliatum, Phalaris spp., Sinapis arvessis, and Setaria spp. areconsidered noxious weeds and their presence is restricted in wheat andbarley seed production in Syria (ICARDA 2002). Moreover, wheat seed con-tamination with barley (or vice versa) and other small grain cereals abovecertain standards is prohibited. Farmers indicated that wild oats (Avena spp.),wild mustard (Brassica spp.), Lolium spp., and Sinapis arvensis were themajor weed problems in wheat. About 80%, 54%, and 10% of farmers consid-ered wild oats, wild mustard, and Lolium, respectively, major weed problemsin wheat production. In the case of barley, 28%, 24%, 13%, and 9% of farmersconsidered wild oats, wild mustard, wild lentil, and wild barley major weedproblems. Farmers’ perception and qualitative assessment of weed problemsin crop production fields matched well with the results obtained from the
Dow
nloa
ded
by [
Zew
die
Bis
haw
] at
09:
56 1
3 Se
ptem
ber
2012

Farmer’s Seed Sources and Seed Quality Part 1 677
quantitative analysis of seed samples collected and tested in the laboratory(Bishaw, Struik, & van Gastel 2011).
THOUSAND-SEED WEIGHT
The overall average thousand-seed weight for wheat seed was 40.06 g,with a minimum of 30.3 g and maximum of 53.4 g (data not shown).In barley, the mean was.32.6 g, ranging from 28.8 g to 39.7 g. Therewas no significant difference found for samples collected from differentclimatic zones or seed sources, in wheat and barley. However, in bar-ley, a significant difference in seed weight was observed between differentdistricts.
Physiological Seed Quality—Germination
The germination of wheat and barley seed samples collected from differentdistricts and sources is presented in Tables 8 and 9.The germination ofwheat seed samples collected from different districts was found to behighly significant (P < 0.001). For wheat, the overall mean germinationwas 88% (range 23% to 99%). The majority of seed samples (78.2%)was above the minimum seed quality requirements of the formal sector(Table 8), and only 20 samples (4.4%) had less than 80% germination. Themean germination was the highest in Ras Al-Ain in Hassaskeh governorate.Although most wheat seed samples met the minimum germination of the for-mal sector, samples from Hassakeh (Hasakeh district) and Aleppo (Azaz andJebel Saman) provinces showed the least number of samples reaching thestandard.
Germination was highly significant among barley seed samples collectedfrom different districts (P < 0.001). In barley, the mean germination was86% (range 16% to 99%). About 72% of samples had germination of 85%or more, the minimum requirement prescribed as the national standard. Themean germination was the highest in Hasakeh district in Hasakeh province(Table 8). In general, samples from Ain El-Arab, El-Bab, and Manbeji inAleppo province once again had the lowest number of samples that met theminimum germination standards.
Comparison of germination potential of seed from formal and infor-mal sources showed no significant difference in the quality of wheat seedlots obtained from different sources except for barley seed (P < 0.05).Compared to seed from informal sector, a relatively larger proportion ofseed samples from formal sector (27%) did not reach minimum germination.Van Gastel and Bishaw (1994) also found similar results where a substan-tial number of samples from there formal sector (36%) were with lowgermination than the standard for certified seed. Walker and Tripp (1997)reported no significant difference in germination between own saved seed
Dow
nloa
ded
by [
Zew
die
Bis
haw
] at
09:
56 1
3 Se
ptem
ber
2012
678 Z. Bishaw et al.
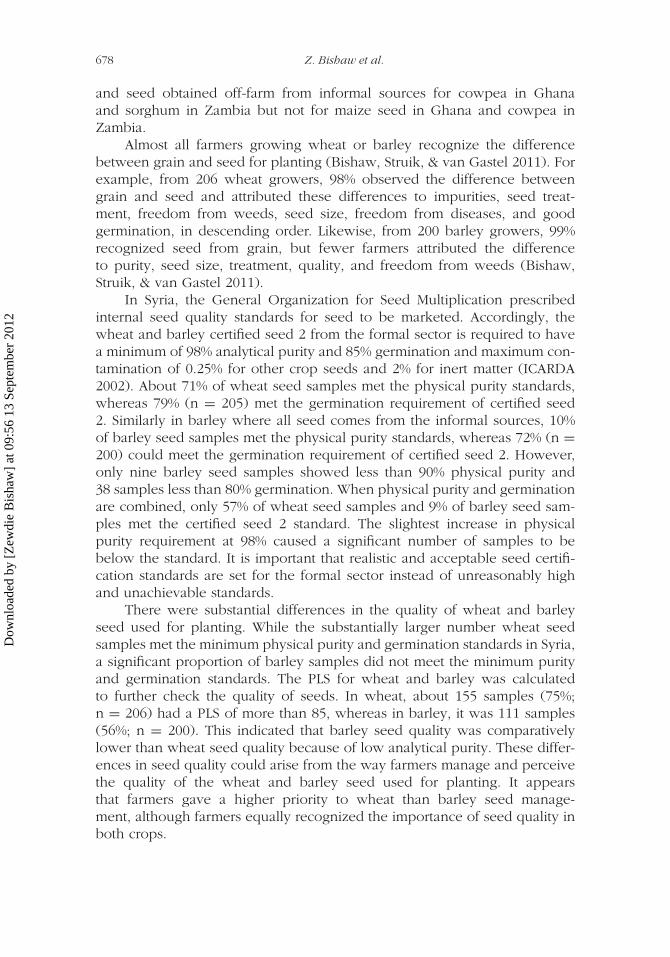
and seed obtained off-farm from informal sources for cowpea in Ghanaand sorghum in Zambia but not for maize seed in Ghana and cowpea inZambia.
Almost all farmers growing wheat or barley recognize the differencebetween grain and seed for planting (Bishaw, Struik, & van Gastel 2011). Forexample, from 206 wheat growers, 98% observed the difference betweengrain and seed and attributed these differences to impurities, seed treat-ment, freedom from weeds, seed size, freedom from diseases, and goodgermination, in descending order. Likewise, from 200 barley growers, 99%recognized seed from grain, but fewer farmers attributed the differenceto purity, seed size, treatment, quality, and freedom from weeds (Bishaw,Struik, & van Gastel 2011).
In Syria, the General Organization for Seed Multiplication prescribedinternal seed quality standards for seed to be marketed. Accordingly, thewheat and barley certified seed 2 from the formal sector is required to havea minimum of 98% analytical purity and 85% germination and maximum con-tamination of 0.25% for other crop seeds and 2% for inert matter (ICARDA2002). About 71% of wheat seed samples met the physical purity standards,whereas 79% (n = 205) met the germination requirement of certified seed2. Similarly in barley where all seed comes from the informal sources, 10%of barley seed samples met the physical purity standards, whereas 72% (n =200) could meet the germination requirement of certified seed 2. However,only nine barley seed samples showed less than 90% physical purity and38 samples less than 80% germination. When physical purity and germinationare combined, only 57% of wheat seed samples and 9% of barley seed sam-ples met the certified seed 2 standard. The slightest increase in physicalpurity requirement at 98% caused a significant number of samples to bebelow the standard. It is important that realistic and acceptable seed certifi-cation standards are set for the formal sector instead of unreasonably highand unachievable standards.
There were substantial differences in the quality of wheat and barleyseed used for planting. While the substantially larger number wheat seedsamples met the minimum physical purity and germination standards in Syria,a significant proportion of barley samples did not meet the minimum purityand germination standards. The PLS for wheat and barley was calculatedto further check the quality of seeds. In wheat, about 155 samples (75%;n = 206) had a PLS of more than 85, whereas in barley, it was 111 samples(56%; n = 200). This indicated that barley seed quality was comparativelylower than wheat seed quality because of low analytical purity. These differ-ences in seed quality could arise from the way farmers manage and perceivethe quality of the wheat and barley seed used for planting. It appearsthat farmers gave a higher priority to wheat than barley seed manage-ment, although farmers equally recognized the importance of seed quality inboth crops.
Dow
nloa
ded
by [
Zew
die
Bis
haw
] at
09:
56 1
3 Se
ptem
ber
2012

Farmer’s Seed Sources and Seed Quality Part 1 679
Physiological Seed Quality—Vigor
The standard germination, speed of germination, seedling root length,seedling shoot length, and seedling dry weight were used to assess theseed vigor of wheat and barley (Table 10). There were highly significantdifferences (P < 0.001) for all vigor test measurements for wheat and barley,except for seedling dry weight in barley. The results are consistent with thefindings for wheat seed samples collected from different regions and districtsin Ethiopia (see Table 5). The wheat seed samples from Jebel Sama’an districtin Aleppo consistently gave the highest seedling shoot length, seedling dryweight, and vigor index 1. The barley seed samples from Ras Al-Ain had thehighest speed of germination, shoot length, and root length. In a previousstudy, the speed of germination of barley was the lowest compared with thatof wheat in Syria and Ethiopia (Bishaw 2004).
The speed of germination and seedling dry weight were the only vigorindices showing highly significant differences between different seed sourcesfor wheat seed samples (Table 11). Shoot length (significant for barley), rootlength (significant for wheat), and vigor index showed inconsistent resultsfor wheat and barley seed lots. The remaining vigor indices did not showany variation among seed from different sources, once again in conformitywith wheat seed samples from Ethiopia (Bishaw 2004).
For wheat, simple linear correlation for standard germination and vigortests and field emergence are given in Table 12. Simple correlations calcu-lated among laboratory vigor tests indicated that all tests were correlated withone another. Among laboratory vigor tests, only standard germination, speedof germination, and seedling root length were significantly correlated withfield emergence. Steiner, Grabe, and Tulo (1989) reported significant corre-lations among seedling shoot length, seedling root length, and seedling dryweight in wheat. Similar results were also reported for lentil where standardgermination, speed of germination, and seedling dry weight was correlatedwith field emergence (Makkawi et al. 1999). In our study, however, seedlingshoot length and seedling dry weight (including seedling vigor index) didnot correlate with field emergence. Makkawi et al. (1999) also reported thatshoot length did not correlate with field emergence in lentil.
Table 13 contains the relationship between different vigor tests andfield emergence in barley. The standard germination and most other vigortests showed significant correlations to each other. Standard germination andspeed of germination correlated well with most other vigor tests except withroot length for the former and root length and seedling dry weight for thelatter. Most of the vigor indices, such as speed of germination, shoot length,and seedling dry weight, did not show any correlation with field emergence.Root length had a negative correlation with field emergence. However, stan-dard germination was the only vigor index with significant correlation withfield emergence in barley. Kim et al. (1994) reported a significant correlation
Dow
nloa
ded
by [
Zew
die
Bis
haw
] at
09:
56 1
3 Se
ptem
ber
2012

TAB
LE1
0Phys
iolo
gica
lqual
ity(v
igor)
ofw
hea
tan
dbar
ley
seed
colle
cted
from
diffe
rentdis
tric
tsin
Syria
Whea
tB
arle
y
Dis
tric
tsSP
GSL
(cm
)RL
(cm
)SD
WT
(g)
VIG
1D
istric
tsSP
GSL
(cm
)RL
(cm
)SD
WT
(g)
VIG
1
Aza
z3.
5012
.35
9.67
0.13
519
47Ain
El-Ara
b1.
3214
.31
14.1
30.
133
2313
Sem
a’an
3.83
14.7
110
.46
0.15
021
73M
anbej
i1.
1213
.36
13.1
30.
117
2225
Al-B
ab1.
1612
.67
12.1
0.09
821
80Te
lA
bia
d3.
8411
.23
9.42
0.12
219
66Raq
qa
1.22
14.6
814
.31
0.10
626
07Te
lA
bia
d1.
1712
.55
12.4
0.11
221
12K
ham
ishli
3.86
13.0
09.
840.
121
2070
Kham
ishli
1.32
14.5
512
.64
0.10
722
39H
asak
eh3.
869.
4511
.25
0.12
418
60H
asak
eh1.
3714
.07
12.6
10.
109
2462
Ras
Al-A
in4.
0211
.19
9.72
0.11
119
62Ras
Al-A
in1.
3814
.79
13.4
90.
114
2562
Mea
n3.
7811
.91
10.0
80.
128
1985
Mea
n1.
2613
.16
13.7
80.
115
2317
Sign
ifica
nce
<0.
001
<0.
001
<0.
001
<0.
001
<0.
001
<0.
001
<0.
001
<0.
001
0.09
6<
0.00
1
Note
:(S
PG
)sp
eed
ofge
rmin
atio
n;(S
L)se
edlin
gsh
ootle
ngt
h;(R
L)se
edlin
gro
otle
ngt
h;(S
DW
T)
seed
ling
dry
wei
ght;
and
(VIG
1)vi
gor
index
1.
680
Dow
nloa
ded
by [
Zew
die
Bis
haw
] at
09:
56 1
3 Se
ptem
ber
2012

TAB
LE1
1Phys
iolo
gica
lqual
ity(v
igor)
ofw
hea
tan
dbar
ley
Seed
colle
cted
from
diffe
rentso
urc
esin
Syria
Whea
tB
arle
y
Seed
sourc
esSP
GSL
(cm
)RL
(cm
)SD
WT
(g)
VIG
1Se
edso
urc
eSP
GSL
(cm
)RL
(cm
)SD
WT
(g)
VIG
1
Gove
rnm
ent
3.94
912
.28
10.1
20.
122
1997
Gove
rnm
ent
––
––
–Fa
rmer
s3.
702
11.5
29.
550.
124
1974
Farm
ers
1.32
114
.22
13.7
30.
136
2469
Tra
der
s4.
066
12.1
79.
330.
119
1982
Tra
der
s1.
275
14.4
213
.15
0.10
925
25O
wn
seed
3.68
611
.810
.30
0.13
419
81O
wn
seed
1.24
513
.67
13.0
80.
113
2280
Mea
n3.
782
11.9
110
.08
0.12
819
85M
ean
1.25
513
.16
13.7
80.
115
2317
Sign
ifica
nce
<0.
001
0.22
0.00
4<
0.00
10.
961
0.20
6<
0.05
0.18
90.
056
0.00
3
Note
:(S
PG
)sp
eed
ofge
rmin
atio
n;(S
L)se
edlin
gsh
ootle
ngt
h;(R
L)se
edlin
gro
otle
ngt
h;(S
DW
T)
seed
ling
dry
wei
ght;
and
(VIG
1)vi
gor
index
1.
681
Dow
nloa
ded
by [
Zew
die
Bis
haw
] at
09:
56 1
3 Se
ptem
ber
2012

682 Z. Bishaw et al.
TABLE 12 Correlation between vigor tests and field emergence in wheat, Syria
SG SPG SL RL SDWT VIG1 VIG2 FE
Standard germination 1 0.88∗ 0.54∗ 0.66∗∗ 0.47∗∗ 0.78∗∗ 0.59∗∗ 0.45∗∗
Speed of germination 1 0.67∗∗ 0.69∗∗ 0.48∗∗ 0.83∗∗ 0.58∗∗ 0.50∗∗
Shoot length 1 0.51∗∗ 0.75∗∗ 0.89∗∗ 0.77∗∗ 0.19Root length 1 0.69∗∗ 0.79∗∗ 0.70∗∗ 0.32∗
Seedling dry weight 1 0.77∗∗ 0.97∗∗ 0.003Vigor index 1 1 0.85∗∗ 0.36Vigor index 2 1 0.11Field emergence 1
Note: ∗,∗∗Significant at P < 0.05 and P < 0.01, respectively; (SG) standard germination; (SPG) speedof germination; (SL) seedling shoot length; (RL) seedling root length; (SDWT) seedling dry weight;(VIG1) vigor index 1; and (FE) field emergence.
TABLE 13 Correlation between vigor tests and field emergence in Barley, Syria
Laboratory tests SG SPG SL RL SDWT VIG1 VIG2 FE
Standard germination 1 0.55∗∗ 0.14∗ 0.13 0.03 0.76∗∗ 0.34∗ 0.26∗∗
Speed of germination 1 0.25∗∗ 0.23∗∗ 0.002 0.53∗∗ 0.18∗ 0.13Shoot length 1 0.72∗ 0.24∗∗ 0.69∗∗ 0.27∗∗ 0.04Root length 1 0.24∗∗ 0.70∗∗ 0.26∗∗ −0.04Seedling dry weight 1 0.19∗∗ 0.95∗∗ 0.03Vigour index 1 1 0.41∗∗ 0.16∗
Vigour index 2 1 0.11Field emergence 1
Note: ∗,∗∗Significant at P < 0.05 and P < 0.01, respectively; (SG) standard germination; (SPG) speedof germination; (SL) seedling shoot length; (RL) seedling root length; (SDWT) seedling dry weight;(VIG1) vigor index 1; and (FE) field emergence.
between standard germination and speed of germination in field emergenceof barley, when seed was artificially aged for a period of 6 or 8 days.
In the formal sector, several vigor tests, such as standard germination,speed of germination, root length, shoot length, and seedling dry weight,have been employed for evaluation of seed quality and field emergence.Correlation coefficients both in wheat and barley indicated the associationbetween vigor tests in seed samples collected from farmers in quantifyingthe quality of the seed and its planting value.
Farmer’s Seed Management and Seed Quality
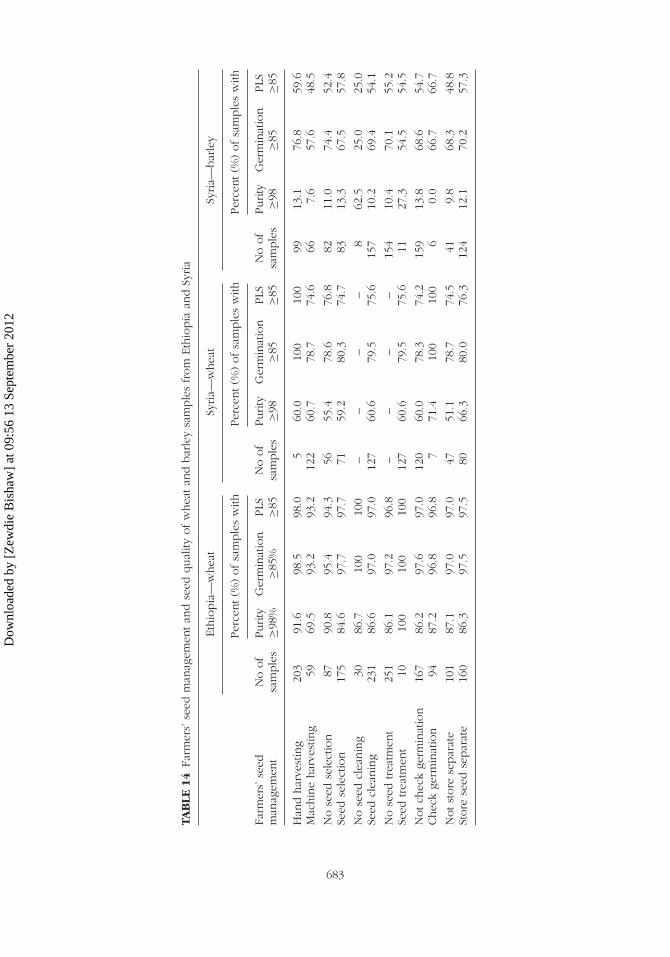
The majority of seed samples collected from farmers during the survey—86.2% (n = 304) of wheat from Ethiopia, 61.7% (n = 206) of wheat, and82.5% (n = 200) of barley from Syria—were from those farmers who usedown-saved seed. Farmers who obtained seed informally used local seed man-agement practices, such as seed selection, cleaning, treatment, or storingseed separately to improve the quality of their planting materials (Table 14).A comparison has been made on physical and physiological quality of seed
Dow
nloa
ded
by [
Zew
die
Bis
haw
] at
09:
56 1
3 Se
ptem
ber
2012
TAB
LE1
4Fa
rmer
s’se
edm
anag
emen
tan
dse
edqual
ityofw
hea
tan
dbar
ley
sam
ple
sfr
om
Eth
iopia
and
Syria
Eth
iopia
—w
hea
tSy
ria—
whea
tSy
ria—
bar
ley
Per
cent(%
)ofsa
mple
sw
ithPer
cent(%
)ofsa
mple
sw
ithPer
cent(%
)ofsa
mple
sw
ith
Farm
ers’
seed
man
agem
ent
No
of
sam
ple
sPurity
≥98%
Ger
min
atio
n≥8
5%PLS ≥85
No
of
sam
ple
sPurity
≥98
Ger
min
atio
n≥8
5PLS ≥85
No
of
sam
ple
sPurity
≥98
Ger
min
atio
n≥8
5PLS ≥85
Han
dhar
vest
ing
203
91.6
98.5
98.0
560
.010
010
099
13.1
76.8
59.6
Mac
hin
ehar
vest
ing
5969
.593
.293
.212
260
.778
.774
.666
7.6
57.6
48.5
No
seed
sele
ctio
n87
90.8
95.4
94.3
5655
.478
.676
.882
11.0
74.4
52.4
Seed
sele
ctio
n17
584
.697
.797
.771
59.2
80.3
74.7
8313
.367
.557
.8
No
seed
clea
nin
g30
86.7
100
100
––
––
862
.525
.025
.0Se
edcl
eanin
g23
186
.697
.097
.012
760
.679
.575
.615
710
.269
.454
.1
No
seed
trea
tmen
t25
186
.197
.296
.8–
––
–15
410
.470
.155
.2Se
edtrea
tmen
t10
100
100
100
127
60.6
79.5
75.6
1127
.354
.554
.5
Notch
eck
germ
inat
ion
167
86.2
97.6
97.0
120
60.0
78.3
74.2
159
13.8
68.6
54.7
Chec
kge
rmin
atio
n94
87.2
96.8
96.8
771
.410
010
06
0.0
66.7
66.7
Notst
ore
separ
ate
101
87.1
97.0
97.0
4751
.178
.774
.541
9.8
68.3
48.8
Store
seed
separ
ate
160
86.3
97.5
97.5
8066
.380
.076
.312
412
.170
.257
.3
683
Dow
nloa
ded
by [
Zew
die
Bis
haw
] at
09:
56 1
3 Se
ptem
ber
2012

684 Z. Bishaw et al.
from those farmers who retained seed on the farm and indicated using differ-ent seed management practices (Table 14). In most cases, the mean physicalpurity and PLS of samples from farmers who did or did not practice a par-ticular seed management were not found to be significantly different (datanot shown). However, there was a large difference in the number of samplesthat maintained the minimum physical purity and germination standards forcertified seed 2. The results indicated that seed cleaning of wheat in Ethiopia,harvesting methods and seed cleaning of barley, and seed treatment of wheatin Syria showed significant differences in germination of seed lots (P < 0.05).On the contrary, it was reported that the crop variety (local or improved),form of seed storage (shelled/unshelled), seed storage facilities (containers),seed selection, pesticide treatment (or use of admixture including smoking),age of the seed, moisture content of the seed, and the region from whichthe samples were collected had significant effects on germination of maize,beans, cowpea, soybean, and groundnut in Ghana, Malawi, and Tanzania(Wright et al. 1995).
Machine harvesting may predispose seed to mechanical damage andloss of germination compared with traditional manual harvesting and thresh-ing. Proper adjustment of equipment and adequate seed moisture contentat harvesting are critical in reducing seed damage. There was some varia-tion in seed quality based on crop harvesting practices followed by farmers.Although the mean physical purity and germination of wheat and barley seedlots from farmers who machine harvested their crops were slightly lower,the seed quality was comparable to manually harvested seed lots both inEthiopia and Syria (data not shown). However, the number of samples thatreached the minimum standard required for certified seed of wheat and bar-ley was substantially lower for samples harvested mechanically (Table 14).The difference was more pronounced in physical purity than in physio-logical quality. Improper handling of seed during harvesting may result insevere loss in seed quality. Fujisaka et al. (1993) found that rice seed sam-ples from farmers who used manual harvesting and threshing had higherphysical purity compared with those that were machine harvested, par-ticularly in relation to weed contamination. Moreover, low germination ofmechanically harvested durum wheat seed was reported in Algeria (Lakhdaret al. 1998) and Morocco (Grass & Tourkmani 1999) and for seed vigor inCanada (Bourgeois, Moes, & Stobbe 1996). The latter reported that seedvigor was reduced when wheat was threshed at a high cylinder speed andconventional combine compared with low cylinder speed and rotary com-bine. Both seedling emergence and grain yield were reduced by 20 plantsm−2 and by 200 kg ha−1, respectively, in plots seeded with kernels threshedat a high cylinder speed compared with kernels threshed at a low cylin-der speed (Bourgeois, Moes, & Stobbe 1996). The agro-climatic differencesmight have also contributed to some of these variations in physiologicalseed quality.
Dow
nloa
ded
by [
Zew
die
Bis
haw
] at
09:
56 1
3 Se
ptem
ber
2012

Farmer’s Seed Sources and Seed Quality Part 1 685
There was no significant difference in mean physical and physiologicalquality of seed samples collected from farmers who cleaned their seed orthose who did not practice cleaning (Table 14). In Ethiopia, 86% and 97% ofseed samples from farmers who cleaned their seed met the minimum phys-ical purity and germination standards, whereas the proportion was 77% and80% for wheat and 10% and 69% for barley in Syria, respectively. The gener-ally poor quality of barley seed samples was recognized, and this contributedto the lower percentage of samples meeting the standard. This indicatedsome weaknesses in the inefficiency of the traditional seed cleaning equip-ment in removing the major contaminants and crop harvesting (manual vs.mechanical) practiced by farmers. It should also be noted that cleaning alonecould not bring the quality of poor seed to a desired level and should becoupled with adequate agronomic practices for seed production. However,the small number of samples from uncleaned seed lots might not give con-clusive evidence for barley samples in Syria. Modern seed cleaning is basedon most prevalent physical characteristics of seed, such as size, shape, andweight, and the contaminating impurities (Boyd et al. 1975). Seed cleaningimproves purity by removing inert matter contaminants and germination byremoving mechanically damaged seeds. The cleaning efficiency in removingthese contaminants, however, requires special skill and equipment.
Table 14 contains results that show a significant number of farmers whoused own seed applied chemical treatment for wheat (n = 127; Syria),checked germination informally (n = 94; Ethiopia), or applied irrigationfor wheat production (n = 84; Syria). Chemical treatment improves phys-iological quality of seed by protecting them against seed- and/or soil-bornepathogens. Germination was significantly better for treated seed, and themean germination for treated wheat seed was 88%. About 80% of the treatedseed samples reached the minimum certified seed requirement. Moreover,of 59 treated seed samples collected from farmers, 83% met the minimumgermination requirement. In Ethiopia, comparison of the results showed nodifference in average germination of wheat samples between farmers whodid check germination and those who did not, i.e., 96%. Similarly, no dif-ference in mean germination was observed between seed samples collectedfrom farmers who did or did not apply irrigation in Syria, except in the num-ber of samples that reached the minimum requirement (83% for irrigated vs.72% for non-irrigated samples). There was no difference in thousand-seedweight between irrigated and non-irrigated samples either.
The storage environment has a significant influence on the quality ofseed, particularly on germination where seed would be predisposed todeteriorative factors, such as high moisture, high temperature, or infesta-tion with storage pests. In Ethiopia, a traditional bin made of interwovenbamboo/sticks internally plastered with a mixture of clay mud and cerealstraw (gotera) is the most popular storage facility, whereas farmers in Syriaused polypropylene bags or jute bags for storage whether seed for planting
Dow
nloa
ded
by [
Zew
die
Bis
haw
] at
09:
56 1
3 Se
ptem
ber
2012

686 Z. Bishaw et al.
was stored separately or in bulk with grain. In Ethiopia, the storage periodextends over a minimum of seven months (November to June), whereasin Syria for over five months (June to November) during a period of lowrelative humidity. Wheat and barley germination results showed no signifi-cant difference among seed lots stored together with grain or separate usingdifferent storage structures. In our studies, most of the wheat seed samplescollected from farmers in Ethiopia maintained high standards of germinationcompared with that of wheat and barley seed samples from Syria. Tsega(1994) also found that, in the highlands of Ethiopia, loss of viability betweenharvesting time and after seven months of storage was minimal, with a netincrease in moisture content both in wheat and barley seed samples.
These differences in seed quality could be attributed to differences instorage facilities, as in Syria most of the wheat and barley seed was storedin polypropylene or jute sacks. Tsega (1994) found that legumes (Lathyrusand lentil) stored in sacks showed the highest loss of germination comparedwith other traditional storage facilities. Moreover, Wright et al. (1995) indi-cated that sacks were less suitable for storage of treated or untreated maizeseed in Ghana. In general, seed in jute or polypropylene sacks are vulner-able to pest attack and change in moisture content relative to the ambienttemperature and relative humidity that has a detrimental effect on the physi-ological quality of seed. Wright et al. (1995) indicated that moisture contenthad a significant effect on germination; and the higher the moisture content,the lower the germination of on-farm saved seed. In Nepal, investigation ontraditional storage practices showed that wheat seed samples stored on-farmin mud structures increased in moisture content with associated drastic fallin germination during storage under conditions of high humidity and tem-perature (Tripathi & Powell 1999). Farmers should be trained in seed storageand encouraged to have adequate facilities to maintain seed quality.
Several workers have reported a decline in germination because ofstorage pests. Apart from seed storage facilities, analyses were also madeon germination of wheat and barley seed samples between farmers whoindicated having storage pest problems and those who didn’t. The meangermination in all cases was comparable between those farmers who hadstorage pest problems and those who didn’t. The results may indicate thatfarmers’ seed storage management practices may not necessarily contributesignificantly to the improvement of the physical and physiological qualityof the seed. Kashyap and Duhan (1994) reported Sitophilus oryzae andRhizopertha dominica as most prevalent wheat seed storage pests in humidareas, and insect-damaged seed had exhibited a significant reduction inphysiological seed quality.
In Syria, few farmers were concerned about the physiological quality oftheir seed and tested germination (6%) because they may not experience theproblem or consider it a cause for poor crop establishment (Bishaw, Struik,& van Gastel 2011). Walker and Tripp (1997) also reported that only 10%
Dow
nloa
ded
by [
Zew
die
Bis
haw
] at
09:
56 1
3 Se
ptem
ber
2012

Farmer’s Seed Sources and Seed Quality Part 1 687
of farmers considered poor field establishment associated with poor seedquality, although the figure can reach 25% among cowpea farmers in Ghana.In Ethiopia, one third of farmers used different innovative approaches todetermine the germination of their seed lots before planting (Bishaw, Struik,& van Gastel 2010). Mathur and Talukder (2002) used jute mats as a “quickmethod” for rice seed in Bangladesh, and this was found to be the quick-est test completed within seven days compared with official methods. It isimportant that farmers are trained in such simple and practical approachesfor testing the quality of their seeds before planting.
CONCLUSION
Wheat and barley seed samples collected from farmers in major crop produc-tion regions and districts showed remarkable significant regional differencesin physical purity and physiological seed quality. Empirical evidence showsthat crop production environments and management practices are major fac-tors that affect not only yield but also seed quality. Several environmentalfactors like temperature, rainfall, wind, light, etc., influence flowering, polli-nation, seed setting, ripening, and disease infection with a significant effecton seed quality. Crop management practices such as planting, fertilization,and weed control as well as harvesting, threshing, cleaning, treatment, andstorage have an impact on seed quality. For example, almost all seed sam-ples from Ethiopia reached the minimum physical purity and germinationstandards prescribed for the formal sector, whereas a substantial propor-tion of samples, particularly of barley in Syria, did not meet the standards.In Ethiopia, most farmers use manual harvesting, threshing, and winnowing,handling small quantities of seed compared to farmers who predominantlyuse machine harvesting in Syria with its veritable consequences on seedquality (purity, germination, vigor). The differences in seed quality acrossregions could arise from the environmental conditions under which the cropis produced and crop-handling practices followed by farmers. Hence seedproduction should be located in areas with favorable climatic regions withcool and dry conditions and be free from abiotic and biotic stresses duringthe entire crop growth period.
The physical and physiological seed quality tests did not show any sig-nificant difference in the quality of seed obtained from different sources witha few exceptions. The majority of seed samples from the formal sector metthe minimum standards but was not significantly different from seed fromthe informal sources. Wheat and barley seed samples collected from infor-mal seed sources from farmers who followed different crop managementpractices produced in most cases seed of comparable quality to seed fromthe formal sector. A substantial proportion of seed samples from the infor-mal sector also reached the minimum physical and physiological quality of
Dow
nloa
ded
by [
Zew
die
Bis
haw
] at
09:
56 1
3 Se
ptem
ber
2012

688 Z. Bishaw et al.
the formal sector (certified seed 2). From these results, it can be concludedthat: (a) the seed from the formal sector may have the highest physicalpurity compared to seed obtained from informal sources (neighbors/farmers,traders/markets, or own saved seed); (b) the seed from the formal sector hashigh physical purity but showed some weaknesses in physiological quality(germination); (c) seed from the informal sector could exhibit high qualitythat could be comparable to the formal sector; and (d) seed obtained frominformal sector may have lower physical purity but is comparable to formalsector in germination.
The seed produced by the formal sector should be of better qualitythan that of the informal sector to persuade farmers to purchase seed. Theresults of seed quality from the informal sector, however, raise fundamentalissues on the quality parameters of the formal sector. Most seed samples frominformal sources showed remarkably high physical purity and germinationcomparable to seed from the formal sector except for physical purity inbarley. Some seed samples from the informal sector had marginally lowerquality than what is prescribed in the national standard (certified seed 2).For example, the physical purity standard in Syria (98%) is higher thanin Ethiopia (97%), leading to a substantial number of seed samples fromthe informal sector falling below the standard. It is important that the real-istic seed standards adopted for certified seed are tailored to and reflectthe needs of diverse seed sectors and the level of the agricultural develop-ment and available seed production technology in a country, rather than anation prescribing non-achievable high standards. At present, national seedstandards are set for physical purity and germination where seed testingis practiced as a routine, but germination tests quite often do not predictperformance of the seed lot under adverse field conditions. In addition toregular test for germination, vigor tests that predict field performance shouldbe incorporated in the seed quality tests.
Most farmers who used own saved or obtained seed through localexchange employed different seed management practices, such as seedselection, seed cleaning, seed treatment, or separate storage. Farmers’ seedselection and cleaning practices appeared to be relatively effective in at leastproducing seed, which is as clean as that from the formal sector. However,such generalizations conceal the fundamental weaknesses of the local seedmanagement practices that need to be addressed to improve seed quality inthe informal sector, particularly in reference to physical purity (contamina-tion with noxious and common weeds). In general, a comparison across awide spectrum of on-farm seed management practices did not yield signif-icant differences in the quality of seed obtained from the informal sector.It appeared that the cleaning efficiency of traditional equipment in removingcontaminants including noxious and common weeds from the seed is obvi-ously low. Considering that the informal sector is a major supplier of seedfor planting, it is imperative to improve the quality of seed produced on the
Dow
nloa
ded
by [
Zew
die
Bis
haw
] at
09:
56 1
3 Se
ptem
ber
2012

Farmer’s Seed Sources and Seed Quality Part 1 689
farm. Making available locally manufactured simple and cheap cleaning andtreatment equipment and provision of training in “good practices” for on-farm seed production, and seed quality testing would help farmers producequality seed used by the informal sector.
The analysis of the wheat and barley seed systems in Ethiopia and Syriademonstrated that the informal sector is a major supplier of seed for plantingof both crops in any given year. The study revealed farmers’ knowledge inseed management and competence in producing quality seed comparable tocertified seed from the formal sector. The results would enable us to devisealternative approaches in organizing a low-cost seed production and mar-keting system using farmers’ skill to accelerate the adoption and diffusion ofmodern varieties. National policies and regulatory frameworks should advo-cate the integration of formal and informal seed system to provide betterchoices to farmers.
REFERENCES
Abdul-Baki, A. A., and J. D. Anderson. 1973. Vigor determination in soybean andmultiple criteria. Crop Sci. 13:630–633.
Ageeb, O. A., A. B. Elahmadi, M. B. Solh, and M. C. Saxena (Eds.). 1996. Wheat pro-duction and improvement in the Sudan. Proceedings of the national researchreview workshop, 27-30 August 1995, Wad Medani, Sudan. Aleppo, Syria:International Center for Agricultural Research in the Dry Areas (ICARDA).
Al-Faqeeh, T. M. 1997. A survey of lentil seed quality in Jordan. MSc thesis, Universityof Jordan, Amman, Jordan.
Almekinders, C. J. M., N. P. Louwaars and G. H. de Bruijin. 1994. Local seed systemsand their importance for an improved seed supply in developing countries.Euphytica 78:207–216.
Badebo, A., and P. O. Lindeman. 1987. Seed survey of wheat in Arsi. SEAD publicationno. 4. Asela, Ethiopia: SEAD
Bishaw, Z. 2004. Wheat and barley seed systems in Ethiopia and Syria. PhD thesis,Wageningen University. Wageningen, the Netherlands.
Bishaw, Z., P. C. Struik, and A. J. G. van Gastel. 2011. Wheat and barley seed systemsin Syria: Farmers’ varietal perception, seed sources and seed management. Int.J. Plant Prod. 5(4): 323–347.
Bishaw, Z, P. C. Struik and A. J. G. van Gastel. 2010. Wheat seed system in Ethiopia:Farmers’ varietal perception, seed sources, and seed management. J. New Seeds:11(4): 281–327.
Bourgeois, L., J. Moes, and E. H. Stobbe. 1996. Impact of threshing on hard redspring wheat seed vigor. Can. J. Plant Sci. 76(2): 215–221.
Curtis, B. C., S. Rajaram, and H. G. Macpherson (Eds.). 2002. Bread wheat:Improvement and production. Plant production and protection series no. 30.Rome, Italy: Food and Agriculture Organization (FAO).
Deb, U. K. (Ed.). 2002. Rice seed delivery system and seed policy in Bangladesh.Dhaka, Bangladesh: Center for Policy Dialogue (CPD).
Dow
nloa
ded
by [
Zew
die
Bis
haw
] at
09:
56 1
3 Se
ptem
ber
2012

690 Z. Bishaw et al.
Ensermu, R., W. Mwangi, H. Verkuijl, M. Hassena, and Z. Alemayehu. 1998.Farmers’ wheat seed sources and seed management in Chilalo awraja, Ethiopia.Addis Ababa, Ethiopia: International Maize and Wheat Improvement Center(CIMMYT).
Fiala, F. 1987. Handbook of vigor test methods. Zürich, Switzerland: InternationalSeed Testing Association (ISTA).
Foster, N. R., L. A. Burchett, and G. M. Paulsen. 1998. Seed quality of hard red wheatafter incipient pre-harvest sprouting. J. Appl. Seed Prod. 16:87–91.
Fujisaka, S., R. A. Guino, R. T. Lubigan, and K. Moody. 1993. Farmers’ rice seed man-agement practices and the resulting weed seed contamination in the Philippines.Seed Sci. Technol. 21:149–157.
Grass, L., and M. Tourkmani. 1999. Mechanical damage assessment in rejected durumwheat seed lots in Morocco. Seed Sci. Technol. 27: 991–997.
Grass, L., and. J. S. Burris. 1995. Effect of heat stress during seed development andmaturation on wheat (Triticum durum) seed quality: I. seed germination andseedling vigor. Can. J. Plant Sci. 75:821–829.
Hampton, J. G. 1998. Seed quality standards: Their use, misuse, and the future.J. Appl. Seed Prod. 16:31–48.
Hasan, B. M. A. 1995. A survey of wheat seed quality in Jordan. MSc thesis, Universityof Jordan, Amman, Jordan.
International Center for Agricultural Research in the Dry Areas (ICARDA). 2002.WANA catalogue of field and seed standards (cereals, legumes, oilseeds, forages,and vegetables). Aleppo, Syria: ICARDA.
International Maize and Wheat Improvement Center (CIMMYT). 1999. Tenthregional wheat workshop for eastern, central, and southern Africa. Addis Ababa,Ethiopia: CIMMYT.
International Maize and Wheat Improvement Center (CIMMYT). 2000. Eleventhregional wheat workshop for eastern, central, and southern Africa. Addis Ababa,Ethiopia: CIMMYT.
International Seed Testing Association (ISTA). 1999. International rules for seedtesting 1999. Zürich, Switzerland: ISTA.
Khah, E. M., E. H. Roberts, and R. H. Ellis. 1989. Effects of seed aging on growthand yield of spring wheat at different plant population densities. Field CropsRes. 20:175–190.
Kim, S. H., Z. R. Choe, J. K. Kang, L. O. Copeland, and S. G. Elias. 1994. Multipleseed vigor indices to predict field emergence and performance in barley. SeedSci. Technol. 22:59–69.
Kugbei, S. 2011. Efficiency of wheat seed production and crop diversification inAfghanistan. J . Crop Improv. 25(3): 191–201.
Lakhdar, L. C., A. Arezki, and L. Mohamed. 1998. Effect of mechanical damage ongermination of durum wheat seed. Seed Info 15:15–16.
Maguire, J. D. 1962. Speed of germination, an aid in selection and evaluation forseedling emergence and vigor. Crop Sci. 2:176–177.
Makkawi, M., M. El Balla, Z. Bishaw, and A. J.G. van Gastel. 1999. The relationshipbetween seed vigor tests and field emergence in lentil (Lens culinaris Medik).Seed Sci. Technol. 27:657–668.
Dow
nloa
ded
by [
Zew
die
Bis
haw
] at
09:
56 1
3 Se
ptem
ber
2012

Farmer’s Seed Sources and Seed Quality Part 1 691
Mathur, S. B. and M. H. Talukder. 2002. Jute mat, a quick method for testinggermination of rice seeds by the farmers in Bangladesh. Seed Sci. Technol.30:459–462.
Mekbib, F. 2008. Farmers’ seed system of sorghum [Sorghum bicolor (L.) Moench] inthe center of diversity: II. seed quality, storage, protection and security. J. NewSeeds 9(3): 191–211.
Ndjeunga, J. 2002. Local village seed systems and pearl millet seed quality in Niger.Exp. Agric. 38:149–162.
Oleksiak, T. 1998. wplyw kwalifikowanego materialu siewnego na plonowanie zboz[Influence of certified seeds on cereal yields]. Biuletyn Instytutu Hodowli iAkilimatyzacji Roslin. 208: 3–9.
Ram, C., O. Singh, R. P. S. Kharb, P. Kumari, and T. P. Yadava. 1991. Seedling vigorin pigeon pea. Seed Sci. Technol. 19:627–631.
Sahile, G., and W. Tilahun. 1997. Results of a weed survey in the southeastern wheatplain of Asasa woreda. Arem 2/3: 100–102.
Srivastava, J. P., and L. T. Simarski (Eds.). 1986. Seed production technology. Aleppo,Syria: International Center for Agricultural Research in the Dry Areas (ICARDA).
Stanelle, J. R., R. L. Vanderlip, L. A. Burchett, and J. P. Shroyer. 1984. Kansas wheatseed: Comparison of the quality of wheat seed planted in 1973 and 1984. J. Appl.Seed Prod. 6:62–67.
Steiner, J. J. D. F. Grabe, and M. Tulo. 1989. Single and multiple vigor tests forpredicting seedling emergence of wheat. Crop Sci. 29:782–786.
Thomson, J. R. 1979. An introduction to seed technology. Glasgow, UK: Leonard Hill.Tripathi, J., and A. A. Powell 1999. Influence of seed storage on the delivery of qual-
ity seed in the informal sector in Nepal. In Proceedings of the 1999 World SeedCongress, 6-8 September 1999, Cambridge, UK , 121–137. Zürich, Switzerland:International Seed Testing Association (ISTA).
Tripp, R, N. P. Louwaars, W. J. van der Burg, D. S. Virk and J. R. Witcombe. 1997.Alternatives for seed regulatory reform: An analysis of variety testing, variety reg-ulation and seed quality control. Agricultural Research and Extension Network.Network Paper No. 69. London, UK: Overseas Development Institute (ODI).
Tsega, M. 1994. An inventory and investigation of the optimum local seed storagemethods in Wello and Shewa administrative regions. Addis Ababa, Ethiopia:SOS/Ethiopia.
van Gastel, A. J. G., and Z. Bishaw. 1994. Seed Survey in Syria. In Seed unit annualreport for 1994, 13–16. Aleppo, Syria: International Center for AgriculturalResearch in the Dry Areas (ICARDA).
Walker, D. J., and R. Tripp. 1997. Seed management by small-scale farmers in Ghanaand Zambia 207-215. In International workshop on seed security for food secu-rity, 30 November–1 December 1997, Florence, Italy. Rome, Italy: Food andAgriculture Organization (FAO).
Wicki, L., and H. Dudek. 2009. Factors influencing productivity of cereals in Polishagriculture. Econ. Sci. Rural Develop. 20:79–88.
Woldeselassie, Y. S. 1999. Evaluation of status and quality of barley seed used bythe Northern and Central Ethiopian farmers. MSc thesis, University of Jordan,Amman, Jordan.
Dow
nloa
ded
by [
Zew
die
Bis
haw
] at
09:
56 1
3 Se
ptem
ber
2012

692 Z. Bishaw et al.
Wright, M., L. Delimini, J. Luhanga, C. Mushi, and H. Tisini. 1995. The quality offarmer saved seed in Ghana, Malawi, and Tanzania. Chatham, UK: NationalResources Institute (NRI) and Overseas Development Institute (ODI).
Wright, M.,. T. Donaldson, E. Cromwell, and J. New. 1994. The retention and care ofseeds by small-scale farmers. Chatham, UK: National Resources Institute (NRI)and Overseas Development Institute (ODI).
Wright, M., and P. Tyler. 1994. Traditional seed saving practices in northern Ghanaand central Malawi. Chatham, UK: National Resources Institute (NRI) andOverseas Development Institute (ODI).
Dow
nloa
ded
by [
Zew
die
Bis
haw
] at
09:
56 1
3 Se
ptem
ber
2012