Ocean redox structure across the Late Neoproterozoic Oxygenation Event: A nitrogen isotope...
32
Earth and Planetary Science Letters 396 (2014) 1–13 Contents lists available at ScienceDirect Earth and Planetary Science Letters www.elsevier.com/locate/epsl Ocean redox structure across the Late Neoproterozoic Oxygenation Event: A nitrogen isotope perspective Magali Ader a,∗ , Pierre Sansjofre a,b,c , Galen P. Halverson d , Vincent Busigny a , Ricardo I.F. Trindade c , Marcus Kunzmann d , Afonso C.R. Nogueira e a Institut de Physique du Globe de Paris, Sorbonne Paris Cité, University Paris Diderot, UMR 7154 CNRS, 1 rue Jussieu, 75238 Paris, France b Departamento de Geofísica, Instituto de Astronomia, Geofísica e Ciências Atmosféricas, Universidade de São Paulo, Rua do Matão 1226, 05508-900 São Paulo, Brazil c Laboratoire Domaines Océaniques, Université de Bretagne Occidentale, UMR 6538, 29820 Plouzané, France d Department of Earth and Planetary Sciences/Geotop, McGill University, 3450 University Street, Montréal, QC, H3A 0E8 Canada e Faculdade de Geologia, Instituto de Geociências, Universidade Federal do Pará, CEP 66.075-110, Belém, Brazil article info abstract Article history: Received 28 November 2013 Received in revised form 12 March 2014 Accepted 18 March 2014 Available online xxxx Editor: B. Marty Keywords: nitrogen isotopes Neoproterozoic ocean oxygenation nitrogen biogeochemical cycle paleoceanography The end of the Neoproterozoic Era (1000 to 541 Ma) is widely believed to have seen the transition from a dominantly anoxic to an oxygenated deep ocean. This purported redox transition appears to be closely linked temporally with metazoan radiation and extraordinary perturbations to the global carbon cycle. However, the geochemical record of this transition is not straightforward, and individual data sets have been variably interpreted to indicate full oxygenation by the early Ediacaran Period (635 to 541 Ma) and deep ocean anoxia persevering as late as the early Cambrian. Because any change in marine redox structure would have profoundly impacted nitrogen nutrient cycling in the global ocean, the N isotope signature of sedimentary rocks (δ 15 N sed ) should reflect the Neoproterozoic deep-ocean redox transition. We present new N isotope data from Amazonia, northwest Canada, northeast Svalbard, and South China that span the Cryogenian glaciations (∼750 to 580 Ma). These and previously published data reveal a N- isotope distribution that closely resembles modern marine sediments, with a mode in δ 15 N close to +4❤ and range from −4 to +11❤. No apparent change is seen between the Cryogenian and Ediacarian. Data from earlier Proterozoic samples show a similar distribution, but shifted slightly towards more negative δ 15 N values and with a wider range. The most parsimonious explanation for the similarity of these N- isotope distribution is that as in the modern ocean, nitrate (and hence O 2 ) was stable in most of the middle–late Neoproterozoic ocean, and possibly much of Proterozoic Eon. However, nitrate would likely have been depleted in partially restricted basins and oxygen minimum zones (OMZs), which may have been more widespread than in the modern ocean. © 2014 Elsevier B.V. All rights reserved. 1. Introduction It is widely argued that the appearance of animals in the ge- ological record is linked to a major step in the oxygenation of Earth’s surface environment, known as the Neoproterozoic Oxy- genation Event (NOE) (Canfield et al., 2007, 2008; Och and Shields- Zhou, 2012; Scott et al., 2008). The NOE is more difficult to document in the geological record than its early Paleoprotero- zoic counterpart, the Great Oxidation Event (GOE), whose onset is well established based on the sedimentary record of redox- * Corresponding author at: Équipe de géochimie des isotopes stables, Institut de Physique du Globe de Paris, 1 rue Jussieu, 75238 Paris, France. Tel.: +33 (0)1 83 95 75 06. E-mail address: [email protected] (M. Ader). sensitive detrital minerals and mass independent fractionation of sulfur isotopes (e.g. Farquhar et al., 2000; Lyons et al., 2014). Al- though the NOE has not been formally defined, one criterion is the timing of ventilation of the deep ocean with sufficient dissolved oxygen to accommodate the earliest animals (Och and Shields- Zhou, 2012). Whereas the cause-and-effect relationship between oxygenation and animal evolution and the oxygen threshold re- quired for early animals are still debated (e.g., Butterfield, 2009; Sperling et al., 2013), eukaryotic diversification and the oxygena- tion of the environment must have been closely coupled through a complex network of biogeochemical feedbacks linked through the origin, export, decay and burial of organic matter (Butterfield, 2009; Close et al., 2011; Logan et al., 1995; Pawlowska et al., 2013). Iron speciation data from Neoproterozoic mudstones suggest a transition from dominantly anoxic and ferruginous deep oceans http://dx.doi.org/10.1016/j.epsl.2014.03.042 0012-821X/© 2014 Elsevier B.V. All rights reserved.
Transcript of Ocean redox structure across the Late Neoproterozoic Oxygenation Event: A nitrogen isotope...
Earth and Planetary Science Letters 396 (2014) 1–13
Contents lists available at ScienceDirect
Earth and Planetary Science Letters
www.elsevier.com/locate/epsl
Ocean redox structure across the Late Neoproterozoic OxygenationEvent: A nitrogen isotope perspective
Magali Ader a,∗, Pierre Sansjofre a,b,c, Galen P. Halverson d, Vincent Busigny a,Ricardo I.F. Trindade c, Marcus Kunzmann d, Afonso C.R. Nogueira e
a Institut de Physique du Globe de Paris, Sorbonne Paris Cité, University Paris Diderot, UMR 7154 CNRS, 1 rue Jussieu, 75238 Paris, Franceb Departamento de Geofísica, Instituto de Astronomia, Geofísica e Ciências Atmosféricas, Universidade de São Paulo, Rua do Matão 1226, 05508-900 São Paulo,Brazilc Laboratoire Domaines Océaniques, Université de Bretagne Occidentale, UMR 6538, 29820 Plouzané, Franced Department of Earth and Planetary Sciences/Geotop, McGill University, 3450 University Street, Montréal, QC, H3A 0E8 Canadae Faculdade de Geologia, Instituto de Geociências, Universidade Federal do Pará, CEP 66.075-110, Belém, Brazil
a r t i c l e i n f o a b s t r a c t
Article history:Received 28 November 2013Received in revised form 12 March 2014Accepted 18 March 2014Available online xxxxEditor: B. Marty
Keywords:nitrogen isotopesNeoproterozoicocean oxygenationnitrogen biogeochemical cyclepaleoceanography
The end of the Neoproterozoic Era (1000 to 541 Ma) is widely believed to have seen the transition froma dominantly anoxic to an oxygenated deep ocean. This purported redox transition appears to be closelylinked temporally with metazoan radiation and extraordinary perturbations to the global carbon cycle.However, the geochemical record of this transition is not straightforward, and individual data sets havebeen variably interpreted to indicate full oxygenation by the early Ediacaran Period (635 to 541 Ma)and deep ocean anoxia persevering as late as the early Cambrian. Because any change in marine redoxstructure would have profoundly impacted nitrogen nutrient cycling in the global ocean, the N isotopesignature of sedimentary rocks (δ15Nsed) should reflect the Neoproterozoic deep-ocean redox transition.We present new N isotope data from Amazonia, northwest Canada, northeast Svalbard, and South Chinathat span the Cryogenian glaciations (∼750 to 580 Ma). These and previously published data reveal a N-isotope distribution that closely resembles modern marine sediments, with a mode in δ15N close to +4�and range from −4 to +11�. No apparent change is seen between the Cryogenian and Ediacarian. Datafrom earlier Proterozoic samples show a similar distribution, but shifted slightly towards more negativeδ15N values and with a wider range. The most parsimonious explanation for the similarity of these N-isotope distribution is that as in the modern ocean, nitrate (and hence O2) was stable in most of themiddle–late Neoproterozoic ocean, and possibly much of Proterozoic Eon. However, nitrate would likelyhave been depleted in partially restricted basins and oxygen minimum zones (OMZs), which may havebeen more widespread than in the modern ocean.
© 2014 Elsevier B.V. All rights reserved.
1. Introduction
It is widely argued that the appearance of animals in the ge-ological record is linked to a major step in the oxygenation ofEarth’s surface environment, known as the Neoproterozoic Oxy-genation Event (NOE) (Canfield et al., 2007, 2008; Och and Shields-Zhou, 2012; Scott et al., 2008). The NOE is more difficult todocument in the geological record than its early Paleoprotero-zoic counterpart, the Great Oxidation Event (GOE), whose onsetis well established based on the sedimentary record of redox-
* Corresponding author at: Équipe de géochimie des isotopes stables, Institut dePhysique du Globe de Paris, 1 rue Jussieu, 75238 Paris, France. Tel.: +33 (0)1 83 9575 06.
E-mail address: [email protected] (M. Ader).
http://dx.doi.org/10.1016/j.epsl.2014.03.0420012-821X/© 2014 Elsevier B.V. All rights reserved.
sensitive detrital minerals and mass independent fractionation ofsulfur isotopes (e.g. Farquhar et al., 2000; Lyons et al., 2014). Al-though the NOE has not been formally defined, one criterion is thetiming of ventilation of the deep ocean with sufficient dissolvedoxygen to accommodate the earliest animals (Och and Shields-Zhou, 2012). Whereas the cause-and-effect relationship betweenoxygenation and animal evolution and the oxygen threshold re-quired for early animals are still debated (e.g., Butterfield, 2009;Sperling et al., 2013), eukaryotic diversification and the oxygena-tion of the environment must have been closely coupled througha complex network of biogeochemical feedbacks linked throughthe origin, export, decay and burial of organic matter (Butterfield,2009; Close et al., 2011; Logan et al., 1995; Pawlowska et al., 2013).
Iron speciation data from Neoproterozoic mudstones suggest atransition from dominantly anoxic and ferruginous deep oceans
2 M. Ader et al. / Earth and Planetary Science Letters 396 (2014) 1–13
with prevalent sulfidic (euxinic) conditions in continental marginsettings (Planavsky et al., 2011; Poulton and Canfield, 2011) todominantly anoxic and ferruginous deep oceans with only occa-sional evidence for euxinic conditions in the early–middle Neopro-terozoic (Canfield et al., 2008), followed by deep-ocean ventilationin the late Ediacaran (Canfield et al., 2007). However, these dataonly provide information about local depositional redox conditionsand do not bear directly on the state of the deep ocean. Tracemetal abundances (Mo, U, V, and Cr) in euxinic sediments, al-though sensitive to local conditions, are also strongly dependent onthe volume of oxygenated water masses, hence they bear on globalredox conditions in the oceans (Algeo and Rowe, 2012). A series ofseparate studies and compilations of trace metal data have beenpublished recently. All show a dramatic increase in abundancesin the Ediacaran first interpreted to record deep ocean ventila-tion (635–541 Ma; Scott et al., 2008; Och and Shields-Zhou, 2012;Sahoo et al., 2012; Partin et al., 2013), broadly consistent withiron speciation data. Yet, data from some individual basins vari-ably indicate persistently anoxic (Li et al., 2010; Johnston et al.,2013) versus oxygenated (Johnston et al., 2012; Sansjofre et al.,2014) bottom-waters throughout most of the Ediacaran Period.Other data imply widespread oxygen-deficient conditions in theearliest Cambrian (e.g. Schroder and Grotzinger, 2007; Cremoneseet al., 2013) despite the appearance of complexly burrowing bi-laterians. An emerging model is that anoxic conditions on con-tinental platforms was locally controlled (Kah and Bartley, 2011;Shen et al., 2011), the deep ocean being pervasively oxygenated,but with a low oxygen concentration preventing the stabilizationof oxic conditions in platforms throughout the Ediacaran Period(Johnston et al., 2012, 2013). Recent modeling coupled with tracemetal compilations further suggests that no more than 40% of thepre-NOE seafloor could have been anoxic and no more than 10%euxinic (Partin et al., 2013; Reinhard et al., 2013). These modelsand existing data thus allow for the possibility that much of theglobal ocean may have been oxygenated prior to the Ediacaran Pe-riod.
We have applied the nitrogen isotope system to the question ofthe NOE because the N-isotopic composition of marine sediments(δ15Nsed; where the standard delta notation and normalization toatmospheric N2 is used; Mariotti et al., 1981) is strongly depen-dent on the nitrogen biogeochemical cycle in the water column,itself controlled by the ocean redox structure (Boyle et al., 2013;Canfield et al., 2010; Fennel et al., 2005; Quan and Falkowski,2009). Although the present day nitrogen cycle is highly complexand remains poorly understood in detail (e.g. Lam and Kuypers,2011; Sigman et al., 2009a), the current understanding of its ba-sic features and of its isotopic imprint in the sedimentary record(Galbraith et al., 2008; Sigman et al., 2009b) have already moti-vated the application of δ15Nsed to elucidate nitrogen biogeochem-ical cycling in past oceans. Nitrogen isotopes have been appliedto the Phanerozoic (e.g. Algeo et al., 2008; Higgins et al., 2012;Junium and Arthur, 2007; Quan et al., 2008) and Precambrianrecords (Beaumont and Robert, 1999; Busigny et al., 2013; Garvinet al., 2009; Godfrey and Falkowski, 2009; Godfrey et al., 2013;Kump et al., 2011; Papineau et al., 2009, 2013; Stüeken, 2013;Thomazo et al., 2009, 2011) as a proxy for both ocean redoxand nitrogen biogeochemistry. Here we add a new nitrogen iso-tope dataset from ∼750 to 580 Ma strata from multiple cratonsto a growing Neoproterozoic database of both bulk sedimentary(δ15Nsed) and kerogen (δ15Nker) nitrogen isotope data (Cremoneseet al., 2013; Kikumoto et al., 2014; Spangenberg et al., 2014) to testwhether the NOE is recorded in nitrogen isotope signatures. Theseresults show that the δ15Nsed distributions for the Cryogenian andthe Ediacaran resemble one another and that documented in themodern ocean.
1.1. Isotope biogeochemistry of the nitrogen oceanic cycle
Nitrogen-isotopic compositions of nitrate, particulate organicmatter and surface sediments have been extensively studied tocharacterize the nitrogen cycle in present oceans and its transcrip-tion into the sedimentary record (Fig. 1a, e.g. Robinson et al., 2012;Somes et al., 2010; Tesdal et al., 2013; Thunell et al., 2004). Belowwe summarize the basic processes and pathways and associatedisotope fractionation (expressed using the enrichment factor nota-tion in �, εa–b ≈ δ15Na–δ15Nb) in the oceanic nitrogen cycle.
The initial source of all bioavailable-N to the oceans is thefixation of atmospheric N2 (N2-fixation) by aerobic or anaero-bic autotrophs, such as cyanobacteria, which transform molecu-lar N2 into organic matter (via NH+
4 ) with a small isotope frac-tionation (εorg–N2 ∼ −4 to 0�; e.g. Zerkle et al., 2008). Otherprimary photosynthetic organisms assimilate remineralized formsof nitrogen mostly as NO−
3 or NH+4 . The mineralization of or-
ganic matter produces NH+4 (ammonification) with no net iso-
tope fractionation owing to its efficiency (Möbius, 2013). If NH+4
remains stable it can then be assimilated with an isotope ef-fect that increases strongly with its availability (εorg–NH4 ∼ 0�to −27�) such that the organic matter can be markedly 15N-depleted where NH+
4 is abundant (Pennock et al., 1996). The NH+4
may also be oxidized. If this oxidation is not complete, the resid-ual NH+
4 will be enriched in 15N, because the first oxidationstep to nitrite (NO−
2 ) involves a strong fractionation (εNO2–NH4 ∼−41� to −13�; Casciotti et al., 2003; Mariotti et al., 1981;Santoro and Casciotti, 2011). In oxic environments, this oxidation isaccomplished by nitrification (i.e. sequential oxidation to NO−
2 andNO−
3 ) and goes to completion, unless ammonium is concurrentlyassimilated as a nutrient. Subsequent NO−
3 assimilation entailsfractionation with εorg–NO−
3between 0 and −8� in NO−
3 -limited
and NO−3 -replete conditions, respectively (Pennock et al., 1996;
Somes et al., 2010). Under dysoxic conditions (i.e. typically inOMZs or within redox transition zones), NO−
3 as well as availableNH+
4 and NO−2 are converted into gaseous species (NO2 and/or N2)
by an incompletely understood combination of metabolic pathwaysthat include heterotrophic denitrification and anammox (anaerobicoxidation of NH+
4 by NO−2 ), nitrification, nitrate reduction to NH+
4 ,chemolithotrophic sulfide-dependent denitrification, co-oxidationof methane and ammonium, and most probably other metabolismsyet to be indentified (Lam et al., 2009; Lam and Kuypers, 2011;Lavik et al., 2009; Mandernack et al., 2009; Wenk et al., 2013).In present day OMZs where nitrate consumption does not reachcompletion, the net result of these processes is a pronounced15N-enrichment in the residual NO−
3 pool (Voss et al., 2001) sim-ilar to that of the experimentally determined for heterotrophicdenitrification (εNO3–N2 ∼ +15 to +30�) (Granger et al., 2008;Mariotti et al., 1981). When NO−
3 consumption proceeds to com-pletion, as in anoxic porewaters, hardly any isotope effect is ex-pressed (Lehmann et al., 2007). Finally, within stable redox tran-sition zones, nitrate (from above) and ammonium (from below)are also near-quantitatively converted into N2 or N2O resultingin a discrete zone of 15N-enrichment in nitrate and ammonium(εNO3–N2 ∼ +10�; εNH4–N2 ∼ +10�) tied to decreasing concen-trations (Fuchsman et al., 2008; Thunell et al., 2004; Wenk et al.,2014).
The ocean’s redox structure thus tightly controls the nitro-gen cycle through the complex network of metabolic pathways bywhich nitrogen flows between reservoirs. The local redox condi-tions determine the dissolved inorganic nitrogen speciation, nitratebeing stable in oxic waters and ammonium in anoxic waters. Thenature (i.e. OMZs versus redox transition zones), location (shallowversus deep), and spatial extent of dysoxic zones determine the
M. Ader et al. / Earth and Planetary Science Letters 396 (2014) 1–13 3
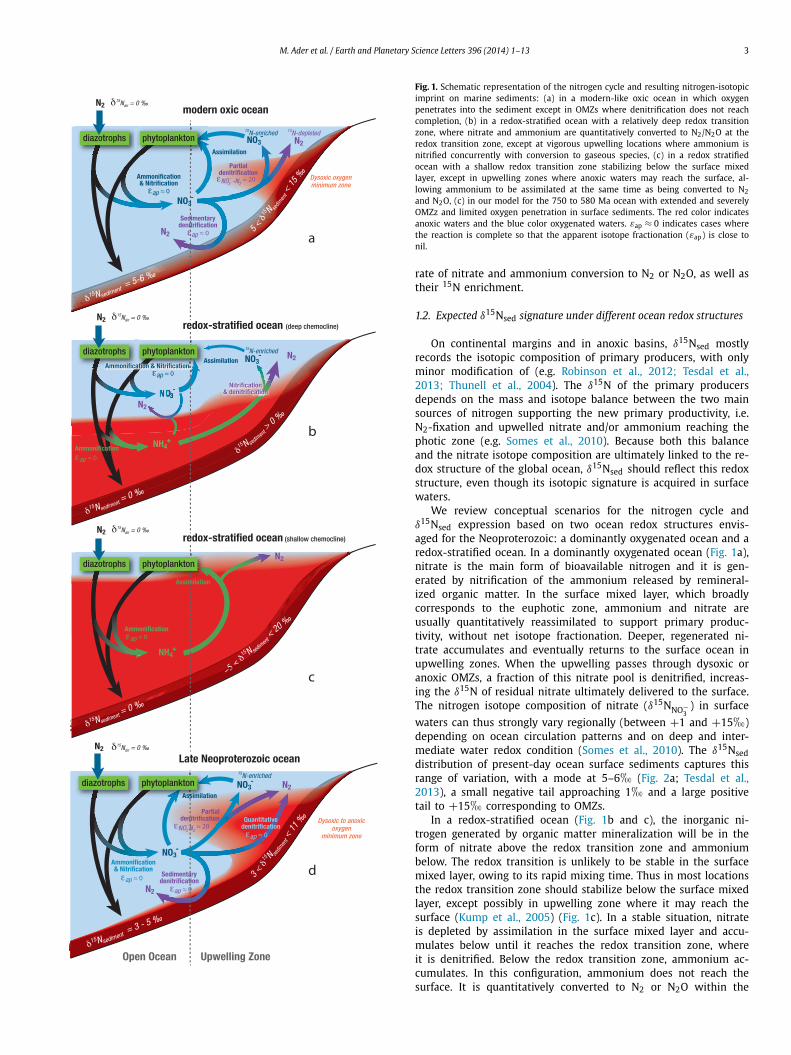
Fig. 1. Schematic representation of the nitrogen cycle and resulting nitrogen-isotopicimprint on marine sediments: (a) in a modern-like oxic ocean in which oxygenpenetrates into the sediment except in OMZs where denitrification does not reachcompletion, (b) in a redox-stratified ocean with a relatively deep redox transitionzone, where nitrate and ammonium are quantitatively converted to N2/N2O at theredox transition zone, except at vigorous upwelling locations where ammonium isnitrified concurrently with conversion to gaseous species, (c) in a redox stratifiedocean with a shallow redox transition zone stabilizing below the surface mixedlayer, except in upwelling zones where anoxic waters may reach the surface, al-lowing ammonium to be assimilated at the same time as being converted to N2
and N2O, (c) in our model for the 750 to 580 Ma ocean with extended and severelyOMZz and limited oxygen penetration in surface sediments. The red color indicatesanoxic waters and the blue color oxygenated waters. εap ≈ 0 indicates cases wherethe reaction is complete so that the apparent isotope fractionation (εap) is close tonil.
rate of nitrate and ammonium conversion to N2 or N2O, as well astheir 15N enrichment.
1.2. Expected δ15Nsed signature under different ocean redox structures
On continental margins and in anoxic basins, δ15Nsed mostlyrecords the isotopic composition of primary producers, with onlyminor modification of (e.g. Robinson et al., 2012; Tesdal et al.,2013; Thunell et al., 2004). The δ15N of the primary producersdepends on the mass and isotope balance between the two mainsources of nitrogen supporting the new primary productivity, i.e.N2-fixation and upwelled nitrate and/or ammonium reaching thephotic zone (e.g. Somes et al., 2010). Because both this balanceand the nitrate isotope composition are ultimately linked to the re-dox structure of the global ocean, δ15Nsed should reflect this redoxstructure, even though its isotopic signature is acquired in surfacewaters.
We review conceptual scenarios for the nitrogen cycle andδ15Nsed expression based on two ocean redox structures envis-aged for the Neoproterozoic: a dominantly oxygenated ocean and aredox-stratified ocean. In a dominantly oxygenated ocean (Fig. 1a),nitrate is the main form of bioavailable nitrogen and it is gen-erated by nitrification of the ammonium released by remineral-ized organic matter. In the surface mixed layer, which broadlycorresponds to the euphotic zone, ammonium and nitrate areusually quantitatively reassimilated to support primary produc-tivity, without net isotope fractionation. Deeper, regenerated ni-trate accumulates and eventually returns to the surface ocean inupwelling zones. When the upwelling passes through dysoxic oranoxic OMZs, a fraction of this nitrate pool is denitrified, increas-ing the δ15N of residual nitrate ultimately delivered to the surface.The nitrogen isotope composition of nitrate (δ15NNO−
3) in surface
waters can thus strongly vary regionally (between +1 and +15�)depending on ocean circulation patterns and on deep and inter-mediate water redox condition (Somes et al., 2010). The δ15Nseddistribution of present-day ocean surface sediments captures thisrange of variation, with a mode at 5–6� (Fig. 2a; Tesdal et al.,2013), a small negative tail approaching 1� and a large positivetail to +15� corresponding to OMZs.
In a redox-stratified ocean (Fig. 1b and c), the inorganic ni-trogen generated by organic matter mineralization will be in theform of nitrate above the redox transition zone and ammoniumbelow. The redox transition is unlikely to be stable in the surfacemixed layer, owing to its rapid mixing time. Thus in most locationsthe redox transition zone should stabilize below the surface mixedlayer, except possibly in upwelling zone where it may reach thesurface (Kump et al., 2005) (Fig. 1c). In a stable situation, nitrateis depleted by assimilation in the surface mixed layer and accu-mulates below until it reaches the redox transition zone, whereit is denitrified. Below the redox transition zone, ammonium ac-cumulates. In this configuration, ammonium does not reach thesurface. It is quantitatively converted to N2 or N2O within the
4 M. Ader et al. / Earth and Planetary Science Letters 396 (2014) 1–13
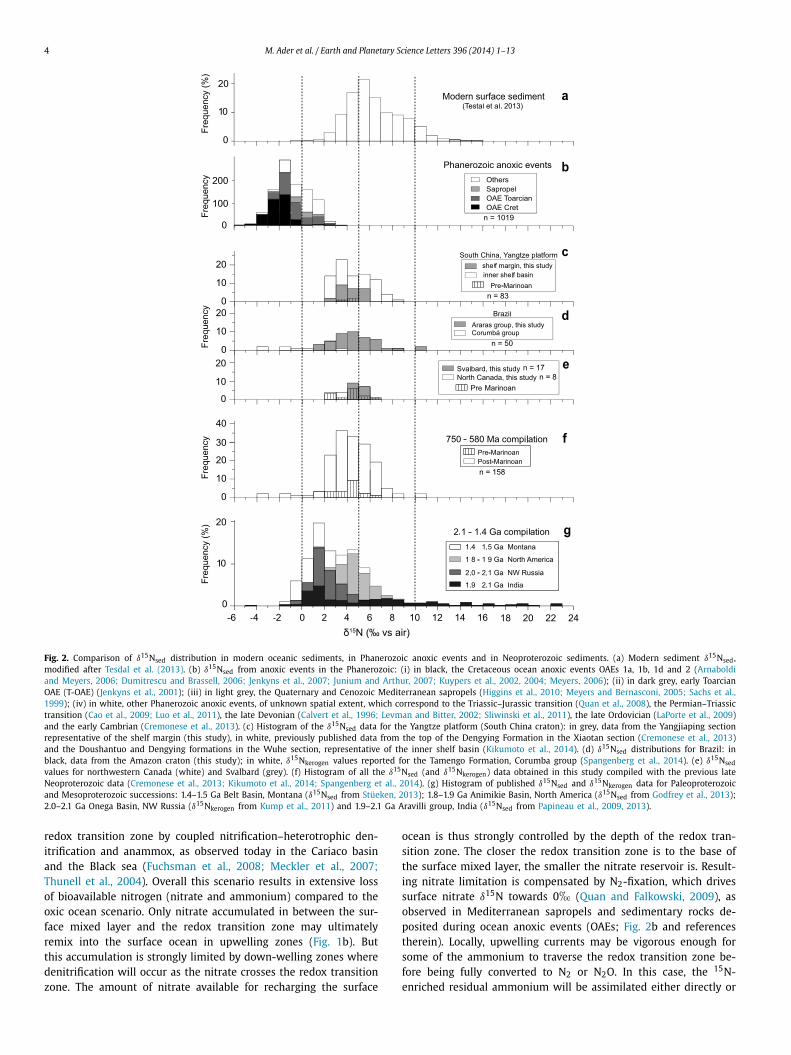
Fig. 2. Comparison of δ15Nsed distribution in modern oceanic sediments, in Phanerozoic anoxic events and in Neoproterozoic sediments. (a) Modern sediment δ15Nsed,modified after Tesdal et al. (2013). (b) δ15Nsed from anoxic events in the Phanerozoic: (i) in black, the Cretaceous ocean anoxic events OAEs 1a, 1b, 1d and 2 (Arnaboldiand Meyers, 2006; Dumitrescu and Brassell, 2006; Jenkyns et al., 2007; Junium and Arthur, 2007; Kuypers et al., 2002, 2004; Meyers, 2006); (ii) in dark grey, early ToarcianOAE (T-OAE) (Jenkyns et al., 2001); (iii) in light grey, the Quaternary and Cenozoic Mediterranean sapropels (Higgins et al., 2010; Meyers and Bernasconi, 2005; Sachs et al.,1999); (iv) in white, other Phanerozoic anoxic events, of unknown spatial extent, which correspond to the Triassic–Jurassic transition (Quan et al., 2008), the Permian–Triassictransition (Cao et al., 2009; Luo et al., 2011), the late Devonian (Calvert et al., 1996; Levman and Bitter, 2002; Sliwinski et al., 2011), the late Ordovician (LaPorte et al., 2009)and the early Cambrian (Cremonese et al., 2013). (c) Histogram of the δ15Nsed data for the Yangtze platform (South China craton): in grey, data from the Yangjiaping sectionrepresentative of the shelf margin (this study), in white, previously published data from the top of the Dengying Formation in the Xiaotan section (Cremonese et al., 2013)and the Doushantuo and Dengying formations in the Wuhe section, representative of the inner shelf basin (Kikumoto et al., 2014). (d) δ15Nsed distributions for Brazil: inblack, data from the Amazon craton (this study); in white, δ15Nkerogen values reported for the Tamengo Formation, Corumba group (Spangenberg et al., 2014). (e) δ15Nsedvalues for northwestern Canada (white) and Svalbard (grey). (f) Histogram of all the δ15Nsed (and δ15Nkerogen) data obtained in this study compiled with the previous lateNeoproterozoic data (Cremonese et al., 2013; Kikumoto et al., 2014; Spangenberg et al., 2014). (g) Histogram of published δ15Nsed and δ15Nkerogen data for Paleoproterozoicand Mesoproterozoic successions: 1.4–1.5 Ga Belt Basin, Montana (δ15Nsed from Stüeken, 2013); 1.8–1.9 Ga Animikie Basin, North America (δ15Nsed from Godfrey et al., 2013);2.0–2.1 Ga Onega Basin, NW Russia (δ15Nkerogen from Kump et al., 2011) and 1.9–2.1 Ga Aravilli group, India (δ15Nsed from Papineau et al., 2009, 2013).
redox transition zone by coupled nitrification–heterotrophic den-itrification and anammox, as observed today in the Cariaco basinand the Black sea (Fuchsman et al., 2008; Meckler et al., 2007;Thunell et al., 2004). Overall this scenario results in extensive lossof bioavailable nitrogen (nitrate and ammonium) compared to theoxic ocean scenario. Only nitrate accumulated in between the sur-face mixed layer and the redox transition zone may ultimatelyremix into the surface ocean in upwelling zones (Fig. 1b). Butthis accumulation is strongly limited by down-welling zones wheredenitrification will occur as the nitrate crosses the redox transitionzone. The amount of nitrate available for recharging the surface
ocean is thus strongly controlled by the depth of the redox tran-sition zone. The closer the redox transition zone is to the base ofthe surface mixed layer, the smaller the nitrate reservoir is. Result-ing nitrate limitation is compensated by N2-fixation, which drivessurface nitrate δ15N towards 0� (Quan and Falkowski, 2009), asobserved in Mediterranean sapropels and sedimentary rocks de-posited during ocean anoxic events (OAEs; Fig. 2b and referencestherein). Locally, upwelling currents may be vigorous enough forsome of the ammonium to traverse the redox transition zone be-fore being fully converted to N2 or N2O. In this case, the 15N-enriched residual ammonium will be assimilated either directly or
M. Ader et al. / Earth and Planetary Science Letters 396 (2014) 1–13 5
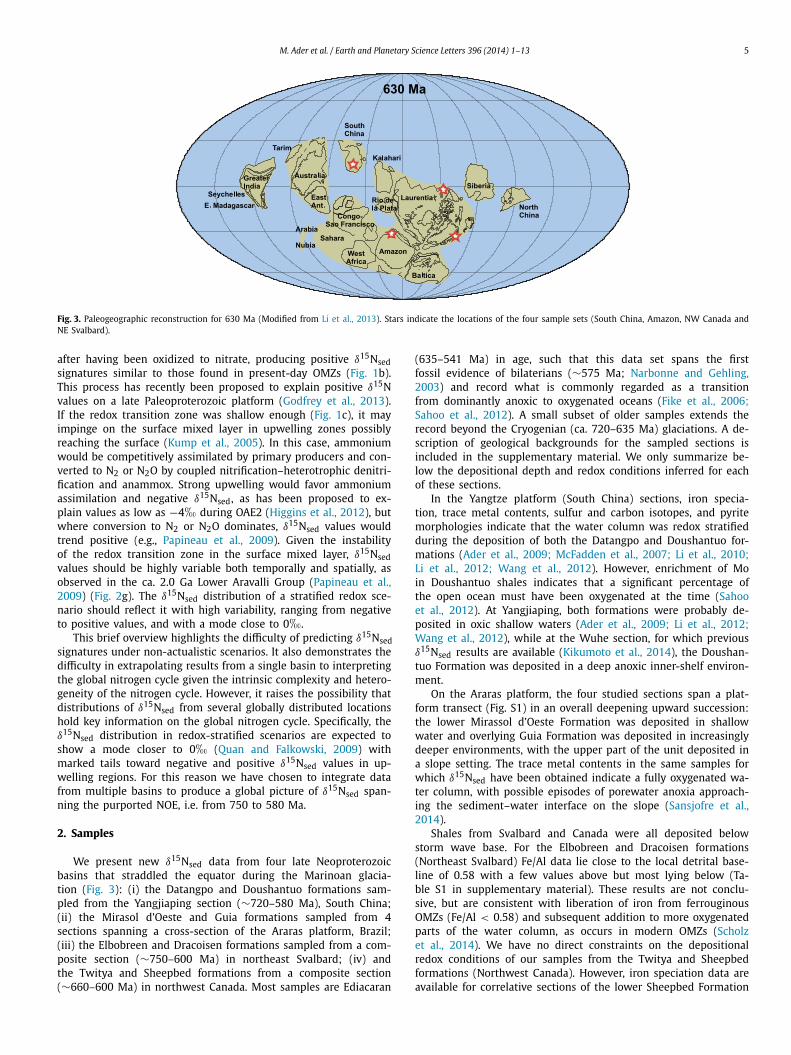
Fig. 3. Paleogeographic reconstruction for 630 Ma (Modified from Li et al., 2013). Stars indicate the locations of the four sample sets (South China, Amazon, NW Canada andNE Svalbard).
after having been oxidized to nitrate, producing positive δ15Nsedsignatures similar to those found in present-day OMZs (Fig. 1b).This process has recently been proposed to explain positive δ15Nvalues on a late Paleoproterozoic platform (Godfrey et al., 2013).If the redox transition zone was shallow enough (Fig. 1c), it mayimpinge on the surface mixed layer in upwelling zones possiblyreaching the surface (Kump et al., 2005). In this case, ammoniumwould be competitively assimilated by primary producers and con-verted to N2 or N2O by coupled nitrification–heterotrophic denitri-fication and anammox. Strong upwelling would favor ammoniumassimilation and negative δ15Nsed, as has been proposed to ex-plain values as low as −4� during OAE2 (Higgins et al., 2012), butwhere conversion to N2 or N2O dominates, δ15Nsed values wouldtrend positive (e.g., Papineau et al., 2009). Given the instabilityof the redox transition zone in the surface mixed layer, δ15Nsedvalues should be highly variable both temporally and spatially, asobserved in the ca. 2.0 Ga Lower Aravalli Group (Papineau et al.,2009) (Fig. 2g). The δ15Nsed distribution of a stratified redox sce-nario should reflect it with high variability, ranging from negativeto positive values, and with a mode close to 0�.
This brief overview highlights the difficulty of predicting δ15Nsedsignatures under non-actualistic scenarios. It also demonstrates thedifficulty in extrapolating results from a single basin to interpretingthe global nitrogen cycle given the intrinsic complexity and hetero-geneity of the nitrogen cycle. However, it raises the possibility thatdistributions of δ15Nsed from several globally distributed locationshold key information on the global nitrogen cycle. Specifically, theδ15Nsed distribution in redox-stratified scenarios are expected toshow a mode closer to 0� (Quan and Falkowski, 2009) withmarked tails toward negative and positive δ15Nsed values in up-welling regions. For this reason we have chosen to integrate datafrom multiple basins to produce a global picture of δ15Nsed span-ning the purported NOE, i.e. from 750 to 580 Ma.
2. Samples
We present new δ15Nsed data from four late Neoproterozoicbasins that straddled the equator during the Marinoan glacia-tion (Fig. 3): (i) the Datangpo and Doushantuo formations sam-pled from the Yangjiaping section (∼720–580 Ma), South China;(ii) the Mirasol d’Oeste and Guia formations sampled from 4sections spanning a cross-section of the Araras platform, Brazil;(iii) the Elbobreen and Dracoisen formations sampled from a com-posite section (∼750–600 Ma) in northeast Svalbard; (iv) andthe Twitya and Sheepbed formations from a composite section(∼660–600 Ma) in northwest Canada. Most samples are Ediacaran
(635–541 Ma) in age, such that this data set spans the firstfossil evidence of bilaterians (∼575 Ma; Narbonne and Gehling,2003) and record what is commonly regarded as a transitionfrom dominantly anoxic to oxygenated oceans (Fike et al., 2006;Sahoo et al., 2012). A small subset of older samples extends therecord beyond the Cryogenian (ca. 720–635 Ma) glaciations. A de-scription of geological backgrounds for the sampled sections isincluded in the supplementary material. We only summarize be-low the depositional depth and redox conditions inferred for eachof these sections.
In the Yangtze platform (South China) sections, iron specia-tion, trace metal contents, sulfur and carbon isotopes, and pyritemorphologies indicate that the water column was redox stratifiedduring the deposition of both the Datangpo and Doushantuo for-mations (Ader et al., 2009; McFadden et al., 2007; Li et al., 2010;Li et al., 2012; Wang et al., 2012). However, enrichment of Moin Doushantuo shales indicates that a significant percentage ofthe open ocean must have been oxygenated at the time (Sahooet al., 2012). At Yangjiaping, both formations were probably de-posited in oxic shallow waters (Ader et al., 2009; Li et al., 2012;Wang et al., 2012), while at the Wuhe section, for which previousδ15Nsed results are available (Kikumoto et al., 2014), the Doushan-tuo Formation was deposited in a deep anoxic inner-shelf environ-ment.
On the Araras platform, the four studied sections span a plat-form transect (Fig. S1) in an overall deepening upward succession:the lower Mirassol d’Oeste Formation was deposited in shallowwater and overlying Guia Formation was deposited in increasinglydeeper environments, with the upper part of the unit deposited ina slope setting. The trace metal contents in the same samples forwhich δ15Nsed have been obtained indicate a fully oxygenated wa-ter column, with possible episodes of porewater anoxia approach-ing the sediment–water interface on the slope (Sansjofre et al.,2014).
Shales from Svalbard and Canada were all deposited belowstorm wave base. For the Elbobreen and Dracoisen formations(Northeast Svalbard) Fe/Al data lie close to the local detrital base-line of 0.58 with a few values above but most lying below (Ta-ble S1 in supplementary material). These results are not conclu-sive, but are consistent with liberation of iron from ferrouginousOMZs (Fe/Al < 0.58) and subsequent addition to more oxygenatedparts of the water column, as occurs in modern OMZs (Scholzet al., 2014). We have no direct constraints on the depositionalredox conditions of our samples from the Twitya and Sheepbedformations (Northwest Canada). However, iron speciation data areavailable for correlative sections of the lower Sheepbed Formation
6 M. Ader et al. / Earth and Planetary Science Letters 396 (2014) 1–13
(Johnston et al., 2013; Shen et al., 2008). These data were inter-preted to indicate anoxic and ferruginous deep waters with varia-tions in the redox transition zone depth, such that the depositionalenvironment may have been oxic in some locations. We note, how-ever, that FeHR/FeT data lie close to the 0.38 threshold used todiscriminate anoxic from oxic environments and the FeT/Al ratioare close to both the generic detrital ratio of 0.53 (Johnston etal., 2013), which means the data do not conclusively demonstrateanoxic conditions. As for Svalbard, it is possible that ferruginousconditions were confined to an OMZ in an otherwise oxygenatedocean.
3. Nitrogen stable isotope analyses
Samples were ground in an agate mortar and sieved to ensurea grain size <140 μm. To concentrate nitrogen in the insolubleresidue, most carbonate-rich samples were first decarbonated inHCl 6 N overnight at room temperature, followed by 2 h at 80 ◦C.Residues were washed with distilled water, centrifuged and driedat 50 ◦C. When enough material was available and N-content wasabove 200 ppm, samples were prepared by conventional sealedtube combustion to convert total nitrogen to N2 (Dumas com-bustion). This method is hereafter referred to as the conventionalmethod (see Ader et al., 1998 for a detailed description). The N2was then measured on a dual inlet Thermo Finnigan Delta + XPmass spectrometer allowing analyses on as low as 2 μmol N2 witha precision of ±0.2� (1σ). Nitrogen blanks were approximately0.15 μmol, thus representing less than 10% of the measured nitro-gen on the least N-rich samples. The reproducibility of the δ15Nsedmeasurements was ±0.2� (1σ).
For samples containing a limited amount of material, N-isotopeanalyses were performed using sealed-tube combustion and on-line N2 purification on an ultra-high vacuum line with direct in-troduction to a static mass spectrometer (hereafter referred to asthe static method) following an established protocol (Ader et al.,2006; Busigny et al., 2003, 2005; Thomazo et al., 2011). Powderedsamples (between 5 and 30 mg) were embedded in a platinumparcel, then evacuated under vacuum at 150 ◦C before being sealedin an evacuated and pre-purified quartz tube with an excess ofCuO and Cu wire and CaO granules. The sample was combustedat 950 ◦C for 6 h and the resulting N2 purified and quantifiedon an ultra-high vacuum line directly coupled to our static massspectrometer. Precision for δ15N via this method is ±0.3� (1σ)
based on repeat analyses. Blanks yielded δ15N values of +1.5±3�and higher nitrogen amounts (∼30 ng) than expected based onprior work in our lab (Ader et al., 2006; Busigny et al., 2005;Thomazo et al., 2011), which is likely a result of the lower sampledegassing temperature set at 150 ◦C to avoid nitrogen devolatil-isation, the thermal maturation experienced by our samples be-ing lower than greenschist facies. In most cases this blank con-tent accounts for less than 3% of the total nitrogen, but reached10% in some of the most nitrogen-poor samples. All results areblank-corrected and given in standard δ notation, calibrated to Air(Mariotti et al., 1981).
In order to ascertain whether bulk and decarbonated samples,as well as conventional and static methods, yield comparable re-sults, selected samples were analyzed by multiple methods (Ta-ble S2). δ15Nsed results obtained on bulk and decarbonated sam-ples using the conventional or the static method compare wellgiven the reproducibility of each method. When all data are con-sidered together, the δ15Nsed reproducibility (1σ ) is usually betterthan ±0.35�, and always better than ±0.63�. N-contents alsocompare quite well between methods, except for pure carbonatesamples, for which bulk N-contents measured on the decarbon-ated residue are often lower than those measured directly on bulksamples. It is likely that a significant fraction of the very small
residue was lost during the decarbonation step, probably as a su-pernatant during rinsing and centrifugation. Therefore, N-contentsdetermined using the decarbonated residue of carbonate samplesare probably slightly underestimated.
4. Results
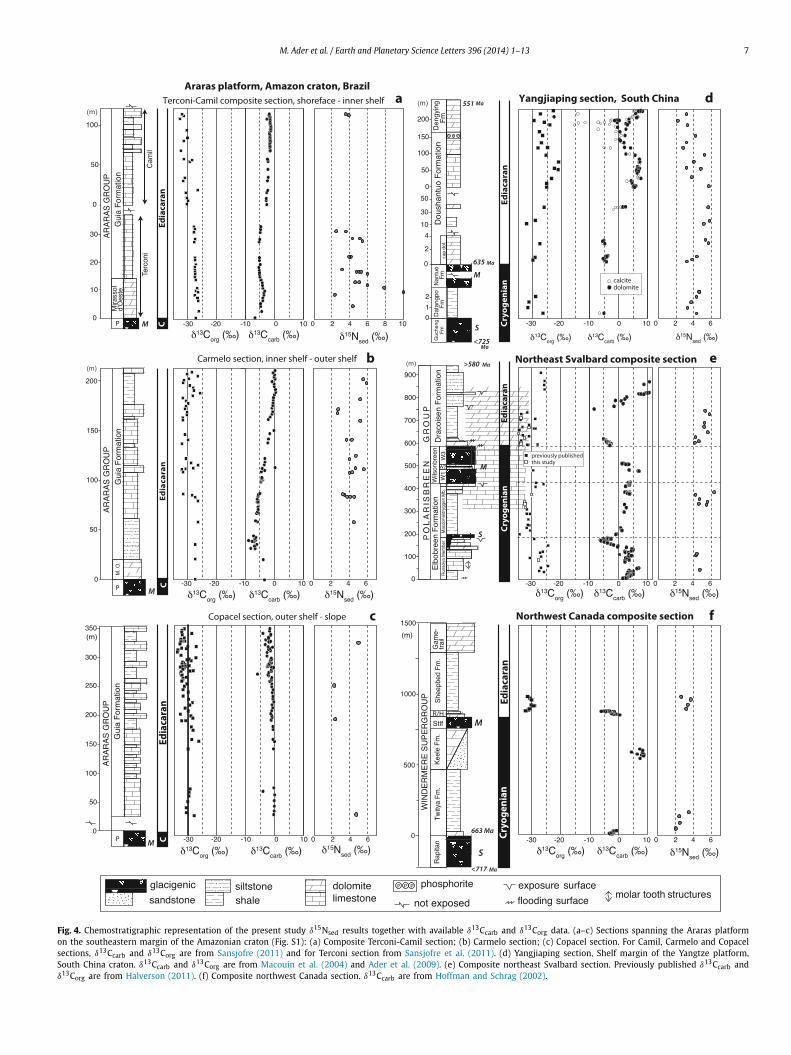
Our δ15Nsed results are listed in the supplementary informationTable S3 and presented as chemostratigraphic profiles (togetherwith available δ13Corg and δ13Ccarb data) for each of the stud-ied sections in Fig. 4. For the Araras platform (n = 41), δ15Nseddata have been obtained from 4 sections spanning the platform(Fig. 4a–c). δ15Nsed data for the shallow-water cap dolostone ofthe Mirassol d’Oeste Formation (directly overlying the Marinoanglacial deposits) are only available in the Terconi-Camil compos-ite section. They show the largest distribution with δ15Nsed valuesranging from +2 to +10� (Fig. 4a). δ15Nsed data for the overlyingGuia Formation are available for all three sections (Fig. 4a–c). Theylie between +2 and +6�, and no systematic variation is apparenteither temporally or between sections.
For South China, all samples come from the Yangjiaping sec-tion (Fig. 4d). In the Datangpo Formation, δ15Nsed data clusteraround +4�. In the Doushantuo Formation, δ15Nsed values in-crease within the 4 meter-thick cap carbonate from +3� upto +5.5�, at which they remain through the subsequent 40 m.Above, δ15Nsed values are more variable, but overall decreaseto +2.5� in the lower Dengying Formation. Recently publishedδ15Nsed data from the Doushantuo Formation from a drill-corein the Three Gorges area that penetrates a deep inner-shelf set-ting on the Yangtze platform (Kikumoto et al., 2014) show similarδ15Nsed values than the Yangjiaping section, which correspond tothe shelf margin (Fig. 2c). Both sections also display similar δ15Nsedstratigraphic variations (Fig. 4d, this study and Fig. 2, Kikumotoet al., 2014) in spite of the different depositional setting, litholo-gies and δ13Corg and δ13Ccarb stratigraphic variations. Samples fromSvalbard (n = 18) present very homogeneous δ15Nsed values rang-ing from +4.1 to +6.3� (Fig. 4e), although data from the post-Marinoan Dracoisen Formation show a distinct positive upwardtrend from +4 to +5.5� (Fig. 4e). All samples from northwestCanada (n = 8) fall between +2 and +4� (Fig. 4f). No obviouscorrelation with δ13Corg and δ13Ccarb is evident in any of the sec-tions (Fig. 4 and Fig. 5d).
These results are synthesized in histograms in Fig. 2 togetherwith δ15Nsed data previously published for the Doushantuo andDengying formations, South China (Cremonese et al., 2013; Kiku-moto et al., 2014) and δ15Nkerogen data from the Tamengo Forma-tion, Brazil (Spangenberg et al., 2014). δ15Nsed values for SouthChina range between +2.2 and +8.5� (Fig. 2c); for the Amazo-nian craton between +2.2 and +10.5�; for the Late EdiacaranTamengo Formation between −3.3 and +3.1�, defining the lowerend of the distribution (Fig. 2d); for northwestern Canada be-tween +2 and +4� and for Svalbard between +4 and +7�(Fig. 2e). Overall, the δ15N values (n = 158) range from −3.3 to+10.5�, with roughly 40% of the data falling between +3 and+6� (Fig. 2f). No time-based evolution is evident from the com-parison of the Cryogenian values to those of the Ediacaran (Fig. 2f).
5. Discussion
5.1. Preservation of the δ15Nsed signature
In sediments from continental margins and anoxic depositionalsettings, δ15N of primary producers is recorded with only minormodification in δ15Nsed in spite of the early diagenetic remineral-ization of organic matter and ammonium fixation in clay minerals(e.g. reviews in Robinson et al., 2012; Thomazo et al., 2011). The
M. Ader et al. / Earth and Planetary Science Letters 396 (2014) 1–13 7
Fig. 4. Chemostratigraphic representation of the present study δ15Nsed results together with available δ13Ccarb and δ13Corg data. (a–c) Sections spanning the Araras platformon the southeastern margin of the Amazonian craton (Fig. S1): (a) Composite Terconi-Camil section; (b) Carmelo section; (c) Copacel section. For Camil, Carmelo and Copacelsections, δ13Ccarb and δ13Corg are from Sansjofre (2011) and for Terconi section from Sansjofre et al. (2011). (d) Yangjiaping section, Shelf margin of the Yangtze platform,South China craton. δ13Ccarb and δ13Corg are from Macouin et al. (2004) and Ader et al. (2009). (e) Composite northeast Svalbard section. Previously published δ13Ccarb andδ13Corg are from Halverson (2011). (f) Composite northwest Canada section. δ13Ccarb are from Hoffman and Schrag (2002).
8 M. Ader et al. / Earth and Planetary Science Letters 396 (2014) 1–13
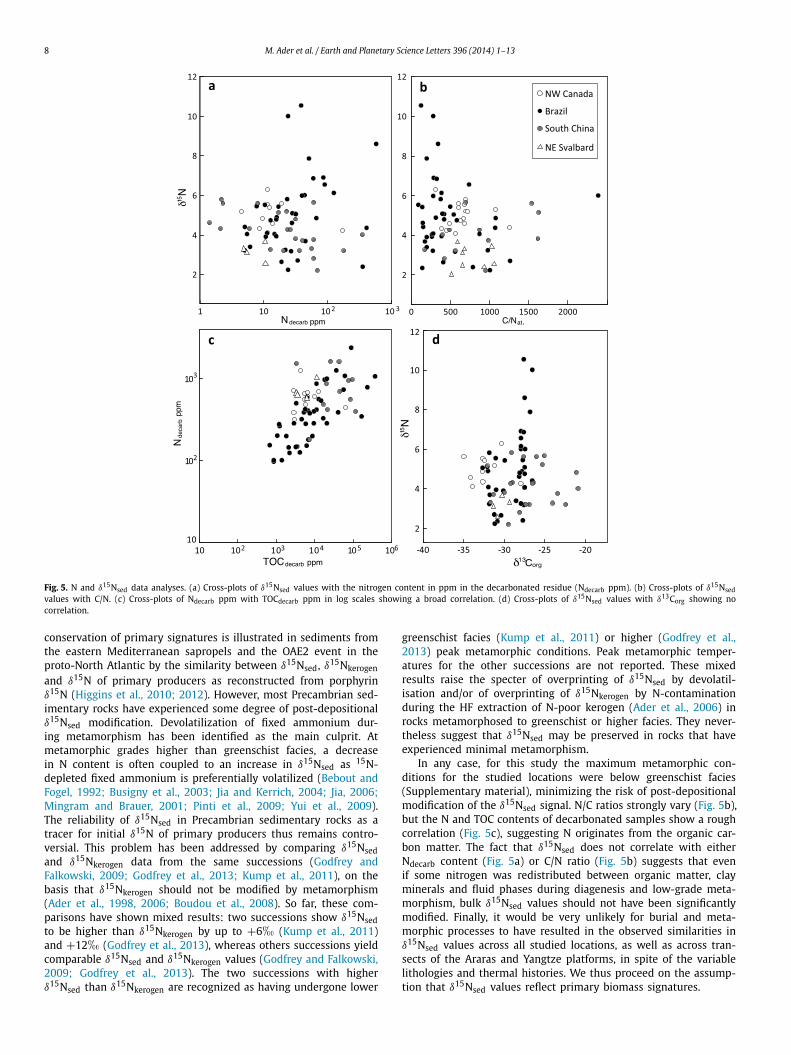
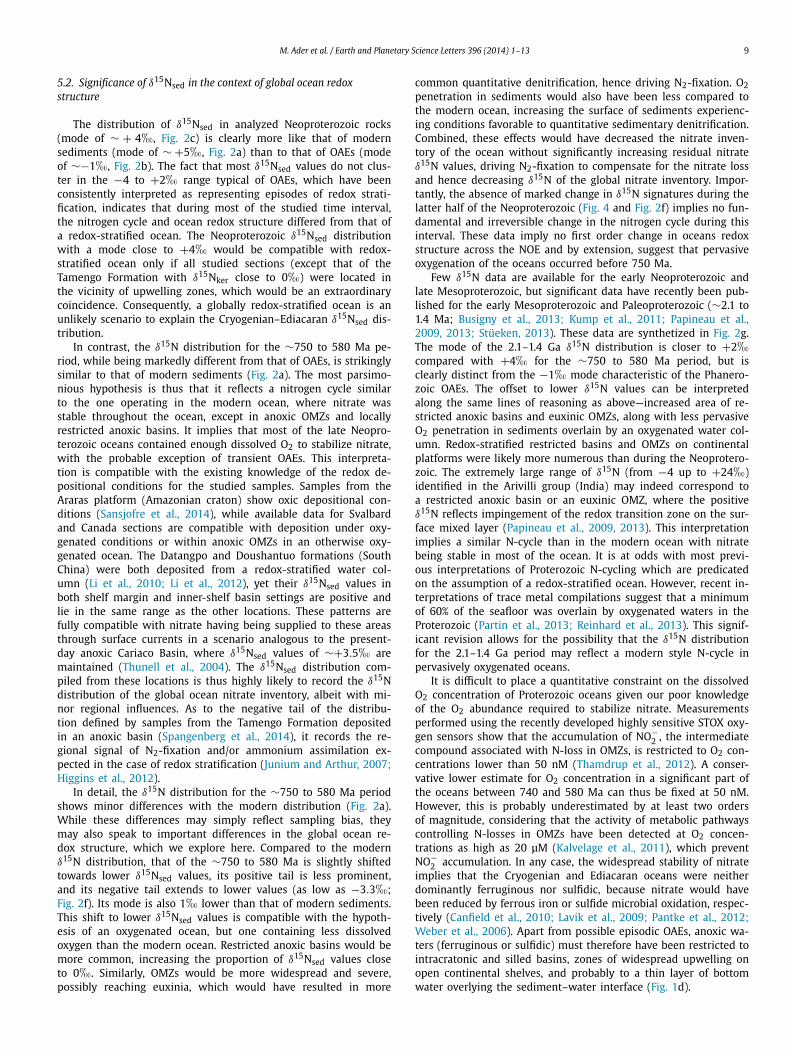
Fig. 5. N and δ15Nsed data analyses. (a) Cross-plots of δ15Nsed values with the nitrogen content in ppm in the decarbonated residue (Ndecarb ppm). (b) Cross-plots of δ15Nsedvalues with C/N. (c) Cross-plots of Ndecarb ppm with TOCdecarb ppm in log scales showing a broad correlation. (d) Cross-plots of δ15Nsed values with δ13Corg showing nocorrelation.
conservation of primary signatures is illustrated in sediments fromthe eastern Mediterranean sapropels and the OAE2 event in theproto-North Atlantic by the similarity between δ15Nsed, δ15Nkerogen
and δ15N of primary producers as reconstructed from porphyrinδ15N (Higgins et al., 2010; 2012). However, most Precambrian sed-imentary rocks have experienced some degree of post-depositionalδ15Nsed modification. Devolatilization of fixed ammonium dur-ing metamorphism has been identified as the main culprit. Atmetamorphic grades higher than greenschist facies, a decreasein N content is often coupled to an increase in δ15Nsed as 15N-depleted fixed ammonium is preferentially volatilized (Bebout andFogel, 1992; Busigny et al., 2003; Jia and Kerrich, 2004; Jia, 2006;Mingram and Brauer, 2001; Pinti et al., 2009; Yui et al., 2009).The reliability of δ15Nsed in Precambrian sedimentary rocks as atracer for initial δ15N of primary producers thus remains contro-versial. This problem has been addressed by comparing δ15Nsedand δ15Nkerogen data from the same successions (Godfrey andFalkowski, 2009; Godfrey et al., 2013; Kump et al., 2011), on thebasis that δ15Nkerogen should not be modified by metamorphism(Ader et al., 1998, 2006; Boudou et al., 2008). So far, these com-parisons have shown mixed results: two successions show δ15Nsedto be higher than δ15Nkerogen by up to +6� (Kump et al., 2011)and +12� (Godfrey et al., 2013), whereas others successions yieldcomparable δ15Nsed and δ15Nkerogen values (Godfrey and Falkowski,2009; Godfrey et al., 2013). The two successions with higherδ15Nsed than δ15Nkerogen are recognized as having undergone lower
greenschist facies (Kump et al., 2011) or higher (Godfrey et al.,2013) peak metamorphic conditions. Peak metamorphic temper-atures for the other successions are not reported. These mixedresults raise the specter of overprinting of δ15Nsed by devolatil-isation and/or of overprinting of δ15Nkerogen by N-contaminationduring the HF extraction of N-poor kerogen (Ader et al., 2006) inrocks metamorphosed to greenschist or higher facies. They never-theless suggest that δ15Nsed may be preserved in rocks that haveexperienced minimal metamorphism.
In any case, for this study the maximum metamorphic con-ditions for the studied locations were below greenschist facies(Supplementary material), minimizing the risk of post-depositionalmodification of the δ15Nsed signal. N/C ratios strongly vary (Fig. 5b),but the N and TOC contents of decarbonated samples show a roughcorrelation (Fig. 5c), suggesting N originates from the organic car-bon matter. The fact that δ15Nsed does not correlate with eitherNdecarb content (Fig. 5a) or C/N ratio (Fig. 5b) suggests that evenif some nitrogen was redistributed between organic matter, clayminerals and fluid phases during diagenesis and low-grade meta-morphism, bulk δ15Nsed values should not have been significantlymodified. Finally, it would be very unlikely for burial and meta-morphic processes to have resulted in the observed similarities inδ15Nsed values across all studied locations, as well as across tran-sects of the Araras and Yangtze platforms, in spite of the variablelithologies and thermal histories. We thus proceed on the assump-tion that δ15Nsed values reflect primary biomass signatures.
M. Ader et al. / Earth and Planetary Science Letters 396 (2014) 1–13 9
5.2. Significance of δ15Nsed in the context of global ocean redoxstructure
The distribution of δ15Nsed in analyzed Neoproterozoic rocks(mode of ∼ + 4�, Fig. 2c) is clearly more like that of modernsediments (mode of ∼ +5�, Fig. 2a) than to that of OAEs (modeof ∼−1�, Fig. 2b). The fact that most δ15Nsed values do not clus-ter in the −4 to +2� range typical of OAEs, which have beenconsistently interpreted as representing episodes of redox strati-fication, indicates that during most of the studied time interval,the nitrogen cycle and ocean redox structure differed from that ofa redox-stratified ocean. The Neoproterozoic δ15Nsed distributionwith a mode close to +4� would be compatible with redox-stratified ocean only if all studied sections (except that of theTamengo Formation with δ15Nker close to 0�) were located inthe vicinity of upwelling zones, which would be an extraordinarycoincidence. Consequently, a globally redox-stratified ocean is anunlikely scenario to explain the Cryogenian–Ediacaran δ15Nsed dis-tribution.
In contrast, the δ15N distribution for the ∼750 to 580 Ma pe-riod, while being markedly different from that of OAEs, is strikinglysimilar to that of modern sediments (Fig. 2a). The most parsimo-nious hypothesis is thus that it reflects a nitrogen cycle similarto the one operating in the modern ocean, where nitrate wasstable throughout the ocean, except in anoxic OMZs and locallyrestricted anoxic basins. It implies that most of the late Neopro-terozoic oceans contained enough dissolved O2 to stabilize nitrate,with the probable exception of transient OAEs. This interpreta-tion is compatible with the existing knowledge of the redox de-positional conditions for the studied samples. Samples from theAraras platform (Amazonian craton) show oxic depositional con-ditions (Sansjofre et al., 2014), while available data for Svalbardand Canada sections are compatible with deposition under oxy-genated conditions or within anoxic OMZs in an otherwise oxy-genated ocean. The Datangpo and Doushantuo formations (SouthChina) were both deposited from a redox-stratified water col-umn (Li et al., 2010; Li et al., 2012), yet their δ15Nsed values inboth shelf margin and inner-shelf basin settings are positive andlie in the same range as the other locations. These patterns arefully compatible with nitrate having being supplied to these areasthrough surface currents in a scenario analogous to the present-day anoxic Cariaco Basin, where δ15Nsed values of ∼+3.5� aremaintained (Thunell et al., 2004). The δ15Nsed distribution com-piled from these locations is thus highly likely to record the δ15Ndistribution of the global ocean nitrate inventory, albeit with mi-nor regional influences. As to the negative tail of the distribu-tion defined by samples from the Tamengo Formation depositedin an anoxic basin (Spangenberg et al., 2014), it records the re-gional signal of N2-fixation and/or ammonium assimilation ex-pected in the case of redox stratification (Junium and Arthur, 2007;Higgins et al., 2012).
In detail, the δ15N distribution for the ∼750 to 580 Ma periodshows minor differences with the modern distribution (Fig. 2a).While these differences may simply reflect sampling bias, theymay also speak to important differences in the global ocean re-dox structure, which we explore here. Compared to the modernδ15N distribution, that of the ∼750 to 580 Ma is slightly shiftedtowards lower δ15Nsed values, its positive tail is less prominent,and its negative tail extends to lower values (as low as −3.3�;Fig. 2f). Its mode is also 1� lower than that of modern sediments.This shift to lower δ15Nsed values is compatible with the hypoth-esis of an oxygenated ocean, but one containing less dissolvedoxygen than the modern ocean. Restricted anoxic basins would bemore common, increasing the proportion of δ15Nsed values closeto 0�. Similarly, OMZs would be more widespread and severe,possibly reaching euxinia, which would have resulted in more
common quantitative denitrification, hence driving N2-fixation. O2penetration in sediments would also have been less compared tothe modern ocean, increasing the surface of sediments experienc-ing conditions favorable to quantitative sedimentary denitrification.Combined, these effects would have decreased the nitrate inven-tory of the ocean without significantly increasing residual nitrateδ15N values, driving N2-fixation to compensate for the nitrate lossand hence decreasing δ15N of the global nitrate inventory. Impor-tantly, the absence of marked change in δ15N signatures during thelatter half of the Neoproterozoic (Fig. 4 and Fig. 2f) implies no fun-damental and irreversible change in the nitrogen cycle during thisinterval. These data imply no first order change in oceans redoxstructure across the NOE and by extension, suggest that pervasiveoxygenation of the oceans occurred before 750 Ma.
Few δ15N data are available for the early Neoproterozoic andlate Mesoproterozoic, but significant data have recently been pub-lished for the early Mesoproterozoic and Paleoproterozoic (∼2.1 to1.4 Ma; Busigny et al., 2013; Kump et al., 2011; Papineau et al.,2009, 2013; Stüeken, 2013). These data are synthetized in Fig. 2g.The mode of the 2.1–1.4 Ga δ15N distribution is closer to +2�compared with +4� for the ∼750 to 580 Ma period, but isclearly distinct from the −1� mode characteristic of the Phanero-zoic OAEs. The offset to lower δ15N values can be interpretedalong the same lines of reasoning as above—increased area of re-stricted anoxic basins and euxinic OMZs, along with less pervasiveO2 penetration in sediments overlain by an oxygenated water col-umn. Redox-stratified restricted basins and OMZs on continentalplatforms were likely more numerous than during the Neoprotero-zoic. The extremely large range of δ15N (from −4 up to +24�)identified in the Arivilli group (India) may indeed correspond toa restricted anoxic basin or an euxinic OMZ, where the positiveδ15N reflects impingement of the redox transition zone on the sur-face mixed layer (Papineau et al., 2009, 2013). This interpretationimplies a similar N-cycle than in the modern ocean with nitratebeing stable in most of the ocean. It is at odds with most previ-ous interpretations of Proterozoic N-cycling which are predicatedon the assumption of a redox-stratified ocean. However, recent in-terpretations of trace metal compilations suggest that a minimumof 60% of the seafloor was overlain by oxygenated waters in theProterozoic (Partin et al., 2013; Reinhard et al., 2013). This signif-icant revision allows for the possibility that the δ15N distributionfor the 2.1–1.4 Ga period may reflect a modern style N-cycle inpervasively oxygenated oceans.
It is difficult to place a quantitative constraint on the dissolvedO2 concentration of Proterozoic oceans given our poor knowledgeof the O2 abundance required to stabilize nitrate. Measurementsperformed using the recently developed highly sensitive STOX oxy-gen sensors show that the accumulation of NO−
2 , the intermediatecompound associated with N-loss in OMZs, is restricted to O2 con-centrations lower than 50 nM (Thamdrup et al., 2012). A conser-vative lower estimate for O2 concentration in a significant part ofthe oceans between 740 and 580 Ma can thus be fixed at 50 nM.However, this is probably underestimated by at least two ordersof magnitude, considering that the activity of metabolic pathwayscontrolling N-losses in OMZs have been detected at O2 concen-trations as high as 20 μM (Kalvelage et al., 2011), which preventNO−
2 accumulation. In any case, the widespread stability of nitrateimplies that the Cryogenian and Ediacaran oceans were neitherdominantly ferruginous nor sulfidic, because nitrate would havebeen reduced by ferrous iron or sulfide microbial oxidation, respec-tively (Canfield et al., 2010; Lavik et al., 2009; Pantke et al., 2012;Weber et al., 2006). Apart from possible episodic OAEs, anoxic wa-ters (ferruginous or sulfidic) must therefore have been restricted tointracratonic and silled basins, zones of widespread upwelling onopen continental shelves, and probably to a thin layer of bottomwater overlying the sediment–water interface (Fig. 1d).
10 M. Ader et al. / Earth and Planetary Science Letters 396 (2014) 1–13
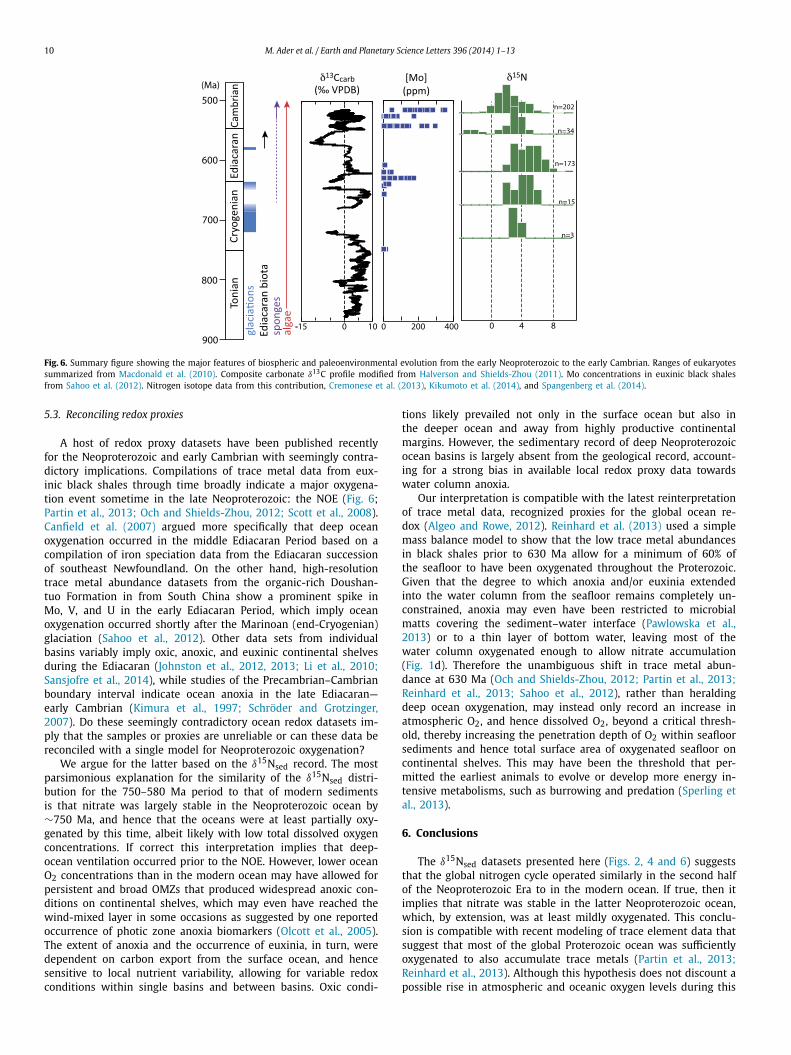
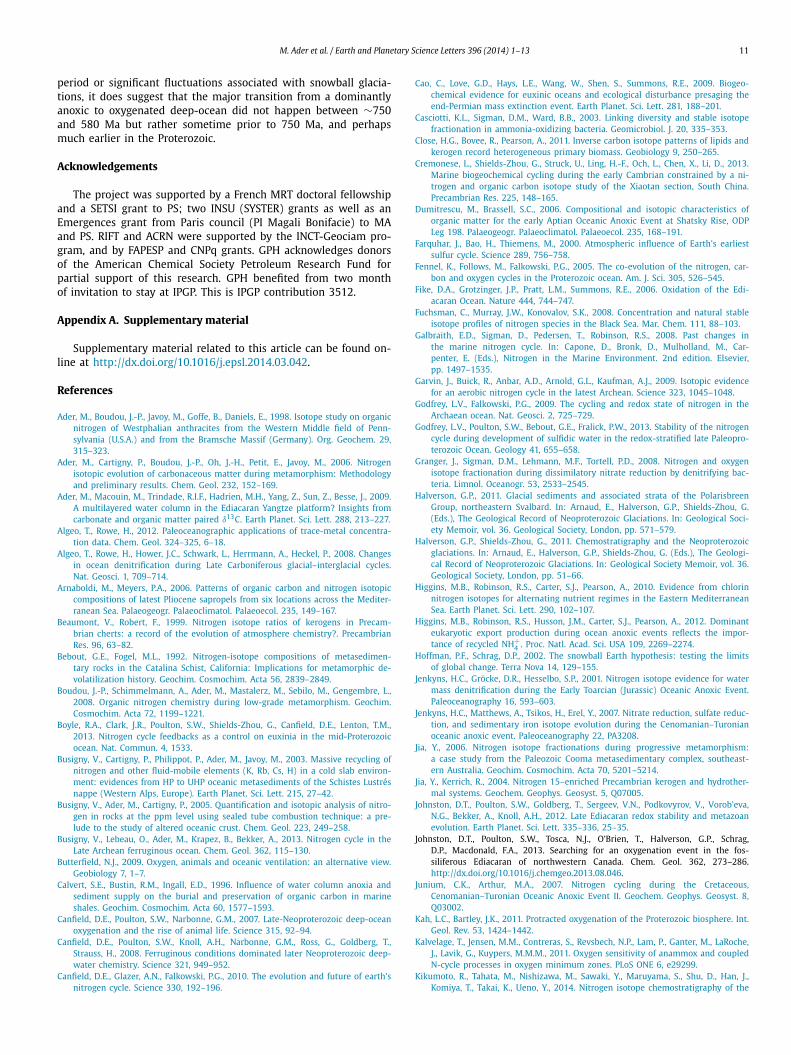
Fig. 6. Summary figure showing the major features of biospheric and paleoenvironmental evolution from the early Neoproterozoic to the early Cambrian. Ranges of eukaryotessummarized from Macdonald et al. (2010). Composite carbonate δ13C profile modified from Halverson and Shields-Zhou (2011). Mo concentrations in euxinic black shalesfrom Sahoo et al. (2012). Nitrogen isotope data from this contribution, Cremonese et al. (2013), Kikumoto et al. (2014), and Spangenberg et al. (2014).
5.3. Reconciling redox proxies
A host of redox proxy datasets have been published recentlyfor the Neoproterozoic and early Cambrian with seemingly contra-dictory implications. Compilations of trace metal data from eux-inic black shales through time broadly indicate a major oxygena-tion event sometime in the late Neoproterozoic: the NOE (Fig. 6;Partin et al., 2013; Och and Shields-Zhou, 2012; Scott et al., 2008).Canfield et al. (2007) argued more specifically that deep oceanoxygenation occurred in the middle Ediacaran Period based on acompilation of iron speciation data from the Ediacaran successionof southeast Newfoundland. On the other hand, high-resolutiontrace metal abundance datasets from the organic-rich Doushan-tuo Formation in from South China show a prominent spike inMo, V, and U in the early Ediacaran Period, which imply oceanoxygenation occurred shortly after the Marinoan (end-Cryogenian)glaciation (Sahoo et al., 2012). Other data sets from individualbasins variably imply oxic, anoxic, and euxinic continental shelvesduring the Ediacaran (Johnston et al., 2012, 2013; Li et al., 2010;Sansjofre et al., 2014), while studies of the Precambrian–Cambrianboundary interval indicate ocean anoxia in the late Ediacaran—early Cambrian (Kimura et al., 1997; Schröder and Grotzinger,2007). Do these seemingly contradictory ocean redox datasets im-ply that the samples or proxies are unreliable or can these data bereconciled with a single model for Neoproterozoic oxygenation?
We argue for the latter based on the δ15Nsed record. The mostparsimonious explanation for the similarity of the δ15Nsed distri-bution for the 750–580 Ma period to that of modern sedimentsis that nitrate was largely stable in the Neoproterozoic ocean by∼750 Ma, and hence that the oceans were at least partially oxy-genated by this time, albeit likely with low total dissolved oxygenconcentrations. If correct this interpretation implies that deep-ocean ventilation occurred prior to the NOE. However, lower oceanO2 concentrations than in the modern ocean may have allowed forpersistent and broad OMZs that produced widespread anoxic con-ditions on continental shelves, which may even have reached thewind-mixed layer in some occasions as suggested by one reportedoccurrence of photic zone anoxia biomarkers (Olcott et al., 2005).The extent of anoxia and the occurrence of euxinia, in turn, weredependent on carbon export from the surface ocean, and hencesensitive to local nutrient variability, allowing for variable redoxconditions within single basins and between basins. Oxic condi-
tions likely prevailed not only in the surface ocean but also inthe deeper ocean and away from highly productive continentalmargins. However, the sedimentary record of deep Neoproterozoicocean basins is largely absent from the geological record, account-ing for a strong bias in available local redox proxy data towardswater column anoxia.
Our interpretation is compatible with the latest reinterpretationof trace metal data, recognized proxies for the global ocean re-dox (Algeo and Rowe, 2012). Reinhard et al. (2013) used a simplemass balance model to show that the low trace metal abundancesin black shales prior to 630 Ma allow for a minimum of 60% ofthe seafloor to have been oxygenated throughout the Proterozoic.Given that the degree to which anoxia and/or euxinia extendedinto the water column from the seafloor remains completely un-constrained, anoxia may even have been restricted to microbialmatts covering the sediment–water interface (Pawlowska et al.,2013) or to a thin layer of bottom water, leaving most of thewater column oxygenated enough to allow nitrate accumulation(Fig. 1d). Therefore the unambiguous shift in trace metal abun-dance at 630 Ma (Och and Shields-Zhou, 2012; Partin et al., 2013;Reinhard et al., 2013; Sahoo et al., 2012), rather than heraldingdeep ocean oxygenation, may instead only record an increase inatmospheric O2, and hence dissolved O2, beyond a critical thresh-old, thereby increasing the penetration depth of O2 within seafloorsediments and hence total surface area of oxygenated seafloor oncontinental shelves. This may have been the threshold that per-mitted the earliest animals to evolve or develop more energy in-tensive metabolisms, such as burrowing and predation (Sperling etal., 2013).
6. Conclusions
The δ15Nsed datasets presented here (Figs. 2, 4 and 6) suggeststhat the global nitrogen cycle operated similarly in the second halfof the Neoproterozoic Era to in the modern ocean. If true, then itimplies that nitrate was stable in the latter Neoproterozoic ocean,which, by extension, was at least mildly oxygenated. This conclu-sion is compatible with recent modeling of trace element data thatsuggest that most of the global Proterozoic ocean was sufficientlyoxygenated to also accumulate trace metals (Partin et al., 2013;Reinhard et al., 2013). Although this hypothesis does not discount apossible rise in atmospheric and oceanic oxygen levels during this
M. Ader et al. / Earth and Planetary Science Letters 396 (2014) 1–13 11
period or significant fluctuations associated with snowball glacia-tions, it does suggest that the major transition from a dominantlyanoxic to oxygenated deep-ocean did not happen between ∼750and 580 Ma but rather sometime prior to 750 Ma, and perhapsmuch earlier in the Proterozoic.
Acknowledgements
The project was supported by a French MRT doctoral fellowshipand a SETSI grant to PS; two INSU (SYSTER) grants as well as anEmergences grant from Paris council (PI Magali Bonifacie) to MAand PS. RIFT and ACRN were supported by the INCT-Geociam pro-gram, and by FAPESP and CNPq grants. GPH acknowledges donorsof the American Chemical Society Petroleum Research Fund forpartial support of this research. GPH benefited from two monthof invitation to stay at IPGP. This is IPGP contribution 3512.
Appendix A. Supplementary material
Supplementary material related to this article can be found on-line at http://dx.doi.org/10.1016/j.epsl.2014.03.042.
References
Ader, M., Boudou, J.-P., Javoy, M., Goffe, B., Daniels, E., 1998. Isotope study on organicnitrogen of Westphalian anthracites from the Western Middle field of Penn-sylvania (U.S.A.) and from the Bramsche Massif (Germany). Org. Geochem. 29,315–323.
Ader, M., Cartigny, P., Boudou, J.-P., Oh, J.-H., Petit, E., Javoy, M., 2006. Nitrogenisotopic evolution of carbonaceous matter during metamorphism: Methodologyand preliminary results. Chem. Geol. 232, 152–169.
Ader, M., Macouin, M., Trindade, R.I.F., Hadrien, M.H., Yang, Z., Sun, Z., Besse, J., 2009.A multilayered water column in the Ediacaran Yangtze platform? Insights fromcarbonate and organic matter paired δ13C. Earth Planet. Sci. Lett. 288, 213–227.
Algeo, T., Rowe, H., 2012. Paleoceanographic applications of trace-metal concentra-tion data. Chem. Geol. 324–325, 6–18.
Algeo, T., Rowe, H., Hower, J.C., Schwark, L., Herrmann, A., Heckel, P., 2008. Changesin ocean denitrification during Late Carboniferous glacial–interglacial cycles.Nat. Geosci. 1, 709–714.
Arnaboldi, M., Meyers, P.A., 2006. Patterns of organic carbon and nitrogen isotopiccompositions of latest Pliocene sapropels from six locations across the Mediter-ranean Sea. Palaeogeogr. Palaeoclimatol. Palaeoecol. 235, 149–167.
Beaumont, V., Robert, F., 1999. Nitrogen isotope ratios of kerogens in Precam-brian cherts: a record of the evolution of atmosphere chemistry?. PrecambrianRes. 96, 63–82.
Bebout, G.E., Fogel, M.L., 1992. Nitrogen-isotope compositions of metasedimen-tary rocks in the Catalina Schist, California: Implications for metamorphic de-volatilization history. Geochim. Cosmochim. Acta 56, 2839–2849.
Boudou, J.-P., Schimmelmann, A., Ader, M., Mastalerz, M., Sebilo, M., Gengembre, L.,2008. Organic nitrogen chemistry during low-grade metamorphism. Geochim.Cosmochim. Acta 72, 1199–1221.
Boyle, R.A., Clark, J.R., Poulton, S.W., Shields-Zhou, G., Canfield, D.E., Lenton, T.M.,2013. Nitrogen cycle feedbacks as a control on euxinia in the mid-Proterozoicocean. Nat. Commun. 4, 1533.
Busigny, V., Cartigny, P., Philippot, P., Ader, M., Javoy, M., 2003. Massive recycling ofnitrogen and other fluid-mobile elements (K, Rb, Cs, H) in a cold slab environ-ment: evidences from HP to UHP oceanic metasediments of the Schistes Lustrésnappe (Western Alps, Europe). Earth Planet. Sci. Lett. 215, 27–42.
Busigny, V., Ader, M., Cartigny, P., 2005. Quantification and isotopic analysis of nitro-gen in rocks at the ppm level using sealed tube combustion technique: a pre-lude to the study of altered oceanic crust. Chem. Geol. 223, 249–258.
Busigny, V., Lebeau, O., Ader, M., Krapez, B., Bekker, A., 2013. Nitrogen cycle in theLate Archean ferruginous ocean. Chem. Geol. 362, 115–130.
Butterfield, N.J., 2009. Oxygen, animals and oceanic ventilation: an alternative view.Geobiology 7, 1–7.
Calvert, S.E., Bustin, R.M., Ingall, E.D., 1996. Influence of water column anoxia andsediment supply on the burial and preservation of organic carbon in marineshales. Geochim. Cosmochim. Acta 60, 1577–1593.
Canfield, D.E., Poulton, S.W., Narbonne, G.M., 2007. Late-Neoproterozoic deep-oceanoxygenation and the rise of animal life. Science 315, 92–94.
Canfield, D.E., Poulton, S.W., Knoll, A.H., Narbonne, G.M., Ross, G., Goldberg, T.,Strauss, H., 2008. Ferruginous conditions dominated later Neoproterozoic deep-water chemistry. Science 321, 949–952.
Canfield, D.E., Glazer, A.N., Falkowski, P.G., 2010. The evolution and future of earth’snitrogen cycle. Science 330, 192–196.
Cao, C., Love, G.D., Hays, L.E., Wang, W., Shen, S., Summons, R.E., 2009. Biogeo-chemical evidence for euxinic oceans and ecological disturbance presaging theend-Permian mass extinction event. Earth Planet. Sci. Lett. 281, 188–201.
Casciotti, K.L., Sigman, D.M., Ward, B.B., 2003. Linking diversity and stable isotopefractionation in ammonia-oxidizing bacteria. Geomicrobiol. J. 20, 335–353.
Close, H.G., Bovee, R., Pearson, A., 2011. Inverse carbon isotope patterns of lipids andkerogen record heterogeneous primary biomass. Geobiology 9, 250–265.
Cremonese, L., Shields-Zhou, G., Struck, U., Ling, H.-F., Och, L., Chen, X., Li, D., 2013.Marine biogeochemical cycling during the early Cambrian constrained by a ni-trogen and organic carbon isotope study of the Xiaotan section, South China.Precambrian Res. 225, 148–165.
Dumitrescu, M., Brassell, S.C., 2006. Compositional and isotopic characteristics oforganic matter for the early Aptian Oceanic Anoxic Event at Shatsky Rise, ODPLeg 198. Palaeogeogr. Palaeoclimatol. Palaeoecol. 235, 168–191.
Farquhar, J., Bao, H., Thiemens, M., 2000. Atmospheric influence of Earth’s earliestsulfur cycle. Science 289, 756–758.
Fennel, K., Follows, M., Falkowski, P.G., 2005. The co-evolution of the nitrogen, car-bon and oxygen cycles in the Proterozoic ocean. Am. J. Sci. 305, 526–545.
Fike, D.A., Grotzinger, J.P., Pratt, L.M., Summons, R.E., 2006. Oxidation of the Edi-acaran Ocean. Nature 444, 744–747.
Fuchsman, C., Murray, J.W., Konovalov, S.K., 2008. Concentration and natural stableisotope profiles of nitrogen species in the Black Sea. Mar. Chem. 111, 88–103.
Galbraith, E.D., Sigman, D., Pedersen, T., Robinson, R.S., 2008. Past changes inthe marine nitrogen cycle. In: Capone, D., Bronk, D., Mulholland, M., Car-penter, E. (Eds.), Nitrogen in the Marine Environment. 2nd edition. Elsevier,pp. 1497–1535.
Garvin, J., Buick, R., Anbar, A.D., Arnold, G.L., Kaufman, A.J., 2009. Isotopic evidencefor an aerobic nitrogen cycle in the latest Archean. Science 323, 1045–1048.
Godfrey, L.V., Falkowski, P.G., 2009. The cycling and redox state of nitrogen in theArchaean ocean. Nat. Geosci. 2, 725–729.
Godfrey, L.V., Poulton, S.W., Bebout, G.E., Fralick, P.W., 2013. Stability of the nitrogencycle during development of sulfidic water in the redox-stratified late Paleopro-terozoic Ocean. Geology 41, 655–658.
Granger, J., Sigman, D.M., Lehmann, M.F., Tortell, P.D., 2008. Nitrogen and oxygenisotope fractionation during dissimilatory nitrate reduction by denitrifying bac-teria. Limnol. Oceanogr. 53, 2533–2545.
Halverson, G.P., 2011. Glacial sediments and associated strata of the PolarisbreenGroup, northeastern Svalbard. In: Arnaud, E., Halverson, G.P., Shields-Zhou, G.(Eds.), The Geological Record of Neoproterozoic Glaciations. In: Geological Soci-ety Memoir, vol. 36. Geological Society, London, pp. 571–579.
Halverson, G.P., Shields-Zhou, G., 2011. Chemostratigraphy and the Neoproterozoicglaciations. In: Arnaud, E., Halverson, G.P., Shields-Zhou, G. (Eds.), The Geologi-cal Record of Neoproterozoic Glaciations. In: Geological Society Memoir, vol. 36.Geological Society, London, pp. 51–66.
Higgins, M.B., Robinson, R.S., Carter, S.J., Pearson, A., 2010. Evidence from chlorinnitrogen isotopes for alternating nutrient regimes in the Eastern MediterraneanSea. Earth Planet. Sci. Lett. 290, 102–107.
Higgins, M.B., Robinson, R.S., Husson, J.M., Carter, S.J., Pearson, A., 2012. Dominanteukaryotic export production during ocean anoxic events reflects the impor-tance of recycled NH+
4 . Proc. Natl. Acad. Sci. USA 109, 2269–2274.Hoffman, P.F., Schrag, D.P., 2002. The snowball Earth hypothesis: testing the limits
of global change. Terra Nova 14, 129–155.Jenkyns, H.C., Gröcke, D.R., Hesselbo, S.P., 2001. Nitrogen isotope evidence for water
mass denitrification during the Early Toarcian (Jurassic) Oceanic Anoxic Event.Paleoceanography 16, 593–603.
Jenkyns, H.C., Matthews, A., Tsikos, H., Erel, Y., 2007. Nitrate reduction, sulfate reduc-tion, and sedimentary iron isotope evolution during the Cenomanian–Turonianoceanic anoxic event. Paleoceanography 22, PA3208.
Jia, Y., 2006. Nitrogen isotope fractionations during progressive metamorphism:a case study from the Paleozoic Cooma metasedimentary complex, southeast-ern Australia. Geochim. Cosmochim. Acta 70, 5201–5214.
Jia, Y., Kerrich, R., 2004. Nitrogen 15–enriched Precambrian kerogen and hydrother-mal systems. Geochem. Geophys. Geosyst. 5, Q07005.
Johnston, D.T., Poulton, S.W., Goldberg, T., Sergeev, V.N., Podkovyrov, V., Vorob’eva,N.G., Bekker, A., Knoll, A.H., 2012. Late Ediacaran redox stability and metazoanevolution. Earth Planet. Sci. Lett. 335–336, 25–35.
Johnston, D.T., Poulton, S.W., Tosca, N.J., O’Brien, T., Halverson, G.P., Schrag,D.P., Macdonald, F.A., 2013. Searching for an oxygenation event in the fos-siliferous Ediacaran of northwestern Canada. Chem. Geol. 362, 273–286.http://dx.doi.org/10.1016/j.chemgeo.2013.08.046.
Junium, C.K., Arthur, M.A., 2007. Nitrogen cycling during the Cretaceous,Cenomanian–Turonian Oceanic Anoxic Event II. Geochem. Geophys. Geosyst. 8,Q03002.
Kah, L.C., Bartley, J.K., 2011. Protracted oxygenation of the Proterozoic biosphere. Int.Geol. Rev. 53, 1424–1442.
Kalvelage, T., Jensen, M.M., Contreras, S., Revsbech, N.P., Lam, P., Ganter, M., LaRoche,J., Lavik, G., Kuypers, M.M.M., 2011. Oxygen sensitivity of anammox and coupledN-cycle processes in oxygen minimum zones. PLoS ONE 6, e29299.
Kikumoto, R., Tahata, M., Nishizawa, M., Sawaki, Y., Maruyama, S., Shu, D., Han, J.,Komiya, T., Takai, K., Ueno, Y., 2014. Nitrogen isotope chemostratigraphy of the
12 M. Ader et al. / Earth and Planetary Science Letters 396 (2014) 1–13
Ediacaran and Early Cambrian platform sequence at Three Gorges, South China.Gondwana Res. 25, 1057–1069.
Kimura, H., Matsumoto, R., Kakuwa, Y., Hamdi, B., Zibaseresht, H., 1997. TheVendian–Cambrian δ13C record, North Iran: evidence for overturning of theocean before the Cambrian Explosion. Earth Planet. Sci. Lett. 147, E1–E7.
Kump, L.R., Pavlov, A., Arthur, M.A., 2005. Massive release of hydrogen sulfide to thesurface ocean and atmosphere during intervals of oceanic anoxia. Geology 33,397–400.
Kump, L., Junium, C., Arthur, M.A., Brasier, A., Fallick, A., Melezhik, V., Lepland, A.,Crne, A.E., Luo, G., 2011. Isotopic evidence for massive oxidation of organic mat-ter following the great oxidation event. Science 334, 1694–1696.
Kuypers, M.M., Blokker, P., Hopmans, E.C., Kinkel, H., Pancost, R.D., Schouten, S.,Sinninghe Damsté, J.S., 2002. Archaeal remains dominate marine organic mat-ter from the early Albian oceanic anoxic event 1b. Palaeogeogr. Palaeoclimatol.Palaeoecol. 185, 211–234.
Kuypers, M.M., van Breugel, Y., Schouten, S., Erba, E., Damsté, J.S.S., 2004. N2-fixingcyanobacteria supplied nutrient N for Cretaceous oceanic anoxic events. Geol-ogy 32, 853–856.
Lam, P., Kuypers, M.M.M., 2011. Microbial nitrogen cycling processes in oxygen min-imum zones. Mar. Sci. Ann. Rev. 3, 317–345.
Lam, P., Lavik, G., Jensen, M.M., van de Vossenberg, J., Schmid, M., Woebken, D.,Dimitri Gutiérrez, D., Amann, R., Jetten, M.S.M., Kuypers, M.M.M., 2009. Revisingthe nitrogen cycle in the Peruvian oxygen minimum zone. Proc. Natl. Acad. Sci.USA 106, 4752–4757.
LaPorte, D.F., Holmden, C., Patterson, W.P., Loxton, J.D., Melchin, M.J., Mitchell, C.E.,Finney, S.C., Sheets, H.D., 2009. Local and global perspectives on carbon andnitrogen cycling during the Hirnantian glaciation. Palaeogeogr. Palaeoclimatol.Palaeoecol. 276, 182–195.
Lavik, G., Stuhrmann, T., Bruchert, V., Van der Plas, A., Mohrholz, V., Lam, P., Musz-mann, M., Fuchs, B.M., Amann, R., Lass, U., Kuypers, M.M.M., 2009. Detoxificationof sulphidic African shelf waters by blooming chemolithotrophs. Nature 457,581–584.
Lehmann, M.F., Sigman, D.M., McCorkle, D.C., Granger, J., Hoffmann, S., Cane, G.,Brunelle, B.G., 2007. The distribution of nitrate 15N/14N in marine sedimentsand the impact of benthic nitrogen loss on the isotopic composition of oceanicnitrate. Geochim. Cosmochim. Acta 71, 5384–5404.
Levman, B.G., Bitter, P.H.v., 2002. The Frasnian–Famennian (mid-Late Devonian)boundary in the type section of the Long Rapids Formation, James Bay Low-lands, northern Ontario, Canada. Can. J. Earth Sci. 39, 1795–1818.
Li, C., Love, G.D., Lyons, T.W., Fike, D.A., Sessions, A.L., Chu, X., 2010. A stratifiedredox model for the Ediacaran Ocean. Science 328, 80–83.
Li, C., Love, G.D., Lyons, T.W., Scott, C.T., Feng, L., Huang, J., Chang, H., Zhang, Q.,Chu, X., 2012. Evidence for a redox stratified Cryogenian marine basin, DatangpoFormation, South China. Earth Planet. Sci. Lett. 331–332, 246–256.
Li, C., Evans, D.A.D., Halverson, G.P., 2013. Neoproterozoic glaciations in a revisedglobal paleogeography from the breakup of Rodinia to the assembly of Gond-wanaland. Sediment. Geol. 294, 219–232.
Logan, G.A., Hayes, J.M., Hieshima, G.B., Summons, R.E., 1995. Terminal Proterozoicreorganization of biogeochemical cycles. Nature 376, 53–56.
Luo, G., Wang, Y., Algeo, T.J., Kump, L.R., Bai, X., Yang, H., Yao, L., Xie, S., 2011.Enhanced nitrogen fixation in the immediate aftermath of the latest Permianmarine mass extinction. Geology 39, 647–650.
Lyons, T.W., Reinhard, C.T., Planavsky, N.J., 2014. The rise of oxygen in Earth’s earlyocean and atmosphere. Nature 506, 307–315.
Macdonald, F.A., Schmitz, M.D., Crowley, J.L., Roots, C.F., Jones, D.S., Maloof, A.C.,Strauss, J.V., Cohen, P.A., Johnston, D.T., Schrag, D.P., 2010. Calibrating the cryo-genian. Science 327, 1241–1243.
Macouin, M., Besse, J., Ader, M., Gilder, S., Yang, Z., Sun, Z., Agrinier, P., 2004.Combined paleomagnetic and isotopic data from the Doushantuo carbonates,South China: implications for the “snowball Earth” hypothesis. Earth Planet. Sci.Lett. 224, 387–398.
Mandernack, K.W., Mills, C.T., Johnson, C.A., Rahn, T., Kinney, C., 2009. The δ15N andδ18O values of N2O produced during the co-oxidation of ammonia by methan-otrophic bacteria. Chem. Geol. 267, 96–107.
Mariotti, A., Germon, J.C., Hubert, P., Kaiser, P., Letolle, R., Tardieux, A., Tardieux,P., 1981. Experimental determination of nitrogen kinetic isotope fractionation:some principles; illustration for the denitrification and nitrification processes.Plant Soil 62, 413–430.
McFadden, K.A., Huang, J., Chu, X., Jiang, G., Kaufman, A.J., Zhou, C., Yuan, X., Xiao,S., 2007. Pulsed oxidation and biological evolution in the Ediacaran DoushantuoFormation. Proc. Natl. Acad. Sci. USA 105, 3197–3202.
Meckler, A.N., Haug, G.H., Sigman, D.M., Plessen, B., Petersen, L.C., Thierstein, H.R.,2007. Detailed sedimentary N isotope records from Cariaco Basin for Termi-nations I and V: local and global implications. Glob. Biogeochem. Cycles 21,GB4019.
Meyers, P.A., 2006. Paleoceanographic and paleoclimatic similarities betweenMediterranean sapropels and Cretaceous black shales. Palaeogeogr. Palaeoclima-tol. Palaeoecol. 235, 305–320.
Meyers, P.A., Bernasconi, S.M., 2005. Carbon and nitrogen isotope excursions in mid-Pleistocene sapropels from the Tyrrhenian Basin: evidence for climate-inducedincreases in microbial primary production. Mar. Geol. 220, 41–58.
Mingram, B., Brauer, K., 2001. Ammonium concentration and nitrogen isotope com-position in metasedimentary rocks from different tectonometamorphic units ofthe European Variscan Belt. Geochim. Cosmochim. Acta 65, 273–287.
Möbius, J., 2013. Isotope fractionation during nitrogen remineralization (ammoni-fication): Implications for nitrogen isotope biogeochemistry. Geochim. Cos-mochim. Acta 105, 422–432.
Narbonne, G.M., Gehling, J.G., 2003. Life after snowball: the oldest complex Edi-acaran fossils. Geology 31, 27–30.
Och, L.M., Shields-Zhou, G.A., 2012. The Neoproterozoic oxygenation event: environ-mental perturbations and biogeochemical cycling. Earth-Sci. Rev. 110, 26–57.
Olcott, A.N., Sessions, A.L., Corsetti, F.A., Kaufman, A.J., de Oliviera, T.F., 2005.Biomarker evidence for photosynthesis during Neoproterozoic glaciation. Sci-ence 310, 471–474.
Pantke, C., Obst, M., Benzerara, K., Morin, G., Ona-Nguema, G., Dippo, U., Kappler,A., 2012. Green rust during Fe(II) oxidation by nitrate-reducing acidovorax sp.strain BoFeN1. Environ. Sci. Technol. 46, 1439–1446.
Papineau, D., Purohit, R., Goldberg, T., Pi, D., Shields, G.A., Bhu, H., Steele, A., Fo-gel, M.L., 2009. High primary productivity and nitrogen cycling after the Paleo-proterozoic phosphogenic event in the Aravalli Supergroup, India. PrecambrianRes. 171, 37–56.
Papineau, D., Purohit, R., Fogel, M.L., Shields-Zhou, G.A., 2013. High phosphate avail-ability as a possible cause for massive cyanobacterial production of oxygen inthe Paleoproterozoic atmosphere. Earth Planet. Sci. Lett. 362, 225–236.
Partin, C.A., Bekker, A., Planavsky, N.J., Scott, C.T., Gill, B.C., Li, C., Podkovyrov, V.,Maslov, A., Konhauser, K.O., Lalonde, S.V., Love, G.D., Poulton, S.W., Lyons, T.W.,2013. Large-scale fluctuations in Precambrian atmospheric and oceanic oxygenlevels from the record of U in shales. Earth Planet. Sci. Lett. 369–370, 284–293.
Pawlowska, M.M., Butterfield, N.J., Brocks, J.J., 2013. Lipid taphonomy in the Protero-zoic and the effect of microbial mats on biomarker preservation. Geology 41,103–106.
Pennock, J.R., Velinsky, D.J., Ludlam, J.M., Sharp, J.H., Fogel, M.L., 1996. Isotopic frac-tionation of ammonium and nitrate during uptake by Skeletonema costatum:implications for δ15N dynamics under bloom conditions. Limnol. Oceanogr. 41,451–459.
Pinti, D.L., Hashizume, K., Sugihara, A., Massault, M., Philippot, P., 2009. Isotopicfractionation of nitrogen and carbon in Paleoarchean cherts from Pilbara cra-ton, Western Australia: origin of 15N-depleted nitrogen. Geochim. Cosmochim.Acta 73, 3819–3848.
Planavsky, N.J., McGoldrick, P., Scott, C.T., Li, C., Reinhard, C.T., Kelly, A.E., Chu, X.,Bekker, A., Love, G.D., Lyons, T.W., 2011. Widespread iron-rich conditions in themid-Proterozoic ocean. Nature 477, 448–451.
Poulton, S.W., Canfield, D.E., 2011. Ferruginous conditions: a dominant feature of theOcean through Earth’s history. Elements 7, 107–112.
Quan, T.M., Falkowski, P.G., 2009. Redox control of N:P ratios in aquatic ecosystems.Geobiology 7, 124–139.
Quan, T.M., van de Schootbrugge, B., Field, M.P., Rosenthal, Y., Falkowski, P.G., 2008.Nitrogen isotope and trace metal analyses from the Mingolsheim core (Ger-many): evidence for redox variations across the Triassic–Jurassic boundary. Glob.Biogeochem. Cycles 22, GB2014.
Reinhard, C.T., Planavsky, N.J., Robbins, L.J., Partin, C.A., Gill, B.C., Lalonde, S.V.,Bekker, A., Konhauser, K.O., Lyons, T.W., 2013. Proterozoic ocean redox and bio-geochemical stasis. Proc. Natl. Acad. Sci. USA 110, 5357–5362.
Robinson, R.S., Kienast, M., Luiza Albuquerque, A., Altabet, M., Contreras, S., De PolHolz, R., Dubois, N., Francois, R., Galbraith, E., Hsu, T.-C., Ivanochko, T., Jaccard,S., Kao, S.-J., Kiefer, T., Kienast, S., Lehmann, M., Martinez, P., McCarthy, M.,Möbius, J., Pedersen, T., Quan, T.M., Ryabenko, E., Schmittner, A., Schneider, R.,Schneider-Mor, A., Shigemitsu, M., Sinclair, D., Somes, C., Studer, A., Thunell, R.,Yang, J.-Y., 2012. A review of nitrogen isotopic alteration in marine sediments.Paleoceanography 27, PA4203.
Sachs, J.P., Repeta, D.J., Goericke, R., 1999. Nitrogen and carbon isotopic ratiosof chlorophyll from marine phytoplankton. Geochim. Cosmochim. Acta 63,1431–1441.
Sahoo, S.K., Planavsky, N.J., Kendall, B., Wang, X., Shi, X., Scott, C., Anbar, A.D., Lyons,T.W., Jiang, G., 2012. Ocean oxygenation in the wake of the Marinoan glaciation.Nature 489, 546–549.
Sansjofre, P., 2011. L’environnement post-marinoen (ca. 635 ma): une étude multi-proxy de la plateforme carbonatée du Groupe d’Araras (Mato Grosso, Brésil).PhD thesis. Université Paris-Diderot. 287 pp.
Sansjofre, P., Ader, M., Trindade, R.I.F., Elie, M., Lyons, J., Cartigny, P., Nogueira, A.C.R.,2011. A carbon isotope challenge to the snowball Earth. Nature 478, 93–96.
Sansjofre, P., Trindade, R.I.F., Ader, M., Soares, J.L., Nogueira, A.C.R., Tribovillard,N., 2014. Paleoenvironmental reconstruction of the Ediacaran Araras platform(Western Brazil) from the sedimentary and trace metals record. PrecambrianRes. 241, 185–202.
Santoro, A.E., Casciotti, K.L., 2011. Enrichment and characterization of ammonia-oxidizing archaea from the open ocean: phylogeny, physiology and stable iso-tope fractionation. ISME J. 5, 1796–1808.
Scholz, F., Severmann, S., McManus, J., Hensen, C., 2014. Beyond the BlackSea paradigm: The sedimentary fingerprint of an open-marine iron shuttle.Geochim. Cosmochim. Acta 127, 368–380.
M. Ader et al. / Earth and Planetary Science Letters 396 (2014) 1–13 13
Schroder, S., Grotzinger, J.P., 2007. Evidence for anoxia at the Ediacaran–Cambrianboundary: the record of redox-sensitive trace elements and rare earth elementsin Oman. J. Geol. Soc. Lond. 164, 175–187.
Scott, C., Lyons, T.W., Bekker, A., Shen, Y., Poulton, S.W., Chu, X., Anbar, A.D.,2008. Tracing the stepwise oxygenation of the Proterozoic ocean. Nature 452,456–459.
Shen, B., Zhang, T., Hoffman, P.F., 2008. Stratification and mixing of a post-glacialNeoproterozoic ocean: evidence from carbon and sulfur isotopes in a cap dolo-stone from northwest China. Earth Planet. Sci. Lett. 265, 209–228.
Shen, B., Xiao, S., Bao, H., Kaufman, A.J., Zhou, C., Yuan, X., 2011. Carbon, sulfur,and oxygen isotope evidence for a strong depth gradient and oceanic oxidationafter the Ediacaran Hankalchough glaciation?. Geochim. Cosmochim. Acta 75,1357–1373.
Sigman, D.M., DiFiore, P.J., Hain, M.P., Deutsch, C., Wang, Y., Karl, D.M., Knapp, A.N.,Lehmann, M.F., Pantoja, S., 2009a. The dual isotopes of deep nitrate as a con-straint on the cycle and budget of oceanic fixed nitrogen. Deep-Sea Res., Part 1,Oceanogr. Res. Pap. 56, 1419–1439.
Sigman, D.M., Karsh, K.L., Casciotti, K.L., 2009b. Nitrogen isotopes in the ocean. In:Steele, J.H., Thorpe, S.A., Turekian, K.K. (Eds.), Encyclopedia of Ocean Sciences.Academic Press, Oxford, pp. 40–54.
Sliwinski, M.G., Whalen, M.T., Newberry, R.J., Payne, J.H., Day, J.E., 2011. Stable iso-tope (δ13Ccarb and org, δ15Norg) and trace element anomalies during the LateDevonian ‘punctata Event’ the Western Canada Sedimentary Basin. Palaeogeogr.Palaeoclimatol. Palaeoecol. 307, 245–271.
Somes, C.J., Schmittner, A., Galbraith, E.D., Lehmann, M.F., Altabet, M.A., Montoya,J.P., Letelier, R.M., Mix, A.C., Bourbonnais, A., Eby, M., 2010. Simulating the globaldistribution of nitrogen isotopes in the ocean. Glob. Biogeochem. Cycles 24,GB4019.
Spangenberg, J.E., Bagnoud-Velãsquez, M., Boggiani, P.C., Gaucher, C., 2014. Re-dox variations and bioproductivity in the Ediacaran: evidence from inorganicand organic geochemistry of the Corumbá Group, Brazil. Gondwana Res..http://dx.doi.org/10.1016/j.gr.2013.08.014.
Sperling, E.A., Halverson, G.P., Knoll, A.H., Macdonald, F.A., Johnston, D.T., 2013.A basin redox transect at the dawn of animal life. Earth Planet. Sci.Lett. 371–372, 143–155.
Stüeken, E.E., 2013. A test of the nitrogen-limitation hypothesis for retarded eu-karyote radiation: nitrogen isotopes across a Mesoproterozoic basinal profile.Geochim. Cosmochim. Acta 120, 121–139.
Tesdal, J.E., Galbraith, E.D., Kienast, M., 2013. Nitrogen isotopes in bulk marine sedi-ment: linking seafloor observations with subseafloor records. Biogeosciences 10,101–118.
Thamdrup, B., Dalsgaard, T., Revsbech, N.P., 2012. Widespread functional anoxia inthe oxygen minimum zone of the Eastern South Pacific. Deep Sea Research PartI. Deep-Sea Res., Part 1, Oceanogr. Res. Pap. 65, 36–45.
Thomazo, C., Pinti, D.L., Busigny, V., Ader, M., Hashizume, K., Philippot, P., 2009.Biological activity and the Earth’s surface evolution: insights from carbon, sul-fur, nitrogen and iron stable isotopes in the rock record. C. R., Palévol 8,665–678.
Thomazo, C., Ader, M., Philippot, P., 2011. Extreme 15N-enrichments in 2.72-Gyr-oldsediments: evidence for a turning point in the nitrogen cycle. Geobiology 9,107–120.
Thunell, R.C., Sigman, D.M., Muller-Karger, F., Astor, Y., Varela, R., 2004. Nitrogenisotope dynamics of the Cariaco Basin, Venezuela. Glob. Biogeochem. Cycles 18,GB3001.
Voss, M., Dippner, J.W., Montoya, J.P., 2001. Nitrogen isotope patterns in the oxygen-deficient waters of the Eastern Tropical North Pacific Ocean. Deep Sea ResearchPart I. Deep-Sea Res., Part 1, Oceanogr. Res. Pap. 48, 1905–1921.
Wang, L., Shi, X., Jiang, G., 2012. Pyrite morphology and redox fluctuationsrecorded in the Ediacaran Doushantuo Formation. Palaeogeogr. Palaeoclimatol.Palaeoecol. 333, 218–227.
Weber, K.A., Achenbach, L.A., Coates, J.D., 2006. Microorganisms pumping iron:anaerobic microbial iron oxidation and reduction. Nat. Rev. Microbiol. 4,752–764.
Wenk, C.B., Blees, J., Zopfi, J., Veronesi, M.L., Bourbonnais, A., Schubert, C.J., Niemann,H., Lehmann, M.F., 2013. Anaerobic ammonium oxidation (anammox) bacteriaand sulfide-dependent denitrifiers coexist in the water column of a meromicticsouth-alpine lake. Limnol. Oceanogr. 58, 1–12.
Wenk, C.B., Zopfi, J., Blees, J., Veronesi, M., Niemann, H., Lehmann, M.F., 2014.Community N and O isotope fractionation by sulfide-dependent denitrificationand anammox in a stratified lacustrine water column. Geochim. Cosmochim.Acta 125, 551–563.
Yui, T.-F., Kao, S.-J., Wu, T.-W., 2009. Nitrogen and N-isotope variation during low-grade metamorphism of the Taiwan mountain belt. Geochem. J. 43, 15–27.
Zerkle, A.L., Junium, C.K., Canfield, D.E., House, C.H., 2008. Production of 15N-depleted biomass during cyanobacterial N2-fixation at high Fe concentrations.J. Geophys. Res. 113, G03014.
1
Geological background
1 Yangjiaping section, Hunan province, South China 1.1 Geologic background 1.2 Sampled section
2 Araras platform sections 2.1 Geologic background 2.2 Sampled sections
3 Northeast Svalbard composite section 3.1 Geologic background 3.2 Sampled sections 3.3 FeT/Al analyses
4 Northwest Canada composite section
References
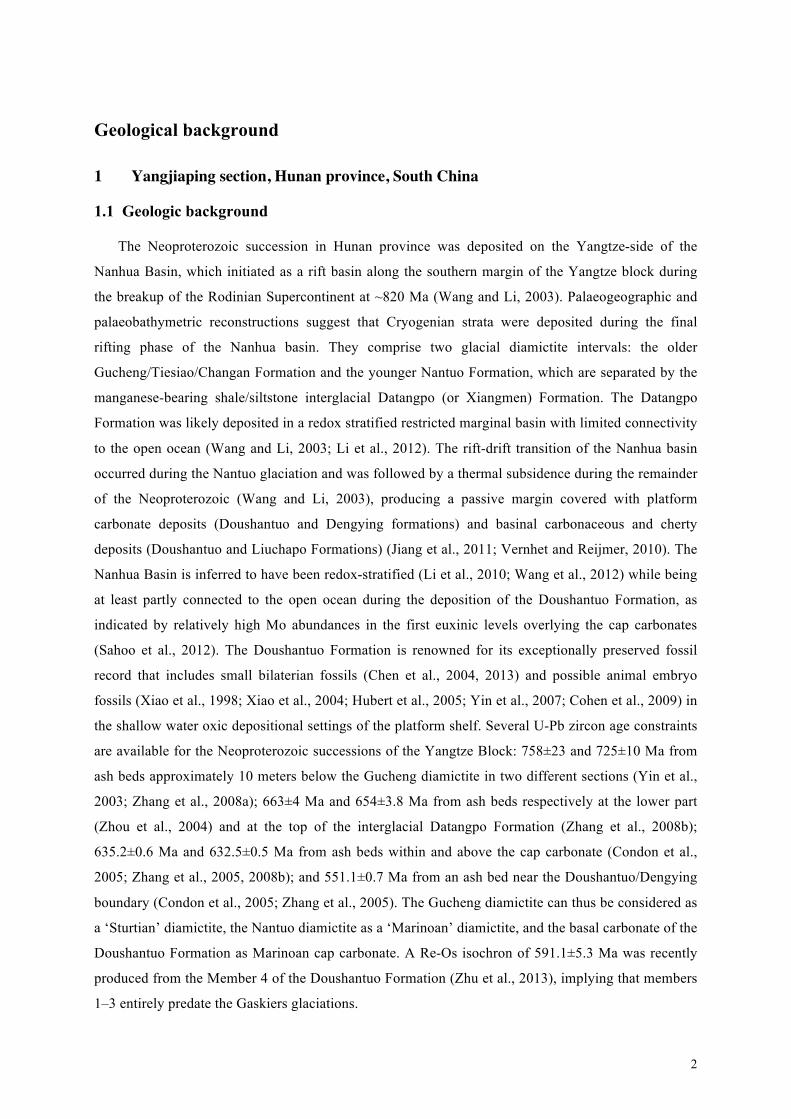
2
Geological background
1 Yangjiaping section, Hunan province, South China
1.1 Geologic background
The Neoproterozoic succession in Hunan province was deposited on the Yangtze-side of the
Nanhua Basin, which initiated as a rift basin along the southern margin of the Yangtze block during
the breakup of the Rodinian Supercontinent at ~820 Ma (Wang and Li, 2003). Palaeogeographic and
palaeobathymetric reconstructions suggest that Cryogenian strata were deposited during the final
rifting phase of the Nanhua basin. They comprise two glacial diamictite intervals: the older
Gucheng/Tiesiao/Changan Formation and the younger Nantuo Formation, which are separated by the
manganese-bearing shale/siltstone interglacial Datangpo (or Xiangmen) Formation. The Datangpo
Formation was likely deposited in a redox stratified restricted marginal basin with limited connectivity
to the open ocean (Wang and Li, 2003; Li et al., 2012). The rift-drift transition of the Nanhua basin
occurred during the Nantuo glaciation and was followed by a thermal subsidence during the remainder
of the Neoproterozoic (Wang and Li, 2003), producing a passive margin covered with platform
carbonate deposits (Doushantuo and Dengying formations) and basinal carbonaceous and cherty
deposits (Doushantuo and Liuchapo Formations) (Jiang et al., 2011; Vernhet and Reijmer, 2010). The
Nanhua Basin is inferred to have been redox-stratified (Li et al., 2010; Wang et al., 2012) while being
at least partly connected to the open ocean during the deposition of the Doushantuo Formation, as
indicated by relatively high Mo abundances in the first euxinic levels overlying the cap carbonates
(Sahoo et al., 2012). The Doushantuo Formation is renowned for its exceptionally preserved fossil
record that includes small bilaterian fossils (Chen et al., 2004, 2013) and possible animal embryo
fossils (Xiao et al., 1998; Xiao et al., 2004; Hubert et al., 2005; Yin et al., 2007; Cohen et al., 2009) in
the shallow water oxic depositional settings of the platform shelf. Several U-Pb zircon age constraints
are available for the Neoproterozoic successions of the Yangtze Block: 758±23 and 725±10 Ma from
ash beds approximately 10 meters below the Gucheng diamictite in two different sections (Yin et al.,
2003; Zhang et al., 2008a); 663±4 Ma and 654±3.8 Ma from ash beds respectively at the lower part
(Zhou et al., 2004) and at the top of the interglacial Datangpo Formation (Zhang et al., 2008b);
635.2±0.6 Ma and 632.5±0.5 Ma from ash beds within and above the cap carbonate (Condon et al.,
2005; Zhang et al., 2005, 2008b); and 551.1±0.7 Ma from an ash bed near the Doushantuo/Dengying
boundary (Condon et al., 2005; Zhang et al., 2005). The Gucheng diamictite can thus be considered as
a ‘Sturtian’ diamictite, the Nantuo diamictite as a ‘Marinoan’ diamictite, and the basal carbonate of the
Doushantuo Formation as Marinoan cap carbonate. A Re-Os isochron of 591.1±5.3 Ma was recently
produced from the Member 4 of the Doushantuo Formation (Zhu et al., 2013), implying that members
1–3 entirely predate the Gaskiers glaciations.
3
1.2 Sampled section
Our samples were collected in the Yangjiaping section in the northwest Hunan province (29°58′N
and 110°43′E). The Datangpo, Doushantuo and Dengying formations in the Yangjiaping section were
deposited in a shallow platform setting (Jiang et al., 2011; Li et al., 2012), which was oxic according
to trace metal contents, pyrite morphology, δ13Ccarb and paired carbon isotopes patterns (Ader et al.,
2009; Wang et al., 2012; Li et al., 2012).
In this section (Fig. 4d of the main text), the Datangpo Formation is composed of ~20 cm of marly
mudstone with a δ13Ccalcite of -5.2‰ (Ader et al., 2009), followed upward by 3 m of black shales and 1
m of grey siltstones just below the contact with the 90 m diamictites of the Nantuo Formation. Above
the Nantuo Formation, the Doushantuo Formation records only two of the three negative δ13Ccarb
excursions identified in the inner-shelf basin (Lambert et al., 1987; Li et al., 1999; Kimura et al., 2005;
Zhu et al., 2007; Ader et al., 2009; Kinumitsu et al., 2011). It begins with a 4 m-thick, finely
laminated, light grey cap dolostone recording the first negative δ13Ccarb excursion (δ13Ccarb -5 ± 0.5‰),
followed by 35 m of discontinuous exposure of black shales and dolomitic shales showing a
progressive increase of δ13Ccarb towards +1‰ and giving way to a covered interval of shales
(Kunimitsu et al., 2011). The outcrop resumes with 100 m of dark grey laminated to oolitic limestone
recording a positive δ13Ccarb plateau starting at around +5‰ and shifting to +7‰ after 20 meters (Zhu
et al., 2007; Ader et al., 2009; Kunimitsu et al., 2011). Above, 100 m of dark grey dolostones,
interrupted by a massive phosphoritic intercalation, record the second δ13Cdolomite negative excursion
(δ13Ccarb = 0‰) with extremely variable δ13Ccalcite interpreted as diagenetic (Ader et al., 2009; Macouin
et al., 2004, 2012). The transition between these dark grey dolostones and the overlying light grey
dolostones is accompanied by a return of δ13Cdolomite to values of +5‰. Different authors place the
Doushantuo/Dengying contact either at this transition (possibly owing to the fact that the Dengying
Formation contains only positive δ13Ccarb values elsewhere in the shelf region (Ader et al., 2009;
Kunimitsu et al., 2011; Macouin et al., 2004) or at the top of the phosphorite intercalation, based on
sequence stratigraphic arguments (Zhu et al., 2007; Jiang et al., 2011). Here we adopt the latter
position for the boundary, as we did in our most recent paper (Macouin et al., 2012), although we note
that this choice bears no consequence on the conclusions of our present or previous studies in which
we adopted the former position for the boundary (Ader et al., 2009; Macouin et al., 2004, 2012).
2 Araras platform sections
2.1 Geologic background
Ediacaran carbonates occur on the southeastern margin of the Amazonian craton in central western
Brazil (Fig. S1a). They comprise four lithostratigraphic units of the Araras Group. The basal Mirassol
d´Oeste Formation is mainly composed of dolostones and stromatolites. This unit is overlain by the
4
Guia Formation, which comprises bituminous fine-grained limestones and subordinate shales and
calcareous breccias (calcirudites). The Mirassol d’Oeste Formation and the base of the Guia Formation
correspond to the cap carbonate sequence described by Hoffman et al. (2007). The upper units are the
Serra do Quilombo Formation, composed of fine-grained dolostones, sandy dolostones and dolomitic
breccias, and the Nobres Formation, comprising fine-grained dolostones, sandstones, breccias,
dolomitic conglomerates, mudstones and abundant levels of chert (Fig. S1b). The calcareous and
mixed succession of the Araras Group was deposited on a shallow to deep platform (Mirassol d´Oeste,
Guia and lower Serra do Quilombo) and tide- and storm- influenced platform (Upper Serra do
Quilombo and Nobres), which developed on a passive margin that formed during Rodinia break-up.
The Araras cap carbonate sequence lies atop diamictites of the Puga Formation in the cratonic region
and cover the low-grade metamorphic basement of the Paraguay Belt within the belt (Fig. S1b). The
striking difference in metamorphic imprint and deformation between the low-greenschist foliated
Paraguay belt basement and its non-metamorphosed cover has been classically used as a regional
stratigraphic criteria to define the base of the Puga and Araras succession (Almeida and Hasuy, 1984
and references therein). Based on chemostratigraphic data (i.e. carbon and strontium isotopes) and two
Pb-Pb radiometric ages of 627 ± 32 Ma and 622 ± 33 Ma obtained on the base of the Guia Formation,
the Puga Formation has been correlated to the Marinoan glaciation (Babinski et al., 2006; Nogueira et
al., 2007; Romero et al., 2013).
2.2 Sampled sections
In this study we report δ15N analysis on samples from four sections that include the Mirassol d’Oeste
and Guia formations. Their depositional environments range from the inner-shelf to the ramp and
slope of the Araras carbonate platform (Fig. S1b). The carbonate rocks of the Terconi section are
exposed in the cratonic area and were deposited in the inner shelf setting (Fig. S1b). The burial
temperature undergone by these carbonates has remained lower than 100°C according to their
magnetic mineralogy (Font et al., 2006) as well as both molecular organic geochemistry (Elie et al.,
2007) together with Rock-Eval pyrolysis results (see supplementary material of Sansjofre et al., 2011).
The carbonate succession of the Camil, Carmelo and Copacel sections, located in the Paraguay Belt,
were deposited in the outer shelf setting (Fig. S1b). Besides faulting and folding, these successions
have undergone higher burial temperatures resulting in a chemical remagnetization (Font et al., 2006)
but they present no sign of penetrative cleavage or metamorphism. All four sections have been
described in several papers (Elie et al., 2007; Font et al., 2006; Nogueira et al., 2007, 2003; Romero et
al., 2013; Sansjofre et al., 2011, 2014; Soares and Nogueira, 2008). Here we only provide a brief
description of their lithologies (Fig. 4a,b,c), sedimentary features and of their associated depositional
context.
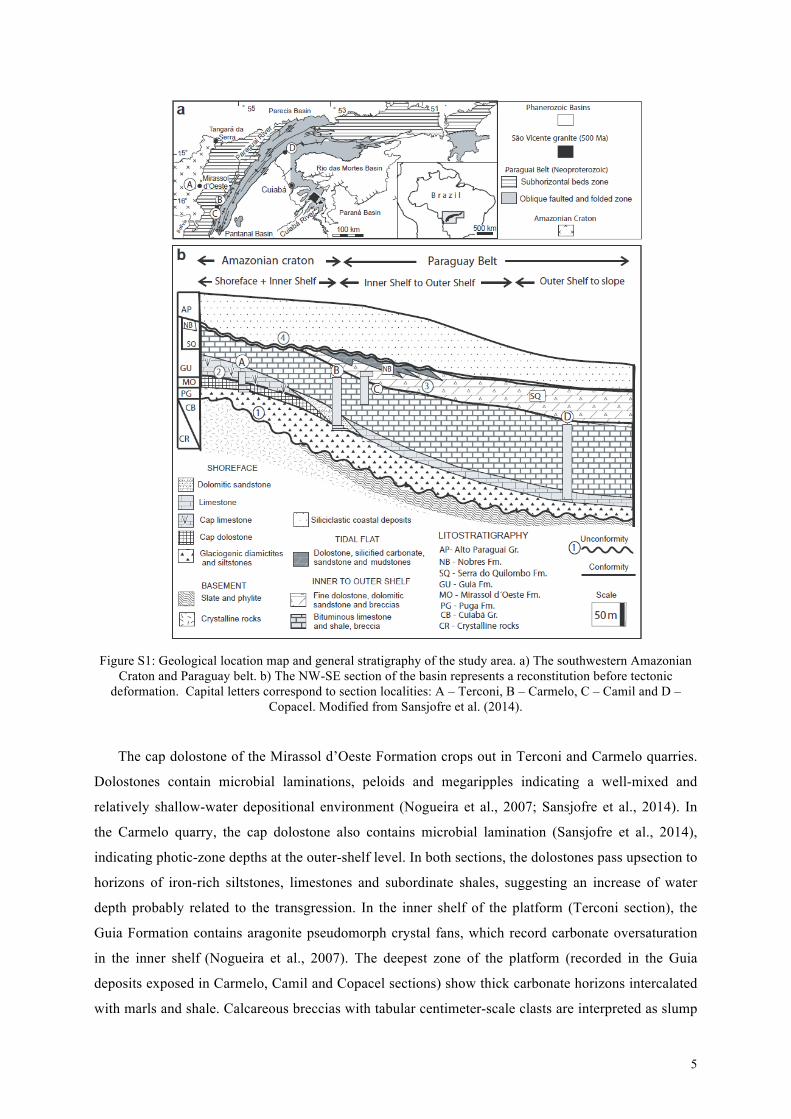
5
Figure S1: Geological location map and general stratigraphy of the study area. a) The southwestern Amazonian
Craton and Paraguay belt. b) The NW-SE section of the basin represents a reconstitution before tectonic deformation. Capital letters correspond to section localities: A – Terconi, B – Carmelo, C – Camil and D –
Copacel. Modified from Sansjofre et al. (2014).
The cap dolostone of the Mirassol d’Oeste Formation crops out in Terconi and Carmelo quarries.
Dolostones contain microbial laminations, peloids and megaripples indicating a well-mixed and
relatively shallow-water depositional environment (Nogueira et al., 2007; Sansjofre et al., 2014). In
the Carmelo quarry, the cap dolostone also contains microbial lamination (Sansjofre et al., 2014),
indicating photic-zone depths at the outer-shelf level. In both sections, the dolostones pass upsection to
horizons of iron-rich siltstones, limestones and subordinate shales, suggesting an increase of water
depth probably related to the transgression. In the inner shelf of the platform (Terconi section), the
Guia Formation contains aragonite pseudomorph crystal fans, which record carbonate oversaturation
in the inner shelf (Nogueira et al., 2007). The deepest zone of the platform (recorded in the Guia
deposits exposed in Carmelo, Camil and Copacel sections) show thick carbonate horizons intercalated
with marls and shale. Calcareous breccias with tabular centimeter-scale clasts are interpreted as slump
6
and debris flow deposits, consistent with a slope setting (Sansjofre et al., 2014). The trace metal
contents in these samples indicate a fully oxygenated water column for most of the time interval
studied here, with possible episodic excursions of pore water anoxia extending up to the sediment-
water interface in the slope depositional environment (Sansjofre et al., 2014).
3 Northeast Svalbard composite section
3.1 Geologic background
Neoproterozoic strata in northeast Svalbard comprise the Veteranen, Akademikerbreen, and
Polarisbreen groups, which occur in a narrow fold and thrust belt spanning from northeastern
Spitsbergen to northwest Nordaustlandet. These rocks are best exposed and have been most studied on
nunataks in Spitsbergen and along the coast around Murchisonfjord in Nordaustlandet. Although age
constraints are poor for these strata, the glacigenic Petrovbreen Member and Wilsonbreen Formation
within the middle Polarisbreen Group are widely accepted to be Cryogenian in age, representing a
typical older (‘Sturtian’) and younger (‘Marinoan’ or end-Cryogenian) glaciation (Halverson, 2011).
These units correlate with glacial strata in the Tillite Group of East Greenland, and together, the
Neoproterozoic sedimentary rocks of NE Svalbard and East Greenland appear to have been deposited
in a broad, thermally subsiding basin, perhaps affected by minor basement uplift at the onset the
Polarisbreen Group. The Polarisbreen Group likely spans from ~750 Ma to the middle Ediacaran
(~590 Ma) (Halverson, 2011), judging from the absence of evidence for the Gaskiers glaciation and
Shuram negative δ13C anomaly and the lack of Ediacaran fossils. The entire Neoproterozoic
succession was affected by Caledonian and Paleogene orogenesis and Carboniferous extension, but
most deformation was concentrated on major structural lineaments, such as the Lomfjorden Fault
Zone. Locally, the Polarisbreen Group was intruded by Caledonian granites and by Cretaceous
dolerites related to the High Arctic Large Igneous Province (Maher, 2001), and rocks are
metamorphosed to hornfels facies. However, the Polarisbreen is generally only lightly metamorphosed
(sub-greenschist facies) and lacks penetrative cleavage away from the cores of folds.
3.2 Sampled sections
The stratigraphic log (Fig. 2e of the main text) is a composite section, and the isotopic data are
integrated from multiple sections on both Spitsbergen and Nordaustlandet (Halverson, 2011). The
Russøya Member (or Member 1 of the Elbobreen Formation) forms the base of the Polarisbreen Group
and pre-dates the inferred Sturtian glaciation in Svalbard. Most of the Russøya Member comprises a
single, shoaling-upward sequence of dominantly gray to black shale and black limestone. Four
samples from the Russøya Member analyzed for δ15N were collected from the Murchisonfjord region
of Nordaustlandet and are derived from organic-rich, slightly calcareous shales deposited below or
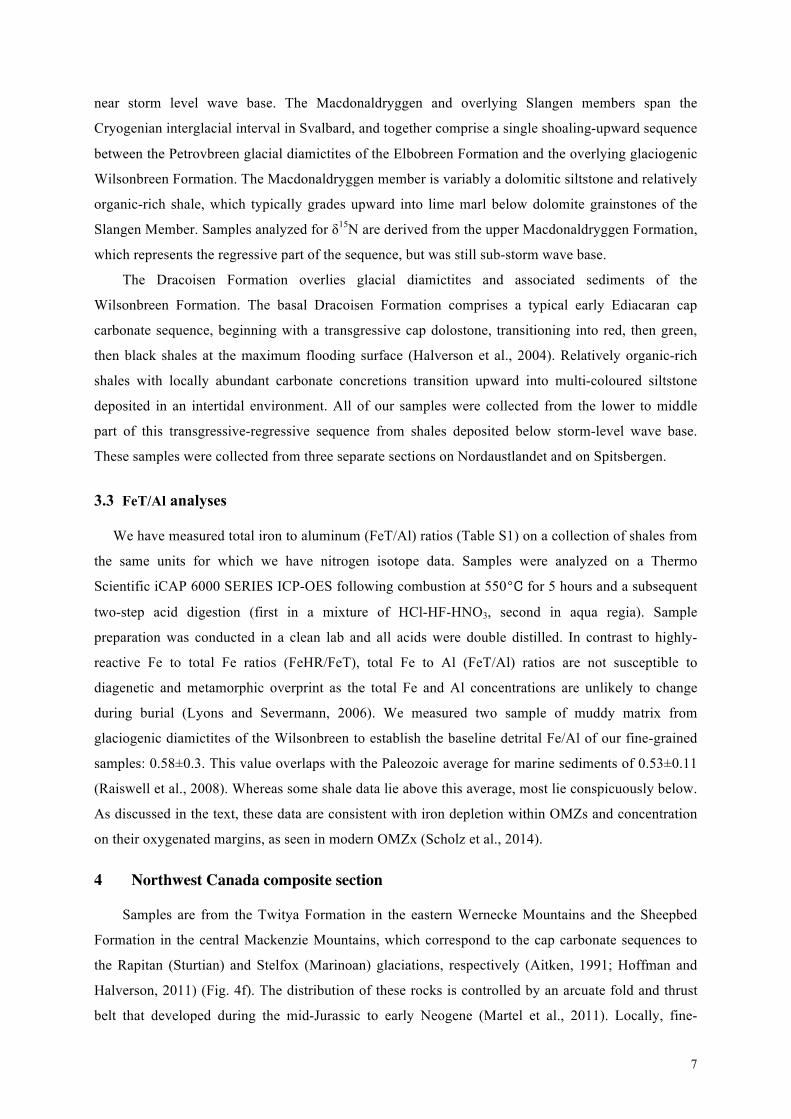
7
near storm level wave base. The Macdonaldryggen and overlying Slangen members span the
Cryogenian interglacial interval in Svalbard, and together comprise a single shoaling-upward sequence
between the Petrovbreen glacial diamictites of the Elbobreen Formation and the overlying glaciogenic
Wilsonbreen Formation. The Macdonaldryggen member is variably a dolomitic siltstone and relatively
organic-rich shale, which typically grades upward into lime marl below dolomite grainstones of the
Slangen Member. Samples analyzed for δ15N are derived from the upper Macdonaldryggen Formation,
which represents the regressive part of the sequence, but was still sub-storm wave base.
The Dracoisen Formation overlies glacial diamictites and associated sediments of the
Wilsonbreen Formation. The basal Dracoisen Formation comprises a typical early Ediacaran cap
carbonate sequence, beginning with a transgressive cap dolostone, transitioning into red, then green,
then black shales at the maximum flooding surface (Halverson et al., 2004). Relatively organic-rich
shales with locally abundant carbonate concretions transition upward into multi-coloured siltstone
deposited in an intertidal environment. All of our samples were collected from the lower to middle
part of this transgressive-regressive sequence from shales deposited below storm-level wave base.
These samples were collected from three separate sections on Nordaustlandet and on Spitsbergen.
3.3 FeT/Al analyses
We have measured total iron to aluminum (FeT/Al) ratios (Table S1) on a collection of shales from
the same units for which we have nitrogen isotope data. Samples were analyzed on a Thermo
Scientific iCAP 6000 SERIES ICP-OES following combustion at 550℃ for 5 hours and a subsequent
two-step acid digestion (first in a mixture of HCl-HF-HNO3, second in aqua regia). Sample
preparation was conducted in a clean lab and all acids were double distilled. In contrast to highly-
reactive Fe to total Fe ratios (FeHR/FeT), total Fe to Al (FeT/Al) ratios are not susceptible to
diagenetic and metamorphic overprint as the total Fe and Al concentrations are unlikely to change
during burial (Lyons and Severmann, 2006). We measured two sample of muddy matrix from
glaciogenic diamictites of the Wilsonbreen to establish the baseline detrital Fe/Al of our fine-grained
samples: 0.58±0.3. This value overlaps with the Paleozoic average for marine sediments of 0.53±0.11
(Raiswell et al., 2008). Whereas some shale data lie above this average, most lie conspicuously below.
As discussed in the text, these data are consistent with iron depletion within OMZs and concentration
on their oxygenated margins, as seen in modern OMZx (Scholz et al., 2014).
4 Northwest Canada composite section
Samples are from the Twitya Formation in the eastern Wernecke Mountains and the Sheepbed
Formation in the central Mackenzie Mountains, which correspond to the cap carbonate sequences to
the Rapitan (Sturtian) and Stelfox (Marinoan) glaciations, respectively (Aitken, 1991; Hoffman and
Halverson, 2011) (Fig. 4f). The distribution of these rocks is controlled by an arcuate fold and thrust
belt that developed during the mid-Jurassic to early Neogene (Martel et al., 2011). Locally, fine-
8
grained rocks are cleavaged in the cores of folds. Although some basalt clasts within the Rapitan
glacial diamictes have chloritized reaction rims, the typical absence of iron silicates within Rapitan
iron formation (Yeo, 1986) implies that the succession is generally metamorphosed to lower
greenschist facies or less.
The age of the base of the Rapitan Formation is constrained to c. 717 Ma by a pair of U-Pb zircon
ages from the Mt. Harper region of the Ogilvie Mountains, Yukon (Macdonald et al., 2010). In the
Wernecke and Mackenzie mountains, it is overlain by the Twitya Formation a thick succession (330–
765 m, Hoffman and Halverson, 2011) of dark grey to black shales and siltstones, with local
carbonates and gritty sandstones. This cap carbonate sequence to the Rapitan (Sturtian) glaciation
typically lacks well developed limestone at the base, as seen in many other equivalent successions
(Halverson et al., 2005), but locally, does have a basal limestone member (Hoffman and Halverson,
2011). The samples analyzed here come from the lower part of the Twitya Formation, above the
maximum flooding surface of the post-glacial transgression, but still within a deeper water
environment (below storm wave base).
The glaciogenic Stelfox Member of the Ice Brook Formation is overlain by the Ravensthroat
Formation cap dolostone, which is up to 20 m thick and contains peloids, megaripples, and negative
δ13C values (-1 to -5‰, James et al., 2001; Hoffman and Halverson, 2011) typical of basal Ediacaran
cap dolostones. Similarly, the overlying Hayhook Formation, which is only locally developed,
contains inorganic aragonitic crystal fans encased in a micritic matrix, similar to basal Ediacaran cap
carbonates in many other basins. The Hayhook Formation is overlain by the Sheepbed Formation,
which comprises mainly grey to black shales and silstones within a succession that is commonly ~500
m thick. The samples from the Sheepbed formation are from rocks deposited below storm wave base
spanning the relatively organic-rich maximum flooding surface (a few tens of meters above the base of
the Sheepbed Formation) within this sequence. Hence these samples are inferred to be early Ediacaran
in age (< ca 630 Ma).
References
Ader, M., Macouin, M., Trindade, R.I.F., Hadrien, M.-H., Yang, Z., Sun, Z., Besse, J., 2009.
A multilayered water column in the Ediacaran Yangtze platform? Insights from carbonate
and organic matter paired δ13C. Earth Planet. Sci. Lett. 288, 213-227.
Aitken, J.D., 1991. Two Late Proterozoic glaciations, Mackenzie Mountains, northwestern
Canada. Geology 19, 445-448.
Almeida, F.F.M., Hasuy, Y., 1984. in: Blücher, E. (Ed.), O Pré-Cambriano do Brasil. São
Paulo, Brazil, pp 265-281.
9
Babinski, M., Trindade, R.I.F., Alvarenga, R.V., 2006. Geochronological constraints on the
Neoproterozoic glaciations in Brazil, in: Snowball Earth. Monte Verita, Tricino
(Switzerland) 16-21 July 2006. pp 19-20.
Chen, J.-Y., Bottjer, D.J., Oliveri, P., Dornbos, S.Q., Gao, F., Ruffins, S., Chi, H., Li, C.-W.,
Davidson, E.H., 2004. Small Bilaterian Fossils from 40 to 55 Million Years Before the
Cambrian. Science 305, 218-222.
Chen, Z., Zhou, C., Meyer, M., Xiang, K., Schiffbauer, J.D., Yuan, X., Xiao, S., 2013. Trace
fossil evidence for Ediacaran bilaterian animals with complex behaviors. Precambr. Res.
224, 690-701.
Cohen, P.A., Knoll, A.H., Kodner, R.B., 2009. Large spinose microfossils in Ediacaran rocks
as resting stages of early animals. Proc. Natl. Acad. Sci. USA 106, 6519-6524.
Condon, D., Zhu, M., Bowring, S., Wang, W., Yang, A., Jin., Y., 2005. U-Pb Ages from the
Neoproterozoic Doushantuo Formation, China. Science 308, 95-98.
Elie, M., Nogueira, A.C.R., Nédélec, A., Trindade, R.I.F., Kenig, F., 2007. Red algal bloom
in the aftermath of the Marinoan Snowball Earth. Terra Nova 19, 303–308.
Font, E., Trindade, R.I.F., Nédélec, A., 2006. Remagnetization in bituminous limestones of
the Neoproterozoic Araras Group (Amazon craton): Hydrocarbon maturation, burial
diagenesis, or both? Journal Geophys. Res. 111, B06204.
Halverson, G.P., Maloof, A.C., Hoffman, P.F., 2004. The Marinoan glaciation
(Neoproterozoic) in northeast Svalbard. Basin Res. 16, 297-324.
Halverson, G.P., Hoffman, P.F., Schrag, D.P., Maloof, A.C., Rice, A.H.N., 2005. Toward a
Neoproterozoic composite carbon-isotope record. Geological Society of America 117, 000-
027.
Halverson, G.P., 2011. Glacial sediments and associated strata of the Polarisbreen Group,
northeastern Svalbard, in: Arnaud, E., Halverson, G.P., Shields-Zhou, G. (Eds.), The
Geological Record of Neoproterozoic Glaciations. Geological Society Memoir 36, London,
pp. 571-579.
Hoffman, P.F., Halverson, G.P., Domack, E.W., Husson, J.M., Higgins, J.A., Schrag, D.P.,
2007. Are basal Ediacarian (635 Ma) post-glacial “cap dolostones” diachronuos? Earth
Planet. Sci. Lett. 258, 114-131.
Hoffman, P.F., Halverson, G.P., 2011. Neoproterozoic glacial record in the Mackenzie
Mountains, northern Canadian Cordillera, in: Arnaud, E., Halverson, G.P., Shields-Zhou,
G. (Eds.), The Geological Record of Neoproterozoic Glaciations. Geological Society
Memoir 36, London, pp. 397-412.
10
Hubert. B., Alvaro, J.J., Chen, J.-Y., 2005. Microbially mediated phosphatization in the
Neoproterozoic Doushantuo Lagerstätte, South China. Bulletin de la Société Géologique
de France 176, 355-361.
James, N.P., Narbonne, G.M., Kyser, T.K., 2001. Late Neoproterozoic cap carbonates:
Mackenzie Mountains, northwestern Canada: precipitation and global glacial meltdown.
Canadian journal of Earth Sciences 38,1229-1262.
Jiang, G., Shi, X., Zhang, S., Wang, Y., Xiao, S., 2011. Stratigraphy and paleogeography of
the Ediacaran Doushantuo Formation (ca. 635-551 Ma) in South China. Gondwana Res.
19, 831-849.
Kimura, H., Azmy, K., Yamamuro, M., Zhi-Wen, J., Cizdziel, J.V., 2005. Integrated
stratigraphy of the upper Neoproterozoic succession in Yunnan Province of South China:
Re-evaluation of global correlation and carbon cycle. Precambr. Res. 138, 1-36.
Kunimitsu, Y., Setsuda, Y., Furuyama, S., Wang, W., Kano, A., 2011. Ediacaran
chemostratigraphy and paleoceanography at a shallow marine setting in northwestern
Hunan Province, South China. Precambr. Res. 191, 194-208.
Lambert, I.B., Walter, M.R., Wenlong, Z., Songnian, L., Guogan, M., 1987.
Palaeoenvironment and carbon isotope stratigraphy of Upper Proterozoic carbonates of the
Yangtze Platform. Nature 325, 140-142.
Li, C., Love, G.D., Lyons, T.W., Fike, D.A., Sessions, A.L., Chu, X., 2010. A Stratified
Redox Model for the Ediacaran Ocean. Science 328, 80-83.
Li, C., Love, G.D., Lyons, T.W., Scott, C.T., Feng, L., Huang, J., Chang, H., Zhang, Q., Zhu,
X., 2012. Evidence for a redox stratified Cryogenian marine basin, Datangpo Formation,
South China. Earth Planet. Sci. Lett. 331-332, 246-256.
Li, R., Chen, J., Zhang, S., Lei, J., Shen, Y., Chen, X, 1999. Spatial and temporal variations in
carbon and sulfur isotopic compositions of Sinian sedimentary rocks in the Yangtze
platform, South China. Precambr. Res. 97, 59-75.
Lyons, T.W., Severmann, S.A., 2006. Critical look at iron paleoredox proxies: New insights
from modern euxinic marine basins. Geochim. Cosmochim. Acta 70, 5698-5722.
Macdonald, F.A., Schmitz, M.D., Crowley, J.L., Roots, C.F., Jones, D.S., Maloof, A.C.,
Strauss, J.V., Cohen, P.A., Johnston, D.T., Schrag, D.P., 2010. Calibrating the Cryogenian.
Science 327, 1241-1243.
Macouin, M., Besse, J., Ader, M., Gilder, S., Yang, Z., Sun, Z., Agrinier, P., 2004. Combined
paleomagnetic and isotopic data from the Doushantuo carbonates, South China:
implications for the "snowball Earth" hypothesis. Earth Planet. Sci. Lett. 224, 387-398.

11
Macouin, M., Ader, M., Moreau, M.-G., Poitou, C., Yang., Z., Sun, Z., 2012. Deciphering the
impact of diagenesis overprint on negative δ13C excursions using rock magnetism: Case
study of Ediacaran carbonates, Yangjiaping section, South China. Earth Planet. Sci. Lett.
351-352, 281-294.
Maher, H.D., Jr, 2001. Manifestations of the Cretaceous High Arctic Large Igneous Province
in Svalbard. The Journal of Geol. 109, 91-104.
Martel, E., Turner, E.C., Fischer, B.J., 2011. Geology of the central Mackenzie Mountains of
the northern Canadian Cordillera, Sekwi Mountain (105P), Mount Eduni (106A), and
northwestern Wrigley Lake (95M) map-areas, Northwest Territories. NWT Geoscience
Office. NWT Special Volume 1, 423 p.
Nogueira, A.C.R., Riccomini, C., Sial, A.N., Moura, C.A.V., Fairchild, T.R., 2003. Soft-
sediment deformation at the base of the Neoproterozoic Puga cap carbonate (southwestern
Amazon craton, Brazil): Confirmation of rapid icehouse to greenhouse transition in
snowball Earth. Geology 31, 613-616.
Nogueira, A.C.R., Riccomini, C., Sial, A.N., Moura, C.A.V., Trindade, R.I.F., Fairchild, T.R.,
2007. Carbon and strontium isotope fluctuations and paleoceanographic changes in the late
Neoproterozoic Araras carbonate platform, southern Amazon craton, Brazil. Chem. Geol.
237, 168-190.
Raiswell, R., Newton, R., Bottrell, S.H., Coburn, P.M., Briggs, D.E.G., Bond, D.P.G.,
Poulton, S.W., 2008. Turbidite depositional influences on the diagenesis of Beecher's
Trilobite Bed and the Hunsrück Slate; sites of soft tissue pyritization. American Journal of
Science 308, 105-129.
Romero, J.A.S., Lafon, J.M., Nogueira, A.C.R., Soares, J.L., 2013. Sr isotope geochemistry
and Pb-Pb geochronology of the Neoproterozoic cap carbonates, Tangara da Serra, Brazil.
Int. Geol. Rev. 55, 185-203.
Sahoo, S.K., Planavsky, N.J., Kendall, B., Wang, X., Shi, X., Scott, C.T., Anbar, A.D., Lyons,
T.W., Jiang, G., 2012. Ocean oxygenation in the wake of the Marinoan glaciation. Nature
489, 546-549.
Sansjofre, P., Ader, M., Trindade, R.I.F., Elie, M., Lyons, J., Cartigny, P., Nogueira, A.C.R.,
2011. A carbon isotope challenge to the snowball Earth. Nature 478, 93-96.
Sansjofre, P., Trindade, R.I.F., Ader, M., Soares, J.L., Nogueira, A.C.R., Tribovillard, N.,
2014. Paleoenvironmental reconstruction of the Ediacaran Araras platform (Western
Brazil) from the sedimentary and trace metals record. Precambrian Research, 241, 185-
202.
12
Sansofre, P., 2011. L'environnement post-marinoen (ca. 635 ma) : une étude multi-proxy de la
plateforme carbonatée du Groupe d'Araras (Mato Grosso, Brésil). PhD thesis, Université
Paris-Diderot, pp 287.
Scholz, F., Severmann, S., McManus, J., Hensen, C., 2014. Beyond the Black Sea paradigm:
The sedimentary fingerprint of an open-marine iron shuttle. Geochimica et Cosmochimica
Acta 127, 368-380.
Soares, J.L., Nogueira, A.C.R., 2008. Depositos carbonàticos de Tangarà da Serra (MT): uma
nova occorrência de capa carbonàtica neoproterozoica no sul do Cràton Amazônico.
Revista Brasileira de Geociências 34, 715-729.
Vernhet, E., Reijmer, J.J.G., 2010. Sedimentary evolution of the Ediacaran Yangtze platform
shelf (Hubei and Hunan provinces, Central China). Sed. Geol. 225, 99-115.
Wang, J., Li, Z.-X., 2003. History of Neoproterozoic rift basins in South China: implications
for Rodinia break-up. Precambr. Res., 122, 141-158.
Wang, L., Shi, X., Jiang, G., 2012. Pyrite morphology and redox fluctuations recorded in the
Ediacaran Doushantuo Formation. Palaeogeography, Palaeoclimatology, Palaeoecology
333, 218–227.
Xiao, S., Zhang, Y., Knoll, A.H., 1998. Three-dimensional preservation of algae and animal
embryos in a Neoproterozoic phosphorite. Nature 391, 553-558.
Xiao, S., Knoll, A.H., Yuan, X., Pueschel, C.M., 2004. Phosphatized multicellular algae in the
Neoproterozoic Doushantuo Formation, China, and the early evolution of florideophyte red
algae. American Journal of Botany 91, 214-227.
Yeo, G.M., 1986. Iron-formation in the late Proterozoic Rapitan Group, Yukon and Northwest
Territories, in: Morin, J.A., (Ed.), Mineral Deposits of Northern Cordillera. Canadian
Institute of Mining and Metallurgy Special Volume 37, 142-153.
Yin, C., Liu, D., Gao, L, Wang, Z., Xing, Y., Jian, P., Shi, Y., 2003. Lower boundary age of
the Nanhua System and the Gucheng glacial stage: Evidence from SHRIMP II dating.
Chin. Sci. Bul. 48, 1657-1662.
Yin, L., Zhou, M., Knoll, A.H., Yuan, X., Zhang, J., Hu, J., 2007. Doushantuo embryos
preserved inside diapause egg cysts. Nature 446, 661-663.
Zhang, Q.-R., Li, X.-H., Feng, H.-Z., Huang, J., Song, B., 2008a. A New Age Constraint on
the Onset of the Neoproterozoic Glaciations in the Yangtze Platform, South China. The
Journal of Geol. 116, 423-429.
13
Zhang, S., Jiang, G., Zhang, J., Song, B., Kennedy, M.J., Christie-Blick, N., 2005. U-Pb
sensitive high-resolution ion microprobe ages from the Doushantuo Formation in south
China: Constraints on late Neoproterozoic glaciations. Geology 33, 473-476.
Zhang, S., Jiang, G., Han, Y., 2008b. The age of the Nantuo Formation and Nantuo glaciation
in South China. Terra Nova 20, 289-294.
Zhou, C., Tucker, R., Xiao, S., Zeng, P., Yuan, X., Chen, Z., 2004. New constraints on the
ages of Neoproterozoic glaciations in south China. Geology 32, 437-440.
Zhu, M., Zhang, J., Yang, A., 2007. Integrated Ediacarian (Sinian) chronostratigraphy of
South China. Palaeogeogr. Paleoclimatol. Palaeoecol. 254, 7-61.
Zhu, B., Becker, H., Jiang, S.-Y., Pi, D.-H., Fischer-Gödde, M., Yang, J.-H., 2013. Re-Os
geochronology of black shales from the Neoproterozoic Doushantuo Formation, Yangtze
platform, South China. Precambr. Res. 225, 67-76.
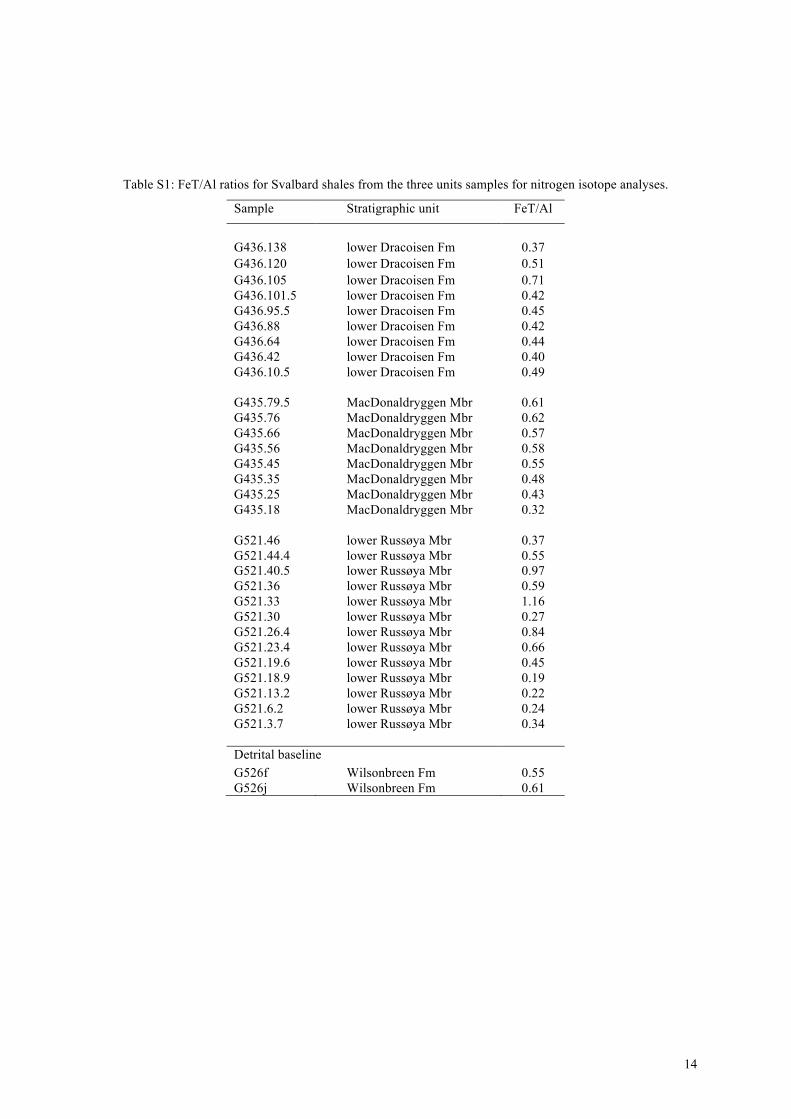
14
Table S1: FeT/Al ratios for Svalbard shales from the three units samples for nitrogen isotope analyses.
Sample Stratigraphic unit FeT/Al
G436.138 lower Dracoisen Fm 0.37 G436.120 lower Dracoisen Fm 0.51 G436.105 G436.101.5 G436.95.5 G436.88 G436.64 G436.42 G436.10.5 G435.79.5 G435.76 G435.66 G435.56 G435.45 G435.35 G435.25 G435.18
lower Dracoisen Fm lower Dracoisen Fm lower Dracoisen Fm lower Dracoisen Fm lower Dracoisen Fm lower Dracoisen Fm lower Dracoisen Fm MacDonaldryggen Mbr MacDonaldryggen Mbr MacDonaldryggen Mbr MacDonaldryggen Mbr MacDonaldryggen Mbr MacDonaldryggen Mbr MacDonaldryggen Mbr MacDonaldryggen Mbr
0.71 0.42 0.45 0.42 0.44 0.40 0.49
0.61 0.62 0.57 0.58 0.55 0.48 0.43 0.32
G521.46 G521.44.4 G521.40.5 G521.36 G521.33 G521.30 G521.26.4 G521.23.4 G521.19.6 G521.18.9 G521.13.2 G521.6.2 G521.3.7
lower Russøya Mbr lower Russøya Mbr lower Russøya Mbr lower Russøya Mbr lower Russøya Mbr lower Russøya Mbr lower Russøya Mbr lower Russøya Mbr lower Russøya Mbr lower Russøya Mbr lower Russøya Mbr lower Russøya Mbr lower Russøya Mbr
0.37 0.55 0.97 0.59 1.16 0.27 0.84 0.66 0.45 0.19 0.22 0.24 0.34
Detrital baseline G526f G526j
Wilsonbreen Fm Wilsonbreen Fm
0.55 0.61
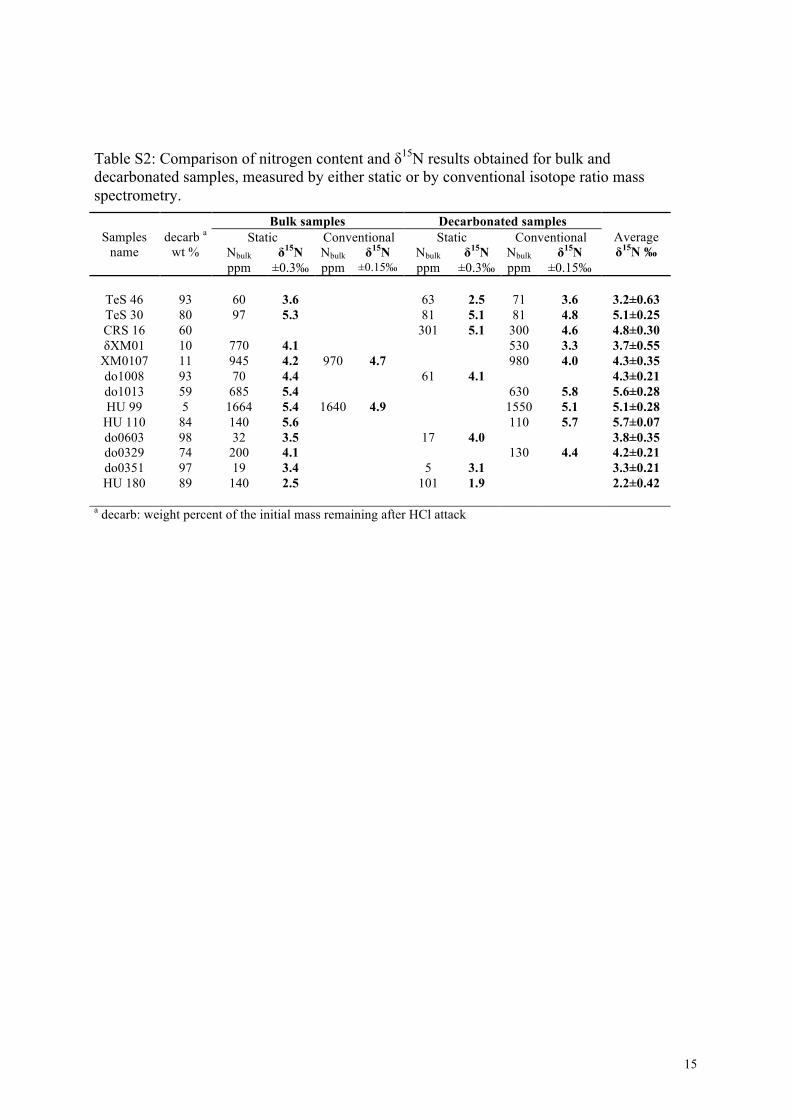
15
Table S2: Comparison of nitrogen content and δ15N results obtained for bulk and decarbonated samples, measured by either static or by conventional isotope ratio mass spectrometry.
Samples name
decarb a wt %
Bulk samples Decarbonated samples Average δ15N ‰
Static Conventional Static Conventional Nbulk ppm
δ15N ±0.3‰
Nbulk ppm
δ15N ±0.15‰
Nbulk ppm
δ15N ±0.3‰
Nbulk ppm
δ15N ±0.15‰
TeS 46 93 60 3.6 63 2.5 71 3.6 3.2±0.63 TeS 30 80 97 5.3 81 5.1 81 4.8 5.1±0.25 CRS 16 60 301 5.1 300 4.6 4.8±0.30 δXM01 10 770 4.1 530 3.3 3.7±0.55
XM0107 11 945 4.2 970 4.7 980 4.0 4.3±0.35 do1008 93 70 4.4 61 4.1 4.3±0.21 do1013 59 685 5.4 630 5.8 5.6±0.28 HU 99 5 1664 5.4 1640 4.9 1550 5.1 5.1±0.28
HU 110 84 140 5.6 110 5.7 5.7±0.07 do0603 98 32 3.5 17 4.0 3.8±0.35 do0329 74 200 4.1 130 4.4 4.2±0.21 do0351 97 19 3.4 5 3.1 3.3±0.21 HU 180 89 140 2.5 101 1.9 2.2±0.42
a decarb: weight percent of the initial mass remaining after HCl attack
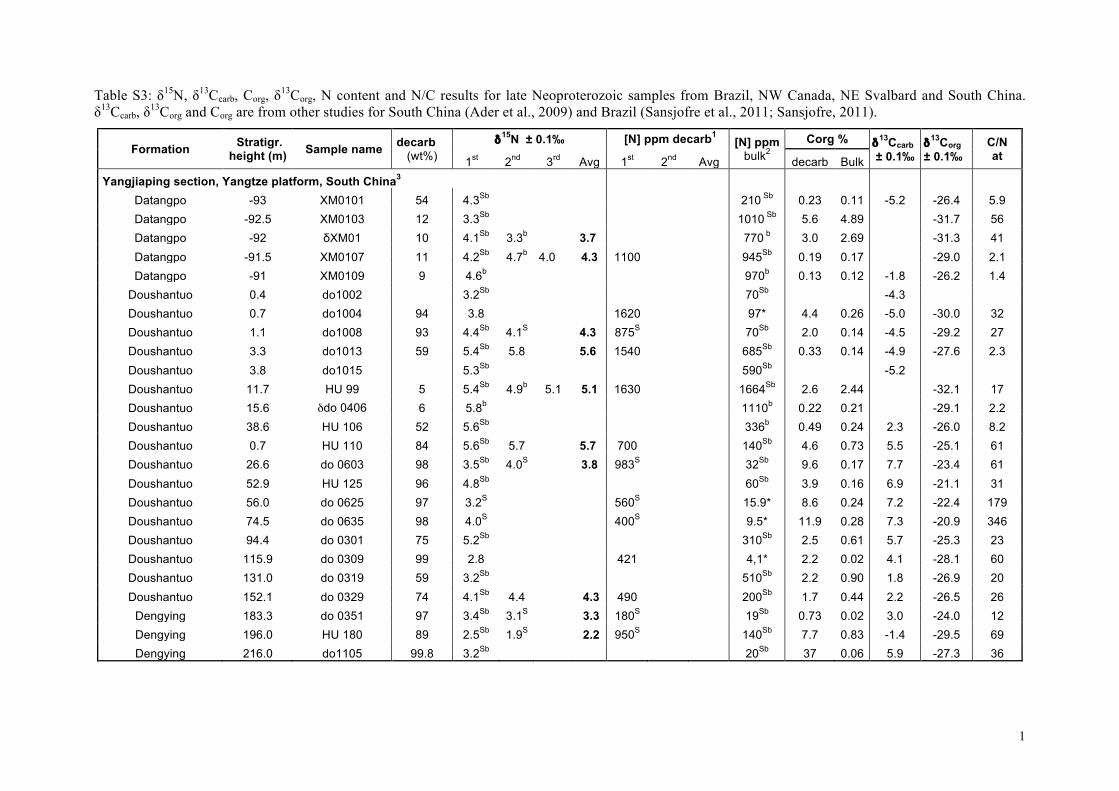
1
Table S3: δ15N, δ13Ccarb, Corg, δ13Corg, N content and N/C results for late Neoproterozoic samples from Brazil, NW Canada, NE Svalbard and South China. 1 δ13Ccarb, δ13Corg and Corg are from other studies for South China (Ader et al., 2009) and Brazil (Sansjofre et al., 2011; Sansjofre, 2011). 2
Formation Stratigr. height (m) Sample name decarb
(wt%) δ15N ± 0.1‰ [N] ppm decarb1 [N] ppm
bulk2 Corg % δ13Ccarb
± 0.1‰ δ13Corg ± 0.1‰
C/N at 1st 2nd 3rd Avg 1st 2nd Avg decarb Bulk
Yangjiaping section, Yangtze platform, South China3 Datangpo -93 XM0101 54 4.3Sb 210 Sb 0.23 0.11 -5.2 -26.4 5.9 Datangpo -92.5 XM0103 12 3.3Sb 1010 Sb 5.6 4.89 -31.7 56 Datangpo -92 δXM01 10 4.1Sb 3.3b 3.7 770 b 3.0 2.69 -31.3 41 Datangpo -91.5 XM0107 11 4.2Sb 4.7b 4.0 4.3 1100 945Sb 0.19 0.17 -29.0 2.1 Datangpo -91 XM0109 9 4.6b 970b 0.13 0.12 -1.8 -26.2 1.4
Doushantuo 0.4 do1002 3.2Sb 70Sb -4.3 Doushantuo 0.7 do1004 94 3.8 1620 97* 4.4 0.26 -5.0 -30.0 32 Doushantuo 1.1 do1008 93 4.4Sb 4.1S 4.3 875S 70Sb 2.0 0.14 -4.5 -29.2 27 Doushantuo 3.3 do1013 59 5.4Sb 5.8 5.6 1540 685Sb 0.33 0.14 -4.9 -27.6 2.3 Doushantuo 3.8 do1015 5.3Sb 590Sb -5.2 Doushantuo 11.7 HU 99 5 5.4Sb 4.9b 5.1 5.1 1630 1664Sb 2.6 2.44 -32.1 17 Doushantuo 15.6 δdo 0406 6 5.8b 1110b 0.22 0.21 -29.1 2.2 Doushantuo 38.6 HU 106 52 5.6Sb 336b 0.49 0.24 2.3 -26.0 8.2 Doushantuo 0.7 HU 110 84 5.6Sb 5.7 5.7 700 140Sb 4.6 0.73 5.5 -25.1 61 Doushantuo 26.6 do 0603 98 3.5Sb 4.0S 3.8 983S 32Sb 9.6 0.17 7.7 -23.4 61 Doushantuo 52.9 HU 125 96 4.8Sb 60Sb 3.9 0.16 6.9 -21.1 31 Doushantuo 56.0 do 0625 97 3.2S 560S 15.9* 8.6 0.24 7.2 -22.4 179 Doushantuo 74.5 do 0635 98 4.0S 400S 9.5* 11.9 0.28 7.3 -20.9 346 Doushantuo 94.4 do 0301 75 5.2Sb 310Sb 2.5 0.61 5.7 -25.3 23 Doushantuo 115.9 do 0309 99 2.8 421 4,1* 2.2 0.02 4.1 -28.1 60 Doushantuo 131.0 do 0319 59 3.2Sb 510Sb 2.2 0.90 1.8 -26.9 20 Doushantuo 152.1 do 0329 74 4.1Sb 4.4 4.3 490 200Sb 1.7 0.44 2.2 -26.5 26
Dengying 183.3 do 0351 97 3.4Sb 3.1S 3.3 180S 19Sb 0.73 0.02 3.0 -24.0 12 Dengying 196.0 HU 180 89 2.5Sb 1.9S 2.2 950S 140Sb 7.7 0.83 -1.4 -29.5 69 Dengying 216.0 do1105 99.8 3.2Sb 20Sb 37 0.06 5.9 -27.3 36
3 4
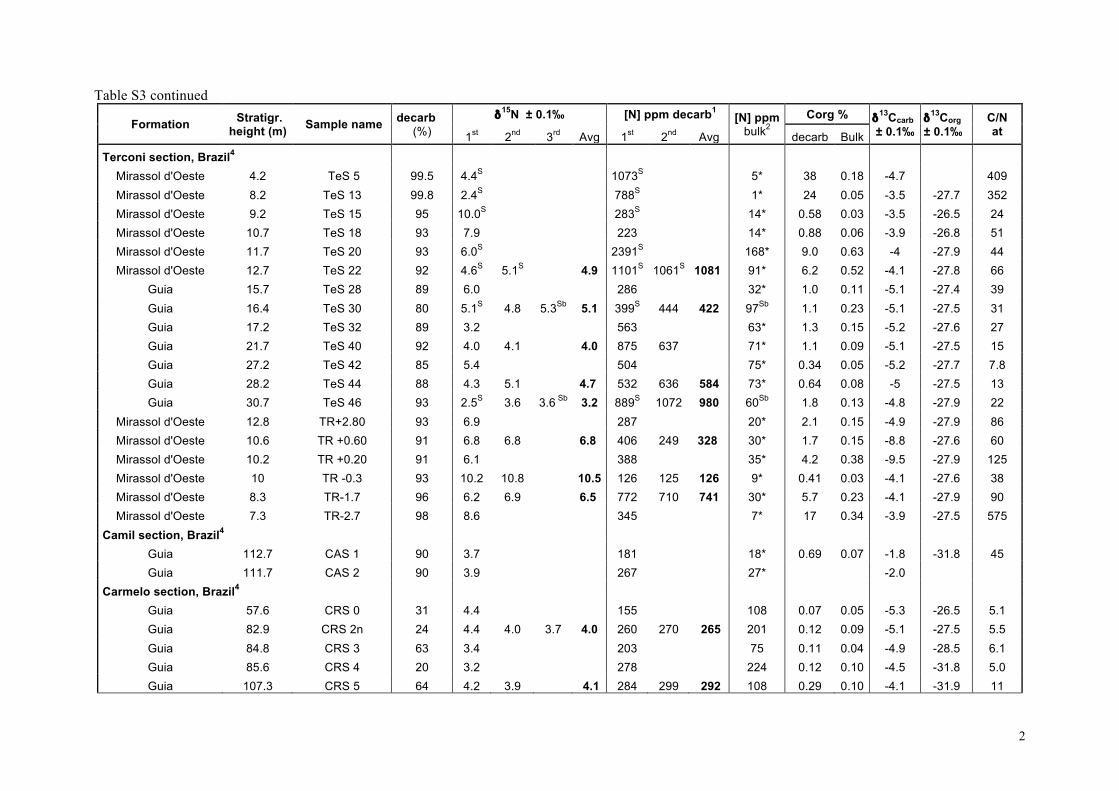
2
Table S3 continued 5
Formation Stratigr. height (m) Sample name decarb
(%) δ15N ± 0.1‰ [N] ppm decarb1 [N] ppm
bulk2 Corg % δ13Ccarb
± 0.1‰ δ13Corg ± 0.1‰
C/N at 1st 2nd 3rd Avg 1st 2nd Avg decarb Bulk
Terconi section, Brazil4 Mirassol d'Oeste 4.2 TeS 5 99.5 4.4S 1073S 5* 38 0.18 -4.7 409 Mirassol d'Oeste 8.2 TeS 13 99.8 2.4S 788S 1* 24 0.05 -3.5 -27.7 352 Mirassol d'Oeste 9.2 TeS 15 95 10.0S 283S 14* 0.58 0.03 -3.5 -26.5 24 Mirassol d'Oeste 10.7 TeS 18 93 7.9 223 14* 0.88 0.06 -3.9 -26.8 51 Mirassol d'Oeste 11.7 TeS 20 93 6.0S 2391S 168* 9.0 0.63 -4 -27.9 44 Mirassol d'Oeste 12.7 TeS 22 92 4.6S 5.1S 4.9 1101S 1061S 1081 91* 6.2 0.52 -4.1 -27.8 66
Guia 15.7 TeS 28 89 6.0 286 32* 1.0 0.11 -5.1 -27.4 39 Guia 16.4 TeS 30 80 5.1S 4.8 5.3Sb 5.1 399S 444 422 97Sb 1.1 0.23 -5.1 -27.5 31 Guia 17.2 TeS 32 89 3.2 563 63* 1.3 0.15 -5.2 -27.6 27 Guia 21.7 TeS 40 92 4.0 4.1 4.0 875 637 71* 1.1 0.09 -5.1 -27.5 15 Guia 27.2 TeS 42 85 5.4 504 75* 0.34 0.05 -5.2 -27.7 7.8 Guia 28.2 TeS 44 88 4.3 5.1 4.7 532 636 584 73* 0.64 0.08 -5 -27.5 13 Guia 30.7 TeS 46 93 2.5S 3.6 3.6 Sb 3.2 889S 1072 980 60Sb 1.8 0.13 -4.8 -27.9 22
Mirassol d'Oeste 12.8 TR+2.80 93 6.9 287 20* 2.1 0.15 -4.9 -27.9 86 Mirassol d'Oeste 10.6 TR +0.60 91 6.8 6.8 6.8 406 249 328 30* 1.7 0.15 -8.8 -27.6 60 Mirassol d'Oeste 10.2 TR +0.20 91 6.1 388 35* 4.2 0.38 -9.5 -27.9 125 Mirassol d'Oeste 10 TR -0.3 93 10.2 10.8 10.5 126 125 126 9* 0.41 0.03 -4.1 -27.6 38 Mirassol d'Oeste 8.3 TR-1.7 96 6.2 6.9 6.5 772 710 741 30* 5.7 0.23 -4.1 -27.9 90 Mirassol d'Oeste 7.3 TR-2.7 98 8.6 345 7* 17 0.34 -3.9 -27.5 575
Camil section, Brazil4 Guia 112.7 CAS 1 90 3.7 181 18* 0.69 0.07 -1.8 -31.8 45 Guia 111.7 CAS 2 90 3.9 267 27* -2.0
Carmelo section, Brazil4 Guia 57.6 CRS 0 31 4.4 155 108 0.07 0.05 -5.3 -26.5 5.1 Guia 82.9 CRS 2n 24 4.4 4.0 3.7 4.0 260 270 265 201 0.12 0.09 -5.1 -27.5 5.5 Guia 84.8 CRS 3 63 3.4 203 75 0.11 0.04 -4.9 -28.5 6.1 Guia 85.6 CRS 4 20 3.2 278 224 0.12 0.10 -4.5 -31.8 5.0 Guia 107.3 CRS 5 64 4.2 3.9 4.1 284 299 292 108 0.29 0.10 -4.1 -31.9 11
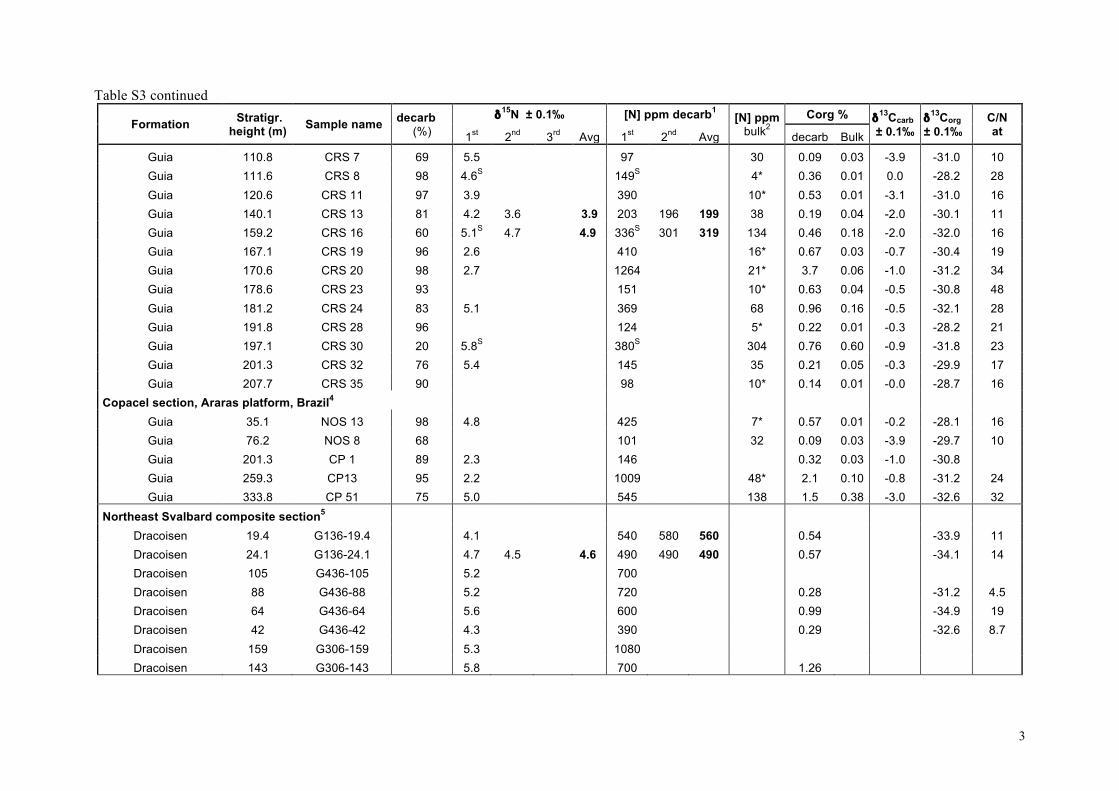
3
Table S3 continued 6
Formation Stratigr. height (m) Sample name decarb
(%) δ15N ± 0.1‰ [N] ppm decarb1 [N] ppm
bulk2 Corg % δ13Ccarb
± 0.1‰ δ13Corg ± 0.1‰
C/N at 1st 2nd 3rd Avg 1st 2nd Avg decarb Bulk
Guia 110.8 CRS 7 69 5.5 97 30 0.09 0.03 -3.9 -31.0 10 Guia 111.6 CRS 8 98 4.6S 149S 4* 0.36 0.01 0.0 -28.2 28 Guia 120.6 CRS 11 97 3.9 390 10* 0.53 0.01 -3.1 -31.0 16 Guia 140.1 CRS 13 81 4.2 3.6 3.9 203 196 199 38 0.19 0.04 -2.0 -30.1 11 Guia 159.2 CRS 16 60 5.1S 4.7 4.9 336S 301 319 134 0.46 0.18 -2.0 -32.0 16 Guia 167.1 CRS 19 96 2.6 410 16* 0.67 0.03 -0.7 -30.4 19 Guia 170.6 CRS 20 98 2.7 1264 21* 3.7 0.06 -1.0 -31.2 34 Guia 178.6 CRS 23 93 151 10* 0.63 0.04 -0.5 -30.8 48 Guia 181.2 CRS 24 83 5.1 369 68 0.96 0.16 -0.5 -32.1 28 Guia 191.8 CRS 28 96 124 5* 0.22 0.01 -0.3 -28.2 21 Guia 197.1 CRS 30 20 5.8S 380S 304 0.76 0.60 -0.9 -31.8 23 Guia 201.3 CRS 32 76 5.4 145 35 0.21 0.05 -0.3 -29.9 17 Guia 207.7 CRS 35 90 98 10* 0.14 0.01 -0.0 -28.7 16
Copacel section, Araras platform, Brazil4 Guia 35.1 NOS 13 98 4.8 425 7* 0.57 0.01 -0.2 -28.1 16 Guia 76.2 NOS 8 68 101 32 0.09 0.03 -3.9 -29.7 10 Guia 201.3 CP 1 89 2.3 146 0.32 0.03 -1.0 -30.8 Guia 259.3 CP13 95 2.2 1009 48* 2.1 0.10 -0.8 -31.2 24 Guia 333.8 CP 51 75 5.0 545 138 1.5 0.38 -3.0 -32.6 32
Northeast Svalbard composite section5 Dracoisen 19.4 G136-19.4 4.1 540 580 560 0.54 -33.9 11 Dracoisen 24.1 G136-24.1 4.7 4.5 4.6 490 490 490 0.57 -34.1 14 Dracoisen 105 G436-105 5.2 700 Dracoisen 88 G436-88 5.2 720 0.28 -31.2 4.5 Dracoisen 64 G436-64 5.6 600 0.99 -34.9 19 Dracoisen 42 G436-42 4.3 390 0.29 -32.6 8.7 Dracoisen 159 G306-159 5.3 1080 Dracoisen 143 G306-143 5.8 700 1.26
7
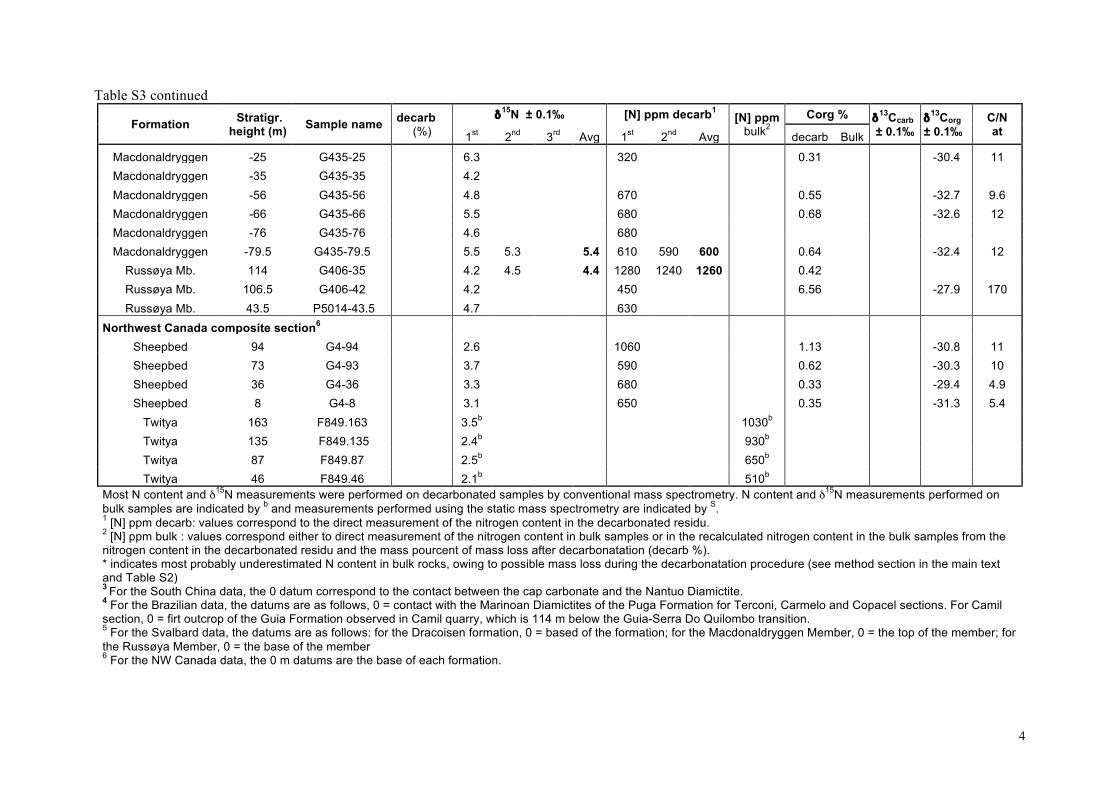
4
Table S3 continued 8
Formation Stratigr. height (m) Sample name decarb
(%) δ15N ± 0.1‰ [N] ppm decarb1 [N] ppm
bulk2 Corg % δ13Ccarb
± 0.1‰ δ13Corg ± 0.1‰
C/N at 1st 2nd 3rd Avg 1st 2nd Avg decarb Bulk
Macdonaldryggen -25 G435-25 6.3 320 0.31 -30.4 11 Macdonaldryggen -35 G435-35 4.2 Macdonaldryggen -56 G435-56 4.8 670 0.55 -32.7 9.6 Macdonaldryggen -66 G435-66 5.5 680 0.68 -32.6 12 Macdonaldryggen -76 G435-76 4.6 680 Macdonaldryggen -79.5 G435-79.5 5.5 5.3 5.4 610 590 600 0.64 -32.4 12
Russøya Mb. 114 G406-35 4.2 4.5 4.4 1280 1240 1260 0.42 Russøya Mb. 106.5 G406-42 4.2 450 6.56 -27.9 170 Russøya Mb. 43.5 P5014-43.5 4.7 630
Northwest Canada composite section6 Sheepbed 94 G4-94 2.6 1060 1.13 -30.8 11 Sheepbed 73 G4-93 3.7 590 0.62 -30.3 10 Sheepbed 36 G4-36 3.3 680 0.33 -29.4 4.9 Sheepbed 8 G4-8 3.1 650 0.35 -31.3 5.4
Twitya 163 F849.163 3.5b 1030b Twitya 135 F849.135 2.4b 930b Twitya 87 F849.87 2.5b 650b Twitya 46 F849.46 2.1b 510b
Most N content and δ15N measurements were performed on decarbonated samples by conventional mass spectrometry. N content and δ15N measurements performed on bulk samples are indicated by b and measurements performed using the static mass spectrometry are indicated by S. 1 [N] ppm decarb: values correspond to the direct measurement of the nitrogen content in the decarbonated residu. 2 [N] ppm bulk : values correspond either to direct measurement of the nitrogen content in bulk samples or in the recalculated nitrogen content in the bulk samples from the nitrogen content in the decarbonated residu and the mass pourcent of mass loss after decarbonatation (decarb %). * indicates most probably underestimated N content in bulk rocks, owing to possible mass loss during the decarbonatation procedure (see method section in the main text and Table S2) 3 For the South China data, the 0 datum correspond to the contact between the cap carbonate and the Nantuo Diamictite. 4 For the Brazilian data, the datums are as follows, 0 = contact with the Marinoan Diamictites of the Puga Formation for Terconi, Carmelo and Copacel sections. For Camil section, 0 = firt outcrop of the Guia Formation observed in Camil quarry, which is 114 m below the Guia-Serra Do Quilombo transition. 5 For the Svalbard data, the datums are as follows: for the Dracoisen formation, 0 = based of the formation; for the Macdonaldryggen Member, 0 = the top of the member; for the Russøya Member, 0 = the base of the member 6 For the NW Canada data, the 0 m datums are the base of each formation.
9